edward martin noel fitzgerald
TRANSCRIPT
Can “compulsory” annuities provide a fair pension?
1
Can “Compulsory” Annuities Provide a Fair Pension?
Edward Martin Noel FitzGerald
Discussion paper1
Economics and Finance
Brunel Business School
Rev 1
October 2006
1 Any communications E mail to author at [email protected]

Can “compulsory” annuities provide a fair pension?
2
Abstract
This discussion paper finds that since 2002 compulsory annuities no longer provide an
actuarially fair pension. Hence annuities are a poor investment giving returns of less
than 85% in present value terms.
The paper uses a data base of annuity rates collected from MoneyFacts monthly
reports since 1994. This includes all products available on the market for Male Only
aged 55 to 75 in 5 year increments. The present value of future annuity streams and
their resultant moneys worth values (MW) are calculated and analysed, with particular
attention to the actuarial aspects. The approach and results are independently
confirmed giving a high degree of confidence in the findings. The analysis progresses
on from the literature review of recent published work
The paper plots historic trends of annuity payout rates and their MW values and
highlights some significant characteristics of the annuity market. While annuity rates
can be expected to fall as life expectation rises no logical reason can be found to also
justify the recent and significant reduction in their MW value below the actuarially
fair value of 1.0.
This research provides a valuable insight for developing strategies to guide the
pensioner when formulating his income drawdown plans, especially in the light of.
recent A-day changes.
Key words annuity rates, moneys worth, actuarially fair annuity rate (AFAR),
expected present discount values (EPDV)
JEL Classification G20, G23

Can “compulsory” annuities provide a fair pension?
3
1 Introduction
With the demise of the defined benefit schemes, the rising costs and inadequate
funding of the PAYG state system, in the future most people will be in a defined
contribution arrangement. This is designed to generate a fund which will provide
an income for their retirement. Although most pension funds are managed by the
major insurance companies, the individual has the opportunity to take direct
control of investment strategies by investing / transferring existing pension
savings into an unsecured pension (USP) such as a SIPP (Self Invested Pension
Plan). However, in order to ensure that earlier tax privileges are used to generate
retirement income, UK legislation restricts the drawdown of the pension fund.
Income drawdown under regulated conditions, including taking a tax free lump
sum, is permitted from age 50 (55 in 2010) to 75. Before April 2006 the
individual’s pension fund had to be converted to a life annuity1 by the age of 75.
From A –Day (6th
April 2006) there is an alternative to converting pension funds
into an annuity at 75. One can opt for an alternatively secured pension (ASP)
which is similar to a USP, but the level of drawdown is severely reduced (by
55%) and no further age related adjustments are made. This is regarded as an
incentive to purchase an annuity
Accordingly, the UK now has one of the largest annuity markets in the world.
The Association of British Insurers advise that in 2004 the premiums invested in
compulsory annuities were £7,478 million and in voluntary annuities were £56.4
million.
1 An annuity provides a stream of income until one’s death in return for an initial
premium.

Can “compulsory” annuities provide a fair pension?
4
The industry continues to refer to the product as Compulsory Purchase Annuities
(CPA) but more accurately they are Annuities Purchased from a Pension Fund or
Pension Funded Annuities. To avoid confusion the term “Compulsory“Purchased
Annuity is used throughout the discussion paper
The purchase of an annuity remains a one-off decision and the capital remains
with the provider even if the annuitant only survives for a short period. Hence the
management of this process decides the difference between relative comfort and
poverty in old age for a large number of people.
Orsag (2000) identifies perceptions as one of the 4 problems with annuity
markets in the UK, namely “the belief that annuities are poor value for money or
that insurers act as a cartel which exploited mandatory annuitisation requirements
to make excess profits” (p1)
The primary object of this discussion paper is to re-examine the evolving
market situation in order to determine whether that perception of poor value for
money has been vindicated or discredited over the past five years.
The methodology used is to calculate the Present Value (PV), designated in the
literature as the Expected Present Discount Value (EPDV), of the payment stream
generated by an initial premium. This is similar to the PV calculation used to
evaluate commercial products but additionally takes into account the probability
that the annuitant will survive to collect his payment at a given future date.
Hence there are three inputs:
• Annuity payout rate (£) or the annuity rate per premium £
• Interest rates that are used to discount future payments

Can “compulsory” annuities provide a fair pension?
5
• Mortality rates to calculate life expectancy for each payment on a
probability basis.
It is common practice to adopt two evaluation reporting techniques for the EPDV
• Moneys Worth (MW) = EPDV / PREMIUM
• Internal Rate of Return (IRR) which is the discount rate which makes the
EPDV equal to the premium. This has the advantage tha no assumptions
are needed regarding the discount rates to be used
Both Murthi (1999 p21) and Finkelstein (2002 p35) argue that a MW of 1.0
represents the actuarially fair value of an annuity (AFAR). However, we shall see
that in recent years it has been in significant decline along with the annuity payout
rates and is no longer available.
Focus is on the “compulsory” annuity for males at age 65, the typical retirement
age, and at age 75, when the pension fund had to be annuitised or now one can opt
for an ASP with its drawdown restrictions.
The discussion paper is organised as follows
The next Section is a brief literature review
Section 3 discusses annuity payout rates1. Comprehensive monthly data was
obtained from Moneyfacts from 1994 up to the present date and this is the basis of
of our work. The nature of the annuity market and its products is noted and some
annuity rate trends since 1994 are plotted and reviewed
1 June 2005 annuity rates have been used throughout. However in Section 5 current data (June 6
th
2006) was adapted so that the derived investment policies and strategies are current

Can “compulsory” annuities provide a fair pension?
6
.
Section 4 describes the EPDV methodology used to calculate the Moneys Worth
on an annuity. Current MW values are presented and trends are plotted since
1994.
Section 5 derives the policies and strategies from the EPDV analysis to assist the
pensioner select the appropriate pension drawdown plan based on getting value
for money. In order for the guidance to be relevant current MoneyFacts data is
used ( 5th
June 2006)
Section 6 draws together the main conclusions and focuses on changes in the
market over recent years and whether they now offer better or poorer value for
money.

Can “compulsory” annuities provide a fair pension?
7
2 Literature review
The bibliography shows that there are a limited number of authors active in this
area and that this subject is “young”.
On the wider aspect of pensions, the work by Davis (2004 Geneva paper) is the most
authoritative and comprehensive available. Its Section 9, “A crises in annuities?”,
provided a valuable reference. Davis also notes (p18) that “In the UK there is
mandatory annuitisation - justified in turn by tax privileges and a possible moral
hazard as the sums are dissipated leaving the state to prevent individuals falling into
poverty”.
Early work by Murthi (1999) et al in the UK and Mitchell (1999) in the USA
introduce and develop the concept of calculating the present value of future
annuity cash flow streams and using a Monies Worth ratio as a criteria of value.
They provided a detailed explanation of the techniques used to calculate MW
including a discussion on the application of mortality tables to determine the
probability of individual survival both for the general population and for cohorts
of pensioners.
Murthi also provides some useful results which are used to check the validity of
the results from the EPDV Calculator (Appendix A1)
The Murthi team which included Orszag and Orszag produced a further four
papers in subsequent years. Their paper “Annuity Margins in the UK” (2000) is
of special interest as it is the definitive work on using Internal Rate of Return
(IRR), and its derivative of Annuity Margin, as a criteria for evaluating
annuities in much the same way that investment projects are assessed.

Can “compulsory” annuities provide a fair pension?
8
Finkelstein (2002) follow this up by extending earlier works to include different
categories of annuities that had then become available, especially those designed to
protect future payments and to mitigate against the loss of funds on early death. They
also use a term structures of interest rates, rather than a constant value, for discounting
purposes.
Cannon (2004 Financial History Review) provide the best reference on the problems
associated with collecting and making sense of historic annuity rates. They generated
an annuity time series for a 65 year old male with the data going back to 1957. This is
a composite of a median annuity rate without guarantee from 1957 up to 1973 and a
mean annuity level rate with five years guarantee up to 2002. . They also identified
the existence of stale / unused data and included only the firms whose annuity rates
had changed since the previous month in their data. This “market phenomena” was
also observed in our data when analysing the maximum annuity rates available in
virtually all annuity products (see Section 3).
Lunnon ( 2001 ICA) and Cardinale (2002) described the different approaches adopted
by the pensions industry worldwide.
The “value for money” issue was referenced by a number of authors. Cannon (2004
Geneva) consider pensions in two phases, accumulation and decumulation /drawdown
in their paper on pension repayment ratios. They find that on average from 1957 to
2002 the Monies Worth was just less than 1.0 and so fair. Indeed their Table 3 (p 29)
showed that the mean MW 95% confidence interval was 0.9811 to 0.9978.
The two authors, Murthi (1999) and Finklestein (2002), who carried out cross section
analysis, see AppendixA1, were agreed that any MW < 1.0 reflects the administration

Can “compulsory” annuities provide a fair pension?
9
and other costs incurred by the provider. Murthi (pp7) provides a comprehensive
explanation why pension costs at annuitisation stage are low. MW values of 0.97 or
higher was considered reasonable, especially as Murthi (2001) observed that
“Insurance Companies invest in riskier but more rewarding assets such as European
Investment Bonds” (pp13).
Lunnon (2001) contributed a useful and timely examination of the alternatives to
compulsory annuities, including drawdown
This paper builds on the above by updating the findings and expanding the scope of
these earlier references using the established methodology for calculating EPDV and
MW
In particular
• A comprehensive database of payout rates for all 5 annuity products is created
for ages 55, 60, 65, 70, and 75. This concentrates on the Male Only category
and is monthly since August 1994.
• An Excel based EPDV Calculator is developed, tested and used to calculate
MW and other related parameters, including the number of years the pensioner
has to receive his annuity payments in order to “get his money back” in real
terms, for various retirement scenarios.
• It is used to derive and plot MW trends for review. Current annuity payout
rates are analysed and strategies developed to guide the pensioner in selecting
the optimum pension drawdown plan with a view to obtaining the best value
for money

Can “compulsory” annuities provide a fair pension?
10
3 “Compulsory” Annuity Payout1 Rates
The author approached some 20 organisations and institutions and found that at
present there is only one source that provides consistent time series data, namely
MoneyFacts – publishers of Investment Life and Pensions. This is a monthly trade
journal but only available to subscription holders. The British Library is the only
one to keep back copies. Hence MoneyFacts are the only source of historic annuity
data. Unfortunately, the available data only goes back to August 1994
Table 3.1 gives a breakdown of all the companies offering compulsory annuities in
June 2005. A relatively large number (6) offered impaired life annuities - a
significant increase since 1995 when only 2 special case rates were offered. Hence
the market has become increasingly specialised and more sensitive to the needs of
annuitants with short life expectation. This compartmentalisation “drives down” the
rates for the rest of the group. These payout rates, which are highlighted light blue,
are deleted from the database to avoid serious distortion of the market analysis..
The benefits are considerable for the impaired life annuitant. A maximum annuity
payout of £886 was offered by PAFS to a 65 year old as compared with the market
maximum of £691 for the typical pensioner (Friends Provident).
1 Annuity Payout rates are annual payments per £10,000 premium. They are also quoted as % rates eg
£691 = 6.91%

Can “compulsory” annuities provide a fair pension?
11
Moneyfacts Data Impaired Life Annuities Deleted
Provider Provider Age Age
Number Name 55 60 65 70 75 55 60 65 70 75
1 AXA 5 495 546 616 715 861 495 546 616 715 861
2
B&CE Insurance
a 603 687 809 988 1247
3 Canada Life 2 542 600 681 795 965 542 600 681 795 965
4 Clerical Medical 518 580 669 798 998 518 580 669 798 998
5
Friends Provident
2 517 592 691 823 997 517 592 691 823 997
6
GE Life (Smoker)
2 557 641 763 945 1238
7
GE Life (Special)
2 568 652 773 955 1248
8
Just Retirement
(Smoker Plus) 579 660 777 946 1195
9
Just Retirement
(Enhanced) 602 701 841 1036 1343
10 Legal & General 542 601 672 771 906 542 601 672 771 906
11 Norwich Union 541 603 680 815 1003
12 PAFS 7 767 739 886 1034 1422
13 Prudential 2 542 615 682 794 997 542 615 682 794 997
14
Scottish Equitable
6
15 Scottish Widows 540 606 685 798 996 540 606 685 798 996
16 Standard Life 540 606 679 783 945 540 606 679 783 945
Statistical
Analysis
Average 569 626 722 860 1080 530 593 672 785 958
Median 542 606 684 807 998 540 601 680 795 981
Max 767 739 886 1036 1422 542 615 691 823 998
5th Large 569 652 773 946 1238 540 600 679 794 965
Minimum 495 546 616 715 861 495 546 616 715 861
Std dev 60 51 76 105 173 18 22 24 32 51
Dispersion 0.50 0.32 0.40 0.40 0.56 0.09 0.11 0.11 0.14 0.14
Table 3.1 Male Level Annuity Payout Rates For 16 June 2005 - £'s

Can “compulsory” annuities provide a fair pension?
12
This leaves 9 providers of non-specialised annuities in the 2nd
section of the Table.
Each offers a full spectrum of products from Level to RPI linked for males aged 55,
60, 65, 70 and 75. As columns list all the providers and annuity payout rates for a
given product, it is easy to calculate their statistical properties. For example, the
average rate offered to a male aged 65 for a Level annuity was £672.28 and the
maximum was £691 (Friends Providential) an increase of £18.72 or 2.78%. The
minimum was £616 (AXA) giving a difference (max – min), of £56.28 or 9.13%.
So as FSA suggests, it is well worth shopping around , especially for an AXA
customer as the additional 9.13% would be for the rest of his life.
Money£acts provide data on 5 annuity products.
• Level,
• Annuities escalating at 5% per annum
• RPI indexed annuities.
• Level with 5 year guarantees,
• Level with 10 year guarantees
Table 3.2 shows annuity payout rates for level, RPI indexed linked and 5% p.a.
escalation as applicable to both 65 and 75 year old Males as of June 2005. Their
maximum rates are highlighted in yellow in the statistical analysis

Can “compulsory” annuities provide a fair pension?
13
Provider Age Age Age
Number 55 60 65 70 75 55 60 65 70 75 55 60 65 70 75
1 495 546 616 715 861 218 268 336 431 571 311 363 434 533 677
2
3 542 600 681 795 965 262 319 398 509 675 335 394 475 589 758
4 518 580 669 798 998 232 291 374 496 683 319 382 469 595 789
5 517 592 691 823 997 246 310 396 513 671
10 542 601 672 771 906 248 305 375 471 603 313 369 440 539 675
11 541 603 680 815 1003 239 293 363 493 672 336 382 452 597 790
13 542 615 682 794 997 265 336 400 507 697 338 451 482 611 807
15 540 606 685 798 996 254 314 395 508 673 331 392 468 591 784
16 540 606 679 783 945 242 309 382 487 644 328 397 471 576 733
Average 530 593 672 785 958 245 305 380 491 654 326 391 461 579 752
Median 540 601 680 795 981 246 309 382 496 672 330 387 469 590 771
Max 542 615 691 823 998 265 336 400 513 697 338 451 482 611 807
5th Large 540 600 679 794 965 246 309 382 496 672 328 382 468 589 758
Minimum 495 546 616 715 861 218 268 336 431 571 311 363 434 533 675
Std dev 18 22 24 32 51 15 19 21 26 41 11 27 17 28 52
Dispersion 0.09 0.11 0.11 0.14 0.14 0.19 0.22 0.17 0.17 0.19 0.08 0.23 0.10 0.13 0.17
Statistical Analysis
Level ESCALATING 5% P.A. RPI - LINKED
Table 3.2 Male Nominal and real Annuity Payout Rates -£’s- 16 June 2005
This shows a significant drop in the first year annuity payout from £998 to £807
(80.8%) if a RPI is purchased at 75 and to £697 (69.8%) for a 5%pa escalating
annuity. The reduction in payout rate are more significant at 65 (69.8%and 57.9%)
because of longer life expectation
In order to evaluate the trend of rates in recent years the most important and popular
annuity products were plotted in Figure 3.1, showing the trend of maximum and
average values of Level annuity payout rates for both for 65 and 75 year old male
annuitants.

Can “compulsory” annuities provide a fair pension?
14
Fig 3.1
Max and Average Male Level Annuity Payout Rates £'s for 65 and 75 yrs
0
200
400
600
800
1000
1200
1400
1600
1800
Aug-94 Aug-95 Aug-96 Aug-97 Aug-98 Aug-99 Aug-00 Aug-01 Aug-02 Aug-03 Aug-04
75 M ax 75 Average 65 M ax 65 Average
It clearly shows a downward trend since August 1994. However, it was not linear.
For example, the 65 year average rate suffers an initial drop from £1,197 in August
1994 to £843 in January 1999 followed by a relatively constant payment rate period
until October 2001 (£843) after which rates continue to drop to £673 in June 2005. .
The maximum difference was £112in and occurred in August 1994.
The market offered annuities to 75 year olds from August 1997 with an increased
value / margin over the 65 year old rate of £452 (42%) to reflect reduced life
expectancy. The average value followed the 65 year rate quite closely with the
margin dropping to £430 in October 2001 and down again to £340 in June 2005
(49%).
The maximum payout rate is not as responsive to “market forces” as average rates.
It remains constant for long periods and then makes some sharp adjustments e.g, the
difference with respect to the average dropped from £136 in October 2001 to £80 in
December 2001. By December 2003 a non-responsive maximum rate opened the gap

Can “compulsory” annuities provide a fair pension?
15
to £127. Over the subsequent 12 months the maximum followed the average but the
excess dropped to only £40 by June 2005. Hence during most of the above period it
was well worthwhile for the 75 year old to shop around for maximum rates.
Accordingly we adapt the maximum payout rates as the basis for further analysis
Fig 3.2 and 3.3 shows a similar pattern for the history of real annuity rates for both
65 and 75 year olds. Index linked annuities were introduced in 1998. They trend
downwards until 1998. From 1998 to 2001 they were fairly static but have continued
to declined since
F ig 3 .2 A nnuity P ayo ut R ate T rends R eal v N o minal fo r 65 yr o ld M ale
400
500
600
700
800
900
1,000
1,100
1,200
1,300
Aug-94 Aug-95 Aug-96 Aug-97 Aug-98 Aug-99 Aug-00 Aug-01 Aug-02 Aug-03 Aug-04
£
Level 65 M ax RPI 65 M ax 5% 65 M ax
The difference between the rates for the 3 types of annuity appears fairly constant
throughout.

Can “compulsory” annuities provide a fair pension?
16
F ig 3 .3 A nnuity P ayo ut R ate T rends R eal v N o minal fo r a 75 yr o ld M ale
700
800
900
1000
1100
1200
1300
1400
1500
1600
Aug-94 Aug-95 Aug-96 Aug-97 Aug-98 Aug-99 Aug-00 Aug-01 Aug-02 Aug-03 Aug-04
Level 75 M ax RPI 75 M ax 5% 75 M ax
As with max level rates, the maximum escalating and real rates also show a sluggish
behaviour as they remain constant for months, followed by sudden changes / drops,
e.g. Feb 03 for a 65 year old. It is particularly evident for 75 year olds.
One possible explanation is that some providers may use annuity funds as cash flow
regulators and so offer high rates for prolonged periods until their cash balance needs
are met. This then gives the trends their familiar “plateau” appearance. In any event
their characteristic behaviour is somewhat at variance with the performance of an
Efficient Market1 and makes it doubly difficult for a would-be annuitant to optimise
his position.
The Monies Worth implications are now addressed in order to determine which, if
any, of the annuity products are value for money. This will also show whether the
prevailing perceptions in 2002 remain valid
1 Financial Theory and Corporate Policy by Copeland and Weston Addison Wesley 1992

Can “compulsory” annuities provide a fair pension?
17
4 Monies Worth of Annuities
4.1 Introduction
We now consider the value for money of an annuity as an investment. As stated
earlier, the approach is identical to that carried out to support funding requests for
investments and projects where the future cash flow streams, both positive and
negative, are discounted back to the present value to give a net present
value(NPV) Investors will naturally expect to see a positive NPV with a
significant margin to cover risks. The annuity pv calculation includes the
probability that the annuitant will survive to receive payout for each successive
year
This work was first published by Mitchel (1999), and was focused on the USA
market. She introduced the terminology of EPDV (Expected Present Discount
Value) to be the discounted value of the future stream of annuity payouts.
Accordingly, NPV = Premium – EPDV.
The same notation was then followed by Finkelstein (2002) and Murthi (1999)
and so is retained here.
Hence =EPDV ∑=
T
t 1( )∏ =
+
∗
t
j j
tt
i
pA
11
equation 4.1.
Where At is the annuity payout in year t, and pt is the probability of survival until
year t, and ij is the discount factor for year j
Moneys Worth (MW), is defined as the EPDV/Premium ratio. As discussed
earlier, this should be 1.0 if the annuity rates are actuarially fair (AFAR).
Since 1979, The Bank of England estimates yield curves for the UK on a daily
basis. These include nominal and real yield curves and the implied inflation

Can “compulsory” annuities provide a fair pension?
18
structure for the UK. The nominal government spot interest rate is the appropriate
discount rate for future annuity payouts when calculating their EPVD. The
20 year maturity values are used and their history since 1994 is shown in Table
4.1. Data is for July 1st each year. They are graphed in Fig 4.3
year 1994 1995 1996 1997 1998
Rate % 8.23 8.35 8.32 6.94 5.42
year 1999 2000 2001 2002 2003
Rate % 4.60 4.38 5.05 4.82 4.60
year 2004 2005 2006
Rate % 4.83 4.23 4.44
Table 4.1 History of UK Nominal Spot Interest Rates 20 Year Maturity
When considering index linked annuities the appropriate first year annuity rate
was held constant but discounted at 2%, assuming constant inflation of 3% for
the period.

Can “compulsory” annuities provide a fair pension?
19
4.2 Calculation of Probability of Survival
There are two groups of people to be considered when seeking information on
survivor probabilities for annuity calculation purposes.
The first group relates to the expected mortality rates of the population as a
whole and are published by GAD, Government Actuaries Department.
The second group relates to the expected mortality rates for groups of individual
annuitants and are published by the Continuous Mortality Investigation Bureau
(CMIR). CMIR reports 16 and 17 were used as these are for compulsory
annuities. Its Table A5 for pensioners, which is designated PML 92B, is directly
relevant. It tabulates mortality rates, qx for both Males and Females from age 20
to 120 in the base year 1992. There are two tables, “lives” and “amounts”.
The “amounts” tables are primarily for the use of the annuity provider as they
represent a large group of annuitants. Hence, the “lives” table, was used as this
best reflects the mortality rates for the individual pensioner.
However, life expectancy has been increasing dramatically and Institute of
Actuaries (1999) CMIR 17 provides factors and equations to adjust for
improvement in mortality over the course of time. It shows that the more accurate
approach is to calculate an individual’s life expectation based on his or her year of
birth. However, it is quite complex to compute. This is best illustrated in figure
4.1 which shows the cumulative survival profile as a function of age for 20 to 120
year olds based on PML92 Lives mortality rate data. The data is normalised at
10,000 “lives” at aged 20 and show how many “lives” remain at each subsequent
year of age.

Can “compulsory” annuities provide a fair pension?
22 July 200620
Fig 4.1 Cumulative Survival Profile
0
2000
4000
6000
8000
10000
12000
20 25 30 35 40 45 50 55 60 65 70 75 80 85 90 95 100 105 110 115 120
Age
Lives L(xt) 1944 1939 1934 1929 PML92
Age 60 Lives 9260
Born
Age 60 65 70 75
Age 65 Lives 8685
Age 70 Lives 7700
Age 75 Lives 6400

Can “compulsory” annuities provide a fair pension?
21
Probabilities of survival are built up from the mortality rate data in PML 92B
table, starting at the age 20 as follows
L21 = (1-q20 ).L20. Eq 4.2
The black curve in fig 5.1 is the base curve and the coloured ones reflect different
age groups. For example, a 65 year old has 8,685 lives remaining but instead of
following the black curve the grey curve is used which gives a clearly extended
life profile. This is a life expectancy correction based on the 65 year old starting
his pension last year (analysis year 2004) and so he belongs to the cohort who
were born in 1939. Hence the age and year a person purchases his annuity
decides the precise survival probability curve he is subsequently expected to
follow for annuity evaluation/cost purposes.
At that point his probability of receiving his first payout is, naturally, 100%.
For example, a 75 year old would have 6,400 lives left and would then start to receive
payment based on the blue curve profile. The actual probability of receiving an
annuity in subsequent years is shown in Fig 4.2. Naturally, it is 100% on starting
"retirement" regardless of age but falls rather more steeply for a 75 year old rather
than a 65 year old. These curves are generated by normalizing the appropriate life
curve of the Fig 4.1 to 100% on starting to draw the annuity payouts.

Can “compulsory” annuities provide a fair pension?
22
Fig 4.2 Cumulative Probability of Reciept of Annuity (Survival)
0
10
20
30
40
50
60
70
80
90
100
50 55 60 65 70 75 80 85 90 95 100 105 110
Age
%
60 65 70 75Pension age
4.3 The EPDV Calculator
When the complexity of doing the calculations based on the year of birth was
established and as it was planned to trend MW from 1994, the author endeavored,
without success, to identify a software package to undertake the EPDV calculations.
Therefore, it was necessary to develop an EPDV Calculator using Excel and do the
necessary calculations to determine survival probabilities from mortality tables as part
of the annuity payout discount cash flow computation. The EPD Calculator is set up
to generate data for four age groups. 60, 65, 70, and 75 and so a separate spreadsheet
similar to that in Fig 4.2 is needed for each age and year of birth.

Can compulsory annuities provide a fair pension?
22 July 200623
Table 4.2 Principles of Annuity Evaluation using the "EPDV Calculator"
1235
6
789
10111213141516171819202122232425262728293031323334353637
A B C D E G J K L M N O S U X AD AG AHInitial Data Birth Year 1939
Retirement Age 65
Analysis Year 2004
Age
Mortality
rate Lives
Years from
base data
date (1992)
mortality rate
reduction
factor
reduced
mortality
rate
Revised
Lives
Years Post
Retirement
Age
Annuity
rate
Discount
Factor
Cumulative
Discount Factor Present Value
x qx sx lx t RF(x,t) q(x,t) s(x,t) l(x,t) p(y) y Ay i ((1+i)y)-1 p(y) PV Ay
20 0.0006 0.9994 10000 -33 3.378767298 0.0021 0.9979 10000
30 0.0006 0.9994 9942 -23 2.309339356 0.0013 0.9987 9834
40 0.0008 0.9992 9881 -13 1.591945284 0.0013 0.9987 9717
53 0.0039 0.9961 9658 0 1 0.0039 0.9961 9450
60 0.0098 0.9902 9261 7 0.787875378 0.0077 0.9923 9104
65 0.0181 0.9819 8686 12 0.718563511 0.0130 0.9870 8676 1.000 0 £702.00 0.05 1.0000 1.000 £702.00
70 0.0321 0.9679 7724 17 0.691442626 0.0222 0.9778 7991 0.921 5 £702.00 0.05 0.7835 0.921 £506.60
75 0.0542 0.9458 6290 22 0.692657833 0.0375 0.9625 6942 0.800 10 £702.00 0.05 0.6139 0.800 £344.81
80 0.0866 0.9134 4464 27 0.713184494 0.0618 0.9382 5473 0.631 15 £702.00 0.05 0.4810 0.631 £213.01
85 0.1311 0.8689 2585 32 0.746959212 0.0979 0.9021 3702 0.427 20 £702.00 0.05 0.3769 0.427 £112.88
90 0.1875 0.8125 1128 37 0.789769664 0.1481 0.8519 1988 0.229 25 £702.00 0.05 0.2953 0.229 £47.50
100 0.3245 0.6755 65 47 0.891069894 0.2892 0.7108 192 0.022 35 £702.00 0.05 0.1813 0.022 £2.81
120 1.0000 0 67 1 1.0000 0.0000 0 0.000 55 £702.00 0.05 0.0683 0.000 £0.00
Life expectancy 18.6 EPDV £8,231.92
Reduction Factor for Mortality Improvement
Probability of
receiving
annuity
Base Data EPDV Calculation

Can compulsory annuities provide a fair pension
24
Each holds the entire PML92 data from ages 20 to 120 i.e. 100 rows of data.
This gives considerable accuracy. Table 5.4 illustrates the calculations for a
male annuitant born in 1939 and so aged 64 in 2004. They are carried out for
each year from age 64 to age 120 and their summation gives a probable life
expectancy of 18.8 years and an EPDV of £8231
It is also possible to readily adapt it to cope with other mortality tables and to
estimate
• Internal rate of return
• Retirement duration to achieve AFAR
The verification of the EPDV Calculator is a necessity and Lunnon M (2003) of
GAD reviewed it, confirmed the actuarial approach methodology and found the
results of the EPDV Calculator to be within 1% of their own. This is fully
reported and comparisons with other published results by Murthi (1999) and
Finkelstein (2002) are presented in Appendix A1
In summary, the data is sound, the analysis techniques adapted are proven and
the MW calculations are verified. Hence one can have a high level of confidence
in the analysis results

Can compulsory annuities provide a fair pension
25
4.3 Monies Worth Values of Market Average Level Annuities
In June 2006 the MW value of the maximum annuity payment stream for a 65 year
old is 0.843 and so the annuitant suffers a significant financial loss of 15.7 p in the
premium £. The actuarially fair annuity rate is £813 cf market maximum payout of
£686. (see table 5.1)
This was not always so. Fig 4.3 which shows the trend of Moneys Worth for Level,
escalating at 5%, and RPI linked annuities for a 65 year old male. The UK nominal
spot rates are also plotted as they are used as the discount factors in the MW
computation
Fig 4.3 Moneys Worth Trend using historic discount factors Real v Nominal for 65 yr old
0.400
0.500
0.600
0.700
0.800
0.900
1.000
1.100
1.200
1994 1995 1996 1997 1998 1999 2000 2001 2002 2003 2004 2005 2006
Analysis Year
Mo
ne
ys
Wo
rth
0
0.02
0.04
0.06
0.08
0.1
0.12
0.14
No
min
al S
po
t R
ate
s
LEVEL Max rate Age 65 RPI - LINKED Max rate Age 65
ESCALATING 5%P.A. COMPOUND Max rate Age 65 AFAR
UK Nominal Spot Rates 20 Yr Maturity
Up to 2001 the MW was in excess of 1.0 and so annuity payout rates were better than
AFAR. In principle they were responsive to interest rate changes. They peaked in
2000, (at 1.12 for the Level annuity). Since then they have been in steady decline
(Level annuity is down to 0.85 in June 2006), even though the discount factor remains

Can compulsory annuities provide a fair pension
26
fairly constant . As MW did not drop below 0.95 until 2002, it has not been reported
in any of the references considered in the literature review.
The real and escalating annuity rates follow a similar pattern except that since 2003
their MW values have dropped significantly below that offered by the Level product.
Surprisingly, the MW of the real product (RPI 3% constant) is lower than an
escalating one (5%). Finklestein (2000) discusses this inconsistency and suggests that
it may be that insurance companies have to bear some inflation risk and “it is possible
that risk averse individuals are willing to pay a higher risk premium for a real
product” (p47)
Fig 4.4 Guarantees Moneys Worth Trends
0.600
0.700
0.800
0.900
1.000
1.100
1.200
1994 1995 1996 1997 1998 1999 2000 2001 2002 2003 2004 2005 2006
Analysis Year
Mo
neys
Wo
rth
LEVEL LEVEL GUARANTEED 5 YEARS LEVEL GUARANTEED 10 YEARS
Fig 4.4 shows the same pattern for Level annuities with both 5 and 10 year
guarantees. Indeed there is little difference in MW values for all 3 products since
2000

Can compulsory annuities provide a fair pension
27
A key uncertainty in pricing annuities is life expectation and it is possible that
annuity payout rates have been dropping to reflect concerns re the extent of this risk.
In order to evaluate this theory, the EPDV calculator was re run to determine the
number of extra years of life expectancy that would have to be added to the current
life expectancy (18. 8 years for a 65 year old in June 2006), to make the EPDV equal
to the premium of £10,000. This is done by incrementally reducing the age the
annuity payout starts until the MW is 1.0. Using maximum annuity rates, this was
found to be 5.8 extra years, bringing the actuarially fair retirement life expectancy
up to 24.6 years. Although it is conceptually attractive to add these years on to the
current life expectation, this is analytically incorrect and quite unrealistic with a
significant reduced probability of surviving the extra years. The correct interpretation
is that the pensioner should be offered early retirement with the same annuity rate
paid accordingly ( eg from age 59.2). As this option is not offered, the present
annuity payout rates give the annuity providers a generous margin for error in
mortality predictions and tables.
Annuity payout rates are, naturally, expected to fall as forecasts of life expectancy rise
at a given MW, ideally retaining AFAR. However, this cannot also justify the
significant reductions in MW below its AFAR value of 1.0 as shown in Figs 4.3 and
4.4, and which leaves the pensioner with an ever reducing value for his annuity
premium.
Further, as discussed earlier, the present major loss to the annuitant is difficult to
explain in terms of costs to the providers which are minimal during the drawdown
phase of a pension fund

Can compulsory annuities provide a fair pension
28
5 Income Drawdown Strategies
5.1 The Pensioners Options and Dilemmas
In 2002 the Financial Services Authority (FSA) were concerned that consumer
understanding of annuities was low and that people did not fully understand the
risks of their decisions. The various options available on the market are discussed
and analysed to develop strategies to guide pensioners when formulating their
drawdown strategy. This is presented in section 5.2
Most people, especially those with small pensions, stay with their pension
provider and do not shop around for the best annuity rates. Hence the open
market options are rarely exercised. Shopping around is assessed in MW terms
by comparing maximum and average rates for a range of products
Many delay the purchase of an annuity as long as possible, risking a poor
outcome. This is known as “longevity drag”. As each type of annuity is available
from age 55 onwards, the impact of delay is evaluated and quantified in MW
terms
There is a common perception that the highest initial income is best and few
people purchase either Index linked or escalating annuities. Further, people with
longer than average life expectancies are naturally worried about the falling value
in real terms of their fixed annuity income. This can be protected by purchasing
index linked or escalating annuities. A MW analysis is carried out to see if they
are value for money?
Guarantees were offered by the Industry in 1997 in response to the widespread
criticism against compulsory annuities as confirmed by Lunnon (2003) that when
you die the money goes to the Insurance Company. The guarantee is that should

Can compulsory annuities provide a fair pension
29
the pensioner die payments will continue to be paid to the deceased estate for the
remainder of the guarantee period.
Fig 5.1 Impact of Guarantees on the Cumulative Probability of Survival
and Receipt of an Annuity
0
20
40
60
80
100
120
60 62 64 66 68 70 72 74 76 78 80 82 84 86 88 90 92 94 96 98 100
Age
%
Level 5 years Guarantee 10 Years Guarantee
As shown in figure 5.1 they effectively amend the cumulative survival profile to
be constant for the appropriate period after which it reverts to the basic Level
profile. These are offered are for either 5 or 10 years with both nominal and real
products but only to the age of 75.
In addition, individuals often buy single life policies leaving their partners
exposed to significant risk, especially given that female life expectation is greater
than males and many partners live 15 to 20 years on after the death of their
husband. An MW analysis provides guidance on their value and possible use as
an alternative to purchasing a joint life annuity
No analysis is undertaken for impaired life annuities for those with medical
disabilities as they are ideal for those prepared to undergo the necessary medicals
Can compulsory annuities provide a fair pension
30
5.2 Some Strategies for Income Drawdown
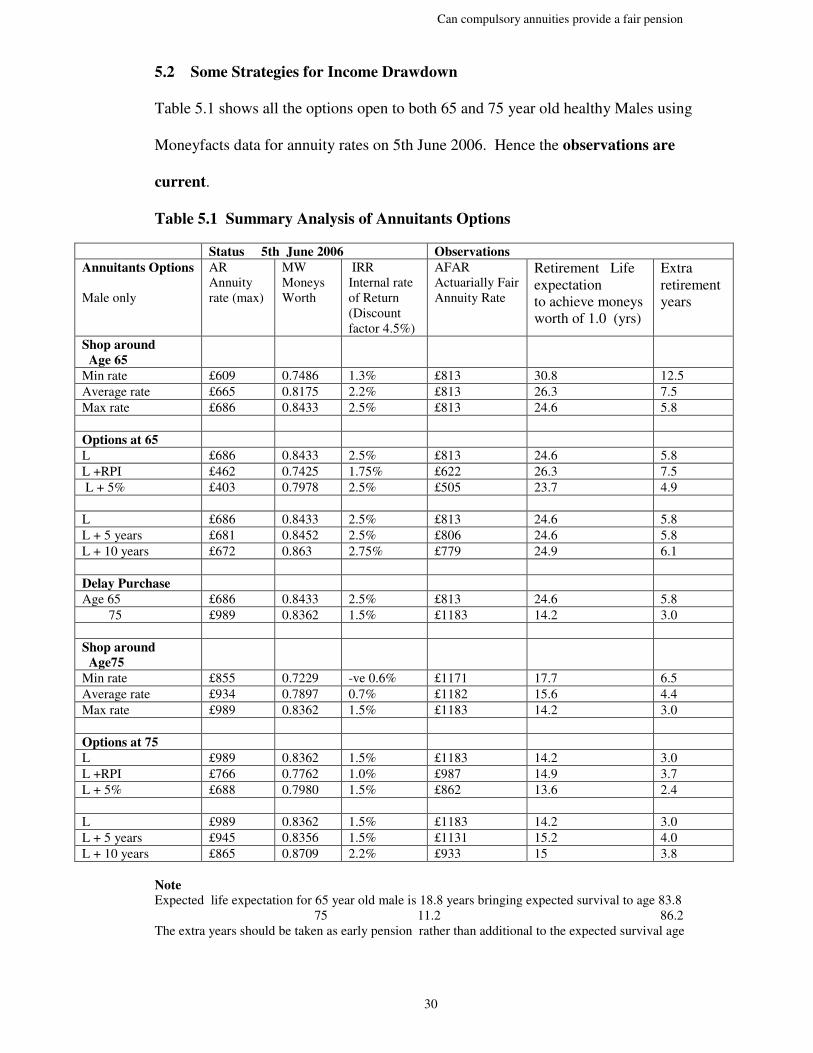
Table 5.1 shows all the options open to both 65 and 75 year old healthy Males using
Moneyfacts data for annuity rates on 5th June 2006. Hence the observations are
current.
Table 5.1 Summary Analysis of Annuitants Options
Status 5th June 2006 Observations
Annuitants Options
Male only
AR
Annuity
rate (max)
MW
Moneys
Worth
IRR
Internal rate
of Return
(Discount
factor 4.5%)
AFAR
Actuarially Fair
Annuity Rate
Retirement Life
expectation
to achieve moneys
worth of 1.0 (yrs)
Extra
retirement
years
Shop around
Age 65
Min rate £609 0.7486 1.3% £813 30.8 12.5
Average rate £665 0.8175 2.2% £813 26.3 7.5
Max rate £686 0.8433 2.5% £813 24.6 5.8
Options at 65
L £686 0.8433 2.5% £813 24.6 5.8
L +RPI £462 0.7425 1.75% £622 26.3 7.5
L + 5% £403 0.7978 2.5% £505 23.7 4.9
L £686 0.8433 2.5% £813 24.6 5.8
L + 5 years £681 0.8452 2.5% £806 24.6 5.8
L + 10 years £672 0.863 2.75% £779 24.9 6.1
Delay Purchase
Age 65 £686 0.8433 2.5% £813 24.6 5.8
75 £989 0.8362 1.5% £1183 14.2 3.0
Shop around
Age75
Min rate £855 0.7229 -ve 0.6% £1171 17.7 6.5
Average rate £934 0.7897 0.7% £1182 15.6 4.4
Max rate £989 0.8362 1.5% £1183 14.2 3.0
Options at 75
L £989 0.8362 1.5% £1183 14.2 3.0
L +RPI £766 0.7762 1.0% £987 14.9 3.7
L + 5% £688 0.7980 1.5% £862 13.6 2.4
L £989 0.8362 1.5% £1183 14.2 3.0
L + 5 years £945 0.8356 1.5% £1131 15.2 4.0
L + 10 years £865 0.8709 2.2% £933 15 3.8
Note
Expected life expectation for 65 year old male is 18.8 years bringing expected survival to age 83.8
75 11.2 86.2
The extra years should be taken as early pension rather than additional to the expected survival age

Can compulsory annuities provide a fair pension
31
The MW and IRR values are calculated and added. For completeness the
observations show the AFAR and the “retirement life expectancy” the annuitant needs
to achieve in order to get his money back ( ie achieve a MW of 1.0) under the present
rates. The extra years over the mortality tables retirement life expectation are also
shown for illustration of how many years the annuitant is expected to loose when
purchasing under present market rates
The following strategies / observations should be noted
• In Moneys Worth terms all annuity products for both age groups offer very poor
value for money. A comparison with AFAR clearly shows this. Hence the best
strategy is to avoid purchasing an annuity by opting for an ASP at the appropriate
time, particularly as the residual fund goes to ones estate. The remaining points
are for those who intend to purchase an annuity perhaps as part of their drawdown
strategy.
• Shopping around is common sense and in practical terms involves no risks since
the size of the provider, his market share or his financial rating has little impact on
annuity payout rates. This is clearly advantageous as it enables the annuitant to
obtain the highest available payout rate without suffering any penalties and both
the MW and IRR reflect this. However the annuitant should be aware of the
anomalies of the market and the step nature of the movement of maximum rates.
• All further analysis are on the basis of maximum rates

Can compulsory annuities provide a fair pension
32
• Deferring purchase from 65 to 75 provides an increase in annuity payout rate
from £686 to £989 (+44%). However there is no significant change in MW, both
being 0.84. Hence it is probably better to take the income, by transferring the
fund to a SIPP, rather than let the fund build up. Under present rules 25% can be
taken as a tax free lump sum and the remainder invested in a wide portfolio of
assets. The amount of drawdown to take each year can also be decided by the
pensioner up to a prescribed limit. Hence the pensioner retains control of his
finances until he chooses to purchase an annuity - if ever. Throughout, the
residual fund remains part of the pensioner’s estate in the event of death.
• The need to protect the standard of living is a real concern if expected longevity
is high or one is taking an early pension. The pensioner has to decide if it is better
to purchase a product that gives a payout which escalates at a fixed rate or is
inflation protected, even though the initial payout is low (£462 cf £686 for a 65
year old) However the MW is also reduced from 0.84 to 0.74 making it a poorer
investment and one needs 7.5 extra retirement years to “get value”
Hence there is no incentive in MW terms to purchase an indexed linked or
escalating annuity as they both incur greater “losses” than the Level.
Should a risk averse pensioner wish to protect income stream and wants 100%
insurance then he is best investing in a SIPP, taking drawdown as needed, waiting
until 75 and purchasing the most advantageous index linked annuity available. In
June 2006 this was £766 from Prudential and incurred a “risk premium” of 23% in
MW terms (MW=0.77) compared with an AFAR of £ 987. His investment will
only payoff should he enjoy 3.7 extra retirement years.

Can compulsory annuities provide a fair pension
33
• Guarantees are available at rates which offer similar MW returns as the level
annuity. Indeed there is a small benefit accruing. . For example, a 75 year old
male taking out a 10 year guarantee sees an increase in MW from 0.836 to 0.87 or
3.4p in the premium £. This is attractive especially if he has a partner of similar
age as the alternative of buying a joint lives annuity is much more expensive. The
savings could be invested as contingency for the partners pension should the
partner outlive the annuity guarantee period, as is statistically likely.
In summary, at present the “compulsory “annuity is very poor value for money
with MW values below 0.84 for the various products. In investment terms this is
equal to a loss of 16% of the premium.
Fortunately, the recent A day legislation allows the pensioner to transfer his pension
funds into a SIPP and manage his own investment and drawdown strategies -
without having to purchase an annuity at 75. This should be considered as the most
appropriate plan
Can compulsory annuities provide a fair pension
34
6 Conclusions
The main conclusion is that annuities no longer provide value for money and hence a
fair pension.
At present the maximum annuity payout rate available to healthy 65 year olds is £686
giving an MW of 0.84 equivalent to an Internal Rate of Return of 2.51%. The
actuarially fair rate would be £813. This is an unacceptable “loss” / premium (16%
minimum) to expect any investor to bear. The situation is worse for those either
delaying to 75 (IRR = 1.5%) or wishing to buy an index linked product. (MW =0.74).
There is a small benefit, in present value terms, for purchasing a Level annuity with a
10 year guarantee.
A suggested reason for these high costs was the underlying concern of annuity
providers about increasing longevity. The analysis shows that it would be necessary
to increase retirement life expectancy for a 65 year old with a maximum rate level
annuity from 18.8 years by an extra 5.8 years to obtain actuarial fairness. These extra
years should be earned by taking an earlier pension (at 55.5) at the same payout rate
rather than hoping to live longer. As this option is not offered, current rates clearly
provide the annuity providers with a very generous margin for error in mortality
predictions and tables
Up to 2001 the MW was in excess of 1.0 . They peaked in 2000, at 1.12 for the Level
annuity. Since then they have been in steady decline (Level annuity is down to 0.84
in June 2006), even though the discount factor remains fairly constant .Hence
“compulsory” annuities provided reasonable value for money so long as the MW was

Can compulsory annuities provide a fair pension
35
greater the 1.0. This threshold was crossed in 2002, and the “compulsory” annuity
has become increasingly expensive and a poor investment. This observation applies
to all annuity products that were analysed. Thus the wide perception that “annuities
are poor value for money” has been confirmed to be correct since 2002. No rational
explanation was found for their progressive devaluation over the last 5 years. While
annuity rates can be expected to fall as life expectation rises there is no logical reason
why this should also justify a reduction in its moneys worth value. As MW did not
drop below 0.95 until 2002, their recent poor performance has not been reported in
any of the references in the literature review
The sluggish response characteristic of some annuities rates is identified as applying
to the maximum rate available to the annuitant rather than the average across the
market. One explanation of this “phenomena” could be that some insurance
companies may use the annuity sector to manage their cash flow. Therefore, in a
period of shortage, higher annuity rates may be offered. These remain high until the
primary objectives are achieved, after which these rates are revised. This is somewhat
at variance with the characteristics on an efficient market and makes it doubly
difficult for a would-be annuitant to optimise his position.
Hence, it is fortunate that compulsory annuitisation at the age of 75 was withdrawn as
of April 2006. The use of personnel pension plans, such as a SIPP, leaves the
investment and life long drawdown strategy with the pensioner. This offers many
benefits as long as annuities continue to be such poor value for money.
The impact on the future of the annuity market remains to be seen.

Can compulsory annuities provide a fair pension
36
7 Bibliography
1. Cannon, E. and Tonks, I .(2004) UK Annuity Rates, Money’s Worth, and
Pension Replacement Ratios 1957 -2002 .Geneva Paper
2. Cannon, E and Tonks, I (2004) UK Annuity Price Series 1957 – 2002
Financial History Review April 2004
3. Cardinale, M et al (2002) Paying Out Pensions. A Review of the
International Markets. Watson Wyatt Research Report, RU07
4. Davis, P (2004). Is there a pensions crisis in the UK. Geneva Papers
5. Davis, P (2004). Evolution European Pensions Market. Geneva Papers
6. Davis, P. (2004) Issues in the Regulation of the Annuity Markets.
Book: Developing an Annuity Market in Europe, EE 2004
7. Financial Services Agency (2003) Purchasing annuities and an examination
of the impact of the Open Market Option. Research note 22
8. Finkelstein, A and Poterba, J (2002). Selection Effects in the UK Individual
Annuities Market. Economic Journal 112 p 28-50.
9. Institute of Actuaries (1999) Continuous Mortally Investigation Reports
Nos.16 and 17
10. Lunnon, M.(2003) Annuitisation: Major Issues Actuarial Aspects of
Pension Reform, Moscow, July 2003
11. Lunnon, M (2002) Annuitisation and the alternatives. 27th
International
Congress of Actuaries Cancun Mexico
12. Mitchell, O (1999) New Evidence of the Money’s Worth of Individual
Annuities American Economic Review p1229 - 1337

Can compulsory annuities provide a fair pension
37
13. Murthi, M (1999) Value for Money of Annuities in the UK – Theory
Experience and Practice Conference on “New ideas about old age securities”
World Bank Washington DC September 1999
14. Murthi, M. (2001) Annuity Margins in the UK OECD Conference Brazil
March 2001
15. Orszag, M. (2000) Annuities: The Problems NAPF annual conference
May

Can compulsory annuities provide a fair pension
38
Appendices
Appendix A1 EPDV Accuracy checks
It was considered, with the complexity of the calculations, that it was important
to check on its accuracy by comparing with other reliable sources. A 10%
margin is considered satisfactory given the range of assumptions that are
possible.
Only two references contained detailed data on both the annuity rates and their
corresponding MW calculation.
a. Murthi (1999) Table 3 (p40) included industry average annuity payout
rates for males aged 65, 70 and 75 as of April 1999. They are for a
premium of £10,000. The corresponding MW values are included in its
Table 4 (p41). They are based on mortality data from the PML92 Base
tables and arewere not corrected against year of birth. They use zero
coupon yield curves (ZCYC) for discounting.
b. Finkelstein (2002) Table 1 provided “compulsory” annuity payout rates
from November 1998 and its Table 2 the corresponding MW results.
References are made to a “compulsory” annuity lives weighted mortality
tables – presumably PML92B. No information is provided about the
nominal interest rates used.
As mentioned earlier M.Lunnon of GAD provided advice on actuarial matters.
calculated the corresponding MW using PML92B mortality tables adjusted for
year of birth and a constant 5% discount factor.

Can compulsory annuities provide a fair pension
39
The results are compared with corresponding EPDV calculations in Table A1.
Age
Analysis
Year
Year of
Birth
1st Year
Annuity
Discount
Factor
Moneys Worth
MW Differences
EPDV Calculator 60 2004 1944 617.18 0.05 0.830
GAD 617.80 0.820 1.20%
EPDV Calculator 65 2004 1939 702.00 0.05 0.823
GAD 702.00 0.823 0.00%
EPDV Calculator 1999 1934 850.00 0.05 0.976
Murthi,M (1999) 850.00 ZCYC 0.965 1.17%
EPDV Calculator 1998 1933 897.00 0.05 1.026
Finklestein, A 897.00 0.962 6.24%
EPDV Calculator 70 2004 1934 818.09 0.05 0.811
GAD 818.09 0.811 0.01%
EPDV Calculator 1999 1929 1,003.00 0.05 0.971
Murthi,M (1999) 1,003.00 ZCYC 0.946 2.57%
EPDV Calculator 1998 1928 1,036.00 0.05 0.998
Finklestein, A 1,036.00 0.945 5.31%
EPDV Calculator 75 2004 1929 996.09 0.05 0.812
GAD 996.09 0.812 0.00%
EPDV Calculator 1999 1924 1,221.00 0.05 0.970
Murthi,M (1999) 1,221.00 ZCYC 0.928 4.33%
EPDV Calculator 1998 1923 1,252.00 0.05 0.99
Finklestein, A 1,252.00 0.921 7.11%
Table A1 Accuracy of EPDV Calculator - Moneys Worth Values
The table is divided into age groups. For each age group, the annuity payout
rates and MW data from external source is entered and the same annuity rates
used in the EPDV Calculator to estimate an MW and the MW’s are compared.
For example taking the 65 year old data from Murthi the stated AR of £850 and
is entered into the EPDV Calculator which estimated a MW of 0.976 . This

Can compulsory annuities provide a fair pension
40
compares with Murthi’s MW of 0.965 and the normalised difference of 1.17 %
is shown in the differences column.
It can be seen from GAD comparisons where assumptions and actuarial results
are the same that the results are virtually identical. With the Murthi published
data agreement is in the range of 1 to 4.5% and Finkelstein a bit wider at 5% to
7½%.
Hence, the GAD comparison shows EPDV Calculator is sound and can be relied
on to produce accurate results. The other comparisons confirm this as the
results are consistent and well within the margins of error from the differing sets
of assumptions. In all cases the EPDV Calculator generated higher MW values
which are consistent with the longer life expectancy arising from the use of date
of birth adjusted mortality tables.