education statistics - national statistics office ( … statistics 2006 – valletta: ... 4.4 number...
TRANSCRIPT

EDUCATION STATISTICS
2006
National Statistics Office, Malta, 2010

Published by the National Statistics Office
Lascaris Valletta Malta
Tel.: (+356) 25 99 70 00 Fax:(+356) 25 99 72 05/ 25 99 71 03
e-mail: [email protected] http://www.nso.gov.mt
CIP Data Education Statistics 2006 – Valletta: National Statistics Office, 2010 xvi, 166p. ISBN-13: 978-99909-73-93-8 ISSN 0076-3489 For further information, please contact: Labour Market and Education Statistics National Statistics Office Lascaris Valletta VLT 2000 Malta Tel: (+356) 25 99 76 69 Our publications are available from: External Cooperation and Communication Department of Information National Statistics Office 3 Castille Place Lascaris Valletta Valletta VLT 2000 Tel.: (+356) 25 99 72 10 Tel.: (+356) 21 22 49 01 Fax: (+356) 25 99 72 05 Fax: (+356) 21 23 71 70

C O N T E N T S
Page
Commentary
CHAPTER 1 – MAINSTREAM SCHOOLS AND CLASSES 1
1.1 Number of schools/institutions by level of education, sector and locality/district 3
1.2 Number of classes and pupils and mean class size by sector, year of study and level of education 5
CHAPTER 2 – ENROLMENTS IN MAINSTREAM EDUCATION 7
2.1 Enrolments by sex, age, sector, year of study and level of education in compulsory schooling 9
2.2 Enrolments by sex, age, sector and year of study in Post-Secondary General 11
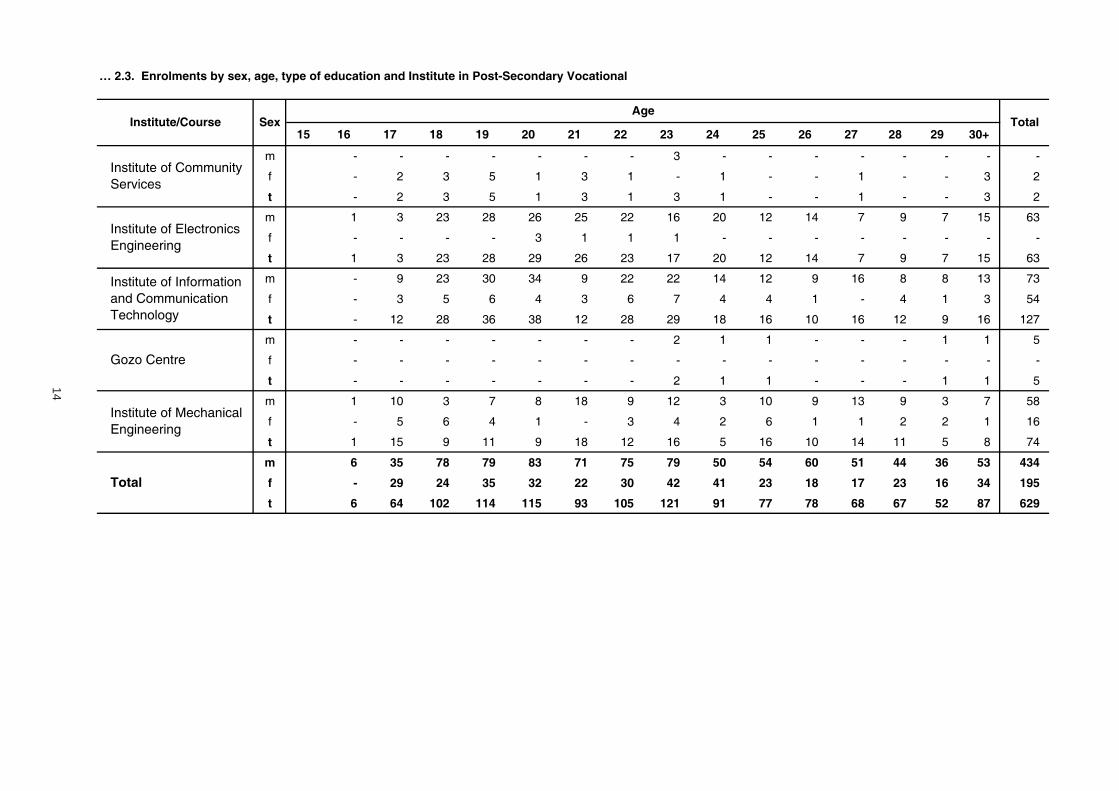
2.3 Enrolments by sex, age, type of education and Institute in Post-Secondary Vocational 12
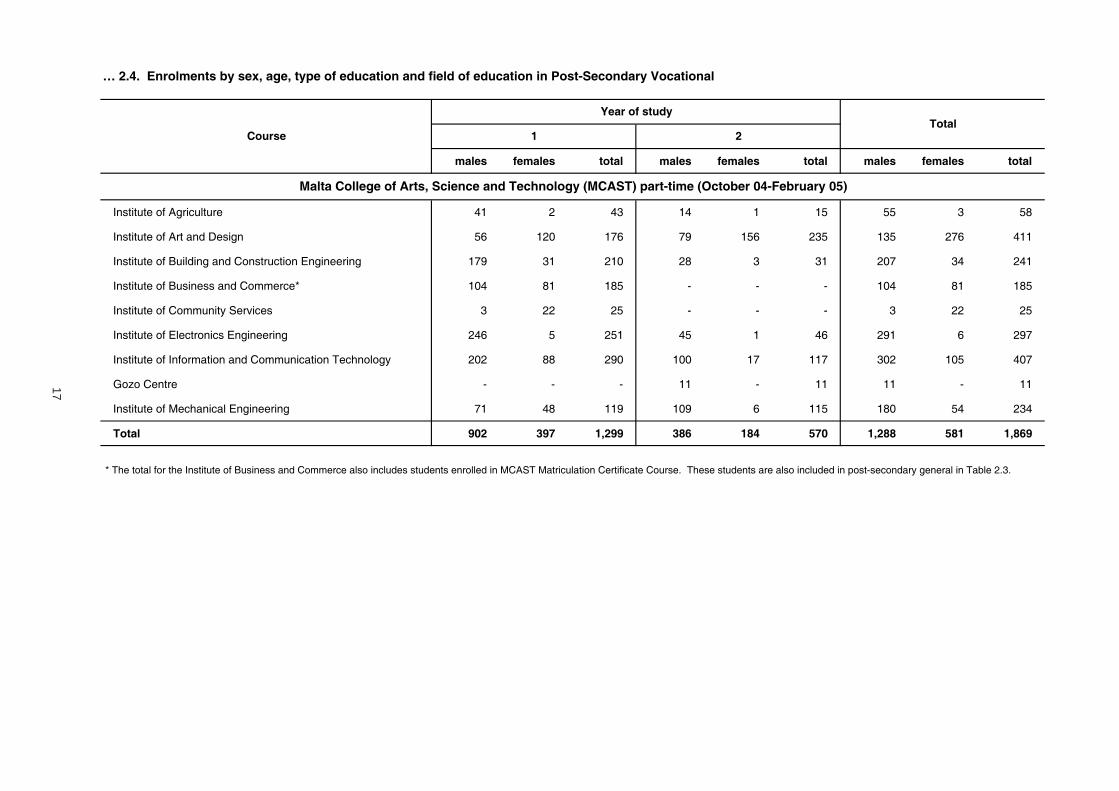
2.4 Enrolments by sex, age, type of education and field of education in Post-Secondary Vocational 15
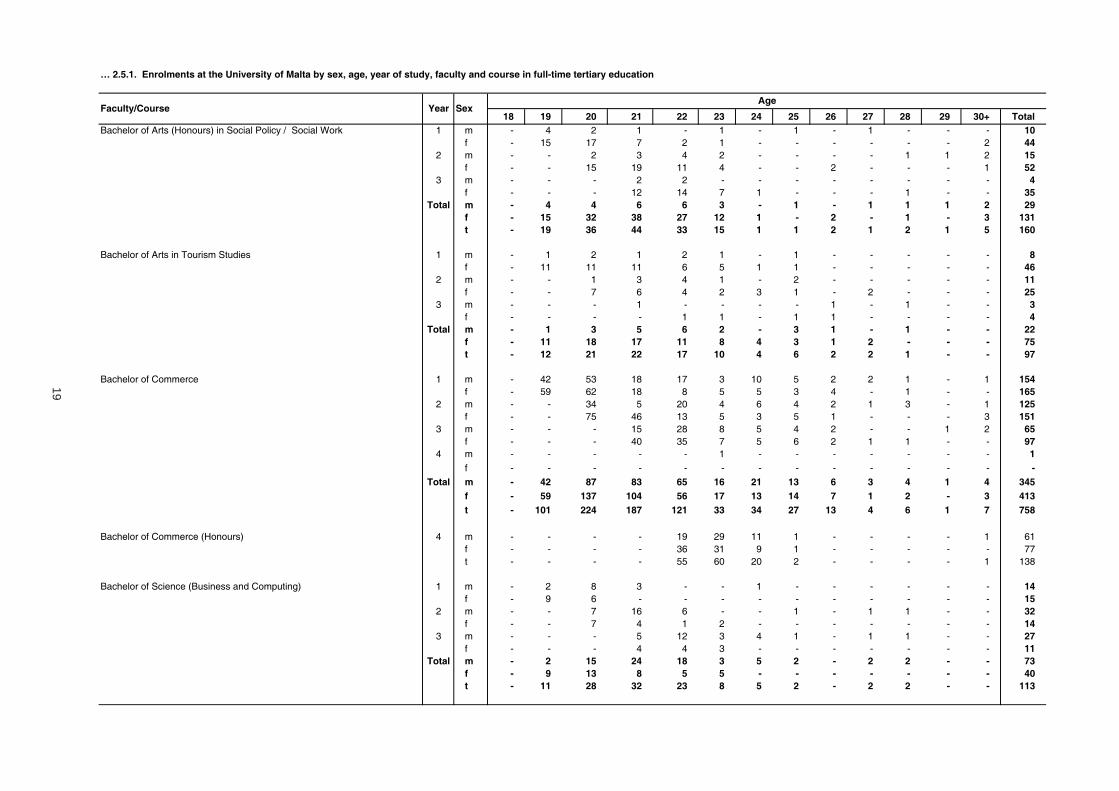
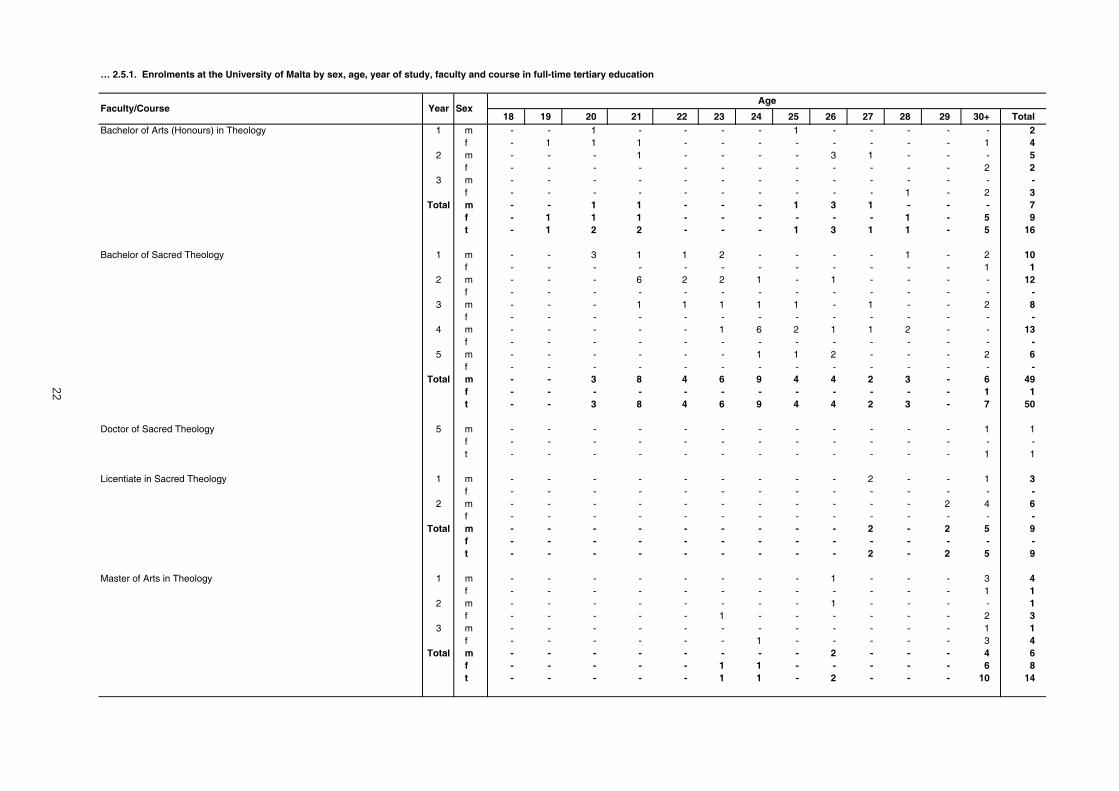
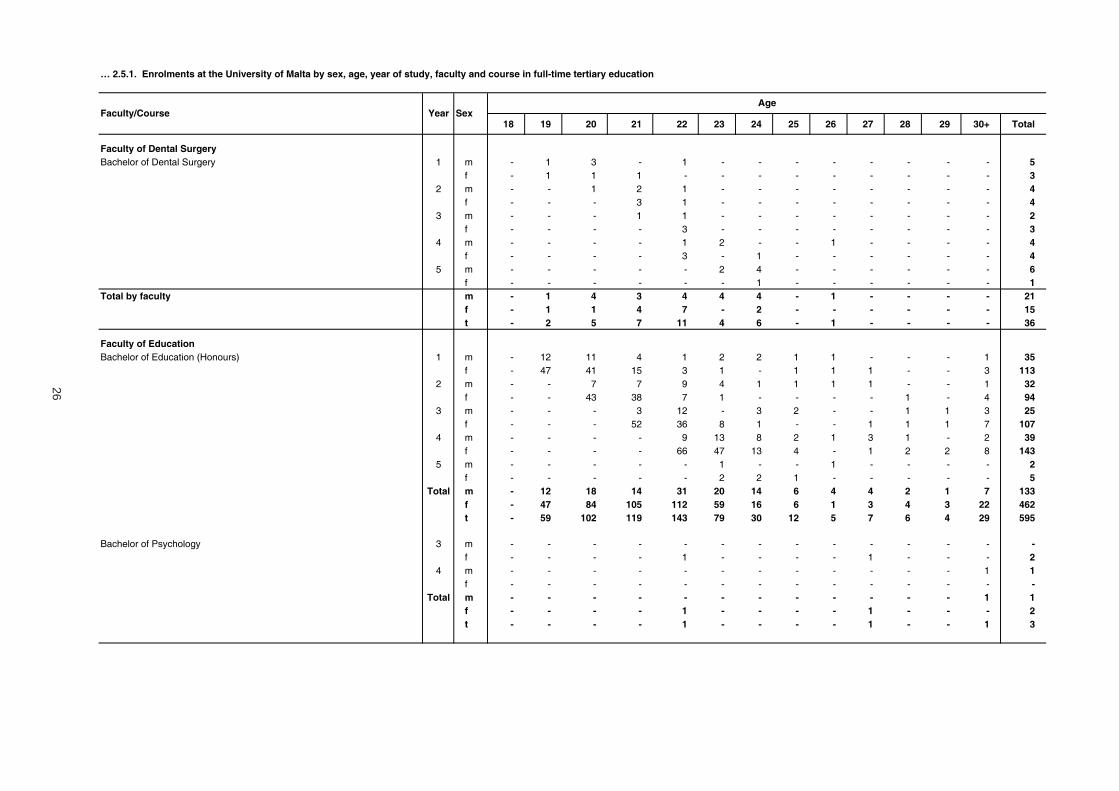
2.5.1 Enrolments at the University of Malta by sex, age, year of study, faculty and course in full-time tertiary education 18
2.5.2 Enrolments at the University of Malta by sex, age, year of study, faculty and course in part-time evening tertiary education 34
2.5.3 Enrolments at the University of Malta by sex, age, year of study, faculty and course in part-time day tertiary education 54
2.6 Enrolments at the University of Malta by sex, age, faculty and field of study 58
2.7 Enrolments by sex, sector, level of education and type of education (summary) 59
2.8 Number of repeaters in primary schools by sex, age, sector, year of study and level of education 60
2.9 Number of repeaters in secondary schools by sex, age, sector, year of study and level of education 61
2.10 Number of dropouts 62
2.11 Students by sex, year of study, sector of education and foreign languages learnt in secondary education 65
2.12 Average age of students by year of study, sector and level of education 68
2.13 Enrolments rates 69
CHAPTER 3 – ENTRANTS IN MAINSTREAM EDUCATION 71
3.1 Entrants by sex, age, level of education and sector of education 73
3.2 Entrants in post-secondary general schools by sex and age 73
3.3 Entrants at the Institute of Tourism Studies (ITS) by sex and age 73
3.4 Entrants at Malta College of Arts, Science and Technology (MCAST) by sex and age 74
3.5 Entrants at University of Malta by sex, age and course type 74
3.6 Entrants at University of Malta by sex, age and course structure 75
3.7 Entrants at University of Malta by sex and field of study 76

Page
CHAPTER 4 – FOREIGN STUDENTS IN MAINSTREAM EDUCATION 77
4.1 Pre-primary foreign students by nationality, sex, age and level of education 79
4.1.1 Primary foreign students by nationality, sex, age and level of education 81
4.1.2 Secondary foreign students by nationality, sex, age and level of education 83
4.2 Pre-primary foreign students by country, sex, sector and level of education 86
4.2.1 Primary foreign students by country, sex, sector and level of education 90
4.2.2 Secondary foreign students by country, sex, sector and level of education 94
4.3 Foreign students by year of study, sex, sector and level of education 98
4.4 Number of foreign students enrolled at the University of Malta attending a tertiary level of education (ISC 5/6) by level of education, programme destination and country of citizenship 99
4.5 Number of foreign students attending a tertiary level of education (ISC 5/6) at the University of Malta by level of education and field of study 101
CHAPTER 5 – SPECIAL EDUCATION 103
5.1 Students attending special schools by sex and age 105
5.2 Students attending special schools by sex and type of disability 106
5.3 Teaching staff in Government special schools classified by grade, sex and age 107
5.4 Number of disabilities amongst children following education in mainstream schools by sector, year of study, level of education, type of institution and type of disability 109
5.5 Children with special needs following education in mainstream schools by sex, age, year of study, level of education and sector 110
5.6 Pre-primary children with special needs having a facilitator (shared or individual) following education in mainstream school by sex, age, year of study, level of education and type of institution
112
5.6.1 Primary children with special needs having a facilitator (shared or individual) following education in mainstream school by sex, age, year of study, level of education and type of institution 113
5.6.2 Secondary children with special needs having a facilitator (shared or individual) following education in mainstream school by sex, age, year of study, level of education and type of institution
117
5.7 Number of disabilities in mainstream school by sex, type of facilitator assistance, type of disability, level of education and type of institution 121
CHAPTER 6 – GRADUATES 123
6.1 Graduates classified by level and type of education, institute/faculty and sex 125
6.2 Graduates at University of Malta classified by field of study, ISCED Level and sex 126
CHAPTER 7 – SUPPORT AND TEACHING STAFF IN MAINSTREAM EDUCATION 127
7.1 Teaching staff in pre-primary and secondary schools by level of education, economic sector, age group and sex 129
7.2 Support teaching staff by level of education, type of employment, economic sector and sex 132
7.3 Support teaching staff by level of education, grade, economic sector and sex 133

Page
CHAPTER 8 – STATE-RUNNING EVENING CLASSES 137
8.1 Students attending courses in government evening classes/centres classified by subject taken, duration of course, age and sex 139
8.2.1 Students attending the Drama Centre and School of Music in Malta classified by sex, age and subject taken 144
8.2.2 Students attending the Drama Centre and School of Music in Gozo classified by sex, age and subject taken 145
8.3 Adult education classified by locality of centre, sex, age group and subject taught 146
8.4 Teaching Staff at Malta School of Drama, Gozo School of Drama, Malta school of Music, Gozo School of Music and Adult Education Centres classified by subject taken and sex 148
CHAPTER 9 – UNIVERSITY OF THE THIRD AGE 149
9.1 Persons attending the University of the Third Age classified by locality of residence, previous occupational status and sex 151
9.2 Persons attending the University of the Third Age classified by previous occupational status and sex 153
CHAPTER 10 – SCHOOL ABSENCES 155
10.1 Absences in government primary schools (male pupils) classified by year of study 157
10.2 Absences in government primary schools (female pupils) classified by year of study 157
10.3 Total absences in government primary schools classified by year of study 157
10.4 Absences in government primary schools classified by locality of school 158
10.5 Absences in government-dependent private primary schools (male pupils) 160
10.6 Absences in government-dependent private primary schools (female pupils) 160
10.7 Total absences in government-dependent private primary schools 160
10.8 Absences in independent private primary schools (male pupils) classified by year of study 161
10.9 Absences in independent private primary schools (female pupils) classified by year of study 161
10.10 Total absences in independent private primary schools classified by year of study 161
10.11 Absences in government dependent and independent private primary schools classified by locality of school 162
10.12 Absences in government secondary schools (male pupils) classified by year of study 163
10.13 Absences in government secondary schools (female pupils) classified by year of study 163
10.14 Total absences in government secondary classified by year of study 163
10.15 Absences in government secondary and boys’/girls’ schools classified by locality of school 164
10.16 Absences in government-dependent private secondary schools (male pupils) 165
10.17 Absences in government-dependent private secondary schools (female pupils) 165
10.18 Total absences in government-dependent private secondary schools 165
10.19 Absences in independent private secondary schools (male pupils) 166
10.20 Absences in independent private secondary schools (female pupils) 166
10.21 Total absences in independent private secondary schools 166


EDUCATION STATISTICS 2005/2006 ‘Education Statistics 2005/2006’ is a revamped publication which provides an annual review of what characterised the educational scenario in the Maltese Islands during the academic year 2005/06. The choice of indicators in this edition relate to the data gathered by distinctive international statistical offices such as the United Nations Educational Scientific and Cultural Organisation (UNESCO), the Organisation for Economic Cooperation and Development (OECD) and Eurostat. In fact, all statistics being presented in this publication have been collected using harmonised methodologies as recommended by Eurostat, which ensure comparability among all EU Member States. To collect the necessary data, questionnaires were designed appropriately and distributed among all registered Educational Institutions. Incoming data were then vetted and processed into tabulations that have been included in this publication. This edition has 10 chapters and the data collected covers educational mainstream institutions, enrolments, entrants, foreign students, special education, graduates, teaching staff, state running evening classes, enrolments at the University of the Third Age and absences in mainstream education. Student population in formal education The total student population (full-time and part-time) in formal education decreased from 88,828 students in 2004/2005 to 85,864 students during the year under review. This decrease of 3.34 per cent or 2,964 students is due to population decline.
Chart 1. Total student population
0
10,000
20,000
30,000
40,000
50,000
60,000
70,000
199
7/19
98
199
8/19
99
199
9/20
00
200
0/20
01
200
1/20
02
200
2/20
03
200
3/20
04
200
4/20
05
200
5/20
06
Government
Private and Church
Adult / Evening Education The total number of students enrolled in adult education stood at 1,232, up by 29.7 per cent (282 students) when compared to the previous year. Government evening classes also recorded an increase in the number of participants of 10.9 per cent. The number of students attending either the School of Arts of Malta or the School of Arts of Gozo dropped by 17.2 per cent whereas enrolment at the Schools of Drama (Malta and Gozo) dropped by 4.3 per cent. By contrast, the number of students attending the School of Drama (Malta and Gozo) increased by 250 or 26.5 per cent during the academic year under review.
vii

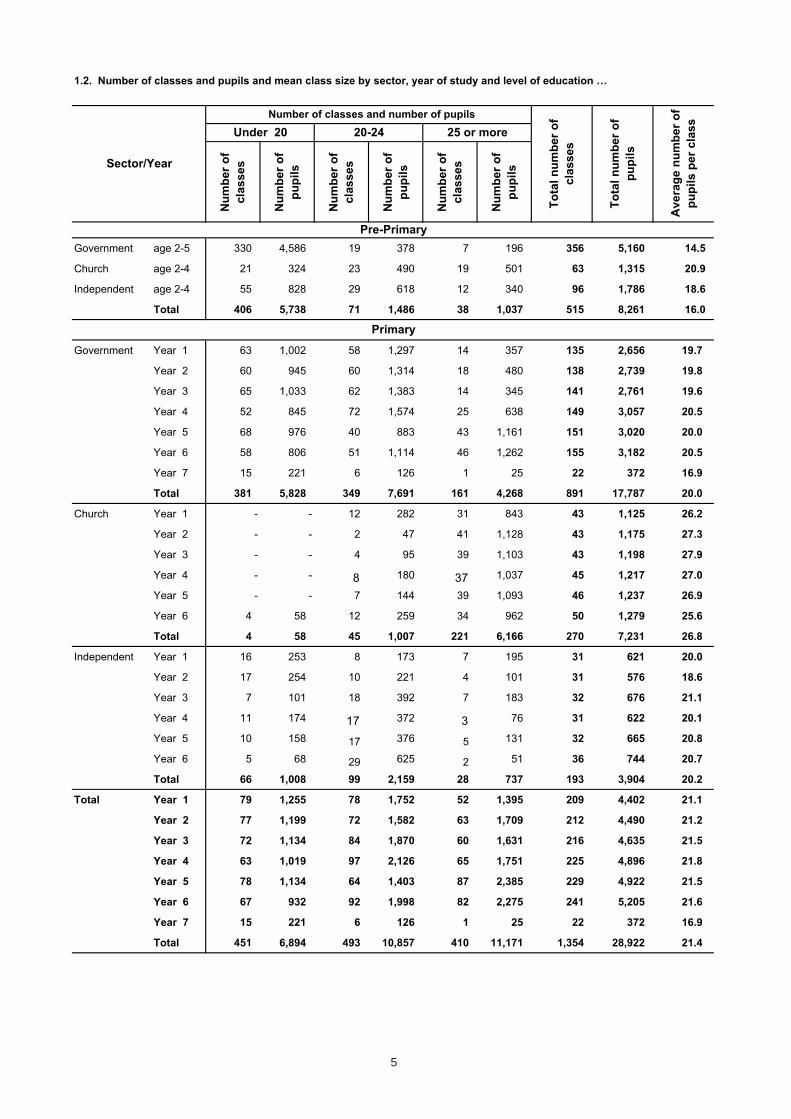
Pre-Primary The total number of children receiving pre-school instruction stood at 8,252 in 2005/2006, down by 299 students or 3.5 per cent over the previous year. This decline is attributable to the constant decrease in birth rates. Primary The downward trend in the total number of pupils at primary level experienced since 1996/1997 prevailed also during the scholastic year 2005/2006. The number of pupils in Government primary schools stood at 17,787 while the number of pupils in private primary schools was 11,135. Secondary The previous three years experienced a decrease in the number of persons enrolled at secondary level. Between 2004/2005 and 2005/2006 there was a decrease of 1.5 per cent or 416 pupils attending this level of education. The student population at secondary level dropped from 28,204 in 2004/2005 to 27,788 in 2005/2006. The Government sector recorded a decrease in enrolments of 2.95 per cent (539 pupils) while the private sector recorded a slight increase of 1.24 per cent (123 pupils).
Chart 2. Education at the pre-primary, primary and secondary levels
0
5,000
10,000
15,000
20,000
25,000
30,000
35,000
40,000
1996
/199
7
1997
/199
8
1998
/199
9
1999
/200
0
2000
/200
1
2001
/200
2
2002
/200
3
2003
/200
4
2004
/200
5
2005
/200
6Pre-Primary
Primary
Secondary
Post-Secondary The number of students at post-secondary (general) education in 2005/2006 decreased by 161 students over the previous year, reaching a total of 5,571 students. This figure comprises students attending the Junior College, government or private Higher Secondary and Sixth Forms. Full-time vocational education catered for 4,314 students during the scholastic year 2005/2006. This signified an increase of 172 students or 4.0 per cent over the previous year. Full-time courses at the Institute for Tourism Studies registered an increase of 51 full-time students - from 527 in 2004/2005 to 578 in 2005/2006. Moreover, MCAST also registered an increase of 121 full-time students, from 3,615 in 2004/2005 to 3,736 in the year under review.
viii

Part-time vocational education at post-secondary level, on the other hand, registered a decrease of 736 students or 26.1 per cent over the previous year. Both MCAST and ITS contributed towards this downward trend.
Chart 3. Education at post-secondary level - general and vocational
01,0002,0003,0004,0005,0006,0007,0008,000
1996
/19
97
1997
/19
98
1998
/19
99
1999
/20
00
2000
/20
01
2001
/20
02
2002
/20
03
2003
/20
04
2004
/20
05
2005
/20
06
Post-Secondary General Post-Secondary Vocational
The University of Malta There was a decrease in student population at the University by 608 students or 6.4 per cent, from 9,530 students to 8,922. Full-time students were down by 736 or 10.1 per cent and part-time students up by 128 or 5.8 per cent. The overall female student component stood at 5,089, signifying a drop of 5.0 per cent or 268 students over the previous year's total female population, and accounting for 57.0 per cent of the total number of university students. Female participation in full-time courses was the highest within the Faculty of Economics, Management and Accountancy with 892 females, followed by 736 female students at the Faculty of Education and 464 female students at the Institute of Health Care. The most popular among males were the Faculty of Economics, Management and Accountancy with 630 males, followed by the Faculty of Engineering (299 males students) and the Faculty of Law (285 male students).
Chart 4. Participation rate in tertiary education 2005/2006
0
200
400
600
800
1,000
1,200
1,400
1,600
1,800
2,000
18 19 20 21 22 23 24 25 26 27 28 29 30+
Age
Num
ber
of s
tude
nts
Males
Females
ix

The number of graduates in 2005 decreased by 65 or 2.4 per cent over the previous year to reach 2,676; 58.0 per cent of the total were females. The field of study which accounted for most of the graduates was that of business and administration, with 534 students. The second field of study that saw a majority of graduates was that related to law, with 480 graduates, of which 66 per cent where females. Males comprised 80.7 per cent and 80.6 per cent of the graduates in the engineering and architecture fields respectively. First degree students amounted to 1,984 or 74.1 per cent of all graduates. Dropouts from the University of Malta numbered 514 during 2005/2006, 121 students more than last year’s total dropouts. Male dropouts accounted for 42.8 per cent of the total dropouts. The Faculty of Economics, Management and Accountancy sustained the highest number of dropouts - 148 students, the next highest dropout was sustained by the Faculty of Arts with 60 dropouts and was followed by the Faculty of Education with 50 dropouts.
Chart 5. Number of Students, Graduates and Dropouts 2000-2005
7493
7332
7955
9530
8,922
2003
1868
2145
2741
2,676
702
472
998
393
514
0 2,000 4,000 6,000 8,000 10,000 12,000
2000/2001
2001/2002
2003/2004
2004/2005
2005/2006
Number of students
Dropouts
Graduates
Students
Chart 6. Trends in the number of women per 100 men in Tertiary education 1998/1999-2005/2006
0
1,000
2,000
3,000
4,000
5,000
6,000
1998/1999 1999/2000 2001/2002 2002/2003 2003/2004 2004/2005 2005/2006
Males Females
x
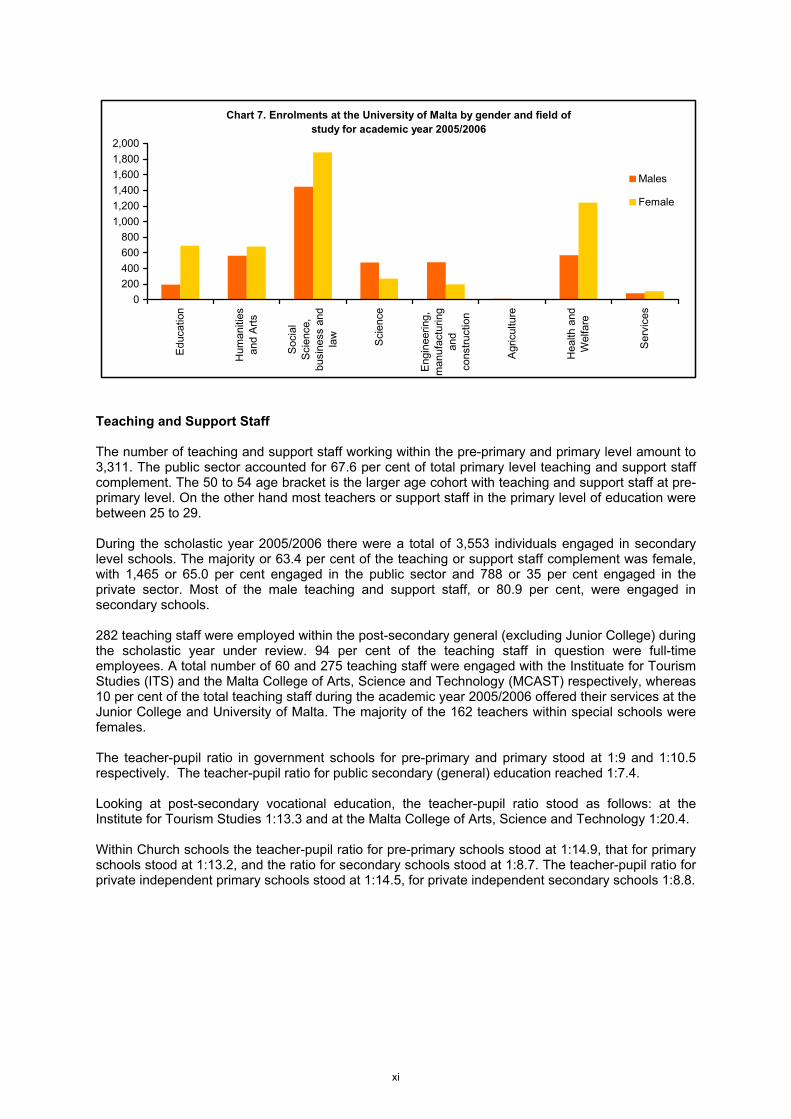
Chart 7. Enrolments at the University of Malta by gender and field of study for academic year 2005/2006
0
200
400
600
800
1,000
1,200
1,400
1,600
1,800
2,000
Edu
catio
n
Hum
aniti
esa
nd A
rts
Soc
ial
Sci
ence
,bu
sine
ss a
ndla
w
Sci
ence
Eng
inee
ring,
man
ufa
ctur
ing
and
con
stru
ctio
n
Agr
icul
ture
Hea
lth a
ndW
elfa
re
Ser
vice
s
Males
Female
Teaching and Support Staff The number of teaching and support staff working within the pre-primary and primary level amount to 3,311. The public sector accounted for 67.6 per cent of total primary level teaching and support staff complement. The 50 to 54 age bracket is the larger age cohort with teaching and support staff at pre-primary level. On the other hand most teachers or support staff in the primary level of education were between 25 to 29. During the scholastic year 2005/2006 there were a total of 3,553 individuals engaged in secondary level schools. The majority or 63.4 per cent of the teaching or support staff complement was female, with 1,465 or 65.0 per cent engaged in the public sector and 788 or 35 per cent engaged in the private sector. Most of the male teaching and support staff, or 80.9 per cent, were engaged in secondary schools. 282 teaching staff were employed within the post-secondary general (excluding Junior College) during the scholastic year under review. 94 per cent of the teaching staff in question were full-time employees. A total number of 60 and 275 teaching staff were engaged with the Instituate for Tourism Studies (ITS) and the Malta College of Arts, Science and Technology (MCAST) respectively, whereas 10 per cent of the total teaching staff during the academic year 2005/2006 offered their services at the Junior College and University of Malta. The majority of the 162 teachers within special schools were females. The teacher-pupil ratio in government schools for pre-primary and primary stood at 1:9 and 1:10.5 respectively. The teacher-pupil ratio for public secondary (general) education reached 1:7.4. Looking at post-secondary vocational education, the teacher-pupil ratio stood as follows: at the Institute for Tourism Studies 1:13.3 and at the Malta College of Arts, Science and Technology 1:20.4. Within Church schools the teacher-pupil ratio for pre-primary schools stood at 1:14.9, that for primary schools stood at 1:13.2, and the ratio for secondary schools stood at 1:8.7. The teacher-pupil ratio for private independent primary schools stood at 1:14.5, for private independent secondary schools 1:8.8.
xi

Chart 8. Teaching staff by level of education and gender
0 500 1000 1500 2000 2500
Pre-Primary
Primary
Secondary
Post-Secondary General
ITS
Junior College and University
Special Schools
Female
Male
Chart 9. Teaching staff by economic sector and level of education
0 500 1,000 1,500 2,000 2,500
Full-Time
Part-Time
Full-Time
Part-Time
Full-Time
Part-Time
Pu
blic
Chu
rch
Priv
ate
Secondary
Primary
Pre-Primary
The University of the Third Age After the downward trend in participation, the University of the Third Age registered an upward shift in 2005/2006. The total number of participants stood at 709, signifying an increase of 22 persons over the previous year. Female participation increased by 4.9 per cent to 532, while male participation decreased by 1.6 per cent to 177. The ratio of males to females stood at 1:3. The Gozo branch of the University of the Third Age did not see any change in the attendance from 2004/2005. An increase occurred among females, up by 2 members to reach 34 female participants while participation for males decreased by 2 to 6 members. The age groups with most participants were the 70-74 and 75-79 age brackets. The number in the first age group stood at 165, while the number in the second age group stood at 157. The number of participants in both age-groups experienced an increase in membership by 1.9 per cent and 9.0 per cent respectively over the previous year. The 60-64 age group registered an increase of 0.9 per cent
xii

in membership to 112, while the membership in the 65-69 age group decreased by 21 members to 14 between 2004 and 2005. At the extreme end of the scale, the 80+ age cohort increased by 22 per cent over last year’s membership and stood at 127 members.
Chart 10. Distribution of participants by age group: 2005/2006
0
20
40
60
80
100
120
140
160
60-64 65-69 70-74 75-79 80+
Age group
Num
ber
of p
artic
ipan
ts
Female
Male
The distribution of participants by district maintained the same pattern as in previous years - the Northern Harbour district with a total of 387 participants, or 54.6 per cent, represented the highest participation throughout the Maltese Islands, followed by the South Harbour district, with a total of 131 participants. The South Eastern district, with 22 participants, was the least represented. Sliema remained the leading locality within the districts, having the highest number of participants. Indeed participation from this locality accounted for 45.0 per cent of the total participants within the district and 24.5 per cent of the whole of Malta and Gozo. St Julians was the second leading locality, accounting for 10 per cent of the total within the district and 5.5 per cent of the total for Malta and Gozo. The largest proportion (42.5 per cent) of participants attending the University of the Third Age held a professional career prior to retirement. These accounted for 81.7 per cent of the professionals and 34.7 per cent of the total participation. Those not gainfully occupied, which included housewives and pensioners, accounted for 25.7 per cent of the participation. Some 10.6 per cent of the participants had previous occupations which fell within the clerical group, while 4.9 per cent were technicians and associate professionals. Only 1.7 per cent were previously occupied either in the Armed Forces or in elementary occupations. School Absences During the first 120 school days (between September 2005 and March 2006), a total of 572,891 school days were lost to absenteeism. This figure accounted for 8.4 per cent of the total number of school days in the reference period, or an overall absence rate of 10.1 absent days per pupil - that for boys being 10.9 days per pupil (0.9 more than the previous year), and for girls 9.3 days per pupil (0.9 more than the previous year). Between 2004/2005 and 2005/2006 there was an overall increase of 0.9 per cent in school absences for students attending primary and secondary level. In fact during 2004/2005 a total of 534,292 absent days for a pupil population of 57,800 was registered, as against 572,891 absent days for a pupil population of 56,719 in 2005/06. This increase was the result of a slight rise in the number of absences at the primary and secondary level both within public and private schools.
xiii

The overall unauthorised absence rate for boys in all primary and secondary schools was 5.0 days per pupil (an increase of 0.3 over 2004/05) while the authorised absence rate stood at 5.9 (an increase of 0.5 over 2004/05). The overall absence rates for girls stood as follows: 4.0 days per pupil for unauthorised absences (0.3 more than 2004/05) and 5.3 days per pupil for authorised absences (0.6 more than 2004/05). Public primary schools registered an increase of 0.7 absent days per pupil over the previous year, to 8.7 days per pupil during 2005/06 - 8.9 days per pupil for boys and 8.4 days per pupil for girls. The unauthorised absence rate for boys at public primary level stood at 3.6 days per pupil, whilst the authorised rate stood at 5.3 days per pupil. The unauthorised rate for girls stood at 3.3 days and the authorised at 5.1 days per pupil. Similarly, private and Church primary schools also registered an increase of 0.1 absent days per pupil, over 2004/05. The overall absence rate for these schools stood at 5.2 absent days per pupil - 4.9 for boys and 5.5 for girls. The unauthorised absence rate for boys at private primary level stood at 0.6 days per pupil, whilst the authorised rate stood at 4.3 days per pupil. The unauthorised and authorised rates for girls stood at 0.7 and 4.8 respectively. The registered increase in the overall number of absent days per pupil prevailed in the secondary level too. Government secondary schools registered an increase in the number of absences per head, up by 1.7 absent days per pupil (from 15.8 in 2004/05 to 17.5 in 2005/06). The average unauthorised absence rate for boys was 12.2 days per pupil and 8.7 days per pupil for authorised absences. The unauthorised absence rate for girls amounted to 8.3 days per pupil, whilst the authorised absence rate was 6.1 days per pupil.
Chart 11. Distribution of absences by level and sector
0
50,000
100,000
150,000
200,000
250,000
300,000
350,000
Public Private Public Private
Primary Secondary
Abs
ent
scho
ol d
ays
2004/2005
2005/2006
Similar to the public secondary schools, private secondary schools registered an increase of 0.6 absent days per pupil over the previous year (from 4.5 to 5.1 absent days per pupil). The unauthorised rate for boys at private secondary level stood at 0.7 days per pupil while the authorised rate stood at 4.1 days per pupil. The unauthorised and authorised rates for girls stood at 0.9 and 4.5 days per pupil respectively. The incidence of absenteeism within private schools both at primary and secondary level was much lower than in government schools. In fact, in 2005/06 the total overall absence rate stood at 5.2 days per pupil in private schools and 13.1 days per pupil within public schools. Particularly, unauthorised
xiv
absence rates were reported to be higher in public schools with 6.8 absent days per pupil as compared to the 0.6 absent days per pupil in private schools. Authorised absence rates were also reported to be higher in the public sector with 6.3 absent days per pupil, against the 4.5 absent days per pupil in private schools. Absence rates in schools varied across the Maltese districts but followed a similar pattern along the three educational sectors - public, Church and private. Out of all the public primary schools, the Northern Harbour district registered the highest average number of absent days per pupil (10.7 days) while Gozo and Comino registered the lowest number of absent days with 6.2 absent days per pupil. The South Eastern district registered the highest number of absent days per pupil in private and Church primary schools with 6.3 absent days per pupil, while the Western district registered the lowest number, with 4.3 absent days per pupil. Secondary schools followed a different pattern from primary across all three sectors. The highest average number of absent days in public secondary schools was registered in the Western district with 24.7 absent days per pupils; but in private/Church secondary schools the highest average number of absent days was registered in the Southern Harbour district with 6.4 absent days per pupil. The lowest number of absent days per pupil in the public secondary schools was registered in the South Eastern district - with 8.6 absent days per pupils. The lowest average number of absent days in the private and Church secondary schools was registered in the Western district with 4.2 absent days per pupil.
xv


CHAPTER 1
Mainstream Schools and Classes


3
Go
vern
men
t
Ch
urc
h
Ind
epen
den
t
Go
vern
men
t
Ch
urc
h
Ind
epen
den
t
Go
vern
men
t
Ch
urc
h
Ind
epen
den
t
Go
vern
men
t
Ch
urc
h
Ind
epen
den
t
Go
vern
men
t
Ch
urc
h
Ind
epen
den
t
Go
vern
men
t
Ch
urc
h
Ind
epen
den
t
MALTA 64 32 25 75 25 16 35 23 9 5 2 2 11 - - 190 82 52
Malta 53 25 25 64 21 16 31 21 9 3 2 2 10 - - 161 69 52
Gozo 11 7 - 11 4 - 4 2 - 2 - - 1 - - 29 13 -
Southern Harbour 15 6 2 16 5 2 10 4 1 1 1 - 7 - - 49 16 5
Valletta 1 1 - 1 1 - - 1 - - - - - - - 2 3 -
Birgu 1 - - 1 - 1 - - 1 - - - - - - 2 - 2
Isla 1 - - 1 - - - - - - - - - - - 2 - -
Bormla 1 1 - 1 2 - 3 1 - - 1 - - - - 5 5 -
abbar 1 1 - 2 - - - - - - - - - - - 3 1 -
Fgura 1 - - 2 - - - - - - - - - - - 3 - -
Floriana 1 - - 1 - - 1 - - - - - - - - 3 - -
Kalkara 1 - - 1 - - - - - - - - 1 - - 3 - -
Luqa 1 1 - 1 - - - - - - - - - - - 2 1 -
Marsa 1 - - 1 1 - 2 - - - - - - - - 4 1 -
Paola 2 1 1 2 1 1 2 1 - 1 - - 6 - - 13 3 2
Santa Lu ija 1 1 - - - - 1 - - - - - - - - 2 1 -
Tarxien 1 - 1 1 - - 1 1 - - - - - - - 3 1 1
Xg ajra 1 - - 1 - - - - - - - - - - - 2 - -
South Eastern 11 2 1 14 1 - 2 - - - - - - - - 27 3 1
ejtun 1 1 - 2 - - 1 - - - - - - - - 4 1 -
Bir ebbu ia 1 1 1 2 - - - - - - - - - - - 3 1 1
Gudja 1 - - 1 1 - - - - - - - - - - 2 1 -
G axaq 1 - - 1 - - - - - - - - - - - 2 - -
Kirkop 1 - - 1 - - - - - - - - - - - 2 - -
Marsaskala 1 - - 1 - - - - - - - - - - - 2 - -
Marsaxlokk 1 - - 1 - - - - - - - - - - - 2 - -
Mqabba 1 - - 1 - - - - - - - - - - - 2 - -
Qrendi 1 - - 1 - - - - - - - - - - - 2 - -
Safi 1 - - 1 - - - - - - - - - - - 2 - -
urrieq 1 - - 2 - - 1 - - - - - - - - 4 - -
Northern Harbour 13 8 13 17 12 10 13 13 6 1 1 2 1 - - 45 34 31
Qormi 2 1 1 3 1 1 3 1 - 8 3 2
Birkirkara 1 - 2 2 2 2 2 2 1 - 1 - - - - 5 5 5
G ira 1 - 1 1 2 1 1 2 1 - - 1 - - - 3 4 4
amrun 2 2 - 2 2 - 4 2 - - - - - - - 8 6 -
Msida 1 - 1 1 1 - - - - 1 - - - - - 3 1 1
Pembroke 1 - 2 1 - 2 2 - 3 - - 1 1 - - 5 - 8
Pieta 1 1 - 1 - - - 1 - - - - - - - 2 2 -
St Julians 1 1 1 1 1 1 - 1 - - - - - - - 2 3 2
Swieqi - - - - - 1 - - 1 - - - - - - - - 2
San wann 1 1 3 2 - 2 - - - - - - - - - 3 1 5
Santa Venera 1 - - 1 - - 1 1 - - - - - - - 3 1 -
Sliema 1 2 2 1 4 - - 3 - - - - - - - 2 9 2
1.1. Number of schools/institutions by level of education, sector and locality/district…
Primary SecondaryPost-Secondary
GeneralTotalPre-Primary
Locality
Post-Secondary Vocational

4
Go
vern
men
t
Ch
urc
h
Ind
epen
den
t
Go
vern
men
t
Ch
urc
h
Ind
epen
den
t
Go
vern
men
t
Ch
urc
h
Ind
epen
den
t
Go
vern
men
t
Ch
urc
h
Ind
epen
den
t
Go
vern
men
t
Ch
urc
h
Ind
epen
den
t
Go
vern
men
t
Ch
urc
h
Ind
epen
den
t
Western 8 6 6 10 2 2 3 4 - - - - - - - 21 12 8
Mdina - - 1 - - - - - - - - - - - - - - 1
ebbu (Malta) 1 2 1 2 1 1 1 1 - - - - - - - 4 4 2
Si iewi 1 1 - 1 - - - - - - - - - - - 2 1 -
Attard 1 - 2 1 - 1 - - - - - - - - - 2 - 3
Balzan - 1 1 - 1 - - - - - - - - - - - 2 1
Dingli 1 - - 1 - - - 1 - - - - - - - 2 1 -
Lija 1 1 - 1 - - - - - - - - - - - 2 1 -
Rabat (Malta) 2 1 1 3 - - 1 2 - - - - - - - 6 3 1
Mtarfa 1 - - 1 - - 1 - - - - - - - - 3 - -
Northern 6 3 3 7 1 2 3 - 2 1 - - 2 - - 19 4 7
G arg ur 1 1 - 1 - - - - - - - - - - - 2 1 -
Mellie a 1 - - 1 - - - - - - - - - - - 2 - -
Mosta 1 1 - 2 1 - 1 - - - - - 1 - - 5 2 -
M arr 1 - 2 1 - 2 - - 2 - - - - - - 2 - 6
Naxxar 1 - 1 1 - - 2 - - 1 - - 1 - - 6 - 1
St Paul's Bay 1 1 - 1 - - - - - - - - - - - 2 1 -
- - -
Gozo and Comino 11 7 - 11 4 - 4 2 - 2 - - 1 - - 29 13 -
Rabat 1 2 - 1 2 - 4 2 - 2 - - - - - 8 6 - G ajnsielem and Comino 1 - - 1 - - - - - - - - - - - 2 - - G asri - 1 - - 1 - - - - - - - - - - - 2 -
G arb 1 - - 1 - - - - - - - - - - - 2 - -
Ker em 1 1 - 1 1 - - - - - - - - - - 2 2 -
Nadur 1 1 - 1 - - - - - - - - - - - 2 1 -
Qala 1 1 - 1 - - - - - - - - - - - 2 1 -
San Lawrenz 1 - - 1 - - - - - - - - - - - 2 - -
Sannat 1 - - 1 - - - - - - - - - - - 2 - -
Xag ra 1 1 - 1 - - - - - - - - 1 - - 3 1 -
Xewkija 1 - - 1 - - - - - - - - - - - 2 - -
ebbu 1 - - 1 - - - - - - - - - - - 2 - -
Schools catering for more then one level have counted more hence once according to the number of levels thought.
i.e. if for example a school caters for both primary and pre-primary it is counted twice in this table, under the appropriate columns
Moreover, Government Primary schools that are divided into school 'A' and school 'B' are counted as two separate entities in this table.
… 1.1. Number of schools/institutions by level of education, sector and locality/district
Locality
Pre-Primary Primary SecondaryPost-Secondary
GeneralPost-Secondary
VocationalTotal
5
Nu
mb
er
of
cla
sses
Nu
mb
er
of
pu
pil
s
Nu
mb
er
of
cla
sses
Nu
mb
er
of
pu
pil
s
Nu
mb
er
of
cla
sses
Nu
mb
er
of
pu
pil
s
Government age 2-5 330 4,586 19 378 7 196 356 5,160 14.5
Church age 2-4 21 324 23 490 19 501 63 1,315 20.9
Independent age 2-4 55 828 29 618 12 340 96 1,786 18.6
Total 406 5,738 71 1,486 38 1,037 515 8,261 16.0
Government Year 1 63 1,002 58 1,297 14 357 135 2,656 19.7
Year 2 60 945 60 1,314 18 480 138 2,739 19.8
Year 3 65 1,033 62 1,383 14 345 141 2,761 19.6
Year 4 52 845 72 1,574 25 638 149 3,057 20.5
Year 5 68 976 40 883 43 1,161 151 3,020 20.0
Year 6 58 806 51 1,114 46 1,262 155 3,182 20.5
Year 7 15 221 6 126 1 25 22 372 16.9
Total 381 5,828 349 7,691 161 4,268 891 17,787 20.0
Church Year 1 - - 12 282 31 843 43 1,125 26.2
Year 2 - - 2 47 41 1,128 43 1,175 27.3
Year 3 - - 4 95 39 1,103 43 1,198 27.9
Year 4 - - 8 180 37 1,037 45 1,217 27.0
Year 5 - - 7 144 39 1,093 46 1,237 26.9
Year 6 4 58 12 259 34 962 50 1,279 25.6
Total 4 58 45 1,007 221 6,166 270 7,231 26.8
Independent Year 1 16 253 8 173 7 195 31 621 20.0
Year 2 17 254 10 221 4 101 31 576 18.6
Year 3 7 101 18 392 7 183 32 676 21.1
Year 4 11 174 17 372 3 76 31 622 20.1
Year 5 10 158 17 376 5 131 32 665 20.8
Year 6 5 68 29 625 2 51 36 744 20.7
Total 66 1,008 99 2,159 28 737 193 3,904 20.2
Total Year 1 79 1,255 78 1,752 52 1,395 209 4,402 21.1
Year 2 77 1,199 72 1,582 63 1,709 212 4,490 21.2
Year 3 72 1,134 84 1,870 60 1,631 216 4,635 21.5
Year 4 63 1,019 97 2,126 65 1,751 225 4,896 21.8
Year 5 78 1,134 64 1,403 87 2,385 229 4,922 21.5
Year 6 67 932 92 1,998 82 2,275 241 5,205 21.6
Year 7 15 221 6 126 1 25 22 372 16.9
Total 451 6,894 493 10,857 410 11,171 1,354 28,922 21.4
Primary
Sector/Year
1.2. Number of classes and pupils and mean class size by sector, year of study and level of education …
Pre-Primary
Number of classes and number of pupils
To
tal
nu
mb
er
of
cla
sses
To
tal
nu
mb
er
of
pu
pil
s
Avera
ge n
um
ber
of
pu
pil
s p
er
cla
ss
Under 20 20-24 25 or more

6
Nu
mb
er
of
cla
sses
Nu
mb
er
of
pu
pil
s
Nu
mb
er
of
cla
sses
Nu
mb
er
of
pu
pil
s
Nu
mb
er
of
cla
sses
Nu
mb
er
of
pu
pil
s
Government Form 1 39 607 50 1,125 57 1,549 146 3,281 22.5
Form 2 27 396 46 1,032 73 1,957 146 3,385 23.2
Form 3 45 695 75 1,693 48 1,214 168 3,602 21.4
Form 4 43 695 77 1,716 51 1,292 171 3,703 21.7
Form 5 42 696 87 1,951 43 1,094 172 3,741 21.8
Total 196 3,089 335 7,517 272 7,106 803 17,712 22.1
Church Form 1 3 50 7 163 47 1,304 57 1,517 26.6
Form 2 1 15 9 210 46 1,286 56 1,511 27.0
Form 3 7 103 28 633 31 811 66 1,547 23.4
Form 4 7 101 24 548 37 961 68 1,610 23.7
Form 5 8 128 24 533 32 837 64 1,498 23.4
Total 26 397 92 2,087 193 5,199 311 7,683 24.7
Independent Form 1 10 167 9 197 4 108 23 472 20.5
Form 2 6 84 10 219 7 180 23 483 21.0
Form 3 7 106 15 329 2 53 24 488 20.3
Form 4 3 48 16 354 4 102 23 504 21.9
Form 5 6 93 14 297 2 56 22 446 20.3
Total 32 498 64 1,396 19 499 115 2,393 20.8
Total Form 1 52 824 66 1,485 108 2,961 226 5,270 23.3
Form 2 34 495 65 1,461 126 3,423 225 5,379 23.9
Form 3 59 904 118 2,655 81 2,078 258 5,637 21.8
Form 4 53 844 117 2,618 92 2,355 262 5,817 22.2
Form 5 56 917 125 2,781 77 1,987 258 5,685 22.0
Total 254 3,984 491 11,000 484 12,804 1,229 27,788 22.6
25 or more
Secondary
… 1.2. Number of classes and pupils and mean class size by sector, year of study and level of education
Sector/Year
Number of classes and number of pupils
To
tal
nu
mb
er
of
cla
sses
To
tal
nu
mb
er
of
pu
pil
s
Avera
ge n
um
ber
of
pu
pil
s p
er
cla
ss
Under 20 20-24

CHAPTER 2
Enrolments in Mainstream Education


9
Boys Girls Boys Girls Boys Girls Boys Girls Total
Total 2,737 2,423 605 710 957 829 4,299 3,962 8,261
under 4 1,057 940 213 187 475 425 1,745 1,552 3,297
4 1,284 1,165 312 388 394 332 1,990 1,885 3,875
5 and over 396 318 80 135 88 72 564 525 1,089
Year 1 1,375 1,281 440 685 342 279 2,157 2,245 4,402
5 965 932 320 477 235 204 1,520 1,613 3,133
6 408 347 119 207 103 67 630 621 1,251
7 2 2 1 1 4 8 7 11 18
Year 2 1,460 1,279 462 713 364 212 2,286 2,204 4,490
6 1,069 913 328 501 255 154 1,652 1,568 3,220
7 381 362 133 211 104 54 618 627 1,245
8 10 4 1 1 5 4 16 9 25
Year 3 1,472 1,289 485 713 415 261 2,372 2,263 4,635
6 - - - - - 2 - 2 2
7 1,027 881 334 485 296 185 1,657 1,551 3,208
8 432 396 145 225 114 70 691 691 1,382
9 13 12 6 3 5 4 24 19 43
10 - - - - - - - - -
Year 4 1,669 1,388 509 708 399 223 2,577 2,319 4,896
7 18 20 - - - - 18 20 38
8 1,130 977 335 471 284 157 1,749 1,605 3,354
9 499 370 167 233 103 62 769 665 1,434
10 22 21 7 4 12 4 41 29 70
Year 5 1,639 1,381 525 712 405 260 2,569 2,353 4,922
9 1,074 957 361 466 269 172 1,704 1,595 3,299
10 546 418 156 235 127 79 829 732 1,561
11 19 6 8 11 9 9 36 26 62
Year 6 1,728 1,454 539 740 431 313 2,698 2,507 5,205
9 15 7 2 - 1 - 18 7 25
10 1,171 998 350 483 303 232 1,824 1,713 3,537
11 530 436 179 245 122 78 831 759 1,590
12 12 13 8 12 5 3 25 28 53
Year 7 210 162 - - - - 210 162 372
10 3 3 - - - - 3 3 6
11 143 118 - - - - 143 118 261
12 64 41 - - - - 64 41 105
Total 9,553 8,234 2,960 4,271 2,356 1,548 14,869 14,053 28,922
2.1. Enrolments by sex, age, sector, year of study and level of education in compulsory schooling …
Pre-Primary
Government Church Independent TotalAge
Primary

10
Boys Girls Boys Girls Boys Girls Boys Girls Total
Form 1 1,568 1,713 816 701 279 193 2,663 2,607 5,270
10 - 8 2 - - - 2 8 10
11 812 1,001 530 399 170 132 1,512 1,532 3,044
12 650 649 270 286 99 56 1,019 991 2,010
13 106 55 14 16 10 5 130 76 206
Form 2 1,637 1,748 815 696 287 196 2,739 2,640 5,379
11 7 - - - 7 6 14 6 20
12 846 1,047 556 413 194 127 1,596 1,587 3,183
13 655 632 238 268 82 61 975 961 1,936
14 127 68 20 15 4 2 151 85 236
15 2 1 1 - - - 3 1 4
Form 3 1,766 1,836 846 701 277 211 2,889 2,748 5,637
12 3 1 - 1 1 - 4 2 6
13 944 1,069 516 443 179 129 1,639 1,641 3,280
14 718 686 299 240 88 80 1,105 1,006 2,111
15 101 80 31 17 9 2 141 99 240
Form 4 1,853 1,850 889 721 261 243 3,003 2,814 5,817
13 1 - 11 1 - 1 12 2 14
14 900 1,099 581 397 132 175 1,613 1,671 3,284
15 799 676 272 295 125 65 1,196 1,036 2,232
16 150 70 24 26 4 2 178 98 276
17 3 5 1 2 - - 4 7 11
Form 5 1,797 1,944 841 657 244 202 2,882 2,803 5,685
14 - - 17 - 1 - 18 0 18
15 966 1,142 527 428 145 134 1,638 1,704 3,342
16 723 732 281 211 94 63 1,098 1,006 2,104
17 108 70 16 18 4 5 128 93 221
Total 8,621 9,091 4,207 3,476 1,348 1,045 14,176 13,612 27,788
TotalAge
Government Church Independent
… 2.1. Enrolments by sex, age, sector, year of study and level of education in compulsory schooling

11
Males Females Males Females Males Females Males Females Total
1,161 1,518 170 151 13 11 1,344 1,680 3,024
Age: 16 544 712 116 98 4 2 664 812 1,476
17 510 708 54 52 8 9 572 769 1,341
18 76 76 1 1 77 77 154
19 17 12 - - - - 17 12 29
20 9 7 - - - - 9 7 16
21 5 - - - - 5 - 5
22 - - - - - - - - -
23 - 1 - - - - - 1 1
24 - - - - - - - - -
25 and over - 2 - - - - - 2 2
936 1,265 161 164 13 8 1,110 1,437 2,547
Age: 16 1 1 1 2 1 3
17 326 503 103 105 5 2 434 610 1,044
18 441 612 56 57 5 5 502 674 1,176
19 117 122 1 3 1 121 123 244
20 29 11 1 - - 29 12 41
21 9 8 - - - - 9 8 17
22 6 1 - - - - 6 1 7
23 4 4 - - - - 4 4 8
24 2 - - - - 2 - 2
25 and over 1 3 - 1 - - 1 4 5
2,097 2,783 331 315 26 19 2,454 3,117 5,571
Total
2.2. Enrolments by sex, age, sector and year of study in Post-Secondary General
Total
1st year
2nd year
Government Independent ChurchPost-Secondary
General

12
15 16 17 18 19 20 21 22 23 24 25 26 27 28 29 30+
m - 19 71 57 61 41 24 22 10 3 4 3 - 3 1 3 322
f - 21 20 54 49 48 32 11 3 4 3 - - 2 1 8 256
t - 40 91 111 110 89 56 33 13 7 7 3 - 5 2 11 578
m - 4 5 12 16 6 3 5 5 8 5 1 5 11 4 63 153
f - 2 3 2 5 2 4 3 2 2 2 3 2 4 3 25 64
t - 6 8 14 21 8 7 8 7 10 7 4 7 15 7 88 217
m - 68 93 84 96 47 11 6 2 1 2 - - - - - 410
f - 2 3 3 3 3 - - - - - - - - - - 14
t - 70 96 87 99 50 11 6 2 1 2 - - - - - 424
m - 73 89 108 105 57 25 9 5 1 - - - 1 1 - 474
f - 5 3 2 5 2 2 1 - - - - - - - - 20
t - 78 92 110 110 59 27 10 5 1 - - - 1 1 - 494
m - 138 112 69 68 31 12 3 3 3 4 - - - - 10 453
f - 7 4 4 7 5 5 4 1 - - - - - - - 37
t - 145 116 73 75 36 17 7 4 3 4 - - - - 10 490
m - 57 104 109 85 37 26 12 2 - 1 - - - - - 433
f - 20 33 15 17 7 6 2 - 1 - 1 - - - - 102
t - 77 137 124 102 44 32 14 2 1 1 1 - - - - 535
m - 42 80 58 55 29 14 5 - 2 - 1 - - - 2 288
f - 100 148 127 86 39 12 5 2 - - 1 - - - 1 521
t - 142 228 185 141 68 26 10 2 2 - 2 - - - 3 809
m - 31 22 28 21 15 12 2 3 - - - - - - - 134
f - 39 40 26 27 15 4 2 1 - - 1 - - - 2 157
t - 70 62 54 48 30 16 4 4 - - 1 - - - 2 291
* The total for the Institute of Business and Commerce also includes students enrolled in MCAST Matriculation Certificate Course. These students are also included in post-secondary general in Table 2.4.
Total
Institute of Business and Commerce*
Institute of Art and Design
Institute of Tourism Studies (ITS) full-time courses
2.3. Enrolments by sex, age, type of education and Institute in Post-Secondary Vocational…
Institute of Tourism Studies (ITS) Full-Time
Malta College of Arts, Science and Technology (MCAST) full-time
Institute of Tourism Studies (ITS) Part-Time
SexInstitute/Course
Institute of Tourism Studies (ITS) part-time courses
Age
Institute of Mechanical Engineering
Institute of Electronics Engineering
Institute of Building and Construction Engineering
Institute of Information and Communication Technology

13
15 16 17 18 19 20 21 22 23 24 25 26 27 28 29 30+
m - 7 6 6 2 3 1 - - - - - - - - - 25
f - 2 2 - - - - - - 1 - - - - - - 5
t - 9 8 6 2 3 1 - - 1 - - - - - - 30
m - 9 15 13 13 6 3 - 1 2 - - - 1 - - 63
f - 57 99 86 55 23 13 4 2 - 1 1 - - - 4 345
t - 66 114 99 68 29 16 4 3 2 1 1 - 1 - 4 408
m - 8 15 14 3 4 2 1 - - - - - - - - 47
f - 6 5 3 1 1 1 - - - - - - - - - 17
t - 14 20 17 4 5 3 1 - - - - - - - - 64
m - 38 22 26 10 4 - - - - - - - - - - 100
f - 30 24 20 13 1 - 2 - 1 - - - - - - 91
t - 68 46 46 23 5 - 2 - 1 - - - - - - 191
m - 471 558 515 458 233 106 38 16 9 7 1 - 2 1 12 2,427
f - 268 361 286 214 96 43 20 6 3 1 4 - - - 7 1,309
t - 739 919 801 672 329 149 58 22 12 8 5 - 2 1 19 3,736
m 1 - - - - - - 1 - - 2 - - 4 1 46
f - - - - - - - - - 1 - - 1 - - 1
t 1 - - - - - - 1 - 1 2 - 1 4 1 47
m 1 3 4 - 1 2 5 5 3 7 9 2 8 3 5 77
f - 13 5 12 9 11 12 24 17 11 12 10 15 8 21 96
t 1 16 9 12 10 13 17 29 20 18 21 12 23 11 26 173
m 2 6 9 5 7 7 8 14 8 5 14 11 10 8 9 84
f - 1 - 1 - 1 2 3 2 1 2 2 1 2 6 10
t 2 7 9 6 7 8 10 17 10 6 16 13 11 10 15 94
m - 4 16 9 7 10 9 4 1 7 3 2 - 2 2 28
f - 5 5 7 14 3 5 3 15 - 2 3 - 3 - 16
t - 9 21 16 21 13 14 7 16 7 5 5 - 5 2 44
Malta College of Arts, Science and Technology (MCAST) part-time
Institute of Business and Commerce
Gozo Centre
MCAST total full-time
Institute of Building and Construction Engineering
Maritime Institute
… 2.3. Enrolments by sex, age, type of education and Institute in Post-Secondary Vocational
Institute/Course SexAge
Total
Institute of Agriculture
Institute of Art and Design
Institute of Agribusiness
Institute of Community Services
14
15 16 17 18 19 20 21 22 23 24 25 26 27 28 29 30+
m - - - - - - - 3 - - - - - - - -
f - 2 3 5 1 3 1 - 1 - - 1 - - 3 2
t - 2 3 5 1 3 1 3 1 - - 1 - - 3 2
m 1 3 23 28 26 25 22 16 20 12 14 7 9 7 15 63
f - - - - 3 1 1 1 - - - - - - - -
t 1 3 23 28 29 26 23 17 20 12 14 7 9 7 15 63
m - 9 23 30 34 9 22 22 14 12 9 16 8 8 13 73
f - 3 5 6 4 3 6 7 4 4 1 - 4 1 3 54
t - 12 28 36 38 12 28 29 18 16 10 16 12 9 16 127
m - - - - - - - 2 1 1 - - - 1 1 5
f - - - - - - - - - - - - - - - -
t - - - - - - - 2 1 1 - - - 1 1 5
m 1 10 3 7 8 18 9 12 3 10 9 13 9 3 7 58
f - 5 6 4 1 - 3 4 2 6 1 1 2 2 1 16
t 1 15 9 11 9 18 12 16 5 16 10 14 11 5 8 74
m 6 35 78 79 83 71 75 79 50 54 60 51 44 36 53 434
f - 29 24 35 32 22 30 42 41 23 18 17 23 16 34 195
t 6 64 102 114 115 93 105 121 91 77 78 68 67 52 87 629
SexAge
Total
Gozo Centre
Institute of Mechanical Engineering
Total
… 2.3. Enrolments by sex, age, type of education and Institute in Post-Secondary Vocational
Institute/Course
Institute of Community Services
Institute of Electronics Engineering
Institute of Information and Communication Technology

15
males females total males females total males females total males females total males females total
Extended Skill Training Scheme (ESTS) including Gozo 43 16 59 33 10 43 - - - - - - 76 26 102 Food Preparation and Service 42 23 65 - - - - - - - - - 42 23 65
Restaurant Operations 17 10 27 - - - - - - - - - 17 10 27
Food Preparation and Production Intermediate Craft - - - 8 7 15 1 - 1 - - - 9 7 16 Food and Preparation and Production Supervisory Studies - - - - 1 1 1 - 1 - - - 1 1 2 Food and Beverages Service Supervisory Studies - - - 25 12 37 32 12 44 - - - 57 24 81
Diploma in Culinary Arts - - - - - - - - - 1 3 4 1 3 4
Diploma in Food and Beverages Services - - - - - - - - - 19 6 25 19 6 25
Accommodation Operations 6 10 16 2 7 9 3 14 17 - - - 11 31 42
Diploma in Accommodation Operations - - - - - - - - - 1 4 5 1 4 5
Hotel Operations 16 15 31 7 16 23 6 3 9 - - - 29 34 63
Diploma Hotel Operations - - - - - - - - - 9 8 17 9 8 17
Travel Agency Operations 1 13 14 2 15 17 - - - - - - 3 28 31
Tour Guiding - - - 3 13 16 - - - - - - 3 13 16
Higher Diploma in Hospitality Management 13 12 25 11 10 21 9 10 19 11 6 17 44 38 82
Total 138 99 237 91 91 182 52 39 91 41 27 68 322 256 578
Part-time training programmer 153 64 217 - - - - - - - - - 153 64 217
Total 153 64 217 - - - - - - - - - 153 64 217
Year of study
Course
2.4. Enrolments by sex, age, type of education and field of education in Post-Secondary Vocational…
Institute of Tourism Studies (ITS) full-time
Institute of Tourism Studies (ITS) part-time
1 2 3 4Total

16
males females total males females total males females total males females total males females total
Institute of Mechanical Engineering328 9 337 - - - 82 5 87 - - - 410 14 424
Institute of Electronics Engineering284 15 299 158 5 163 - - - 32 - 32 474 20 494
Institute of Building and Construction Engineering 383 26 409 35 4 39 9 - 9 26 7 33 453 37 490Institute of Information and Communication Technology 276 69 345 157 33 190 - - - - - - 433 102 535
Institute of Business and Commerce*166 314 480 118 198 316 4 9 13 - - - 288 521 809
Institute of Art and Design 127 157 284 7 - 7 - - - - - - 134 157 291
Maritime Institute 19 5 24 - - - 6 - 6 - - - 25 5 30
Institute of Community Services 49 288 337 8 40 48 6 17 23 - - - 63 345 408
Institute of Agribusiness 31 15 46 12 2 14 4 - 4 - - - 47 17 64
Gozo Centre 81 71 152 19 17 36 - 3 3 - - - 100 91 191
Total 1,744 969 2,713 514 299 813 111 34 145 58 7 65 2,427 1,309 3,736
Malta College of Arts, Science and Technology (MCAST) full-time
* The total for the Institute of Business and Commerce also includes students enrolled in MCAST Matriculation Certificate Course. These students are also included in post-secondary general in Table 2.3.
Course
Year of studyTotal
1 2 3 4
… 2.4. Enrolments by sex, age, type of education and field of education in Post-Secondary Vocational for academic year 2005/06
17
males females total males females total males females total
Institute of Agriculture 41 2 43 14 1 15 55 3 58
Institute of Art and Design 56 120 176 79 156 235 135 276 411
Institute of Building and Construction Engineering 179 31 210 28 3 31 207 34 241
Institute of Business and Commerce* 104 81 185 - - - 104 81 185
Institute of Community Services 3 22 25 - - - 3 22 25
Institute of Electronics Engineering 246 5 251 45 1 46 291 6 297
Institute of Information and Communication Technology 202 88 290 100 17 117 302 105 407
Gozo Centre - - - 11 - 11 11 - 11
Institute of Mechanical Engineering 71 48 119 109 6 115 180 54 234
Total 902 397 1,299 386 184 570 1,288 581 1,869
* The total for the Institute of Business and Commerce also includes students enrolled in MCAST Matriculation Certificate Course. These students are also included in post-secondary general in Table 2.3.
Malta College of Arts, Science and Technology (MCAST) part-time (October 04-February 05)
Course
… 2.4. Enrolments by sex, age, type of education and field of education in Post-Secondary Vocational
1 2Total
Year of study

18
18 19 20 21 22 23 24 25 26 27 28 29 30+ Total
Institute of Conservation and Management of Cultural Heritage (Heritage Malta)Bachelor of Conservation (Honours) 1 m - - - - - - - - - - - - - -
f - - 1 - - - - - - - - - - 12 m - - - - - - - - - - - - 1 1
f - - - 1 1 - - - - - - - - 23 m - - - - - - - - - - - - - -
f - - - - - - - - - - - - 2 24 m - - - - - - - 1 - - - - 1 2
f - - - - - 2 2 - - 1 - - 4 9Total m - - - - - - - 1 - - - - 2 3
f - - 1 1 1 2 2 - - 1 - - 6 14t - - 1 1 1 2 2 1 - 1 - - 8 17
Bachelor of Science (Honours) in Mediterranean Agro-Ecosystems 1 m - - 1 1 5 1 - 3 2 - 1 1 6 21Management f - - - - - 1 1 - - 1 - - 3 6
t - - 1 1 5 2 1 3 2 1 1 1 9 27
Post-graduate Diploma in Conservation Technology for Masonry 1 m - - - - - - - - - - - - - -Buildings f - - - - - - - - - - - - 1 1
t - - - - - - - - - - - - 1 1Total by faculty m - - 1 1 5 1 - 4 2 - 1 1 8 24
f - - 1 1 1 3 3 - - 2 - - 10 21t - - 2 2 6 4 3 4 2 2 1 1 18 45
Faculty of Economics, Management and AccountancyBachelor of Accountancy (Honours) 1 m - - - - 21 14 1 - - - - - - 36
f - - - - 19 21 2 - - - - - - 422 m - - - - - 18 8 - - - - - - 26
f - - - - - 27 16 - 1 - - - - 44Total m - - - - 21 32 9 - - - - - - 62
f - - - - 19 48 18 - 1 - - - - 86t - - - - 40 80 27 - 1 - - - - 148
Bachelor of Arts (Honours) Social Work / Social Administration 3 m - - - - 1 1 - - - - - - - 2f - - - - - 2 - - 1 - - - - 3
4 m - - - - 1 3 - 2 - - - - 2 8f - - - - 11 15 5 1 - - - - 2 34
Total m - - - - 2 4 - 2 - - - - 2 10f - - - - 11 17 5 1 1 - - - 2 37t - - - - 13 21 5 3 1 - - - 4 47
Bachelor of Arts (Honours) Tourism Studies 4 m - - - - - 2 1 2 3 - - - - 8f - - - - 5 - 4 - 3 - - - - 12t - - - - 5 2 5 2 6 - - - - 20
2.5.1. Enrolments at the University of Malta by sex, age, year of study, faculty and course in full-time tertiary education…
Faculty/Course Year SexAge
19
18 19 20 21 22 23 24 25 26 27 28 29 30+ TotalBachelor of Arts (Honours) in Social Policy / Social Work 1 m - 4 2 1 - 1 - 1 - 1 - - - 10
f - 15 17 7 2 1 - - - - - - 2 442 m - - 2 3 4 2 - - - - 1 1 2 15
f - - 15 19 11 4 - - 2 - - - 1 523 m - - - 2 2 - - - - - - - - 4
f - - - 12 14 7 1 - - - 1 - - 35Total m - 4 4 6 6 3 - 1 - 1 1 1 2 29
f - 15 32 38 27 12 1 - 2 - 1 - 3 131t - 19 36 44 33 15 1 1 2 1 2 1 5 160
Bachelor of Arts in Tourism Studies 1 m - 1 2 1 2 1 - 1 - - - - - 8f - 11 11 11 6 5 1 1 - - - - - 46
2 m - - 1 3 4 1 - 2 - - - - - 11f - - 7 6 4 2 3 1 - 2 - - - 25
3 m - - - 1 - - - - 1 - 1 - - 3f - - - - 1 1 - 1 1 - - - - 4
Total m - 1 3 5 6 2 - 3 1 - 1 - - 22f - 11 18 17 11 8 4 3 1 2 - - - 75t - 12 21 22 17 10 4 6 2 2 1 - - 97
Bachelor of Commerce 1 m - 42 53 18 17 3 10 5 2 2 1 - 1 154f - 59 62 18 8 5 5 3 4 - 1 - - 165
2 m - - 34 5 20 4 6 4 2 1 3 - 1 125f - - 75 46 13 5 3 5 1 - - - 3 151
3 m - - - 15 28 8 5 4 2 - - 1 2 65f - - - 40 35 7 5 6 2 1 1 - - 97
4 m - - - - - 1 - - - - - - - 1f - - - - - - - - - - - - - -
Total m - 42 87 83 65 16 21 13 6 3 4 1 4 345f - 59 137 104 56 17 13 14 7 1 2 - 3 413t - 101 224 187 121 33 34 27 13 4 6 1 7 758
Bachelor of Commerce (Honours) 4 m - - - - 19 29 11 1 - - - - 1 61f - - - - 36 31 9 1 - - - - - 77t - - - - 55 60 20 2 - - - - 1 138
Bachelor of Science (Business and Computing) 1 m - 2 8 3 - - 1 - - - - - - 14f - 9 6 - - - - - - - - - - 15
2 m - - 7 16 6 - - 1 - 1 1 - - 32f - - 7 4 1 2 - - - - - - - 14
3 m - - - 5 12 3 4 1 - 1 1 - - 27f - - - 4 4 3 - - - - - - - 11
Total m - 2 15 24 18 3 5 2 - 2 2 - - 73f - 9 13 8 5 5 - - - - - - - 40t - 11 28 32 23 8 5 2 - 2 2 - - 113
… 2.5.1. Enrolments at the University of Malta by sex, age, year of study, faculty and course in full-time tertiary education
Faculty/Course Year SexAge

20
18 19 20 21 22 23 24 25 26 27 28 29 30+ TotalMaster of Business Administration 1 m - - - - - 2 - 1 - 1 1 - 1 6
f - - - - - 2 3 1 1 1 - - 2 102 m - - - - - - 4 2 - 2 2 - 3 13
f - - - - - - 2 4 - 1 1 1 2 11Total m - - - - - 2 4 3 - 3 3 - 4 19
f - - - - - 2 5 5 1 2 1 1 4 21t - - - - - 4 9 8 1 5 4 1 8 40
Doctor of Philosophy (Ph D) in Banking and Finance 5 m - - - - - - - - - - - - 1 1f - - - - - - - - - - - - - -t - - - - - - - - - - - - 1 1
Total by faculty m - 49 109 118 137 93 51 27 10 9 11 2 14 630f - 94 200 167 170 140 59 24 16 5 4 1 12 892t - 143 309 285 307 233 110 51 26 14 15 3 26 1,522
Faculty of LawsBachelor of Arts in Legal and Humanistic Studies 3 m - - - - - 2 - 1 - - 1 - 1 5
f - - - - 2 2 - 1 - - - - - 5t - - - - 2 4 - 2 - - 1 - 1 10
Bachelor of Laws 1 m - 15 22 7 3 4 1 1 2 - - 1 8 64f - 32 34 3 - - 1 2 1 2 - 1 1 77
2 m - - 12 17 4 4 - 1 - 1 - 1 1 41f - 1 30 39 5 2 - - - - - - 3 80
3 m - - - 22 12 5 1 - 2 2 - - 3 47f - - - 22 32 5 - - - 1 - 2 6 68
Total m - 15 34 46 19 13 2 2 4 3 - 2 12 152f - 33 64 64 37 7 1 2 1 3 - 3 10 225t - 48 98 110 56 20 3 4 5 6 - 5 22 377
Diploma in Legal Procurator 1 m - - - - - - - - - - - - - -f - - - - - - - - 1 - - - - 1t - - - - - - - - 1 - - - - 1
Diploma of Notary Public 1 m - - - - 7 12 3 2 1 - - 1 - 26f - - - - 16 23 5 3 - - 2 1 5 55t - - - - 23 35 8 5 1 - 2 2 5 81
Doctor of Laws 2 m - - - - - 10 7 2 2 - - - 4 25f - - - - - 27 21 6 - 1 1 1 1 58
3 m - - - - - - 14 17 1 1 3 2 9 47f - - - - - - 16 20 3 2 - 1 5 47
Total m - - - - - 10 21 19 3 1 3 2 13 72f - - - - - 27 37 26 3 3 1 2 6 105t - - - - - 37 58 45 6 4 4 4 19 177
… 2.5.1. Enrolments at the University of Malta by sex, age, year of study, faculty and course in full-time tertiary education
Faculty/Course Year SexAge

21
18 19 20 21 22 23 24 25 26 27 28 29 30+ TotalMaster in Financial Services 1 m - - - - - - - 1 - - - 1 - 2
f - - - - - 2 - - 1 2 - - - 52 m - - - - - - - - - - - - - -
f - - - - - - - 1 - - - - 2 3Total m - - - - - - - 1 - - - 1 - 2
f - - - - - 2 - 1 1 2 - - 2 8t - - - - - 2 - 2 1 2 - 1 2 10
Master in Human Rights and Democratisation 1 m - - - - - - 3 1 4 2 1 1 11 23f - - - - 1 1 3 3 5 3 2 2 6 26
2 m - - - - - - - - - - 1 - - 1f - - - - - - - - - - - - - -
Total m - - - - - - 3 1 4 2 2 1 11 24f - - - - 1 1 3 3 5 3 2 2 6 26t - - - - 1 1 6 4 9 5 4 3 17 50
Magister Juris in European and Comparative Law 1 m - - - - - - - - - - - - - -f - - - - - 1 - 3 1 2 - - - 7t - - - - - 1 - 3 1 2 - - - 7
Magister Juris in International Law 1 m - - - - - - - - - - - - 1 1f - - - - - - - - - - - - - -t - - - - - - - - - - - - 1 1
Master of Arts in Law 1 m - - - - - - - - - 1 - - 2 3f - - - - - - - - - - - - - -
2 m - - - - - - - - - - - - - -f - - - - - - - - - - - - 1 1
Total m - - - - - - - - - 1 - - 2 3f - - - - - - - - - - - - 1 1t - - - - - - - - - 1 - - 3 4
Total by faculty m - 15 34 46 26 37 29 26 12 7 6 7 40 285f - 33 64 64 56 63 46 39 12 13 5 8 30 433t - 48 98 110 82 100 75 65 24 20 11 15 70 718
Faculty of TheologyBA in Theology and Human Studies 1 m - - - - - - - 1 - - - - - 1
f - 2 1 - - - - - - - - - - 32 m - - - - - - 1 - - - - - - 1
f - - 1 1 - - - - - - - - - 23 m - - - 1 - 1 1 - - - - - - 3
f - - - - - 1 - - - - - - - 1Total m - - - 1 - 1 2 1 - - - - - 5
f - 2 2 1 - 1 - - - - - - - 6t - 2 2 2 - 2 2 1 - - - - - 11
… 2.5.1. Enrolments at the University of Malta by sex, age, year of study, faculty and course in full-time tertiary education
Faculty/Course Year SexAge
22
18 19 20 21 22 23 24 25 26 27 28 29 30+ TotalBachelor of Arts (Honours) in Theology 1 m - - 1 - - - - 1 - - - - - 2
f - 1 1 1 - - - - - - - - 1 42 m - - - 1 - - - - 3 1 - - - 5
f - - - - - - - - - - - - 2 23 m - - - - - - - - - - - - - -
f - - - - - - - - - - 1 - 2 3Total m - - 1 1 - - - 1 3 1 - - - 7
f - 1 1 1 - - - - - - 1 - 5 9t - 1 2 2 - - - 1 3 1 1 - 5 16
Bachelor of Sacred Theology 1 m - - 3 1 1 2 - - - - 1 - 2 10f - - - - - - - - - - - - 1 1
2 m - - - 6 2 2 1 - 1 - - - - 12f - - - - - - - - - - - - - -
3 m - - - 1 1 1 1 1 - 1 - - 2 8f - - - - - - - - - - - - - -
4 m - - - - - 1 6 2 1 1 2 - - 13f - - - - - - - - - - - - - -
5 m - - - - - - 1 1 2 - - - 2 6f - - - - - - - - - - - - - -
Total m - - 3 8 4 6 9 4 4 2 3 - 6 49f - - - - - - - - - - - - 1 1t - - 3 8 4 6 9 4 4 2 3 - 7 50
Doctor of Sacred Theology 5 m - - - - - - - - - - - - 1 1f - - - - - - - - - - - - - -t - - - - - - - - - - - - 1 1
Licentiate in Sacred Theology 1 m - - - - - - - - - 2 - - 1 3f - - - - - - - - - - - - - -
2 m - - - - - - - - - - - 2 4 6f - - - - - - - - - - - - - -
Total m - - - - - - - - - 2 - 2 5 9f - - - - - - - - - - - - - -t - - - - - - - - - 2 - 2 5 9
Master of Arts in Theology 1 m - - - - - - - - 1 - - - 3 4f - - - - - - - - - - - - 1 1
2 m - - - - - - - - 1 - - - - 1f - - - - - 1 - - - - - - 2 3
3 m - - - - - - - - - - - - 1 1f - - - - - - 1 - - - - - 3 4
Total m - - - - - - - - 2 - - - 4 6f - - - - - 1 1 - - - - - 6 8t - - - - - 1 1 - 2 - - - 10 14
… 2.5.1. Enrolments at the University of Malta by sex, age, year of study, faculty and course in full-time tertiary education
Faculty/Course Year SexAge

23
18 19 20 21 22 23 24 25 26 27 28 29 30+ TotalMaster of Philosophy in Theology 3 m - - - - - - - - - - - - 1 1
f - - - - - - - - - - - - - -t - - - - - - - - - - - - 1 1
Total by faculty m - - 4 10 4 7 11 6 9 5 3 2 17 78f - 3 3 2 - 2 1 - - - 1 - 12 24t - 3 7 12 4 9 12 6 9 5 4 2 29 102
Faculty of ArtsBachelor of Arts 1 m - 7 10 2 2 2 3 1 2 1 - - 1 31
f - 18 19 7 2 2 1 1 1 - - 1 1 532 m - - 2 3 2 2 3 - - 1 - - - 13
f - - 6 14 2 1 2 1 2 - 1 - 2 313 m - - 1 3 6 1 2 1 1 1 - - 3 19
f - - - 6 8 2 2 1 - - 3 - 2 24Total m - 7 13 8 10 5 8 2 3 3 - - 4 63
f - 18 25 27 12 5 5 3 3 - 4 1 5 108t - 25 38 35 22 10 13 5 6 3 4 1 9 171
Bachelor of Arts (Honours) 2 m - - 20 17 3 4 1 2 2 2 1 2 4 58f - - 31 31 12 2 1 1 1 2 1 - 6 88
3 m - - - 12 17 4 2 1 1 - - - 5 42f - - - 25 33 13 2 2 1 - - 3 7 86
Total m - - 20 29 20 8 3 3 3 2 1 2 9 100f - - 31 56 45 15 3 3 2 2 1 3 13 174t - - 51 85 65 23 6 6 5 4 2 5 22 274
Postgraduate Diploma in Interpreting 1 m - - - - - - - - - - - - 1 1f - - - - - 2 - - 2 3 - - 1 8t - - - - - 2 - - 2 3 - - 2 9
Master in Translation and Interpreting 1 m - - - - - - - - - - - - 1 1f - - - - - - - - - 1 - - 2 3t - - - - - - - - - 1 - - 3 4
Master of Arts 1 m - - - - 3 1 - 2 - - 1 - 1 8f - - - - - 4 3 1 - - 1 - 2 11
2 m - - - - - - 2 - - - - - - 2f - - - - - 3 4 3 1 - - - 1 12
3 m - - - - - - 1 1 - - - - 3 5f - - - - - - - 2 1 - - - 1 4
Total m - - - - 3 1 3 3 - - 1 - 4 15f - - - - - 7 7 6 2 - 1 - 4 27t - - - - 3 8 10 9 2 - 2 - 8 42
… 2.5.1. Enrolments at the University of Malta by sex, age, year of study, faculty and course in full-time tertiary education
Faculty/Course Year SexAge

24
18 19 20 21 22 23 24 25 26 27 28 29 30+ Total
Master of Arts in Creativity and Innovation 1 m - - - - - 2 1 1 1 - 2 - - 7f - - - - 1 - 2 - 1 - - - 1 5
2 m - - - - - - - - 1 1 - - 1 3f - - - - - - - - - - - - 6 6
Total m - - - - - 2 1 1 2 1 2 - 1 10f - - - - 1 - 2 - 1 - - - 7 11t - - - - 1 2 3 1 3 1 2 - 8 21
Master of Music 1 m - - - - - - 1 - - - - - - 1f - - - - - - - - - - - - - -
2 m - - - - - - 1 - - - - - - 1f - - - - - - - - - - - - - -
4 m - - - - - - - - - - - - 1 1f - - - - - - - - - - - - - -
Total m - - - - - - 2 - - - - - 1 3f - - - - - - - - - - - - - -t - - - - - - 2 - - - - - 1 3
Qualifying Programme for the Master of Arts 1 m - - - - - 3 1 1 1 - - - - 6
f - - - - 8 2 2 1 - - - - 1 14
t - - - - 8 5 3 2 1 - - - 1 20
Doctor of Philosophy in History 3 m - - - - - - - - - - - - 1 1
f - - - - - - - - - - - - - -
t - - - - - - - - - - - - 1 1
Doctor of Philosophy in Italian 2 m - - - - - - - - - - - - - -f - - - - - - - - - 1 - - - 1
3 m - - - - - - - - - - - - - -f - - - - - - - - - 1 - - - 1
Total m - - - - - - - - - - - - - -f - - - - - - - - - 2 - - - 2t - - - - - - - - - 2 - - - 2
Doctor of Philosophy in Music Studies 4 m - - - - - - - - - - - - - -
f - - - - - - - - - - - - 1 1
t - - - - - - - - - - - - 1 1
Master of Philosophy in English 2 m - - - - - - - - - - - - 1 1
f - - - - - - - - - - - - - -
t - - - - - - - - - - - - 1 1
… 2.5.1. Enrolments at the University of Malta by sex, age, year of study, faculty and course in full-time tertiary education
Faculty/Course Year SexAge

25
18 19 20 21 22 23 24 25 26 27 28 29 30+ TotalDoctor of Philosophy in International Relations 2 m - - - - - - - - - 1 - - - 1
f - - - - - - - - - - - - - -5 m - - - - - - - - - - - - 1 1
f - - - - - - - - - - - - - -Total m - - - - - - - - - 1 - - 1 2
f - - - - - - - - - - - - - -t - - - - - - - - - 1 - - 1 2
Total by faculty m - 7 33 37 33 19 18 10 9 7 4 2 24 203f - 18 56 83 66 31 19 13 10 8 6 4 34 348t - 25 89 120 99 50 37 23 19 15 10 6 58 551
Institute of Forensic StudiesBachelor of Arts (Honours) in Criminology 1 m - 3 2 8 1 - - 1 - - - - - 15
f - 7 16 2 1 1 1 1 - - - - - 294 m - - - - - - - - - - - - - -
f - - - - - - - - - - - - 1 1Total m - 3 2 8 1 - - 1 - - - - - 15
f - 7 16 2 1 1 1 1 - - - - 1 30t - 10 18 10 2 1 1 2 - - - - 1 45
Ph D in Anatomy 1 m - - - - - - - - - - - - - -f - - - - - - - - - - - - 1 1t - - - - - - - - - - - - 1 1
Total by faculty m - 3 2 8 1 - - 1 - - - - - 15f - 7 16 2 1 1 1 1 - - - - 2 31t - 10 18 10 2 1 1 2 - - - - 2 46
Centre for Communication TechnologyBachelor of Communications (Hons) 3 m - - - 1 1 2 1 - - 1 - - 1 7
f - - - 4 - 3 - 1 - 1 - - - 94 m - - - - 1 4 2 - - - 1 - 1 9
f - - - - 3 11 3 3 - - - - 2 22Total m - - - 1 2 6 3 - - 1 1 - 2 16
f - - - 4 3 14 3 4 - 1 - - 2 31t - - - 5 5 20 6 4 - 2 1 - 4 47
Bachelor of Communications 1 m - 3 5 7 1 3 5 5 1 1 - - - 31f - 6 11 8 3 4 - 2 - - 1 - 2 37
2 m - - 4 5 3 8 3 - 1 - - - - 24f - - 7 14 11 5 3 2 - 3 - - - 45
3 m - - - 2 4 2 1 - - 1 2 2 - 14f - - - 3 12 5 5 1 1 - 1 - - 28
Total m - 3 9 14 8 13 9 5 2 2 2 2 - 69f - 6 18 25 26 14 8 5 1 3 2 - 2 110t - 9 27 39 34 27 17 10 3 5 4 2 2 179
Total by faculty m - 3 9 15 10 19 12 5 2 3 3 2 2 85f - 6 18 29 29 28 11 9 1 4 2 - 4 141t - 9 27 44 39 47 23 14 3 7 5 2 6 226
… 2.5.1. Enrolments at the University of Malta by sex, age, year of study, faculty and course in full-time tertiary education
Faculty/Course Year SexAge
26
18 19 20 21 22 23 24 25 26 27 28 29 30+ Total
Faculty of Dental SurgeryBachelor of Dental Surgery 1 m - 1 3 - 1 - - - - - - - - 5
f - 1 1 1 - - - - - - - - - 32 m - - 1 2 1 - - - - - - - - 4
f - - - 3 1 - - - - - - - - 43 m - - - 1 1 - - - - - - - - 2
f - - - - 3 - - - - - - - - 34 m - - - - 1 2 - - 1 - - - - 4
f - - - - 3 - 1 - - - - - - 45 m - - - - - 2 4 - - - - - - 6
f - - - - - - 1 - - - - - - 1Total by faculty m - 1 4 3 4 4 4 - 1 - - - - 21
f - 1 1 4 7 - 2 - - - - - - 15t - 2 5 7 11 4 6 - 1 - - - - 36
Faculty of EducationBachelor of Education (Honours) 1 m - 12 11 4 1 2 2 1 1 - - - 1 35
f - 47 41 15 3 1 - 1 1 1 - - 3 1132 m - - 7 7 9 4 1 1 1 1 - - 1 32
f - - 43 38 7 1 - - - - 1 - 4 943 m - - - 3 12 - 3 2 - - 1 1 3 25
f - - - 52 36 8 1 - - 1 1 1 7 1074 m - - - - 9 13 8 2 1 3 1 - 2 39
f - - - - 66 47 13 4 - 1 2 2 8 1435 m - - - - - 1 - - 1 - - - - 2
f - - - - - 2 2 1 - - - - - 5Total m - 12 18 14 31 20 14 6 4 4 2 1 7 133
f - 47 84 105 112 59 16 6 1 3 4 3 22 462t - 59 102 119 143 79 30 12 5 7 6 4 29 595
Bachelor of Psychology 3 m - - - - - - - - - - - - - -f - - - - 1 - - - - 1 - - - 2
4 m - - - - - - - - - - - - 1 1f - - - - - - - - - - - - - -
Total m - - - - - - - - - - - - 1 1f - - - - 1 - - - - 1 - - - 2t - - - - 1 - - - - 1 - - 1 3
… 2.5.1. Enrolments at the University of Malta by sex, age, year of study, faculty and course in full-time tertiary education
Faculty/Course Year SexAge

27
18 19 20 21 22 23 24 25 26 27 28 29 30+ TotalBachelor of Psychology (Honours) 1 m - 3 2 6 - - 2 - - 1 - - 1 15
f - 22 23 5 2 3 - 1 - - - 1 8 652 m - - 1 5 1 3 - - 1 - 1 - 3 15
f - - 14 15 3 1 1 2 - 1 - - 2 393 m - - - 5 3 - 2 - 1 2 - 1 1 15
f - - - 16 26 8 1 1 - 1 - - 2 554 m - - - - 1 6 4 - 1 - - - 1 13
f - - - - 8 10 6 3 1 - 1 1 5 355 m - - - - - - 1 - - - - - - 1
f - - - - - - - - - - - - - -Total m - 3 3 16 5 9 9 - 3 3 1 1 6 59
f - 22 37 36 39 22 8 7 1 2 1 2 17 194t - 25 40 52 44 31 17 7 4 5 2 3 23 253
Master of Psychology 2 m - - - - - - - - - - - - 2 2f - - - - - - - - - - 2 1 5 8t - - - - - - - - - - 2 1 7 10
Postgraduate Certificate in Education 1 m - - - - 2 2 2 2 1 1 1 - 5 16f - - - - 15 28 10 2 3 1 2 3 6 70t - - - - 17 30 12 4 4 2 3 3 11 86
Total by faculty m - 15 21 30 38 31 25 8 8 8 4 2 21 211f - 69 121 141 167 109 34 15 5 7 9 9 50 736t - 84 142 171 205 140 59 23 13 15 13 11 71 947
Faculty of EngineeringBachelor of Engineering (Honours) 1 m - 35 30 11 4 4 - 4 1 - 1 1 1 92
f - 9 11 2 1 - - - - - - - - 232 m - - 24 23 10 - - 1 2 1 1 - - 62
f - - 6 10 3 - - - - - - - - 193 m - - - 20 28 5 4 2 3 1 - - 1 64
f - - - 7 7 1 - - - - - - - 154 m - - - - 28 32 5 3 1 - 1 - 1 71
f - - - - 5 13 1 - - - - - - 19Total m - 35 54 54 70 41 9 10 7 2 3 1 3 289
f - 9 17 19 16 14 1 - - - - - - 76t - 44 71 73 86 55 10 10 7 2 3 1 3 365
Master of Philosophy in Engineering 1 m - - - - - 3 - 2 - - - 1 - 6f - - - - - - - - - - - - - -
2 m - - - - - - 1 - - - - - - 1f - - - - - - 1 1 - - - - - 2
3 m - - - - - - - - - - - - - -f - - - - - - - - - - - 1 - 1
Total m - - - - - 3 1 2 - - - 1 - 7f - - - - - - 1 1 - - - 1 - 3t - - - - - 3 2 3 - - - 2 - 10
… 2.5.1. Enrolments at the University of Malta by sex, age, year of study, faculty and course in full-time tertiary education
Faculty/Course Year SexAge

28
18 19 20 21 22 23 24 25 26 27 28 29 30+ Total
Doctor of Philosophy in Engineering 3 m - - - - - - - - 2 - - - - 2f - - - - - - - - - - - - - -
4 m - - - - - - - - - - - - 1 1f - - - - - - - - - - - - - -
Total m - - - - - - - - 2 - - - 1 3f - - - - - - - - - - - - - -t - - - - - - - - 2 - - - 1 3
Total by faculty m - 35 54 54 70 44 10 12 9 2 3 2 4 299f - 9 17 19 16 14 2 1 - - - 1 - 79t - 44 71 73 86 58 12 13 9 2 3 3 4 378
Faculty of Architecture and Civil EngineeringBachelor of Engineering and Architecture (Honours) 1 m - 6 14 6 1 - 1 2 1 - 1 1 - 33
f - 13 12 3 - - - - - 1 - - - 292 m - - 12 11 8 - 1 - - - - - 1 33
f - - 10 9 1 - - - - - - - - 203 m - - - 3 6 1 - - - 1 - - 1 12
f - - - 10 9 2 - 1 - - - - - 224 m - - - - 8 11 3 2 - - 1 - - 25
f - - - - 2 5 5 1 - - - - - 135 m - - - - - 6 13 5 5 - - - - 29
f - - - - - 14 8 2 1 - 1 - - 26Total by faculty m - 6 26 20 23 18 18 9 6 1 2 1 2 132
f - 13 22 22 12 21 13 4 1 1 1 - - 110t - 19 48 42 35 39 31 13 7 2 3 1 2 242
European Documentation and Research CentreBachelor of European Studies 2 m - - - - - - - - - - - - - -
f - - - 1 - - - - - - - - - 13 m - - - - - - - - - - - - - -
f - - - - - 2 - - - - - - - 2Total m - - - - - - - - - - - - - -
f - - - 1 - 2 - - - - - - - 3t - - - 1 - 2 - - - - - - - 3
Bachelor of European Studies (Honours) 1 m - 2 2 2 1 - - 1 - - - - - 8f - 5 8 4 1 - 1 - - - - - - 19
2 m - - 4 2 2 1 - 1 - 1 - - 2 13f - - 6 6 3 4 1 1 - 2 - 1 1 25
3 m - - - - 5 1 - - - 1 - - 1 8f - - - 7 3 3 1 1 - - - - 1 16
Total m - 2 6 4 8 2 - 2 - 2 - - 3 29f - 5 14 17 7 7 3 2 - 2 - 1 2 60t - 7 20 21 15 9 3 4 - 4 - 1 5 89
… 2.5.1. Enrolments at the University of Malta by sex, age, year of study, faculty and course in full-time tertiary education
Faculty/Course Year SexAge

29
18 19 20 21 22 23 24 25 26 27 28 29 30+ Total
Bachelor of Arts (Honours) in European Studies 3 m - - - - - - - - - - 1 - - 1f - - - - - - - - - - - - - -t - - - - - - - - - - 1 - - 1
Master of Arts in European Studies 1 m - - - - 3 1 3 - 1 - - - 3 11f - - - - 1 3 2 - - - - - - 6t - - - - 4 4 5 - 1 - - - 3 17
Total by faculty m - 2 6 4 11 3 3 2 1 2 1 - 6 41f - 5 14 18 8 12 5 2 - 2 - 1 2 69t - 7 20 22 19 15 8 4 1 4 1 1 8 110
Faculty of Medicine and SurgeryBachelor of Pharmacy (Honours) 1 m - 5 5 - - - - - - - - - - 10
f - 14 10 1 1 - 1 - - - - - - 272 m - - 3 2 1 - - - - - - - - 6
f - - 14 8 - - - - - - - - - 223 m - - - - 4 - - - - - - - - 4
f - - - 6 11 8 - - - - - - 1 264 m - - - - 3 5 1 - 1 - - - - 10
f - - - - 15 6 3 1 - - - - - 255 m - - - - - 4 1 1 - - - - - 6
f - - - - - 7 9 - 1 - - - - 17Total m - 5 8 2 8 9 2 1 1 - - - - 36
f - 14 24 15 27 21 13 1 1 - - - 1 117t - 19 32 17 35 30 15 2 2 - - - 1 153
Master of Science in Medicine and Surgery 2 m - - - - - - 1 - - - - - - 1f - - - - - - - - - - - - 1 1t - - - - - - 1 - - - - - 1 2
Total by faculty m - 5 8 2 8 9 3 1 1 - - - - 37f - 14 24 15 27 21 13 1 1 - - - 2 118t - 19 32 17 35 30 16 2 2 - - - 2 155
Faculty of ScienceBachelor of Science 3 m - - - - - - - - - - - - - -
f - - - 1 - - - - - - - - - 1
t - - - 1 - - - - - - - - - 1
Bachelor of Science (Honours) 1 m 1 10 21 3 1 3 - 1 - - 1 - - 41f - 16 19 1 - - 1 1 - - - - - 38
2 m - - 13 8 2 1 1 - - - - 1 1 27f - - 13 16 4 1 - 1 - - - 1 - 36
3 m - - - 4 12 1 1 1 - - - - - 19f - - - 9 15 1 - - - - - - - 25
4 m - - - - 6 12 3 2 - - - - - 23f - - - - 11 16 4 - - - - - - 31
Total m 1 10 34 15 21 17 5 4 - - 1 1 1 110f - 16 32 26 30 18 5 2 - - - 1 - 130t 1 26 66 41 51 35 10 6 - - 1 2 1 240
… 2.5.1. Enrolments at the University of Malta by sex, age, year of study, faculty and course in full-time tertiary education
Faculty/Course Year SexAge

30
18 19 20 21 22 23 24 25 26 27 28 29 30+ TotalMaster of Science 1 m - - - - - - 5 1 - - - - - 6
f - - - - - - - - - - - - - -2 m - - - - - - 1 1 2 - - - - 4
f - - - - - - 1 - - - - - - 1Total m - - - - - - 6 2 2 - - - - 10
f - - - - - - 1 - - - - - - 1t - - - - - - 7 2 2 - - - - 11
Qualifying Programme for the Master of Science 1 m - - - - - - - - - - - - - -f - - - - - - - 1 - - - - - 1t - - - - - - - 1 - - - - - 1
Doctor of Philosophy in Physiology and Biochemistry 2 m - - - - - - - - - - - - 1 1f - - - - - - - - - - - - - -
4 m - - - - - - - - - - - - 1 1f - - - - - - - - - 1 - - 2 3
Total m - - - - - - - - - - - - 2 2f - - - - - - - - - 1 - - 2 3t - - - - - - - - - 1 - - 4 5
Doctor of Philosophy in Chemistry 1 m - - - - - - 1 - - - - - - 1f - - - - - - - - - - - - - -t - - - - - - 1 - - - - - - 1
Total by faculty m 1 10 34 15 21 17 12 6 2 - 1 1 3 123f - 16 32 27 30 18 6 3 - 1 - 1 2 136t 1 26 66 42 51 35 18 9 2 1 1 2 5 259
Institute of Health CareBachelor of Science (Honours) Health Science 1 m - 4 6 6 2 - - 1 - - - - 1 20
f - 33 29 8 4 1 1 - - - - - 1 772 m - - 7 11 2 1 1 - 1 - - - 1 24
f - - 21 31 6 1 - - 1 - - - 1 613 m - - - 3 9 6 1 - - - - - 1 20
f - - - 25 31 11 2 2 - 1 - - 3 754 m - - - - - 3 3 - - - - - 1 7
f - - - 1 14 14 - 1 - - - - 1 31Total m - 4 13 20 13 10 5 1 1 - - - 4 71
f - 33 50 65 55 27 3 3 1 1 - - 6 244t - 37 63 85 68 37 8 4 2 1 - - 10 315
Bachelor of Science (Honours) in Nursing/Midwifery 4 m - - - - 2 5 1 1 - 1 2 - 1 13f - - - - 12 11 4 7 1 - - 2 9 46t - - - - 14 16 5 8 1 1 2 2 10 59
Bachelor of Science in Health Science 4 m - - - - - - 1 - - - - - - 1f - - - - - - - - - - - - - -t - - - - - - 1 - - - - - - 1
… 2.5.1. Enrolments at the University of Malta by sex, age, year of study, faculty and course in full-time tertiary education
Faculty/Course Year SexAge

31
18 19 20 21 22 23 24 25 26 27 28 29 30+ TotalDiploma in Health Science 1 m - - 4 5 7 2 1 - 1 - - - 1 21
f - - 6 16 23 9 4 3 1 1 - 2 2 672 m - - - 2 7 9 4 - - - - - 2 24
f - - - 7 24 25 9 4 - - 1 - 4 74
Total m - - 4 7 14 11 5 - 1 - - - 3 45
f - - 6 23 47 34 13 7 1 1 1 2 6 141
t - - 10 30 61 45 18 7 2 1 1 2 9 186
Preparatory Course for Diploma in Health Science 1 m - 1 7 3 3 - 1 - 1 - - - - 16f 1 5 10 8 4 3 - - - - 1 - 1 33
2 m - - - - 1 - - - - - - - - 1f - - - - - - - - - - - - - -
Total m - 1 7 3 4 - 1 - 1 - - - - 17f 1 5 10 8 4 3 - - - - 1 - 1 33t 1 6 17 11 8 3 1 - 1 - 1 - 1 50
Total by faculty m - 5 24 30 33 26 13 2 3 1 2 - 8 147f 1 38 66 96 118 75 20 17 3 2 2 4 22 464t 1 43 90 126 151 101 33 19 6 3 4 4 30 611
Board of Studies for Information TechnologyBachelor of Science (Honours) Information Technology 1 m - 20 18 8 - - 1 2 1 2 - - - 52
f - 4 3 - - - - - - - - - - 72 m - - 21 19 6 2 2 - - - - - 1 51
f - - 5 10 - - - - - - - - - 153 m - - - 16 15 4 2 - 1 - - - - 38
f - - - 6 4 - - - - - - - - 104 m - - - - 10 11 4 1 - 1 - - 1 28
f - - - - 2 2 - - - - - - - 4Total m - 20 39 43 31 17 9 3 2 3 - - 2 169
f - 4 8 16 6 2 - - - - - - - 36t - 24 47 59 37 19 9 3 2 3 - - 2 205
Diploma in Information Technology 2 m - - - - 4 1 1 - - - - - - 6f - - - 1 1 - - - - - - - - 2t - - - 1 5 1 1 - - - - - - 8
Master of Philosophy in Computer Science 1 m - - - - - - - - - - - - - -f - - - - - - - - - - - - - -t - - - - - - - - - - - - - -
Total by faculty m - 20 39 43 35 18 10 3 2 3 - - 2 175f - 4 8 17 7 2 - - - - - - - 38t - 24 47 60 42 20 10 3 2 3 - - 2 213
… 2.5.1. Enrolments at the University of Malta by sex, age, year of study, faculty and course in full-time tertiary education
Faculty/Course Year SexAge

32
18 19 20 21 22 23 24 25 26 27 28 29 30+ Total
Faculty of Medicine and SurgeryDoctor of Medicine and Surgery 1 m - 8 8 7 2 1 2 2 - - - - 1 31
f - 15 15 2 - - - - - - - - - 322 m - - 11 8 2 3 1 2 1 - - - - 28
f - - 15 16 4 - 1 - - - - - 2 383 m - - - 6 12 1 2 - - 1 1 - 1 24
f - - - 11 13 4 2 - 1 1 - - - 324 m - - - - 13 10 3 - - 1 - - - 27
f - - - - 16 12 1 2 1 - - - - 325 m - - - - - 12 13 2 - 1 - - 2 30
f - - - - - 8 12 1 - - - - - 21Total by faculty m - 8 19 21 29 27 21 6 1 3 1 - 4 140
f - 15 30 29 33 24 16 3 2 1 - - 2 155t - 23 49 50 62 51 37 9 3 4 1 - 6 295
Mediterranean Academy of Diplomatic StudiesMA in Diplomatic Studies 1 m - - - - 3 3 1 1 1 - 2 2 - 13
f - - - - 2 2 2 - - - - 2 1 9t - - - - 5 5 3 1 1 - 2 4 1 22
Master in Contemporary Diplomacy 1 m - - - - - - - - - 1 - - 6 7f - - - - - - - - 1 - - 1 2 4t - - - - - - - - 1 1 - 1 8 11
Master in Diplomacy 1 m - - - - - - - 2 1 - 2 - 4 9f - - - - - - - - - - - 1 2 3t - - - - - - - 2 1 - 2 1 6 12
Postgraduate Diploma in Contemporary Diplomacy 1 m - - - - - - - - - - 1 - 7 8f - - - - - - - - - - - - 4 4t - - - - - - - - - - 1 - 11 12
Postgraduate Diploma in Diplomacy 1 m - - - - - - - - - - - - 1 1f - - - - - - - - - - - - - -t - - - - - - - - - - - - 1 1
Total by faculty m - - - - 3 3 1 3 2 1 5 2 18 38f - - - - 2 2 2 - 1 - - 4 9 20t - - - - 5 5 3 3 3 1 5 6 27 58
Mediterranean InstituteMaster of Philosophy in Mediterranean Studies 1 m - - - - - - - - - - - - - -
f - - - - - - - - - - - - 1 1Total by faculty t - - - - - - - - - - - - 1 1
European Centre for GerontologyPostgraduate Diploma in Gerontology and Geriatrics 1 m - - - - - - - - - 1 - - - 1
f - - - - - - 1 1 1 - - - 2 5Total by faculty t - - - - - - 1 1 1 1 - - 2 6
… 2.5.1. Enrolments at the University of Malta by sex, age, year of study, faculty and course in full-time tertiary education
Faculty/Course Year SexAge

33
18 19 20 21 22 23 24 25 26 27 28 29 30+ Total
Institute of Agriculture
Preparatory Course for Diploma in Agriculture 1 m 1 1 - 1 - 1 - 1 - - - - 5 10
f 1 - - - - 1 - - - - - - - 2
Total by faculty t 2 1 - 1 - 2 - 1 - - - - 5 12
Certificate in Foundation Studies 1 m - 6 5 5 3 4 1 - - - - - - 24
f 1 5 6 - 2 - 1 1 1 - - - - 17
Total by faculty t 1 11 11 5 5 4 2 1 1 - - - - 41
Full-time total m 2 191 432 463 494 381 242 132 80 53 47 24 178 2,719
f 3 350 699 736 752 567 255 134 54 46 30 33 196 3,855
t 5 541 1,131 1,199 1,246 948 497 266 134 99 77 57 374 6,574
… 2.5.1. Enrolments at the University of Malta by sex, age, year of study, faculty and course in full-time tertiary education
Faculty/Course Year SexAge
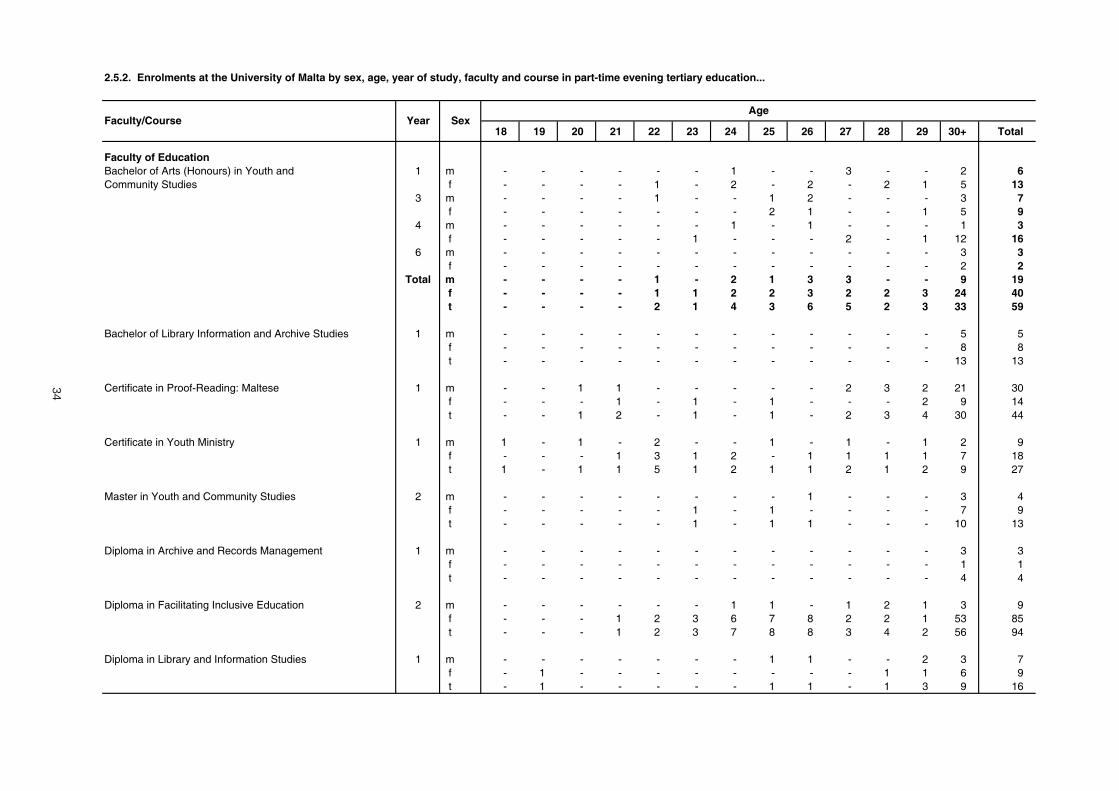
34
18 19 20 21 22 23 24 25 26 27 28 29 30+ Total
Faculty of EducationBachelor of Arts (Honours) in Youth and 1 m - - - - - - 1 - - 3 - - 2 6Community Studies f - - - - 1 - 2 - 2 - 2 1 5 13
3 m - - - - 1 - - 1 2 - - - 3 7f - - - - - - - 2 1 - - 1 5 9
4 m - - - - - - 1 - 1 - - - 1 3f - - - - - 1 - - - 2 - 1 12 16
6 m - - - - - - - - - - - - 3 3f - - - - - - - - - - - - 2 2
Total m - - - - 1 - 2 1 3 3 - - 9 19f - - - - 1 1 2 2 3 2 2 3 24 40t - - - - 2 1 4 3 6 5 2 3 33 59
Bachelor of Library Information and Archive Studies 1 m - - - - - - - - - - - - 5 5f - - - - - - - - - - - - 8 8t - - - - - - - - - - - - 13 13
Certificate in Proof-Reading: Maltese 1 m - - 1 1 - - - - - 2 3 2 21 30f - - - 1 - 1 - 1 - - - 2 9 14t - - 1 2 - 1 - 1 - 2 3 4 30 44
Certificate in Youth Ministry 1 m 1 - 1 - 2 - - 1 - 1 - 1 2 9f - - - 1 3 1 2 - 1 1 1 1 7 18t 1 - 1 1 5 1 2 1 1 2 1 2 9 27
Master in Youth and Community Studies 2 m - - - - - - - - 1 - - - 3 4f - - - - - 1 - 1 - - - - 7 9t - - - - - 1 - 1 1 - - - 10 13
Diploma in Archive and Records Management 1 m - - - - - - - - - - - - 3 3f - - - - - - - - - - - - 1 1t - - - - - - - - - - - - 4 4
Diploma in Facilitating Inclusive Education 2 m - - - - - - 1 1 - 1 2 1 3 9f - - - 1 2 3 6 7 8 2 2 1 53 85t - - - 1 2 3 7 8 8 3 4 2 56 94
Diploma in Library and Information Studies 1 m - - - - - - - 1 1 - - 2 3 7f - 1 - - - - - - - - 1 1 6 9t - 1 - - - - - 1 1 - 1 3 9 16
2.5.2. Enrolments at the University of Malta by sex, age, year of study, faculty and course in part-time evening tertiary education...
Faculty/Course Year SexAge

35
18 19 20 21 22 23 24 25 26 27 28 29 30+ Total
Postgraduate Diploma in Education 1 m - - - - - - - - - - - 1 9 10
(Administration and Management) f - - - - - - - - - 2 1 1 15 19
2 m - - - - - - - - - - 1 5 27 33
f - - - - - - - - - - 5 6 36 47
Total m - - - - - - - - - - 1 6 36 43
f - - - - - - - - - 2 6 7 51 66
t - - - - - - - - - 2 7 13 87 109
Postgraduate Diploma in Lifelong Career Guidance 1 m - - - - - - 1 1 - - - - 2 4
and Development f - - - - - 1 2 - 3 - 2 1 5 14
t - - - - - 1 3 1 3 - 2 1 7 18
Postgraduate Diploma in Translation 1 m - - - 2 1 - - - 1 - 1 - 2 7
f - - - 3 2 - - 1 - - - - 4 10
2 m - - - - - - - - 1 - - - 6 7
f - - - - - 2 - 1 1 - 2 1 11 18
Total m - - - 2 1 - - - 2 - 1 - 8 14
f - - - 3 2 2 - 2 1 - 2 1 15 28
t - - - 5 3 2 - 2 3 - 3 1 23 42
Master in Translation and Interpreting 1 m - - - - - - - - - - - 1 7 8
f - - - - - 2 1 1 - 2 3 1 15 25
t - - - - - 2 1 1 - 2 3 2 22 33
Master of Arts in Comparative Euro-Med Educational 1 m - - - - - - 1 - - - - - 2 3
Studies f - - - - - - - - - - 2 - 6 8
t - - - - - - 1 - - - 2 - 8 11
Pre-Tertiary Faculty Certificate in Youth Ministry 1 m - - - - - - - - - - - - 2 2
f - - 1 - - - - - - - - - - 1
t - - 1 - - - - - - - - - 2 3
… 2.5.2. Enrolments at the University of Malta by sex, age, year of study, faculty and course in part-time evening tertiary education
Faculty/Course Year SexAge

36
18 19 20 21 22 23 24 25 26 27 28 29 30+ Total
Master of Education 2 m - - - - - - - 1 2 - - 3 9 15
f - - - - - - - 5 4 3 1 - 6 19
3 m - - - - - - - - - - - - 1 1
f - - - - - - - - - - - - 2 2
4 m - - - - - - - - - - 1 - 4 5
f - - - - - - - - - 2 2 - 6 10
5 m - - - - - - - - - - - - 3 3
f - - - - - - - - - - - - 4 4
6 m - - - - - - - - - - - - 1 1
f - - - - - - - - - - - - 4 4
7 m - - - - - - - - - - - - - -
f - - - - - - - - - - - - 2 2
Total m - - - - - - - 1 2 - 1 3 18 25
f - - - - - - - 5 4 5 3 - 24 41
t - - - - - - - 6 6 5 4 3 42 66
Master of Philosophy in Education 3 m - - - - - - - - - - - - 1 1
f - - - - - - - - - - - - - -
t - - - - - - - - - - - - 1 1
Doctor of Philosophy in Education 1 m - - - - - - - - - - - - 1 1
f - - - - - - - - - - - - - -
4 m - - - - - - - - - - - - - -
f - - - - - - - - - - - - 1 1
8 m - - - - - - - - - - - - 1 1
f - - - - - - - - - - - - - -
Total m - - - - - - - - - - - - 2 2
f - - - - - - - - - - - - 1 1
t - - - - - - - - - - - - 3 3
Total by faculty m 1 - 2 3 4 - 5 6 9 7 8 16 127 188
f - 1 1 6 8 12 13 19 20 14 24 18 232 368
t 1 1 3 9 12 12 18 25 29 21 32 34 359 556
… 2.5.2. Enrolments at the University of Malta by sex, age, year of study, faculty and course in part-time evening tertiary education
Faculty/Course Year SexAge

37
18 19 20 21 22 23 24 25 26 27 28 29 30+ Total
Institute for Physical Education and SportDiploma in Sport and Leisure Studies 2 m - - - - 1 - - - - - 2 - 5 8
f - - - - - - 1 1 - - 1 - 4 7t - - - - 1 - 1 1 - - 3 - 9 15
Pre-Tertiary Certificate: Foundations in Coaching 1 m - - - - - 1 - - - 1 - - 5 7f - - - - 1 - - - 1 - - - 1 3t - - - - 1 1 - - 1 1 - - 6 10
Total by faculty m - - - - 1 1 - - - 1 2 - 10 15f - - - - 1 - 1 1 1 - 1 - 5 10t - - - - 2 1 1 1 1 1 3 - 15 25
Faculty of TheologyBachelor of Arts in Religious Studies 4 m - - - - - - 1 - 1 1 - - 4 7
f - - - - - - - - - 1 - - 8 95 m - - - - - - - - - 1 1 - 5 7
f - - - - - - - - - - - - 13 13Total m - - - - - - 1 - 1 2 1 - 9 14
f - - - - - - - - - 1 - - 21 22t - - - - - - 1 - 1 3 1 - 30 36
Bachelor of Arts (Honours) in Theology 1 m - - - - - - - - - - 1 - 3 4f - - - - - 1 - - - - - - 9 10
2 m - - - - - - - - - 1 - - 3 4f - - - - - - - - - - - - 3 3
3 m - - - - - - 1 - 1 - - - 1 3f - - - - - - - - - - 1 1 3 5
Total m - - - - - - 1 - 1 1 1 - 7 11f - - - - - 1 - - - - 1 1 15 18t - - - - - 1 1 - 1 1 2 1 22 29
Diploma in Religious Studies 1 m - - - - - - - - - - - - - -f - - - - - - - - - - - - 1 1
2 m - - - - - - - - - - - - 1 1f - - - - - - - - - - - - 1 1
Total m - - - - - - - - - - - - 1 1f - - - - - - - - - - - - 2 2t - - - - - - - - - - - - 3 3
… 2.5.2. Enrolments at the University of Malta by sex, age, year of study, faculty and course in part-time evening tertiary education
Faculty/Course Year SexAge

38
18 19 20 21 22 23 24 25 26 27 28 29 30+ Total
Doctor of Sacred Theology 4 m - - - - - - - - - - - - 1 1f - - - - - - - - - - - - - -
5 m - - - - - - - - - - - - 1 1f - - - - - - - - - - - - - -
7 m - - - - - - - - - - - - 1 1f - - - - - - - - - - - - - -
Total m - - - - - - - - - - - - 3 3f - - - - - - - - - - - - - -t - - - - - - - - - - - - 3 3
Master of Philosophy in Theology 2 m - - - - - - - - - - - - - -f - - - - - - - - - - - - 1 1
3 m - - - - - - - - - - - - 1 1f - - - - - - - - - - - - - -
Total m - - - - - - - - - - - - 1 1f - - - - - - - - - - - - 1 1t - - - - - - - - - - - - 2 2
Master of Arts in Theology 1 m - - - - - - - - - - - - 5 5f - - - - 1 - - - - - - - 7 8
2 m - - - - - - - 1 - 1 - - 7 9f - - - - - - - - - - 1 - 2 3
3 m - - - - - - - - - - - - 6 6f - - - - - - - 1 - 1 - - 4 6
Total m - - - - - - - 1 - 1 - - 18 20f - - - - 1 - - 1 - 1 1 - 13 17t - - - - 1 - - 2 - 2 1 - 31 37
Master of Arts in Theology and Human Studies 3 m - - - - - - - - - - - - 1 1f - - - - - - - - - - - - - -
4 m - - - - - - - - - - 1 - 1 2f - - - - - - - - - - - - 4 4
5 m - - - - - - - - - - - - 2 2f - - - - - - - - - - - - - -
8 m - - - - - - - - - - - - 1 1f - - - - - - - - - - - - - -
Total m - - - - - - - - - - 1 - 5 6f - - - - - - - - - - - - 4 4t - - - - - - - - - - 1 - 9 10
… 2.5.2. Enrolments at the University of Malta by sex, age, year of study, faculty and course in part-time evening tertiary education
Faculty/Course Year SexAge

39
18 19 20 21 22 23 24 25 26 27 28 29 30+ Total
Doctor of Philosophy in Theology 4 m - - - - - - - - - - - - 1 1f - - - - - - - - - - - - - -t - - - - - - - - - - - - 1 1
Total by faculty m - - - - - - 2 1 2 4 3 - 45 57f - - - - 1 1 - 1 - 2 2 1 56 64t - - - - 1 1 2 2 2 6 5 1 101 121
International Institute for Baroque StudiesMaster of Philosophy in Baroque Studies 4 m - - - - - - - - - - - - - -
f - - - - - - - - - - - - 1 1t - - - - - - - - - - - - 1 1
Faculty of ArtsBachelor of Arts 5 m - - - - - - - - - - - - - -
f - - - - - - - - - - - - 1 1t - - - - - - - - - - - - 1 1
Master of Arts 1 m - - - - 2 3 2 1 2 1 - 3 5 19f - - - 2 3 7 6 - 1 2 2 2 - 25
2 m - - - - 1 4 2 2 1 - 2 - 3 15f - - - - 8 4 1 - 1 - 4 - 4 22
3 m - - - - - 1 2 3 2 1 1 - 11 21f - - - - - 1 11 5 6 - - - 1 24
4 m - - - - - - - 1 - - - - 1 2f - - - - - - 1 1 - 2 - - 1 5
6 m - - - - - - - - - - - - - -f - - - - - - - - - - - - 1 1
Total m - - - - 3 8 6 7 5 2 3 3 20 57f - - - 2 11 12 19 6 8 4 6 2 7 77t - - - 2 14 20 25 13 13 6 9 5 27 134
Master of Philosophy in Art 1 m - - - - - - - - - - - 1 - 1f - - - - - - - - - - - - - -t - - - - - - - - - - - 1 - 1
Master of Philosophy in Classics 2 m - - - - - - - - - - - - 1 1f - - - - - - - - - - - - - -t - - - - - - - - - - - - 1 1
… 2.5.2. Enrolments at the University of Malta by sex, age, year of study, faculty and course in part-time evening tertiary education
Faculty/Course Year SexAge

40
18 19 20 21 22 23 24 25 26 27 28 29 30+ Total
Master of Philosophy in Music Studies 3 m - - - - - - - - 1 - - - - 1f - - - - - - - - - - - - 1 1
5 m - - - - - - - - - - - 1 - 1f - - - - - - - - - - - - - -
Total m - - - - - - - - 1 - - 1 - 2f - - - - - - - - - - - - 1 1t - - - - - - - - 1 - - 1 1 3
Master of Philosophy in Sociology 1 m - - - - - - - - - - - - 1 1f - - - - - - - - - - - 1 - 1t - - - - - - - - - - - 1 1 2
Master of Philosophy in Theatre Studies 1 m - - - - - - - - - - - - 1 1f - - - - - - - - - - - - - -t - - - - - - - - - - - - 1 1
Master of Philosophy in Maltese Studies 2 m - - - - - - - - - - - - 1 1f - - - - - - - - - - - - - -t - - - - - - - - - - - - 1 1
Master of Philosophy in Philosophy 1 m - - - - - - - - - - - - 1 1f - - - - - - - - - - - - - -
2 m - - - - - - - - - - - - 1 1f - - - - - - - - - - - - - -
4 m - - - - - - - - - - - - 1 1f - - - - - - - - - - - - - -
Total m - - - - - - - - - - - - 3 3f - - - - - - - - - - - - - -t - - - - - - - - - - - - 3 3
Master of Philosophy in English 1 m - - - - - - - - - - - - - -f - - - - - - - - 1 - - - - 1
2 m - - - - - - - - - - - - 1 1f - - - - - - - - - - - - 1 1
Total m - - - - - - - - - - - - 1 1f - - - - - - - - 1 - - - 1 2t - - - - - - - - 1 - - - 2 3
… 2.5.2. Enrolments at the University of Malta by sex, age, year of study, faculty and course in part-time evening tertiary education
Faculty/Course Year SexAge
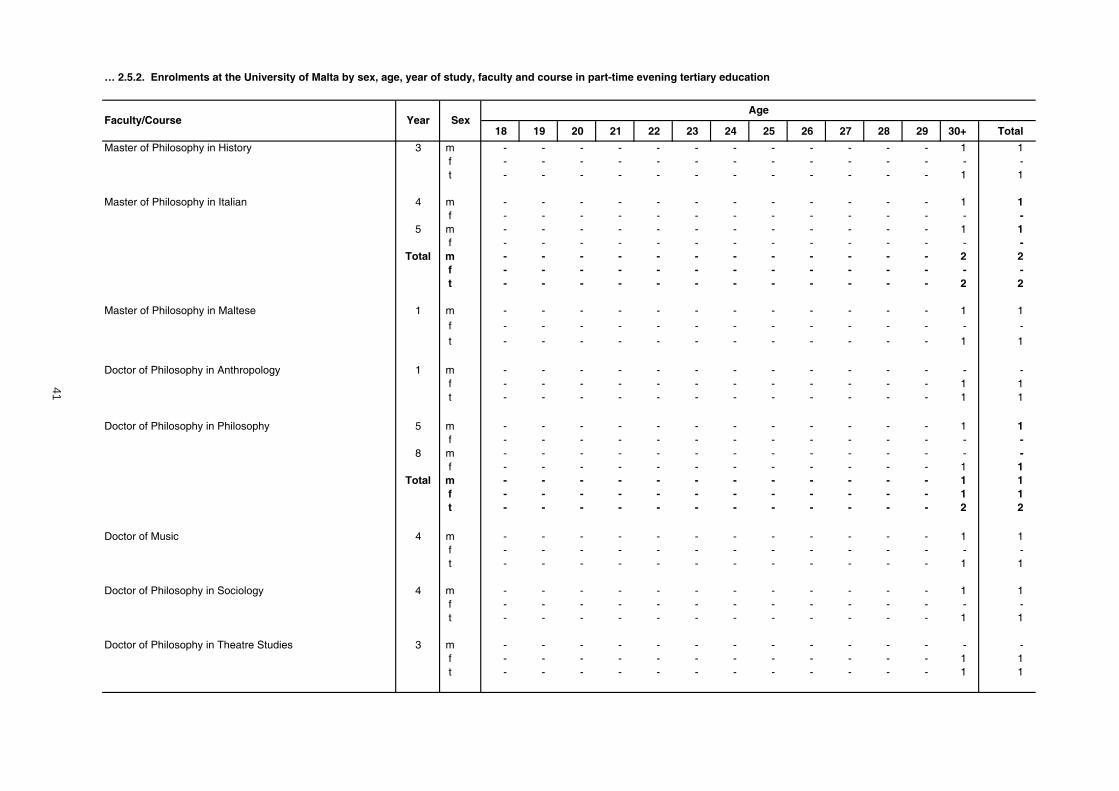
41
18 19 20 21 22 23 24 25 26 27 28 29 30+ Total
Master of Philosophy in History 3 m - - - - - - - - - - - - 1 1f - - - - - - - - - - - - - -t - - - - - - - - - - - - 1 1
Master of Philosophy in Italian 4 m - - - - - - - - - - - - 1 1f - - - - - - - - - - - - - -
5 m - - - - - - - - - - - - 1 1f - - - - - - - - - - - - - -
Total m - - - - - - - - - - - - 2 2f - - - - - - - - - - - - - -t - - - - - - - - - - - - 2 2
Master of Philosophy in Maltese 1 m - - - - - - - - - - - - 1 1f - - - - - - - - - - - - - -t - - - - - - - - - - - - 1 1
Doctor of Philosophy in Anthropology 1 m - - - - - - - - - - - - - -f - - - - - - - - - - - - 1 1t - - - - - - - - - - - - 1 1
Doctor of Philosophy in Philosophy 5 m - - - - - - - - - - - - 1 1f - - - - - - - - - - - - - -
8 m - - - - - - - - - - - - - -f - - - - - - - - - - - - 1 1
Total m - - - - - - - - - - - - 1 1f - - - - - - - - - - - - 1 1t - - - - - - - - - - - - 2 2
Doctor of Music 4 m - - - - - - - - - - - - 1 1f - - - - - - - - - - - - - -t - - - - - - - - - - - - 1 1
Doctor of Philosophy in Sociology 4 m - - - - - - - - - - - - 1 1f - - - - - - - - - - - - - -t - - - - - - - - - - - - 1 1
Doctor of Philosophy in Theatre Studies 3 m - - - - - - - - - - - - - -f - - - - - - - - - - - - 1 1t - - - - - - - - - - - - 1 1
… 2.5.2. Enrolments at the University of Malta by sex, age, year of study, faculty and course in part-time evening tertiary education
Faculty/Course Year SexAge

42
18 19 20 21 22 23 24 25 26 27 28 29 30+ Total
Doctor of Philosophy in Maltese 6 m - - - - - - - - - - - - 1 1f - - - - - - - - - - - - - -t - - - - - - - - - - - - 1 1
Doctor of Philosophy in English 7 m - - - - - - - - - - - - 1 1f - - - - - - - - - - - - - -t - - - - - - - - - - - - 1 1
Doctor of Philosophy in Italian 4 m - - - - - - - - - - - - 1 1f - - - - - - - - - - - - - -
5 m - - - - - - - - - - - - 1 1f - - - - - - - - - - - - - -
8 m - - - - - - - - - - - - - -f - - - - - - - - - - - - 2 2
Total m - - - - - - - - - - - - 2 2f - - - - - - - - - - - - 2 2t - - - - - - - - - - - - 4 4
Qualifying Programme for the Master of Arts 2 m - - - - - - - - - - - - 1 1f - - - - - - - - - - - - 2 2t - - - - - - - - - - - - 3 3
Master of Music 2 m - - - - - - - - - - - - - -f - - - - - - - - - - - - 1 1
3 m - - - - - - - - - - - - - -f - - - - - - - - - - - - 1 1
Total m - - - - - - - - - - - - - -f - - - - - - - - - - - - 2 2t - - - - - - - - - - - - 2 2
Total by faculty m - - - - 3 8 6 7 6 2 3 5 40 80f - - - 2 11 12 19 6 9 4 6 3 19 91t - - - 2 14 20 25 13 15 6 9 8 59 171
Institute of Forensic StudiesBachelor of Arts (Honours) in Criminology 5 m - - - - - - - - - - - 1 10 11
f - - - - - 1 - 1 - - - 1 - 3t - - - - - 1 - 1 - - - 2 10 14
… 2.5.2. Enrolments at the University of Malta by sex, age, year of study, faculty and course in part-time evening tertiary education
Faculty/Course Year SexAge
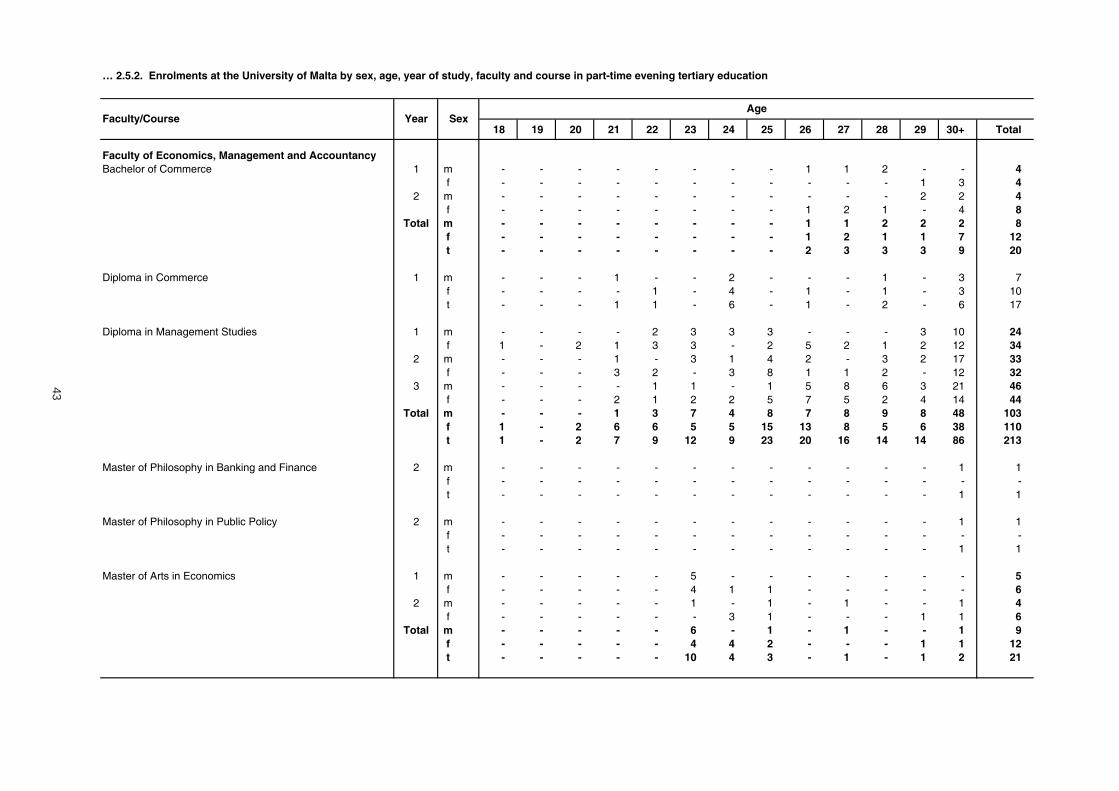
43
18 19 20 21 22 23 24 25 26 27 28 29 30+ Total
Faculty of Economics, Management and AccountancyBachelor of Commerce 1 m - - - - - - - - 1 1 2 - - 4
f - - - - - - - - - - - 1 3 42 m - - - - - - - - - - - 2 2 4
f - - - - - - - - 1 2 1 - 4 8Total m - - - - - - - - 1 1 2 2 2 8
f - - - - - - - - 1 2 1 1 7 12t - - - - - - - - 2 3 3 3 9 20
Diploma in Commerce 1 m - - - 1 - - 2 - - - 1 - 3 7f - - - - 1 - 4 - 1 - 1 - 3 10t - - - 1 1 - 6 - 1 - 2 - 6 17
Diploma in Management Studies 1 m - - - - 2 3 3 3 - - - 3 10 24f 1 - 2 1 3 3 - 2 5 2 1 2 12 34
2 m - - - 1 - 3 1 4 2 - 3 2 17 33f - - - 3 2 - 3 8 1 1 2 - 12 32
3 m - - - - 1 1 - 1 5 8 6 3 21 46f - - - 2 1 2 2 5 7 5 2 4 14 44
Total m - - - 1 3 7 4 8 7 8 9 8 48 103f 1 - 2 6 6 5 5 15 13 8 5 6 38 110t 1 - 2 7 9 12 9 23 20 16 14 14 86 213
Master of Philosophy in Banking and Finance 2 m - - - - - - - - - - - - 1 1f - - - - - - - - - - - - - -t - - - - - - - - - - - - 1 1
Master of Philosophy in Public Policy 2 m - - - - - - - - - - - - 1 1f - - - - - - - - - - - - - -t - - - - - - - - - - - - 1 1
Master of Arts in Economics 1 m - - - - - 5 - - - - - - - 5f - - - - - 4 1 1 - - - - - 6
2 m - - - - - 1 - 1 - 1 - - 1 4f - - - - - - 3 1 - - - 1 1 6
Total m - - - - - 6 - 1 - 1 - - 1 9f - - - - - 4 4 2 - - - 1 1 12t - - - - - 10 4 3 - 1 - 1 2 21
… 2.5.2. Enrolments at the University of Malta by sex, age, year of study, faculty and course in part-time evening tertiary education
Faculty/Course Year SexAge

44
18 19 20 21 22 23 24 25 26 27 28 29 30+ Total
Doctor of Philosophy in Economics 3 m - - - - - - - - - - - - - -f - - - - - - - - - - 1 - - 1
5 m - - - - - - - - - - - - 1 1f - - - - - - - - - - - - - -
Total m - - - - - - - - - - - - 1 1f - - - - - - - - - - 1 - - 1t - - - - - - - - - - 1 - 1 2
Doctor of Philosophy in Public Policy 2 m - - - - - - - - - - - - 1 1f - - - - - - - - - - - - - -
3 m - - - - - - - - - - - - 2 2f - - - - - - - - - - - - - -
4 m - - - - - - - - - - - - 1 1f - - - - - - - - - - - - - -
Total m - - - - - - - - - - - - 4 4f - - - - - - - - - - - - - -t - - - - - - - - - - - - 4 4
Doctor of Philosophy in Social Work 4 m - - - - - - - - - - - - - -f - - - - - - - - - - - - 1 1
5 m - - - - - - - - - - - - - -f - - - - - - - - - - - - 1 1
Total m - - - - - - - - - - - - - -f - - - - - - - - - - - - 2 2t - - - - - - - - - - - - 2 2
Executive Master in Business Administration 1 m - - - - 1 1 - - 1 2 1 2 6 14f - - - - 3 - 2 2 2 4 - 1 - 14
2 m - - - - - 3 1 1 5 3 1 1 12 27f - - - - 1 3 1 2 1 2 1 1 - 12
3 m - - - - - - 4 1 2 - 2 1 31 41f - - - - - - 1 4 - 2 1 - 4 12
Total m - - - - 1 4 5 2 8 5 4 4 49 82f - - - - 4 3 4 8 3 8 2 2 4 38t - - - - 5 7 9 10 11 13 6 6 53 120
… 2.5.2. Enrolments at the University of Malta by sex, age, year of study, faculty and course in part-time evening tertiary education
Faculty/Course Year SexAge
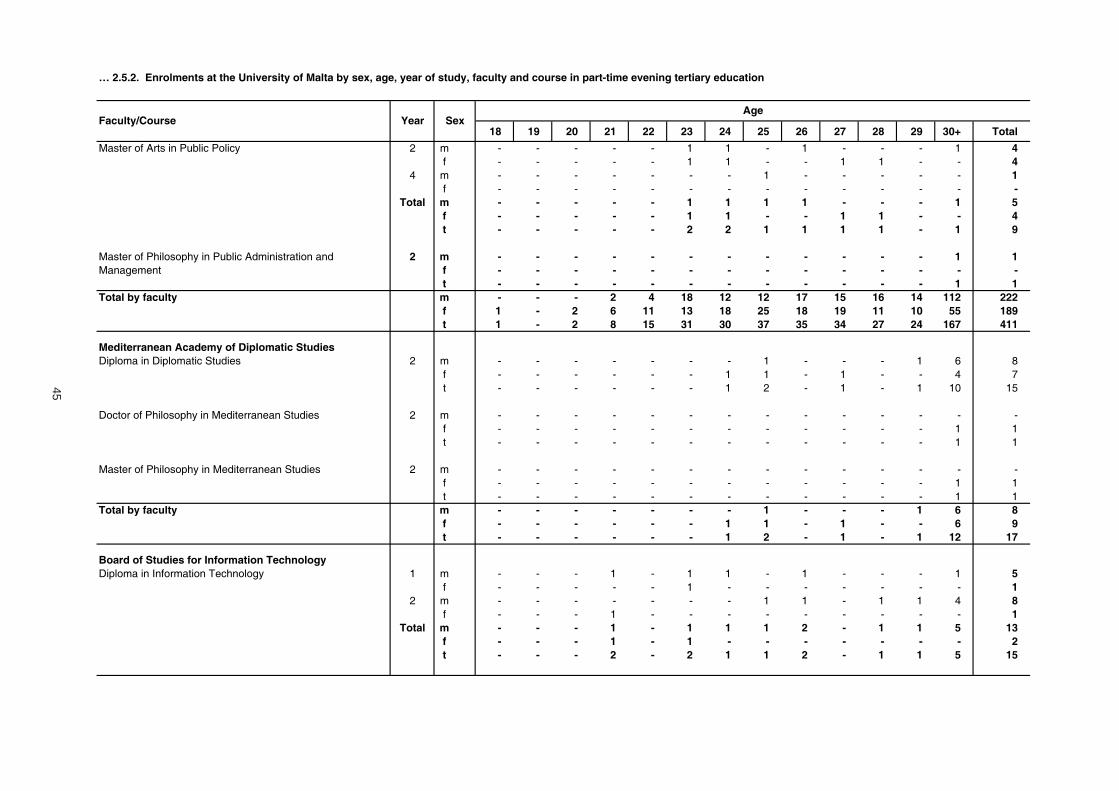
45
18 19 20 21 22 23 24 25 26 27 28 29 30+ Total
Master of Arts in Public Policy 2 m - - - - - 1 1 - 1 - - - 1 4f - - - - - 1 1 - - 1 1 - - 4
4 m - - - - - - - 1 - - - - - 1f - - - - - - - - - - - - - -
Total m - - - - - 1 1 1 1 - - - 1 5f - - - - - 1 1 - - 1 1 - - 4t - - - - - 2 2 1 1 1 1 - 1 9
Master of Philosophy in Public Administration and 2 m - - - - - - - - - - - - 1 1Management f - - - - - - - - - - - - - -
t - - - - - - - - - - - - 1 1Total by faculty m - - - 2 4 18 12 12 17 15 16 14 112 222
f 1 - 2 6 11 13 18 25 18 19 11 10 55 189t 1 - 2 8 15 31 30 37 35 34 27 24 167 411
Mediterranean Academy of Diplomatic StudiesDiploma in Diplomatic Studies 2 m - - - - - - - 1 - - - 1 6 8
f - - - - - - 1 1 - 1 - - 4 7t - - - - - - 1 2 - 1 - 1 10 15
Doctor of Philosophy in Mediterranean Studies 2 m - - - - - - - - - - - - - -f - - - - - - - - - - - - 1 1t - - - - - - - - - - - - 1 1
Master of Philosophy in Mediterranean Studies 2 m - - - - - - - - - - - - - -f - - - - - - - - - - - - 1 1t - - - - - - - - - - - - 1 1
Total by faculty m - - - - - - - 1 - - - 1 6 8f - - - - - - 1 1 - 1 - - 6 9t - - - - - - 1 2 - 1 - 1 12 17
Board of Studies for Information TechnologyDiploma in Information Technology 1 m - - - 1 - 1 1 - 1 - - - 1 5
f - - - - - 1 - - - - - - - 12 m - - - - - - - 1 1 - 1 1 4 8
f - - - 1 - - - - - - - - - 1Total m - - - 1 - 1 1 1 2 - 1 1 5 13
f - - - 1 - 1 - - - - - - - 2t - - - 2 - 2 1 1 2 - 1 1 5 15
… 2.5.2. Enrolments at the University of Malta by sex, age, year of study, faculty and course in part-time evening tertiary education
Faculty/Course Year SexAge

46
18 19 20 21 22 23 24 25 26 27 28 29 30+ Total
Master in Information Technology 1 m - - - 1 - - - - - - - - 7 8f - - - - - - - 1 - - - - 2 3t - - - 1 - - - 1 - - - - 9 11
Master of Philosophy in Computer Science 3 m - - - - - - - - - 1 - - - 1f - - - - - - - - - - - - - -t - - - - - - - - - 1 - - - 1
Doctor of Philosophy in Computer Science 3 m - - - - - - - - - 1 - - - 1f - - - - - - - - - - - - - -t - - - - - - - - - 1 - - - 1
Doctor of Philosophy in Computer Science 1 m - - - - - - - - - - - - 1 1and Artificial Intelligence f - - - - - - - - - - - - - -
t - - - - - - - - - - - - 1 1
Master of Philosophy in Computer Science 1 m - - - - 1 1 - - - - - - - 2and Artificial Intelligence f - - - - - - - - - - - - - -
t - - - - 1 1 - - - - - - - 2Total by faculty m - - - 2 1 2 1 1 2 2 1 1 13 26
f - - - 1 - 1 - 1 - - - - 2 5t - - - 3 1 3 1 2 2 2 1 1 15 31
Centre for Labour StudiesDiploma in Social Studies 2 m - - - - 1 - 1 1 - - - - 7 10
f - - - - - - 1 - 2 - 2 1 4 10t - - - - 1 - 2 1 2 - 2 1 11 20
Diploma in Lace Studies 1 m - - - - - - - - - - - - - -f - - - - - - 1 - - - - - 6 7t - - - - - - 1 - - - - - 6 7
Total by faculty m - - - - 1 - 1 1 - - - - 7 10f - - - - - - 2 - 2 - 2 1 10 17t - - - - 1 - 3 1 2 - 2 1 17 27
Institute of Conservation and Management of Cultural Heritage (Heritage Malta)Diploma in Water Operations Management 2 m - - - - - - - - 1 - 1 4 24 30
f - - - - - - - 1 - - - 1 9 11t - - - - - - - 1 1 - 1 5 33 41
… 2.5.2. Enrolments at the University of Malta by sex, age, year of study, faculty and course in part-time evening tertiary education
Faculty/Course Year SexAge
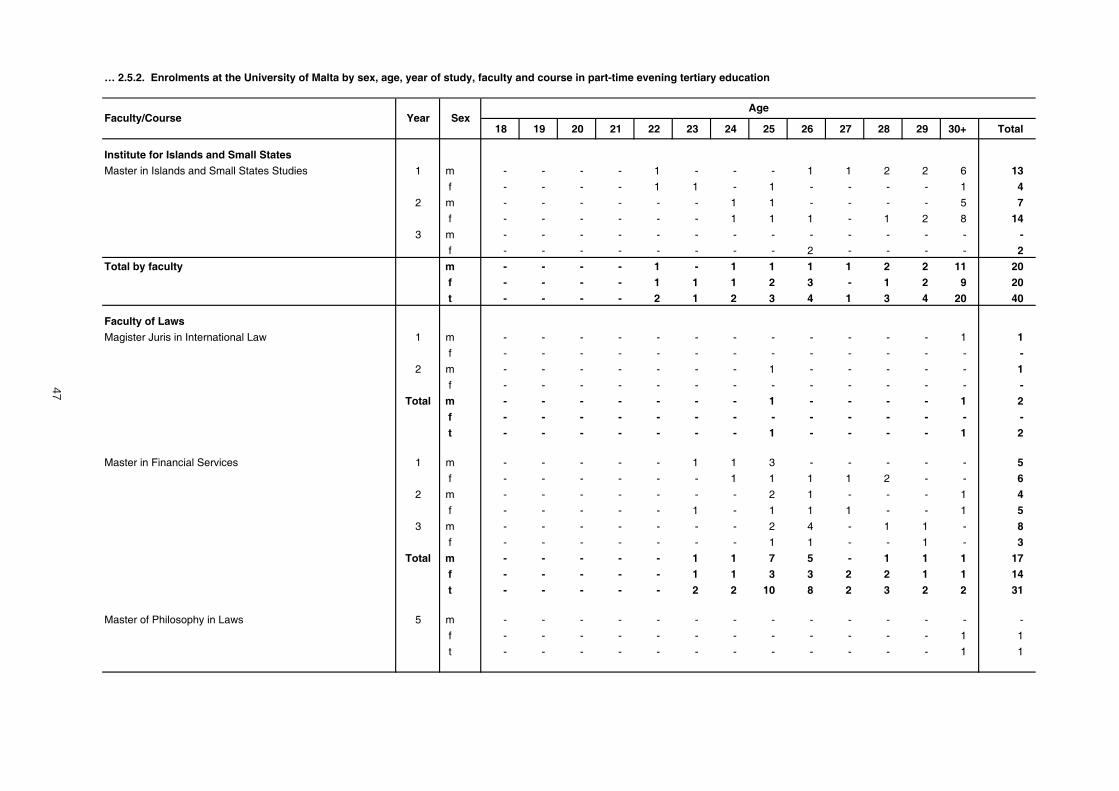
47
18 19 20 21 22 23 24 25 26 27 28 29 30+ Total
Institute for Islands and Small States
Master in Islands and Small States Studies 1 m - - - - 1 - - - 1 1 2 2 6 13
f - - - - 1 1 - 1 - - - - 1 4
2 m - - - - - - 1 1 - - - - 5 7
f - - - - - - 1 1 1 - 1 2 8 14
3 m - - - - - - - - - - - - - -
f - - - - - - - - 2 - - - - 2
Total by faculty m - - - - 1 - 1 1 1 1 2 2 11 20
f - - - - 1 1 1 2 3 - 1 2 9 20
t - - - - 2 1 2 3 4 1 3 4 20 40
Faculty of Laws
Magister Juris in International Law 1 m - - - - - - - - - - - - 1 1
f - - - - - - - - - - - - - -
2 m - - - - - - - 1 - - - - - 1
f - - - - - - - - - - - - - -
Total m - - - - - - - 1 - - - - 1 2
f - - - - - - - - - - - - - -
t - - - - - - - 1 - - - - 1 2
Master in Financial Services 1 m - - - - - 1 1 3 - - - - - 5
f - - - - - - 1 1 1 1 2 - - 6
2 m - - - - - - - 2 1 - - - 1 4
f - - - - - 1 - 1 1 1 - - 1 5
3 m - - - - - - - 2 4 - 1 1 - 8
f - - - - - - - 1 1 - - 1 - 3
Total m - - - - - 1 1 7 5 - 1 1 1 17
f - - - - - 1 1 3 3 2 2 1 1 14
t - - - - - 2 2 10 8 2 3 2 2 31
Master of Philosophy in Laws 5 m - - - - - - - - - - - - - -
f - - - - - - - - - - - - 1 1
t - - - - - - - - - - - - 1 1
… 2.5.2. Enrolments at the University of Malta by sex, age, year of study, faculty and course in part-time evening tertiary education
Faculty/Course Year SexAge

48
18 19 20 21 22 23 24 25 26 27 28 29 30+ Total
Doctor of Philosophy in Laws 4 m - - - - - - - - - - - - 2 2
f - - - - - - - - - - - - - -
8 m - - - - - - - - - - - - 1 1
f - - - - - - - - - - - - - -
Total m - - - - - - - - - - - - 3 3
f - - - - - - - - - - - - - -
t - - - - - - - - - - - - 3 3
Total by faculty m - - - - - 1 1 8 5 - 1 1 5 22
f - - - - - 1 1 3 3 2 2 1 2 15
t - - - - - 2 2 11 8 2 3 2 7 37
European Centre for Gerontology
Master of Gerontology and Geriatrics 1 m - - - - - - - - - - - - - -
f - - - - - - - - - - - - 2 2
3 m - - - - - - - - - - - - - -
f - - - - - - - - - - - - 1 1
Total by faculty m - - - - - - - - - - - - - -
f - - - - - - - - - - - - 3 3
t - - - - - - - - - - - - 3 3
Faculty of Medicine and Surgery
Master of Science in Medicine and Surgery 1 m - - - - - - - - - 1 - - - 1
f - - - - - 2 - - 1 1 - - 2 6
2 m - - - - - - - - - - - - - -
f - - - - - - - - - - - - 1 1
4 m - - - - - - - - - - - - - -
f - - - - - - - - - - 1 - - 1
Total m - - - - - - - - - 1 - - - 1
f - - - - - 2 - - 1 1 1 - 3 8
t - - - - - 2 - - 1 2 1 - 3 9
Master of Philosophy in Medicine 2 m - - - - - - - - - - - - 1 1
f - - - - - - - - - - - - - -
t - - - - - - - - - - - - 1 1
… 2.5.2. Enrolments at the University of Malta by sex, age, year of study, faculty and course in part-time evening tertiary education
Faculty/Course Year SexAge

49
18 19 20 21 22 23 24 25 26 27 28 29 30+ Total
Master of Philosophy in Pharmacy 1 m - - - - - - - - - - - - 1 1
f - - - - - - - 1 1 - - - - 2
t - - - - - - - 1 1 - - - 1 3
Master of Philosophy in Surgery 3 m - - - - - - - - - - - - 1 1f - - - - - - - - 1 - - - - 1t - - - - - - - - 1 - - - 1 2
Total by faculty m - - - - - - - - - 1 - - 3 4f - - - - - 2 - 1 3 1 1 - 3 11t - - - - - 2 - 1 3 2 1 - 6 15
Institute of AgricultureMaster of Science in Agricultural and Veterinary Pharmacy 2 m - - - - - - - 1 - - - - - 1
f - - - - - - - - - - - - - -t - - - - - - - 1 - - - - - 1
Master of Science in Agricultural Sciences 2 m - - - - - - - - - - - - 1 1f - - - - - - - - - - - - - -
3 m - - - - - - - - - - - - 2 2f - - - - - - - - - - - - - -
Total m - - - - - - - - - - - - 3 3f - - - - - - - - - - - - - -t - - - - - - - - - - - - 3 3
Master of Philosophy in Agriculture 1 m - - - - - - - - - - - - - -f - - - - - - - - - - - - 1 1t - - - - - - - - - - - - 1 1
Total by faculty m - - - - - - - 1 - - - - 3 4f - - - - - - - - - - - - 1 1t - - - - - - - 1 - - - - 4 5
Faculty of Dental SurgeryMaster of Philosophy in Dental Surgery 4 m - - - - - - - - - - - - - -
f - - - - - - - - - - - - 1 1t - - - - - - - - - - - - 1 1
Doctor of Philosophy in Dental Surgery 4 m - - - - - - - - - - - - - -f - - - - - - - - - - - - 1 1t - - - - - - - - - - - - 1 1
Total by faculty m - - - - - - - - - - - - - -f - - - - - - - - - - - - 2 2t - - - - - - - - - - - - 2 2
… 2.5.2. Enrolments at the University of Malta by sex, age, year of study, faculty and course in part-time evening tertiary education
Faculty/Course Year SexAge

50
18 19 20 21 22 23 24 25 26 27 28 29 30+ Total
Faculty of Engineering
Master of Philosophy in Engineering 1 m - - - - - 1 - - - - - 1 - 2
f - - - - - - - 1 - - - - - 1
2 m - - - - - 2 - - 1 - - - 2 5
f - - - - - - - 1 1 - - - - 2
4 m - - - - - - - - - 1 - - 1 2
f - - - - - - - - - - - - - -
Total m - - - - - 3 - - 1 1 - 1 3 9
f - - - - - - - 2 1 - - - - 3
t - - - - - 3 - 2 2 1 - 1 3 12
Master of Science in Engineering 1 m - - - - - 1 - - 1 - - - 1 3
f - - - - - - 1 - - - - - - 1
2 m - - - - - - - 4 - - - - - 4
f - - - - - - - - 1 - - - - 1
3 m - - - - - - 1 1 1 1 1 1 3 9
f - - - - - - - - - - - - - -
Total m - - - - - 1 1 5 2 1 1 1 4 16
f - - - - - - 1 - 1 - - - - 2
t - - - - - 1 2 5 3 1 1 1 4 18
Doctor of Philosophy in Engineering 5 m - - - - - - - - - 1 - - 1 2
f - - - - - - - - - - - - - -
t - - - - - - - - - 1 - - 1 2
Total by faculty m - - - - - 4 1 5 3 3 1 2 8 27
f - - - - - - 1 2 2 - - - - 5
t - - - - - 4 2 7 5 3 1 2 8 32
Faculty of Architecture and Civil Engineering
Ph D in Architecture and Civil Engineering 6 m - - - - - - - - - - - - 1 1
f - - - - - - - - - - - - - -
t - - - - - - - - - - - - 1 1
… 2.5.2. Enrolments at the University of Malta by sex, age, year of study, faculty and course in part-time evening tertiary education
Faculty/Course Year SexAge

51
18 19 20 21 22 23 24 25 26 27 28 29 30+ Total
Institute of Linguistics
Master of Arts in Linguistics 2 m - - - - - - - - - - - - - -
f - - - - - - - - - - - - 2 2
3 m - - - - - - - - - - - - - -
f - - - - - - - - - 1 - - - 1
5 m - - - - - - - - - - - - - -
f - - - - - - - - - - - - 1 1
Total m - - - - - - - - - - - - - -
f - - - - - - - - - 1 - - 3 4
t - - - - - - - - - 1 - - 3 4
Doctor of Philosophy in Linguistics 4 m - - - - - - - - - - - - 1 1
f - - - - - - - - - - - - - -
8 m - - - - - - - - - - - - - -
f - - - - - - - - - - - - 1 1
Total m - - - - - - - - - - - - 1 1
f - - - - - - - - - - - - 1 1
t - - - - - - - - - - - - 2 2
Total by faculty m - - - - - - - - - - - - 1 1
f - - - - - - - - - 1 - - 4 5
t - - - - - - - - - 1 - - 5 6
Institute of Health Care
Doctor of Philosophy in Public Health 4 m - - - - - - - - - - - - - -
f - - - - - - - - - - - - 1 1
t - - - - - - - - - - - - 1 1
Doctor of Philosophy in Obstetrics and Gynaecology 8 m - - - - - - - - - - - - 1 1
f - - - - - - - - - - - - - -
t - - - - - - - - - - - - 1 1
… 2.5.2. Enrolments at the University of Malta by sex, age, year of study, faculty and course in part-time evening tertiary education
Faculty/Course Year SexAge

52
18 19 20 21 22 23 24 25 26 27 28 29 30+ Total
Doctor of Philosophy in Pathology 3 m - - - - - - - - - - - - 2 2
f - - - - - - - - - - - - - -
4 m - - - - - - - - - - - - 1 1
f - - - - - - - - - - - - - -
Total m - - - - - - - - - - - - 3 3
f - - - - - - - - - - - - - -
t - - - - - - - - - - - - 3 3
Doctor of Philosophy in Clinical Pharmacology 4 m - - - - - - - - - - - - - -f - - - - - - - - - - - - 1 1t - - - - - - - - - - - - 1 1
Total by faculty m - - - - - - - - - - - - 4 4f - - - - - - - - - - - - 2 2t - - - - - - - - - - - - 6 6
Faculty of Science Master of Philosophy in Biology 2 m - - - - - - 1 - - - - - - 1
f - - - - - - - - - - - - 2 2t - - - - - - 1 - - - - - 2 3
Doctor of Philosophy in Biology 5 m - - - - - - - - - 1 - - - 1f - - - - - - - - - - - - 2 2t - - - - - - - - - 1 - - 2 3
Postgraduate Diploma in Applied Chemistry 1 m - - - - - - 1 - - 1 - - 4 6f - - - - - - - 1 - - - - 1 2t - - - - - - 1 1 - 1 - - 5 8
Master of Science 1 m - - - - 1 1 2 2 1 1 - - 2 10f - - - - - 1 - - - 1 - - 2 4
2 m - - - - - - 3 4 - 2 1 2 1 13f - - - - - 3 3 2 1 1 - - - 10
3 m - - - - - - 2 1 - 1 - - 1 5f - - - - - - - - 1 - 1 - - 2
4 m - - - - - - - - - - - 1 - 1f - - - - - - - 2 2 - - - - 4
7 m - - - - - - - - - - - - - -f - - - - - - - - - - - - 1 1
Total m - - - - 1 1 7 7 1 4 1 3 4 29f - - - - - 4 3 4 4 2 1 - 3 21t - - - - 1 5 10 11 5 6 2 3 7 50
… 2.5.2. Enrolments at the University of Malta by sex, age, year of study, faculty and course in part-time evening tertiary education
Faculty/Course Year SexAge

53
18 19 20 21 22 23 24 25 26 27 28 29 30+ Total
Master of Science in Integrated Product Development 1 m - - - - 2 1 4 - 1 1 1 1 6 17
f - - - - - - - - - - - 1 - 1
t - - - - 2 1 4 - 1 1 1 2 6 18
Docotor of Philosophy in Physics 5 m - - - - - - - - - - - - 1 1
f - - - - - - - - - - - - - -
t - - - - - - - - - - - - 1 1
Docotor of Philosophy in Physiology and Biochemistry 1 m - - - - - - - - - - - - 1 1
f - - - - - - - - - - - - - -
t - - - - - - - - - - - - 1 1
Total by faculty m - - - - 3 2 13 7 2 7 2 4 16 56
f - - - - - 4 3 5 4 2 1 1 8 28
t - - - - 3 6 16 12 6 9 3 5 24 84
Part-time evening total m 1 - 2 7 18 36 43 51 48 43 40 51 446 786
f 1 1 3 15 33 48 60 69 65 46 51 39 429 860
t 2 1 5 22 51 84 103 120 113 89 91 90 875 1,646
… 2.5.2. Enrolments at the University of Malta by sex, age, year of study, faculty and course in part-time evening tertiary education
Faculty/Course Year SexAge

54
18 19 20 21 22 23 24 25 26 27 28 29 30+ Total
Faculty of Economics, Management and AccountancyDiploma in Public Administration 2 m - - - - - - 1 - - 1 1 1 34 38
f - - 1 - 1 3 3 - 1 - - - 25 34t - - 1 - 1 3 4 - 1 1 1 1 59 72
Bachelor of Arts (Honours) Social Work / 4 m - - - - - - - - - - - - - -Social Administration f - - - - - - - - - - - - 2 2
t - - - - - - - - - - - - 2 2
Bachelor of Arts (Honours) in Social Policy / 1 m - - - - - - - - - - - 1 1 2Social Work f - - - - - - - - - - - 1 5 6
2 m - - - - - 1 - - - - - - 1 2f - - - - 2 - - - - - - - 8 1-
Total m - - - - - 1 - - - - - 1 2 4f - - - - 2 - - - - - - 1 13 16t - - - - 2 1 - - - - - 2 15 20
Total by faculty m - - - - - 1 1 - - 1 1 2 36 42f - - 1 - 3 3 3 - 1 - - 1 40 52t - - 1 - 3 4 4 - 1 1 1 3 76 94
Faculty of EducationPostgraduate Diploma in Educuation 2 m - - - - - - - - 1 - - - 5 6(Inclusion and Individual Educational Needs in Primary School) f - - - - - - - 1 1 1 1 - 20 24Total by faculty t - - - - - - - 1 2 1 1 - 25 30
Institute of Health CareBachelor of Science (Honours) Health Science 2 m - - - - - - 1 - - - - - 1 2
f - - - - - - - - - - - - - -3 m - 1 3 1 - 2 - - - 1 - - 10 18
f - 3 2 2 - 1 1 1 - - - 1 23 344 m - - 1 - 3 1 - - - - - - 5 10
f - - 1 - 2 - - - - - - - 3 6Total m - 1 4 1 3 3 1 - - 1 - - 16 30
f - 3 3 2 2 1 1 1 - - - 1 26 40t - 4 7 3 5 4 2 1 - 1 - 1 42 70
Postgraduate Diploma in Health Science 1 m - - 1 - - - - - - 1 - - 2 4f - - 2 1 1 1 - - 2 2 - - 11 20
2 m - - - 1 - - - - 2 - - - 19 22f - - - - - - - - - - - - 20 20
Total m - - 1 1 - - - - 2 1 - - 21 26f - - 2 1 1 1 - - 2 2 - - 31 40t - - 3 2 1 1 - - 4 3 - - 52 66
2.5.3 Enrolments at the University of Malta by sex, age, year of study, faculty and course in part-time day tertiary education…
AgeYear SexFaculty/Course

55
18 19 20 21 22 23 24 25 26 27 28 29 30+ Total
Bachelor of Science (Honours) in Nursing/Midwifery 4 m - - - - - - 2 - - - - - 2 4f - - - - 1 1 2 - 2 - - - 12 18t - - - - 1 1 4 - 2 - - - 14 22
Bachelor of Science in Health Science 4 m - - - - - - - - - 1 - - 1 2f - - - - - - - - - - - - - -t - - - - - - - - - 1 - - 1 2
Master of Health Science 1 m - - - - - - - 1 - - - 1 10 12f - - - - - - 1 1 - - 1 - 15 18
2 m - - - - - - - - - - - - 2 2f - - - - 3 1 - 1 1 - 1 - 23 30
Total m - - - - - - - 1 - - - 1 12 14f - - - - 3 1 1 2 1 - 2 - 38 48t - - - - 3 1 1 3 1 - 2 1 50 62
Total by faculty m - 1 5 2 3 3 3 1 2 3 - 1 52 76f - 3 5 3 7 4 4 3 5 2 2 1 107 146t - 4 10 5 10 7 7 4 7 5 2 2 159 222
Faculty of ArtsDiploma in Arabic 2 m - - - - - 1 1 - - - - - 30 32
f - - - - - - - 1 - 1 2 - 24 28t - - - - - 1 1 1 - 1 2 - 54 60
Qualifying Programme for the Master of Arts 1 m 1 - - - - - - - - - - - 1 2f - 1 - - - - - - - - - - 1 2t 1 1 - - - - - - - - - - 2 4
Master of Arts in Creativity and Innovation 1 m - - - - - - - 2 - - - 1 5 8f - - - 1 1 1 - 1 1 - - - 7 12
2 m - - 1 - - - - - - - - 1 6 8f - - - - 1 - - - - - 1 - 8 10
Total m - - 1 - - - - 2 - - - 2 11 16f - - - 1 2 1 - 1 1 - 1 - 15 22t - - 1 1 2 1 - 3 1 - 1 2 26 38
Total by faculty m 1 - 1 - - 1 1 2 - - - 2 42 50f - 1 - 1 2 1 - 2 1 1 3 - 40 52t 1 1 1 1 2 2 1 4 1 1 3 2 82 102
International Institute for Baroque StudiesDiploma in Baroque Architecture 2 m - - - - 1 - - - 4 1 - - 26 32
f - - - - - - - - - - - - - -t - - - - 1 - - - 4 1 - - 26 32
… 2.5.3. Enrolments at the University of Malta by sex, age, year of study, faculty and course in part-time day tertiary education
Faculty/Course Year SexAge

56
18 19 20 21 22 23 24 25 26 27 28 29 30+ Total
Master in Baroque Studies 1 m - - - - - - - 1 - - - - 1 2f - 1 1 - - 1 - - - - - - 3 6
2 m - - - - - - - - - - - - 2 2f - - - - - - - - - - - - 2 2
Total m - - - - - - - 1 - - - - 3 4f - 1 1 - - 1 - - - - - - 5 8t - 1 1 - - 1 - 1 - - - - 8 12
Total by faculty m - - - - 1 - - 1 4 1 - - 29 36f - 1 1 - - 1 - - - - - - 5 8t - 1 1 - 1 1 - 1 4 1 - - 34 44
Centre for Labour StudiesDiploma in Social Studies 2 m - - - - 3 2 - - 1 - 1 1 52 60
f - - 2 1 - 5 3 2 2 1 2 - 40 58Total by faculty t - - 2 1 3 7 3 2 3 1 3 1 92 118
Faculty of LawsDoctor of Laws (Qual) 1 m 1 - - - - - - - - - - - 3 4
f - - - - - - - - - - - - 2 2t 1 - - - - - - - - - - - 5 6
Magister Juris in European and Comparative Law 1 m - - 1 2 - - - - - - - - 3 6f - - 1 - - - - - - - - - 1 2
2 m - - - 3 1 - 1 - - - - 1 12 18f - - - - 3 2 2 - - - - - 7 14
Total m - - 1 5 1 - 1 - - - - 1 15 24f - - 1 - 3 2 2 - - - - - 8 16t - - 2 5 4 2 3 - - - - 1 23 40
Master of Arts in European Studies 1 m - - 1 1 - - - 1 - - - - 3 6f - - - - - - - 1 - - - - 1 2
2 m - - - - 1 1 - - 1 - - - 7 10f - - - - 1 - - 1 - - - - 6 8
Total m - - 1 1 1 1 - 1 1 - - - 10 16f - - - - 1 - - 2 - - - - 7 10t - - 1 1 2 1 - 3 1 - - - 17 26
Total by faculty m 1 - 2 6 2 1 1 1 1 - - 1 28 44f - - 1 - 4 2 2 2 - - - - 17 28t 1 - 3 6 6 3 3 3 1 - - 1 45 72
… 2.5.3. Enrolments at the University of Malta by sex, age, year of study, faculty and course in part-time day tertiary education
Faculty/Course Year SexAge
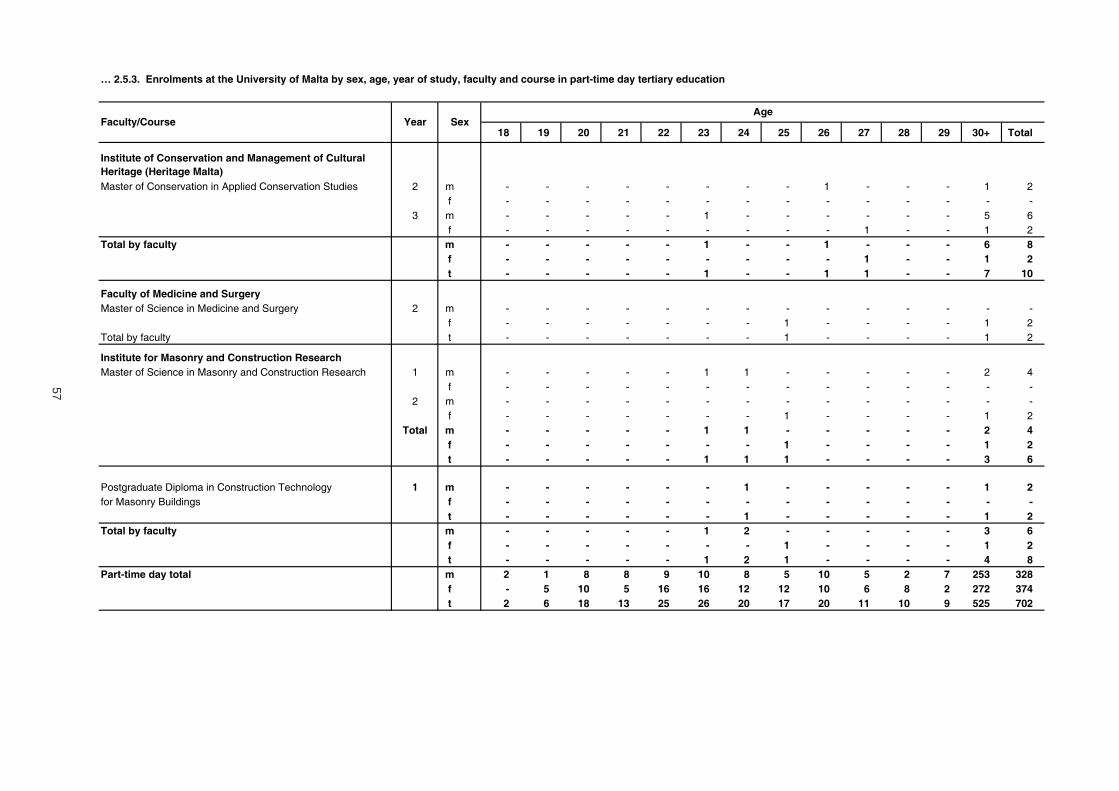
57
18 19 20 21 22 23 24 25 26 27 28 29 30+ Total
Institute of Conservation and Management of Cultural Heritage (Heritage Malta)Master of Conservation in Applied Conservation Studies 2 m - - - - - - - - 1 - - - 1 2
f - - - - - - - - - - - - - -3 m - - - - - 1 - - - - - - 5 6
f - - - - - - - - - 1 - - 1 2Total by faculty m - - - - - 1 - - 1 - - - 6 8
f - - - - - - - - - 1 - - 1 2t - - - - - 1 - - 1 1 - - 7 10
Faculty of Medicine and SurgeryMaster of Science in Medicine and Surgery 2 m - - - - - - - - - - - - - -
f - - - - - - - 1 - - - - 1 2Total by faculty t - - - - - - - 1 - - - - 1 2
Institute for Masonry and Construction ResearchMaster of Science in Masonry and Construction Research 1 m - - - - - 1 1 - - - - - 2 4
f - - - - - - - - - - - - - -2 m - - - - - - - - - - - - - -
f - - - - - - - 1 - - - - 1 2Total m - - - - - 1 1 - - - - - 2 4
f - - - - - - - 1 - - - - 1 2t - - - - - 1 1 1 - - - - 3 6
Postgraduate Diploma in Construction Technology 1 m - - - - - - 1 - - - - - 1 2for Masonry Buildings f - - - - - - - - - - - - - -
t - - - - - - 1 - - - - - 1 2Total by faculty m - - - - - 1 2 - - - - - 3 6
f - - - - - - - 1 - - - - 1 2t - - - - - 1 2 1 - - - - 4 8
Part-time day total m 2 1 8 8 9 10 8 5 10 5 2 7 253 328f - 5 10 5 16 16 12 12 10 6 8 2 272 374t 2 6 18 13 25 26 20 17 20 11 10 9 525 702
… 2.5.3. Enrolments at the University of Malta by sex, age, year of study, faculty and course in part-time day tertiary education
Faculty/Course Year SexAge

58
Males Females Total Males Females Total Males Females Total Males Females Total
Total: All fields of education 3,255 4,453 7,653 537 613 1,205 41 23 64 3,833 5,089 8,922
Education (ISC 14) 184 605 789 9 85 94 2 1 3 195 691 886
Teacher training (ISC 141) 139 486 625 - 85 85 - - - 139 571 710
Education science (ISC 142) 45 119 164 9 n 9 2 1 3 56 120 176
Humanities and Arts 421 589 1,010 130 87 217 13 8 21 564 684 1,248
Arts (ISC21) 178 309 487 32 7 39 1 2 3 211 318 529
Humanities (ISC22) 243 280 523 98 80 178 12 6 18 353 366 719
Social sciences, business and law 1,271 1,713 2,984 166 172 338 10 3 13 1,447 1,888 3,335
Social and behavioural science (ISC31) 196 373 569 - - - 2 3 5 198 376 574
Journalism and information (ISC32) 90 149 239 10 10 20 n n - 100 159 259
Business and administration (ISC34) 647 737 1,384 148 154 302 5 - 5 800 891 1,691
Law (ISC38) 338 454 792 8 8 16 3 - 3 349 462 811
Science 450 261 711 19 4 23 8 6 14 477 271 748
Life sciences (ISC42) 53 35 88 - - - 4 6 10 57 41 98
Physical sciences (ISC44) 29 15 44 - - - 2 - 2 31 15 46
Mathematics and statistics (ISC46) 115 132 247 - - - n - - 115 132 247
Computing (ISC48) 253 79 332 19 4 23 2 - 2 274 83 357
Engineering, manufacturing and construction 478 198 676 - - - 4 - 4 482 198 680
Engineering and engineering trades (ISC52) 340 85 425 - - - 3 - 3 343 85 428
Architecture and building (ISC58) 138 113 251 - - - 1 - 1 139 113 252
Agriculture 4 1 5 10 2 12 - - - 14 3 17
Agriculture, forestry and fishery (ISC62) 3 1 4 10 2 12 - - - 13 3 16
Veterinary (ISC64) 1 - 1 - - - - - - 1 - 1
Health and welfare 435 997 1,432 132 242 374 4 5 9 571 1,244 1,815
Health (ISC72) 364 748 1,112 62 174 236 4 3 7 430 925 1,355
Social services (ISC76) 71 249 320 70 68 138 - 2 2 141 319 460
Services 38 89 127 45 21 66 - - - 83 110 193
Personal services (ISC81) 30 87 117 15 10 25 - - - 45 97 142
Environmental protection (ISC85) 8 2 10 30 11 41 - - - 38 13 51
2.6. Enrolments at the University of Malta by sex, age, faculty and field of study
ISCED 5A ISCED 5B ISCED 6Total All Tertiary
(ISCED 5+6)

59
Males Females Total Males Females Total Males Females Total Males Females Total
Pre-Primary 2,737 2,423 5,160 605 710 1,315 957 829 1,786 4,299 3,962 8,261
Primary 9,553 8,234 17,787 2,960 4,271 7,231 2,356 1,548 3,904 14,869 14,053 28,922
Secondary 8,621 9,091 17,712 4,207 3,476 7,683 1,348 1,045 2,393 14,176 13,612 27,788
Post-Secondary General 2,097 2,783 4,880 331 315 646 26 19 45 2,454 3,117 5,571
Post-Secondary Vocational 4,190 2,210 6,400 - - - - - - 4,190 2,210 6,400
MCAST Full-Time 2,427 1,309 3,736 - - - - - - 2,427 1,309 3,736
Part-Time 1,288 581 1,869 - - - - - - 1,288 581 1,869
ITS Full-Time 322 256 578 - - - - - - 322 256 578
Part-Time 153 64 217 - - - - - - 153 64 217
Tertiary Education 3,833 5,089 8,922 - - - - - - 3,833 5,089 8,922
Full-Time 2,719 3,855 6,574 - - - - - - 2,719 3,855 6,574
Part-Time 1,114 1,234 2,348 - - - - - - 1,114 1,234 2,348
2.7. Enrolments by sex, sector, level of education and type of education (summary)
TotalGovernment Church Independent

60
Boys Girls Boys Girls Boys Girls Boys Girls Total
10 6 5 3 - 2 15 11 26
Age: 6 9 5 4 3 - 1 13 9 22
7 1 1 1 - - 1 2 2 4
16 22 8 16 - - 24 38 62
Age: 6 3 4 - 9 - - 3 13 16
7 11 17 7 6 - - 18 23 41
8 2 1 1 1 - - 3 2 5
13 22 3 5 10 13 26 40 66
Age: 7 1 11 - - 4 5 5 16 21
8 10 7 1 4 5 8 16 19 35
9 2 4 2 1 1 - 5 5 10
10 - - - - - 0 - 0
13 12 1 4 5 - 19 16 35
Age: 8 3 2 - 1 1 - 4 3 7
9 7 7 - 3 3 - 10 10 20
10 3 3 1 - 1 - 5 3 8
10 5 8 2 1 - 19 7 26
Age: 9 1 1 - - 1 - 2 1 3
10 5 4 7 1 - - 12 5 17
11 4 - 1 1 - - 5 1 6
12 - - - - - 0 - 0
7 5 7 12 4 - 18 17 35
Age: 10 - 1 2 2 1 - 3 3 6
11 6 3 3 7 2 - 11 10 21
12 1 1 2 3 1 - 4 4 8
188 150 - - - - 188 150 338
Age: 10 3 3 - - - - 3 3 6
11 124 107 - - - - 124 107 231
12 61 40 - - - - 61 40 101
Year 5
TotalGovernment Independent Church
2.8. Number of repeaters in primary schools by sex, age, sector, year of study and level of education
Primary
Year 1
Year 2
Year 6
Year 7
Year 3
Year 4

61
Boys Girls Boys Girls Boys Girls Boys Girls Total
9 6 4 2 1 - 14 8 22
Age: 11 1 - - - - - 1 - 1
12 6 6 3 2 1 - 10 8 18
13 2 - 1 - - - 3 - 3
8 24 3 - 1 - 12 24 36
Age: 12 1 - - - - - 1 - 1
13 5 21 2 - - - 7 21 28
14 2 3 1 - 1 - 4 3 7
2 17 9 5 - - 11 22 33
Age: 13 - - 2 - - - 2 - 2
14 1 11 6 1 - - 7 12 19
15 1 6 1 4 - - 2 10 12
31 16 4 2 4 1 39 19 58
Age: 14 2 9 - - 2 - 4 9 13
15 16 - 2 - 2 - 20 - 20
16 13 5 2 2 - 1 15 8 23
17 - 2 - - - - - 2 2
22 6 1 1 1 - 24 7 31
Age: 16 19 5 1 1 1 - 21 6 27
17 3 1 - - - - 3 1 4
2.9. Number of repeaters in secondary schools by sex, age, sector, year of study and level of education
Secondary
Government Church Independent Total
Form 5
Form 1
Form 2
Form 3
Form 4

62
Males Females Total
Architecture and Civil EngineeringBachelor of Engineering and Arts (Honours) 1 6 - 6
2 1 - 13 - 1 1
Postgraduate Diploma in Conservation Technology for Masonry Buildings 1
1 - 1
ArtsMaster of Arts 1 3 4 7
2 1 1 23 - 1 14 1 - 1
Master of Arts (Qual.) 1 - 3 3Bachelor of Arts 1 11 17 28
2 - 1 13 2 4 6
Master of Arts Translation and Interpreting 2 1 1 2Postgraduate Diploma in Translation and Interpreting 2 1 - 1Bachelor of Arts (Honours) 2 1 3 4
3 4 - 4
Economics, Management and AccountancyBachelor of Commerce 1 21 26 47
2 5 8 133 1 2 3
Bachelor of Science Business and Computing 1 2 1 3Bachelor of Commerce (Honours) 4 1 - 1Master of Arts Economics 1 1 - 1Diploma in Management Studies 1 14 16 30
2 2 - 2Diploma in Commerce 2 2 3 5Bachelor of Arts (Honours) Social Policy/Social Work 1 - 5 5
2 1 2 3
Bachelor of Arts (Honours) Social Administration/Social Work 4- 1 1
Master in Business Administration (Qual.) 1 1 2 3Master in Business Administration 1 2 3 5
2 7 3 103 1 3 4
Bachelor of Arts Tourism Studies 1 1 9 102 - 1 1
Bachelor of Accountancy (Honours) 1 - 1 1
EducationPostgraduate Certificate in Education 1 2 5 7Postgraduate Diploma in Education (Administration and Management) 1
- 1 1
Bachelor of Education (Honours) 1 5 6 112 2 1 33 1 1 24 - 3 3
Bachelor of Psychology (Honours) 1 - 9 92 - 3 33 - 1 1
2.10. Number of dropouts…
2005/2006Year of study
FacultyCourse

63
Males Females Total
Diploma in Sport and Leisure Studies 2 4 3 7Bachelor of Arts in Youth and Community Studies (Honours) 1 - 2 2Bachelor of Arts in Youth and Community Studies 4 - 1 1
LawBachelor of Arts Legal and Humanistic Studies 1 9 6 15Magister Juris International Law 1 - 1 1
3 - 1 1Magister Juris in European and Comparative Law 1 4 4 8Doctor of Law 2 - 1 1Qualifying Programme in Doctor of Law 1 1 - 1Master of Human Rights and Democratisation 1 1 - 1Master of Philosophy Laws 3 1 - 1Master in Financial Services 1 1 - 1
EngineeringBachelor of Engineering (Honours) 1 6 - 6
2 1 - 1Master of Science in Integrated Product Development 1 4 2 6
Medicine and SurgeryDoctor of Medicine and Surgery 1 - 1 1Bachelor of Pharmacy (Honours) 1 1 - 1
2 - 1 1Bachelor of Dental Surgery 3 - 2 2
Science Master of Science 1 1 - 1
2 - 1 13 2 - 27 2 - 2
Bachelor of Science (Honours) 1 3 5 82 2 2 4
TheologyBachelor of Arts Theology and Human Studies (Honours) 1 1 1 2Masters in Theology 2 1 - 1Bachelor of Arts Theology and Human Studies 1 1 1 2
Institute of AgriculturePreparatory Course for Diploma in Agriculture 1 2 - 2Bachelor of Science (Honours) in Med Agro-Ecosystems Mangement 1 3 - 3
Bachelor of Science (Honours) Information Technology 1 15 2 172 1 1 23 1 - 1
Certificate/Diploma in Information Technology 1 2 - 22 - - -
Master in Information Technology 1 1 - 1
Board of Studies for Information TechnologyInstitute of Forensic StudiesBachelor of Arts (Honours) in Criminology 1 - 4 4
… 2.10. Number of dropouts
Year of study
2005/2006Faculty
Course

64
Males Females Total
Institute of Health CareBachelor of Science (Honours) Health Science 1 - 5 5
2 1 1 23 3 4 7
Diploma in Health Science 1 1 3 42 - 1 1
Preparatory Course for Diploma in Health Science 1 4 1 52 - 2 2
Post Qualification Diploma in Health Science 1 - 1 12 1 - 1
European Centre of GerontologyPostgraduate Diploma in Gerontology and Geriatrics 1 2 - 2
Mediterranean Academy of Diplomatic StudiesDiploma in Diplomatic Studies 2 - 1 1Master in Diplomatic Studies 1 - 1 1
Workers Participation and Development CentreDiploma in Social Studies 2 1 3 4Certificate in Foundation Studies 1 3 1 4
European Documentation and Research CentreBachelor of European Studies 1 2 2 4
2 3 - 3Master in comparative European Mediterranean Education Studies 1 - 1 1Master in European Studies 1 3 4 7
2 - 1 1
Centre for Communication TechnologyBachelor of Communications 1 3 6 9
2 4 2 6Bachelor of Communications (Honours) 4 1 - 1Bachelor of Library Information and Archive Studies 1 - 1 1Diploma Journalism 1 - 1 1Diploma In Archive and Records Management 2 - 1 1Diploma Library and Information Studies 2 - 1 1Qualifying Programme for the Master of Arts (CCT) 1 1 4 5M. A. (CCT) 1 4 7 11
2 - 1 1
Institute for the Design and Development ThinkingMaster of Creativity and Innovation 1 - 3 3
Visiting StudentsVisiting Students 1 7 41 48
Total 220 294 514
Source: University of Malta
… 2.10. Number of dropouts
Year of study
2005/2006Faculty
Course
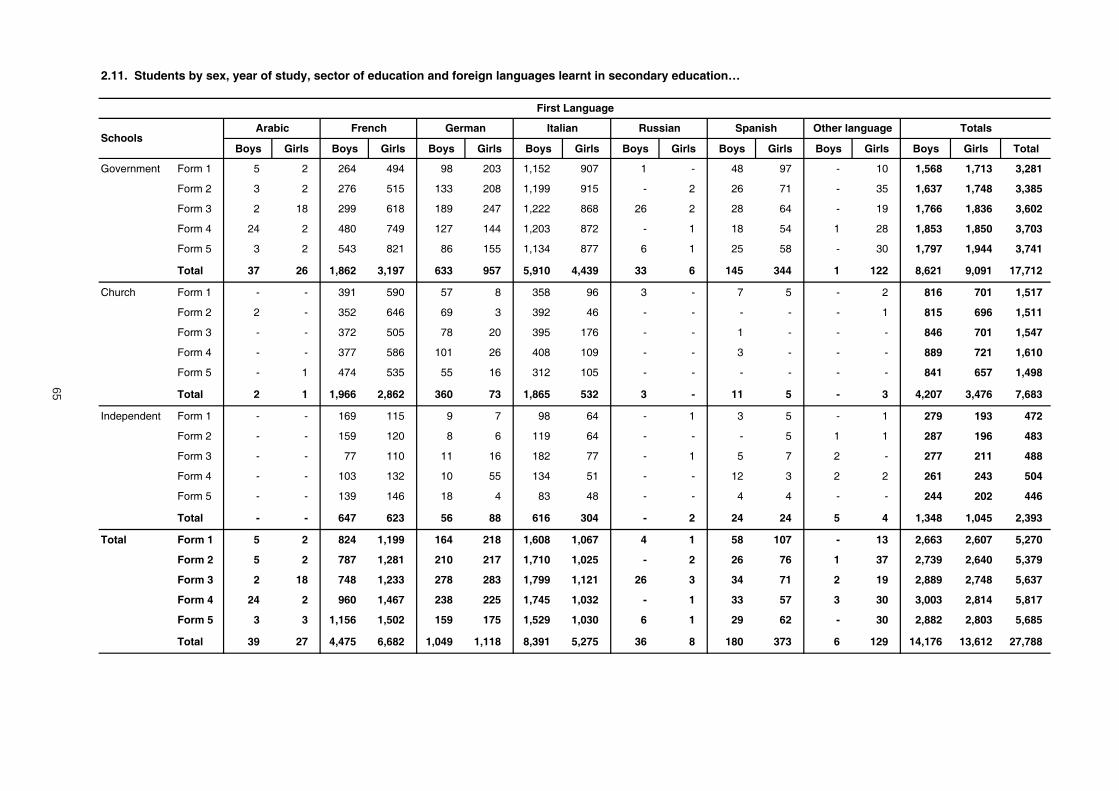
65
Boys Girls Boys Girls Boys Girls Boys Girls Boys Girls Boys Girls Boys Girls Boys Girls Total
Government Form 1 5 2 264 494 98 203 1,152 907 1 - 48 97 - 10 1,568 1,713 3,281
Form 2 3 2 276 515 133 208 1,199 915 - 2 26 71 - 35 1,637 1,748 3,385
Form 3 2 18 299 618 189 247 1,222 868 26 2 28 64 - 19 1,766 1,836 3,602
Form 4 24 2 480 749 127 144 1,203 872 - 1 18 54 1 28 1,853 1,850 3,703
Form 5 3 2 543 821 86 155 1,134 877 6 1 25 58 - 30 1,797 1,944 3,741
Total 37 26 1,862 3,197 633 957 5,910 4,439 33 6 145 344 1 122 8,621 9,091 17,712
Church Form 1 - - 391 590 57 8 358 96 3 - 7 5 - 2 816 701 1,517
Form 2 2 - 352 646 69 3 392 46 - - - - - 1 815 696 1,511
Form 3 - - 372 505 78 20 395 176 - - 1 - - - 846 701 1,547
Form 4 - - 377 586 101 26 408 109 - - 3 - - - 889 721 1,610
Form 5 - 1 474 535 55 16 312 105 - - - - - - 841 657 1,498
Total 2 1 1,966 2,862 360 73 1,865 532 3 - 11 5 - 3 4,207 3,476 7,683
Independent Form 1 - - 169 115 9 7 98 64 - 1 3 5 - 1 279 193 472
Form 2 - - 159 120 8 6 119 64 - - - 5 1 1 287 196 483
Form 3 - - 77 110 11 16 182 77 - 1 5 7 2 - 277 211 488
Form 4 - - 103 132 10 55 134 51 - - 12 3 2 2 261 243 504
Form 5 - - 139 146 18 4 83 48 - - 4 4 - - 244 202 446
Total - - 647 623 56 88 616 304 - 2 24 24 5 4 1,348 1,045 2,393
Total Form 1 5 2 824 1,199 164 218 1,608 1,067 4 1 58 107 - 13 2,663 2,607 5,270
Form 2 5 2 787 1,281 210 217 1,710 1,025 - 2 26 76 1 37 2,739 2,640 5,379
Form 3 2 18 748 1,233 278 283 1,799 1,121 26 3 34 71 2 19 2,889 2,748 5,637
Form 4 24 2 960 1,467 238 225 1,745 1,032 - 1 33 57 3 30 3,003 2,814 5,817
Form 5 3 3 1,156 1,502 159 175 1,529 1,030 6 1 29 62 - 30 2,882 2,803 5,685
Total 39 27 4,475 6,682 1,049 1,118 8,391 5,275 36 8 180 373 6 129 14,176 13,612 27,788
First Language
SchoolsArabic French German Italian Russian Spanish Other language
2.11. Students by sex, year of study, sector of education and foreign languages learnt in secondary education…
Totals

66
Boys Girls Boys Girls Boys Girls Boys Girls Boys Girls Boys Girls Boys Girls Boys Girls Total
Government Form 1 - - 7 - 2 - - - - - 1 1 31 9 41 10 51
Form 2 1 - - 15 22 3 14 3 1 - - - 75 36 113 57 170
Form 3 1 2 19 59 6 29 58 116 - 1 15 86 57 36 156 329 485
Form 4 1 2 15 22 8 46 54 117 - 3 10 66 30 28 118 284 402
Form 5 6 1 - 19 23 38 57 176 - 1 2 81 3 31 91 347 438
Total 9 5 41 115 61 116 183 412 1 5 28 234 196 140 519 1,027 1,546
Church Form 1 - - 108 71 30 14 162 576 - - 16 - - - 316 661 977
Form 2 - - 116 - 35 16 166 623 - - - - - - 317 639 956
Form 3 - - 72 23 31 19 175 315 - - - 7 - - 278 364 642
Form 4 - - 55 26 20 10 198 354 - - - - - - 273 390 663
Form 5 - - 36 0 19 4 201 302 - - - - - - 256 306 562
Total - - 387 120 135 63 902 2,170 - - 16 7 - - 1,440 2,360 3,800
Independent Form 1 - - - 1 10 7 140 87 - - - - - - 150 95 245
Form 2 - - 9 1 13 12 123 75 - - - - - - 145 88 233
Form 3 - - 10 8 7 4 7 43 1 1 - - 1 3 26 59 85
Form 4 - - 27 23 1 1 1 42 - - 1 - - - 30 66 96
Form 5 - - 10 7 3 4 11 40 - - - - - - 24 51 75
Total - - 56 40 34 28 282 287 1 1 1 - 1 3 375 359 734
Total Form 1 - - 115 72 42 21 302 663 - - 17 1 31 9 507 766 1,273
Form 2 1 - 125 16 70 31 303 701 1 - - - 75 36 575 784 1,359
Form 3 1 2 101 90 44 52 240 474 1 2 15 93 58 39 460 752 1,212
Form 4 1 2 97 71 29 57 253 513 - 3 11 66 30 28 421 740 1,161
Form 5 6 1 46 26 45 46 269 518 - 1 2 81 3 31 371 704 1,075
Total 9 5 484 275 230 207 1,367 2,869 2 6 45 241 197 143 2,334 3,746 6,080
This table excludes all students that did not study a second foreign language.
German Italian Russian Spanish Other language Totals
Second Language
… 2.11. Students by sex, year of study, sector of education and foreign languages learnt in secondary education
SchoolsArabic French

67
Boys Girls Boys Girls Boys Girls Boys Girls Boys Girls Boys Girls Boys Girls Boys Girls Total
Government Form 1 - - 1 - 2 - - 2 - - 1 - - - 4 2 6
Form 2 - - - - - 1 - - - - - - 1 - 1 1 2
Form 3 - - - 14 - 4 2 5 - - - 4 - 2 2 29 31
Form 4 - - 1 1 - 4 1 14 - - - - - - 2 19 21
Form 5 - - - 3 - 9 2 12 - - - 2 - - 2 26 28
Total - - 2 18 2 18 5 33 - - 1 6 1 2 11 77 88
Church Form 1 - - - - 5 - - 4 - - - - - - 5 4 9
Form 2 - - - - 10 - - - - - - - - - 10 - 10
Form 3 - - - - - - - - - - - - - - - - -
Form 4 - - - - - - - 20 - - - - - 7 - 27 27
Form 5 - - - - 6 - - - - - - - - - 6 - 6
Total - - - - 21 - - 24 - - - - - 7 21 31 52
Independent Form 1 - - - - - - 6 1 - - - - - - 6 1 7
Form 2 - - - - - - 24 18 - - - - - - 24 18 42
Form 3 - - - 2 1 - 16 9 - 1 1 - 2 3 20 15 35
Form 4 - - - - - - 9 14 - - - - - - 9 14 23
Form 5 - - - - - - 7 9 - - - - - - 7 9 16
Total - - - 2 1 - 62 51 - - - - 2 3 65 56 121
Total Form 1 - - 1 - 7 - 6 7 - - 1 - - - 15 7 22
Form 2 - - - - 10 1 24 18 - - - - 1 - 35 19 54
Form 3 - - - 16 1 4 18 14 - 1 1 4 2 5 22 44 66
Form 4 - - 1 1 - 4 10 48 - - - - - 7 11 60 71
Form 5 - - - 3 6 9 9 21 - - - 2 - - 15 35 50
Total - - 2 20 24 18 67 108 - 1 2 6 3 12 98 165 263
This table excludes all students that did not study a third foreign language.
… 2.11. Students by sex, year of study, sector of education and foreign languages learnt in secondary education
Third Language
SchoolsArabic French German Italian Russian Spanish Other language Totals

68
Boys Girls Total b g t b g t
Kindergarten 3.8 3.7 3.8 3.8 3.9 3.9 3.5 3.4 3.4 3.7
Year 1 5.3 5.3 5.3 5.3 5.3 5.3 5.3 5.3 5.3 5.3
Year 2 6.3 6.3 6.3 6.3 6.3 6.3 6.3 6.3 6.3 6.3
Year 3 7.3 7.3 7.3 7.3 7.3 7.3 7.3 7.3 7.3 7.3
Year 4 8.3 8.3 8.3 8.4 8.3 8.3 8.3 8.3 8.3 8.3
Year 5 9.4 9.3 9.3 9.3 9.4 9.3 9.4 9.4 9.4 9.3
Year 6 10.3 10.3 10.3 10.4 10.4 10.4 10.3 10.3 10.3 10.3
Year 7 11.3 11.2 11.3 - - - - - - 11.3
Form 1 11.5 11.4 11.5 11.4 11.5 11.4 11.4 11.3 11.4 11.4
Form 2 12.6 12.4 12.5 12.3 12.4 12.4 12.3 12.3 12.3 12.4
Form 3 13.5 13.5 13.5 13.4 13.4 13.4 13.4 13.4 13.4 13.5
Form 4 14.6 14.4 14.5 14.4 14.5 14.4 14.5 14.5 14.4 14.5
Form 5 15.5 15.4 15.5 15.4 15.4 15.4 15.4 15.4 15.4 15.4
Year 1 16.7 16.7 16.7 16.3 16.4 16.3 16.8 16.8 16.8 16.6
Year 2 17.9 17.8 17.9 17.4 17.4 17.4 17.8 17.9 17.9 17.8
Secondary
Post-Secondary General
Pre-Primary
Year of StudyGovernment
2.12. Average age of students by year of study, sector and level of education
Primary
Overall mean age
Church Independent

69
2.13 Enrolment rates
Males Females Total Males Females Total
Pre-Primary* Pre-Primary*
students 3-4 years 3,602 3,324 6,926 total students 4,294 3,958 8,252
population 3-4 years 4,108 3,783 7,891 population 3-4 years 4,108 3,783 7,891
Enrolment rates (%) 87.68 87.87 87.77 Enrolment rates (%) 104.53 104.63 104.57
Primary* Primary*
students 5-10 years 13,770 13,081 26,851 total students 14,874 14,057 28,931
population 5-10 years 14,455 13,705 28,160 population 5-10 years 14,455 13,705 28,160
Enrolment rates (%) 95.26 95.45 95.35 Enrolment rates (%) 102.90 102.57 102.74
Secondary* Secondary*
students 11-16 years 14,042 13,504 27,546 total students 14,176 13,612 27,788
population 11-16 years 16,952 16,054 33,006 population 11-16 years 16,952 16,054 33,006
Enrolment rates (%) 82.83 84.12 83.46 Enrolment rates (%) 83.62 84.79 84.19
Post-Secondary General Post-Secondary General
students 16-19 years 2,389 3,078 5,467 total students 2,454 3,117 5,571
population 16-19 years 11,740 11,083 22,823 population 16-19 years 11,740 11,083 22,823
Enrolment rates (%) 20.35 27.77 23.95 Enrolment rates (%) 20.90 28.12 24.41
Post-Secondary Vocational Post-Secondary Vocational
students 16-29 years 3,672 1,975 5,647 total students 4,190 2,210 6,400
population 16-29 years 42,937 40,432 83,369 population 16-29 years 42,937 40,432 83,369
Enrolment rates (%) 8.55 4.88 6.77 Enrolment rates (%) 9.76 5.47 7.68
Tertiary Education Tertiary Education
students 18-29 years 2,956 4,185 7,141 total students 3,833 5,089 8,922
population 18-29 years 37042 34728 71,770 population 18-29 years 37042 34728 71,770
Enrolment rates (%) 7.98 12.05 9.95 Enrolment rates (%) 10.35 14.65 12.43
3 Population figures refer to total population as at end 2005.
1Net Enrolment rate refers to the number of pupils (total, male, female) in the theoretical age group for a specific level of education enrolled in at the specificlevel of education expressed as a percentage of the (total, male, female) population in that age group.
2 The Gross Enrolment Rate is calculated by expressing the number of students enrolled in a specific level of education, regardless of age, as a percentageof the population of official school age for the same level.
Net erollment rates1 Gross Enrolment rates2

CHAPTER 3
Entrants in Mainstream Education


73
Boys Girls Boys Girls Boys Girls Boys Girls Total
All ages 1,375 1,281 440 685 342 279 2,157 2,245 4,402
4 - - - - - - - - -
5 965 932 320 477 235 204 1,520 1,613 3,133
6 408 347 119 207 103 67 630 621 1,251
7 2 2 1 1 4 8 7 11 18
8 - - - - - - - - -
9 - - - - - - - - -
All ages 1,568 1,713 816 701 279 193 2,663 2,607 5,270
10 - 8 2 - - - 2 8 10
11 812 1,001 530 399 170 132 1,512 1,532 3,044
12 650 649 270 286 99 56 1,019 991 2,010
13 106 55 14 16 10 5 130 76 206
14 - - - - - - - - -
15 - - - - - - - - -
Total
Primary
Secondary
3.1. Entrants by sex, age, level of education and sector of education
AgeGovernment Church Independent
Age Males Females Total
16 664 812 1,476
17 572 769 1,341
18 77 77 154
19 17 12 29
20 9 7 16
21 + 5 3 8
Total 1,344 1,680 3,024
Age Males Females Total
16 18 21 39
17 55 15 70
18 27 28 55
19 19 15 34
20 11 7 18
21 + 8 13 21
Total 138 99 237
3.2. Entrants in post-secondary general schools by sex and age
3.3. Entrants at the Institute of Tourism Studies (ITS) by sex and age

74
Age Males Females Total
16 471 268 739
17 459 273 732
18 350 204 554
19 251 108 359
20 115 46 161
21 45 16 61
22 17 7 24
23 8 4 12
24 5 2 7
25+ 14 9 23
Total 1,735 937 2,672
3.4. Entrants at Malta College of Arts, Science and Technology (MCAST) by sex and age
Males Females Total Males Females Total Males Females Total
18 2 3 5 2 - 2 1 1 2
19 191 349 540 - 2 2 - 1 1
20 245 373 618 3 4 7 2 3 5
21 116 123 239 3 2 5 6 8 14
22 97 126 223 - 2 2 13 19 32
23 77 128 205 1 3 4 20 25 45
24 53 54 107 2 1 3 19 23 42
25 - 29 123 103 226 9 10 19 71 84 155
30 - 34 31 22 53 4 7 11 58 59 117
35 - 39 24 17 41 1 - 1 22 26 48
40+ 22 28 50 27 39 66 53 52 105
Total 981 1,326 2,307 52 70 122 265 301 566
3.5. Entrants at University of Malta by sex, age and course type
Full-time Part-time dayAge
Part-time evening

75
Males Females Total Males Females Total Males Females Total Males Females Total Males Females Total Males Females Total
18 2 3 5 - 1 1 2 - 2 - - - - - - 4 4 8
19 8 10 18 - 1 1 183 339 522 - 1 1 - - - 191 351 542
20 14 17 31 4 8 12 229 351 580 2 2 4 - - - 249 378 627
21 10 10 20 7 17 24 102 99 201 4 3 7 - - - 123 129 252
22 8 10 18 16 43 59 66 54 120 17 14 31 - - - 107 121 228
23 6 6 12 18 36 54 41 46 87 28 34 62 - - - 93 122 215
24 2 3 5 10 14 24 30 18 48 25 28 53 1 - 1 68 63 131
25-29 13 11 24 17 30 47 76 37 113 82 83 165 - - - 188 161 349
30-34 10 8 18 10 15 25 12 15 27 43 31 74 1 - 1 76 69 145
35-39 9 1 10 4 9 13 10 15 25 17 9 26 - - - 40 34 74
40+ 16 9 25 7 12 19 16 25 41 50 47 97 2 2 4 91 95 186
Total 98 88 186 93 186 279 767 999 1,766 268 252 520 4 2 6 1,230 1,527 2,757
PhD TotalAge
3.6 Entrants at University of Malta by sex, age and course structure
First degree MastersCertificate Diploma

76
Male Female Group Total
Teacher training and education science 55 191 246
Arts 36 67 103
Humanities 148 177 325
Social and behavioural science 76 147 223
Journalism and information 46 55 101
Business and administration 262 309 571
Law 166 190 356
Life science 45 15 60
Physical science 13 2 15
Mathematics and statistics 41 38 79
Computing 82 26 108
Engineering and engineering trades 120 26 146
Architecture and building 39 30 69
Agriculture, forestry and fishery 10 3 13
Health 122 295 417
Social Services 22 77 99
Personal Services 15 49 64
Total 1,298 1,697 2,995
3.7. Entrants at University of Malta by sex and field of study

CHAPTER 4
Foreign Sudents in
Mainstream Education


79
3 and under
4 5 Total3 and under
4 5 Total
Afghanistan - - - - 1 - - 1
Albania - - - - - - - -
Argentina - - - - 1 - - 1
Australia 1 - - 1 2 - - 2
Austria 2 1 1 4 - - - -
Bahamas - - - - - - - -
Bangladesh - - - - - - 1 1
Belarus - - - - - - - -
Belgium - - - - - - - -
Benin - - - - - - - -
Bosnia - Herzegovina - 1 - 1 - - - -
Brazil - - - - - - - -
Bulgaria - - - - - 1 - 1
Canada - - - - 1 - - 1
China - - - - 2 - 1 3
Congo - 2 - 2 - - - -
Croatia (Hrvatska) 1 - - 1 - - - -
Czech Republic - - - - - - - -
Denmark - - - - - 1 - 1
Egypt - 1 - 1 1 - - 1
Eritrea - - 2 2 - 1 - 1
Ethiopia 1 1 - 2 2 2 1 5
Finland - - - - - 1 - 1
France 3 2 - 5 1 1 - 2
Georgia (Abkhazia) - - - - - - - -
Germany 2 1 1 4 1 1 - 2
Hungary - - - - - - - -
Iceland - - 1 1 - - - -
India - - - - - - - -
Iraq - - - - - - - -
Ireland - - - - 1 - - 1
Italy 7 1 - 8 1 8 - 9
Japan 1 - - 1 1 - - 1
Jordan - - - - - - - -
Kazakhstan - - - - - - - -
Kenya - - - - - - - -
Korea (Dem People's Rep) - - - - - - - -
Latvia - - - - 1 - - 1
Lebanon - - - - - 1 1 2
Libya 1 2 - 3 - 2 - 2
Lithuania - - - - - - - -
Macedonia - 2 - 2 - - - -
Malaysia - - - - - - - -
Maldives - - - - - - - -
Morocco - - - - - - - -
4.1. Pre-primary foreign students by nationality, sex, age and level of education …
Boys Girls
Pre-primary
Country
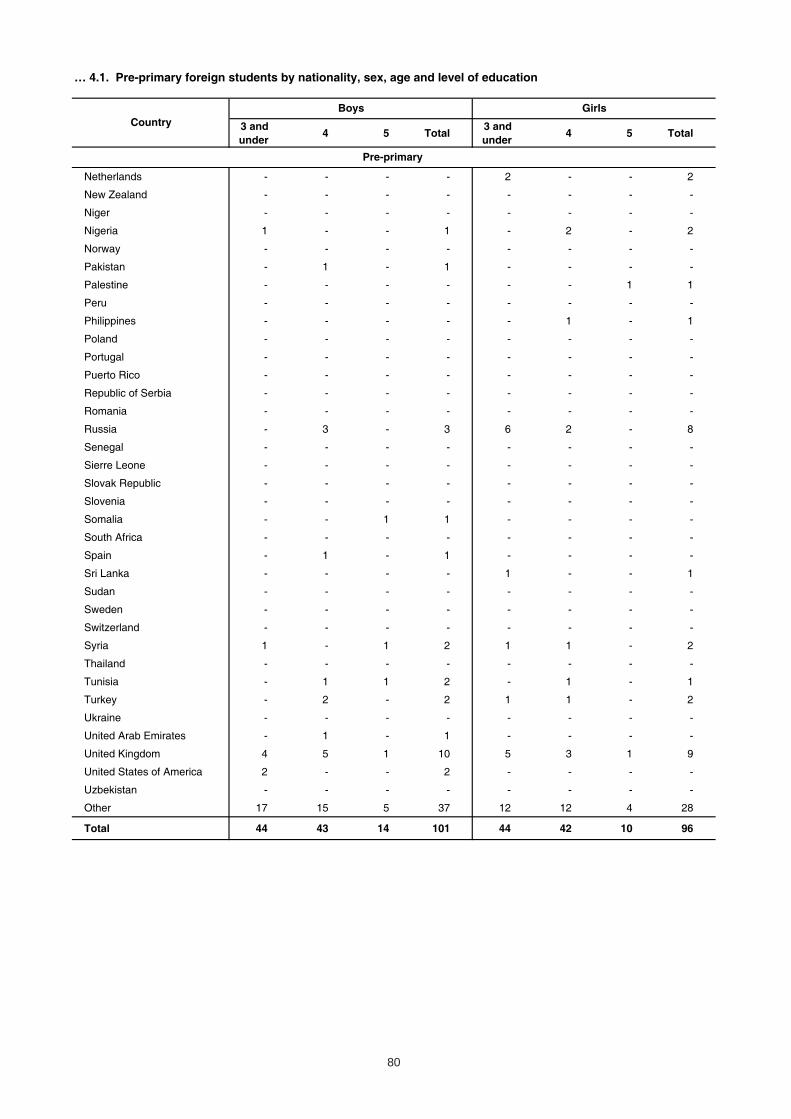
80
3 and under
4 5 Total3 and under
4 5 Total
Netherlands - - - - 2 - - 2
New Zealand - - - - - - - -
Niger - - - - - - - -
Nigeria 1 - - 1 - 2 - 2
Norway - - - - - - - -
Pakistan - 1 - 1 - - - -
Palestine - - - - - - 1 1
Peru - - - - - - - -
Philippines - - - - - 1 - 1
Poland - - - - - - - -
Portugal - - - - - - - -
Puerto Rico - - - - - - - -
Republic of Serbia - - - - - - - -
Romania - - - - - - - -
Russia - 3 - 3 6 2 - 8
Senegal - - - - - - - -
Sierre Leone - - - - - - - -
Slovak Republic - - - - - - - -
Slovenia - - - - - - - -
Somalia - - 1 1 - - - -
South Africa - - - - - - - -
Spain - 1 - 1 - - - -
Sri Lanka - - - - 1 - - 1
Sudan - - - - - - - -
Sweden - - - - - - - -
Switzerland - - - - - - - -
Syria 1 - 1 2 1 1 - 2
Thailand - - - - - - - -
Tunisia - 1 1 2 - 1 - 1
Turkey - 2 - 2 1 1 - 2
Ukraine - - - - - - - -
United Arab Emirates - 1 - 1 - - - -
United Kingdom 4 5 1 10 5 3 1 9
United States of America 2 - - 2 - - - -
Uzbekistan - - - - - - - -
Other 17 15 5 37 12 12 4 28
Total 44 43 14 101 44 42 10 96
Pre-primary
… 4.1. Pre-primary foreign students by nationality, sex, age and level of education
CountryBoys Girls

81
5 6 7 8 9 10 11 12 Total 5 6 7 8 9 10 11 12 Total
Afghanistan - - - - - - - - - - - - - - - - - -
Albania - - 1 - - 1 - - 2 - - - - 1 1 - - 2
Argentina - - - - - - - - - - - - - - - - - -
Australia - - 3 1 2 5 2 1 14 - - 1 3 1 2 1 - 8
Austria - - - - - - - - - - - - - 1 - - - 1
Bahamas - - - - - - - - - - - - - - - - - -
Bangladesh - - - - - - - - - - - - - - - - - -
Belarus - - - - - - - - - - - - 1 - - - - 1
Belgium 2 - - - - - 1 - 3 - - - - - 2 - - 2
Benin - - - - - - - - - - - - - - - - - -
Bosnia - Herzegovina - - 1 - - - - - 1 - 1 - - - - - - 1
Brazil - - - - - - - - - - - - - - - - - -
Bulgaria 1 1 - 2 2 1 3 1 11 - 2 3 - 5 - - 1 11
Canada - 1 - - 1 2 - - 4 - - - - 2 - 2 - 4
China - - - - - 1 - - 1 - - 1 2 - - - - 3
Congo - - - - 2 - 2 - 4 1 - - - - 1 - - 2
Croatia (Hrvatska) 1 - - - - - - - 1 - - 1 - - 1 - - 2
Czech Republic - 1 - - - - - - 1 - - - - - - - - -
Denmark - - - - - - - - - - - - - - - - - -
Egypt 1 1 1 2 - 1 1 - 7 1 1 1 - - 2 - - 5
Eritrea - 2 5 1 1 - - - 9 1 1 1 - 2 - 1 - 6
Ethiopia - - - - - 2 - - 2 - - 1 1 1 - - - 3
Finland - - - - - - - - - - - - - - - - - -
France - - 2 2 - 2 - - 6 - - 4 1 - - - - 5
Georgia (Abkhazia) - - - - - 1 - - 1 - - - - - - - - -
Germany - 3 1 2 3 5 1 - 15 1 3 1 5 2 1 5 - 18
Hungary - - - - - - 1 - 1 - - - - - - - - -
Iceland - - - - - 2 - - 2 - 1 - - 1 - - - 2
India 1 - 1 - - - - - 2 - - - - - - - - -
Iraq - - 1 1 1 - - 1 4 - - - 1 - - - - 1
Ireland 1 - - - - - - - 1 - - - 1 1 - - - 2
Italy 1 1 2 4 3 6 3 - 20 3 2 2 6 5 1 2 - 21
Japan - - - - - - - - - 1 - - - - - - - 1
Jordan - - - - - - - - - - - - 1 - - - - 1
Kazakhstan - - - - - - - - - - - - - - - - - -
Kenya - - - - - - - - - - - - 1 - - - - 1
Korea (Dem People's Rep) - - - - - - - - - - - - - - - - - -
Latvia - - - - - - - - - 1 - - - - - - - 1
Lebanon - - - - - - - - - - - - - - - - - -
Libya 2 1 3 2 3 1 - - 12 - 1 2 3 3 3 - - 12
Boys Girls
4.1.1. Primary foreign students by nationality, sex, age and level of education …
Country

82
5 6 7 8 9 10 11 12 Total 5 6 7 8 9 10 11 12 Total
Lithuania - - - - - - - - - - - - - - - - - -Macedonia - - - - - - - - - - - - - - - - - -Malaysia - - - - - - - - - - - - 1 - - - - 1Maldives - - - - - 1 - - 1 1 - - - - - - - 1Morocco - - - - 1 - - - 1 1 - - 1 - - - - 2Netherlands 2 2 1 1 1 1 1 - 9 1 - - - 1 - - 1 3New Zealand - - - - - - - - - - - 1 - - - - - 1Niger - - - - - - - - - - - - - - - - - -Nigeria - - 1 1 - 2 1 - 5 - - - - 1 - - - 1Norway - - - - - 1 - - 1 - - - - - - - - -Pakistan - - - 1 - - - - 1 - - - - - - - - -Palestine - 1 - 1 - - - - 2 - - - - - - - - -Peru - - - - - - - - - - - - - - - - - -Philippines - 1 - - - 1 - - 2 - 2 - - - - - - 2Poland - - 1 - 1 - - - 2 - - - - - 1 1 - 2Portugal - - - - - - - - - 1 - - - - - - - 1Puerto Rico - - - - - - - - - - - - - - - - - -Republic of Serbia 1 1 - 4 1 4 2 - 13 1 1 3 3 2 1 2 - 13Romania - - - 1 2 - - - 3 - - - - - 1 - - 1Russia 3 5 1 5 1 1 1 - 17 4 3 3 2 2 1 4 - 19Senegal - - - - - 1 - - 1 - - - - - - - - -Sierre Leone - - - - - - - - - - - - - - - - - -Slovak Republic - - - - - - - - - - - - - - - - - -Slovenia - - - - - - - - - - - - 1 - - - - 1Somalia 1 - 1 1 1 - 1 - 5 - - - - - - - - -South Africa - - 1 - - - - - 1 1 - - - - - 1 - 2Spain - - - - - - - - - - 1 - - - - - - 1Sri Lanka - - - - - - - - - - - - - - - - - -Sudan - - - - - - - - - - - - - - - - - -Sweden - 1 1 - - - - - 2 - - - - - - 2 - 2Switzerland 1 - - - - - - - 1 - - - 1 - - - - 1Syria - - - 1 1 1 1 - 4 - - 1 1 2 - - - 4Thailand - - - 1 1 - - - 2 - - - - - - - - -Tunisia - - 1 - - - - - 1 - - - - 1 1 - - 2Turkey - 1 - - 2 1 - - 4 - 2 - - - 1 - - 3Ukraine 1 1 - - 1 2 - - 5 - - - 1 - 3 - - 4United Arab Emirates - - - - 1 - - - 1 - - - - 1 - - - 1United Kingdom 7 17 15 7 11 20 15 - 92 3 14 10 12 15 19 6 2 81United States of America - 4 2 1 4 3 2 - 16 1 1 2 - - 1 1 - 6Uzbekistan - - - - - - - - - - - - - - - - - -Other 5 9 8 10 3 7 3 1 46 11 10 14 12 8 3 6 2 66
Total 31 54 54 52 50 76 41 4 362 34 46 52 61 58 46 34 6 337
… 4.1.1. Primary foreign students by nationality, sex, age and level of education
CountryBoys Girls
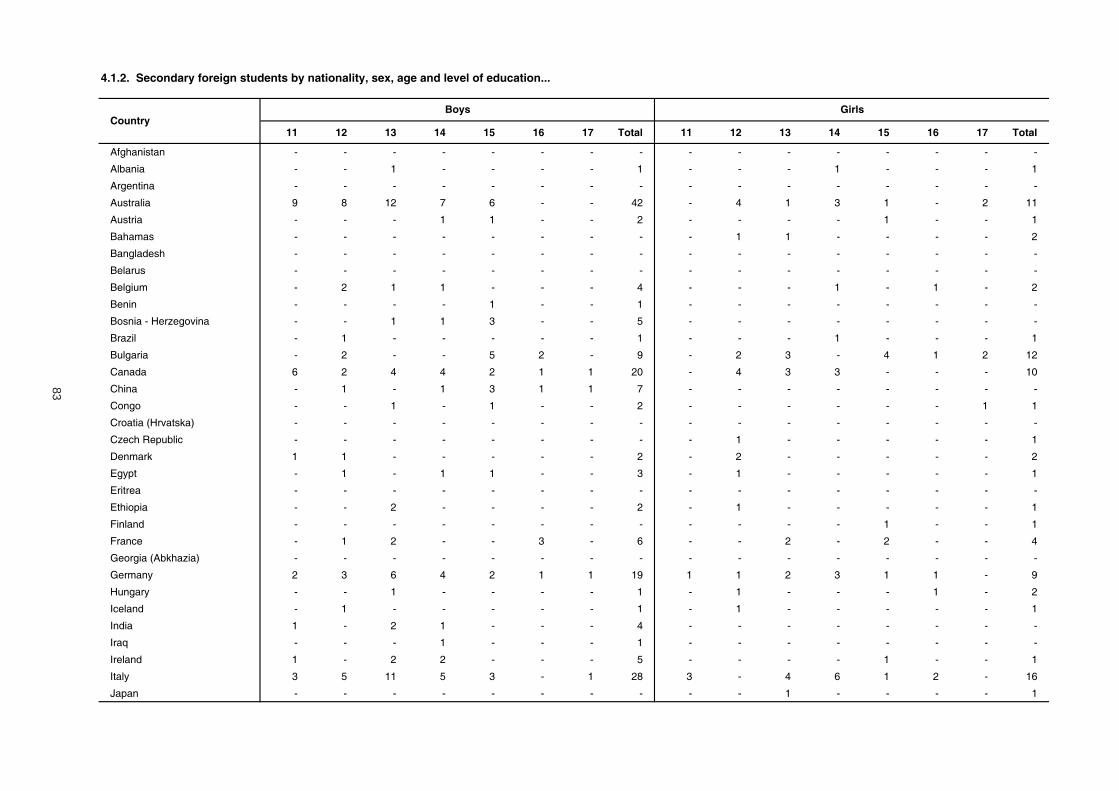
83
11 12 13 14 15 16 17 Total 11 12 13 14 15 16 17 Total
Afghanistan - - - - - - - - - - - - - - - -
Albania - - 1 - - - - 1 - - - 1 - - - 1
Argentina - - - - - - - - - - - - - - - -
Australia 9 8 12 7 6 - - 42 - 4 1 3 1 - 2 11
Austria - - - 1 1 - - 2 - - - - 1 - - 1
Bahamas - - - - - - - - - 1 1 - - - - 2
Bangladesh - - - - - - - - - - - - - - - -
Belarus - - - - - - - - - - - - - - - -
Belgium - 2 1 1 - - - 4 - - - 1 - 1 - 2
Benin - - - - 1 - - 1 - - - - - - - -
Bosnia - Herzegovina - - 1 1 3 - - 5 - - - - - - - -
Brazil - 1 - - - - - 1 - - - 1 - - - 1
Bulgaria - 2 - - 5 2 - 9 - 2 3 - 4 1 2 12
Canada 6 2 4 4 2 1 1 20 - 4 3 3 - - - 10
China - 1 - 1 3 1 1 7 - - - - - - - -
Congo - - 1 - 1 - - 2 - - - - - - 1 1
Croatia (Hrvatska) - - - - - - - - - - - - - - - -
Czech Republic - - - - - - - - - 1 - - - - - 1
Denmark 1 1 - - - - - 2 - 2 - - - - - 2
Egypt - 1 - 1 1 - - 3 - 1 - - - - - 1
Eritrea - - - - - - - - - - - - - - - -
Ethiopia - - 2 - - - - 2 - 1 - - - - - 1
Finland - - - - - - - - - - - - 1 - - 1
France - 1 2 - - 3 - 6 - - 2 - 2 - - 4
Georgia (Abkhazia) - - - - - - - - - - - - - - - -
Germany 2 3 6 4 2 1 1 19 1 1 2 3 1 1 - 9
Hungary - - 1 - - - - 1 - 1 - - - 1 - 2
Iceland - 1 - - - - - 1 - 1 - - - - - 1
India 1 - 2 1 - - - 4 - - - - - - - -
Iraq - - - 1 - - - 1 - - - - - - - -
Ireland 1 - 2 2 - - - 5 - - - - 1 - - 1
Italy 3 5 11 5 3 - 1 28 3 - 4 6 1 2 - 16
Japan - - - - - - - - - - 1 - - - - 1
Boys GirlsCountry
4.1.2. Secondary foreign students by nationality, sex, age and level of education...

84
11 12 13 14 15 16 17 Total 11 12 13 14 15 16 17 Total
Jordan - - - - - - - - - - - - - - - -
Kazakhstan - - 1 - 1 - - 2 - - - - - - - -
Kenya - - - - - - - - - - - - - - - -
Korea (Dem People's Rep) - - - - - - - - - - - 1 - - - 1
Latvia - - - - 2 - - 2 - 1 2 - - - - 3
Lebanon - - - - - - - - - - - - - - - -
Libya - 2 2 1 1 - - 6 - 1 - - - - - 1
Lithuania - - 1 - 1 - - 2 - - - - - - - -
Macedonia - - - - - - - - - - - - - - - -
Malaysia - - - - - - - - - - - - - - - -
Maldives - - - - - - - - - - - - - - - -
Morocco - - 1 2 - - 1 4 - - 1 - - - - 1
Netherlands - 2 4 4 5 1 - 16 - - - - 1 - - 1
New Zealand - - - - - - - - - - - - - - - -
Niger - - 1 - - - - 1 - - - - - - - -
Nigeria 1 - - - - - - 1 - 1 - - - - - 1
Norway - - - - - - - - - - - - - - - -
Pakistan - - - - - - - - - - - - - - - -
Palestine - - 1 - - - - 1 - - - - - - - -
Peru - - 1 - - - - 1 - - - - - - - -
Philippines - - 1 - - - - 1 - - - - - 1 - 1
Poland 2 1 1 1 1 - - 6 - 1 - 2 - - - 3
Portugal - - - - - - - - - - - - - - - -
Puerto Rico - - - - 1 - - 1 - - - - - - - -
Republic of Serbia - 1 1 1 1 1 - 5 - 1 3 1 2 - 1 8
Romania - - - 1 1 - - 2 - 1 - - 1 - - 2
Russia - 3 3 3 7 - - 16 3 2 4 2 3 2 - 16
Senegal - - - - - - - - - - - - - - - -
Sierre Leone - - - - - - 1 1 - - - - - - - -
Slovak Republic - 1 1 - - - - 2 - - 1 1 - - 1 3
Slovenia - - - - - - - - - - - - - - - -
Somalia 1 1 - - - 1 - 3 - 1 - - - - - 1
… 4.1.2. Secondary foreign students by nationality, sex, age and level of education
CountryBoys Girls

85
11 12 13 14 15 16 17 Total 11 12 13 14 15 16 17 Total
South Africa - - - - - - - - - - - - - - - -
Spain - - 1 - - - - 1 - - - 1 - - - 1
Sri Lanka - 1 - - 1 - - 2 - - - - - - - -
Sudan - - - - - - 1 1 - - - - - - - -
Sweden - 2 - 1 - - - 3 1 1 - 1 1 - - 4
Switzerland - - 4 - 1 1 - 6 - 1 1 - - 1 - 3
Syria - 1 - - - - - 1 - - - - - - - -
Thailand - - - - 1 - 1 2 - - - - - 1 - 1
Tunisia - - - - - - - - - - - - - - - -
Turkey - 1 1 - - - - 2 - - 1 - 1 - - 2
Ukraine - - 2 1 - 2 - 5 - 1 - 2 1 - 1 5
United Arab Emirates - - - - 1 - - 1 - - - - - - - -
United Kingdom 7 6 24 29 24 8 1 99 4 22 21 16 16 2 - 81
United States of America 6 11 10 5 3 1 - 36 1 1 5 6 2 2 - 17
Uzbekistan - - - - - - - - - 1 - - - - - 1
Other - 3 7 9 3 1 2 25 3 11 6 5 1 - - 26
Total 40 64 114 87 83 24 11 423 16 66 62 56 41 15 8 264
… 4.1.2. Secondary foreign students by nationality, sex, age and level of education
CountryBoys Girls

86
Government Church Independent Total
Boys - - - -
Girls 1 - - 1
Boys - - - -
Girls - - - -
Boys - - - -
Girls 1 - - 1
Boys 1 - - 1
Girls - - 2 2
Boys 1 - 3 4
Girls - - - -
Boys - - - -
Girls - - - -
Boys - - - -
Girls - 1 - 1
Boys - - - -
Girls - - - -
Boys - - - -
Girls - - - -
Boys - - - -
Girls - - - -
Boys - - 1 1
Girls - - - -
Boys - - - -
Girls - - - -
Boys - - - -
Girls 1 - - 1
Boys - - - -
Girls 1 - - 1
Boys - - - -
Girls - - 3 3
Boys 2 - - 2
Girls - - - -
Boys - - 1 1
Girls - - - -
Boys - - - -
Girls - - - -
Boys - - - -
Girls 1 - - 1
Boys - - 1 1
Girls - - 1 1
Boys 2 - - 2
Girls 1 - - 1
Boys 2 - - 2
Girls 4 1 - 5
Boys - - - -
Girls - - 1 1
Eritrea
Ethiopia
Finland
Croatia
Czech Republic
Denmark
Egypt
Bulgaria
Canada
China
Congo
Belgium
Benin
Bosnia
Brazil
Austria
Bahamas
Bangladesh
Belarus
4.2. Pre-primary foreign students by country, sex, sector and level of education …
SexCountry Pre-primary
Afghanistan
Albania
Argentina
Australia

87
Government Church Independent Total
Boys 2 - 3 5
Girls - - 2 2
Boys - - - -
Girls - - - -
Boys - - 4 4
Girls 1 - 1 2
Boys - - - -
Girls - - - -
Boys - - 1 1
Girls - - - -
Boys - - - -
Girls - - - -
Boys - - - -
Girls - - - -
Boys - - - -
Girls 1 - - 1
Boys 1 - 7 8
Girls 3 - 6 9
Boys - - 1 1
Girls - - 1 1
Boys - - - -
Girls - - - -
Boys - - - -
Girls - - - -
Boys - - - -
Girls - - - -
Boys - - - -
Girls - - - -
Boys - - - -
Girls 1 - - 1
Boys - - - -
Girls - - 2 2
Boys - - 3 3
Girls 1 - 1 2
Boys - - - -
Girls - - - -
Boys 1 - 1 2
Girls - - - -
Boys - - - -
Girls - - - -
Boys - - - -
Girls - - - -
Boys - - - -
Girls - - - -
Boys - - - -
Girls - - 2 2
Morocco
Netherlands
Lithuania
Macedonia
Malaysia
Maldives
Korea
Latvia
Lebanon
Libya
Japan
Jordan
Kazakhstan
Kenya
India
Ireland
Iraq
Italy
Georgia
Germany
Hungary
Iceland
France
… 4.2. Pre-primary foreign students by country, sex, sector and level of education
Country SexPre-primary

88
Government Church Independent Total
Boys - - - -
Girls - - - -
Boys - - - -
Girls - - - 0
Boys 1 - - 1
Girls 1 1 - 2
Boys - - - -
Girls - - - -
Boys 1 - - 1
Girls - - - -
Boys - - - -
Girls - - 1 1
Boys - - - -
Girls - - - -
Boys - - - -
Girls - - 1 1
Boys - - - -
Girls - - - -
Boys - - - -
Girls - - - -
Boys - - - -
Girls - - - -
Boys - - - -
Girls - - - -
Boys 1 - 2 3
Girls 1 1 6 8
Boys - - - -
Girls - - - -
Boys - - - -
Girls - - - -
Boys - - - -
Girls - - - -
Boys - - - -
Girls - - - -
Boys - - - -
Girls - - - -
Boys 1 - - 1
Girls - - - -
Boys - - - -
Girls - - - -
Boys - 1 - 1
Girls - - - -
Boys - - - -
Girls 1 - - 1
Boys - - - -
Girls - - - -Sudan
Somalia
South Africa
Spain
Sri Lanka
Serbia
Sierra Leone
Slovakia
Slovenia
Puerto Rico
Romania
Russia
Senegal
Peru
Philippines
Poland
Portugal
Nigeria
Norway
Pakistan
Palestine
New Zealand
Niger
… 4.2. Pre-primary foreign students by country, sex, sector and level of education
Country SexPre-primary

89
Government Church Independent Total
Boys - - - -
Girls - - - -
Boys - - - -
Girls - - - -
Boys - - 2 2
Girls - - 2 2
Boys - - - -
Girls - - - -
Boys 2 - - 2
Girls - - 1 1
Boys - - 2 2
Girls 1 - 1 2
Boys - - - -
Girls - - - -
Boys 1 - - 1
Girls - - - -
Boys 4 1 5 10
Girls 2 - 7 9
Boys - - 2 2
Girls - - - -
Boys - - - -
Girls - - - -
Boys 28 3 6 37
Girls 15 1 12 28
Boys 51 5 45 101
Girls 38 5 53 96
Total 89 10 98 197
United Kingdom
United States
Uzbekistan
Other
Thailand
Tunisia
Turkey
Ukraine
Sweden
Switzerland
Syria
… 4.2. Pre-primary foreign students by country, sex, sector and level of education
Country SexPre-primary
United Arab Emirates
Total

90
Government Church Independent Total
Boys - - - -
Girls - - - -
Boys 1 1 - 2
Girls 2 - - 2
Boys - - - -
Girls - - - -
Boys 8 - 6 14
Girls 3 2 3 8
Boys - - - -
Girls - - 1 1
Boys - - - -
Girls - - - -
Boys - - - -
Girls - - - -
Boys - - - -
Girls 1 - - 1
Boys 2 1 - 3
Girls - - 2 2
Boys - - - -
Girls - - - -
Boys 1 - - 1
Girls 1 - - 1
Boys - - - -
Girls - - - -
Boys 5 - 6 11
Girls 7 - 4 11
Boys 2 - 2 4
Girls 3 - 1 4
Boys - - 1 1
Girls 1 - 2 3
Boys 4 - - 4
Girls 2 - - 2
Boys 1 - - 1
Girls 2 - - 2
Boys - - 1 1
Girls - - - -
Boys - - - -
Girls - - - -
Boys 4 - 3 7
Girls 1 - 4 5
Boys 9 - - 9
Girls 6 - - 6
Boys 2 - - 2
Girls 3 - - 3
Boys - - - -
Girls - - - -
4.2.1. Primary foreign students by country, sex, sector and level of education …
SexCountry Primary
Afghanistan
Albania
Argentina
Australia
Austria
Bahamas
Bangladesh
Belarus
Belgium
Benin
Bosnia
Brazil
Bulgaria
Canada
China
Congo
Croatia
Czech Republic
Denmark
Egypt
Eritrea
Ethiopia
Finland

91
Government Church Independent Total
Boys - - 6 6
Girls 1 - 4 5
Boys 1 - - 1
Girls - - - -
Boys 5 - 10 15
Girls 4 3 11 18
Boys - - 1 1
Girls - - - -
Boys - - 2 2
Girls - - 2 2
Boys - - 3 3
Girls - - - -
Boys 1 - 2 3
Girls - - 1 1
Boys - 1 - 1
Girls - - 2 2
Boys 4 - 16 20
Girls 4 5 12 21
Boys - - - -
Girls - - 1 1
Boys - - - -
Girls 1 - - 1
Boys - - - -
Girls - - - -
Boys - - - -
Girls 1 - - 1
Boys - - - -
Girls - - - -
Boys - - - -
Girls - - 1 1
Boys - - - -
Girls - - - -
Boys 7 - 5 12
Girls 4 - 8 12
Boys - - - -
Girls - - - -
Boys - - - -
Girls - - - -
Boys - - - -
Girls 1 - - 1
Boys 1 - - 1
Girls 1 - - 1
Boys 1 - - 1
Girls 2 - - 2
Boys 3 - 6 9
Girls 2 1 - 3
France
… 4.2.1. Primary foreign students by country, sex, sector and level of education
Country SexPrimary
Georgia
Germany
Hungary
Iceland
India
Ireland
Iraq
Italy
Japan
Jordan
Kazakhstan
Kenya
Korea
Latvia
Lebanon
Libya
Lithuania
Macedonia
Malaysia
Maldives
Morocco
Netherlands

92
Government Church Independent Total
Boys - - - -
Girls 1 - - 1
Boys - - - -
Girls - - - -
Boys 3 1 1 5
Girls - - 1 1
Boys - - 1 1
Girls - - - -
Boys 1 - - 1
Girls - - - -
Boys - - 2 2
Girls - - - -
Boys - - - -
Girls - - - -
Boys - - 2 2
Girls 2 - - 2
Boys - 1 1 2
Girls 1 1 - 2
Boys - - - -
Girls - - 1 1
Boys - - - -
Girls - - - -
Boys 3 - - 3
Girls 1 - - 1
Boys 8 2 7 17
Girls 6 1 12 19
Boys 1 - - 1
Girls - - - -
Boys 9 1 3 13
Girls 9 3 1 13
Boys - - - -
Girls - - - -
Boys - - - -
Girls - - - -
Boys - - - -
Girls - - 1 1
Boys 5 - - 5
Girls - - - -
Boys - - 1 1
Girls - - 2 2
Boys - - - -
Girls - - 1 1
Boys - - - -
Girls - - - -
Boys - - - -
Girls - - - -
New Zealand
Niger
… 4.2.1. Primary foreign students by country, sex, sector and level of education
Country SexPrimary
Nigeria
Norway
Pakistan
Palestine
Peru
Philippines
Poland
Portugal
Puerto Rico
Romania
Russia
Senegal
Serbia
Sierra Leone
Slovakia
Slovenia
Somalia
South Africa
Spain
Sri Lanka
Sudan

93
Government Church Independent Total
Boys - - 2 2
Girls - - 2 2
Boys - - 1 1
Girls - - 1 1
Boys - - 4 4
Girls - - 4 4
Boys 2 - - 2
Girls - - - -
Boys 1 - - 1
Girls 2 - - 2
Boys 3 - 1 4
Girls 2 1 - 3
Boys 4 1 - 5
Girls 4 - - 4
Boys 1 - - 1
Girls 1 - - 1
Boys 39 5 48 92
Girls 29 8 44 81
Boys 3 - 13 16
Girls 2 1 3 6
Boys - - - -
Girls - - - -
Boys 27 12 7 46
Girls 43 15 8 66
Boys 172 26 164 362
Girls 156 41 140 337
Total 328 67 304 699
United Arab Emirates
Total
Sweden
Switzerland
Syria
… 4.2.1. Primary foreign students by country, sex, sector and level of education
Country SexPrimary
Thailand
Tunisia
Turkey
Ukraine
United Kingdom
United States
Uzbekistan
Other

94
Government Church Independent Total
Boys - - - -
Girls - - - -
Boys - 1 - 1
Girls 1 - - 1
Boys - - - -
Girls - - - -
Boys 30 10 2 42
Girls 8 1 2 11
Boys - - 2 2
Girls - - 1 1
Boys - - - -
Girls - - 2 2
Boys - - - -
Girls - - - -
Boys - - - -
Girls - - - -
Boys - 2 2 4
Girls - - 2 2
Boys - - 1 1
Girls - - - -
Boys 3 - 2 5
Girls - - - -
Boys 1 - - 1
Girls 1 - - 1
Boys 4 1 4 9
Girls 7 - 5 12
Boys 12 4 4 20
Girls 6 2 2 10
Boys 5 - 2 7
Girls - - - -
Boys 1 1 - 2
Girls - 1 - 1
Boys - - - -
Girls - - - -
Boys - - - -
Girls - - 1 1
Boys - - 2 2
Girls 1 1 - 2
Boys 1 1 1 3
Girls 1 - - 1
Boys - - - -
Girls - - - -
Boys 2 - - 2
Girls 1 - - 1
Boys - - - -
Girls - - 1 1
Eritrea
Ethiopia
Finland
Croatia
Czech Republic
Denmark
Egypt
Bulgaria
Canada
China
Congo
Belgium
Benin
Bosnia
Brazil
Austria
Bahamas
Bangladesh
Belarus
4.2.2. Secondary foreign students by country, sex, sector and level of education …
SexCountry Secondary
Afghanistan
Albania
Argentina
Australia

95
Government Church Independent Total
Boys - - 6 6
Girls - - 4 4
Boys - - - -
Girls - - - -
Boys 4 1 14 19
Girls 4 1 4 9
Boys - 1 - 1
Girls - - 2 2
Boys - - 1 1
Girls - - 1 1
Boys - - 4 4
Girls - - - -
Boys 1 - - 1
Girls - - - -
Boys 1 - 4 5
Girls - - 1 1
Boys 5 4 19 28
Girls 3 1 12 16
Boys - - - -
Girls - - 1 1
Boys - - - -
Girls - - - -
Boys 2 - - 2
Girls - - - -
Boys - - - -
Girls - - - -
Boys - - - -
Girls - - 1 1
Boys - - 2 2
Girls 1 1 1 3
Boys - - - -
Girls - - - -
Boys 3 - 3 6
Girls 1 - - 1
Boys 1 - 1 2
Girls - - - -
Boys - - - -
Girls - - - -
Boys - - - -
Girls - - - -
Boys - - - -
Girls - - - -
Boys 4 - - 4
Girls 1 - - 1
Boys 2 1 13 16
Girls - - 1 1
Morocco
Netherlands
Lithuania
Macedonia
Malaysia
Maldives
Korea
Latvia
Lebanon
Libya
Japan
Jordan
Kazakhstan
Kenya
India
Ireland
Iraq
Italy
Georgia
Germany
Hungary
Iceland
France
… 4.2.2. Secondary foreign students by country, sex, sector and level of education
Country SexSecondary

96
Government Church Independent Total
Boys - - - -
Girls - - - -
Boys 1 - - 1
Girls - - - -
Boys 1 - - 1
Girls 1 - - 1
Boys - - - -
Girls - - - -
Boys - - - -
Girls - - - -
Boys - - 1 1
Girls - - - -
Boys - 1 - 1
Girls - - - -
Boys - 1 - 1
Girls 1 - - 1
Boys 1 3 2 6
Girls 1 - 2 3
Boys - - - -
Girls - - - -
Boys - - 1 1
Girls - - - -
Boys - 2 - 2
Girls 2 - - 2
Boys 10 - 6 16
Girls 10 - 6 16
Boys - - - -
Girls - - - -
Boys 3 - 2 5
Girls 6 - 2 8
Boys 1 - - 1
Girls - - - -
Boys 1 - 1 2
Girls 1 - 2 3
Boys - - - -
Girls - - - -
Boys 3 - - 3
Girls 1 - - 1
Boys - - - -
Girls - - - -
Boys - - 1 1
Girls 1 - - 1
Boys 2 - - 2
Girls - - - -
Boys - 1 - 1
Girls - - - -Sudan
Somalia
South Africa
Spain
Sri Lanka
Serbia
Sierra Leone
Slovakia
Slovenia
Puerto Rico
Romania
Russia
Senegal
Peru
Philippines
Poland
Portugal
Nigeria
Norway
Pakistan
Palestine
New Zealand
Niger
… 4.2.2. Secondary foreign students by country, sex, sector and level of education
Country SexSecondary

97
Government Church Independent Total
Boys - 1 2 3
Girls - - 4 4
Boys 1 1 4 6
Girls - - 3 3
Boys 1 - - 1
Girls - - - -
Boys 2 - - 2
Girls 1 - - 1
Boys - - - -
Girls - - - -
Boys 1 - 1 2
Girls 1 - 1 2
Boys 5 - - 5
Girls 3 - 2 5
Boys - - 1 1
Girls - - - -
Boys 42 17 40 99
Girls 32 8 41 81
Boys 21 9 6 36
Girls 14 - 3 17
Boys - - - -
Girls 1 - - 1
Boys 19 2 4 25
Girls 17 7 2 26
Boys 197 65 161 423
Girls 129 23 112 264
Total 326 88 273 687
United Kingdom
United States
Uzbekistan
Other
Thailand
Tunisia
Turkey
Ukraine
Sweden
Switzerland
Syria
… 4.2.2. Secondary foreign students by country, sex, sector and level of education
Country SexSecondary
United Arab Emirates
Total
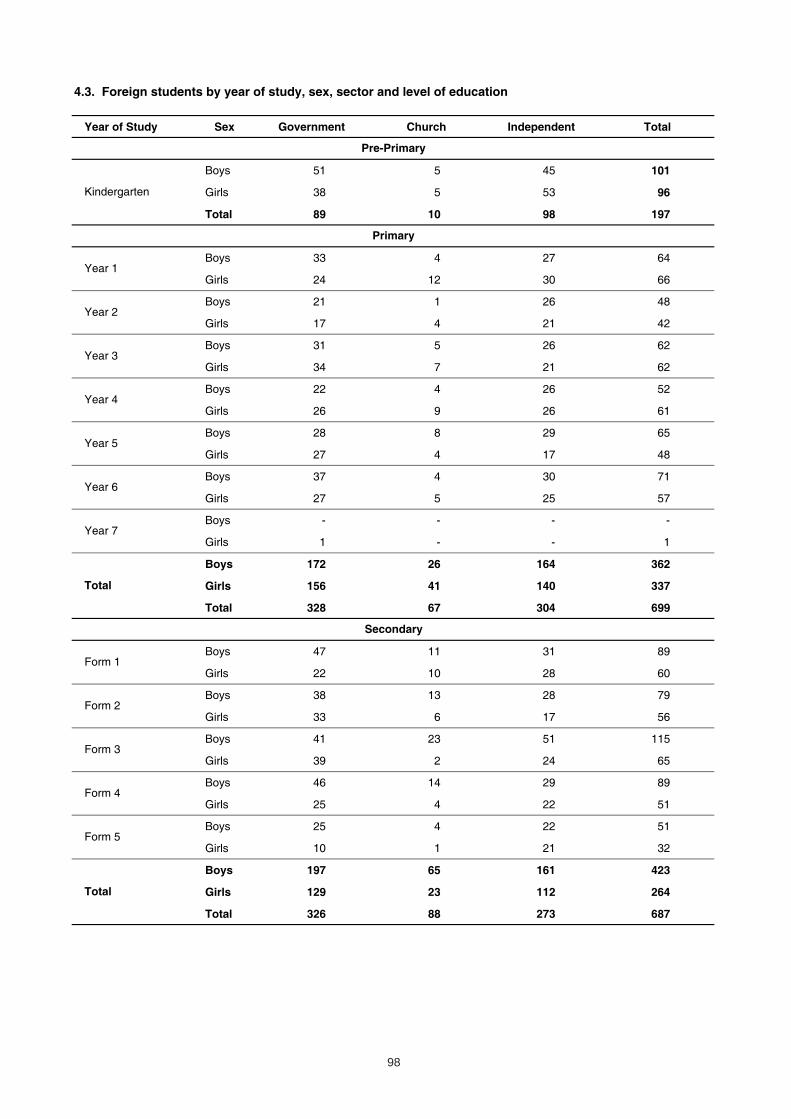
98
Year of Study Sex Government Church Independent Total
Boys 51 5 45 101
Girls 38 5 53 96
Total 89 10 98 197
Boys 33 4 27 64
Girls 24 12 30 66
Boys 21 1 26 48
Girls 17 4 21 42
Boys 31 5 26 62
Girls 34 7 21 62
Boys 22 4 26 52
Girls 26 9 26 61
Boys 28 8 29 65
Girls 27 4 17 48
Boys 37 4 30 71
Girls 27 5 25 57
Boys - - - -
Girls 1 - - 1
Boys 172 26 164 362
Girls 156 41 140 337
Total 328 67 304 699
Boys 47 11 31 89
Girls 22 10 28 60
Boys 38 13 28 79
Girls 33 6 17 56
Boys 41 23 51 115
Girls 39 2 24 65
Boys 46 14 29 89
Girls 25 4 22 51
Boys 25 4 22 51
Girls 10 1 21 32
Boys 197 65 161 423
Girls 129 23 112 264
Total 326 88 273 687
Total
Form 3
Form 4
Form 5
Kindergarten
Total
Year 6
Year 7
Year 4
Year 5
Form 1
Form 2
Secondary
Primary
Pre-Primary
4.3. Foreign students by year of study, sex, sector and level of education
Year 1
Year 2
Year 3

99
Total 5A 5B 6
All countries 639 594 43 2
Africa 63 61 1 1
Algeria 3 3 - -
Burkina Faso 1 1 - -
Cameroon 2 2 - -
Egypt 8 8 - -
Eritrea 2 2 - -
Ethiopia 3 2 1 -
Kenya 6 6 - -
Libya 4 3 - 1
Malawi 1 1 - -
Mauritius 1 1 - -
Morocco 6 6 - -
Nigeria 10 10 - -
Seychelles 1 1 - -
Sierra Leone 3 3 - -
Tunisia 8 8 - -
Uganda 3 3 - -
Zambia 1 1 - -
North America 11 11 - -
Canada 2 2 - -
United States of America 9 9 - -
Latin America and the Caribbean 9 9 - -
Antigua and Barbuda 1 1 - -
Bahamas 1 1 - -
Barbados 1 1 - -
Colombia 1 1 - -
Mexico 2 2 - -
Perù 2 2 - -
St.Kitts and Nevis 1 1 - -
Asia 308 278 30 -Armenia 1 1 - -China 219 202 17 -India 2 2 - -Iran 1 1 - -Iraq 2 2 - -Israel 6 6 - -Japan 1 1 - -Jordan 2 2 - -Kuwait 28 18 10 -Lebanon 8 8 - -Myanmar 2 2 - -Pakistan 1 1 - -Palestinian Autonomous Territories 14 13 1 -Philippines 4 4 - -Syria 2 1 1 -Turkey 13 12 1 -Uzbekistan 2 2 - -
4.4 Number of foreign students enrolled at the University of Malta attending a tertiary level of education (ISC5/6) by level of education, programme destination and country of citizenship …
Students by country of citizenship
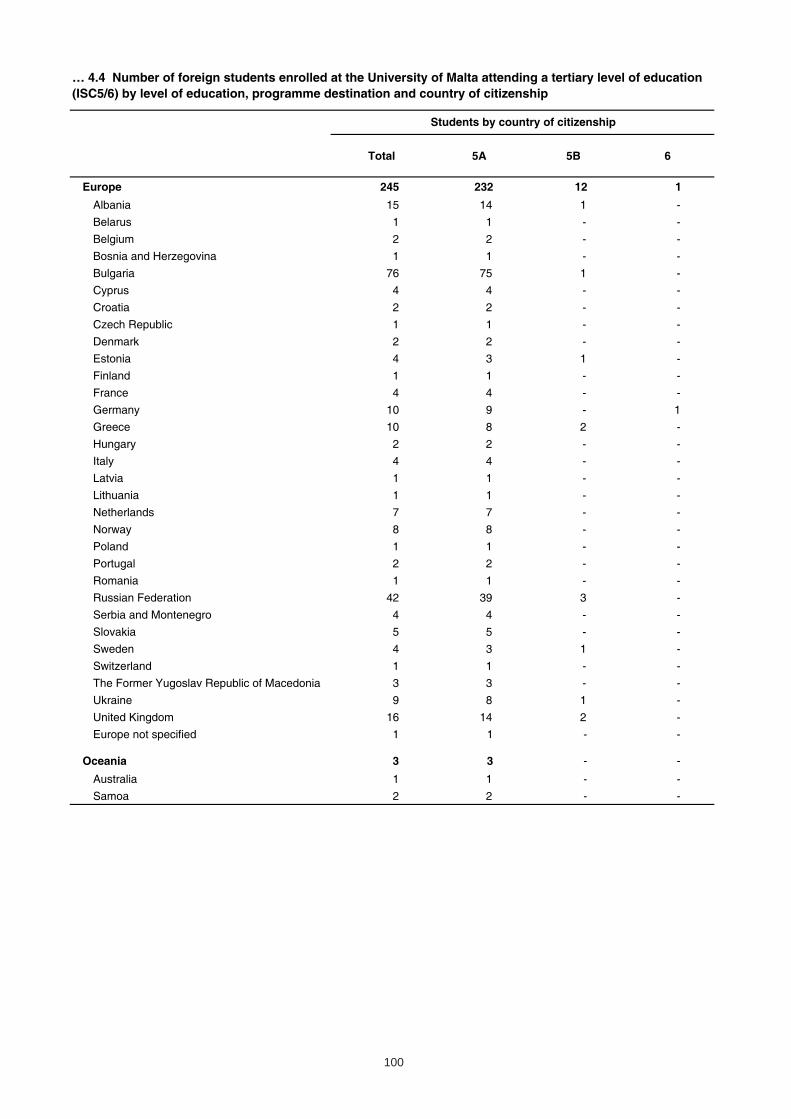
100
Total 5A 5B 6
Europe 245 232 12 1
Albania 15 14 1 -
Belarus 1 1 - -
Belgium 2 2 - -
Bosnia and Herzegovina 1 1 - -
Bulgaria 76 75 1 -
Cyprus 4 4 - -
Croatia 2 2 - -
Czech Republic 1 1 - -
Denmark 2 2 - -
Estonia 4 3 1 -
Finland 1 1 - -
France 4 4 - -
Germany 10 9 - 1
Greece 10 8 2 -
Hungary 2 2 - -
Italy 4 4 - -
Latvia 1 1 - -
Lithuania 1 1 - -
Netherlands 7 7 - -
Norway 8 8 - -
Poland 1 1 - -
Portugal 2 2 - -
Romania 1 1 - -
Russian Federation 42 39 3 -
Serbia and Montenegro 4 4 - -
Slovakia 5 5 - -
Sweden 4 3 1 -
Switzerland 1 1 - -
The Former Yugoslav Republic of Macedonia 3 3 - -
Ukraine 9 8 1 -
United Kingdom 16 14 2 -
Europe not specified 1 1 - -
Oceania 3 3 - -
Australia 1 1 - -
Samoa 2 2 - -
… 4.4 Number of foreign students enrolled at the University of Malta attending a tertiary level of education (ISC5/6) by level of education, programme destination and country of citizenship
Students by country of citizenship

101
Total 5A 5B 6
All fields of education 639 594 43 2
Education (14) 5 5 - -
Teacher training (141) 3 3 - -
Education science (142) 2 2 - -
Humanities and Arts 151 109 41 1
Arts (21) 88 88 - -
Humanities (22) 63 21 41 1
Social sciences, business and law 328 327 1 -
Social and behavioural science (31) 51 51 - -
Business and administration (34) 163 162 1 -
Law (38) 114 114 - -
Science 24 24 - -
Life sciences (42) 2 2 - -
Physical sciences (44) 2 2 - -
Mathematics and statistics (46) 1 1 - -
Computing (48) 19 19 - -
Engineering, manufacturing and construction 16 16 - -
Engineering and engineering trades (52) 11 11 - -
Architecture and building (58) 5 5 - -
Health and welfare 68 67 - 1
Health (72) 66 65 - 1
Social services (76) 2 2 - -
Services 47 46 1 -
Personal services (81) 43 42 1 -
Environmental protection (85) 4 4 - -
Foreign Students
4.5. Number of foreign students attending a tertiary level of education (ISC 5/6) at the University of Malta by level of education and field of study

CHAPTER 5
Special Education


105
5.1. Students attending special schools by sex and age
Males Females Total
3 2 1 3
4 2 1 3
5 5 2 7
6 2 1 3
7 2 4 6
8 1 5 6
9 3 4 7
10 1 3 4
11 10 2 12
12 17 16 33
13 10 2 12
14 33 1 34
15 7 4 11
16+ 77 72 149
Total 171 119 290
TotalAge

106
Boys Girls Boys Girls Boys Girls Boys Girls Boys Girls Boys Girls Boys Girls Boys Girls Boys Girls Total
Guardian Angel School, amrun 8 7 8 7 5 4 - - 1 1 5 5 4 3 - - 31 27 58
Mater Dei School, Msida - - - - - - - - - - - - - - 21 - 21 - 21
Skola Helen Keller, Qrendi 1 1 10 9 10 8 5 4 9 8 - - - - - - 35 30 65
San Miguel, Pembroke - - - - 28 20 - - - - - - - - - - 28 20 48
Dun Manwel Attard, Wardija 11 8 10 8 1 1 1 - 1 - 5 3 2 1 - - 31 21 52
Prof. G. Aquilina, Sannat, Gozo 1 - 11 9 8 6 - - 2 2 1 1 3 2 - - 26 20 46
Total 21 16 39 33 52 39 6 4 13 11 11 9 9 6 21 - 172 118 290
* Disabilities as classified by special schools.
Challenging Behaviour
Multiple Disabilities
TotalEmotional Difficulties
5.2. Students attending special schools by sex and type of disability *
School
Learning Difficulties Mobility Problems
Hearing ImpairedModerate Severe
Visually Impaired

107
Age SexHead of School
TeacherSupply Teacher
Kindergarten Assistant
Supply Kindergarten
AssistantInstructor Facilitator Total
Total Males 2 8 1 - 6 2 - 19
Females 2 30 8 49 31 5 18 143
Total 4 38 9 49 37 7 18 162
under 21 Males - - - - - - - -
Females - - - - 3 - - 3
19 Males - - - - - - - -
Females - - - - 2 - - 2
20 Males - - - - - - - -
Females - - - - 1 - - 1
21-24 Males - 1 - - 4 - - 5
Females - 8 3 - 12 - 2 25
21 Males - - - - 2 - - 2
Females - - - - 2 - - 2
22 Males - 1 - - 1 - - 2
Females - 2 - - 3 - - 5
23 Males - - - - 1 - - 1
Females - 3 1 - 3 - 1 8
24 Males - - - - - - - -
Females - 3 2 - 4 - 1 10
25-29 Males - - - - 2 - - 2
Females - 7 4 - 3 - 7 21
25 Males - - - 2 - 2
Females - 1 2 - - - 3 6
26 Males - - - - - - - -
Females - - - - - - 2 2
27 Males - - - - - - - -
Females - 2 1 - 2 - 1 6
28 Males - - - - - - - -
Females - 2 1 - - - 1 4
29 Males - - - - - - - -
Females - 2 - - 1 - 3
30-34 Males - 4 - - - - - 4
Females - 4 1 - 1 - 5 11
30 Males - 2 - - - - - 2
Females - 1 - - - - 3 4
31 Males - - - - - - - -
Females - 1 - - - - - 1
32 Males - 1 - - - - - 1
Females - 1 1 - 1 - 1 4
34 Males - 1 - - - - - 1
Females - 1 - - - - 1 2
35-39 Males - - - - - - - -
Females - 1 - 4 3 - 2 10
35 Males - - - - - - - -
Females - 1 - - - - - 1
36 Males - - - - - - - -
Females - - - 1 - - 1 2
37 Males - - - - - - - -
Females - - - - 1 - - 1
38 Males - - - - - - - -
Females - - - 1 1 - 1 3
39 Males - - - - - - - -
Females - - - 2 1 - - 3
5.3. Teaching staff in Government special schools classified by grade, sex and age …

108
Age SexHead of School
TeacherSupply Teacher
Kindergarten Assistant
Supply Kindergarten
AssistantInstructor Facilitator Total
40-44 Males - 1 - - - - - 1
Females - 2 - 6 4 2 - 14
40 Males - - - - - - - -
Females - - - 2 1 - - 3
41 Males - - - - - - - -
Females - 2 - - 1 2 - 5
42 Males - - - - - - - -
Females - - - 2 - - - 2
43 Males - - - - - - - -
Females - - - 1 2 - - 3
44 Males - 1 - - - - - 1
Females - - - 1 - - - 1
45-49 Males - 1 1 - - 1 - 3
Females - 1 - 12 3 - 1 17
45 Males - - - - - - - -
Females - - - 1 1 - 1 3
46 Males - 1 1 - - - - 2
Females - - - - - - - -
47 Males - - - - - - - -
Females - - - 3 - - - 3
48 Males - - - - - - - -
Females - - - 4 - - - 4
49 Males - - - - - 1 - 1
Females - 1 - 4 2 - - 7
50-54 Males 1 - - - - 1 - 2
Females - 3 - 13 2 1 1 20
50 Males - - - - - - - -
Females - 1 - 1 - - - 2
51 Males 1 - - - - - - 1
Females - - - 6 1 1 - 8
52 Males - - - - - 1 - 1
Females - - - 2 - - 1 3
53 Males - - - - - - - -
Females - - - 2 - - - 2
54 Males - - - - - - - -
Females - 2 - 2 1 - - 5
55-60 Males 1 1 - - - - - 2
Females 2 3 - 14 - 2 - 21
55 Males 1 - - - - - - 1
Females 1 - - 6 - - - 7
56 Males - - - - - - - -
Females 1 2 - - - - - 3
57 Males - - - - - - - -
Females - - - 2 - - - 2
58 Males - - - - - - - -
Females - - - 4 - 2 - 6
59 Males - 1 - - - - - 1
Females - - - - - - - -
60 Males - - - - - - - -
Females - 1 - 2 - - - 3
Males - - - - - - - -
Females - 1 - - - - - 1
61 and over
… 5.3. Teaching staff in Government special schools classified by grade, sex and age
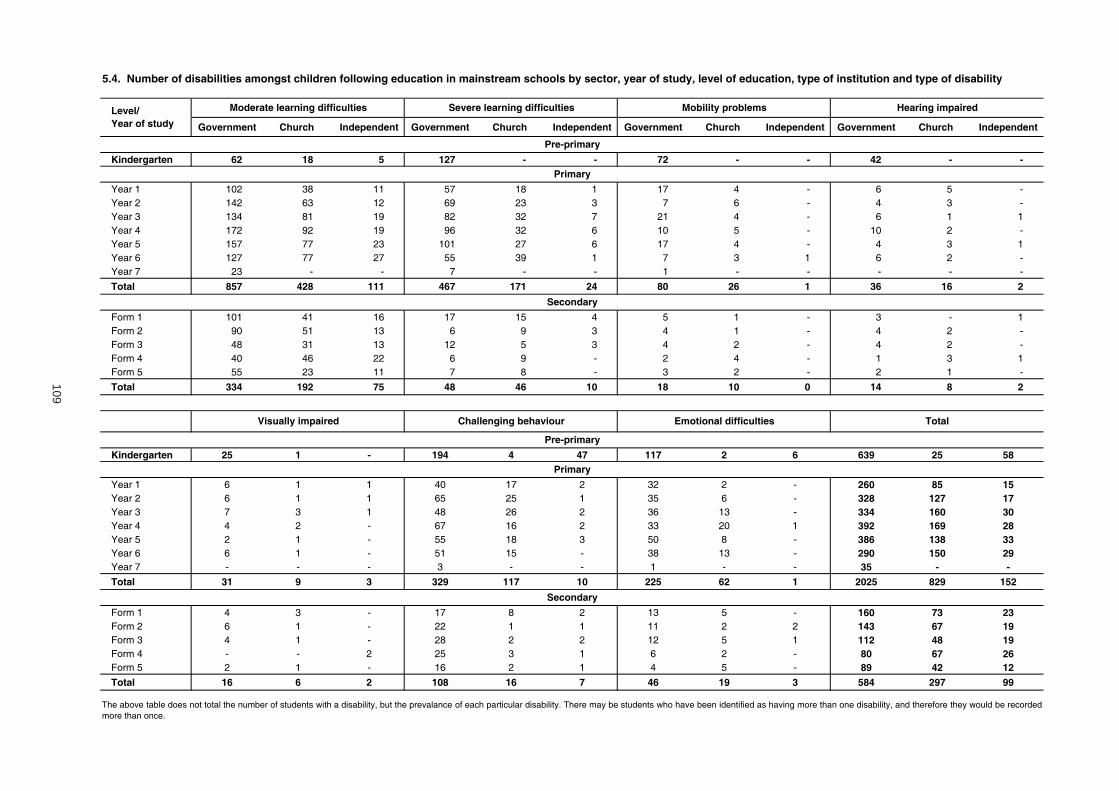
109
Government Church Independent Government Church Independent Government Church Independent Government Church Independent
Kindergarten 62 18 5 127 - - 72 - - 42 - -
Year 1 102 38 11 57 18 1 17 4 - 6 5 -Year 2 142 63 12 69 23 3 7 6 - 4 3 -Year 3 134 81 19 82 32 7 21 4 - 6 1 1Year 4 172 92 19 96 32 6 10 5 - 10 2 -Year 5 157 77 23 101 27 6 17 4 - 4 3 1Year 6 127 77 27 55 39 1 7 3 1 6 2 -Year 7 23 - - 7 - - 1 - - - - -
Total 857 428 111 467 171 24 80 26 1 36 16 2
Form 1 101 41 16 17 15 4 5 1 - 3 - 1Form 2 90 51 13 6 9 3 4 1 - 4 2 -Form 3 48 31 13 12 5 3 4 2 - 4 2 -Form 4 40 46 22 6 9 - 2 4 - 1 3 1Form 5 55 23 11 7 8 - 3 2 - 2 1 -
Total 334 192 75 48 46 10 18 10 0 14 8 2
Kindergarten 25 1 - 194 4 47 117 2 6 639 25 58
Year 1 6 1 1 40 17 2 32 2 - 260 85 15Year 2 6 1 1 65 25 1 35 6 - 328 127 17Year 3 7 3 1 48 26 2 36 13 - 334 160 30Year 4 4 2 - 67 16 2 33 20 1 392 169 28Year 5 2 1 - 55 18 3 50 8 - 386 138 33Year 6 6 1 - 51 15 - 38 13 - 290 150 29Year 7 - - - 3 - - 1 - - 35 - -
Total 31 9 3 329 117 10 225 62 1 2025 829 152
Form 1 4 3 - 17 8 2 13 5 - 160 73 23Form 2 6 1 - 22 1 1 11 2 2 143 67 19Form 3 4 1 - 28 2 2 12 5 1 112 48 19Form 4 - - 2 25 3 1 6 2 - 80 67 26Form 5 2 1 - 16 2 1 4 5 - 89 42 12
Total 16 6 2 108 16 7 46 19 3 584 297 99
5.4. Number of disabilities amongst children following education in mainstream schools by sector, year of study, level of education, type of institution and type of disability
Total
Mobility problems
Visually impaired
Level/ Year of study
Moderate learning difficulties Severe learning difficulties Hearing impaired
Pre-primary
Secondary
Primary
The above table does not total the number of students with a disability, but the prevalance of each particular disability. There may be students who have been identified as having more than one disability, and therefore they would be recordedmore than once.
Pre-primary
Primary
Secondary
Challenging behaviour Emotional difficulties

110
Boys Girls Boys Girls Boys Girls Boys Girls Total
Pre-primary
Kindergarten 3 and under 62 42 1 1 17 5 80 48 128
4 90 56 4 6 15 8 109 70 179
5 34 15 1 5 7 - 42 20 62
Total 186 113 6 12 39 13 231 138 369
Primary
Year 1 5 82 48 26 30 4 3 112 81 193
6 44 23 8 10 4 2 56 35 91
7 - - - 1 2 - 2 1 3
Total 126 71 34 41 10 5 170 117 287
Year 2 6 107 44 38 39 8 1 153 84 237
7 69 22 16 14 7 1 92 37 129
8 5 4 - 1 - - 5 5 10
Total 181 70 54 54 15 2 250 126 376
Year 3 7 98 41 58 39 12 7 168 87 255
8 74 43 14 21 8 3 96 67 163
9 9 4 4 2 - - 13 6 19
10 - - - - 0 0 0
Total 181 88 76 62 20 10 277 160 437
Year 4 8 153 55 57 48 18 7 228 110 338
9 73 31 26 25 5 - 104 56 160
10 9 9 1 1 2 - 12 10 22
Total 235 95 84 74 25 7 344 176 520
Year 5 9 136 57 49 23 11 6 196 86 282
10 71 44 31 18 8 3 110 65 175
11 4 1 5 2 2 - 11 3 14
Total 211 102 85 43 21 9 317 154 471
Year 6 9 1 - 2 - 1 - 4 - 4
10 102 35 61 22 12 7 175 64 239
11 66 23 27 13 6 2 99 38 137
12 4 4 3 3 1 - 8 7 15
13 - - - - - 0 0 0
Total 173 62 93 38 20 9 286 109 395
Year 7 11 16 9 - - - - 16 9 25
12 7 1 - - - - 7 1 8
Total 23 10 - - - - 23 10 33
Total 1,130 498 426 312 111 42 1,667 852 2,519
5.5. Children with special needs following education in mainstream schools by sex, age, year of study, level of education and sector …
Government Church Independent TotalAgeLevel/Year

111
Boys Girls Boys Girls Boys Girls Boys Girls Total
Secondary
Form 1 11 66 21 17 12 10 1 93 34 127
12 32 5 16 11 6 2 54 18 72
13 5 4 3 2 4 - 12 6 18
14 - - - - 0 0 0
Total 103 30 36 25 20 3 159 58 217
Form 2 12 49 13 13 30 6 5 68 48 116
13 38 9 8 13 3 4 49 26 75
14 11 1 1 1 - - 12 2 14
Total 98 23 22 44 9 9 129 76 205
Form 3 13 33 8 8 9 6 5 47 22 69
14 24 9 12 7 5 2 41 18 59
15 10 4 3 1 1 - 14 5 19
Total 67 21 23 17 12 7 102 45 147
Form 4 14 8 10 10 23 11 4 29 37 66
15 32 9 9 15 8 3 49 27 76
16 7 1 2 1 - - 9 2 11
17 - 1 - - - - 0 1 1
Total 47 21 21 39 19 7 87 67 154
Form 5 15 33 6 12 4 3 - 48 10 58
16 18 9 8 6 6 3 32 18 50
17 4 3 3 2 - - 7 5 12
Total 55 18 23 12 9 3 87 33 120
Total 370 113 125 137 69 29 564 279 843
Total
… 5.5. Children with special needs following education in mainstream schools by sex, age, year of study, level of education and sector
Level/Year AgeGovernment Church Independent

112
Full-time facilitatorShared
facilitatorFull-time facilitator
Shared facilitator
Kindergarten 3 and under 6 3 4 -
4 10 2 4 -
5 3 - 1 -
Total 19 5 9 -
Kindergarten 3 and under 1 - 1 -
4 1 - 1 -
5 1 - 2 1
Total 3 - 4 1
Kindergarten 3 and under - 1 - 3
4 - - - -
5 - - - -
Total - 1 - 3
Kindergarten 3 and under 7 4 5 3
4 11 2 5 -
5 4 - 3 1
Total 22 6 13 4
Independent
Church
Total
Government
Pre-primary
Year of study Age
Girls
5.6. Pre-primary children with special needs having a facilitator (shared or individual) following education in mainstream school by sex, age, year of study, level of education and type of institution
Boys

113
Full-time facilitatorShared
facilitatorFull-time facilitator
Shared facilitator
Year 1 5 23 5 11 1
6 21 3 7 2
7 - - - -
Total 44 8 18 3
Year 2 6 30 17 7 8
7 29 6 6 3
8 1 1 2 2
Total 60 24 15 13
Year 3 7 25 17 13 8
8 19 10 10 4
9 4 4 - 4
10 - -
Total 48 31 23 16
Year 4 8 27 30 11 6
9 22 11 14 3
10 6 1 7 -
Total 55 42 32 9
Year 5 9 35 28 9 6
10 20 16 12 11
11 2 1 - -
Total 57 45 21 17
Year 6 9 - 1 - -
10 34 31 3 11
11 26 18 12 6
12 2 1 2 1
13 - - -
Total 62 51 17 18
Year 7 11 3 5 1 1
12 - - 1 -
Total 3 5 2 1
329 206 128 77Total
5.6.1. Primary children with special needs having a facilitator (shared or individual) following education in mainstream school by sex, age, year of study, level of education and type of institution …
Year of study Age
Boys Girls
Primary - Government

114
Full-time facilitatorShared
facilitatorFull-time facilitator
Shared facilitator
Year 1 5 6 - 7 1
6 4 2 2 2
7 - - 1 -
Total 10 2 10 3
Year 2 6 12 1 9 3
7 6 1 5 -
8 - - - -
Total 18 2 14 3
Year 3 7 12 5 5 2
8 - 2 7 -
9 2 1 2 -
10 - - - -
Total 14 8 14 2
Year 4 8 6 6 9 3
9 6 3 2 2
10 - - 1 -
Total 12 9 12 5
Year 5 9 3 5 10 3
10 4 7 9 2
11 1 2 1 1
Total 8 14 20 6
Year 6 9 - - - -
10 7 5 9 -
11 3 6 5 2
12 - 1 2 -
13 - - - -
Total 10 12 16 2
Year 7 11 - - - -
12 - - - -
Total - - - -
72 47 86 21Total
Primary - Church
… 5.6.1. Primary children with special needs having a facilitator (shared or individual) following education in mainstream school by sex, age, year of study, level of education and type of institution
Year of study Age
Boys Girls

115
Full-time facilitatorShared
facilitatorFull-time facilitator
Shared facilitator
Year 1 5 - - - 1
6 - - - -
7 1 - - -
Total 1 - - 1
Year 2 6 - - - -
7 4 - - -
8 - - - -
Total 4 - - -
Year 3 7 2 - - -
8 1 2 - -
9 - - - -
10 - - - -
Total 3 2 - -
Year 4 8 2 4 1 3
9 1 2 - -
10 - 1 - -
Total 3 7 1 3
Year 5 9 2 2 - 2
10 3 2 - 1
11 - - - -
Total 5 4 - 3
Year 6 9 - - - -
10 - - - 2
11 - 2 - -
12 - - - -
13 - - - -
Total - 2 - 2
Year 7 11 - - - -
12 - - - -
Total - - - -
16 15 1 9
Primary - Independent
Total
… 5.6.1. Primary children with special needs having a facilitator (shared or individual) following education in mainstream school by sex, age, year of study, level of education and type of institution
Year of study Age
Boys Girls

116
Full-time facilitatorShared
facilitatorFull-time facilitator
Shared facilitator
Year 1 5 29 5 18 3
6 25 5 9 4
7 1 0 1 0
Total 55 10 28 7
Year 2 6 42 18 16 11
7 39 7 11 3
8 1 1 2 2
Total 82 26 29 16
Year 3 7 39 22 18 10
8 20 14 17 4
9 6 5 2 4
10 - - - -
Total 65 41 37 18
Year 4 8 35 40 21 12
9 29 16 16 5
10 6 2 8 0
Total 70 58 45 17
Year 5 9 40 35 19 11
10 27 25 21 14
11 3 3 1 1
Total 70 63 41 26
Year 6 9 - 1 - -
10 41 36 12 13
11 29 26 17 8
12 2 2 4 1
13 - - - -
Total 72 65 33 22
Year 7 11 3 5 1 1
12 - - 1 -
Total 3 5 2 1
417 268 215 107
… 5.6.1. Primary children with special needs having a facilitator (shared or individual) following education in mainstream school by sex, age, year of study, level of education and type of institution
Year of study Age
Boys Girls
Primary - Total
Total

117
Full-time facilitatorShared
facilitatorFull-time facilitator
Shared facilitator
Form 1 11 21 12 7 2
12 11 7 3 -
13 2 - 2 2
14 - - - -
Total 34 19 12 4
Form 2 12 7 7 3 5
13 16 1 4 4
14 8 - 1 -
Total 31 8 8 9
Form 3 13 6 1 3 1
14 8 3 1 2
15 3 - 3 -
Total 17 4 7 3
Form 4 14 5 2 3 -
15 5 2 6 -
16 1 1 - 1
17 - - 1 -
Total 11 5 10 1
Form 5 15 7 2 4 2
16 7 1 5 3
17 2 - 3 -
Total 16 3 12 5
109 39 49 22
Year of study Age
Boys Girls
5.6.2. Secondary children with special needs having a facilitator (shared or individual) following education in mainstream school by sex, age, year of study, level of education and type of institution …
Secondary - Government
Total

118
Full-time facilitatorShared
facilitatorFull-time facilitator
Shared facilitator
Form 1 11 11 4 9 3
12 7 4 8 2
13 2 1 2 -
14 - - - -
Total 20 9 19 5
Form 2 12 4 3 5 3
13 1 2 3 1
14 1 - 1 -
Total 6 5 9 4
Form 3 13 3 2 5 1
14 3 4 4 1
15 1 - 1 -
Total 7 6 10 2
Form 4 14 4 1 2 -
15 3 3 6 -
16 2 - - -
17 - - - -
Total 9 4 8 -
Form 5 15 2 4 3 -
16 4 1 3 1
17 3 - 1 1
Total 9 5 7 2
51 29 53 13
… 5.6.2. Secondary children with special needs having a facilitator (shared or individual) following education in mainstream school by sex, age, year of study, level of education and type of institution
Year of study Age
Boys Girls
Secondary - Church
Total

119
Full-time facilitatorShared
facilitatorFull-time facilitator
Shared facilitator
Form 1 11 1 - - -
12 1 1 - 1
13 - - - -
14 - - - -
Total 2 1 - 1
Form 2 12 - - - 2
13 - - - -
14 - - - -
Total - - - 2
Form 3 13 1 - - -
14 - - - -
15 - - - -
Total 1 - - -
Form 4 14 - - - -
15 2 1 - -
16 - - - -
17 - - - -
Total 2 1 - -
Form 5 15 - - - -
16 - - - -
17 - - - -
Total - - - -
5 2 0 3
… 5.6.2. Secondary children with special needs having a facilitator (shared or individual) following education in mainstream school by sex, age, year of study, level of education and type of institution
Year of study Age
Boys Girls
Secondary - Independent
Total

120
Full-time facilitatorShared
facilitatorFull-time facilitator
Shared facilitator
Form 1 11 33 16 16 5
12 19 12 11 3
13 4 1 4 2
14 0 0 0 0
Total 56 29 31 10
Form 2 12 11 10 8 10
13 17 3 7 5
14 9 0 2 0
Total 37 13 17 15
Form 3 13 10 3 8 2
14 11 7 5 3
15 4 0 4 0
Total 25 10 17 5
Form 4 14 9 3 5 0
15 10 6 12 0
16 3 1 0 1
17 0 0 1 0
Total 22 10 18 1
Form 5 15 9 6 7 2
16 11 2 8 4
17 5 0 4 1
Total 25 8 19 7
165 70 102 38
Secondary - Total
Total
… 5.6.2. Secondary children with special needs having a facilitator (shared or individual) following education in mainstream school by sex, age, year of study, level of education and type of institution
Year of study Age
Boys Girls

121
Full-time Facilitator
Shared Facilitator
No Facilitator
Full-time Facilitator
Shared Facilitator
No Facilitator
Full-time Facilitator
Shared Facilitator
No Facilitator
Full-time Facilitator
Shared Facilitator
No Facilitator
Full-time Facilitator
Shared Facilitator
No Facilitator
Full-time Facilitator
Shared Facilitator
No Facilitator
Pre-primary 19 5 18 9 - 11 3 - 3 4 1 7 - - 3 - - 2
Primary 114 123 332 42 56 190 21 24 187 45 11 140 6 8 61 - 8 28
Secondary 86 36 140 33 15 24 29 22 39 32 8 62 1 1 47 - 3 23
Pre-primary 1 - 79 - - 47 - - - - - - - - - - - -
Primary 131 54 144 56 16 63 25 12 76 25 6 39 8 5 14 - 1 1
Secondary 16 3 17 7 2 3 18 4 - 18 3 3 1 1 6 - - 2
Pre-primary 2 - 42 4 - 24 - - - - - - - - - - - -
Primary 45 4 8 19 2 2 9 - 2 8 2 5 - - 1 - - -
Secondary 4 1 3 7 1 2 3 - - 5 - 2 - - - - - -
Pre-primary 1 - 23 - - 18 - - - - - - - - - - - -
Primary 10 11 9 4 - 2 - - 3 5 - 3 - 1 - - - 1
Secondary 2 1 3 6 1 1 1 - - 2 1 4 - - 2 - - -
Pre-primary 1 - 15 - - 9 1 - - - - - - - - - - -
Primary 11 2 8 6 2 2 1 - 1 5 1 1 1 - - - - 2
Secondary 2 - 5 5 3 1 2 3 - 1 - - 2 - - - - -
Pre-primary 5 1 146 2 - 40 - - - 2 - 2 - 1 35 - 3 8
Primary 105 45 127 27 3 22 20 10 40 23 2 22 1 3 5 1 - -
Secondary 21 3 71 2 - 11 5 1 4 4 1 1 1 - 6 - - -
Pre-primary 2 1 65 2 - 47 - - - 1 - 1 - - - - - 6
Primary 59 13 72 30 4 47 4 5 25 14 2 12 1 - - - - -
Secondary 14 3 14 7 2 6 4 1 6 5 2 1 - - 2 - - 1
Pre-primary 31 7 388 17 0 196 4 0 3 7 1 10 0 1 38 0 3 16
Primary 475 252 700 184 83 328 80 51 334 125 24 222 17 17 81 1 9 32
Secondary 145 47 253 67 24 48 62 31 49 67 15 73 5 2 63 0 3 26
5.7. Number of disabilities in mainstream school by sex, type of facilitator assistance, type of disability, level of education and type of institution
Church Independent
Boys Girls Boys GirlsSchool Level
Government
Boys Girls
Moderate learning difficulties
Challenging behaviour
Total
Emotional difficulties
Severe learning difficulties
Mobility problems
Hearing impaired
Visually impaired


CHAPTER 6
Graduates

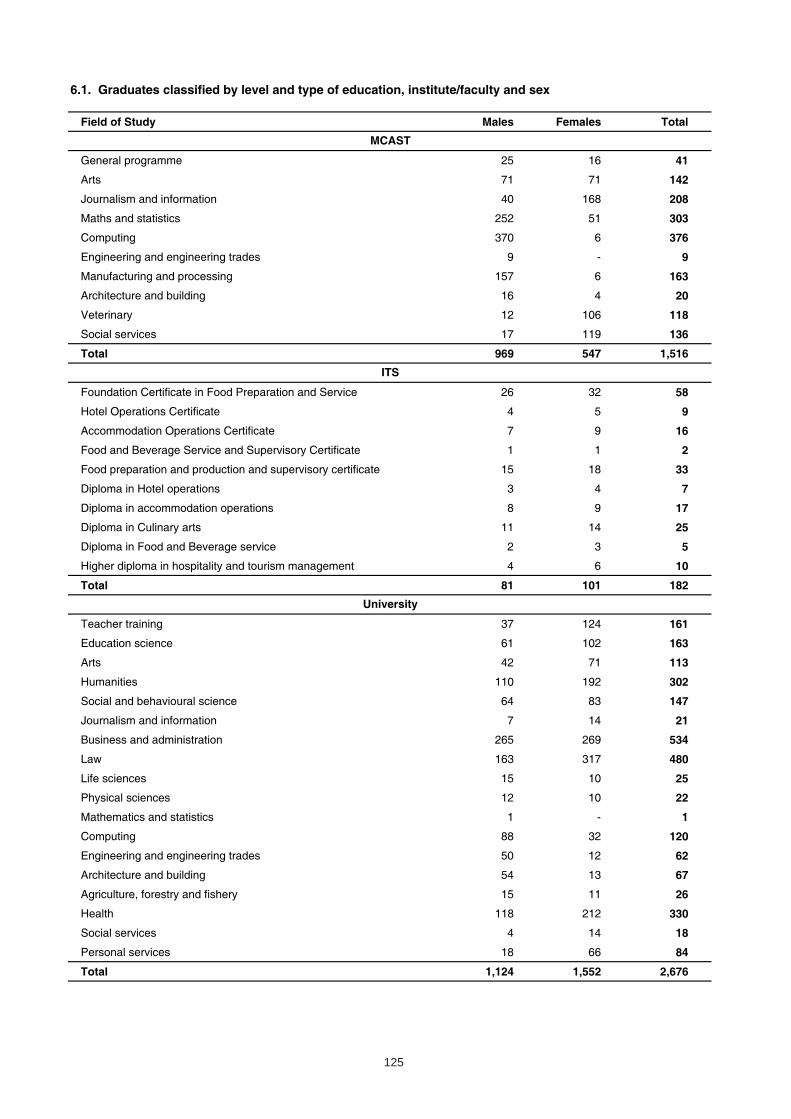
125
Field of Study Males Females Total
General programme 25 16 41
Arts 71 71 142
Journalism and information 40 168 208
Maths and statistics 252 51 303
Computing 370 6 376
Engineering and engineering trades 9 - 9
Manufacturing and processing 157 6 163
Architecture and building 16 4 20
Veterinary 12 106 118
Social services 17 119 136
Total 969 547 1,516
Foundation Certificate in Food Preparation and Service 26 32 58
Hotel Operations Certificate 4 5 9
Accommodation Operations Certificate 7 9 16
Food and Beverage Service and Supervisory Certificate 1 1 2
Food preparation and production and supervisory certificate 15 18 33
Diploma in Hotel operations 3 4 7
Diploma in accommodation operations 8 9 17
Diploma in Culinary arts 11 14 25
Diploma in Food and Beverage service 2 3 5
Higher diploma in hospitality and tourism management 4 6 10
Total 81 101 182
Teacher training 37 124 161
Education science 61 102 163
Arts 42 71 113
Humanities 110 192 302
Social and behavioural science 64 83 147
Journalism and information 7 14 21
Business and administration 265 269 534
Law 163 317 480
Life sciences 15 10 25
Physical sciences 12 10 22
Mathematics and statistics 1 - 1
Computing 88 32 120
Engineering and engineering trades 50 12 62
Architecture and building 54 13 67
Agriculture, forestry and fishery 15 11 26
Health 118 212 330
Social services 4 14 18
Personal services 18 66 84
Total 1,124 1,552 2,676
6.1. Graduates classified by level and type of education, institute/faculty and sex
MCAST
University
ITS

126
Males Females Total Males Females Total Males Females Total Males Females Total Males Females Total
Education 31 119 150 60 102 162 6 5 11 1 - 1 98 226 324
Teacher training 31 119 150 - - - 6 5 11 - - - 37 124 161
Education science - - - 60 102 162 - - - 1 - 1 61 102 163
Humanities and Arts 112 188 300 31 64 95 9 11 20 - - - 152 263 415
Arts 29 48 77 6 16 22 7 7 14 - - - 42 71 113
Humanities 83 140 223 25 48 73 2 4 6 - - - 110 192 302
Social sciences, business and law 319 529 848 107 90 197 73 64 137 - - - 499 683 1182
Social and behavioural science 41 67 108 12 16 28 11 - 11 - - - 64 83 147
Journalism and information 1 1 2 - - - 6 13 19 - - - 7 14 21
Business and administration 172 202 374 39 18 57 54 49 103 - - - 265 269 534
Law 105 259 364 56 56 112 2 2 4 - - - 163 317 480
Science 100 43 143 10 6 16 6 2 8 - 1 1 116 52 168
Life sciences - 1 1 9 6 15 6 2 8 - 1 1 15 10 25
Physical sciences 12 10 22 - - - - - - - - - 12 10 22
Mathematics and statistics - - - 1 - 1 - - - - - - 1 - 1
Computing 88 32 120 - - - - - - - - - 88 32 120
Engineering, manufacturing and construction 99 23 122 3 2 5 1 - 1 1 - 1 104 25 129
Engineering and engineering trades 46 11 57 3 1 4 - - - 1 - 1 50 12 62
Architecture and building 53 12 65 - 1 1 1 - 1 - - - 54 13 67
Agriculture 15 11 26 - - - - - - - - - 15 11 26
Agriculture, forestry and fishery 15 11 26 - - - - - - - - - 15 11 26
Health and welfare 100 211 311 20 12 32 1 3 4 1 - 1 122 226 348
Health 97 200 297 20 12 32 - - - 1 - 1 118 212 330
Social services 3 11 14 - - - 1 3 4 - - - 4 14 18
Services 18 66 84 - - - - - - - - - 18 66 84
Personal services 18 66 84 - - - - - - - - - 18 66 84
Total: All fields of education 794 1,190 1,984 231 276 507 96 85 181 3 1 4 1,124 1,552 2,676
6.2 Graduates at University of Malta classified by field of study, ISCED Level and sex
ISCED 5A
DiplomasDoctor of Philosophy/ Doctor's
degrees
ISCED 5BTotal
ISCED 6
First degree 3-5 yrs Second and further degreesField of Study
CHAPTER 7
Support and Teaching Staff in
Mainstream Education


129
7.1. Teaching staff in pre-primary, primary and secondary schools by level of education, economic sector, age group and sex 1 ...
Males Females Total Males Females Total Males Females Total Males Females Total
less than 25 3 61 64 - 13 13 1 8 9 4 82 8625-29 3 34 37 1 10 11 - 3 3 4 47 5130-34 - 27 27 - 2 2 - 8 8 - 37 3735-39 1 67 68 - 7 7 - 13 13 1 87 8840-44 - 56 56 1 6 7 - 34 34 1 96 9745-49 - 95 95 - 12 12 - 23 23 - 130 13050-54 2 123 125 - 4 4 - 23 23 2 150 15255-59 1 95 96 - 12 12 - 14 14 1 121 12260-64 - 8 8 1 11 12 1 2 3 2 21 2365+ - - - - 8 8 - 1 1 - 9 9Total 10 566 576 3 85 88 2 129 131 15 780 795
less than 25 28 216 244 4 73 77 1 6 7 33 295 32825-29 78 311 389 9 91 100 1 16 17 88 418 50630-34 48 232 280 2 63 65 4 22 26 54 317 37135-39 15 110 125 3 46 49 2 21 23 20 177 19740-44 13 116 129 4 55 59 7 25 32 24 196 22045-49 11 129 140 2 53 55 2 83 85 15 265 28050-54 24 138 162 1 40 41 1 32 33 26 210 23655-59 21 180 201 2 58 60 - 26 26 23 264 28760-64 4 27 31 1 25 26 - 9 9 5 61 6665+ - - 0 1 13 14 2 9 11 3 22 25Total 242 1,459 1,701 29 517 546 20 249 269 291 2,225 2,516
less than 25 63 220 283 20 99 119 4 8 12 87 327 41425-29 153 326 479 58 124 182 16 22 38 227 472 69930-34 163 276 439 58 90 148 19 32 51 240 398 63835-39 116 162 278 38 56 94 14 55 69 168 273 44140-44 72 103 175 39 56 95 24 13 37 135 172 30745-49 77 78 155 24 55 79 6 17 23 107 150 25750-54 118 144 262 13 57 70 4 18 22 135 219 35455-59 146 146 292 20 53 73 2 10 12 168 209 37760-64 25 10 35 3 12 15 1 4 5 29 26 5565+ - - 0 1 7 8 3 - 3 4 7 11Total 933 1,465 2,398 274 609 883 93 179 272 1,300 2,253 3,553
Secondary
Economic Sector
Pre-primary
Age
Primary
Private TotalGovernment Church

130
… 7.1. Teaching staff in pre-primary, primary and secondary schools by level of education, economic sector, age group and sex 1
Males Females Total Males Females Total Males Females Total Males Females Total
less than 25 4 2 6 3 1 4 - - - 7 3 1025-29 7 15 22 6 3 9 - - - 13 18 3130-34 17 23 40 4 11 15 - - - 21 34 5535-39 15 15 30 10 4 14 - - - 25 19 4440-44 18 8 26 3 3 6 - - - 21 11 3245-49 7 6 13 8 3 11 - - - 15 9 2450-54 23 8 31 2 6 8 - - - 25 14 3955-59 20 7 27 3 2 5 - - - 23 9 3260-64 9 1 10 - 2 2 - - - 9 3 1265+ 1 - 1 2 - 2 - - - 3 - 3
Total 121 85 206 41 35 76 - - - 162 120 282
less than 25 - 5 5 - - - - - - - 5 525-29 2 4 6 - - - - - - 2 4 630-34 5 3 8 - - - - - - 5 3 835-39 3 4 7 - - - - - - 3 4 740-44 3 4 7 - - - - - - 3 4 745-49 7 1 8 - - - - - - 7 1 850-54 6 3 9 - - - - - - 6 3 955-59 4 2 6 - - - - - - 4 2 660-64 4 - 4 - - - - - - 4 - 465+ - - 0 - - - - - - - - -
Total 34 26 60 - - - - - - 34 26 60
20-29 60 33 93 - - - - - - 60 33 9330-39 50 29 79 - - - - - - 50 29 7940-49 32 19 51 - - - - - - 32 19 5150-59 31 17 48 - - - - - - 31 17 4860+ 2 2 4 - - - - - - 2 2 4
Total 175 100 275 - - - - - - 175 100 275
Age
Economic Sector
Government Church Private Total
Post-Secondary General excluding Junior College
ITS
MCAST

131
… 7.1. Teaching staff in pre-primary, primary and secondary schools by level of education, economic sector, age group and sex 1
Males Females Total Males Females Total Males Females Total Males Females Total
less than 25 7 34 41 - - - - - - 7 34 4125-29 - 15 15 - - - - - - - 15 1530-34 4 11 15 - - - - - - 4 11 1535-39 - 10 10 - - - - - - - 10 1040-44 1 14 15 - - - - - - 1 14 1545-49 3 17 20 - - - - - - 3 17 2050-54 2 20 22 - - - - - - 2 20 2255-59 2 18 20 - - - - - - 2 18 2060-64 - 4 4 - - - - - - - 4 465+ - - - - - - - - - - - -
Total 19 143 162 - - - - - - 19 143 1621 Note: Data for University and Junior College teaching/ lecturing staff is not available by age categories.
Special Schools
Age
Economic Sector
Government Church Private Total
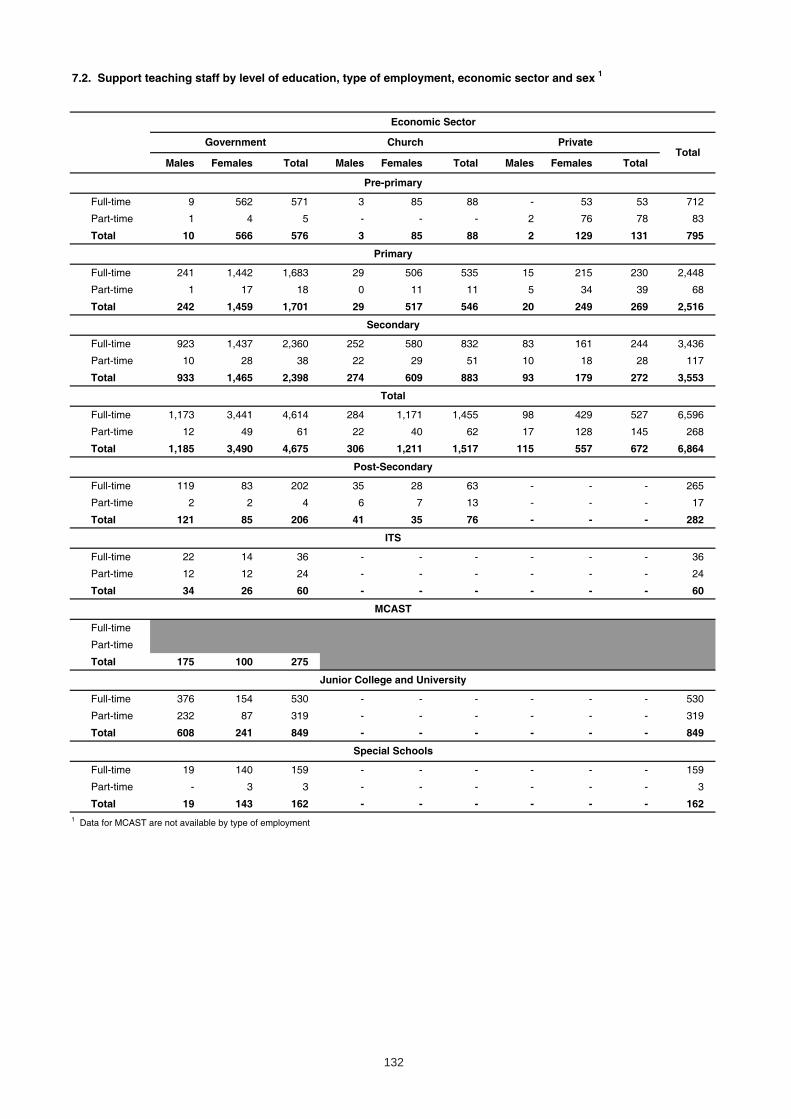
132
7.2. Support teaching staff by level of education, type of employment, economic sector and sex 1
Males Females Total Males Females Total Males Females Total
Full-time 9 562 571 3 85 88 - 53 53 712
Part-time 1 4 5 - - - 2 76 78 83
Total 10 566 576 3 85 88 2 129 131 795
Full-time 241 1,442 1,683 29 506 535 15 215 230 2,448
Part-time 1 17 18 0 11 11 5 34 39 68
Total 242 1,459 1,701 29 517 546 20 249 269 2,516
Full-time 923 1,437 2,360 252 580 832 83 161 244 3,436
Part-time 10 28 38 22 29 51 10 18 28 117
Total 933 1,465 2,398 274 609 883 93 179 272 3,553
Full-time 1,173 3,441 4,614 284 1,171 1,455 98 429 527 6,596
Part-time 12 49 61 22 40 62 17 128 145 268
Total 1,185 3,490 4,675 306 1,211 1,517 115 557 672 6,864
Full-time 119 83 202 35 28 63 - - - 265
Part-time 2 2 4 6 7 13 - - - 17
Total 121 85 206 41 35 76 - - - 282
Full-time 22 14 36 - - - - - - 36
Part-time 12 12 24 - - - - - - 24
Total 34 26 60 - - - - - - 60
Full-time
Part-time
Total 175 100 275
Full-time 376 154 530 - - - - - - 530
Part-time 232 87 319 - - - - - - 319
Total 608 241 849 - - - - - - 849
Full-time 19 140 159 - - - - - - 159
Part-time - 3 3 - - - - - - 3
Total 19 143 162 - - - - - - 1621 Data for MCAST are not available by type of employment
Pre-primary
Primary
Secondary
Total
Economic Sector
Government Church PrivateTotal
Post-Secondary
Special Schools
Junior College and University
MCAST
ITS
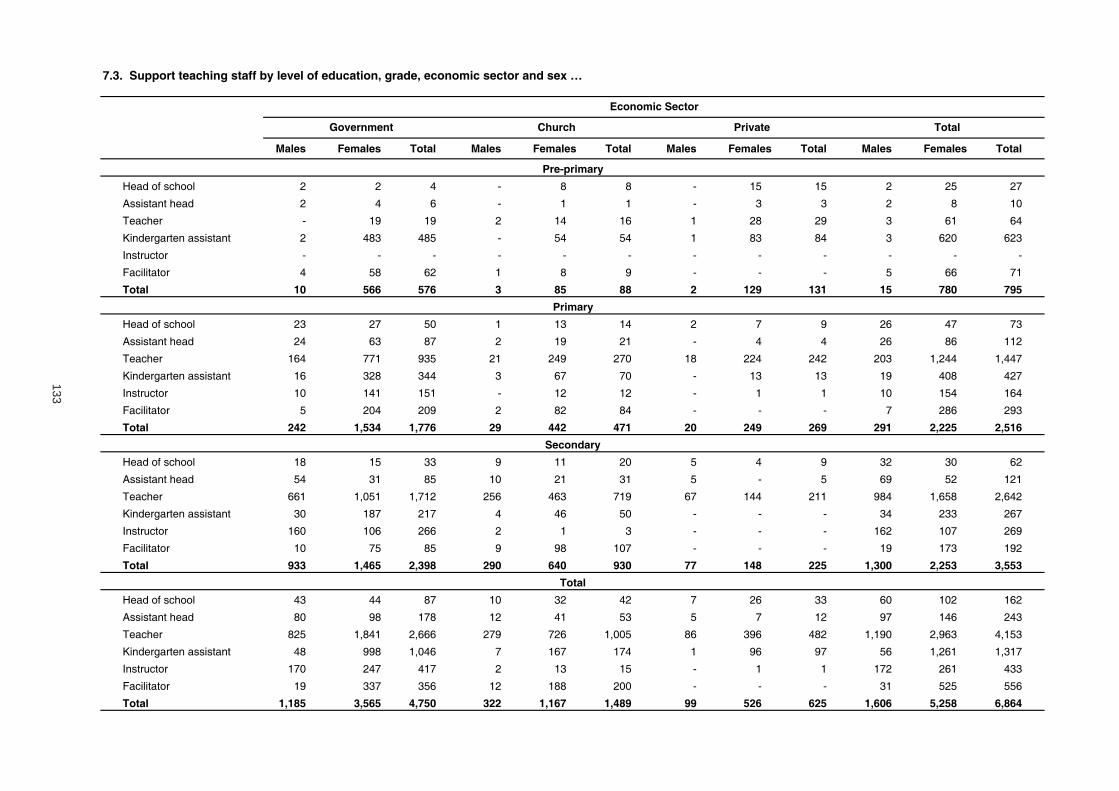
133
7.3. Support teaching staff by level of education, grade, economic sector and sex …
Males Females Total Males Females Total Males Females Total Males Females Total
Head of school 2 2 4 - 8 8 - 15 15 2 25 27
Assistant head 2 4 6 - 1 1 - 3 3 2 8 10
Teacher - 19 19 2 14 16 1 28 29 3 61 64
Kindergarten assistant 2 483 485 - 54 54 1 83 84 3 620 623
Instructor - - - - - - - - - - - -
Facilitator 4 58 62 1 8 9 - - - 5 66 71
Total 10 566 576 3 85 88 2 129 131 15 780 795
Head of school 23 27 50 1 13 14 2 7 9 26 47 73
Assistant head 24 63 87 2 19 21 - 4 4 26 86 112
Teacher 164 771 935 21 249 270 18 224 242 203 1,244 1,447
Kindergarten assistant 16 328 344 3 67 70 - 13 13 19 408 427
Instructor 10 141 151 - 12 12 - 1 1 10 154 164
Facilitator 5 204 209 2 82 84 - - - 7 286 293
Total 242 1,534 1,776 29 442 471 20 249 269 291 2,225 2,516
Head of school 18 15 33 9 11 20 5 4 9 32 30 62
Assistant head 54 31 85 10 21 31 5 - 5 69 52 121
Teacher 661 1,051 1,712 256 463 719 67 144 211 984 1,658 2,642
Kindergarten assistant 30 187 217 4 46 50 - - - 34 233 267
Instructor 160 106 266 2 1 3 - - - 162 107 269
Facilitator 10 75 85 9 98 107 - - - 19 173 192
Total 933 1,465 2,398 290 640 930 77 148 225 1,300 2,253 3,553
Head of school 43 44 87 10 32 42 7 26 33 60 102 162
Assistant head 80 98 178 12 41 53 5 7 12 97 146 243
Teacher 825 1,841 2,666 279 726 1,005 86 396 482 1,190 2,963 4,153
Kindergarten assistant 48 998 1,046 7 167 174 1 96 97 56 1,261 1,317
Instructor 170 247 417 2 13 15 - 1 1 172 261 433
Facilitator 19 337 356 12 188 200 - - - 31 525 556
Total 1,185 3,565 4,750 322 1,167 1,489 99 526 625 1,606 5,258 6,864
Pre-primary
Primary
Secondary
Total
Economic Sector
Government Church Private Total

134
… 7.3. Support teaching staff by level of education, grade, economic sector and sex
Males Females Total Males Females Total Males Females Total Males Females Total
Head of school 2 - 2 2 - 2 - - - 4 - 4Assistant head 5 2 7 1 1 2 - - - 6 3 9Teacher 114 82 196 35 34 69 - - - 149 116 265Instructor - - - - - - - - - - - -Professor/Lecturer - - - 2 - 2 - - - 2 - 2Assistant lecturer - - - - - - - - - - - -Facilitator - 1 1 1 - 1 - - - 1 1 2Total 121 85 206 41 35 76 - - - 162 120 282
Head of school - - - - - - - - - - - -Assistant head - - - - - - - - - - - -Teacher 1 - 1 - - - - - - 1 - 1Instructor 1 - 1 - - - - - - 1 - 1Professor/Lecturer 32 26 58 - - - - - - 32 26 58Assistant lecturer - - - - - - - - - - - -Facilitator - - - - - - - - - - - -Total 34 26 60 - - - - - - 34 26 60
Professors 42 1 43 - - - - - - 42 1 43Associate Professors 34 2 36 - - - - - - 34 2 36Senior Lecturers 146 34 180 - - - - - - 146 34 180Lecturers 151 42 193 - - - - - - 151 42 193Assistant Lecturers 214 142 356 - - - - - - 214 142 356Teaching Assistants 15 15 30 - - - - - - 15 15 30Research Assistants 6 5 11 - - - - - - 6 5 11Total 608 241 849 - - - - - - 608 241 849
Head of school 2 2 4 - - - - - - 2 2 4Assistant head - - - - - - - - - - - -Teacher 9 38 47 - - - - - - 9 38 47Kindergarten assistant 6 80 86 - - - - - - 6 80 86Instructor 2 5 7 - - - - - - 2 5 7Professor/Lecturer - - - - - - - - - - - -Assistant lecturer - - - - - - - - - - - -Facilitator - 18 18 - - - - - - - 18 18Total 19 143 162 - - - - - - 19 143 162
Economic Sector
Government Church Private Total
Post-Secondary General excluding Junior College
ITS
Junior College and University
Special Schools
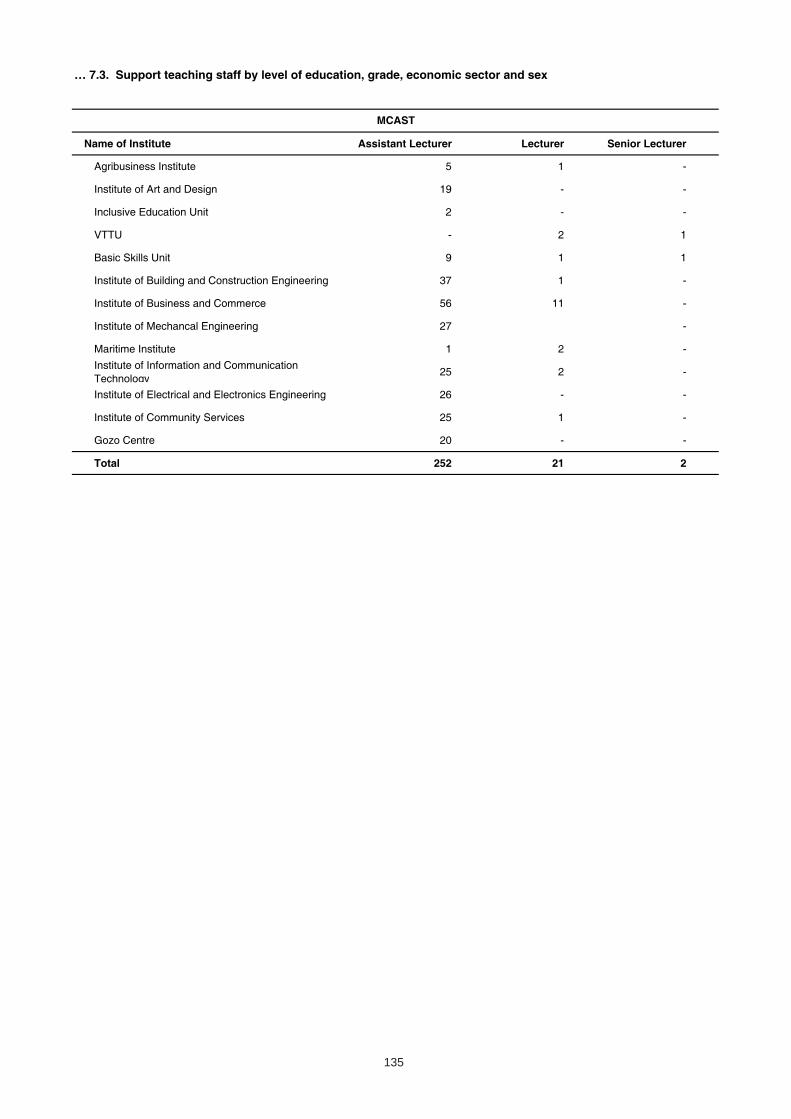
135
… 7.3. Support teaching staff by level of education, grade, economic sector and sex
Name of Institute Assistant Lecturer Lecturer Senior Lecturer
Agribusiness Institute 5 1 -
Institute of Art and Design 19 - -
Inclusive Education Unit 2 - -
VTTU - 2 1
Basic Skills Unit 9 1 1
Institute of Building and Construction Engineering 37 1 -
Institute of Business and Commerce 56 11 -
Institute of Mechancal Engineering 27 -
Maritime Institute 1 2 -
Institute of Information and Communication Technology
25 2 -
Institute of Electrical and Electronics Engineering 26 - -
Institute of Community Services 25 1 -
Gozo Centre 20 - -
Total 252 21 2
MCAST


CHAPTER 8
State-Running
Evening Classes


139
Females Males Females Males Females Males Females Males Females Males Total
M. Regina Girls' JL Blata l-Bajda 216 246 246 169 304 136 442 214 1,224 780 2,004
Accounts 'O' Level 9 months 14 8 23 7 10 2 1 - 48 17 65
Biology 'O' Level 9 months 8 5 4 5 3 1 - - 15 11 26
Business Studies 'O' Level 9 months 2 - 3 1 - - 1 - 6 1 7
Chemistry 'O' Level 9 months 4 - 2 - 1 3 1 - 8 3 11
Chemistry 'A' Level 9 months 2 2 2 3 - - - - 4 5 9
Computer Studies 'O' Level 9 months 4 8 2 3 1 3 - - 7 14 21
ECDL 9 months 18 20 21 19 4 8 17 9 60 56 116
ECDL START 9 months - - 2 7 3 4 13 22 18 33 51
Economics 'O' Level 9 months 1 3 - - - - - - 1 3 4
English 'O' Level 9 months 32 34 16 18 13 10 - - 61 62 123
English Language Intermediate 9 months 8 - 1 1 1 - 1 1 11 2 13
French 1st+2nd Year 9 months 2 4 1 1 7 2 7 5 17 12 29
French 'O' Level 9 months 6 30 - - - - 1 1 7 31 38
Thread Filigree Ganutell (Beg + Adv) 9 months - - 5 - 3 1 13 - 21 1 22
German 1st+2nd Year+Post Sec 9 months 3 2 4 2 3 - 5 3 15 7 22
Gold Embroidery 9 months - - - - 3 1 5 - 8 1 9
History 'O' Level 9 months 1 4 1 - - - - - 2 4 6
History 'A' Level 9 months - - 1 - 3 2 - - 4 2 6
How to set up a business 9 months - - - 3 5 4 - 1 5 8 13
Italian 1st+2nd Year 9 months 5 4 6 3 - - 3 14 14 21 35
Italian 'O' Level 9 months 7 11 2 7 4 3 - - 13 21 34
Italian 'A' Level 9 months 1 4 2 2 1 2 1 - 5 8 13
Lace Making 9 months - 1 - 8 - 6 - 22 0 37 37
Maltese 'O' Level 9 months 15 20 2 4 1 3 1 - 19 27 46
Marketing Intermediate 9 months - - 3 2 - - - - 3 2 5
Marketing Advanced 9 months - - 10 7 3 3 - - 13 10 23
Mathematics 'O' Level + Sec 'B' 9 months 23 59 9 16 3 8 3 6 38 89 127
Mathematics Intermediate 9 months - - 4 5 3 - - - 7 5 12
Monastery Work 9 months - - - - - - - 10 0 10 10
Pure Maths 1st +2nd Year 9 months 16 4 2 - 1 - - - 19 4 23
8.1. Students attending courses in government evening classes/centres classified by subject taken, duration of course, age and sex …
Course
Du
rati
on
o
f C
ou
rse Age
15-19 20-24 25-39Total
40 and Over

140
Females Males Females Males Females Males Females Males Females Males Total
M. Regina Girls' JL Blata l-Bajda (contd.)Physics 'O' Level 9 months 3 2 1 - 1 - - 1 21 18 39
Physics 'A' Level 9 months - - 5 3 1 2 - - 6 5 11
Philosophy 'A' Level 9 months 1 2 1 3 3 - 1 - 6 5 11
Religion 'O' Level 9 months 5 3 1 2 - - - - 6 5 11
Religion 'A' Level 9 months - - 4 5 - - - - 4 5 9
Social Studies 'O' 9 months 2 3 - - 1 - - 1 3 4 7
Sociology 'A' Level 9 months - - 2 5 5 10 - - 7 15 22
Spanish Beginners + 2nd Year 9 months 1 - 3 8 1 4 3 14 8 26 34
Spanish 'O' Level 9 months 4 3 3 4 4 5 2 1 13 13 26
Systems of Knowledge 9 months 1 6 - - - - - - 1 6 7
Ballroom Dancing 14 weeks 1 - 3 - 7 7 55 44 66 51 117
Beading Techniques 14 weeks - - 3 - 12 - 20 - 35 0 35
Beauty Care 14 weeks 5 - 18 - 33 - 9 - 65 0 65
Computer Awareness (Short Course) 14 weeks - - - - 2 - 27 26 29 26 55
Cookery & Nutrition 14 weeks 1 - 10 - 46 - 44 1 101 1 102
Curtain Making 14 weeks 1 - 6 - 8 - 26 - 41 0 41
Flower Arranging 14 weeks 1 - 6 - 6 - 22 - 35 0 35
Keep Fit (Men) + (Females) 14 weeks 6 - 30 2 64 3 136 22 236 27 263
Maltese Sign Language 14 weeks 10 - 20 5 19 3 16 - 65 8 73
ECDL Advanced (Word) 14 weeks - - 2 - 1 1 4 - 7 1 8
Photoshop 10 weeks 2 4 - 8 14 35 4 10 20 57 77
Antonio Galea' Floriana Primary 8 2 42 3 125 6 576 55 743 66 809
Ballroom Dancing 14 weeks 3 1 1 3 7 1 46 24 53 29 82
Curtain Making 14 weeks - - 5 - 37 1 78 1 116 2 118
Cottage Craft 14 weeks 1 - 2 - 11 - 15 - 29 - 29
Crochet 14 weeks - - - - 5 - 21 - 26 - 26
Dress Cutting (Ladies) 14 weeks 2 - 8 - 3 - 9 - 22 - 22
Embroidery/Basic Weaving 14 weeks - - - - 4 - 22 - 26 - 26
Flower Arranging 14 weeks 1 - 12 - 11 - 9 1 33 1 34
Gold Embroidery 14 weeks - - 1 - 3 - 7 - 11 - 11
25-39
… 8.1. Students attending courses in government evening classes/centres classified by subject taken, duration of course, age and sex
Course
Du
rati
on
o
f C
ou
rse Age
Total15-19 20-24 40 and Over

141
Females Males Females Males Females Males Females Males Females Males Total
Antonio Galea' Floriana Primary (contd.)Lace Making 14 weeks - - 3 - 15 - 163 - 181 - 181
Lace Making/Tatting 14 weeks - - - - 1 - 20 - 21 - 21
Lipreading 14 weeks 1 - 4 - 2 1 5 2 12 3 15
Macrame' 14 weeks - - - - 1 - 9 - 10 - 10
Monastery Work 14 weeks - - - - 1 - 12 - 13 - 13
Recycled Creative Craft 14 weeks - - 6 - 11 2 28 - 45 2 47
Sequence and Line Dancing 14 weeks - - - - 3 1 71 25 74 26 100
Thread Filigree Ganutell (Beginners) 14 weeks - 1 - - 4 - 10 1 14 2 16
Thread Filigree Ganutell (Once a month class) - - - - 5 - 33 - 38 - 38
Thread Filigree Ganutell (Advanced) 14 weeks - - - - 1 - 18 1 19 1 20
Ospizio Boys' School Floriana - - 1 - 9 2 17 - 27 2 29
Furniture Craft 9 months - - 1 - 2 1 5 - 8 1 9
Restoration on all kinds of furniture 9 months - - - - 6 - 9 5 15 5 20
Upholstery 9 months - - - - 1 1 3 2 4 3 7
Woodwork 9 months 1 - 1 - 5 1 3 2 10 3 13
St. Joseph Boys' JL Paola - 1 - 1 - 3 5 17 5 22 27
ECDL START 9 months - 1 - - - 2 5 5 5 8 13
Lace Making 9 months - - - 1 - 1 - 12 - 14 14
Maria Theresa' Girls' JL Mriehel - 2 - 15 - 21 1 80 1 118 119
Monastery Work 9 months - - - - - 1 - 7 - 8 8
Thread Filigree Ganutell (Advanced) 9 months - - - 1 - 4 - 23 - 28 28
Parchment Craft 1st+2nd Year 9 months - 1 - 3 - 2 1 11 1 17 18
Keep-Fit (Females) 14 weeks - 1 - 11 - 14 - 39 - 65 65
SIS Centre, Blata l-Bajda 26 21 30 24 25 16 27 36 108 97 205
ECDL 9 months 8 5 15 4 12 6 13 16 48 31 79
ECDL Advanced 9 months 18 16 15 20 13 10 14 20 60 66 126
25-39
… 8.1. Students attending courses in government evening classes/centres classified by subject taken, duration of course, age and sex
Course
Du
rati
on
o
f C
ou
rse Age
Total15-19 20-24 40 and Over
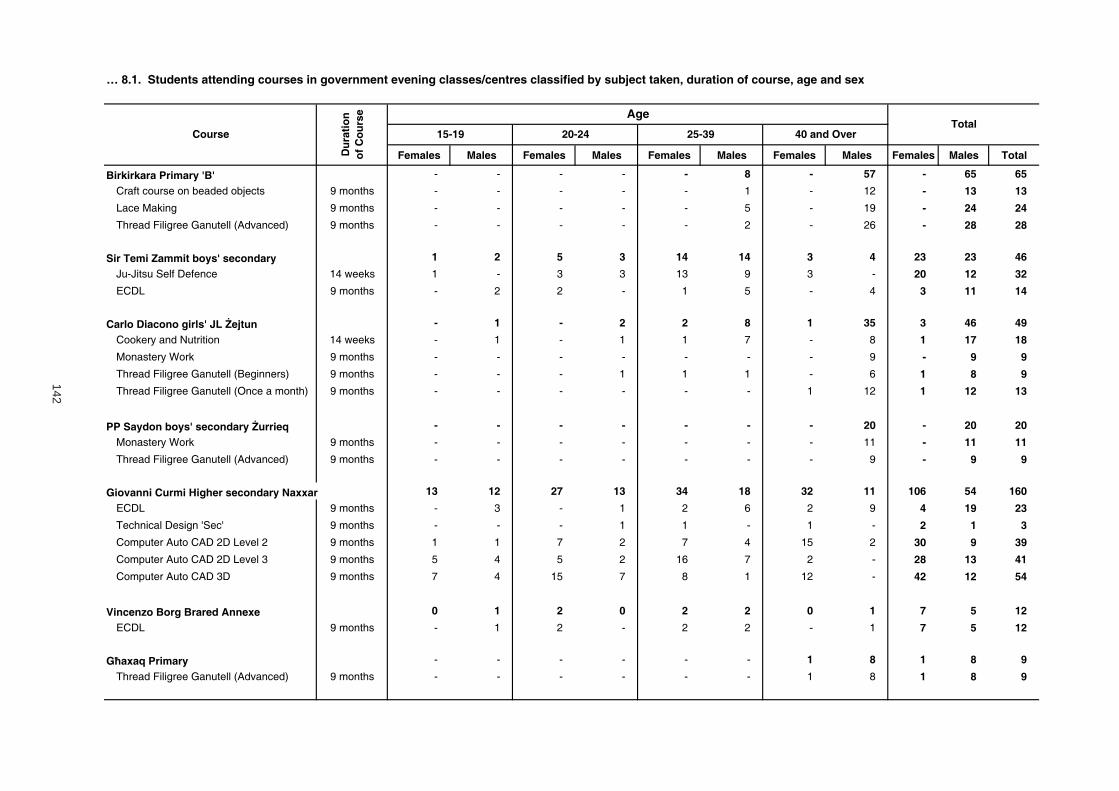
142
Females Males Females Males Females Males Females Males Females Males Total
Birkirkara Primary 'B' - - - - - 8 - 57 - 65 65
Craft course on beaded objects 9 months - - - - - 1 - 12 - 13 13
Lace Making 9 months - - - - - 5 - 19 - 24 24
Thread Filigree Ganutell (Advanced) 9 months - - - - - 2 - 26 - 28 28
Sir Temi Zammit boys' secondary 1 2 5 3 14 14 3 4 23 23 46
Ju-Jitsu Self Defence 14 weeks 1 - 3 3 13 9 3 - 20 12 32
ECDL 9 months - 2 2 - 1 5 - 4 3 11 14
Carlo Diacono girls' JL ejtun - 1 - 2 2 8 1 35 3 46 49
Cookery and Nutrition 14 weeks - 1 - 1 1 7 - 8 1 17 18
Monastery Work 9 months - - - - - - - 9 - 9 9
Thread Filigree Ganutell (Beginners) 9 months - - - 1 1 1 - 6 1 8 9
Thread Filigree Ganutell (Once a month) 9 months - - - - - - 1 12 1 12 13
PP Saydon boys' secondary urrieq - - - - - - - 20 - 20 20
Monastery Work 9 months - - - - - - - 11 - 11 11
Thread Filigree Ganutell (Advanced) 9 months - - - - - - - 9 - 9 9
Giovanni Curmi Higher secondary Naxxar 13 12 27 13 34 18 32 11 106 54 160
ECDL 9 months - 3 - 1 2 6 2 9 4 19 23
Technical Design 'Sec' 9 months - - - 1 1 - 1 - 2 1 3
Computer Auto CAD 2D Level 2 9 months 1 1 7 2 7 4 15 2 30 9 39
Computer Auto CAD 2D Level 3 9 months 5 4 5 2 16 7 2 - 28 13 41
Computer Auto CAD 3D 9 months 7 4 15 7 8 1 12 - 42 12 54
Vincenzo Borg Brared Annexe 0 1 2 0 2 2 0 1 7 5 12
ECDL 9 months - 1 2 - 2 2 - 1 7 5 12
G axaq Primary - - - - - - 1 8 1 8 9
Thread Filigree Ganutell (Advanced) 9 months - - - - - - 1 8 1 8 9
25-39 40 and Over15-19 20-24
… 8.1. Students attending courses in government evening classes/centres classified by subject taken, duration of course, age and sex
Course
Du
rati
on
o
f C
ou
rse Age
Total
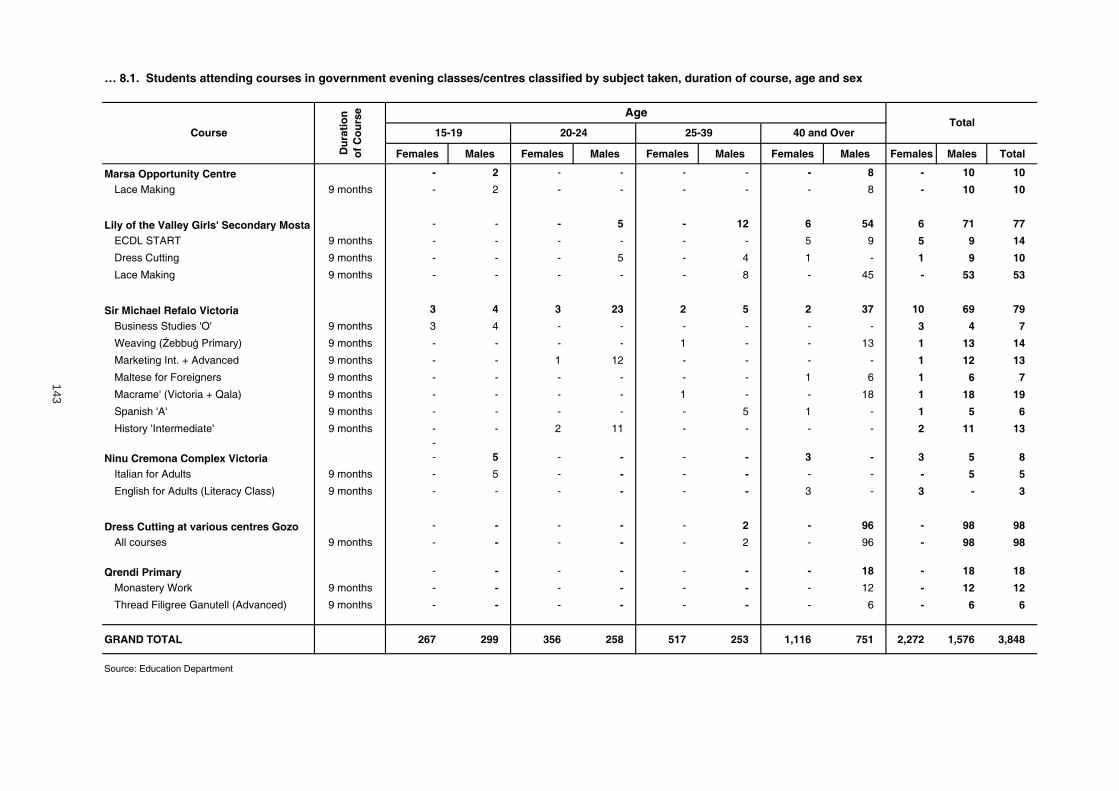
143
Females Males Females Males Females Males Females Males Females Males Total
Marsa Opportunity Centre - 2 - - - - - 8 - 10 10
Lace Making 9 months - 2 - - - - - 8 - 10 10
Lily of the Valley Girls' Secondary Mosta - - - 5 - 12 6 54 6 71 77
ECDL START 9 months - - - - - - 5 9 5 9 14
Dress Cutting 9 months - - - 5 - 4 1 - 1 9 10
Lace Making 9 months - - - - - 8 - 45 - 53 53
Sir Michael Refalo Victoria 3 4 3 23 2 5 2 37 10 69 79
Business Studies 'O' 9 months 3 4 - - - - - - 3 4 7
Weaving ( ebbu Primary) 9 months - - - - 1 - - 13 1 13 14
Marketing Int. + Advanced 9 months - - 1 12 - - - - 1 12 13
Maltese for Foreigners 9 months - - - - - - 1 6 1 6 7
Macrame' (Victoria + Qala) 9 months - - - - 1 - - 18 1 18 19
Spanish 'A' 9 months - - - - - 5 1 - 1 5 6
History 'Intermediate' 9 months - - 2 11 - - - - 2 11 13-
Ninu Cremona Complex Victoria - 5 - - - - 3 - 3 5 8
Italian for Adults 9 months - 5 - - - - - - - 5 5
English for Adults (Literacy Class) 9 months - - - - - - 3 - 3 - 3
Dress Cutting at various centres Gozo - - - - - 2 - 96 - 98 98
All courses 9 months - - - - - 2 - 96 - 98 98
Qrendi Primary - - - - - - - 18 - 18 18
Monastery Work 9 months - - - - - - - 12 - 12 12
Thread Filigree Ganutell (Advanced) 9 months - - - - - - - 6 - 6 6
GRAND TOTAL 267 299 356 258 517 253 1,116 751 2,272 1,576 3,848
Source: Education Department
40 and Over
… 8.1. Students attending courses in government evening classes/centres classified by subject taken, duration of course, age and sex
Course
Du
rati
on
o
f C
ou
rse Age
Total15-19 20-24 25-39

144
Females Males Females Males Females Males Females Males Females Males Total
Drama Juniors (Prep Class) 29 9 - - - - - - 29 9 38
Drama Juniors 66 14 - - - - - - 66 14 80
Drama Intermediate 27 13 - - - - - - 27 13 40
Drama Seniors 1st, 2nd & 3rd Year - - 10 7 7 3 - - 17 10 27
Drama Costume Design - - 1 - 4 - 7 - 12 - 12
Drama Community Theatre - - - - 2 2 2 - 4 2 6
Drama Personality Development - - 1 4 6 2 1 - 8 6 14
Drama Dance - - 11 - 1 - - 1 12 1 13
Drama Script-Writing - - 2 2 - - - - 2 2 4
Drama Musical Theatre - - 9 - 4 1 1 - 14 1 15
Ballet 64 - - - - - - - 64 - 64
Total 186 36 34 13 24 8 11 1 255 58 313
Basic Course 52 46 - - - - - - 52 46 98
Recorder 3 - - - - - - - 3 - 3
Flute 18 19 3 5 - - - - 23 22 45
Oboe 2 9 - - - - - - 2 9 11
Clarinet 7 11 2 5 1 1 - - 10 17 27
Saxophone 7 7 - - - - - - 7 7 14
French Horn 6 5 2 3 - 1 - - 8 9 17
Trumpet 14 26 1 5 - - - - 15 31 46
Trombone 2 1 - 3 - 1 - - 2 5 7
Althorn 3 4 - - - - - - 3 4 7
Euphonium - 6 - 1 - - - - - 7 7
Tuba - 2 - - - - - - - 2 2
Percussion 1 5 1 2 - 1 - - 2 8 10
Violin 35 43 5 15 2 4 - - 42 62 104
Viola 1 3 - - - - - - 1 3 4
Violoncello 5 11 - - 2 1 - - 7 12 19
Classical Guitar 15 16 4 3 - - - - 19 19 38
Modern Guitar 13 20 4 5 4 3 - - 21 28 49
Bass Guitar 7 4 - - 1 - - - 8 4 12
Harp 9 9 - - - - - - 9 9 18
Piano 63 79 8 12 2 5 - - 73 96 169
Pedal Organ 1 3 - - - - - - 1 3 4
Voice 50 55 3 - 2 3 - - 55 58 113
Double Bass - 5 - - - - - - - 5 5
Jazz Improvisation 4 8 2 2 2 - - - 8 10 18
Total 318 397 35 61 16 20 - - 371 476 847
(Foundation) Drawing and Painting 18 9 20 6 12 10 24 17 74 42 116
Diploma 1st Year Painting 1 3 7 1 8 6 10 6 26 16 42
Diploma 2nd Year Painting 1 - 3 - 4 4 10 11 18 15 33
Sculpture - 3D Class 1 1 - - 3 2 5 12 9 15 24
Sculpture - Wood and Stone - - 1 - 1 7 1 13 3 20 23
Sculpture - Gold and Silversmithing - 1 - - 1 - 3 6 4 7 11
History and Appreciation Of Art - 1 - - 6 2 4 5 10 8 18
Gilding - - - - - 4 16 29 16 33 49
Artistic Creativity - - - - 3 - 12 11 15 11 26
Art Enrichment Course - - 1 2 7 4 2 - 10 6 16
Total 21 15 32 9 45 39 87 110 185 173 358
Drama Centre
School of Arts
School of Music
8.2.1. Students attending the Drama Centre and School of Music in Malta classified by sex, age and subject taken
School/subject19 and under 20-30 31-39 40 and over Total

145
Females Males Females Males Females Males Females Males Females Males Total
Drama Pre-Junior Class 6 14 - - - - - - 6 14 20
Drama Junior Course 17 8 - - - - - - 17 8 25
Drama Intermediate Course 14 6 - - - - - - 14 6 20
Acting Seniors 1 - 3 1 8 3 1 - 13 4 17
Movement 7 - - - - - - - 7 - 7
Aerobics - - - - 9 - 9 - 18 - 18
Latin American 42 4 3 - 17 2 20 9 82 15 97
Ballet 146 - - - - - - - 146 - 146
Total 233 32 6 1 34 5 30 9 303 47 350
Basic Course 32 29 - - - - - - 32 29 61
Theory of Music 69 54 4 5 1 2 2 2 78 63 141
Pianoforte 18 13 1 1 - 3 - - 19 17 36
Violin 25 8 3 - 1 - - - 29 8 37
Cello 1 2 - - 2 1 - - 3 3 6
Modern Guitar 8 9 2 3 - - - 2 10 14 24
Bass Guitar 1 2 - - - - - - 1 2 3
Flute 7 2 - - - - - - 7 2 9
Clarinet 3 8 - - - - - - 3 8 11
Saxophone - 3 - - - - - 2 - 5 5
Althorn - 1 - - - - - - - 1 1
Trombone - 2 - - - - - - - 2 2
French Horn - - - - - 1 - - - 1 1
Voice 1 1 - - 2 1 - - 3 2 5
Soleggio 1 1 - - 2 1 - - 3 2 5
Total 166 135 10 9 8 9 2 6 188 159 347
Art Attack 6 17 - - - - - - 6 17 23
Basic Art 'A' Level - - - - 5 - 9 - 14 - 14
Beading 3 - 1 - 1 - 13 - 18 - 18
Crafts 6 18 - - - - - - 6 18 24
Basic Art Juniors 39 34 - - - - - - 39 34 73
CAD - - 3 3 - - - - 3 3 6
Clay Modelling - 2 - 1 3 2 4 4 7 9 16
Embroidery - - 2 - 4 - 13 2 19 2 21
Entrepreneurship 8 8 - - - - - - 8 8 16
Gilding - - - 1 2 4 14 13 16 18 34
Graphic Design 1 3 3 2 - 2 - 1 4 8 12
Lace Adults - - 1 - 10 - 199 1 210 1 211
Lace Juniors 9 6 - - - - 2 - 11 6 17
Metal Works - 1 1 1 - 2 - 1 1 5 6
Paper Mache' - 1 - 2 2 - 2 2 4 5 9
Monastery Work - - - - 6 - 20 - 26 - 26
Oil/Water Painting 5 4 1 6 1 - 1 2 8 12 20
Parchment 13 - 2 - 3 - 8 - 26 - 26
Pottery/Ceramics 1 1 - 1 - 2 6 5 7 9 16
Pyrography - 1 1 - 1 1 7 7 9 9 18
Silver Filigree - 1 - - 3 - - 4 3 5 8
Stained Glass 3 2 1 - 6 8 5 8 15 18 33
Textile Design - - 5 - 16 - 42 1 63 1 64
Thread Filigree - - - - 17 - 84 3 101 3 104
Wood/Stone Carving - 1 - 1 1 - 2 12 3 14 17
Total 94 100 21 18 81 21 431 66 627 205 832
Grand Total 1,018 715 138 111 208 102 561 192 1,929 1,118 3,047
Source: Education Department
School of Art
8.2.2. Students attending the Drama Centre and School of Music in Gozo classified by sex, age and subject taken
School/subject19 and under 20-30 31-39 40 and over Total
School of Drama
School of Music

146
Males Females Males Females Males Females Males Females Males Females Total
Basic English 6 5 9 7 24 23 21 64 60 99 159
Blata l-Bajda Girls' JL Yr 1 1 - 1 1 5 1 1 6 8 8 16
Blata l-Bajda Girls' JL Yr 2 1 - 1 2 3 2 1 7 6 11 17
Blata l-Bajda Girls' JL Yr 3 - - 3 1 3 3 2 8 8 12 20
Birkirkara Primary A 1 1 1 - - 2 1 4 3 7 10
Birkirkara Primary B - 1 2 3 5 7 - 12 7 23 30
Paola Boys' Sec (Yr 1) 2 1 - - 1 - 4 4 7 5 12
Paola Boys' Sec (Yr 2) - 2 - - 5 3 5 8 10 13 23
Paola Boys' Sec (Yr 3) 1 - 1 - 2 1 7 10 11 11 22
National Council of Women - - - - - 4 - 5 - 9 9
Basic English at Local Councils 2 2 3 14 18 19 27 63 50 98 148
Dingli - - - - 1 2 3 3 4 5 9
Iklin - - - - - - - 9 - 9 9
Fgura - - - 3 3 - 5 6 8 9 17
G ira - - - 2 - - 2 5 2 7 9
Kalkara - - 1 1 2 2 4 7 7 10 17
Mosta 1 - 1 1 3 4 - 2 5 7 12
Naxxar - - - 1 2 2 4 5 6 8 14
Qormi - - 1 3 5 5 5 6 11 14 25
Rabat - - - - - - 1 9 1 9 10
ejtun (P Frere Institute) 1 2 - 3 - 3 1 6 2 14 16
urrieq - - - - 2 1 2 5 4 6 10
Special Classes for Drug Addicts 11 10 3 1 37 2 2 - 53 13 66
Komunita' Sta Marija Luqa - - 2 1 22 1 - - 24 2 26
St. Anna Ba ar i - ag aq (Caritas) - - - - 14 - - - 14 - 14Dar Mer ba Bik/Refugees 11 10 1 - 1 1 2 - 15 11 26
Basic Maths - - 2 3 1 2 2 3 5 8 13
Blata l-Bajda Girls' JL - - 2 3 1 2 2 3 5 8 13
8.3. Adult education classified by locality of centre, sex, age group and subject taught …
Age
Subject and CentresTotal
15-19 20-24 25-39 40 and over

147
Males Females Males Females Males Females Males Females Males Females Total
Maltese for Foreigners 5 8 4 19 7 11 13 18 29 56 85
Blata l-Bajda Girls' JL Yr 1 - 3 2 8 3 3 6 7 11 21 32
Blata l-Bajda Girls' JL Yr 2 - - - 7 2 2 1 3 3 12 15
Mosta Girls' Sec Yr 1 5 4 2 3 2 5 3 5 12 17 29
Mosta Girls' Sec Yr 2 - 1 - 1 - 1 3 3 3 6 9
English for Foreigners 4 2 3 8 15 13 21 15 43 38 81
Blata l-Bajda Girls' JL Yr 1 4 1 2 1 11 4 10 8 27 14 41
Blata l-Bajda Girls' JL Yr 2 - 1 1 5 3 4 9 6 13 16 29
Blata l-Bajda Girls' JL Yr 3 - - - 2 1 5 2 1 3 8 11
Lifelong Learning Centre - 1 5 66 10 112 11 208 26 387 413
Secondary Subjects - - 4 63 9 98 7 190 20 351 371
ECDL Core - - - 1 1 6 1 15 2 22 24
ECDL Advanced - - - - - 7 1 2 1 9 10
How to set up a business - 1 1 2 - 1 2 1 3 5 8
Basic Maltese - 1 4 3 2 4 86 167 92 175 267
Blata l-Bajda Girls' JL - - 1 1 - - 1 6 2 7 9
Birkirkara Primary B Yr 1 - - - - 1 2 3 6 4 8 12
Birkirkara Primary B Yr 2 - 1 1 1 - 1 3 2 4 5 9
ebbu Primary B Yr 1 - - 2 1 1 1 2 6 5 8 13
ESF Courses (Malta) - - - - - - 73 147 73 147 220
ESF Courses (Xewkija Gozo) - - - - - - 4 - 4 - 4
Total 28 29 33 121 114 186 183 538 358 874 1,232
Source: Education Department
… 8.3. Adult education classified by locality of centre, sex, age group and subject taught
Subject and Centres
AgeTotal
15-19 20-24 25-39 40 and over

148
Males Females Total
Drama Centre (Malta) 9 13 22
School of Drama (Gozo) 3 6 9
School of Arts (Malta) 13 0 13
School of Arts (Gozo) 10 6 16
School of Music (Malta) 22 10 32
School of Music (Gozo) 13 13 26
Adult Education Centres 50 41 91
Basic Maltese 18 13 31
Basic English 5 6 11
Basic English at Local Councils 3 12 15
Basic Maths 1 - 1
Life Long Learning Centres 11 4 15
Basic Maltese for Foreigners 4 2 6
Basic English for Foreigners 3 2 5
Special Courses for Drug Addicts/Alcoholics 5 2 7
Evening Classes 61 81 142
Maria Regina Junior Lyceum, Blata l-Bajda 33 40 73
Marsa Opportunity Centre - 1 1
Antonio Galea Primary School, Floriana 3 17 20
Ospizio, Floriana 4 - 4
SIS Training Centre, Blata l-Bajda 3 1 4
Maria Teresa Girls' Junior Lyceum, Mrie el - 5 5
Birkirkara Primary 'B' - 3 3
P. P. Saydon Boys' Secondary School, urrieq - 1 1
Sir Temi Zammit Boys' Secondary School, Mtarfa 2 - 2
Lily of the Valley Girls' Secondary School, Mosta 1 2 3
Giovanni Curmi Higher Secondary, Naxxar 7 - 7
Carlo Diacono Girls' Junior Lyceum, ejtun - 3 3
St. Joseph Junior Lyceum, Paola 2 - 2
G axaq Primary School - 1 1
Vincenzo Borg Brared, Annex, Naxxar - 1 1
Qrendi Primary 'C' - 1 1
Ninu Cremona Complex, Victoria, Gozo 2 - 2
Sir M Refalo, Post Sec. School, Victoria, Gozo 4 2 6
Dress Cutting Centres, Gozo - 3 3
Total 181 170 351
Source: Education Department
TotalSchool
8.4. Teaching Staff at Malta School of Drama, Gozo School of Drama, Malta School of Music, Gozo School of Music and Adult Education Centres classified by subject taken and sex

CHAPTER 9
University of the
Third Age


151
Males Females Males Females Males Females Males Females Males Females Males Females Males Females Males Females Males Females Males Females Males Females Males Females Males Females Total
Total 7 1 27 45 53 211 46 30 11 64 3 11 6 6 1 1 1 3 1 158 21 - - 2 177 532 709
MALTA 7 1 27 43 50 196 45 26 10 63 2 10 6 5 1 - 1 3 1 149 21 - - 2 171 498 669
Gozo - - - 2 3 15 1 4 1 1 1 1 - 1 - 1 - - - 9 - - - - 6 34 40
Southern Harbour 1 1 5 10 9 34 12 8 3 11 1 1 5 1 - - 1 - 1 23 3 - - 1 41 90 131
Valletta - - 2 2 2 10 2 1 - 3 - 1 1 - - - - - - 3 1 - - - 8 20 28
Bormla - 1 - - 1 1 1 - - 1 - - - - - - - - - 1 - - - - 2 4 6
abbar 1 - 1 - 1 3 3 1 - - - - - - - - 1 - 1 1 1 - - - 9 5 14
Fgura - - - 3 2 4 1 - 1 1 - - - - - - - - - 3 - - - - 4 11 15
Floriana - - 1 - - 4 3 - - 2 1 - - - - - - - - 4 - - - - 5 10 15
Kalkara - - - 2 - 2 - - - - - - 1 - - - - - - 1 - - - - 1 5 6
Luqa - - - - 1 1 - - - - - - - 1 - - - - - 1 - - - - 1 3 4
Marsa - - 1 - - - - - - - - - - - - - - - - - - - - - 1 0 1
Paola - - - - - 3 1 1 - - - - 1 - - - - - - 3 1 - - 1 3 8 11
Santa Lu ija - - - - 1 1 1 2 1 1 - - 2 - - - - - - 3 - - - - 5 7 12
Tarxien - - - 3 1 5 - 3 1 3 - - - - - - - - - 3 - - - - 2 17 19
Northern Harbour 5 - 16 14 29 109 27 14 4 43 1 6 1 4 - - - 3 - 99 11 - - 1 94 293 387
Qormi - - - 1 - 3 3 - - 2 - - - - - - - - - 4 1 - - - 4 10 14
Birkirkara - - 3 1 2 15 2 1 1 4 1 - - - - - - - - 6 1 - - - 10 27 37
G ira - - - - 1 2 - 1 - 2 - - - 1 - - - - - 1 1 - - - 2 7 9
amrun - - - 3 1 7 3 1 1 2 - - - - - - - - - 2 - - - - 5 15 20
Msida 1 - - 1 2 8 2 1 - 2 - - 1 - - - - - - 4 - - - - 6 16 22
Pembroke - - 1 - - 1 - - - - - - - - - - - - - - - - - - 1 1 2
Pieta - - 1 - - 2 - 1 - - - - - - - - - - - 1 1 - - - 2 4 6
San iljan - - - 3 4 10 3 1 - 6 - - - - - - - 2 - 7 3 - - - 10 29 39
San wann - - 1 - 3 6 - - - 2 - - - - - - - 1 - 12 - - - - 4 21 25
Santa Venera - - - 2 1 5 1 2 - - - 2 - 1 - - - - - 4 - - - - 2 16 18
Sliema 4 - 7 3 14 46 11 6 2 18 - 4 - 1 - - - - - 53 4 - - 1 42 132 174
Swieqi - - 2 - 1 3 - - - 4 - - - 1 - - - - - 4 - - - - 3 12 15
Ta' Xbiex - - 1 - - 1 2 - - 1 - - - - - - - - - 1 - - - - 3 3 6
Pen
sio
ner
Tec
hn
icia
ns
and
as
soci
ate
pro
fess
ion
als
Ser
vice
s w
ork
ers
and
sh
op
an
d
mar
ket
sale
s w
ork
ers
Ele
men
tary
o
ccu
pat
ion
s
9.1. Persons attending the University of the Third Age classified by locality of residence, previous occupational status and sex …
Pla
nt
and
mac
hin
e o
per
ato
rs a
nd
as
sem
ble
s
Ho
mem
aker
Locality
Arm
ed F
orc
es
Leg
isla
tors
, sen
ior
off
icia
ls a
nd
m
anag
ers
Pro
fess
ion
als
Cra
ft a
nd
rel
ated
tr
ades
wo
rker
s
Cle
rks
Total
Vo
lun
tary
wo
rker
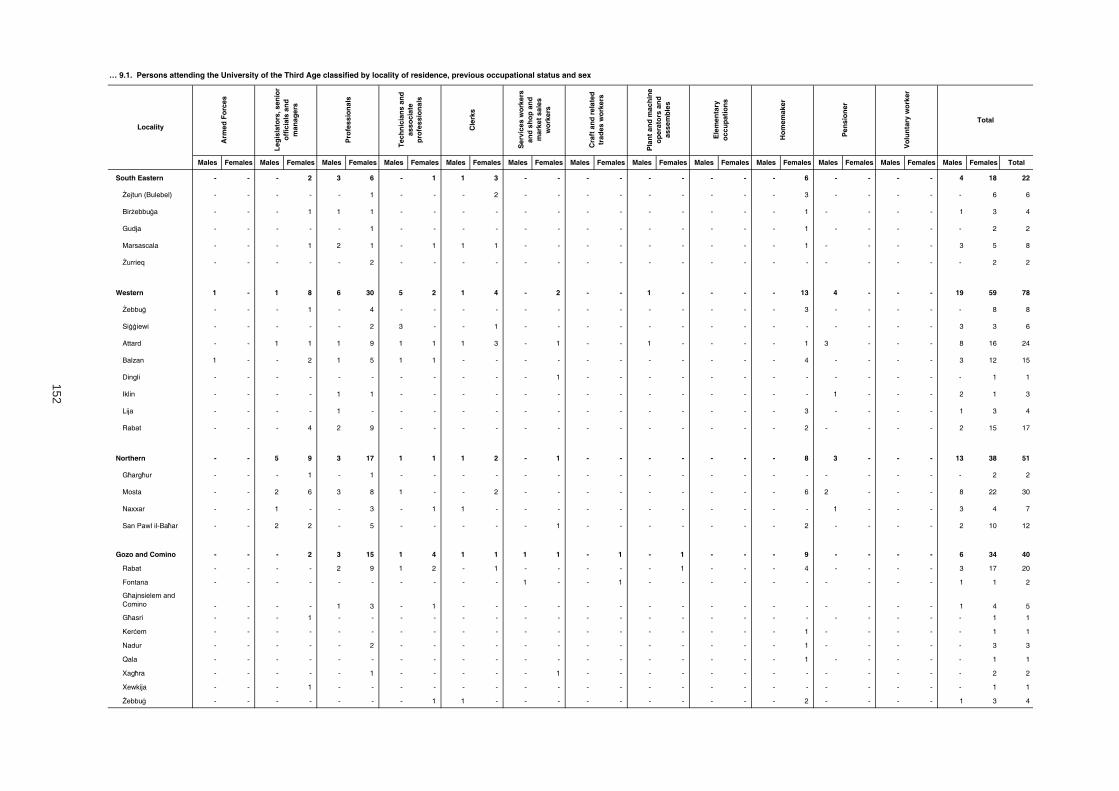
152
Males Females Males Females Males Females Males Females Males Females Males Females Males Females Males Females Males Females Males Females Males Females Males Females Males Females Total
South Eastern - - - 2 3 6 - 1 1 3 - - - - - - - - - 6 - - - - 4 18 22
ejtun (Bulebel) - - - - - 1 - - - 2 - - - - - - - - - 3 - - - - - 6 6
Bir ebbu a - - - 1 1 1 - - - - - - - - - - - - - 1 - - - - 1 3 4
Gudja - - - - - 1 - - - - - - - - - - - - - 1 - - - - - 2 2
Marsascala - - - 1 2 1 - 1 1 1 - - - - - - - - - 1 - - - - 3 5 8
urrieq - - - - - 2 - - - - - - - - - - - - - - - - - - - 2 2
Western 1 - 1 8 6 30 5 2 1 4 - 2 - - 1 - - - - 13 4 - - - 19 59 78
ebbu - - - 1 - 4 - - - - - - - - - - - - - 3 - - - - - 8 8
Si iewi - - - - - 2 3 - - 1 - - - - - - - - - - - - - - 3 3 6
Attard - - 1 1 1 9 1 1 1 3 - 1 - - 1 - - - - 1 3 - - - 8 16 24
Balzan 1 - - 2 1 5 1 1 - - - - - - - - - - - 4 - - - - 3 12 15
Dingli - - - - - - - - - - - 1 - - - - - - - - - - - - - 1 1
Iklin - - - - 1 1 - - - - - - - - - - - - - - 1 - - - 2 1 3
Lija - - - - 1 - - - - - - - - - - - - - - 3 - - - - 1 3 4
Rabat - - - 4 2 9 - - - - - - - - - - - - - 2 - - - - 2 15 17
Northern - - 5 9 3 17 1 1 1 2 - 1 - - - - - - - 8 3 - - - 13 38 51
G arg ur - - - 1 - 1 - - - - - - - - - - - - - - - - - - - 2 2
Mosta - - 2 6 3 8 1 - - 2 - - - - - - - - - 6 2 - - - 8 22 30
Naxxar - - 1 - - 3 - 1 1 - - - - - - - - - - - 1 - - - 3 4 7
San Pawl il-Ba ar - - 2 2 - 5 - - - - - 1 - - - - - - - 2 - - - - 2 10 12
Gozo and Comino - - - 2 3 15 1 4 1 1 1 1 - 1 - 1 - - - 9 - - - - 6 34 40
Rabat - - - - 2 9 1 2 - 1 - - - - - 1 - - - 4 - - - - 3 17 20
Fontana - - - - - - - - - - 1 - - 1 - - - - - - - - - - 1 1 2
G ajnsielem and Comino - - - - 1 3 - 1 - - - - - - - - - - - - - - - - 1 4 5
G asri - - - 1 - - - - - - - - - - - - - - - - - - - - - 1 1
Ker em - - - - - - - - - - - - - - - - - - - 1 - - - - - 1 1
Nadur - - - - - 2 - - - - - - - - - - - - - 1 - - - - - 3 3
Qala - - - - - - - - - - - - - - - - - - - 1 - - - - - 1 1
Xag ra - - - - - 1 - - - - - 1 - - - - - - - - - - - - - 2 2
Xewkija - - - 1 - - - - - - - - - - - - - - - - - - - - - 1 1
ebbu - - - - - - - 1 1 - - - - - - - - - - 2 - - - - 1 3 4
Tec
hn
icia
ns
and
as
soci
ate
pro
fess
ion
als
Cle
rks
Ser
vice
s w
ork
ers
and
sh
op
an
d
mar
ket
sale
s w
ork
ers
Cra
ft a
nd
rel
ated
tr
ades
wo
rker
s
Ho
mem
aker
Pro
fess
ion
als
Pla
nt
and
mac
hin
e o
per
ato
rs a
nd
as
sem
ble
s
Ele
men
tary
o
ccu
pat
ion
s
Total
Pen
sio
ner
Vo
lun
tary
wo
rker
… 9.1. Persons attending the University of the Third Age classified by locality of residence, previous occupational status and sex
Locality
Arm
ed F
orc
es
Leg
isla
tors
, sen
ior
off
icia
ls a
nd
m
anag
ers

153
9.2. Persons attending the University of the Third Age classified by previous occupational status, age group and sex
Males Females Males Females Males Females Males Females Males Females Males Females Males Females Total
Armed forces 1 - 2 1 - - - - 1 - 3 - 7 1 8
Legislators, senior officials and managers - - 5 12 5 14 4 6 8 8 5 5 27 45 72
Professionals - 2 5 41 10 47 8 48 18 53 12 20 53 211 264
Technicians and associate professionals - - 4 8 11 9 17 5 7 4 7 4 46 30 76
Clerks - - 4 8 1 12 5 22 1 10 - 12 11 64 75
Services workers and shop and market sales workers - - - 2 - 2 - 3 1 1 2 3 3 11 14
Craft and related trades workers - - 1 - 1 3 2 1 - 2 2 - 6 6 12
Plant and machine operators and assembles - - - - - 1 1 - - - - - 1 1 2
Elementary occupations - - - - - 2 - - 1 1 - - 1 3 4
Homemaker - - - 17 - 23 - 37 1 35 - 46 1 158 159
Pensioner - - 1 - 4 - 6 - 5 - 5 - 21 - 21
Voluntary worker - - - 1 - - - - - - - 1 - 2 2
Total 1 2 22 90 32 113 43 122 43 114 36 91 177 532 709
Total75-79 80 and overUnder 60 60-64 65-69 70-74


CHAPTER 10
SCHOOL ABSENCES


157
UnauthorisedAverage per
pupilAuthorised
Average per pupil
Year 1 1,375 4,614 3.36 9,583 6.97
Year 2 1,460 4,761 3.26 9,013 6.17
Year 3 1,472 4,891 3.32 7,564 5.14
Year 4 1,669 5,852 3.51 7,676 4.60
Year 5 1,639 5,766 3.52 7,861 4.80
Year 6 1,728 7,443 4.31 8,010 4.64
Year 7 210 760 3.62 1,039 4.95
Total 9,553 34,087 3.56 50,746 5.32
UnauthorisedAverage per
pupilAuthorised
Average per pupil
Year 1 1,281 4,308 3.36 8,946 6.98
Year 2 1,279 4,078 3.19 7,435 5.81
Year 3 1,289 4,240 3.29 6,678 5.18
Year 4 1,388 4,292 3.09 6,072 4.37
Year 5 1,381 4,509 3.27 6,557 4.75
Year 6 1,454 4,868 3.35 5,897 4.06
Year 7 162 594 3.67 718 4.43
Total 8,234 26,889 3.32 42,303 5.08
UnauthorisedAverage per
pupilAuthorised
Average per pupil
Year 1 2,656 8,922 3.36 18,529 6.98
Year 2 2,739 8,839 3.23 16,448 6.01
Year 3 2,761 9,131 3.31 14,242 5.16
Year 4 3,057 10,144 3.32 13,748 4.50
Year 5 3,020 10,275 3.40 14,418 4.77
Year 6 3,182 12,311 3.87 13,907 4.37
Year 7 372 1,354 3.64 1,757 4.72
Total 17,787 60,976 3.45 93,049 5.22
Note: Absences refer to the period September 2005 to March 2006.
10.1. Absences in government primary schools (male pupils) classified by year of study
Year of studyTotal pupils
boys
Absences
10.2. Absences in government primary schools (female pupils) classified by year of study
Year of studyTotal pupils
girls
Absences
10.3. Total absences in government primary schools classified by year of study
Year of study Total pupils
Absences

158
Unauthorised Authorised Total Average
MALTA 17,787 60,976 93,049 154,025 8.66
Southern Harbour 4,042 20,217 20,423 40,640 10.05
Valletta 186 2,289 1,022 3,311 17.80
Birgu 104 513 644 1,157 11.13
Isla 187 1,116 1,396 2,512 13.43
Bormla 245 2,649 1,399 4,048 16.52
abbar 895 2,814 3,805 6,619 7.40
Fgura 715 2,810 3,368 6,178 8.64
Floriana 97 731 696 1,427 14.71
Kalkara 204 730 814 1,544 7.57
Luqa 232 1,135 807 1,942 8.37
Marsa 186 1,430 1,044 2,474 13.30
Paola 661 2,514 3,332 5,846 8.84
Tarxien 238 933 1,445 2,378 9.99
Xghajra 92 553 651 1,204 13.09
Northern Harbour 4,001 17,853 24,927 42,780 10.69
Qormi 770 2,563 4,320 6,883 8.94
Birkirkara 603 3,428 3,905 7,333 12.16
G ira 195 903 1,812 2,715 13.92
amrun 538 4,762 4,024 8,786 16.33
Msida 248 840 1,780 2,620 10.56
Pembroke 213 661 757 1,418 6.66
Pietà 194 342 1,244 1,586 8.18
San iljan 157 798 1,174 1,972 12.56
San wann 598 1,527 3,629 5,156 8.62
Santa Venera 346 1,409 1,846 3,255 9.41
Sliema 139 620 436 1,056 7.60
South Eastern 3,140 9,553 13,913 23,466 7.47
ejtun 609 2,456 2,752 5,208 8.55
Bir ebbugia 564 1,604 2,627 4,231 7.50
Gudja 104 347 330 677 6.51
G axaq 223 632 1,163 1,795 8.05
Kirkop 113 539 728 1,267 11.21
Marsaskala 406 1,417 2,163 3,580 8.82
Marsaxlokk 154 294 498 792 5.14
Mqabba 187 520 1,192 1,712 9.16
Qrendi 76 99 325 424 5.58
Safi 115 246 366 612 5.32
urrieq 589 1,399 1,769 3,168 5.38
Western Harbour 2,537 4,720 14,853 19,573 7.72
ebbu 483 1,083 2,504 3,587 7.43
Si iewi 443 547 2,317 2,864 6.47
Attard 407 1,171 3,466 4,637 11.39
Dingli 224 320 1,041 1,361 6.08
Lija 356 262 2,282 2,544 7.15
Rabat 480 1,062 2,269 3,331 6.94
Mtarfa 144 275 974 1,249 8.67
10.4. Absences in government primary schools classified by locality of school …
Region/LocalityTotal
primary pupils
Absences

159
Unauthorised Authorised Total Average
Northern 2,449 6,607 10,989 17,596 7.18
G arg ur 60 94 219 313 5.22
Mellie a 328 424 1,702 2,126 6.48
M arr 185 198 738 936 5.06
Mosta 858 1,131 3,522 4,653 5.42
Naxxar 412 879 2,281 3,160 7.67
San Pawl il-Ba ar 606 3,881 2,527 6,408 10.57
Gozo and Comino 1,618 2,026 7,944 9,970 6.16
Rabat 290 382 1,675 2,057 7.09
G ajnsielem and Comino 142 131 574 705 4.96
G arb 90 21 432 453 5.03
Ker em 90 23 509 532 5.91
Nadur 233 271 930 1,201 5.15
Qala 102 115 551 666 6.53
San Lawrenz 44 49 196 245 5.57
Sannat 185 613 670 1,283 6.94
Xag ra 244 34 1,243 1,277 5.23
Xewkija 132 201 787 988 7.48
ebbu 66 186 377 563 8.53
Note: Absences refer to the period September 2005 to March 2006.
Absences
… 10.4. Absences in government primary schools classified by locality of school
Region/LocalityTotal
primary pupils

160
UnauthorisedAverage
per pupilAuthorised
Average per pupil
Year 1 440 272 0.62 2,741 6.23
Year 2 462 460 1.00 2,469 5.34
Year 3 485 187 0.39 2,337 4.82
Year 4 509 239 0.47 2,217 4.36
Year 5 525 280 0.53 2,158 4.11
Year 6 539 337 0.63 2,102 3.90
Total 2,960 1,775 0.60 14,024 4.74
UnauthorisedAverage
per pupilAuthorised
Average per pupil
Year 1 685 431 0.63 4,787 6.99
Year 2 713 376 0.53 4,294 6.02
Year 3 713 454 0.64 3,543 4.97
Year 4 708 309 0.44 3,052 4.31
Year 5 712 362 0.51 2,683 3.77
Year 6 740 382 0.52 3,331 4.50
Total 4,271 2,314 0.54 21,690 5.08
UnauthorisedAverage
per pupilAuthorised
Average per pupil
Year 1 1,125 703 0.62 7,528 6.69
Year 2 1,175 836 0.71 6,763 5.76
Year 3 1,198 641 0.54 5,880 4.91
Year 4 1,217 548 0.45 5,269 4.33
Year 5 1,237 642 0.52 4,841 3.91
Year 6 1,279 719 0.56 5,433 4.25
Total 7,231 4,089 0.57 35,714 4.94
Note: Absences refer to the period September 2005 to March 2006.
10.5. Absences in government-dependent private primary schools (male pupils)
Year of studyTotal
pupils boys
Absences
10.6. Absences in government-dependent private primary schools (female pupils)
Year of studyTotal
pupils girls
Absences
10.7. Total absences in government-dependent private primary schools
Year of studyTotal
pupils
Absences

161
UnauthorisedAverage
per pupilAuthorised
Average per pupil
Year 1 342 18 0.05 1,920 5.61
Year 2 364 52 0.14 1,843 5.06
Year 3 415 41 0.10 1,781 4.29
Year 4 399 103 0.26 1,451 3.64
Year 5 405 127 0.31 1,479 3.65
Year 6 431 90 0.21 1,451 3.37
Total 2,356 431 0.18 9,925 4.21
UnauthorisedAverage
per pupilAuthorised
Average per pupil
Year 1 279 37 0.13 2,087 7.48
Year 2 212 11 0.05 1,159 5.47
Year 3 261 39 0.15 1,151 4.41
Year 4 223 61 0.27 917 4.11
Year 5 260 116 0.45 1,120 4.31
Year 6 313 118 0.38 1,201 3.84
Total 1,548 382 0.25 7,635 4.93
UnauthorisedAverage
per pupilAuthorised
Average per pupil
Year 1 621 55 0.09 4,007 6.45
Year 2 576 63 0.11 3,002 5.21
Year 3 676 80 0.12 2,932 4.34
Year 4 622 164 0.26 2,368 3.81
Year 5 665 243 0.37 2,599 3.91
Year 6 744 208 0.28 2,652 3.56
Total 3,904 813 0.21 17,560 4.50
Note: Absences refer to the period September 2005 to March 2006.
10.8. Absences in independent private primary schools (male pupils) classified by year of study
Year of studyTotal
pupils boys
Absences
10.9. Absences in independent private primary schools (female pupils) classified by year of study
Year of studyTotal
pupils girls
Absences
10.10. Total absences in independent private primary schools classified by year of study
Year of studyTotal
pupils
Absences

Unauthorised Authorised Total Average
MALTA 11,135 4,902 53,274 58,176 5.22
Southern Harbour 2,081 1,165 11,057 12,222 5.87
Valletta 155 29 552 581 3.75
Birgu 242 10 1,178 1,188 4.91
Bormla 1,084 256 6,253 6,509 6.00
Marsa 323 649 1,802 2,451 7.59
Paola 277 221 1,272 1,493 5.39
South Eastern 304 167 1,739 1,906 6.27
Gudja 304 167 1,739 1,906 6.27
Northern Harbour 5,885 3,157 28,425 31,582 5.37
Qormi 167 15 816 831 4.98
Birkirkara 989 982 4,438 5,420 5.48
G ira 701 691 2,970 3,661 5.22
amrun 717 538 3,252 3,790 5.29
Msida 336 - 2,026 2,026 6.03
San wann 1,198 42 6,271 6,313 5.27
San iljan 624 26 3,021 3,047 4.88
Pembroke 273 - 1,470 1,470 5.38
Sliema 777 817 3,667 4,484 5.77
Swieqi 103 46 494 540 5.24
Western 1,280 197 5,257 5,454 4.26
ebbu 455 82 1,648 1,730 3.80
Attard 305 4 1,333 1,337 -
Balzan 520 111 2,276 2,387 4.59
Northern 938 198 3,849 4,047 4.31
Mosta 48 - 246 246 5.13
M arr 890 198 3,603 3,801 4.27
Gozo and Comino 647 18 2,947 2,965 4.58
Rabat 331 - 1,286 1,286 3.89
Ker em 139 18 754 772 5.55
G asri 177 - 907 907 5.12
Note: Absences refer to the period September 2005 to March 2006.
Region/Locality
10.11. Absences in government dependent and independent private primary schools classified by locality of school
AbsencesTotal primary
pupils

163
Unauthorised
Average per pupil
AuthorisedAverage
per pupil
Form 1 1,568 11,141 7.11 8,008 5.11
Form 2 1,637 14,083 8.60 9,824 6.00
Form 3 1,766 19,417 10.99 12,173 6.89
Form 4 1,853 26,107 14.09 18,267 9.86
Form 5 1,797 34,032 18.94 26,796 14.91
Total 8,621 104,780 12.15 75,068 8.71
Unauthorised
Average per pupil
AuthorisedAverage
per pupil
Form 1 1,713 8,512 4.97 7,370 4.30
Form 2 1,748 11,171 6.39 8,121 4.65
Form 3 1,836 13,135 7.15 10,093 5.50
Form 4 1,850 17,003 9.19 12,763 6.90
Form 5 1,944 25,806 13.27 16,990 8.74
Total 9,091 75,627 8.32 55,337 6.09
Unauthorised
Average per pupil
AuthorisedAverage
per pupil
Form 1 3,281 19,653 5.99 15,378 4.69
Form 2 3,385 25,254 7.46 17,945 5.30
Form 3 3,602 32,552 9.04 22,266 6.18
Form 4 3,703 43,110 11.64 31,030 8.38
Form 5 3,741 59,838 16.00 43,786 11.70
Total 17,712 180,407 10.19 130,405 7.36
Note: Absences refer to the period September 2005 to March 2006.
10.12. Absences in government secondary schools (male pupils) classified by year of study
Year of studyTotal
pupils boys
Absences
Year of studyTotal
pupils
Absences
10.14. Total absences in government secondary schools classified by year of study
10.13. Absences in government secondary schools (female pupils) classified by year of study
Year of studyTotal
pupils girls
Absences

164
Unauthorised Authorised Total Average
MALTA 17,712 180,407 130,405 310,812 17.55
Malta 15,952 166,552 122,363 288,915 18.11
Southern Harbour 4,647 54,652 49,341 103,993 22.38
Bormla 1,330 20,572 14,079 34,651 26.05
Floriana 196 6,561 5,154 11,715 59.77
Marsa 468 9,451 5,267 14,718 31.45
Paola 1,167 12,409 10,672 23,081 19.78
Tarxien 423 4,014 3,495 7,509 17.75
Santa Lu ija 1,063 1,645 10,674 12,319 11.59
South Eastern 969 4,958 3,388 8,346 8.61
ejtun 969 4,958 3,388 8,346 8.61
Northern Harbour 8,098 74,760 49,121 123,881 15.30
Qormi 2,422 15,755 10,525 26,280 10.85
Birkirkara 565 8,843 6,182 15,025 26.59
G ira 383 7,157 4,420 11,577 30.23
amrun 3,100 27,840 18,256 46,096 14.87
Pembroke 1,151 8,755 5,770 14,525 12.62
Santa Venera 477 6,410 3,968 10,378 21.76
Western 1,211 16,808 13,143 29,951 24.73
ebbu 223 2,895 4,002 6,897 30.93
Rabat 467 6,704 4,039 10,743 23.00
Mtarfa 329 5,553 3,983 9,536 28.98
urrieq 192 1,656 1,119 2,775 14.45
Northern 1,027 15,374 7,370 22,744 22.15
Naxxar 467 10,715 4,003 14,718 31.52
Mosta 560 4,659 3,367 8,026 14.33
Gozo and Comino 1,760 13,855 8,042 21,897 12.44
Rabat 1,760 13,855 8,042 21,897 12.44
Note: Absences refer to the period September 2005 to March 2006.
10.15. Absences in government secondary and boys'/girls' schools classified by locality of schoo
District/localityTotal
secondary pupils
Absences

165
UnauthorisedAverage
per pupilAuthorised
Average per pupil
Form 1 816 202 0.25 2,871 3.52
Form 2 815 297 0.36 3,187 3.91
Form 3 846 398 0.47 3,772 4.46
Form 4 889 606 0.68 4,471 5.03
Form 5 841 926 1.10 4,383 5.21
Total 4,207 2,429 0.58 18,684 4.44
UnauthorisedAverage
per pupilAuthorised
Average per pupil
Form 1 701 109 0.16 2,657 3.79
Form 2 696 392 0.56 2,871 4.13
Form 3 701 318 0.45 2,887 4.12
Form 4 721 717 0.99 3,868 5.36
Form 5 657 1,474 2.24 4,155 6.32
Total 3,476 3,010 0.87 16,438 4.73
UnauthorisedAverage
per pupilAuthorised
Average per pupil
Form 1 1,517 311 0.21 5,528 3.64
Form 2 1,511 689 0.46 6,058 4.01
Form 3 1,547 716 0.46 6,659 4.30
Form 4 1,610 1,323 0.82 8,339 5.18
Form 5 1,498 2,400 1.60 8,538 5.70
Total 7,683 5,439 0.71 35,122 4.57
Note: Absences refer to the period September 2005 to March 2006.
Year of studyTotal
pupils
Absences
Year of studyTotal
pupils girls
Absences
10.18. Total absences in government-dependent private secondary schools
10.17. Absences in government-dependent private secondary schools (female pupils)
10.16. Absences in government-dependent private secondary schools (male pupils)
Year of studyTotal
pupils boys
Absences

166
UnauthorisedAverage
per pupilAuthorised
Average per pupil
Form 1 279 229 0.82 806 2.89
Form 2 287 251 0.87 808 2.82
Form 3 277 226 0.82 1,114 4.02
Form 4 261 342 1.31 777 2.98
Form 5 244 478 1.96 754 3.09
Total 1,348 1,526 1.13 4,259 3.16
UnauthorisedAverage
per pupilAuthorised
Average per pupil
Form 1 193 105 0.54 528 2.74
Form 2 196 192 0.98 712 3.63
Form 3 211 171 0.81 861 4.08
Form 4 243 321 1.32 888 3.65
Form 5 202 490 2.43 853 4.22
Total 1,045 1,279 1.22 3,842 3.68
UnauthorisedAverage
per pupilAuthorised
Average per pupil
Form 1 472 334 0.71 1,334 2.83
Form 2 483 443 0.92 1,520 3.15
Form 3 488 397 0.81 1,975 4.05
Form 4 504 663 1.32 1,665 3.30
Form 5 446 968 2.17 1,607 3.60
Total 2,393 2,805 1.17 8,101 3.39
Note: Absences refer to the period September 2005 to March 2006.
10.20. Absences in independent private secondary schools (female pupils)
10.19. Absences in independent private secondary schools (male pupils)
Year of studyTotal
pupils boys
Absences
Year of studyTotal
pupils
Absences
Year of studyTotal
pupils girls
Absences
10.21. Total absences in independent private secondary schools
