education series 4
TRANSCRIPT

(1)
Ordinary Investors’ Education Series No. 4
Basics of Derivatives
FUTURES & OPTIONS
What Purposes They Serve
and
How To Use Them
Dr. L. C. Gupta & Naveen Jain, M.Com., M.Phil.
Assisted by Poornima Kaushik, M.A.
Society for Capital Market Research & Development
jointly with
Vivek Financial Focus Limited

(i)
Basics of Derivatives : FUTURES MARKETS GENERAL Futures and options markets have acquired growing importance in recent years in the world of business and investment. It has, therefore, become essential for corporate executives, finance and investment managers, commodity producers, traders, importers and exporters, and even ordinary investors to acquire a basic understanding about how the futures and options markets work and how they can be best utilised for furthering one’s financial objectives. Our attempt here is to explain the basics of futures and options as simply as possible. (For information on earlier Series No. 1, 2 and 3, see pages 41-42).

(ii)
CONTENTS
Chapter
Para
1. BASICS OF FUTURES
Futures contracts represent a significant development Forward contracts Example of forward contract Futures contracts The underlying asset Origin of the term “futures”
1.1 to1.9
2. ILLUSTRATIONS OF HEDGING THROUGH FUTURES
Hedging of inventory risk How the hedge works in the case of holder of equities Hedging the risk of price rise Genuine hedging Criterion for distinguishing a hedger from speculator Features of a genuine hedge
2.1 to 2.14
3. ROLE OF ARBITRAGE IN ALIGNING THE FUTURES AND CASH MARKETS
Relationship of futures price to cash price Cost of carry Example of arbitrage Contango and backwardation High leverage Upper limit to futures price
Cash market is the anchor Hedger’s role
3.1 to 3.14
4. REGULATORY AND OPERATIONAL ASPECTS OF FUTURES TRADING
The futures segment The clearing corporation
4.1 to 4.13

(iii)
Stringent requirements of the futures market Clearing and non-clearing members Mark-to-market system Eligibility for listing on derivatives segment Contract size and lot size Low initial margins, high leverage Reasons for introducing futures system
5. THE SYSTEM OF EQUITY FUTURES IN INDIA
Main features Settlement day Build up of trading Near-month contract dominates trading Open-interest Bulk of trading is day trading Rolling over of positions to next month Mechanisms for market’s safety
5.1 to 5.16
6. BASICS OF OPTIONS
Option writer Types of option contracts
Call option Option premium (i.e. price of option right) Put option Detailed examples Call option case Put option case Option’s maturity or expiration date Call option buyer and seller Put option buyer vs. seller: Profit position Special market terminology of the options market Intrinsic value Unpredictability of stock price movements Recent developments
6.1 to 6.32

(1)
Chapter 1
BASICS OF FUTURES
Futures contracts represent a significant development:
1.1 The system of “futures contracts” is a great advancement over the much older system of “forward contracts”, as we shall explain shortly. The emergence of futures trading is a major economic and financial innovation.
Forward contracts:
1.2 Let us first understand the forward contract system. Each forward contract is an agreement between two parties and is tailor-made according to the specific requirements of both. It specifies the quantity and quality of the asset or goods to be delivered, the date and place of delivery, and the price to be paid. Thus, each forward contract is unique and is, therefore, not tradable. Such contracts have been a part and parcel of general commercial practice in the business world since quite long.
Example of forward contract:
1.3 A simple example of a forward contract is a contract for the supply of wheat flour by a flour-miller to a bakery. Such a contract is intended to give and take actual delivery of the particular goods at prices agreed in advance and as per agreed schedule. This helps business firms to plan their own operations and coordinate also with other firms. This promotes smoother functioning of the economic system as a whole.
Futures contracts:
1.4 An important characteristic of a futures contract is that it is standardized in order to make it a tradable contract. It is not intended to acquire the asset or goods but only to transfer the price risk to other market participants. The price risk in question is the risk due to fluctuations in the asset value. A futures contract is thus a risk management tool.
1.5 It is standardized in terms of contract size, tenure and the type as well as the quality or grade of the underlying asset, i.e., the asset on which it is based. It has a fixed tenure at the end of

(2)
which the contract expires. Different futures contracts have different tenures, such as 1 month, 2 months, 3 months or much longer also. A futures contract is identified by the month in which it is to expire. For example, the contract expiring in June is known as June futures; similarly, July futures, August futures, etc. In the U.S., many futures contracts have fairly long tenure upto a year or even longer.
The underlying asset:
1.6 The value of a futures contract moves with the value of the asset underlying it, i.e., the asset on which it is based. The underlying asset may be a financial asset (like equities, bonds, or foreign currency) or a commodity. We thus have equity futures, bond futures, currency futures, wheat futures, corn futures, oil futures, gold futures and many others.
1.7 The features which differentiate forward contracts from futures contracts are highlighted in Exhibit 1.1.
Exhibit 1.1
FORWARD AND FUTURES CONTRACTS DISTINGUISHED
Forward contracts Futures contracts
1. Contract is always settled by actual delivery by the seller to the buyer.
1. The bulk of futures contracts are settled by paying/ receiving only the price difference between one’s buying/selling prices, and not by delivery.
2.
The contract terms are negotiated between the two parties concerned. Each contract is a unique bilateral contract and, therefore, not tradable.
2. Contracts are standardized and tradable on futures exchanges.
3. Contracted price is not made public.
3. Traded price is publicly available.
4. There is risk of default by counterparty.
4. A Clearing Corporation acts as the counter-party to every trade. Hence, there is no risk of default by counter-party.

(3)
Origin of the term “Futures”:
1.8 Origin of the term “futures” is rather mysterious. It is explained in Exhibit 1.2.
Exhibit 1.2
HOW THE TERM “FUTURES” AROSE
The term “futures” looks odd from grammatical viewpoint. How it arose is interesting. Grain traders in the U.S. had hit upon the idea of making forward contracts easily transferable at market-determined prices by standardizing the contracts. This took the form of exchange-traded forward contracts with the establishment of the CBOT (Chicago Board of Trade) in 1848. The two principal features of this new system were:
(1) Standardising the contracts in order to avoid the
cumbersome process of negotiating the specific terms of every contract with respect to quantities, grades, delivery dates and location; and
(2) Creating a central meeting place, called the exchange, for
buyers and sellers of forward contracts in selected commodities of wide importance.
Such exchange-traded forward contracts were given a different name, viz., “futures contracts” (or simply futures) to distinguish them from the traditional non-tradable forward contracts.
1.9 Thus, the system of futures contracts is only about 160 years old. In India, the standardized form of futures contracts is of very recent origin although we have a long history of stock exchanges and commodity trading.

(4)
Chapter 2
ILLUSTRATIONS OF HEDGING THROUGH FUTURES
2.1 There is a great variety of situations in which a person may feel the need to hedge the price risk through futures. Hedging means protecting against some specific risk. We shall give a few simple examples here.
Hedging of inventory risk:
2.2 If a person holds an inventory of equities, he is exposed to the risk of decline in the market value of his equity holdings. In normal times, most investors are prepared to face this kind of risk. At other times, the risk can be really serious, either due to some important impending economic or political development, or due to the investor’s personal financial situation. In such circumstances, the investor may like to hedge the risk.
2.3 Suppose that the holder of equities is particularly concerned
about uncertainty of equity prices over the next one month. He can hedge the risk of price decline by selling equity index futures of one month’s maturity. In this way, he can lock-in the prevailing equity prices. Such hedge can be effective in eliminating the price risk, provided the composition of the investment portfolio held by him is at least broadly similar to the composition of the equity index underlying the futures contract used for hedging. If the composition of his portfolio is very different from that of the equity index, the hedge may not be effective at all.
How the hedge works in the case of holder of equities:
2.4 The hedge will work as follows:
If equity prices over the next one month decline by, say, 20%, he will lose this much on his equity holdings. At the same time, he will make a profit of 20% on the futures contract which had locked-in the higher earlier price. Thus, loss on the equity portfolio will be cancelled out by profit on the equity index futures contract. The whole purpose of hedging is to provide protection against loss.

(5)
2.5 Hedging the risk of price decline is very often needed by producers of agricultural commodities, such as wheat. A wheat farmer, for example, may sell wheat futures at a given price well before the harvest in order to lock-in the prevailing price.
Hedging the risk of price rise:
2.6 We now consider an altogether different kind of situation. Suppose that you are anticipating purchase of equities in a month’s time out of the lump sum of around Rs. 200,000 which you will be receiving on your retirement.
2.7 The risk faced by you in such a situation is that, by the time the money becomes available for purchasing equities, the equity prices might rise. If you have to pay higher prices for investing your money, the rate of return which you will earn on the investment will come down.
2.8 In order to hedge this kind of risk, you can buy equity index futures. How this hedge will work is as follows. In the event of equity prices rising, you will make a profit on the futures contract bought before the equity prices actually rose. This is because the value of the futures contract is linked to the value of the underlying asset, viz., equity shares. If equity share prices rise, the contract’s value will also rise.
2.9 Hence, the contract’s settlement price on its expiry date will be higher than the purchase price paid by you earlier. You will thus earn a profit on the futures contract. This will help to meet the increase in the cost of the investments which you had planned to purchase with your retirement funds. This is elaborated below.
(a) You have bought Equity Index Futures contracts at the prevailing price for a sum of Rs. 200,000 as a hedge against rise in equity prices.
(b) Suppose that the equity prices rise subsequently by 20% on the contract’s maturity date. Hence, the Equity Index futures contracts held by you will rise in value from Rs. 200,000 to Rs. 2,20,000.
(c) Your gain on the futures contracts will be Rs. 20,000.
(6)
(d) The cost of purchasing the same portfolio of shares as you had planned will rise from Rs. 200,000 to Rs. 2,20,000. This additional cost of Rs. 20,000 can be met from the profit of Rs. 20,000 on the futures contracts. You have thus hedged your risk.
2.10 The user of an agricultural product may also like to hedge against the risk of price rise of his raw materials, such as wheat, by buying wheat futures. In this way, he can lock-in his buying price.
Genuine hedging:
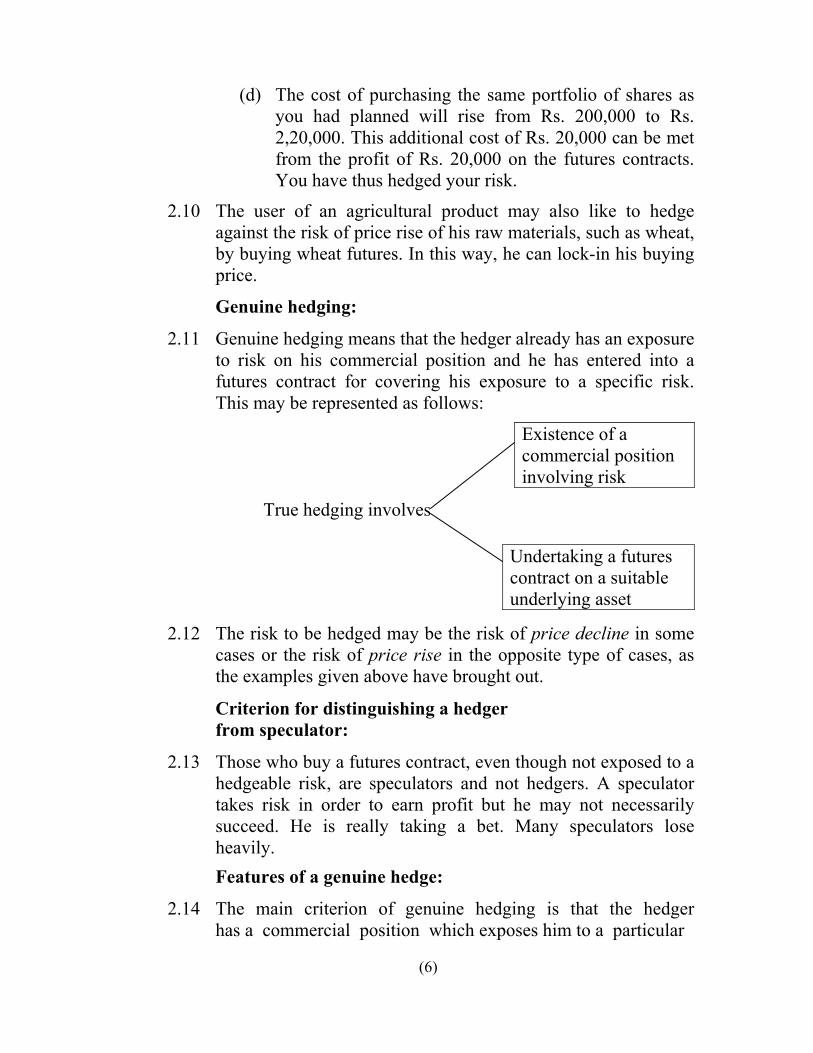
2.11 Genuine hedging means that the hedger already has an exposure to risk on his commercial position and he has entered into a futures contract for covering his exposure to a specific risk. This may be represented as follows:
Existence of a commercial position involving risk
True hedging involves
Undertaking a futures contract on a suitable underlying asset
2.12 The risk to be hedged may be the risk of price decline in some cases or the risk of price rise in the opposite type of cases, as the examples given above have brought out.
Criterion for distinguishing a hedger from speculator:
2.13 Those who buy a futures contract, even though not exposed to a hedgeable risk, are speculators and not hedgers. A speculator takes risk in order to earn profit but he may not necessarily succeed. He is really taking a bet. Many speculators lose heavily.
Features of a genuine hedge:
2.14 The main criterion of genuine hedging is that the hedger has a commercial position which exposes him to a particular

(7)
risk. The effectiveness of hedging depends on whether the hedging transaction matches the nature of price-risk to which one is exposed. A variety of examples of hedging through futures are presented in Exhibits 2.1, 2.2, and 2.3.
Exhibit 2.1
HEDGING INVENTORY HOLDING RISK
Risk : Price may fall.
Hedging action required: Sell Futures (i.e., go short)1
Price movement
Inventory value: how affected
Futures contracts: how affected
Remarks
(a) Price falls Loss incurred on inventory
Profit on futures Loss & profit cancel out
(b) Price rises Profit made on inventory
Loss on futures Profit & Loss cancel out
Exhibit 2.2
HEDGING THE OPERATIONAL RISK
Risk: Price of raw material may rise.
Hedging action required: Buy Futures (i.e., go long)1
Price movement
Material cost: how affected
Futures contract: how affected
Remarks
• Price rises Material cost rises: profit reduces
Profit on futures Loss & profit cancel out
• Price falls Material cost falls, profit increases
Loss on futures Profit & Loss cancel out
1 The futures should be based on the appropriate type of underlying asset.

(8)
Exhibit 2.3
MORE EXAMPLES OF HEDGING THROUGH FUTURES
(1) INVENTORY RISK
(Value may decline)
(a) Commodities
(b) Bonds
(c) Foreign Currency
(d) Shares
HEDGING STRATEGY
Sell futures
(2) CURRENCY RISK
(Exchange rate may change adversely)
(a) Anticipated payment to be made in US$ after 3 months
(b) Anticipated Receipt in US$ after 3 months
Buy US$ futures equal to anticipated payment
Sell US$ futures equal to anticipated receipts
(3) INVESTING ANTICIPATED CASH FLOW
(e.g. a new equity scheme launched by a mutual fund)
Buy futures to hedge against increase in equity prices before the cash collected has been invested
(4) PORTFOLIO RE- BALANCING:
(e.g. wanting to reduce the proportion of equities in portfolio and to increase bonds)
Sell Stock Index Futures and buy bond futures

(9)
Chapter 3
ROLE OF ARBITRAGE IN ALIGNING THE FUTURES AND CASH MARKETS
Relationship of futures price to cash price:
3.1 The cash price of an asset at the present time and its price in the future at a given time are closely linked to each other by the cost of carry, i.e., the cost incurred in holding the asset from the present moment till the given future date.
Cost of Carry:
3.2 Normally, the futures price of a stock is higher than the cash price by an amount approximately representing the carrying cost. Such carrying cost includes interest cost and warehousing costs. In other words:
Futures price = Cash market price + interest cost + depository / warehousing charges for the holding period till the contract’s expiry
3.3 If the equation given above is not satisfied (i.e., the futures price is higher or lower than what is justified), it would indicate that there is a discrepancy between the futures market and the cash market.
3.4 The difference between the futures price and the cash market price goes on narrowing and finally disappears on the expiration date. On the contract expiry date, the futures price and the cash price must converge, i.e. become identical.
3.5 The difference between futures price and cash price is known as “basis” in market parlance. If the difference is more than what is justified by the carrying cost, as defined above, then market forces in the form of arbitrage operations would come into play and rectify the anomaly, as illustrated below.

(10)
Example of arbitrage:1
3.6 We assume the following:
Prevailing Share Price of X Ltd. on 01-03-2008 = Rs. 600 per share Prevailing Futures Price of the share = Rs.615 Expiration Date = 27-03-2008
If the Interest Rate is 1.0 % per month, the cost of carry (interest plus depository / warehousing charges) for the period involved will be approximately Rs. 6.
Arbitrage operation between spot and futures will be as follows:
a) Buy the share on spot basis at Rs. 600 by borrowing Rs. 600 at 1% p.m.
b) Sell futures expiring around the month-end at the prevailing price of Rs. 615.
c) Hold the shares till expiry date of futures (i.e. 27-03-2008).
d) Settle the futures by giving delivery and receiving the price of Rs. 615.
Computation of net gain from arbitrage :
Spot purchase price = Rs. 600 Add carrying cost = Rs. 6
Total cost = 606
Prevailing futures price = 615
Hence, Net Profit (615 - 606) = 9
Contango and backwardation:
3.7 The futures price is normally higher than the spot (i.e. cash) price by the amount of carrying cost. This kind of situation is described as contango in market parlance. If the futures price is lower than the spot price, the situation
1 The term “arbitrage” means buying a commodity or security in one market and simultaneously
selling it in another market, thus taking advantage of temporary price discrepancies. Such market operators are known as “arbitrageurs”.

(11)
is described as backwardation and is regarded as abnormal.
High leverage:
3.8 It may also be mentioned here that for buying futures, one enjoys the advantage of high leverage because only the margin money has to be paid. Such margin money is only a fraction of the price. The margin payment is a percentage of the contract value. It varies from one share to another and could be even 20-40% depending on the share price volatility. It still gives considerable leverage and jacks up the return on actual investment.
3.9 We have explained above that the operations of arbitrageurs are helpful in ensuring proper alignment between the futures market and the cash market.
3.10 So long as arbitrage operation can yield a profit, the futures price and the cash price are not fully aligned to each other. Hence, arbitrageurs will continue to take advantage of this situation. As a result, the discrepancy between the futures and the cash market prices will go on narrowing and will ultimately be removed. The arbitrage activity will cease when it ceases to be profitable.
Upper limit to futures price:
3.11 It may be noted here that the futures contract price may exceed the spot price upto a certain limit. This limit is set by the cost of carrying. In the case of commodities, the warehousing and insurance costs could be an important part of the carrying costs, in addition to the interest costs on the funds locked up in holding stocks of commodities. Our discussion has indicated that the futures price is normally higher than the cash market price. Also, the price of the more distant futures contract will be higher than the price of the futures maturing earlier.
3.12 Under abnormal conditions or due to special factors, the futures contract price may lie below the spot price. In the case of commodities, it is often due to seasonal factors.

(12)
The phenomenon of the futures price being lower than the spot price is called backwardation. Cash market is the anchor:
3.13 It is the cash market which determines the direction of the futures market for an asset. In an efficiently functioning market, the price is determined by the fundamental forces of demand and supply. If the cash price rises, the futures price will also generally rise to a similar extent under normal conditions. The prices of futures are kept aligned with cash market prices by the possibility of profitable arbitrage, as explained earlier.
Hedger’s Role:
3.14 Apart from arbitrageurs, who are basically speculative operators, commercial interests act as hedgers to limit or eliminate the price risk faced by them. Hedgers may be manufacturers who buy a commodity for their manufacturing operations or they may be dealers or exporters of a commodity. In the case of financial futures, the hedgers may be investment institutions (see Chapter 2 for examples of hedging).

(13)
Chapter 4
REGULATORY AND OPERATIONAL ASPECTS OF FUTURES TRADING
The futures segment:
4.1 For futures or derivatives trading, the stock exchange has to create a separate segment, as required by SEBI regulations. This segment is called Futures & Options (F & O) segment.
The Clearing Corporation:
4.2 In the modern system, the Clearing Corporation serves as a crucial part of the mechanism of futures market for ensuring its smooth functioning (see Exhibit 4.1). It guarantees that all the participating traders will honour their obligations. It serves this role by interposing itself as a counterparty to every trade – it adopts the position of buyer to every seller, and the position of seller to every buyer but does not itself trade. It is a passive partner in the trading system. Every trader in the futures market has obligations only to the Clearing Corporation with regard to payments as well as deliveries.
4.3 Actually, the number of contracts bought will always be
exactly equal to the number of contracts sold. Hence, for every party expecting to receive delivery, the opposite trading party must be prepared to make delivery. Such matching is carried out through the Clearing mechanism and any difference has to be immediately resolved.
Stringent requirements of the futures market:
4.4 The futures market is subject to more stringent requirements than is the case with the cash market. The brokers/members of the erstwhile stock exchanges were not automatically made members of the futures (derivatives) segment. This is because much stricter

(14)
Exhibit 4.1
TRANSACTION SETTLEMENT SYSTEM:
OLD Vs. MODERN
(Old Method)
PARTIES TRANSACT DIRECTLY
Asset delivered
Payment made
(Modern Method)
CLEARING HOUSE INTERPOSES
Asset delivered Asset delivered
Payment made Payment made
Clearing Corporation
Buyer
Seller
Seller
Buyer

(15)
eligibility conditions with regard to networth were laid down for admission to the futures segment of the stock exchanges compared to the cash segment.
Clearing and Non-Clearing Members:
4.5 In order to somewhat ease the constraint on participation due to high networth requirement, the L.C. Gupta Committee on Derivatives had suggested a two-level system of members, to be called Clearing Members and Non-Clearing Members. The non-clearing members are now called Trading Members. The networth requirement for the Clearing Members is higher than for Trading Members. The Trading Members can trade on their own behalf and on behalf of their clients but they have to depend on the Clearing Members for settlement of trades. The Clearing Members take the responsibility for the Trading Member’s position so far as the Clearing Corporation is concerned. The Clearing Members are thus the guarantors for the Trading Members. An investor accesses the market through a broker/member who may be a clearing member or a non-clearing member, as shown in Exhibit 4.2.
4.6 All the members of the derivatives exchange are
compulsorily required to collect initial and mark-to-market margins from their clients (see Exhibit 4.3). The mark-to-market margins (which are explained below) have to be collected before the next day’s trading starts. This is necessary because of the high leverage and therefore high risk involved in derivatives trading.
Mark-to-market system:
4.7 How the system of Mark-to-market on daily basis operates is explained below:
Every transaction involves two parties, viz., the buyer and the seller. Any price-change affects the buyer and

(16)
Exhibit 4.2
ROUTING OF PAYMENTS AND DELIVERIES
Exhibit 4.3
TYPES OF MARGINS
1.
Initial Margin
2. Mark-to-market margin
Investor
A
Investor
B
Non-clearing Member
Clearing Member
Clearing Corporation

(17)
the seller in opposite ways. In market parlance, the buyer has a “long” position, and the seller has a “short” position. If price rises subsequent to purchasing of futures, the buyer will gain and the seller will lose. On the other hand, if price falls, the buyer will lose and the seller will gain. Gains made by a person are credited to his A/c, while losses are debited. Daily Mark-to-market means that gains and losses are settled every day by actual payment before the next day’s trading starts. A numerical example is given in Exhibit 4.4.
Eligibility for listing on derivatives segment:
4.8 The number of shares allowed to be traded in the futures segment is only a fraction of the shares traded in the cash market because of much stricter requirements for the futures, i.e., derivatives segment. Shares for inclusion in derivatives trading are chosen from amongst the top 500 stocks in terms of average daily market capitalization and also average daily traded value in the previous six months on a rolling basis.
4.9 The number of companies whose shares are listed on the
futures segment of the NSE is only about 200 out of a total of around 1100 companies listed on the NSE’s cash segment. The BSE, which has a total of more than 4000 listed companies in its cash segment, has very little futures trading. The NSE has virtually monopolised equity futures trading in India.
Contract size and lot size:
4.10 The minimum contract size in the futures segment in India is Rs. 2 lakhs. The minimum contract value can be converted into lot size, i.e., the number of shares represented by one contract. The lot size is determined at

(18)
Exhibit 4.4
Numerical Example of Mark-to-Market
Assume that the prices of a futures contract from the beginning date (i.e. t0) to last date (t8) are as given below:
Date t0 t1 t2 t3 t4 t5 t6 t7 t8
Price 135 130 133 135 138 132 125 109 80
Price change (Daily Debited/ Credited to the buyer's A/c
-5 +3 +2 +3 -6 -7 -16 -29
Cumulative Debit / Credit upto successive dates
-5 -2 0 +3 -3 -10 -26 -55
the time of introducing a contract and is based on the then prevailing share price. For example, if shares of XYZ Ltd are quoted at Rs. 1000 each and the contract size is Rs. 2 lakhs, the lot size will be 200 shares (i.e. 200,000÷1000). More recently, the market authorities decided to reduce the contract size and lot size in the case of certain shares whose market prices had multiplied many times since their inclusion in the futures segment. Such increase in market prices had made the contract size too large in these cases.
Low initial margins, high leverage:
4.11 A person who buys a futures contract has to pay only the initial margin on the contract. This margin varies from one share to another, depending on the volatility of the security. The initial margins are fixed by the stock exchange in such a manner that they are large enough to

(19)
cover the worst case of one-day loss with 99% probability over a specified time horizon.
Reasons for introducing futures system:
4.12 The object of introducing futures in India was to replace the controversial badla system which had earned great notoriety and had dominated the Indian stock market’s entire functioning all along. There were many malpractices associated with the badla system.
4.13 The futures system was introduced first in the form of
stock index futures in June 2000. Subsequently, trading of Index Options was introduced in June 2001, options on individual stocks in July 2001 and futures on individual stocks in November 2001.

(20)
Chapter 5
THE SYSTEM OF EQUITY FUTURES IN INDIA
Main features:
5.1 India has equity futures contracts in the form of Index Futures as well as Individual Stock Futures on selected stocks.
The futures contracts are available for three durations (or expiration periods), viz., 1 month (near-month contract), 2 months (next-month contract) and 3 months (distant-month contract).
If the near-month contract matures in January, it is identified as January Futures. The subsequent ones will be known as February Futures, March Futures, etc.
Settlement day:
5.2 The settlement of an expiring contract takes place on the last Thursday of the concerned month. As one contract expires, a new 3-month contract is made available from the next day. Thus, at any one time, contracts of three different durations are available for trading. Build up of trading:
5.3 We have traced the build up of trading in a new contract from its beginning till its expiry. The build up is very slow during the first two months of a new contract. The contract has very little liquidity and very few participants during this period.
Near-month contract dominates trading:
5.4 Actually speaking, the great bulk of trading in equity futures remains concentrated in the “near-month”

(21)
contract, i.e., the contract which is about to mature. The other contrasts have very little trading. As a consequence, it is almost impossible to execute a trade during the initial two months of a new contract.
5.5 The trading in the “near-month” contract builds up
quickly during the first two weeks of this month, then reaches a plateau and finally declines in the last week preceding the contract’s expiry. These changes get reflected in the volume of “open interest,” as explained below.
Open interest:
5.6 Open interest refers to the total number of contracts which remain outstanding at any particular time. When Mr. S sells one contract to Mr. B, open interest equal to one contract will be created. In market parlance, Mr. S. (the seller) is said to have a “short” position and Mr. B (the buyer) will be having a “long” position.
5.7 As trading builds up with the selling of more contracts, the open interest also goes on increasing. The bulk of such open interest relates to the near-month contract.
5.8 When the contract’s expiry date draws near, the open
interest falls sharply because the market players square up their positions by reversing the trades.
5.9 Many of them take a position in the subsequent month’s
contract. Exhibit 5.1 shows the typical shape of the growth and decline in the volume of open interest in a particular contract. It may be noted from Exhibit 5.1 that at the beginning of the month and for many days into the month, the open positions are almost wholly for the near-month contract. The “next month” and the “distant month” have only a small volume of open positions.

(22)
0
500
1000
1500
2000
26-J
ul
02-A
ug
09-A
ug
16-A
ug
23-A
ug
30-A
ug
06-S
ep
13-S
ep
20-S
ep
27-S
ep
04-O
ct
11-O
ct
18-O
ct
25-O
ct
Period of Analysis
Val
ue o
f Ope
n In
tere
st(R
s. m
illio
n)
Exhibit 5.1
INDIVIDUAL STOCK FUTURES CONTRACT EXPIRING 31ST OCT 2002: TIME PATTERN OF OPEN INTEREST AT WEEKLY INTERVALS DURING JUL-OCT 2002
THE CASE OF INFOSYS STOCK

(23)
5.10 As open positions for the expiring month are squared up, new positions are opened for the subsequent month. By rolling over their open positions from near-month contract to next-month contract and so on, the traders can maintain their total open positions for almost any length of time. The bulk of open positions get rolled over in this way.
5.11 Typically, out of the monthly total trading volume in stock futures, roughly 70-80% is accounted for by the near-month contract. The pattern of open positions as well as of trading volume indicates very high concentration in the near-term contract.
Bulk of trading is day trading:
5.12 The great bulk of trading in stock futures is day trading and the holding period is rarely more than a few days or, at the most, a few weeks till contract expiry.
5.13 If we look at open positions in each of the three contracts on the same stock at the beginning of any month, the near-month contract typically accounts for around 99% of the combined open positions in all the three futures contracts available on a stock. In any case, the near-month contract always overwhelmingly dominates the futures open positions.
Rolling over of position to next month:
5.14 The process of rolling over of open positions by traders from the near-month into the following month gathers momentum only a few days before the contract expiry date. As the month progresses, while the open position of the near-month contract declines, the open position of the other two contracts (specially that of the next-month contract) increases.

(24)
5.15 In Chapter 4, we have already mentioned about
contract size and lot size prescribed as part of the system of equity futures in India.
Mechanisms for market’s safety:
5.16 Futures contracts involve very high leverage, as initial margin is relatively low. Hence futures trading attracts a great deal of speculative interest. Hedgers seek to transfer risk whereas speculators take on risk in search of profit. Both hedgers and speculators are needed to make the system of futures trading possible. The safety of the market has been assured by very elaborate mechanisms, such as the existence of the Clearing Corporation acting as the counter-party to every trade and the adoption of daily mark-to-market system. These features have already been discussed in detail in the preceding chapter.

(25)
Chapter 6
BASICS OF OPTIONS
6.1 The potential returns from buying options on an underlying asset are much higher and the risk much lower compared to buying futures. This is because for buying an option, the buyer has to pay to the option seller only a relatively small fee, called option premium. The maximum loss for the buyer is limited to the amount of premium paid by him to the option writer. A futures contract can involve much higher loss. Option writer:
6.2 The seller of an option contract is known as the option writer. Types of option contracts:
6.3 An option contract may be (1) a Call option or (2) a Put option.
Call option:
6.4 Under call option, the buyer of option has the right to buy but is not obliged to buy, a specified quantity of the particular asset (e.g. a share) at a pre-determined price, known as the exercise price (or strike price), before or on a specified date. However, the seller (writer) of a call option is obligated to sell the asset to the buyer at the exercise price.
Option premium (i.e. price of option right):
6.5 Thus, an option contract imposes a commitment only on the option seller (called option writer) but not on the option buyer. This places the option writer at a disadvantage. It is for this reason that the option writer charges the buyer an upfront fee, known as option premium. This is also called as

(26)
option price (which should not be confused with the option’s exercise price mentioned a little earlier).
6.6 Options may be based on various kinds of
underlying assets, such as shares and share index, currencies, commodities, etc. In the present discussion, we shall throughout regard the underlying asset as shares.
6.7 For a buyer of call option, it is profitable to
exercise the option only if the market price of the share is higher than the exercise price. For example:
Call option exercise price = Rs. 10/-
Market of share price = Rs. 12/-
Exercising the option can immediately yield a profit of Rs. 2/- to the buyer of option. The call buyer can buy the share at the exercise price and then immediately sell in the market at higher price.
The buyer of call option will not exercise the option if the market price of the share is lower than the exercise price: For example, if the market price is Rs.8 and the exercise price is Rs. 10/-, it is not advantageous to exercise the option since he can buy the share at a lower price from the market.
Put option:
6.8 Under put option, the buyer of option has the right to sell a particular asset to the option writer at a specified price (i.e. exercise) by a specified date but he is not obliged to sell it. A put option buyer will exercise the option only if the exercise price is higher than the market price. For example:

(27)
Put option exercise price = Rs. 130/-
Market price of share = Rs. 140/-
Put option buyer will not exercise the option in this situation because by exercising the put option he would get only Rs. 130 from the option writer whereas he can sell the share in the market for Rs. 140/-.
Now, take the reverse case as follows:
Put option exercise price = Rs. 140
Market price of share = Rs. 130
In this situation, the put option buyer will exercise the option because by exercising the put option, he can get a price of Rs. 140 whereas by selling in the market, he would get only Rs. 130. In fact, in this situation, one may buy the share from the market at Rs. 130 and then sell the same for Rs. 140 to the option writer.
6.9 Note the main points as summarized below:
CALL OPTIONS PUT OPTIONS
Option buyer (option holder)
Buys the right (but has no obligation) to buy the underlying asset at the specified price, called exercise price.
Buys the right (but has no obligation) to sell underlying asset at the specified price, called exercise price.
Option seller (option writer)
Has the obligation to sell the underlying asset to the option holder at the exercise price.
Has the obligation to buy the underlying asset from the option holder at the exercise price.

(28)
6.10 The option right is valuable to the buyer because it limits his possible loss to the amount of premium paid by him while his potential gain is unlimited. On the other hand, the seller’s (i.e. option writer’s) potential loss is unlimited but his gain is limited to the premium received.
Detailed examples:
6.11 Table 6.1 presents a detailed example of the net gain/loss to option buyer and option seller in the case of call option. Table 6.2 similarly presents an example of put option. The attempt in these tables is to clarify when to exercise the option and when not to exercise it and how to determine the profit or loss of each party. In both the tables, the ruling price of ABC Company shares on the date of entering into the option contract is assumed to be Rs. 140.
Call option case:
6.12 We first look at the case of call option (Table 6.1). Mr. S (the option writer) sells to Mr. B a call option on the share with an exercise price of Rs. 150, contract maturity of 1 month, and option premium of Rs. 7.
6.13 The option holder is free to exercise the option on
any date before it expires. The net gain/loss to Mr. B (buyer) and S (the seller) will depend on the share price ruling on the exercise date of the option, as shown in Table 6.1. The computation of gain or loss is explained in the note below the table.
Put option case:
6.14 In the case of put option, the buyer’s possible loss is limited to the amount of option premium paid but the option writer’s possible loss could be very high. Table 6.2 shows how it is computed and on what factors it depends. Table 6.2 shows the gain or loss to each party in this case. An explanation is provided in the note below the table.

(29)
Table 6.1
Call option on shares (Exercise price = Rs. 150. Market Price on date of buying the option = Rs. 140.)
Explanatory note to Table 6.1
Call option will not be exercised at Sl. No. 1 and 2 because the market price is below or just equal to the exercise price. The option will be exercised only when the market price exceeds the exercise price of Rs. 150. The Remarks column provides the explanation. The option will be exercised when the market price is 153. This price exceeds the exercise price by Rs. 3 which can be set off against the call option premium of Rs. 7 paid. The net loss to option buyer is therefore Rs. 4. At market prices of Rs. 160 and Rs. 200, the call option buyer makes a profit.
Sl. No.
Market price onExercise Date
(Rs.)
Option Premium
(Rs.)
Net gain/loss to
buyer (Rs.)
Net gain/loss to seller
(Rs.)
Remarks
Col. 1 Col. 2 Col. 3 Col. 4 Col. 5 (1) 145 7 -7 +7 Right not
exercised (2) 150 7 -7 +7 Right not
exercised (3) 153 7 -4 +4 Right
exercised (4) 160 7 +3 -3 Right
exercised (5) 200 7 +43 -43 Right
exercised

(30)
Table 6.2
Example : Put option on shares (Exercise price = Rs. 130. Price on date of buying the option = Rs. 140.)
Sl. No.
Market price on Exercise
Date (Rs.)
Option Premium
(Rs.)
Net gain/ loss* to buyer of
option (Rs.)
Net gain/loss+
to seller of option
(Rs.)
Remarks
Col. 1 Col. 2 Col. 3 Col. 4 Col. 5 (1) 140 7 -7 +7 Right not
exercised(2) 130 7 -7 +7 Right not
exercised(3) 100 7 +23 -23 Right
exercised(4) 30 7 +93 -93 Right
exercised
Explanatory note to Table 6.2
In the case of put option the option buyer will exercise the option of selling the shares to the option writer only when the market price has fallen below the exercise price of Rs. 130. When the market price falls to Rs. 100, the buyer will exercise of put option at the exercise price of Rs. 130. He can sell the share to the option writer for Rs. 130 whereas the market price is only Rs. 100. His net gain is Rs. 23 after deducting the option premium. His net gain is 93 when the market price has fallen to Rs. 30 only.
* The buyer’s net gain/loss has to take into account the option premium paid by him to the option seller. + The option seller’s net gain or loss has to take into account the option premium received by him.
(31)
Option’s maturity or expiration date
6.15 The specified date by which the option right can be exercised by the option buyer is known as the expiration or maturity date. After the expiration date, the option right, if not already exercised, becomes worthless. Options may be European-style which can be exercised only on maturity date but not before. Or, they may be American-style which can be exercised at any time upto maturity date. (Whatever its origin, this terminology has nothing to do with geographic areas and both these types are found in many countries).
Call option buyer and seller:
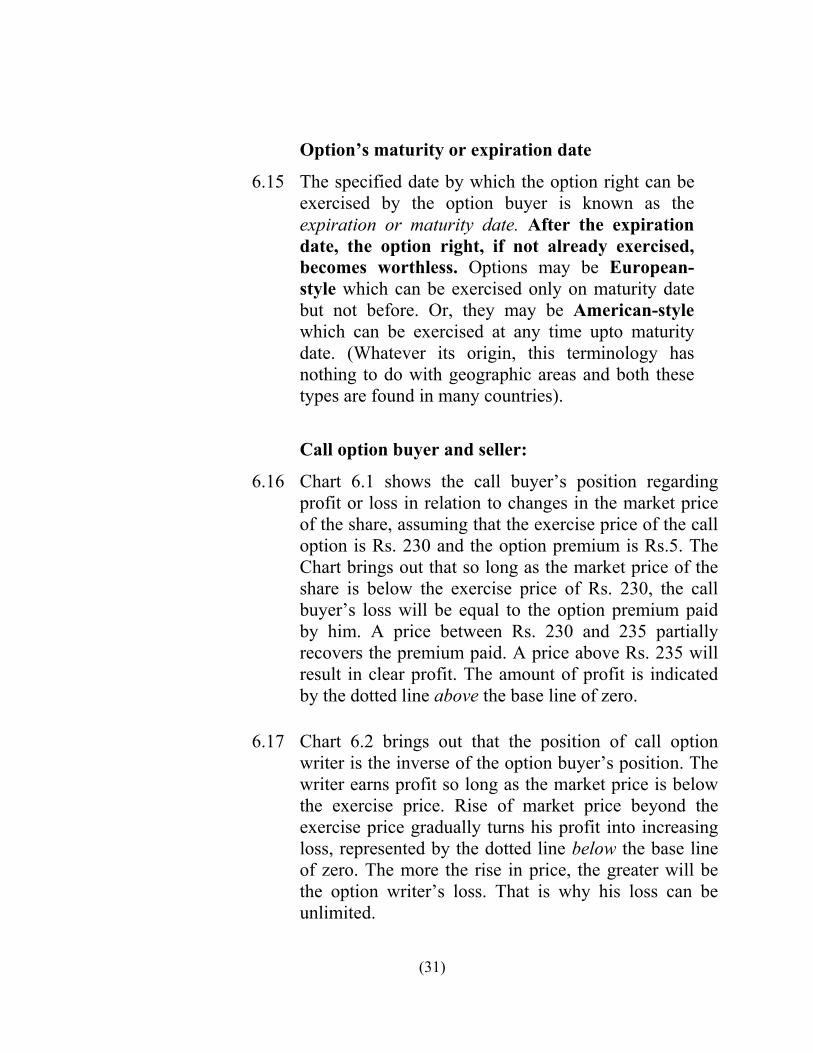
6.16 Chart 6.1 shows the call buyer’s position regarding profit or loss in relation to changes in the market price of the share, assuming that the exercise price of the call option is Rs. 230 and the option premium is Rs.5. The Chart brings out that so long as the market price of the share is below the exercise price of Rs. 230, the call buyer’s loss will be equal to the option premium paid by him. A price between Rs. 230 and 235 partially recovers the premium paid. A price above Rs. 235 will result in clear profit. The amount of profit is indicated by the dotted line above the base line of zero.
6.17 Chart 6.2 brings out that the position of call option
writer is the inverse of the option buyer’s position. The writer earns profit so long as the market price is below the exercise price. Rise of market price beyond the exercise price gradually turns his profit into increasing loss, represented by the dotted line below the base line of zero. The more the rise in price, the greater will be the option writer’s loss. That is why his loss can be unlimited.

(32)
Chart 6.1 Profit/Loss Position of Buyer of Call Option
-20
-15
-10
-5
0
5
10
15
20
200 205 210 215 220 225 230 235 240
Market price of share
Prof
it (+
) / L
oss
(-) Profit or loss on position
Exercise Price : Rs. 230Option Premium : Rs. 5
Chart 6.2Profit/Loss Position of Writer (Seller) of Call Option
-20
-15
-10
-5
0
5
10
15
20
200 205 210 215 220 225 230 235 240
Market price of share
Prof
it (+
) / L
oss
(-) Profit or loss on position
Exercise Price : Rs. 230Option Premium : Rs. 5

(33)
Put option buyer vs. seller: Profit position
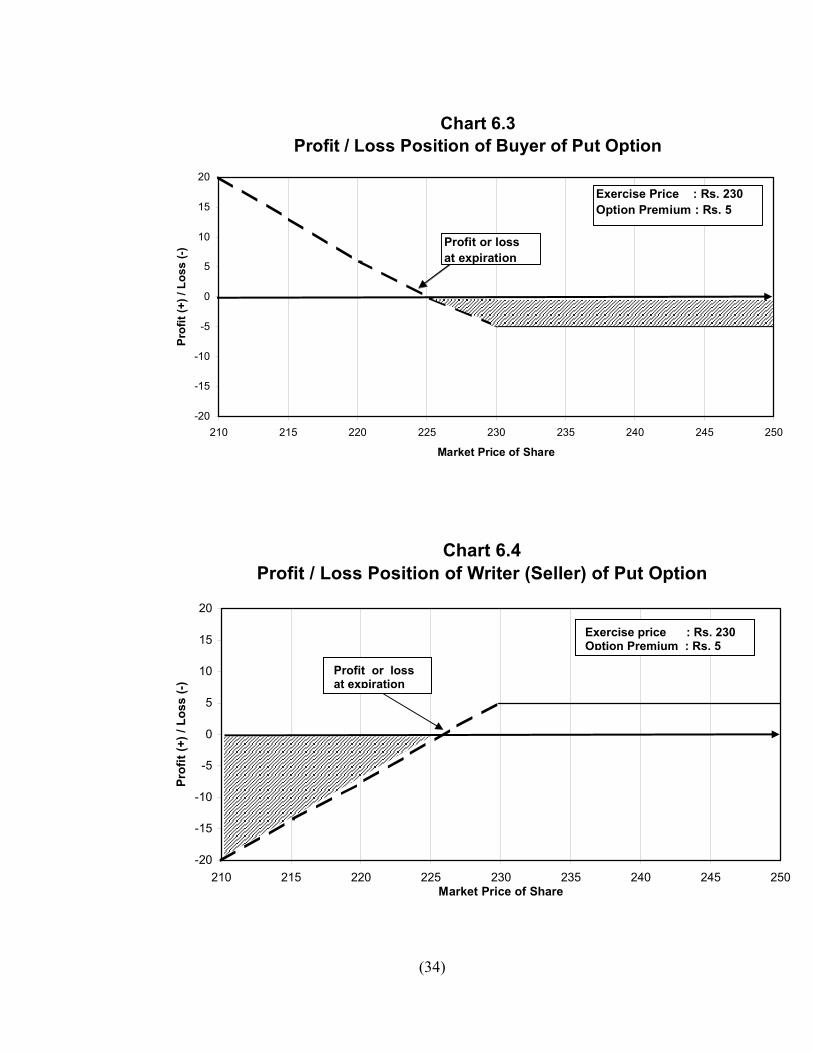
6.18 The profit or loss position of put option buyer is shown in Chart 6.3 and that of seller is shown in Chart 6.4, assuming that the exercise price is Rs. 230 and option premium is Rs.5.
6.19 The put option buyer will exercise the option of selling
to the option writer if the market price is lower than the exercise price. In this situation, he will get more money by exercising the option of selling the share to the option writer than by selling it in the market, thereby marking a profit (less the option premium paid by him). The more the decline in the market price the more will be the profit of the put option buyer, as the represented by the dotted line above the base-line of zero.
6.20 The put option writer’s position is the opposite of the
option buyer’s position. The writer earns a profit by way of option premium received when the market price is above the exercise price. This is because the option buyer will not exercise the option in this situation.
6.21 If the market price falls below the exercise price, the
option buyer will like to exercise the put option by selling the shares to the option writer. The resulting loss incurred by the option writer can more than wipe out the option premium charged by him, as shown in Chart 6.4.
(34)
Chart 6.3 Profit / Loss Position of Buyer of Put Option
-20
-15
-10
-5
0
5
10
15
20
210 215 220 225 230 235 240 245 250
Market Price of Share
Prof
it (+
) / L
oss
(-)Exercise Price : Rs. 230Option Premium : Rs. 5
Profit or loss at expiration
Chart 6.4 Profit / Loss Position of Writer (Seller) of Put Option
-20
-15
-10
-5
0
5
10
15
20
210 215 220 225 230 235 240 245 250Market Price of Share
Prof
it (+
) / L
oss
(-)
Profit or loss at expiration
Exercise price : Rs. 230Option Premium : Rs. 5

(35)
Special market terminology of the options market:
6.22 The following options terminology is commonly used to indicate profit or loss position of buyers of call and put options:
(a) In-the-money: This term looks at the current
market price of the asset concerned from the viewpoint of the option buyer. It means that (1) in the case of call option, the market price is more than the exercise price and (2) in case of put option, the market price is less than the exercise price. Thus, the general meaning of “in-the-money” is that the situation is profitable from the option buyer’s viewpoint if the option is exercised immediately.
(b) Out-of-the-money: This term is just the opposite of in-the-money. If means that the current market price of the asset is (1) less than the exercise price in the case of call option and (2) more than the strike price in case of put option. Thus, this term means that the prevailing market price is unprofitable from the option buyer’s viewpoint, whether it be a call option or a put option. The option buyer may, therefore, not exercise the option.
(c) At-the-money: This term indicates that the exercise price is equal to the current market price of the asset, be it call option or put option. This means that exercising the option will result neither in profit nor in loss.
Intrinsic value:
6.23 The value of the call or put option, if exercised by its holder immediately, is known as its intrinsic value. Such intrinsic value may be positive (i.e., profitable) or negative (i.e. unprofitable) from the viewpoint of the holder of the option. The gain or

(36)
loss is measured by comparing the strike price with the asset’s current market price.
6.24 If a stock is at the expiration and the stock price is
less than or equal to the exercise price, the call option will have no value. On the other hand, if the stock price is greater than the exercise price, the call option will have a value equal to the difference between the stock price and the exercise price.
6.25 A put option on a stock will have a positive value
only if the exercise price is higher than the market price. Such value will be equal to the amount by which the exercise price exceeds the market price.
Unpredictability of stock price movements:
6.26 Options trading is kind of bet on the future direction of prices of the underlying asset. Forecasting the market’s future direction over short periods is extremely difficult. For example, whether to buy a call option or a put option will itself depend on whether the buyer expects the price to rise or to decline within the contract’s tenure. This is the biggest question of all.
6.27 Options contracts differ from futures contracts in
fundamental respects. In the case of futures, both the buyer and the seller are obligated to buy/sell the underlying asset and the risk profile facing both the buyer and the seller is symmetric.
6.28 However, the characteristics of options are quite
different: First, the buyer of the call/put option has the right, but not the obligation, to buy/sell the underlying asset at a specified price. Second, the option buyer’s risk is limited to the option premium paid by him to the option writer while the possibility of profit is unlimited. As against this, the option writer’s profit is limited to the option premium received by him but his risk of loss is unlimited.

(37)
6.29 Theoretically, according to the Black-Scholes option
pricing model, the price of options depends on a complex set of factors, including the risk-free interest rate, the time remaining before expiration, the exercise price of the option, and the volatility of the underlying asset. Detailed discussion of the model is not intended here.
6.30 The maximum duration of stock and stock index
options contracts in India has been limited to 3 months so far. Such contracts are, therefore, presently used in India for the purpose of short-term investment strategies only.
Recent developments:
6.31 Sebi has recently decided to introduce long-term options contracts with tenures upto 3 years on Sensex and Nifty but not on individual stocks.
6.32 Long term options contracts expose the option
writer to a much higher degree of risk because the stock prices can move very widely over long periods. Such risk can be controlled by adopting a system of “covered options”, i.e., only those who already own the stocks involved are allowed to write/sell options on them.