education policy analysis archives - files.eric.ed.gov · schools operated by for-profit education...
TRANSCRIPT

Journal website: http://epaa.asu.edu/ojs/ Manuscript received: 6/12/2016 Facebook: /EPAAA Revisions received: 22/5/2017 Twitter: @epaa_aape Accepted: 30/11/2017
education policy analysis archives A peer-reviewed, independent, open access, multilingual journal
Arizona State University
Volume 25 Number 124 December 18, 2017 ISSN 1068-2341
Growth and Performance of Fully Online and Blended K-12 Public Schools
Charisse Gulosino
University of Memphis
&
Gary Miron
Western Michigan University United States
Citation: Gulosino, C. A., & Miron, G. (2017). Growth and performance of fully online and blended K-12 public schools. Education Policy Analysis Archives, 25(124). http://dx.doi.org/10.14507/epaa.25.2859 Abstract: This study provides a census of full-time virtual schools and blended schools from 35 states. Specifically, it utilizes data visualization and exploratory data analysis to examine student demographics and school performance measures of virtual schools and blended schools operating in the 2014-15 school year. The school achievement measures for both virtual and blended schools indicate these schools are performing poorly. Nevertheless, the evidence suggests that their enrollment growth continues. Large virtual schools operated by for-profit education management organizations (EMOs) dominate this sector and are increasing their market share. While more districts are opening their own virtual and blended schools, the schools are typically small, and with limited enrollment. The proportion of Black and Hispanic students in virtual schools is lower than the national average, while students enrolled in blended schools more closely resemble the race and ethnic characteristics of students enrolled in brick-and-mortar public schools nationwide. Virtual and blended schools, while serving students in kindergarten through grade 12, have

Education Policy Analysis Archives Vol. 25 No. 124 2
higher concentrations at the elementary and secondary levels. The empirical work in this area is in its infancy; hence, this study seeks to contribute to both the conceptual and empirical implications of virtual and blended schools by embracing a balance between thei r public and private benefits. Keywords: Virtual Schools; Blended Schools; Cyber Schools; Hybrid Schools; Online Learning; School Choice Crecimiento y rendimiento de escuelas públicas K-12 en línea y combinadas Resumen: Este estudio proporciona un censo de escuelas virtuales y escuelas combinadas de 35 estados. Específicamente, utiliza la visualización de datos y el análisis de datos exploratorios para examinar las características demográficas de los estudiantes y las medidas de rendimiento escolar de las escuelas virtuales y escuelas combinadas que funcionan en el año escolar 2014-15. Las medidas de rendimiento escolar para las escuelas virtuales y combinadas indican que estas escuelas tienen un rendimiento bajo. Sin embargo, la evidencia sugiere que el crecimiento de su inscripción continúa. Las grandes escuelas virtuales operadas por organizaciones de gestión educativa (EMO) con fines de lucro dominan este sector y están aumentando su cuota de mercado. Mientras más distritos están abriendo sus propias escuelas virtuales y combinadas, las escuelas son típicamente pequeñas y con una inscripción limitada. La proporción de estudiantes negros e hispanos en las escuelas virtuales es más baja que el promedio nacional, mientras que los estudiantes matriculados en escuelas combinadas se asemejan más a la raza y las características étnicas de los estudiantes matriculados en las escuelas públicas de ladrillo y mortero en todo el país. Las escuelas virtuales y mixtas, mientras prestan servicios a estudiantes de jardín de infantes hasta el grado 12, tienen concentraciones más altas en los niveles de primaria y secundaria. El trabajo empírico en esta área está en su infancia; por lo tanto, este estudio busca contribuir tanto a las implicaciones conceptuales como empíricas de las escuelas virtuales y combinadas, adoptando un equilibrio entre sus beneficios públicos y privados. Palabras clave: Escuelas virtuales; Escuelas combinadas; Cyber Schools; Escuelas híbridas; Aprender en línea; Elección de escuela Crescimento e desempenho das escolas públicas K-12 on-line e combinadas Resumo: Este estudo fornece um recenseamento de escolas virtuais e escolas combinadas em 35 estados. Especificamente, utiliza a visualização de dados e análise de dados exploratórios para examinar as características demográficas dos alunos e as medidas de desempenho escolar de escolas virtuais e escolas combinadas que funcionam no ano lectivo 2014-15. Medidas de desempenho escolar para escolas virtuais e combinadas indicam que essas escolas funcionam mal. No entanto, a evidência sugere que o crescimento de sua matrícula continua. As grandes escolas virtuais operadas por organizações de gestão educacional (EMO) para lucro dominam esse setor e estão aumentando sua participação no mercado. Enquanto mais distritos estão abrindo suas próprias escolas virtuais e combinadas, as escolas são geralmente pequenas e com inscrição limitada. A proporção de estudantes negros e hispânicos em escolas virtuais é menor do que a média nacional, enquanto os alunos matriculados em escolas combinadas são mais parecidos com a raça e características étnicas dos alunos matriculados em escolas públicas de tijolos e argamassa. todo o país. Escolas virtuais e misturadas, enquanto servem estudantes do jardim de infância até a 12ª série, têm concentrações mais altas nos níveis primário e secundário. O trabalho empírico nesta área está em sua infância; Portanto, este

Online and blended K-12 public schools 3
estudo procura contribuir tanto para as implicações conceituais e empíricas das escolas virtuais como combinadas, adotando um equilíbrio entre seus benefícios públicos e privados. Palavras-chave: Escolas virtuais; Escolas combinadas; Cyber Schools; Escolas híbridas; Aprenda online; Escolha da escola
Introduction
Over the past two decades, new communication technologies have provided exciting opportunities for schooling (Fairlie, 2005; Merchant et al., 2014; Picciano & Seaman, 2009). While higher education and business sectors took advantage of new technologies for delivering instruction and professional development to primary and secondary education, K-12 schools have only recently begun taking advantage of technological opportunities (Cavanaugh et al., 2004; Watson, 2007). Beginning in the mid-1990s, virtual and blended schools have become one of the school choice options available for American families (Saultz & Fusarelli, 2017).
In 2006, a policy brief by Gregg Vanourek (2006) published by the National Association of Charter School Authorizers helped lay out a framework for identifying and understanding the various dimensions and modalities of online learning. This framework illustrated a wide array of online options, ranging from delivery of individual courses, to full-time hybrid or blended learning (i.e., part of the instruction in a course is face-to-face, and part is delivered online), to full-time virtual schools (Greenway & Vanourek, 2006). It is important to note that this study tracks only full-time virtual and blended schools and not the multiple other forms of online instruction (LaBarbera, 2013). In this study, blended schools are schools in which all students experience the same blended instruction, with variations in how blended schools combine virtual and face-to-face activities (Jacob, 2011; Watson, 2008; Wicks, 2010). On the other hand, full-time virtual schools, also known as cyber or online schools, deliver all curriculum and instruction via the Internet and electronic communication. Students are usually at home and teachers are at a remote location, with everyone participating at different times (Ahn, 2011; Greenway & Vanourek, 2006; Marsh, Carr-Chellman & Sockman, 2009; Staker & Horn, 2012; Tucker, 2007). Full-time virtual and blended schools receive full funding for delivering what is supposed to be a full education experience, and so the characteristics and performance of these schools is especially important. Most virtual and blended schools are full-time, statewide, and asynchronous, with students learning from home and teachers working out of an office building or their home. While both types of schools offer the potential to radically restructure the way that teaching and learning happens, they also present challenges for researchers and policymakers who want to know who they serve and how well they work (Finn & Fairchild, 2012; Natale, 2011).
Although increasing numbers of parents and students are choosing this option, little is known about online schooling in general, and a weak existing research base on virtual and blended schools in particular (Clark, 2001; Vanourek, 2006). Much of the published literature involves a qualitative synthesis of anecdotal evidence from those involved in the K-12 online industry and not based on an explicit theoretical framework. While some of the available virtual school analyses focus on virtual schooling in general and others on virtual charter schools more specifically (Coates et al., 2004; Gill et al., 2015; Pazhouh et al., 2015), little is known about whether virtual and blended schools are serving the full range of the student population and whether they are doing so successfully. It is important to extend research on virtual and blended schools to examine whether

Education Policy Analysis Archives Vol. 25 No. 124 4
the assumptions of the ‘market’ perspective are empirically grounded, especially on the balance between private and public benefits of online schooling that has been given scant attention.
The purpose of this study is to describe the expansion of existing virtual and blended schools, identify which students these schools are serving, and how well the schools are performing. To help document the growth of virtual and blended schools, their student demographics as well as academic performance, this study contains detailed descriptions of full-time virtual and blended schools in operation during the 2014-15 school year in 35 states. Research questions this study seeks to answer include:
-How many full-time virtual and blended schools operate in the U.S.? How many students do they enroll? -What are the key characteristics of these schools and who operates them? -What are the demographic characteristics of students enrolled in virtual and blended schools? How do demographic data for students enrolled in virtual and blended schools differ from those enrolled in brick-and-mortar schools? -How do virtual and blended schools perform in terms of such school performance measures as state performance ratings and graduation rates?
The current evidence base on which to make public policy decisions about online schooling is limited—that is, so little is offered in terms of policy instruments or heuristic analytic tools for evaluating virtual and blended schools (Huerta & Gonzales, 2004; Huerta, Gonzales, & d’Entremont, 2006). The field of online schooling has remained largely atheoretical (Rice, 2006). In addition, there is no single repository to which researchers can access data on K-12 online schooling (Miron & Urschel, 2012; Molnar et al., 2013, 2014, 2015). The empirical work in this field is clearly in its infancy; hence, this study seeks to contribute to both the conceptual and empirical implications of virtual and blended schools and then to offer a balanced appraisal of their growth and performance from choice-based school reform. In our conceptual framework, we argue that the challenge now facing this sector is embracing the balance between public and private benefits. Following the school choice literature, we assume that parents making informed decisions from a spectrum of publicly-funded choice options will choose those that provide the private benefits of education they desire (i.e., brick-and-mortar vs. online schools). But, depending upon how virtual or blended schools are provided or expanded, the public benefits may be affected (i.e., academic performance). We also argue that that the challenge is made tougher by the fact that the data are still coming in. While the results reported here cannot directly speak to causality, our analysis represents an improvement over single-state case studies (Baker et al., 2005; Beese & Martin, 2016; Colorado & Eberle, 2010; Mosier, 2010; Russo, 2005). To our knowledge, we provide the first exploratory multi-state study involving the demographics, growth and performance indicators of virtual and blended-learning schools.
The organization of the study follows a sequence of logical and interrelated steps. First, we describe the virtual schooling structures and offer a conceptual framework to understand its operation. Special attention is devoted to the concepts of private and public benefits of online schooling. Second, we analyze which students enroll in virtual and blended schools and how these schools perform on state tests and high school graduation rates. In our analysis, we provide descriptive evidence on the students who enroll to virtual and blended schools compared to their national averages. We describe students on the basis of race/ethnicity, percentage of students

Online and blended K-12 public schools 5
receiving free or reduced price lunch (FRL), enrollment broken down by grade levels, student-teacher ratios, and their distribution across district and charter school sectors as well as by operator status. We also examine measured performance of both virtual and blended-learning schools for which data are available for the 2014-15 academic year. Because measured performance does not include apples-to-apples comparisons, the results are exploratory, descriptive analyses rather than correlational or causal analyses. Finally, we highlight the relevance of several aspects of the descriptive results and discuss policy implications that are sensitive to the perceived public and private benefits derived from virtual and blended schools.
Literature Review
A Typology of Online Schooling: Virtual and Blended Schools
To provide a basis for interpreting the descriptive findings in this paper, it is useful to consider a schematic model of online schooling options. There is an array of education services delivered online. On one end of the continuum, individual courses are delivered to students who are otherwise enrolled in brick and mortar schools. The middle terrain includes a wide array of full-time blended programs and schools serving students with a combination of face-to-face and online activities throughout the school day. On the other end of the continuum, full-time virtual schools provide all instruction online. The description below provides a focused roadmap for understanding these configurations with respect to virtual and blended schools. To date, there has been little research that has focused on the issues that these online schools are facing.
Students served. Among the private benefits of virtual and blended schools is the ability to serve a wide range of students, such as students with disabilities, limited English proficient (LEP) students or English language learners (ELL), gifted and talented students, and non-traditional students who have been historically under-served by traditional school environments (i.e., different learning styles and needs; risk factors; Spitler, Repetto, & Cavanaugh, 2013). In this study, we consider the extent to which virtual and blended schools serve low-income students as well as the extent to which they are more likely to serve minority students who are on average more likely to be socially disadvantaged than their white counterparts.
Although researchers have not reached consensus about the student populations at virtual and blended schools, recent studies have begun to explore national and state trends of demographic characteristics of students enrolled in these schools. For example, survey results from an unpublished study of virtual schooling in Georgia reveals that a majority of families using full-time virtual schooling options in high school are predominantly white, well educated, and affluent (Black, 2009). Full time virtual schooling may not be an option for families that work outside the home with limited disposable time. On the other hand, this trend does not hold for blended schools in all states. Our findings suggest that students enrolled in blended schools closely resemble the race and ethnic characteristics of students enrolled in brick-and-mortar public schools nationwide. The mixed findings suggest the heterogeneity of the student population in virtual and blended schools.
As virtual and blended school parents make choices, it is important to consider the impact of those choices on brick-and-mortar public schools and students. Two scenarios at both ends of the spectrum are possible. At one end of the spectrum, online schooling could pose a serious financial threat by diverting essential resources from already under-resourced brick-and-mortar public schools. Education in a democratic society has placed a high premium on a common schooling experience, traditional education, place-based instruction and daily peer interaction from broad and diverse backgrounds (Gutmann, 1987). At the other end of the spectrum, the logic of school choice

Education Policy Analysis Archives Vol. 25 No. 124 6
claims that virtual and blended schools will not balkanize public education, but provide new education pathways for serving different types of students with many different needs. Limited studies suggest that virtual and blended schools may enroll higher percentages of students being at risk of academic failure (Beck, Egalite, & Moranto, 2014). The accommodation of different learning styles and flexible access to curriculum and instruction serve to expand the range of available options to non-traditional students and provide access to segments of the education market that have been underserved in the past. On the other hand, the biggest challenge is how to manage the influx of online learning opportunities to ensure that students (regardless of race/ethnicity, gender, age, social class, language origin, and handicapping condition) get their full benefit and not end up lost in cyberspace. Challengers argue that public funding of online schooling will create greater inequities for students with greater needs (Bernstein, 2013). Critics also claim that ‘creaming’ (selection mechanism) of online students may occur through targeted recruitment (DeJarnatt, 2013).
Grades served. Our typology of virtual and blended schools explores service provision across grade levels. Although brick-and-mortar public schools are required to serve students at all grade levels, private EMOs running virtual and blended schools are not, and certain grade levels are preferred over others. In the school choice literature, the most common grade configuration has been K-8 or K-12 schools, with middle and junior high schools considered as unpopular in the private sector (Jacob & Rockoff, 2012). This comes as no surprise, since students undergo a difficult transition from childhood to adolescence at precisely the time when they may need increased attention to be successful in academics and social behavior. EMOs running virtual and blended schools may continue to eschew serving middle school grades for this reason, finding it less cost-effective to educate middle schoolers with backgrounds and learning styles with which they are unfamiliar.
In most countries, K-12 virtual and blended learning is focused on secondary education (Waters, Barbour, & Menchaca, 2014). In the United States, the stable and steady growth pattern in K-12 online learning has its origins from distance education, reflecting the history of the nation’s higher education in general. Our findings are consistent with previous research showing that virtual and blended schools serve students in kindergarten through grade 12, with higher concentrations at both the elementary and secondary levels (Watson et al., 2012).
Provider/operator status (for-profit/nonprofit and district/charter). Many virtual and blended school operators (for-profit vs. nonprofit EMOs; districts vs. charter schools) see opportunities in this burgeoning market and are pushing states and districts to expand public school choice online. Although the landscape of online schooling continues to develop, our typology lines up consistently with past examinations of the for-profit virtual school industry, particularly as a growing part of the charter school sector (Glass, 2009; Glass & Welner, 2011; Natale & Cook, 2012; Waters, 2011). Virtual charter schools, as opposed to their virtual district counterparts, differ because most allow open enrollment across district lines and operate on a performance-based contract for a fixed term with a charter authority. Moreover, the rise in other types of online schools—blended/hybrid schools that fall in the middle of the continuum—may open up multiple pathways of learning under the aegis of the local school districts or charter schools (Lafer, 2014; Watson, 2008). In this typology, we consider the variation in the organization of virtual and blended schools, thus enabling a comparison in the types of students educated in these schools, including teacher-student ratios, enrollment size, graduation rates and performance ratings.
Following economists’ logic on market competition (Friedman, 1962; Moe & Chubb, 2009), a combination of choice and competitive incentives created by an educational online marketplace is predicted to break the ‘education monopoly’ of brick-and-mortar public schools. The unique

Online and blended K-12 public schools 7
flexibility inherent in online schools creates an ideal opportunity for for-profit and nonprofit EMOs to broaden their market share. Virtual and blended schools represent a disruption of the educational status quo, because they compete with their brick-and-mortar counterparts using low-cost business models— absence of brick and mortar facilities, limited number of teachers and other services essential to traditional school settings (Ball, Thrupp, & Forsey, 2010). Virtual and blended schools are also exempt from many rules that generally govern traditional brick-and-mortar schools, allowing for students learning from home and teachers working out of a school site or home office (Greenway & Vanourek, 2006). The assumption is that as school choice undercuts bureaucratic political control of public education, it provides operators of virtual and blended schools the opportunity and motivation to experiment with new organizational and instructional strategies. However, whereas the government is the primary driver of K-12 online and blended learning in the international arena (Barbour, 2009), in the United States the expansive growth of the EMO sector in K-12 online learning seems to align with Milton Friedman's idea of ‘consumers’ exercising utility preferences in the private markets. In this study, our overall findings show that more than half of students who attend virtual and blended schools are operated by private, for-profit EMOs. The surge in virtual charter school and blended school growth is occurring against the backdrop of a larger movement toward the privatization of education services.
Achievement. An ongoing question concerning virtual and blended schools is whether students in these environments achieve academically as well as their traditional school counterparts. This implies that government must regulate virtual and blended schools to assure that they meet at least the minimum requirements for satisfying the public interest. Following Milton Friedman (1965), somehow the state must assure that at least a minimum set of public outputs are produced for accountability purposes. However, simple comparisons of student achievement at virtual, blended and brick-and-mortar schools may be biased because students do not choose to attend these schools randomly. It is not possible to know how virtual and blended students would have achieved if they had attended brick-and-mortar schools. The primary challenge in estimating the effects of virtual and blended schools on academic achievement arises because their students are self-selected, and thus are likely to differ in unobserved ways from otherwise similar students who choose to remain in traditional brick-and-mortar public schools. As a result, simply comparing either the test score levels or gains of virtual and blended students to those of traditional brick-and-mortar public school students is likely to provide biased estimates of the achievement effects.
There remains a paucity of research focused on the effectiveness of online learning for K–12 students. A U.S. Department of Education meta-analysis of experimental results published between 1996 and 2008 is often cited by proponents of online schooling because the authors concluded that courses that combined face-to-face instruction with online education is modestly superior to traditional education in terms of student outcomes (Means, Toyama, Murphy, Bakia, & Jones, 2009). Other meta-analysis studies on student performance found no significant difference in achievement or marginal positive size effects in online student performance compared to their brick-and-mortar counterparts (Bernard et al., 2009; Cavanaugh, 2001; Cavanaugh et al., 2004; Tamim et al., 2011 ). However, an important caveat of these K-12 online studies is that the findings are focused solely on blended online instruction with in-person contact and concentrated in higher education rather than elementary or secondary schooling, and thus does not fully represent results related to full time online schools for K-12 students. More recently, the highly respected Center for Research on Education Outcomes (CREDO), published the first nationwide data and analysis of virtual charter schools as well as their impact on students’ academic growth in 17 states and Washington, D.C. (Woodworth et al., 2015). Overall, virtual charter schools show dismal performance. The most
Education Policy Analysis Archives Vol. 25 No. 124 8
obvious limitation of the study is its sole focus on full-time virtual charter schools. The analysis does not include students who have taken virtual courses in blended schools.
For a rapidly growing field as virtual and blended schools (Molnar et al., 2013, 2014, 2015), the body of research of their impact on academic performance remains largely unexplored. Accountability is a critical component if virtual and blended schools are going to flourish. Like school choice policies, virtual and blended schooling detractors believe that the assumptions that make competition effective will not be present in the education online marketplace and that the public and private benefits of investing in publicly-funded online education are expected to have no impact on schools’ measured progress. Our descriptive results, using data visualization and exploratory data analysis, provide evidence that students are learning significantly less on average in math and reading achievement in a full-time online environment than the national average for all public schools.
As shown above, this study adds a conceptual dimension to an otherwise descriptive analysis of the growth and performance of virtual and blended schools. Most of the debate over school choice options has been embedded in the concept of striking a balance between public and private benefits (Belfield & Levin, 2015, 2005; Levin & Belfield, 2003). Along with the benefits, there are number of factors that may influence the value judgments about online schooling, such as student characteristics or demographic profiles, growth and prevalence of the EMO sector and academic results. In the succeeding section, we argue that if virtual and blended schools are expanded, it is necessary to consider the consequences for both the private and the benefits and how these can be balanced.
Public and private benefits of virtual and blended schools. Much like the school choice literature (Levin, 1987, 1998, 2003; Levin & Belfield, 2001), there is a fundamental tension between private and public benefits of virtual and blended schooling. The private good aspect of online schooling suggests a large component of family school choice. It is expected that parents would like to have great choice in schooling arrangements—to opt out of brick-and-mortar schools in favor of online schools they believe would max imize their child’s development and acquisition of skills, values, and learning experiences that capture the valued private benefits of schooling (Liu et al., 2010; Russell 2004 ). The concomitant public good aspect refers to common standards of experiences and outcomes for all schools. These public benefits of online schooling such as the impact on academic performance for different types of students are the basis for public funding (Carr-Chellman & Marsh, 2009).
As our study points out, virtual and blended schools continue to grow at a rapid pace despite lackluster academic outcomes and little knowledge about their internal workings. There are several possible reasons for this. First, prior research on parent surveys and interviews reveal that parents who are enrolling their children in virtual schools are primarily attracted to the cache of online learning. For some parents, it does not matter if these schools increase the achievement levels of their children. A study authored by Paul Kim, Flora Kim and Karimi (2012) claims that “students/parents who consider online schools do not necessarily understand what may be actually required in online learning, and many often choose online learning because of the notion of flexibility in time, space, or pace over the traditional brick-and-mortar schools.” The lure of virtual and blended schools is particularly powerful for parents who seek the freedom of home-schooling with some of the benefits of a public school. The private benefits of online education can be maximized if parents choose virtual and blended schools that fully meet their educational aspirations for their children.
Schooling arrangements such as virtual and blended schools can be viewed as an increase in the production of private educational outputs, those that respond to the private tastes of households

Online and blended K-12 public schools 9
for online educational services. It is generally considered a basic parental right to control the types of experiences that will influence the upbringing of their children. Even those parents who accept the overall public benefits of brick-and-mortar schools may be at odds with specific goals, needs and activities that are incompatible with their private educational preferences (i.e., the characteristics of their local schools, commute time, behavior reasons or special needs of their children; Lacireno-Paquet & Brantley, 2008). Nonetheless, it is difficult to capture parental preferences or child-specific factors, like their the demand for specialized services, that affect how similar parents view online schooling options (Borup, Graham, & Davies, 2013; Boulton, 2008; Litke, 1998).
Second, the continued popularity of virtual and blended schools is surprisingly consistent with the school choice literature (Bast & Walberg, 2004; Kleitz et al., 2000; Schneider et al., 1998; Weiher & Tedin, 2002). Like any maximizer of school choice, the demand for virtual and blended schools depends on parental preferences and values about education. Advocates argue that providing families with greater choice of schools with greater flexibility of operation will create better matches between educational needs and school services while at the same time promoting healthy competition for the enrollment (and per pupil funding) of students. These advocates argue that parents choose virtual or blended schools for reasons that maximize their children’s well-being, or “utility,” considering the costs, benefits, and probabilities of success. Such a consumer-based accountability system places heavy emphasis on parental satisfaction (Schneider & Buckley, 2002).
The concept of consumer-driven school choice parallels the logic of market theory, which claims that market style mechanisms of consumer choice and competition among virtual and blended schools or online education providers will yield innovation, competition, and eventual achievement effects (Chubb & Moe, 1990; Henig, 1994; Teske & Schneider, 2001; Witte, 2000; Zimmer & Buddin, 2007, 2009). This is a common line of reasoning used by advocates of market reform, yet there have been few direct tests of this assertion in virtual school environments (Woodworth et al, 2015; Zimmer & Buddin, 2006). Unlike parents with children in brick-and mortar school settings, parents leaning toward online classes may value other aspects of virtual and blended schools more highly than school performance on standardized tests, such as pedagogical preferences, more flexible instructional time, more discipline, more specialized educational programs and other personal interests/needs (Lauen, 2007; Schneider & Buckley, 2002). Regardless of the reasons and criteria that different types of parents use when choosing virtual and blended schools there is an assumption among advocates of school choice that parents who choose their schools will be satisfied with them.
Finally, with heterogeneous preferences across households, virtual or blended schools will seek to differentiate their offerings from other schools, thereby creating a niche in their local education market to attract students. According to education economists (Levin, 1991, 1992, 1998), schools maximize their objective functions by choosing an input mix and an effort level. Following this literature, various combinations of inputs and effort will naturally attract different groups of applicants in online schooling. That is, virtual and blended schools will compete by matching their appeal to educational preferences of parents as district-operated schools or charter schools operated by for-profit and nonprofit education management organizations (EMOs). The market orientation of virtual and blended schools is based on a business orientation to education where efficiency gains are seen in the private management of online education options. Viewed in terms of allocative and productive efficiency (Levin, 1997, 2002; Belfield & Levin, 2002), virtual and blended schools are driven by incentives to improve their own performance when faced with competition for online students. Because state school funding is tied to student enrollment, the drive to grow enrollment is expected to give them greater incentive to cultivate parental satisfaction by operating more efficiently and improving the outcomes valued by online students and parents.

Education Policy Analysis Archives Vol. 25 No. 124 10
Alternatively, virtual and blended schools may have unintended negative effects on
traditional, brick-and-mortar public schools and students: they may draw those parents with resources and social capital out of the public school system and add stress to public school budgets (Ellis, 2008; Torre, 2013); highly motivated students may thrive while those who have struggled academically in brick-and-mortar settings may continue to struggle online (Waters & Leong, 2014); and public schools may reduce the effort they put into educating vulnerable student populations and steering them into the largely untested waters of online schooling. Increased scale and public dollars from per pupil allocation may also allow virtual and blended schools to filter money toward activities not sustainable or uncommon in traditional public schools (i.e., marketing and recruiting of students) (Shapiro, 2013).
Data and Methods
Data Sources, Selection Criteria and Aggregation Calculations
The findings presented in this study are based on publicly available data, collected, audited, and warehoused by public authorities. Data from the National Center for Education Statistics are particularly helpful in gathering key data on enrollment, student demographics and staffing. Data from state education agencies and from individual school web sites is also used to provide data not available from NCES.
The scope of this study is limited to full-time, public elementary and secondary virtual and blended schools in the U.S. These include virtual and blended schools operated by for-profit and nonprofit Education Management Organizations (EMOs) as well as virtual schools operated by states or districts. To be included in this study and considered in our analyses, a virtual school or blended learning school must meet our selection criteria. Firstly, it must be classified as a school and not a program. For example, it must be classified as a functioning school and not just a collection of individual optional courses. Online courses offered by school districts or schools to cut costs or attract students from other schools/districts/states, are therefore not included. Private virtual or blended schools (funded in whole or in part by charging tuition and fees, rather than relying on a public funding program using tax dollars) are excluded. Also excluded are schools offering a combination of programs including traditional face-to-face programs as well as virtual or blended options, unless it is possible to separate data for the full-time virtual or blended school components. Additionally, when separating programs from schools, we look for the existence of unique NCES or State Education Agency ID codes that are designated for school units. To be included in our study, these virtual and blended schools should have evidence of at least 25 students enrolled during one of the last few years. These criteria helped identify and exclude smaller district programs and schools not intended to be full-time, but simply to offer some virtual learning experience for a subset of students. Such restrictions allow for more confidence in attributing demographic profiles and measured outcomes to specific types of online schools. The primary sources for total enrollment and school performance data are the Common Core of Data from NCES, state-level datasets, and school report cards for the 2014-15 school year. Data for grade level enrollment, race-ethnicity and gender are obtained from NCES and represent the 2013-14 school year, the most recent data available.
Aggregated data reflect weighted averages based on enrollment. That is, averages have been calculated so that the influence of any given school on the aggregated average is proportional to its enrollment. Comparisons are made to norms for all public schools in the United States. An important part of our analyses examines school performance; by including only full-time virtual schools and blended schools, we are better able to attribute school performance outcomes to these

Online and blended K-12 public schools 11
online schools. This study calculated mean scale scores and achievement levels based on subject area results in Partnership for Assessment of Readiness for College and Careers (PARCC) and the Smarter Balanced Assessment Consortium (SBAC) to determine whether virtual and blended schools were meeting or exceeding proficiency benchmarks compared with state averages. Data visualization and exploratory data analysis are used throughout the study.
Results
Growth and Current Scope of Full-Time Virtual and Blended Schools
Although virtual and blended schools still account for a relatively small portion of the overall school choice options in the US, they constitute some of the fastest-growing options, overlapping with both homeschooling and charter schools. Appendix A contains charts that depict trends over time in enrollment in virtual and blended schools and students. During the 2014-15 school year, 33 states had full-time virtual schools—many of them charters. Sixteen states had blended schools, while only two states (New Jersey and Rhode Island) had full-time blended but not full-time virtual schools. Beyond the 35 states with either virtual or blended schools, we recognize that other states also offer virtual education options, but in several other formats including, for example, the offering of individual online classes for some students or supplemental coursework facilitated online.
Figure 1 illustrates the estimated enrollment growth in full-time virtual schools over the last 13 years. The International Association for K-12 Online Learning (iNACOL) typically reports a much higher estimate than NEPC reports each year; however, those reports offer insufficient detail on their selection criteria and do not list specific schools on which they base enrollment calculations. Figure 1 also illustrates the proportion of students in full-time virtual schools operated by the two largest for-profit EMOs, K12 Inc. and Connections Academy: K12 Inc. schools account for 34.4% of all enrollments while Connections Academy schools account for 23%. Although K12 Inc.’s share of enrollments decreased in 2014-15, Connections Academy’s share increased from 17% to 23%. Together, these two companies enrolled 57.4% of all full-time virtual school students in 2014-15, an increase from their combined share of 53% in 2013-14 that continues a pattern of gradual growth in recent years.
Figure 1. Estimated Enrollment Trends in Full-Time Virtual Schools

Education Policy Analysis Archives Vol. 25 No. 124 12
Figure 2. Estimated Enrollment Trends in Full-Time Blended/Hybrid Schools
As Figure 2 shows, enrollments in blended schools have also been growing steadily. Three
prominent education management organizations dominate this sector. Rocketship Education accounts for 22.3% of enrollment, K12 Inc. for 10.9%, and Nexus Academy for 3.9%.
While new district-operated schools added significantly to the pool of full-time virtual schools, they tend to be very small (see Table 1). Virtual charters are much larger, accounting for 48.5% of all virtual schools and for 82.6% of enrollments. Within the virtual school sector, for-profit EMOs play a prominent role: they operate 40.8 percent of all virtual schools, which together enroll 72.6% of the student population (see Table 2). In 2013-14, for-profit EMOs managed 160 charter and district schools; in 2014-15, that number grew to 186. As noted earlier, K12 Inc. is by far the largest EMO in this sector; in 2014-15, it operated 117 full-time virtual schools that enrolled just under 90,000 students. However, K12 Inc. enrollments decreased by approximately 3,500 students between 2013-14 and 2014-15, and because of more recent closures, K12’s enrollments are likely to remain below their peak for the next few years.
Connections Academy LLC1, the second largest for-profit operator, operated 32 such schools with just under 60,000 students, an increase of more than 7,000 students between 2013-14 and 2014-15. It is important to note that the data on these private operators under-represents the role of for-profit EMOs. While this study profiles only virtual schools that EMOs are entirely responsible for, many district-operated virtual schools subcontract to K12, Inc. and Connections Academy, LLC to provide online curriculum, learning platforms, and other support services. In contrast to for-profit EMOs, their non-profit counterparts operated only 16 schools, enrolling 4,582 students. Generally, charter virtual schools are much more likely to be operated by an EMO.
1 On Sept. 15, 2011, Pearson bought Connections Academy in the name for different entities within the main division - Connections Education. Connections Learning is the new entity that provides curriculum to schools and districts. For the purpose of brevity, Connections Education, Connections Academy and Connections Learning are used interchangeably.

Online and blended K-12 public schools 13
Table 1 Distribution of Virtual Schools and Students Across District and Charter Sectors, 2014-15
Schools Percent of all Schools
Students Percent of all Enrollment
Average Enrollment Per School
District
234 51.5% 45,509 17.4% 194
Charter
220 48.5% 215,940 82.6% 982
Total for all Virtual Schools
454 100.0% 261,449 100% 577
Source: United States Department of Education, National Center for Education Statistics, Common Core of Data (CCD), State Nonfiscal Public Elementary/Secondary Education Survey, 2011-12 v.1a. accessed Dec 1, 2014.
There were 220 virtual charter schools and 234 virtual district schools operating full-time in
2014-15. Although the number of district-operated virtual schools increased more than virtual charters, charters continued to have much larger enrollments. The average enrollment in charters was 982 students per school compared with an average of 194 students in district schools. A possible explanation for this is that district schools are created to serve smaller targeted populations. Another possible explanation is that district virtual schools are seldom operated by for-profit companies motivated to create larger schools to ensure larger profit margins.
All EMOs combined operated 45% of full-time virtual schools and accounted for 73% of enrollment. These full-time virtual schools operate largely as for-profit entities—an average of 1,027 students per school (Table 2). In contrast, the average enrollment in the schools operated by non-profit EMOs was considerably smaller, with an average of 286 students per school. Independent virtual schools (those public virtual schools with no private EMO involvement) had the smallest average school size, 266 students per school.
Table 2 Distribution of Virtual Schools and Students by Operator Status 2014-15
Schools Percent of all Schools
Students Percent of all Enrollment
Average Enrollment Per School
Independent
252 55.6% 66,954 25.6% 266
Nonprofit EMO
16 3.5% 4,582 1.8% 286
For-profit EMO
186 40.8% 189,913 72.6% 1,027
K12 Inc.
117 25.8% 89,546 34.2% 1,063
Connections Academy
32 7.1% 59,722 22.8% 1,850
Total for All Virtual Schools
454
100%
261,449
100%
577
Source: United States Department of Education, National Center for Education Statistics, Common Core of Data (CCD), State Nonfiscal Public Elementary/Secondary Education Survey, 2011-12 v.1a. accessed Dec 1, 2014.

Education Policy Analysis Archives Vol. 25 No. 124 14
A number of other for-profit EMOs have emerged to operate full-time virtual schools, including Mosaica Education Inc. (8 schools), Insight Schools (6 schools) Edison Schools (4 schools), Calvert Education Services (3 schools), Cyber Education Center (3 schools), and White Hat Management (3 schools). The largest nonprofit EMOs are Learning Matters Educational Group (6 schools), Advanced Academics (4 schools), and Roads Education Organization (3 schools). More expansion is coming from some for-profit EMOs that formerly operated only brick and mortar schools. These include Edison Schools Inc., Mosaica Inc., and White Hat Management.
Reflecting similar trends, most blended learning schools are independent district-operated schools—but they have small enrollments than those in blended schools managed by private EMOs (see Tables 3 and 4). For example, while K12 Inc. only had three full-time blended schools in 2014-15, those schools enrolled 2,843 students. K12 Inc. blended schools are clearly much larger in enrollments than those run by other operators, such as Nexus Academies (a Pearson company similar to Connections Academy). However, the largest operator of full-time blended schools is Rocketship Education, a private nonprofit EMO based in California that recently expanded to Tennessee and Wisconsin. In 2014-15 Rocketship operated 11 schools enrolling 5,841 students. Enrollments in the charter blended schools are substantially larger (408 students per school) as compared to the district schools (191 students per school) (see Table 3).
Table 3 Distribution of Blended Schools and Students Across District and Charter Sectors, 2013-14
Schools Percent of all Schools
Students Percent of all Enrollment
Average Enrollment Per School
District
41 47.7% 7,812 29.9% 191
Charter
45 52.3% 18,343 70.1% 408
Total for all Hybrid Schools
86 100.0% 26,155 100% 304
Source: United States Department of Education, National Center for Education Statistics, Common Core of Data (CCD), State Nonfiscal Public Elementary/Secondary Education Survey, 2011-12 v.1a. accessed Dec 1, 2014. Table 4 Distribution of Blended Schools and Students by Operator Status 2014-15
Schools Percent of all Schools
Students Percent of all Enrollment
Average Enrollment Per School
Independent
54 62.8% 14,223 54.4% 263
Nonprofit EMO
18 20.9% 7,393 28.3% 411
For-profit EMO
14 16.3% 4,539 17.4% 324
Total for All Hybrid Schools
86
100%
26,155
100%
304
Source: United States Department of Education, National Center for Education Statistics, Common Core of Data (CCD), State Nonfiscal Public Elementary/Secondary Education Survey, 2011-12 v.1a. accessed Dec 1, 2014.

Online and blended K-12 public schools 15
Student Characteristics
The following analysis of student demographics provides context for school performance data comparisons discussed later in this study.
Race-Ethnicity. The proportion of minority students in virtual schools has slowly increased
a few percentage points over the past few years. Nevertheless, aggregate data from full-time virtual schools still differs substantively from national averages in terms of student ethnicity. Just over 65% of the students in virtual schools were White-Non-Hispanic, compared with the national mean of 49.8% (see Figure 3). Not surprisingly, then, the proportion of Black and Hispanic students in virtual schools was noticeably lower than the national average. Only 12.8% of students in virtual schools were Black while the national average was 25.5%; only 10.5% of students in virtual schools were Hispanic while the national average was 15.5%.2 The fact that minority and low-income families may have less access to technology may help to explain underrepresentation of these groups, even though most virtual schools loan their students computers and often pay for internet access. There are other possible explanations for the overrepresentation of white students in these schools that appear to be consistent with the growth of white homeschooling, explained in part by a desire to evade racial integration in schools (Ahn & McEachin, 2017; Mazama & Musumunu, 2014).3 These parallels call for further research.
Figure 3. Race/Ethnicity of Students in Virtual Schools Compared with National Averages, 2013-14
Figure 4 displays the demographic composition of students enrolled in blended schools.
The population of students in blended schools more closely matches enrollments in public schools. One noteworthy difference is that the enrollments of Hispanic students in blended schools are
2 Comparison with demographic composition of charter schools in the nation is also relevant since the virtual schools that enroll most students are charter virtual schools. Thirty-six percent of all charter school students are White, 29.2% are Black, 27.2% are Hispanic, 3.5% are Asian, and 3.2% are classified as “Other.” 3 A recent study by Ahn and McEachin (2017) shows that homeschooled students are also more likely to be White than the general population nationally.

Education Policy Analysis Archives Vol. 25 No. 124 16
substantially higher than in public schools. This finding may be explained by the fact that blended learning schools are concentrated in California and Colorado—states with large concentrations of Hispanic students. As blended schools expand in other states, it is likely that their enrollments will become more like those of full-time virtual schools.
Figure 4. Race/Ethnicity of Students in Blended Schools Compared with National Averages, 2013-14
Data available from state sources for 2014-15 was less complete than the 2013-14 data
collected from the National Center for Education Statistics (NCES); still, the pattern of distribution of students by race/ethnicity was largely unchanged except for a very small increase in minority students.
Table 5 breaks out race/ethnicity data by school type and operator status. Nonprofit EMO virtual schools had some distinct differences, although their very small share of enrollment makes drawing inferences difficult. Similarly, the differences in student ethnicity between district and charter schools and those between for-profit or independent virtual schools are also very small. Table 5 Student’s Race Ethnicity, 2013-14
Native American
Asian Hispanic Black White Pacific Islander
Multi-racial
Independent
0.9% 1.5% 12.3% 9.9% 71.2% 0.3% 3.7%
Nonprofit EMO
1.1% 3.0% 20.5% 3.8% 66.6% 0.1% 4.8%
For-profit EMO
0.9% 1.9% 9.5% 14.2% 69.6% 0.4% 3.3%

Online and blended K-12 public schools 17
Table 5 cont. Student’s Race Ethnicity, 2013-14
Native American
Asian Hispanic Black White Pacific Islander
Multi-racial
K12 Inc.
1.0% 2.5% 8.2% 16.6% 69.4% 0.5% 1.6%
Connections Academy
0.7% 1.7% 12.6% 10.2% 69.2% 0.2% 5.5%
District Charter
1.2% 0.9%
1.9% 1.8%
12.1% 10.2%
8.8% 13.7%
71.8% 69.6%
0.2% 0.4%
3.6% 3.4%
All Virtual Schools
0.9% 1.8% 10.5% 12.8% 69.9% 0.4% 3.5%
National Average
1.0%
4.8%
15.5%
25.5%
49.8%
0.4%
3.0%
Source: United States Department of Education, National Center for Education Statistics, Common Core of Data (CCD), State Nonfiscal Public Elementary/Secondary Education Survey, 2011-12 v.1a. accessed Dec 1, 2014.
Free and reduced-price lunch and other student characteristics. As illustrated in Figure
5, the proportion of students in full-time virtual schools with available data (who qualified for free or reduced-price lunch (FRL) was 33.1%—16.8 percentage points lower than the all public school average of 49.9%. Within the full-time virtual school sector, district schools had a greater percentage of low-income students (33.8%) than charters (29.4%), while for-profits had a greater percentage of low-income students (35.9%) than those operated by nonprofit EMOs (28.2%). Of the two largest for-profit EMOs, K12 Inc. schools had 33.9% and Connections Academy enrolled a slightly higher percentage, 42.2%.
Blended schools with available data enrolled a much higher proportion of FRL students than virtual schools. In 2013-14, 46.9% of the students enrolled in blended schools qualified for free or reduced-priced lunch (3 percentage points lower than the average in all public schools).
Figure 5. Students Qualifying for Free and Reduced-Priced Lunch, 2013-14

Education Policy Analysis Archives Vol. 25 No. 124 18
The current study does not contain updated data on the proportion of students with
disabilities or students classified as English-language learners. English language learners represent a growing proportion of students in the nation’s schools, especially in the states served by virtual schools. Of the 464 full-time virtual schools with available data, only 0.1% of students were classified as ELL. This is a striking difference from the 9.2% national average in 2012-13.4
Many schools reported no data regarding special education. Earlier data from NCES in 2011-12 indicated that the proportion of students with disabilities in virtual schools is around half of the national average, or 7.2% compared with 13.1%.
While the population in the nation’s public schools is nearly evenly split between girls and boys, the population of students enrolled in virtual charter schools during the 2011-12 school year was skewed slightly in favor of girls (52.5% girls and 47.5% boys).5
These ratios remained when schools were subdivided into charter and district schools and independent and for-profit schools. Only nonprofit virtual and blended schools mirrored the nation’s public schools with a nearly even split between girls and boys. More research on this area is needed.
Enrollment by grade level. The National Center for Education Statistics (NCES) uses four
school-level classifications: elementary, middle school, high school, or other. “Other” refers to grade configurations that cut across the other three levels. More than 60% of virtual schools fell into the “Other” category because they were designed or intended to enroll students across two or more levels; in fact, many served students from kindergarten to grade 12. A total of 10.4% were designated as primary schools, 2.4% as middle schools, and 23.8% as high schools. The figures for blended learning schools indicated that 35.7% were classified as Other, while 15.7% were elementary schools, 4.3% were middle schools, and 44.3% were high schools. While these classifications are generally useful for describing traditional public schools, they are less useful for describing student distribution in charter schools, which comprise a large segment of virtual and blended schools. Charters often have permission to serve all grades but may enroll students in a more limited grade range. To illustrate the distribution of students in virtual schools as accurately as possible, Figure 6 details NCES data on actual student enrollment by grade; comparisons were based on national averages. A disproportionate number of students in virtual schools were in high school or upper secondary level, in contrast to the national picture where a relatively stable cohort of students was generally distributed evenly across grades, with a gradual drop from grades 9 to 12. This finding is interesting since brick-and-mortar charter schools were more likely to concentrate on the primary and lower secondary levels, which have lower per pupil costs than the upper secondary level.
4 This statistic is based on NCES data from U.S. Department of Education, National Center for Education Statistics. (2015). The Condition of Education 2015 (NCES 2015-144), English Language Learners. Retrieved from https://nces.ed.gov/fastfacts/display.asp?id=96. 5 This finding is based on NCES data from 2011-12.

Online and blended K-12 public schools 19
Figure 6. Enrollment by Grade Level for Virtual Schools and U.S., 2013-14
District-operated virtual schools served slightly more students at the upper secondary level
than charter schools did. More pronounced differences were evident when for-profit schools were compared with nonprofit EMO-operated schools and independent schools, which both served many upper secondary level students. Virtual schools operated by for-profit EMOs, predominately by K12 Inc. and Connections Academy, served substantially fewer students at the upper secondary level and showed enrollment drop-offs after grade 9.
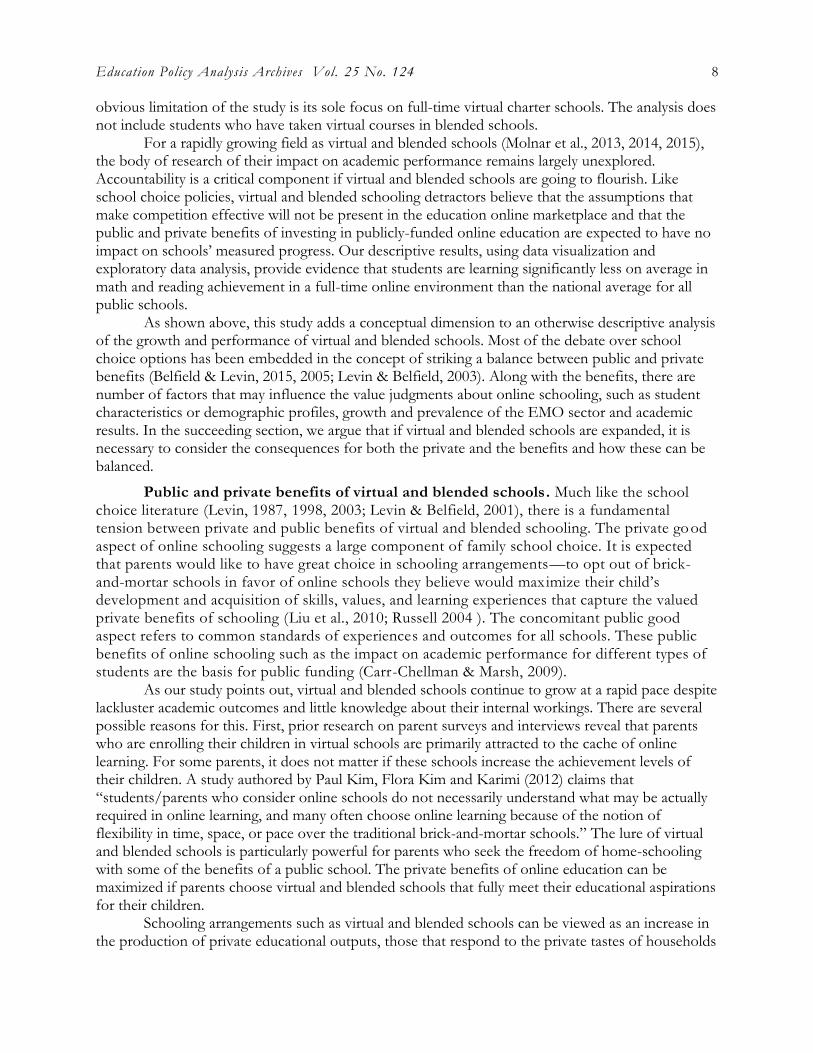
Figure 7 illustrates the actual number of students served by virtual schools at each grade level. Enrollment increased steadily through grade 9 and then leveled off from grades 10-12. This summary masks some changes by subgroups of schools. For example, the virtual schools operated by for-profit EMOs saw steep declines after grade 9, while many district-operated virtual schools served only students in the final few grades of high school, offsetting the decline in for-profit EMOs. This surprising decline in the grade cohorts in the for-profit EMO schools may be related to the low graduation rates of virtual schools: if dropout rates are high, then a portion of students do not persist into the upper grades. Plausible alternative explanations come from research on homeschooling families. One possible explanation is that parents may feel inclined to send their children to bricks-and-mortar high schools for the offerings of peer interactions, challenging coursework, and a wide selection of extra-curricular activities and supplemental postsecondary programs necessary to achieve college readiness (Dennis, 2004). In addition, course scheduling and family engagement in a fully online high school learning environment may be especially cumbersome in large families where parents have limited time to spend with their high school students because younger children require more attention (Dennis, 2004). More research is needed in this area.
Education Policy Analysis Archives Vol. 25 No. 124 20
Figure 7. Number of Virtual School Students per Grade Level and Number of Schools that Offer Instruction at Each of the Grade Levels, 2013-14
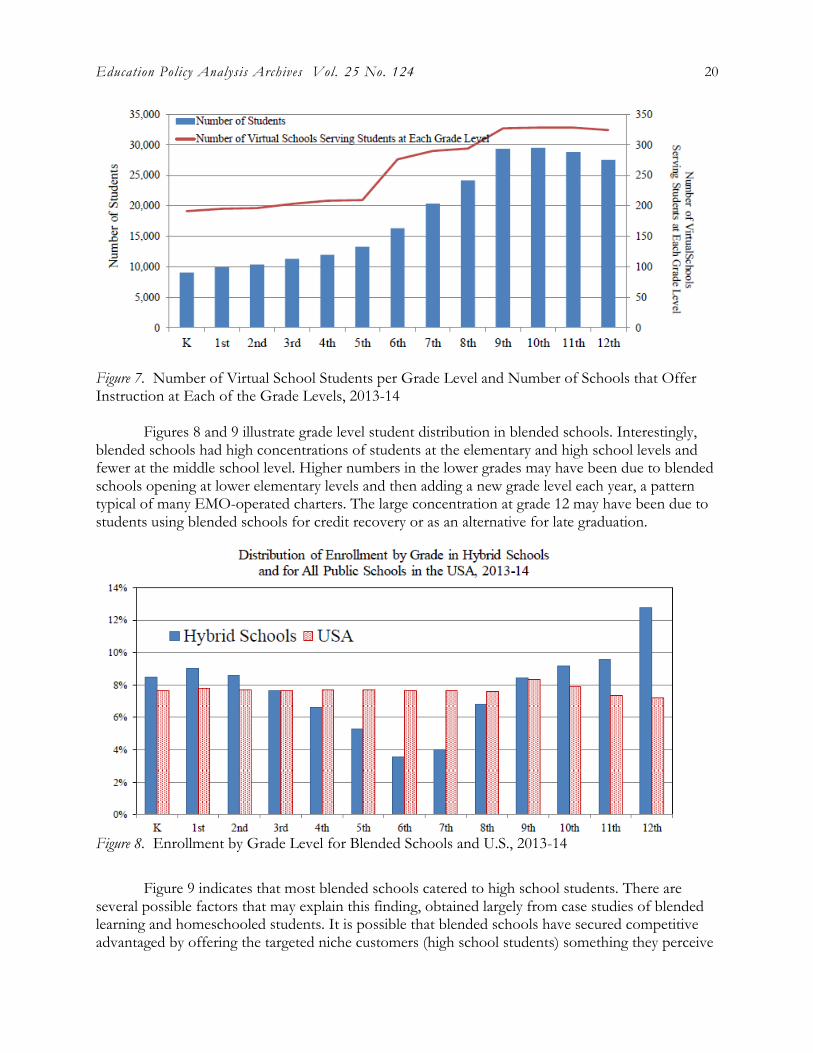
Figures 8 and 9 illustrate grade level student distribution in blended schools. Interestingly,
blended schools had high concentrations of students at the elementary and high school levels and fewer at the middle school level. Higher numbers in the lower grades may have been due to blended schools opening at lower elementary levels and then adding a new grade level each year, a pattern typical of many EMO-operated charters. The large concentration at grade 12 may have been due to students using blended schools for credit recovery or as an alternative for late graduation.
Figure 8. Enrollment by Grade Level for Blended Schools and U.S., 2013-14
Figure 9 indicates that most blended schools catered to high school students. There are
several possible factors that may explain this finding, obtained largely from case studies of blended learning and homeschooled students. It is possible that blended schools have secured competitive advantaged by offering the targeted niche customers (high school students) something they perceive

Online and blended K-12 public schools 21
is more closely aligned to their own unique needs or preferences. Education providers have found education niche markets that specialize solely in the delivery of face-to-face and online classes in high school (Picciano & Seaman, 2009). Consistent with the literature, students who continue with their online schooling in high school are more likely to be technologically savvy and are better able to self-regulate and work independently, thus turning them into potential client niche for blended schools in the post-secondary education sector (Picciano et al., 2012; Christensen, Horn, & Staker, 2013; Cherry, 2010). Although a number of hybrid models of face-to-face and individualized self-paced computer programs have been implemented over the last 20 years in higher education, there remains much work to be done in the area of full-time blended/hybrid schools for high school students.
Figure 9. Number of Blended School Students per Grade Level and Number of Schools that Offer Instruction at Each of the Grade Levels, 2013-14
Student-Teacher Ratios
Far more schools reported demographic data than reported student-teacher ratios. Due to a relative dearth of information on student-teacher ratio from state education agencies and from school report cards, the most recent and complete data available was NCES Common Core data for school year 2013-14.
While the average ratio was approximately 16 students per teacher in the nation’s public schools, virtual schools reported more than twice as many students per teacher (35:1). Among virtual schools, those operated by for-profit EMOs had the highest ratio (44:1), while those operated by nonprofit EMOs had the lowest (19.5:1). The raw data showed considerable outliers, with some virtual schools reporting fewer than two students per teacher and others reporting more than 300. Table 6 includes data from full-time virtual schools broken out by EMO status and by district or charter status. Table 6 also includes data from blended schools, which indicate that they had—on average— slightly lower student-teacher ratios compared with the full-time virtual schools (32.4:1).

Education Policy Analysis Archives Vol. 25 No. 124 22
Table 6 Teacher-Student Ratios, 2013-14
Number of schools with data
Median Mean SD Max Min
All Virtual Schools
213 26.5 35.03 36.43 356 1.3
Independent Virtual
119 23.0 29.36 24.81 150 1.4
Nonprofit Virtual
7 17.0 19.50 12.91 42 4.8
For-profit Virtual
87 36.6 44.04 47.64 356 1.3
K12 Inc.
51 39.6 41.77 38.78 265 1.3
Connections Academy
16 37.2 35.60 6.69 45.6 24
District Virtual Charter Virtual
73 140
28.2 25.8
39.89 32.50
51.18 25.46
356 150
1.4 1.3
All Hybrid Schools
16 23.26 32.44 24.59 113 11
National Average
16.0**
Source: United States Department of Education, National Center for Education Statistics, Common Core of Data (CCD), State Nonfiscal Public Elementary/Secondary Education Survey, 2011-12 v.1a. accessed Dec 1, 2014. *Note: The pupil/teacher ratios in 2010 and 2011 were both at 16.0. Keaton, P. (2013). Selected Statistics from the Common Core of Data: School Year 2011-12 (NCES 2013-441). U.S. Department of Education, Washington, DC: National Center for Education Statistics. Retrieved December 1, 2014, from http://nces.ed.gov/pubsearch.
School Performance Data
This section utilizes three key school performance indicators, namely, state school performance ratings, percentage of virtual and blended schools meeting or exceeding state proficiency benchmarks, and on-time graduation rates. General findings and trends are presented and discussed in Tables 7 to 9.
Performance-based school accountability systems identified in this study required full-time virtual schools, blended schools, and brick-and-mortar schools to fulfill similar academic progress and proficiency expectations. State-specific school performance ratings (rated acceptable or unacceptable) were obtained from school report cards. Currently, only 19 of 35 states included in this study released their 2014-15 report cards. While report cards provide a more holistic picture of a school’s performance, we acknowledge that overall acceptable and unacceptable performance designations are cursory and superficial, primarily involving judgments based on criteria that vary by state. To supplement the limited database information, this study calculated mean scale scores and achievement levels based on subject area results in PARCC (Partnership for Assessment of Readiness for College and Careers) and the Smarter Balanced Assessment Consortium (SBAC) to determine whether virtual and blended schools were meeting or exceeding proficiency benchmarks

Online and blended K-12 public schools 23
compared with state averages. In 2014-15, most states adopted sweeping educational policy changes. These generally included updated “college- and career-ready” academic standards and new accountability systems, typically employing Common Core-aligned assessments from PARCC or SBAC. In 2013-14, several states granted ESEA flexibility waivers transitioned to new statewide assessments, and since 2014-15 nearly every state has been grappling with issues related to the results of new assessments and the redesign of report card ratings intended to summarize student and school performance. As a result of the changing and currently limited database, variations in school performance captured here should be interpreted cautiously.
New Accountability Systems and State School Performance Ratings
School performance ratings were obtained from state sources or directly from school report cards. Although these are weak measures of school performance, they do provide descriptive indicators that can be aggregated across states. For several reasons, however, there are many gaps in report card ratings. Due to current flux in accountability systems resulting from new requirements under the Every Student Succeeds Act (ESSA) and flexibility waivers and extensions granted under the Elementary and Secondary Education Act (ESEA), many states have put their accountability systems on hold as they finalize new formats and transition to new standards and state tests. Such waivers allowed 29 states with virtual and blended schools to discontinue the use of state-determined AYP standards in 2012-13.
Annual school report cards often include multiple measures that vary from state to state but tend to include academic proficiency in Math and English/Language Arts, longitudinal academic growth, growth gaps, college readiness, attendance and graduation rates. Although the type, number, and weighting of such measures vary greatly from state to state, report card ratings do reflect the educational values of a state. Therefore, overall school report card ratings provide a reasonable representation of an individual school’s performance relevant to state expectations. Such new generation accountability systems are expected to add significantly to the size and scope of school performance measures, thus adding more detailed information about the aggregate performance trends of full-time virtual schools. For example, subject area results in PARCC and Smarter Balanced tests are reported in two ways—mean scale scores and mean achievement levels—so that student performance can be more easily understood. State reporting metrics based on the percentage of students meeting and exceeding expectations greatly facilitate performance comparisons between a state, its districts, and its schools with similar grade configurations.
Texas and Utah use a school grading accountability rating based on multiple metrics, including such areas as student achievement, student progress, closing performance gaps, participation rate, and postsecondary readiness. Pennsylvania uses four performance categories (advanced, proficient, basic and below basic) to indicate school performance on its 2015 PSSA state tests, as well as the percent of students designated as “historically underperforming” across the tested grade levels in a school. The test results may be used to compare whether schools’ scores are lower than the district’s historical performance or above the state’s averages in all assessed areas. Other states (South Carolina for example) use three standardized tests including ACT Aspire in grades 3-8 in core subject areas to calculate absolute ratings, growth ratings, growth towards college/career readiness, and federal accountability status (percent of students who met or exceeded grade level standards). Still other states, including Minnesota and Georgia, use a variety of multiple indicators that are then combined to arrive at an overall evaluation of school performance.6
6 For more details, see http://www.education.state.mn.us/MDE/JustParent/ESEA/PriorityFocusRewardSch/ index.html

Education Policy Analysis Archives Vol. 25 No. 124 24
Several of the state-specific school performance ratings consider the growth of all students
toward college and career readiness, the performance of all students in the school, subgroup growth, academic achievement rating, and graduation rate. For example, in the 2014-15 school year, Georgia implemented a College and Career Ready Performance Index (CCRPI) that uses multiple indicators to rate schools, including percentages of students reaching proficiency.
States like Tennessee publish school report cards that show how each school (virtual schools, blended schools and brick-and-mortar schools), district, and the state performs on a wide range of academic measures—achievement, graduation rate, ACT scores, and value-added composite scores.7
Another example of a state using multiple indicators is Minnesota, which uses both AYP indicators and its own Multiple Measurement Rating (MMR). The MMR targets a combination of multiple domains, emphasizing growth, achievement gap, proficiency and graduation rates in an effort to increase the validity of its assessments.
In the 2014-15 school year, state education authorities provided annual accountability ratings for only 62 (13.6%) of the 457 full-time virtual schools. Iowa, Washington, Idaho and Minnesota schools were rated based on AYP results, while Oklahoma, Louisiana, Nevada and Utah were rated with letter-grades or on star-rating report cards. Massachusetts, Texas and Tennessee ratings were based on composite performance indices based on multiple measures, including student growth.8 Among the 62 virtual schools with ratings, 19 (30.64%) received acceptable ratings in 2014-15. Independent virtual schools without EMOs were more likely to receive an acceptable rating than virtual schools with for-profit EMOs: 40.74% compared with 23.53% (see Table 7). Only one school operated by a nonprofit EMO was rated; its rating was unacceptable. No blended schools were assigned state performance ratings.
Table 7 Percentage of Virtual Schools with Acceptable School Performance Ratings by Management Status, 2014 -15
2014-15 Percentage of Total Rated Acceptable N=62
All Virtual Schools
30.64% (19 out of 62)
For-profit Virtual
23.53% (8 out of 34)
Nonprofit Virtual
0% (0 out of 1)
Independent Virtual 40.74% (11 out of 27)
District-Operated Virtual 37.84% (14 out of 37)
Charter Virtual
20% (5 out of 25)
Source: Authors’ calculations.
7 For more details, see https://www.tn.gov/education/topic/report-card 8 For more details, see http://profiles.doe.mass.edu/help/data.aspx?section=assess

Online and blended K-12 public schools 25
Percentage of Virtual/Blended Schools Meeting or Exceeding State Proficiency Benchmarks
Table 8 details comparisons of average state assessment results in English Language Arts (ELA) and Mathematics with average results in virtual and blended schools. That is, the table indicates to what extent average student proficiency in virtual and blended schools met, fell short of, or exceeded states averages. However, comparison of the school’s student achievement on the statewide achievement assessments should be considered in a spirit of inquiry. In particular, analyses conducted using aggregate, school-level achievement measures do not capture variability among individual students or among student subgroups.
Generally, recent state-by-state first year results for assessments aligned with more rigorous learning standards showed a decline in the statewide percentage of students scoring at proficient or advanced levels. However, results for students in full-time virtual schools showed a greater decline in grades 3-8.9 For example, while statewide 33%of California’s students met or exceeded standards in math, the percent of full-time virtual students at comparable levels fell to an average of 26.95 %.
Of the 121 virtual schools with available student proficiency rates, we found that 22 (18.18%) had rates above the state average (see Table 8). Of virtual schools operated by nonprofit EMOs, half (5 out of 10 schools) had proficiency rates above state averages. Over 23% of district-operated virtual schools produced proficiency rates above the state average (6 out of 26 schools). Rates for virtual charter schools and virtual schools operated by for-profit EMOs were similar: 16.84% and 16.67%. Table 8 Percentage of Virtual and Blended Schools that Outperform State Averages in Terms of Proportion of Students Meeting or Exceeding State Proficiency Benchmarks, 2014-15
2014-15 Virtual Schools that Outperform the State Average Total for all Virtual Schools: N= 121
18.18% (22 out of 121)
For-profit Virtual
16.67% (8 out of 48)
Nonprofit Virtual
50% (5 out of 10)
Independent Virtual 14.29% (9 out of 63)
District Virtual 23.08% (6 out of 26)
Charter Virtual
16.84% (16 out of 95)
9 Reaching conclusions about how 9-11 students performed is more difficult because of an array of different math tests given to students in high school.

Education Policy Analysis Archives Vol. 25 No. 124 26
Table 8 cont. Percentage of Virtual and Blended Schools that Outperform State Averages in Terms of Proportion of Students Meeting or Exceeding State Proficiency Benchmarks, 2014-15 2014-15 Virtual Schools that Outperform the State Average
Total for all Hybrid Schools: N= 42 14.28% (6 out of 42)
For-profit Hybrid
0% (0 out of 13)
Nonprofit Hybrid Independent Hybrid District Hybrid Charter Hybrid
14.28% (1 out of 7)
22.73% (5 out of 22)
27.27% (3 out of 11)
9.68% (3 out of 31)
Source: Authors’ calculations.
Comparisons of acceptable school performance ratings in blended schools are weaker
because blended schools typically operate as district-run hybrid schools; in contrast, virtual schools generally can enroll students statewide and so have a student population more similar to the state’s aggregate enrollment. Still, the proficiency gaps between blended schools and their host states are substantial and noteworthy. Of the blended schools operated by for-profit EMOs, none outperformed state averages for students meeting or exceeding proficiency. Among nonprofit EMO blended schools, only one exceeded state averages, while of charter blended schools, 3 out of 31 posted averages higher than their states’. The district- and independent-operated blended schools performed better than their blended school counterparts in terms of meeting or exceeding state averages in the percentage of students achieving proficiency (27.27% and 22.73%, respectively).
Graduation Rates
In recent years, schools and states have been standardizing how they record and report graduation rates. The measure widely used today is “On-Time Graduation Rate,” which refers to the percentage of all students who graduate from high school within four years after they started 9th grade. Information on graduation rates was available for 131 virtual schools (about 28% of the total 457) and for 26 (32% of the total 87) blended schools. Many virtual and blended schools did not report a graduation rate partly because some do not offer high school grades; others are relatively new and have not had a student cohort that has completed grades 9-12. Even so, the rates are low for the large enrollment reported for grades 9-12 (see Figures 7 and 9).
As Figure 10 illustrates, the on-time graduation rates for full-time virtual and blended schools (40.6% and 37.4% respectively) were less than the national average of 81.0%. The graduation rates for virtual schools have flattened or declined over the past few years, while the graduation rates for the nation have been improving about 1 percentage point each year. These findings align with other measures of school performance and contribute to the overall picture of virtual and blended school performance.

Online and blended K-12 public schools 27
Figure 10. Mean Graduation Rates for Virtual Schools Relative to All Public Schools, 2013-2014.
The graduation rates for 2013-15 are poor across all subgroups of virtual and blended
schools. (see Table 7). During the 2013-14 school year, virtual schools operated by nonprofit EMOs had the highest on-time graduation rate, 50.1%. Rates in independent and for-profit operated virtual schools were 40.9% and 38.3%, respectively. Within the subgroup representing EMO-managed virtual schools, high-school students at K12, Inc. had an on-time graduation rate of 32.8%; as in 2012-13, Connections Academy did better at 47.8%.
Table 9 Mean Graduation Rates for Virtual Schools Relative to All Public Schools, 2013-2014
Subhead
Number of schools with data
4 year on-time graduation rate
Mean Weighted Mean
Median
Independent
79 40.92% 51.51% 35%
Nonprofit
8 50.10% 40.64% 50.5%
Nonprofit
44 38.31% 39.26% 33.5%
K-12 Inc. 18 32.83% 35.46% 29.5%
Connections Academy 13
47.88% 50.51% 49.0%
District
57 41.13% 40.23% 35.0%
Charter
74 40.20% 42.90% 35.0%
All Virtual Schools
131 40.60% 42.69% 35.0%
All Hybrid Schools
26 37.43% 38.87% 37.0%
National Average (2012-13) 81.0%* Source: The national figure is for 2012-13. For details see https://nces.ed.gov/ccd/tables/ACGR_2010-11_to_2012-13.asp.

Education Policy Analysis Archives Vol. 25 No. 124 28
Charter virtual schools had a graduation rate similar to those of district-operated virtual
schools at about 40.2% and 41.1%, respectively. Blended schools with graduation data had a lower graduation rate than all of the subgroups of virtual schools Overall, average on-time graduation rates remained substantially lower for virtual and blended schools than for traditional public schools in the US: only 40.6% of students at virtual high schools and 37.4% at blended schools graduated on time, whereas the national average for all public high schools was more than double at 81.0%. Regardless of setting or school type, graduation rates in virtual and blended learning schools remain far below national averages.
Based on anecdotal evidence, there are several factors that can influence low graduation rates. The operators of full-time virtual and blended schools may claim that these results are due to the fact that their schools cater to a weaker class of students, largely at-risk population, perhaps already multiple grade levels behind and are likely to transfer repeatedly and may not intend to stay for four years. Even though these vulnerable students may eventually graduate, virtual and alternative schools claim that they end up with high mobility rates and low credit accumulation, thus resulting in low graduation rates. In other words, a major contributing factor towards low graduation rates may have been due to students using virtual and blended schools for credit recovery or as an alternative for late graduation (Brady, 2012). On the other hand, critics claim that the graduation rate ‘crisis’ in virtual and blended schools is another indicator that online schooling may not be an effective learning environment for all students, particularly for struggling, underperforming student populations (Brady, 2012). More research is needed in this area.
Summary, Policy Implications, Study Limitations, and Directions for Future Research
Summary
The analyses in this study describe the growth and performance of virtual and blended schools and identify which students these schools are serving. The study offers a balanced appraisal of their growth and performance from choice-based school reform, both from an individual (private) and a societal (public) standpoint. The results provide insights into what is distinctive about virtual and blended schools.
The analysis finds that more than half the student populations that attend virtual and blended schools are in schools that are operated by private, for-profit EMOs. Enrollments in the charter virtual and blended schools are substantially larger than district schools. The proportions of Black and Hispanic students in virtual schools are considerably lower than the national averages, while students enrolled in blended schools closely resemble the race and ethnic characteristics of students enrolled in brick-and-mortar public schools nationwide. Virtual and blended schools are more likely to serve students in kindergarten through grade 12, with higher concentrations at both the elementary and secondary levels. Finally, our descriptive results provide evidence that students are learning significantly less on average in math and reading achievement in a full-time online environment than the national average for all public schools. Virtual and blended schools managed by for-profit EMOs lagged behind their district and independent counterparts in meeting or exceeding state proficiency levels. The on-time graduation rates for full-time virtual and blended schools are also less than the national average.
Discussion and Policy Implications
Why should such a discussion of public and private benefits of online schooling matter? Given our conflicting conceptions of the purposes of schooling in a democracy (that is, schooling

Online and blended K-12 public schools 29
according to whom and for whom), it is hardly surprising that some argue that access to virtual and blended schooling is a personal right to be exercised by students and their families solely for their own benefit. Although the rhetoric of school choice reform argues about what is best for children, the fact is that there will be winners and losers among stakeholders with different interests (Fuller, 1996). Indeed, there is a lot at stake: virtual and blended schools may offer profitable contracts to EMOs to execute increased class size and student-teacher ratios, and thus necessitate transparency and accountability for the use of publicly funded educational resources and their measured outcomes. On the other hand, public school advocates who call for greater investment in education have emphasized the need for a public school system that provides a common educational experience and sustained peer interaction from broad and diverse learning contexts, and that public education should provide a level playing field. Full-time virtual and blended schools are especially important to track because they receive full funding for delivering what is supposed to be a full educational experience. This study demonstrates that there are number of factors that may influence the value judgments about online schooling, such as student characteristics or demographic profiles, growth and prevalence of the EMO sector and academic results.
Policymakers that see virtual and blended schools as a useful tool for improving public education should be mindful of the consequences for both the private and the public benefits, and how their growth and performance may contribute to educational inequalities for students from disadvantaged backgrounds. For example, this study indicates an overrepresentation of white students in virtual schools compared to the racial/ethnic distribution of public school students nationwide. If full-time virtual schools do target a particular racial group, districts that are losing high proportions of white students from virtual schools may experience an intensification of existing racial stratification, with students from white families concentrated in virtual schools, and students from minority families concentrated in brick-and-mortar schools. This racial stratification could in turn intensify educational inequalities in districts and regions, undermining the ability of states to facilitate an equality of opportunity. Much like the modern homeschooling movement, choice-based policies such as virtual and blended schools exist in the socio-historical context of racial stratification/segregation in traditional, brick-and-mortar public schools, decades of white flight from inner cities and metropolitan schools, and well-understood nexus between income and access to quality schools (Saiger, 2016).
In addition, our findings suggest that those who have struggled academically in brick-and-mortar settings may continue to struggle online, as indicated by lackluster performance in demonstrating proficiency in state tests and low on-time graduation rates for full-time virtual and blended schools. The poignant implication of these findings is telling—that is, virtual and blended schools will solve neither the gap in achievement between disadvantaged students and their better-off peers nor the gap in access to high-quality choice schools. This implies that disadvantaged students may still get less than adequate education, even though some will switch to virtual and blended schools.
On the other hand, our findings show that the largest growth in virtual and blended school enrollment is in the elementary and secondary levels, with steep enrollment drop-offs after grade 9 for virtual schools operated by for-profit EMOs. This is an unexplored area and needs further research as it will give an understanding of the factors influencing the perceived public and private benefits of online schooling among different stakeholders. For example, demand for virtual schools in high school may not be present because of the opportunity costs of online schooling in upper secondary level: parents may prefer that their children participate in extracurricular activities that influence the type and selectivity of the postsecondary institution they attend, or encourage social and peer interaction amid changing family circumstances. Blended schools focused on product

Education Policy Analysis Archives Vol. 25 No. 124 30
differentiation and niche-oriented interests may view targeting high school students as a way to address client satisfaction and clients' needs and preferences. However, policymakers and stakeholders would do well to be aware of the potentially stratifying effects of virtual and blended schools. If virtual and blended schools are allowed the expansion of scale, policies must be enacted to ensure that they do so in ways that are responsive to all public school constituencies (i.e., special education students or at-risk students, not just the self-directed and gifted students frequently sampled in the K-12 online literature) and that stratification is not exacerbated by their proliferation. Policies that provide incentives for virtual and blended schools to serve minority or low-income students may help to mitigate the stratifying effects of online schooling— a culture of individualism through technology where students are fragmented and susceptible to a constant cycle of enrollment and withdrawal (Saul, 2011). Instead, online schooling policies should be the result of deliberate policy choices grounded in educational environments where students can grow within culturally rich, informed, democratic, digitally connected and diverse learning communities.
Furthermore, states that expand virtual and blended schools to provide additional choices to families must also ensure that parents have access to high-quality school profiles and demographic and school performance data that allows families to make decisions with the best possible information. The availability of better information (i.e., class sizes, teacher-student ratios, and percent special education students and limited English proficient students) is unlikely to eliminate differences in families’ online schooling decisions. However, without better refined data, there is a critical lack of information and families will be unable to make informed choices, violating a key precept necessary for properly functioning education markets.
Study Limitations
There are some caveats and limitations to consider, however, when interpreting our results. Note that most of these limitations are also present for other researchers working with this topic, although they are not always highlighted in their studies.
First, our supplementary tables in the appendices have several gaps that reflect missing data. Some states combine virtual school data with local district data in ways that make disaggregation impossible. For example, while data on student ethnic background and on free-and-reduced-price lunch status is relatively complete, data reported at the district level (including, for example, special education enrollment) is much less available. This was particularly problematic in states where charter schools are not considered Local Education Authorities or districts.
Second, national aggregate results for all public schools provide the base for several comparisons in this report, which profiles 33 states having virtual and/or blended options and an additional two states offering only the blended format—a total snapshot of 35 states. While comparisons of two inherently different forms of schooling, each representing different geographic datasets, have some obvious weaknesses, national aggregate data is what state and federal agencies typically use in their reports and comparisons. Following the agencies’ lead is intended to allow reasonable comparison of this study with others. An additional consideration is that, because the 33 states represented are among the largest and most densely populated, the national comparison is informative, if not perfect. It is perhaps also worth noting that the national data include data for full-time virtual and blended schools, although it constitutes a relatively small subset.
Third, full-time virtual and blended schools are rapidly evolving; currently, the number of such schools, their demographic composition, and their performance data could vary from the 2013-14 demographic data and the 2014-15 performance data presented here. When the fluidity of the terrain is layered onto the scope of this attempt to compose a national portrait, some errors of inclusion and exclusion seem likely.

Online and blended K-12 public schools 31
Fourth, in terms of assessment data, it is worth noting that there are many new state
assessments being used, often with a single year of data. Another concern relates to the fact that average enrollments in virtual and blended schools are generally lower than state averages, which means that average student proficiency percentages in virtual and blended schools are generally based on fewer students. As a result, year-to-year variations among virtual and blended schools may naturally be greater than variations in state averages. A similar concern relates to the accuracy of class size data, because class size may help explain the weak performance of virtual and blended schools. Given the anecdotal evidence practitioners have shared with us after reviewing our earlier research, and given the excessively high teacher-student ratios reported by investigative journalists (Saul, 2011), we do have concerns about the accuracy of largely self-reported teacher-student ratios found in state and federal datasets. We believe that the data we report underestimates the number of teachers to students in virtual and blended learning schools. This is an area of interest because virtual schools have considerable cost savings in facilities and transportation, and so one would expect them to have more resources available to spend on teaching staff.
Finally, it is beyond the scope of this study to determine whether the variation in student demographics in virtual and blended schools, as well as their performance measures, is due to an explicit effort to maximize the scalable business model of online schooling. It is also important to note that several aspects of the private and public benefits of virtual and blended schools are not well understood, or have not been researched adequately to provide quantifiable measures. Our earlier discussion of the school choice literature (i.e., homeschooling) also suggests that parents may care about many aspects of virtual and blended schooling that do not directly show up in schools’ performance measures.
Directions for Future Research
The above limitations need to be corrected by the policy analysts, government agencies, and institutional researchers who are already engaged in collecting and disseminating similar information. The rapid, widespread adoption of K-12 virtual and blended schooling emphasizes the need for a commitment to rigorous data collection and to wide public distribution of clear, contextualized information on school demographics, organizational/institutional profiles, and measured outcomes. Since virtual and blended schooling is a relatively recent but growing phenomenon in K-12 education, very limited empirical studies have been carried out to date. To our knowledge, this is the first study addressing the demographic characteristics, growth and performance for both virtual and blended-learning schools. Although this is only an exploratory study, the descriptive findings have important implications for education as a public or private good. Future research should move beyond the descriptive phase of research from using cross-sectional data (a single snapshot in time) into a more rigorous statistical analysis.
Future work should draw parallels between homeschooling/school choice literature and virtual/blended schools to infer what factors apart from academic achievement matter for parents. Instead of relying solely on test scores as a proxy for outcomes, future studies could follow students from virtual and blended schools into college and the workforce. In addition, researchers’ descriptions of online schools should ensure that they are unbiased indication of the larger virtual and blended student school population (i.e., credit recovery students, self-directed learners, mobile students). Much work remains to be done, and promising initiatives in data collection needs broader/richer samples to fulfill the theoretical claims of the public versus private benefits of virtual and blended schooling.

Education Policy Analysis Archives Vol. 25 No. 124 32
References Ahn, J. (2011). Policy, technology, and practice in cyber charter schools: Framing the issues. Teachers
College Record, 113(1), 1-26. Ahn, J., & McEachin, A. (2017). Student enrollment patterns and achievement in Ohio’s online
charter schools. Educational Researcher, 46(1), 44-57. Baker, J. D., Bouras, C., Hartwig, S. M., & McNair, E. R. (2005). K12 Inc. and the Colorado Virtual
Academy: A virtual charter school. In Z. L. Berge & T. Clark (Eds.), Virtual schools: Planning for success (pp. 133–142). New York: Teachers College Press.
Ball, S. J., Thrupp, M., & Forsey, M. (2010). Hidden markets: the new education privatization. New York, NY: Routledge.
Bast, J. L., & Walberg, H. J. (2004). Can parents choose the best schools for their children?. Economics of Education Review, 23(4), 431-440. https://doi.org/10.1016/j.econedurev.2003.08.003
Barbour, M. K. (2009). Today’s student and virtual schooling: The reality, the challenges, the promise. Journal of Distance Learning, 13(1), 5–25.
Beck, D., Egalite, A., & Maranto, R. (2014). Why they choose and how it goes: Comparing special education and general education cyber student perceptions. Computers & Education, 76, 70-79. https://doi.org/10.1016/j.compedu.2014.03.011
Beese, J., & Martin, J. (2016). Misrepresenting Brown Are Ohio schools lost in the free market? General implications for urban education. Urban Education. https://doi.org/10.1177/0042085916666929
Belfield, C. R., & Levin, H. M. (2002). The effects of competition between schools on educational outcomes: A review for the United States. Review of Educational Research, 72(2), 279-341. https://doi.org/10.3102/00346543072002279
Belfield, C., & Levin, H. M. (2005). Vouchers and public policy: When ideology trumps evidence. American Journal of Education, 111(4), 548-567. https://doi.org/10.1086/431183
Belfield, C. R., & Levin, H. M. (2015). Privatizing educational choice: Consequences for parents, schools, and public policy. New York, NY: Routledge.
Bernstein, M. (2013). Whose choice are we talking about? The exclusion of students with disabilities from for-profit online charter schools. Richmond Journal of Law and the Public Interest, 16(3), 487-528. https://doi.org/10.2139/ssrn.2203589
Bernard, R. M., Abrami, P. C., Borokhovski, E., Wade, A. C., Tamim, R. M., Surkes, M. A., & Bethel, E. C. (2009). A meta-analysis of three types of interaction treatments in distance education. Review of Educational Research, 79, 1243–1289. https://doi.org/10.3102/0034654309333844
Black, E. W. (2009). An evaluation of familial involvements’ influence on student achievement in K-12 virtual schooling. (PhD dissertation). University of Florida.
Borup, J., Graham, C. R., & Davies, R. S. (2013). The nature of parental interactions in an online charter school. American Journal of Distance Education, 27, 40–55. https://doi.org/10.1080/08923647.2013.754271
Boulton, H. (2008). Managing e-Learning: What are the real implications for schools? The Electronic Journal of e-Learning, 6(1), 11-18.
Brady, K. (2012). Technology in schools. Thousand Oaks, CA: Sage Publications, Inc. Carr-Chellman, A. A., & Marsh, R. M. (2009). Follow the money. TechTrends, 53(4), 49.
https://doi.org/10.1007/s11528-009-0306-6

Online and blended K-12 public schools 33
Cavanaugh, C. (2001). The effectiveness of interactive distance education technologies in K-12
learning: A meta-analysis. International Journal of Educational Telecommunications, 7(1), 73-88. Cavanaugh, C., Gillan, K. J., Kromrey, J., Hess, M., & Blomeyer, R. (2004). The effects of distance
education on K-12 student outcomes: A meta-analysis. Naperville, IL: Learning Point Associates/North Central Regional Educational Laboratory (NCREL).
Cherry, L. D. (2010). Blended learning: An examination of online learning's impact on face-to-face instruction in high school classrooms. Minneapolis, MN: Walden University.
Christensen, C. M., Horn, M. B., & Staker, H. (2013). Is K-12 blended learning disruptive? An introduction to the theory of hybrids. Lexington, MA: Clayton Christensen Institute for Disruptive Innovation.
Clark, T. (2001). Virtual schools: Trends and issues - A study of virtual schools in the United States. San Francisco, CA: Western Regional Educational Laboratories. Retrieved from http://www.wested.org/online_pubs/virtualschools.pdf
Coates, W. C., Ankel, F., Birnbaum, A., Kosiak, D., Broderick, K. B., Thomas, S., & Collings, J. (2004). The virtual advisor program: linking students to mentors via the world wide web. Academic Emergency Medicine, 11(3), 253-255. https://doi.org/10.1111/j.1553-2712.2004.tb02205.x
Colorado J. T., & Eberle, J. (2010) ‘Student demographics and success in online learning environments’. Emporia State Research Studies, 46(1), 4-10.
Chubb, J.E. & Moe, T.M. (1990). Politics, Markets and America’s Schools. Washington, D.C.: Brookings Institution.
DeJarnatt, S. L. (2013). Keep following the money: Financial accountability and governance of cyber charter schools. The Urban Lawyer, 915-951.
Dennis, J. G. (2004). Homeschooling high school: Planning ahead for college admission. Seattle, WA: YWAM Publishing.
Ellis, K. (2008). Cyber charter schools: Evolution, issues, and opportunities in funding and localized oversight. Educational Horizons, 86(3), 142-152.
Fairlie, R. W. (2005). The effect of home computers on school enrollment. Economics of Education Review, 24, 533-547. https://doi.org/10.1016/j.econedurev.2004.08.008
Finn, C. E., & Fairchild, D. R. (2012). Education reform for the digital era. Washington, DC: Thomas B. Fordham Institute.
Friedman, M. (1962). Capitalism and freedom. Chicago, IL: University of Chicago Press. Fuller, B. F., & Elmore, R. (1996). Who chooses? Who loses? Culture, institutions and the unequal effects of
school choice. New York, NY: Teachers College Press. Garrett Dikkers, A. (2015). The intersection of online and face-to-face teaching: Implications for
virtual school teacher practice and professional development. Journal of Research on Technology in Education, 47(3), 139-156. https://doi.org/10.1080/02773813.2015.1038439
Gill, B., Walsh, L., Wulsin, C. S., Matulewicz, H., Severn, V., Grau, E., L., . . . Kerwin, T. (2015). Inside online charter schools. Cambridge, MA: Mathematica Policy Research. Retrieved from https://www.mathematica-mpr.com/our-publications-and-findings/publications/inside-online-charter-schools
Glass, G. V. (2009). The realities of K-12 virtual education. Boulder and Tempe: Education and the Public Interest Center & Education Policy Research Unit. Retrieved from http://epicpolicy.org/publication/realities-K-12-virtual-education
Glass, G. V., & Welner, K. G. (2011). Online K-12 Schooling in the US: Uncertain Private Ventures in Need of Public Regulation. Boulder, CO: National Education Policy Center.

Education Policy Analysis Archives Vol. 25 No. 124 34
Greenway, R., & Vanourek, G. (2006). The virtual revolution: Understanding online schools.
Education Next, 6(2), 34-42. Gutmann, A. (1987). Democratic education. Princeton, NJ: Princeton University Press. Hasler Waters, L. & Leong, P. (2014). Who is teaching? New roles for teachers and parents in cyber
charter schools. Journal of Technology and Teacher Education, 22(1), 33-56. Chesapeake, VA: Society for Information Technology & Teacher Education.
Henig, J. R. (1994). Rethinking school choice: The limits of the market metaphor. Princeton, NJ: Princeton University Press.
Huerta, L., & Gonzales, M. (2004). Cyber and homeschool charter schools: How states are defining new forms of public schooling. Phoenix: Education Policy Research Unit. Retrieved from http://epsl.asu.edu/epru/articles/EPRU-0401-49-OWI.htm
Huerta, L. A., Gonzalez, M. F., & d’Entremont, D. (2006). Cyber charter schools: Can accountability keep pace with innovation? Phi Delta Kappan, 88(1), 23–30.
Jacob, A. M. (2011). Benefits and barriers to the hybridization of schools. Journal of Education Policy, Planning and Administration, 1(1), 61-82.
Jacob, B. A., & Rockoff, J. E. (2012). Organizing schools to improve student achievement: Start times, grade configurations, and teacher assignments. The Education Digest, 77(8), 28.
Kim, P., Kim, F. H., & Karimi, A. (2012). Public Online Charter School Students Choices, Perceptions, and Traits. American Educational Research Journal, 49(3), 521-545. https://doi.org/10.3102/0002831212443078
Kleitz, B., Weiher, G. R., Tedin, K., & Matland, R. (2000). Choice, charter schools, and household preferences. Social Science Quarterly, 846-854.
LaBarbera, R. (2013). The relationship between students’ perceived sense of connectedness to the instructor and satisfaction in online courses. The Quarterly Review of Distance Education, 14(4), 209-220.
Litke, D. (1998). Virtual schooling at the middle grades: A case study résumé. The Journal of Distance Education, 13(2), 33-50.
Lacireno-Paquet, N., & Brantley, C. (2008). Who chooses schools, and why. Education Policy Research Unit and the Education and the Public Interest Center, Arizona State University. Retrieved from http://www.greatlakescenter.org/docs/Policy_Briefs/Lacireno-Paquet_Who%20Chooses%20Schools.pdf
Lafer, G. (2014). Do poor kids deserve lower-quality education than rich kids. Evaluating school privatization proposals in Milwaukee, Wisconsin. Washington, DC: Economic Policy Institute. Retrieved from http://www.epi.org/publication/school-privatization-milwaukee/
Lauen, D. L. (2007). Contextual explanations of school choice. Sociology of Education, 80, 179-209. https://doi.org/10.1177/003804070708000301
Levin, H. M. (2003). The public-private nexus in education. In Educational partnerships and the State: the paradoxes of governing schools, children, and families (pp. 171-186). Palgrave Macmillan.
Levin, H. M. (2002). A comprehensive framework for evaluating educational vouchers. Educational evaluation and policy analysis, 24(3), 159-174. https://doi.org/10.3102/01623737024003159
Levin, H. M. (1997). Raising school productivity: An x-efficiency approach. Economics of Education Review, 16(3), 303-311. https://doi.org/10.1016/S0272-7757(96)00069-6
Levin, H. M. (1998). Educational vouchers: Effectiveness, choice, and costs. Journal of Policy Analysis and Management, 373-392. https://doi.org/10.1002/(SICI)1520-6688(199822)17:3<373::AID-PAM1>3.0.CO;2-D
Levin, H. M. (1992). Market approaches to education: vouchers and school choice. Economics of Education Review, 11(4), 279-285. https://doi.org/10.1016/0272-7757(92)90037-4

Online and blended K-12 public schools 35
Levin, H. M. (1991). The economics of educational choice. Economics of Education Review, 10(2), 137-
158. https://doi.org/10.1016/0272-7757(91)90005-A https://doi.org/10.1016/0272-7757(91)90007-C
Levin, H. M. (1987). Education as a public and private good. Journal of Policy Analysis and Management, 628-641. https://doi.org/10.2307/3323518
Levin, H. M., & Belfield, C. R. (2001). Families as contractual partners in education. UCLA Law Review, 49, 1799.
Levin, H. M., & Belfield, C. R. (2003). Chapter 6: The Marketplace in Education. Review of Research in Education, 27(1), 183-219. https://doi.org/10.3102/0091732X027001183
Liu, F., Black, E., Algina, J., Cavanaugh, C., & Dawson, K. (2010). The validation of one parental involvement measurement in virtual schooling. Journal of Interactive Online Learning, 9(2), 105-132.
Marsh, R. M., Carr-Chellman, A. A., & Sockman, B. R. (2009). Why parents choose cybercharter schools. TechTrends, 53(4), 32-36. https://doi.org/10.1007/s11528-009-0303-9
Mazama, A., & Musumunu, G. (2014). African Americans and homeschooling: Motivations, opportunities and challenges. New York, NY: Routledge.
Means, B., Toyama, Y., Murphy, R., Bakia, M., & Jones, K. (2009). Evaluation of evidence-based practices in online learning: A meta-analysis and review of online learning studies. Washington, DC: US Department of Education.
Merchant, Z., Goetz, E., Cifuentes, L., Keeney-Knnicutt, W., & Davis, T. (2014). Effectiveness of virtual reality-based instruction on students’ learning outcomes in K-12 and higher education: A meta-analysis. Computers & Education.
Miron, G., & Urschel, J. L. (2012). Understanding and improving full-time virtual schools: A study of student characteristics, school finance, and school performance in schools operated by K12, Inc. [with Appendices]. National Education Policy Center.
Moe, T. M., & Chubb, J. E. (2009). Liberating learning: Technology, politics, and the future of American education. John Wiley and Sons.
Molnar, A. (Ed.) Huerta, L., Shafer, S. R., Barbour, M. K., Miron, G., & Gulosino, C. (2015). Virtual Schools in the U.S. 2015: Politics, Performance, Policy, and Research Evidence. Boulder, CO: National Education Policy Center. Retrieved from http://nepc.colorado.edu/publication/virtual-schools-annual-2015
Molnar, A. (Ed.), Rice, J. K., Huerta, L., Shafer, S. R., Barbour, M. K., Miron, G., . . . Horvitz, B. (2014) Virtual Schools in the U.S. 2014: Politics, Performance, Policy, and Research Evidence. Boulder, CO: National Education Policy Center. Retrieved from http://nepc.colorado.edu/publication/virtual-schools-annual-2014
Molnar, A. (Ed.), Miron, G., Huerta, L., Cuban, L., Horvitz, B., Gulosino, C., . . . Shafer, S.R. (2013). Virtual Schools in the U.S. 2013: Politics, Performance, Policy, and Research Evidence. Boulder, CO: National Education Policy Center. Retrieved from http://nepc.colorado.edu/publication/virtualschools-annual-2013
Mosier, B. A. (2010). A descriptive study of Florida virtual school's physical education students: An initial exploration. (PhD dissertation). Florida State University.
Natale, C. F. (2011). Teaching in the world of virtual K–12 learning: Challenges to ensure educator quality. Princeton, New Jersey: Education Testing Service (ETS).
Natale, C. F., & Cook, J. (2012). Virtual K–12 learning: New learning frontiers for state education agencies. Peabody Journal of Education, 87(5), 535-558. https://doi.org/10.1080/0161956X.2012.723491

Education Policy Analysis Archives Vol. 25 No. 124 36
Pazhouh, R., Lake, R., & Miller, L. (2015). The policy framework for online charter schools. Washington,
DC: Center on Reinventing Public Education. Picciano, A. G., & Seaman, J. (2009). K-12 online learning: A 2008 Follow-up of the Survey of US School
District Administrators. Newburyport, MA: Sloan Consortium. Picciano, A. G., Seaman, J., Shea, P., & Swan, K. (2012). Examining the extent and nature of online
learning in American K-12 education: The research initiatives of the Alfred P. Sloan Foundation. The Internet and Higher Education, 15(2), 127-135.
Rice, K. L. 2006. A comprehensive look at distance education in the K-12 context. Journal of Research on Technology in Education, 38(4), 425-449. https://doi.org/10.1080/15391523.2006.10782468
Russell, G. (2004). Virtual schools: A critical view. Development and management of virtual schools: Issues and trends. In Catherine Cavanaugh (Ed.), Development and Management of Virtual Schools: Issues and Trends (pp. 1-25). Hershey, PA: Information Science Publishing.
Russo, A. (2005). A tough nut to crack in Ohio: Charter schooling in the Buckeye state. Chicago, IL: Progressive Policy Institute.
Saul, S. (2011, December 12). Profits and questions at online charter schools. The New York Times. Retrieved from http://www.nytimes.com/2011/12/13/education/online-schools-score-better-on-wall-street-than-in-classrooms.html
Saiger, A. (2016). Homeschooling, virtual learning, and the eroding public/private binary. Journal of School Choice, 10(3), 297-319. https://doi.org/10.1080/15582159.2016.1202070
Saultz, A., & Fusarelli, L. D. (2017). Online schooling: A cautionary tale. Journal of School Choice, 11(1), 29-41. https://doi.org/10.1080/15582159.2016.1272928
Schneider, M., & Buckley, J. (2002). What do parents want from schools? Evidence from the Internet. Educational Evaluation and Policy Analysis, 24(2), 133-144. https://doi.org/10.3102/01623737024002133
Schneider, M., Marschall, M., Teske, P., & Roch, C. (1998). School choice and culture wars in the classroom: What different parents seek from education. Social Science Quarterly, 489-501.
Shapiro, A. (2013). Education under siege: Frauds, fads, fantasies and fictions in educational reform. New York, NY: R&L Education.
Spitler, C., Repetto, J., & Cavanaugh, C. (2013). Investigation of a special education program in a public cyber charter school. American Journal of Distance Education, 27(1), 4-15. https://doi.org/10.1080/08923647.2013.754182
Staker, H., & Horn, M. B. (2012). Classifying K-12 blended learning. Innosight Institute. Tamim, R. M., Bernard, R. M., Borokhovski, E., Abrami, P. C., & Schmid, R. F. (2011). What forty
years of research says about the impact of technology on learning a second-order meta-analysis and validation study. Review of Educational Research, 81(1), 4-28.
Teske, P., & Schneider, M. (2001). What research can tell policymakers about school choice. Journal of Policy Analysis and Management, 20(4), 609-631. https://doi.org/10.1002/pam.1020
Torre, D. (2013). Virtual charter schools: Realities and unknowns. International Journal of E-Learning & Distance Education, 27(1).
Tucker, B. (2007). Laboratories of reform: Virtual high schools and innovation in public education. Education Sector Reports, 1-15.
Vanourek, Gregg, (2006). A primer on virtual charter schools: Mapping the electronic frontier, National Association of Charter School Authorizers Issue Brief, 1-12.
Waters, J. K. (2011). Competing for the virtual student: As the for-profit sector gets into the virtual school business, public schools begin to vie for the online student at the same time they find new ways to help them be successful. The Journal (Technological Horizons In Education), 38(7), 28.

Online and blended K-12 public schools 37
Waters, L. H., & Leong, P. (2014). Who is teaching? New roles for teachers and parents in cyber
charter schools. Journal of Technology and Teacher Education, 22(1), 33-56. Waters, L. H., Barbour, M. K., & Menchaca, M. P. (2014). The nature of online charter schools:
Evolution and emerging concerns. Educational Technology & Society, 17(4), 379-389. Watson, J. F. (2007). A national primer on K-12 online learning. Washington, DC: North American
Council for Online Learning. Watson, J. (2008). Blended learning: The convergence of online and face-to-face education. Promising practices in
online learning. Washington, DC: North American Council for Online Learning. Weiher, G. R., & Tedin, K. L. (2002). Does choice lead to racially distinctive schools? Charter
schools and household preferences. Journal of Policy Analysis and Management, 21(1), 79-92. https://doi.org/10.1002/pam.1041
Wicks, M. (2010). A national primer on K-12 online learning. Version 2. International Association for K-12 Online Learning.
Witte, J. F., Jr. (2000). The market approach to Education. Princeton, NJ: Princeton University Press. Woodworth, J. L., Raymond, M. E., Chirbas, K., Gonzales, M., Negassi, Y., Snow, W., & Van
Dongle, C. (2015). Online charter school study. Stanford, CA: Center for Research on Education Outcomes. Retrieved from https://credo.stanford.edu/pdfs/OnlineCharterStudyFinal2015.pdf
Zimmer, R., & Buddin, R. (2006). Making sense of charter schools: Evidence from California. Occasional Paper. Rand Corporation.

Education Policy Analysis Archives Vol. 25 No. 124 38
About the Authors
Charisse Gulosino University of Memphis [email protected] Charisse Gulosino received her doctorate in education from Columbia University and is currently an Assistant Professor in the Leadership and Policy Studies Program at the University of Memphis. Prior to her current position, Charisse was a Postdoctoral Research Associate and a faculty member of the Alfred Taubman Center for Public Policy and American Institutions at Brown University. She also previously served as a Visiting Scholar in the Department of Education Policy and Social Analysis (EPSA) at Teachers College, Columbia University. Her area of interest is in policies affecting students, their families, teachers, and communities in urban K-12 settings. Gary Miron Western Michigan University [email protected] Gary Miron is professor of evaluation, measurement, and research at Western Michigan University. He has extensive experience evaluating school reforms and education policies. Over the past two decades he has conducted several studies of school choice programs in Europe and in the United States, including nine state evaluations of charter school reforms. In recent years, his research has increasingly focused on the education management organizations (EMOs) and efforts to create systemic change in urban schools in Michigan and rural schools in Louisiana. Prior to coming to Western Michigan University, Dr. Miron worked for 10 years at Stockholm University in Sweden.

Online and blended K-12 public schools 39
education policy analysis archives Volume 25 Number 124 December 18, 2017 ISSN 1068-2341
Readers are free to copy, display, and distribute this article, as long as the work is attributed to the author(s) and Education Policy Analysis Archives, it is distributed for non-commercial purposes only, and no alteration or transformation is made in the work. More details of this Creative Commons license are available at http://creativecommons.org/licenses/by-nc-sa/3.0/. All other uses must be approved by the author(s) or EPAA. EPAA is published by the Mary Lou Fulton Institute and Graduate School of Education at Arizona State University Articles are indexed in CIRC (Clasificación Integrada de Revistas Científicas, Spain), DIALNET (Spain), Directory of Open Access Journals, EBSCO Education Research Complete, ERIC, Education Full Text (H.W. Wilson), QUALIS A1 (Brazil), SCImago Journal Rank, SCOPUS, SOCOLAR (China).
Please send errata notes to Audrey Amrein-Beardsley at [email protected]
Join EPAA’s Facebook community at https://www.facebook.com/EPAAAAPE and Twitter feed @epaa_aape.
Education Policy Analysis Archives Vol. 25 No. 124 40
education policy analysis archives
editorial board
Lead Editor: Audrey Amrein-Beardsley (Arizona State University) Editor Consultor: Gustavo E. Fischman (Arizona State University)
Associate Editors: David Carlson, Margarita Jimenez-Silva, Eugene Judson, Mirka Koro-Ljungberg, Scott Marley, Jeanne M. Powers, Iveta Silova, Maria Teresa Tatto (Arizona State University)
Cristina Alfaro San Diego State University
Gene V Glass Arizona State University
Gloria M. Rodriguez University of California, Davis
Gary Anderson New York University
Ronald Glass University of California, Santa Cruz
R. Anthony Rolle University of Houston
Michael W. Apple University of Wisconsin, Madison
Jacob P. K. Gross University of Louisville
A. G. Rud Washington State University
Jeff Bale OISE, University of Toronto, Canada
Eric M. Haas WestEd Patricia Sánchez University of University of Texas, San Antonio
Aaron Bevanot SUNY Albany Julian Vasquez Heilig California State University, Sacramento
Janelle Scott University of California, Berkeley
David C. Berliner Arizona State University
Kimberly Kappler Hewitt University of North Carolina Greensboro
Jack Schneider College of the Holy Cross
Henry Braun Boston College Aimee Howley Ohio University Noah Sobe Loyola University
Casey Cobb University of Connecticut
Steve Klees University of Maryland Nelly P. Stromquist University of Maryland
Arnold Danzig San Jose State University
Jaekyung Lee SUNY Buffalo
Benjamin Superfine University of Illinois, Chicago
Linda Darling-Hammond Stanford University
Jessica Nina Lester Indiana University
Adai Tefera Virginia Commonwealth University
Elizabeth H. DeBray University of Georgia
Amanda E. Lewis University of Illinois, Chicago
Tina Trujillo University of California, Berkeley
Chad d'Entremont Rennie Center for Education Research & Policy
Chad R. Lochmiller Indiana University
Federico R. Waitoller University of Illinois, Chicago
John Diamond University of Wisconsin, Madison
Christopher Lubienski Indiana University
Larisa Warhol University of Connecticut
Matthew Di Carlo Albert Shanker Institute
Sarah Lubienski Indiana University John Weathers University of Colorado, Colorado Springs
Sherman Dorn Arizona State University
William J. Mathis University of Colorado, Boulder
Kevin Welner University of Colorado, Boulder
Michael J. Dumas University of California, Berkeley
Michele S. Moses University of Colorado, Boulder
Terrence G. Wiley Center for Applied Linguistics
Kathy Escamilla University of Colorado, Boulder
Julianne Moss Deakin University, Australia
John Willinsky Stanford University
Melissa Lynn Freeman Adams State College
Sharon Nichols University of Texas, San Antonio
Jennifer R. Wolgemuth University of South Florida
Rachael Gabriel University of Connecticut
Eric Parsons University of Missouri-Columbia
Kyo Yamashiro Claremont Graduate University
Amy Garrett Dikkers University of North Carolina, Wilmington
Susan L. Robertson Bristol University, UK

Online and blended K-12 public schools 41
archivos analíticos de políticas educativas consejo editorial
Editor Consultor: Gustavo E. Fischman (Arizona State University) Editores Asociados: Armando Alcántara Santuario (Universidad Nacional Autónoma de México), Jason Beech,
(Universidad de San Andrés), Angelica Buendia, (Metropolitan Autonomous University), Ezequiel Gomez Caride, (Pontificia Universidad Católica Argentina), Antonio Luzon, (Universidad de Granada), José Luis Ramírez,
Universidad de Sonora)
Claudio Almonacid Universidad Metropolitana de Ciencias de la Educación, Chile
Ana María García de Fanelli Centro de Estudios de Estado y Sociedad (CEDES) CONICET, Argentina
Miriam Rodríguez Vargas Universidad Autónoma de Tamaulipas, México
Miguel Ángel Arias Ortega Universidad Autónoma de la Ciudad de México
Juan Carlos González Faraco Universidad de Huelva, España
José Gregorio Rodríguez Universidad Nacional de Colombia, Colombia
Xavier Besalú Costa Universitat de Girona, España
María Clemente Linuesa Universidad de Salamanca, España
Mario Rueda Beltrán Instituto de Investigaciones sobre la Universidad y la Educación, UNAM, México
Xavier Bonal Sarro Universidad Autónoma de Barcelona, España
Jaume Martínez Bonafé Universitat de València, España
José Luis San Fabián Maroto Universidad de Oviedo, España
Antonio Bolívar Boitia Universidad de Granada, España
Alejandro Márquez Jiménez Instituto de Investigaciones sobre la Universidad y la Educación, UNAM, México
Jurjo Torres Santomé, Universidad de la Coruña, España
José Joaquín Brunner Universidad Diego Portales, Chile
María Guadalupe Olivier Tellez, Universidad Pedagógica Nacional, México
Yengny Marisol Silva Laya Universidad Iberoamericana, México
Damián Canales Sánchez Instituto Nacional para la Evaluación de la Educación, México
Miguel Pereyra Universidad de Granada, España
Ernesto Treviño Ronzón Universidad Veracruzana, México
Gabriela de la Cruz Flores Universidad Nacional Autónoma de México
Mónica Pini Universidad Nacional de San Martín, Argentina
Ernesto Treviño Villarreal Universidad Diego Portales Santiago, Chile
Marco Antonio Delgado Fuentes Universidad Iberoamericana, México
Omar Orlando Pulido Chaves Instituto para la Investigación Educativa y el Desarrollo Pedagógico (IDEP)
Antoni Verger Planells Universidad Autónoma de Barcelona, España
Inés Dussel, DIE-CINVESTAV, México
José Luis Ramírez Romero Universidad Autónoma de Sonora, México
Catalina Wainerman Universidad de San Andrés, Argentina
Pedro Flores Crespo Universidad Iberoamericana, México
Paula Razquin Universidad de San Andrés, Argentina
Juan Carlos Yáñez Velazco Universidad de Colima, México
José Ignacio Rivas Flores Universidad de Málaga, España

Education Policy Analysis Archives Vol. 25 No. 124 42
arquivos analíticos de políticas educativas conselho editorial
Editor Consultor: Gustavo E. Fischman (Arizona State University) Editoras Associadas: Geovana Mendonça Lunardi Mendes (Universidade do Estado de Santa Catarina),
Marcia Pletsch, Sandra Regina Sales (Universidade Federal Rural do Rio de Janeiro)
Almerindo Afonso
Universidade do Minho
Portugal
Alexandre Fernandez Vaz
Universidade Federal de Santa
Catarina, Brasil
José Augusto Pacheco
Universidade do Minho, Portugal
Rosanna Maria Barros Sá
Universidade do Algarve
Portugal
Regina Célia Linhares Hostins
Universidade do Vale do Itajaí,
Brasil
Jane Paiva
Universidade do Estado do Rio de
Janeiro, Brasil
Maria Helena Bonilla
Universidade Federal da Bahia
Brasil
Alfredo Macedo Gomes
Universidade Federal de Pernambuco
Brasil
Paulo Alberto Santos Vieira
Universidade do Estado de Mato
Grosso, Brasil
Rosa Maria Bueno Fischer
Universidade Federal do Rio Grande
do Sul, Brasil
Jefferson Mainardes
Universidade Estadual de Ponta
Grossa, Brasil
Fabiany de Cássia Tavares Silva
Universidade Federal do Mato
Grosso do Sul, Brasil
Alice Casimiro Lopes
Universidade do Estado do Rio de
Janeiro, Brasil
Jader Janer Moreira Lopes
Universidade Federal Fluminense e
Universidade Federal de Juiz de Fora,
Brasil
António Teodoro
Universidade Lusófona
Portugal
Suzana Feldens Schwertner
Centro Universitário Univates
Brasil
Debora Nunes
Universidade Federal do Rio Grande
do Norte, Brasil
Lílian do Valle
Universidade do Estado do Rio de
Janeiro, Brasil
Flávia Miller Naethe Motta
Universidade Federal Rural do Rio de
Janeiro, Brasil
Alda Junqueira Marin
Pontifícia Universidade Católica de
São Paulo, Brasil
Alfredo Veiga-Neto
Universidade Federal do Rio Grande
do Sul, Brasil
Dalila Andrade Oliveira
Universidade Federal de Minas
Gerais, Brasil