education for people and planet - wikimedia · 2012 youth and skills: putting education to work...
TRANSCRIPT

C R E A T I N G S U S T A I N A B L E F U T U R E S F O R A L L
Education for people and planet:
SustainableDevelopmentGoals
United NationsEducational, Scientific and
Cultural Organization
2016G L O B A L E D U C A T I O N M O N I T O R I N G R E P O R T S U M M A R Y

C R E A T I N G S U S T A I N A B L E F U T U R E S F O R A L L
Education for people and planet:
G L O B A L E D U C A T I O N M O N I T O R I N G R E P O R T S U M M A R Y
2016

4
G L O B A L E D U C A T I O N M O N I T O R I N G R E P O R T 2 0 1 6S U M M A R Y
This Report is an independent publication commissioned by UNESCO on behalf of the international community. It is the product of a collaborative effort involving members of the Report team and many other people, agencies, institutions and governments.
The designations employed and the presentation of the material in this publication do not imply the expression of any opinion whatsoever on the part of UNESCO concerning the legal status of any country, territory, city or area, or of its authorities, or concerning the delimitation of its frontiers or boundaries.
The Global Education Monitoring Report team is responsible for the choice and the presentation of the facts contained in this report and for the opinions expressed therein, which are not necessarily those of UNESCO and do not commit the Organization.
Overall responsibility for the views and opinions expressed in the Report is taken by its Director.
The Global Education Monitoring Report is an independent annual publication. The GEM Report is funded by a group of governments, multilateral agencies and private foundations and facilitated and supported by UNESCO.
The Global Education Monitoring Report teamDirector: Aaron Benavot
Manos Antoninis, Madeleine Barry, Nicole Bella, Nihan Köseleci Blanchy, Marcos Delprato, Glen Hertelendy, Catherine Jere, Priyadarshani Joshi, Katarzyna Kubacka, Leila Loupis, Kassiani
Lythrangomitis, Alasdair McWilliam, Anissa Mechtar, Branwen Millar, Claudine Mukizwa, Yuki Murakami, Taya Louise Owens, Judith Randrianatoavina, Kate Redman, Maria Rojnov, Anna Ewa
Ruszkiewicz, Will Smith, Emily Subden, Rosa Vidarte and Asma Zubairi.
For more information, please contact:Global Education Monitoring Report teamc/o UNESCO, 7, place de Fontenoy75352 Paris 07 SP, FranceEmail: [email protected].: +33 1 45 68 07 41www.unesco.org/gemreporthttps://gemreportunesco.wordpress.com
Any errors or omissions found subsequent to printing will be corrected in the online version at www.unesco.org/gemreport
© UNESCO, 2016All rights reservedFirst editionPublished in 2016 by the United Nations Educational,Scientific and Cultural Organization
7, Place de Fontenoy, 75352 Paris 07 SP, France
Typeset by UNESCOGraphic design by FHI 360Layout by FHI 360Comic book illustrations by Toby Morris
New Global Education Monitoring Report series2016 Education for people and planet: Creating sustainable futures for all
EFA Global Monitoring Report series2015 Education for All 2000-2015: Achievements and challenges2013/4 Teaching and learning: Achieving quality for all2012 Youth and skills: Putting education to work2011 The hidden crisis: Armed conflict and education2010 Reaching the marginalized2009 Overcoming inequality: Why governance matters2008 Education for All by 2015: Will we make it?2007 Strong foundations: Early childhood care and education2006 Literacy for life2005 Education for All: The quality imperative2003/4 Gender and Education for All: The leap to equality2002 Education for All: Is the world on track?
Cover and back cover photos: Fadil Aziz/Alcibbum Photography
The cover photos are of school children from the Palau Papan Island in the archipelago of Togean in Sulawesi, Indonesia. The children, from the Bajo tribe, live in stilt houses and cross a bridge spanning 1.8 kilometres to the neighbouring island of Melange to go to school every day.

5
S U M M A R YG L O B A L E D U C A T I O N M O N I T O R I N G R E P O R T 2 0 1 6
ForewordIn May 2015, the World Education Forum in Incheon (Republic of Korea), brought together 1,600 participants from 160 countries with a single goal in mind: how to ensure inclusive and equitable quality education and lifelong learning for all by 2030?
The Incheon Declaration for Education 2030 has been instrumental to shape the Sustainable Development Goal on Education to “Ensure inclusive and equitable quality education and promote lifelong learning opportunities for all”.
It entrusts UNESCO with the leadership, coordination and monitoring of the Education 2030 agenda. It also calls upon the Global Education Monitoring (GEM) Report to provide independent monitoring and reporting of the Sustainable Development Goal on education (SDG 4), and on education in the other SDGs, for the next fifteen years.
The ultimate goal of this agenda is to leave no one behind. This calls for robust data and sound monitoring. The 2016 edition of the GEM Report provides valuable insight for governments and policy makers to monitor and accelerate progress towards SDG 4, building on the indicators and targets we have, with equity and inclusion as measures of overall success.
This Report makes three messages starkly clear.
Firstly, the urgent need for new approaches. On current trends only 70% of children in low income countries will complete primary school in 2030, a goal that should have been achieved in 2015. We need the political will, the policies, the innovation and the resources to buck this trend.
Secondly, if we are serious about SDG 4, we must act with a sense of heightened urgency, and with long-term commitment. Failure to do so will not only adversely affect education but will hamper progress towards each and every development goal: poverty reduction, hunger eradication, improved health, gender equality and women’s empowerment, sustainable production and consumption, resilient cities, and more equal and inclusive societies.
Lastly, we must fundamentally change the way we think about education and its role in human well-being and global development. Now, more than ever, education has a responsibility to foster the right type of skills, attitudes and behavior that will lead to sustainable and inclusive growth.
The 2030 Agenda for Sustainable Development calls on us to develop holistic and integrated responses to the many social, economic and environmental challenges we face. This means reaching out beyond traditional boundaries and creating effective, cross-sectoral partnerships.
A sustainable future for all is about human dignity, social inclusion and environmental protection. It is a future where economic growth does not exacerbate inequalities but builds prosperity for all; where urban areas and labour markets are designed to empower everyone and economic activities, communal and corporate, are green-oriented. Sustainable development is a belief that human development cannot happen without a healthy planet. Embarking upon the new SDG agenda requires all of us to reflect upon the ultimate purpose of learning throughout life. Because, if done right, education has the power like none else to nurture empowered, reflective, engaged and skilled citizens who can chart the way towards a safer, greener and fairer planet for all. This new report provides relevant evidence to enrich these discussions and craft the policies needed to make it a reality for all.
Irina BokovaDirector-General of UNESCO

6
G L O B A L E D U C A T I O N M O N I T O R I N G R E P O R T 2 0 1 6S U M M A R Y
Foreword
The 2016 Global Education Monitoring Report (GEM Report) is both masterful and disquieting. This is a big report: comprehensive, in-depth and perspicacious. It is also an unnerving report. It establishes that education is at the heart of sustainable development and the Sustainable Development Goals (SDGs), yet it also makes clear just how far away we are from achieving the SDGs. This report should set off alarm bells around the world and lead to a historic scale-up of actions to achieve SDG 4.
The GEM Report provides an authoritative account of how education is the most vital input for every dimension of sustainable development. Better education leads to greater prosperity, improved agriculture, better health outcomes, less violence, more gender equality, higher social capital and an improved natural environment. Education is key to helping people around the world understand why sustainable development is such a vital concept for our common future. Education gives us the key tools – economic, social, technological, even ethical – to take on the SDGs and to achieve them. These facts are spelled out in exquisite and unusual detail throughout the report. There is a wealth of information to be mined in the tables, graphs and texts.
Yet the report also emphasizes the remarkable gaps between where the world stands today on education and where it has promised to arrive as of 2030. The gaps in educational attainment between rich and poor, within and between countries, are simply appalling. In many poor countries, poor children face nearly insurmountable obstacles under current conditions. They lack books at home; have no opportunity for pre-primary school; and enter facilities without electricity, water, hygiene, qualified teachers, textbooks and the other appurtenances of a basic education, much less a quality education. The implications are staggering. While SDG 4 calls for universal completion of upper secondary education by 2030, the current completion rate in low-income countries is a meagre 14% (Table 10.3 of the full report).
The GEM Report undertakes an important exercise to determine how many countries will reach the 2030 target on the current trajectory, or even on a path that matches the fastest improving country in the region. The answer is sobering: we need unprecedented progress, starting almost immediately, in order to have a shot at success with SDG 4.
Cynics might say, ‘We told you, SDG 4 is simply unachievable’, and suggest that we accept that ‘reality’. Yet as the report hammers home in countless ways, such complacency is reckless and immoral. If we leave the current young generation without adequate schooling, we doom them and the world to future poverty, environmental ills, and even social violence and instability for decades to come. There can be no excuse for complacency. The message of this report is that we need to get our act together to accelerate educational attainment in an unprecedented manner.
One of the keys for acceleration is financing. Here again, the report makes for sobering reading. Development aid for education today is lower than it was in 2009 (Figure 20.7 of the full report). This is staggeringly short-sighted of the rich countries. Do these donor countries really believe that they are ‘saving money’ by underinvesting in aid for education in the world’s low-income countries? After reading this report, the leaders and citizens in the high income world will be deeply aware that investing in education is fundamental for global well-being, and that the current level of aid, at around US$5 billion per year for primary education – just US$5 per person per year in the rich countries! – is a tragically small investment for the world’s future sustainable development and peace.

7
S U M M A R YG L O B A L E D U C A T I O N M O N I T O R I N G R E P O R T 2 0 1 6
The 2016 GEM Report provides a plethora of insights, recommendations and standards for moving forward. It offers invaluable suggestions on how to monitor and measure progress on SDG 4. It demonstrates by example the feasibility of far more refined measures of education inputs, quality and achievement than the often crude measures of enrolment and completion that we rely on today. Using big data, better survey tools, facility monitoring and information technology, we can get far more nuanced measures of the education process and outcomes at all levels.
Fifteen years ago the world finally recognized the enormity of the AIDS epidemic and other health emergencies and took concrete steps to scale up public health interventions in the context of the Millennium Development Goals. Thus were born major initiatives such as the Global Fund to Fight AIDS, Tuberculosis and Malaria, the Global Alliance for Vaccines and Immunisation (now Gavi, the Vaccine Alliance) and many other examples. These efforts led to a dramatic upturn in public health interventions and funding. While it did not achieve all that was possible (mainly because the 2008 financial crisis ended the upswing in public health funding) it did lead to many breakthroughs whose effects continue to be felt today.
The 2016 GEM Report should be read as a similar call to action for education as the core of the SDGs. My own view, often repeated in the past couple of years, is the urgency of a Global Fund for Education that builds on the positive lessons of the Global Fund for AIDS, Tuberculosis and Malaria. The financing constraint lies at the very heart of the education challenge, as this report makes vividly clear through every bit of cross-national and household-based data.
This compelling document calls on us to respond to the opportunity, urgency and declared global goal embodied in SDG 4: universal education of good quality for all and opportunities for learning throughout life. I urge people everywhere to study this report carefully and take its essential messages to heart. Most importantly, let us act on them at every level, from the local community to the global community.
Jeffrey D. Sachs Special Adviser to the UN Secretary-General on the
Sustainable Development Goals

8
G L O B A L E D U C A T I O N M O N I T O R I N G R E P O R T 2 0 1 6S U M M A R Y
2016 Global Education Monitoring Report SummaryINTRODUCTIONAt the 70th Session of the United Nations General Assembly in September 2015, member states adopted a new global development agenda, Transforming our world: the 2030 Agenda for Sustainable Development. At its heart are 17 Sustainable Development Goals (SDGs), including SDG 4 on education. The SDGs establish development priorities to 2030 and succeed both the Millennium Development Goals and the Education for All (EFA) goals, whose deadlines expired in 2015.
The Global Education Monitoring Report (GEM Report), which builds on the experience of the previous EFA Global Monitoring Report series, received a new mandate to assess the progress of education under the 2030 Agenda. The 2016 GEM Report, the first of the new 15-year series, explores the complex relationship between education and other facets of sustainable development, along with the monitoring implications for SDG 4. It shows that education will not deliver its full potential to catapult the world forward unless school participation rates dramatically improve, learning becomes a lifelong pursuit and education systems fully embrace sustainable development.
The thematic part of the report highlights evidence, practices and policies that demonstrate how education can serve as a catalyst for the overall sustainable development agenda. It presents compelling arguments for the types of education that are vital for achieving the goals of poverty reduction, hunger
eradication, improved health, gender equality and empowerment, sustainable agriculture, resilient cities and more equal, inclusive and just societies.
The monitoring part tackles the many challenges concerning how to assess progress on SDG 4, including concrete recommendations for policy change. Each of the seven education targets and three means of implementation in SDG 4 are examined in turn. In addition, education finance and education systems are analysed, as is the extent to which education can be monitored in the other SDG goals. Building blocks and potential synergies for a more effective and efficient global education monitoring agenda over the next 15 years are identified at the national, regional and international levels.
TABLE 1:How education is typically linked with other Sustainable Development Goals
Goal 1 Education is critical to lifting people out of poverty. Goal 10 Where equally accessible, education makes a proven difference to social and economic inequality.
Goal 2 Education plays a key role in helping people move towards more sustainable farming methods, and in understanding nutrition.
Goal 11 Education can give people the skills to participate in shaping and maintaining more sustainable cities, and to achieve resilience in disaster situations.
Goal 3 Education can make a critical difference to a range of health issues, including early mortality, reproductive health, spread of disease, healthy lifestyles and well-being.
Goal 12 Education can make a critical difference to production patterns (e.g. with regard to the circular economy) and to consumer understanding of more sustainably produced goods and prevention of waste.
Goal 5 Education for women and girls is particularly important to achieve basic literacy, improve participative skills and abilities, and improve life chances.
Goal 13 Education is key to mass understanding of the impact of climate change and to adaptation and mitigation, particularly at the local level.
Goal 6 Education and training increase skills and the capacity to use natural resources more sustainably and can promote hygiene.
Goal 14 Education is important in developing awareness of the marine environment and building proactive consensus regarding wise and sustainable use.
Goal 7 Educational programmes, particularly non-formal and informal, can promote better energy conservation and uptake of renewable energy sources.
Goal 15 Education and training increase skills and capacity to underpin sustainable livelihoods and to conserve natural resources and biodiversity, particularly in threatened environments.
Goal 8 There is a direct link among such areas as economic vitality, entrepreneurship, job market skills and levels of education.
Goal 16 Social learning is vital to facilitate and ensure participative, inclusive and just societies, as well as social coherence.
Goal 9 Education is necessary to develop the skills required to build more resilient infrastructure and more sustainable industrialization.
Goal 17 Lifelong learning builds capacity to understand and promote sustainable development policies and practices.
Source: ICSU and ISSC (2015).
Education will not deliver its full potential to catapult the world forward unless participation rates dramatically improve, learning becomes a lifelong pursuit and education systems fully embrace sustainable development

9
S U M M A R YG L O B A L E D U C A T I O N M O N I T O R I N G R E P O R T 2 0 1 6
Children use the blackboard to lean on in the Dan Saa school, Niger.
9
CREDIT: Tagaza Djibo/UNESCO

10

11
S U M M A R YG L O B A L E D U C A T I O N M O N I T O R I N G R E P O R T 2 0 1 6
Education and sustainable development: how they are linked and why these links are important
Planet: environmental sustainability
Individual and collective human actions have put immense strain on the planet and the life forms it supports. Since humanity is clearly contributing to environmental degradation, rapid biodiversity loss and climate change, its
actions must also provide the solutions to these challenges.
Education can play a major part in the required transformation into more environmentally sustainable societies, in concert with initiatives from government, civil society and the private sector. Education shapes values and perspectives. It also contributes to the development of skills, concepts and tools that can be used to reduce or stop unsustainable practices.
Education’s multifaceted role in sustainability is not always positive. It can contribute to unsustainable practices, including overconsumption of resources, and exacerbate the loss of relatively sustainable indigenous knowledge and ways of living. Education may need to be shaped and transformed to ensure its impact is positive.
HUMAN BEHAVIOUR HAS LED TO AN ENVIRONMENTAL CRISISThree of the most common understandings of how human behaviour leads to environmental degradation involve demography, modern lifestyles and individual behaviour. The demographic explanation is that there are simply too many people on the planet: the global population tripled between 1950 and 2015, and is expected to grow by another billion to 8.5 billion by 2030. The modern lifestyles concept focuses on higher per capita resource consumption by people in urban areas and wealthier countries. Countries where living standards have rapidly increased have seen a near doubling of their ecological footprint in the past two decades. In 2012, most high income countries had an unsustainable ecological footprint. The individual behaviour explanation sees individuals as both the source of environmental problems and their potential solution through, for example, policies that encourage recycling, bicycle use and fuel-efficient cars.
LEARNING IS ESSENTIAL TO OVERCOME THESE CHALLENGESEducation has a key role to play in addressing environmental challenges. Education, especially of girls and women, is the most effective means of curtailing population growth, increasing women’s autonomy over fertility-related decisions and the timing of pregnancies. Education can improve livelihoods by increasing earnings, and skilled people
are essential to the transformation of economies and food systems. Education can influence individual and collective environmental behaviour through contemporary, traditional and lifelong approaches to learning.
CONTEMPORARY APPROACH: LEARNING THROUGH SCHOOLINGSchools help students understand a given environmental problem, its consequences and the types of action required to address it. Knowledge about the environment is increasingly incorporated into formal school curricula. Analysis of 78 national curricula shows that 55% use the term ‘ecology’ and 47% ‘environmental education’.
Analysis of 78 national curricula show that 55% use the term ‘ecology’ and 47% ‘environmental education’

12
G L O B A L E D U C A T I O N M O N I T O R I N G R E P O R T 2 0 1 6S U M M A R Y
In India, for example, following a Supreme Court ruling, government agencies in 2003 started producing extensive content on environmental education, which has resulted in over 300 million students in 1.3 million schools receiving some environmental education training.
Environmental education encourages sustainable lifestyles, waste reduction, improved energy use, increased public transport use, support for pro-environment policies, and environmental activism. In Estonia and Sweden, where sustainable development is part of the curriculum, students were more likely than their peers in countries without such content to give correct answers on environmental science in the 2006 Programme for International Student Assessment. Some schools have adopted a ‘whole school’ approach to environmental education. Research on such schools in England (United Kingdom) show improvements in the schools’ ethos and students’ health and learning, and reductions in the schools’ ecological footprints.
TRADITIONAL APPROACH: LEARNING THROUGH COMMUNITYTraditional – especially indigenous – knowledge in such areas as agriculture, food production and conservation has played an important role in environmental sustainability for centuries. Numerous examples of indigenous communities’ traditional land management practices are becoming recognized globally as excellent approaches for conserving biodiversity and maintaining ecosystem processes. In Colombia, the Council of Sustainable Settlements of the Americas is putting into practice the concept of buen vivir (living well), which recognizes the contribution of indigenous communities, for example in urban eco-barrio projects, traditional sustainable villages and sustainability education centres.
FIGURE 1:High levels of human development have come at an ecological costTotal ecological footprint by Human Development Index, by country, 2012
Caucasus and Central Asia
Eastern and South-eastern Asia
Europe and Northern America
Latin America and the Caribbean
Northern Africa and Western Asia
Pacific
Southern Asia
Sub-Saharan Africa
Ecol
ogic
al fo
otpr
int (
hect
ares
per
cap
ita)
7
6
5
0
4
2
3
1
0
10
9
8
0.2 0.4 0.6 0.8 1Human Development Index
An ecological footprint of less than 1.7 global hectares per person, given current population and available productive land and sea area (biocapacity), is sustainable; the earth can replenish a country’s resource use.
The Human Development Index (HDI, by the UN Development Programme) measures a country’s average achievements in health, knowledge and standard of living. An HDI value of 0.8 or more indicates very high human development.
Singapore’s high HDI (0.91) is associated with a large ecological footprint per capita (7.97). This means that people in Singapore, although living a good life, also have high resource demand.
Unsustainable ecological footprint
Sustainable ecological footprint
World biocapacity per person in 1961
High HDI
World biocapacity per person in 2011
Eritrea Timor-Leste
Rep. of Korea
Singapore
Australia
Very High HDI
Source: GEM Report team analysis based on data from Global Footprint Network (2016).

13
S U M M A R YG L O B A L E D U C A T I O N M O N I T O R I N G R E P O R T 2 0 1 6
Local and indigenous knowledge have contributed to ecosystem functioning, disaster early warning systems, and climate change adaptation and resilience. The Alaska Rural Systemic Initiative in the United States, in which students interact with indigenous elders, is an example of schools learning from indigenous knowledge. Providing school instruction in local languages also contributes to knowledge sharing between generations.
LIFELONG LEARNING APPROACH: LEARNING THROUGH WORK AND DAILY LIFEBeyond formal education, government agencies, religious organizations, non-profit and community groups, labour organizations and the private sector can all help change individual and collective behaviour.
Government-backed campaigns can raise awareness of an environmental problem, point to its causes and signal how people can solve it. In 2015, the Ethiopian government and partners launched a two-year public awareness campaign aimed at encouraging solar lighting products.
Religious, cultural and social leaders can help spread environmentally sound values and behaviour.
Workplace is essential centre for environmental learning. Companies have launched initiatives to reduce their ecological footprints and educate staff and the public about environmental protection. A 2008 Economist Intelligence Unit survey reported that over 40% of global executives thought it important for their companies to align sustainability with their business. Labour organizations have also promoted more sustainable workplace practices.
Through public information campaigns, projects, partnerships and green alliances, non-government organizations (NGOs) play a vital part in mobilizing public support for conservation. Web-based campaign groups such as Avaaz, which has 44 million members in 194 countries, help raise awareness on the environment with initiatives such as a two-year campaign to ban bee-killing pesticides.
COPING WITH CLIMATE CHANGE REQUIRES AN INTEGRATED APPROACH TO LEARNINGEducation enhances people’s resilience to climate-related risks. It also encourages their support for and involvement in mitigation actions. Broadening access to education is more effective against climate change effects than investment in infrastructure such as sea walls and irrigation systems. Female education reduces disaster-related fatalities.
Projections show that if education progress stalled, future disaster-related fatalities would increase by 20% per decade. Communities most at risk from climate-related events are generally in countries where educational attainment is low and unequal.
Education can help communities prepare for and adapt to climate-related disasters. A study on Cuba, the Dominican Republic and Haiti found that lack of education and low literacy rates prevented people from understanding disaster warnings. In the Philippines, local communities worked with education officials and other partners to teach young people about climate change adaptation, which helps build community resilience.
If education progress stalled, future disaster-related fatalities would increase by 20% per decade

14

15
S U M M A R YG L O B A L E D U C A T I O N M O N I T O R I N G R E P O R T 2 0 1 6
Prosperity: sustainable and inclusive economies
The world economy needs to become environmentally sustainable and inclusive if the 2030 Agenda is to succeed. Education has a key role in this transformation.
Education and lifelong learning are needed to make production and consumption sustainable, supply skills for the creation of green industry and orient higher education and research towards green innovation. They also have a part to play in transforming key economic sectors, such as agriculture, upon which both rich and poor countries and households rely.
Just as the economy must become sustainable, so too must it become more inclusive and less unequal. Education of good quality can contribute to these aims. A better-educated labour force is essential to inclusive economic growth focused on human welfare. Education reduces poverty by increasing chances of finding decent work and adequate earnings, and helps close wage gaps due to gender, socio-economic status and other bases of discrimination.
THE GREENING OF INDUSTRY WILL INCREASE DEMAND FOR SKILLSSustainable development and green growth mean creating green industries and ‘greening’ existing ones. Green industries already employ large numbers of workers, and are expected to grow significantly in lower income countries. For instance, renewable sources may account for almost half the total increase in global electricity generation between 2015 and 2040, with growth especially in China, India, Latin America and Africa.
Creating green industries relies on high-skill workers with specific higher education and training; greening existing industries requires continuing education and training for low- and medium-skill workers, often on the job. Policy-makers and educators face the challenge of defining which skills to teach, as economies undergo rapid change.
Sustainability and green growth require substantial increases in research and development investment. For higher education systems to provide enough people with specialist knowledge and skills in a wide range of fields, diverse and specific curricula are needed, along with cooperative study programmes across fields. The International Energy Agency estimates that governments need to increase energy research and development by up to fivefold annually to achieve a quick transition to low carbon intensity.
EDUCATION CAN HELP TRANSFORM AGRICULTUREAgriculture worldwide faces an unprecedented challenge over 2015–2030. It is one of the economic sectors most directly affected by environmental degradation and it is responsible for a third of greenhouse gas emissions.
Meanwhile, population growth requires a huge but sustainable increase in food production and more equitable distribution of food supplies.
Education is vital for sustainable food production. Primary and secondary education give future farmers foundation skills as well as critical knowledge about sustainability challenges in agriculture. Vocational training and skills policies bridge the gap between farmers and new technology. Literacy and agricultural extension programmes can help farmers increase productivity. Agricultural research connected with tertiary education helps produce innovation leading to increased sustainability. Yet many
countries and donors have halted or reduced investment in such research. Notably, the share of sub-Saharan Africa in global expenditure on public agricultural research declined from 10% in 1960 to 6% in 2009.
EDUCATION AND LIFELONG LEARNING CONTRIBUTE TO LONG-TERM ECONOMIC GROWTHIncreased levels of primary and secondary education contribute to long-term economic growth. Initial levels of educational attainment explain about half the difference in growth rates between East Asia and sub-Saharan Africa
Literacy and agricultural extension programmes can help farmers increase productivity by up to 12%

16
G L O B A L E D U C A T I O N M O N I T O R I N G R E P O R T 2 0 1 6S U M M A R Y
between 1965 and 2010. Good quality education and highly skilled workers foster productivity gains and technological change. Differences in the quality of education systems help explain the East Asian ‘miracle’ in economic growth and Latin America’s ‘lost decades’. For countries to prosper, investment in good quality secondary and tertiary education is a must. This is particularly true of sub-Saharan Africa, where the gross enrolment ratio in tertiary education was just 8% in 2014.
If education is to continue to drive growth, it must keep up with the rapidly changing world of work. Technology has not only raised demand for high-skill workers but has also reduced demand for medium-skill jobs, such as clerical and
sales workers and machine operators, whose tasks are more easily automated. This could affect millions in the future: In 2015, slightly less than two-thirds of total employment was in medium-skill occupations.
Evidence suggests that most education systems are not keeping up with market demand. By 2020, the world could have 40 million too few workers with tertiary education relative to demand, and up to 95 million too many at lower education levels.
Skills and competences promoted by general, comprehensive education – critical thinking, problem solving, team and project work, and solid literacy, communication and
presentation skills – are likely to remain valued in the labour market. Acquiring a range of transferable and foundation skills is therefore extremely important for future employment. The challenge for education systems is how to impart them to students most effectively.
EDUCATION CAN SUPPORT SOCIAL INCLUSIONEducation is essential in ensuring that economic growth is sustainable and does not leave anyone behind. Education drives growth, increases the incomes of the poorest and, if equitably distributed, reduces inequality. If 10 recent European Union (EU) member states meet 2020 targets to cut early school leaving and increase tertiary participation, it could reduce the number of those at risk of poverty by 3.7 million.
However, increases in training and skills have not always translated evenly into reduced social inequality. Alongside efforts to equitably expand education, governments need to focus on redistributive social policies to help reverse the trend of widening income inequality within countries.
EDUCATION IMPROVES LABOUR MARKET OUTCOMESUnemployment rates are lower among the more educated, particularly in richer countries. In the Organisation for Economic Co-operation and Development (OECD), only 55% of adults aged 25 to 64 with less than an upper secondary education were employed in 2013, compared with 73% of those with an upper secondary or non-tertiary education and 83% with a tertiary qualification. In poorer countries, this relationship often weakens among youth, suggesting that the demand for skilled labour is comparatively lower and that education systems are not equipping students with relevant skills.
Reducing education disparity can increase access to decent work among disadvantaged groups. Analysis conducted for the 2016 GEM Report suggests that if workers from advantaged and more disadvantaged social backgrounds had the same education, disparity in working poverty could reduce by 39%.
Education is clearly linked with earnings – across 139 countries, the rate of return per additional year of schooling is 9.7%. Rates of return are highest in poorer countries that lack skilled workers. However, ensuring that students benefit the most from higher attainment requires that education investments are accompanied by economic policies that increase demand for skilled labour.
By 2020, the world could have 40 million too few workers with tertiary education relative to demand

S U M M A R YG L O B A L E D U C A T I O N M O N I T O R I N G R E P O R T 2 0 1 6
17
While green growth offers many opportunities for expanding employment, job losses are inevitable when environmentally unsustainable industries close. Expanded lifelong learning policies are needed to promote education and training programmes enabling displaced workers to shift into new jobs.
FIGURE 2:Increasing levels of education are associated with lower working poverty Working poverty (below 50% of median weekly earnings) by education level in 12 low and middle income countries
45
40
35
30
25
20
15
10
5
0
Wor
king
pov
erty
(%)
Yunn
an p
rovi
nce
(Chi
na)
Keny
a
Ukra
ine*
Viet
Nam
TFYR
Mac
edon
ia*
Sri L
anka
Lao
PDR
Arm
enia
*
Boliv
ia
Ghan
a
Colo
mbi
a
Geor
gia*
Pool
ed
Primary or less
Lower secondary
Upper secondary/ post-secondary non-tertiary
Tertiary
*Levels of education were excluded due to low number of observations. Note: Sample is for urban areas. Sample restricted to full-time workers (at least 30 hours per week) aged 15–64. Source: GEM Report team calculations based on World Bank STEP Skills Measurement Surveys (2012–2013).
A man stands in a crop of cassava that is being cultivated using an improved technique in Boukoko, Central African Republic.
CREDIT: Riccardo Gangale/FAO

18

19
S U M M A R YG L O B A L E D U C A T I O N M O N I T O R I N G R E P O R T 2 0 1 6
People: inclusive social development
Social development leads to improvements in human well-being and equality and is compatible with democracy and justice. Education is a powerful enabler, and a key aspect, of social development. It is central to ensuring people
can live healthy lives and improve their children’s lives. It can enhance gender equality by empowering vulnerable populations, a majority of whom are girls and women.
Education is interlinked with other sectors, just as health, nutrition, water and energy sources are central to education. Children’s health determines their ability to learn, health infrastructure can be used to deliver education, and healthy teachers are indispensable to education sector functioning.
Ultimately, a holistic approach to human development is needed to address multidimensional poverty challenges.
INCLUSIVE SOCIAL DEVELOPMENT IS CRITICAL TO SUSTAINABLE FUTURES FOR ALLInclusive social development requires universal provision of critical services such as education, health, water, sanitation, energy, housing and transport, which is far from the case at present. Despite progress, substantive gender
equality also remains elusive in most countries – for example, women do at least twice as much unpaid work as men, and often work in the informal sector.
Inclusive social development demands addressing entrenched marginalization and discrimination against women, people with disabilities, indigenous populations, ethnic and linguistic minorities, refugees and displaced populations, among other vulnerable groups. To change discriminatory norms and empower women and men, education and the knowledge it conveys can be improved to influence values and attitudes.
Many groups are marginalized in terms of education access and quality, including racial, ethnic and linguistic minorities, people with disabilities, pastoralists, slum dwellers, children with HIV, ‘unregistered’ children and orphans. Differences in income, location, ethnicity and gender account for patterns of educational marginalization within countries. Poverty is by far the greatest barrier to education. Among 20- to 24-year-olds in 101 low and middle income countries, the poorest have on average 5 years fewer schooling than the richest; the gap is 2.6 years between urban and rural dwellers, and 1.1 year between women and men.
These factors often overlap. For instance, females from poor, ethnically or spatially marginalized backgrounds often fare substantially worse than their male counterparts. In a majority of countries, less than half of poor rural females have basic literacy skills. In countries such as Afghanistan, Benin, Chad, Ethiopia, Guinea, Pakistan and South Sudan, where disparities are extreme, the poorest young women have attained less than a single year of schooling.
EDUCATION IMPROVES SOCIAL DEVELOPMENT OUTCOMESEducation can improve social development outcomes across a range of areas, notably health and women’s status. It provides specific skills and knowledge on health and nutrition, changing behaviour in ways that improve medical conditions. In India, Indonesia, Paraguay and the United Republic of Tanzania, poor, less educated patients had access to less competent doctors.
School-based interventions, such as meals and health campaigns, can have an immediate impact on health. Conversely, meals in schools may increase attendance. In northern rural Burkina Faso, daily school lunches and a take-home ration increased female enrolment by five to six percentage points after one year.
School-based interventions can provide information on health and lead to behavioural change. Many water, sanitation and hygiene interventions in schools improve health and economic and gender equity. In Finland, school meals are viewed as an investment in learning and a way to teach long-lasting eating habits and promote awareness of food choices.
Women do at least twice as much unpaid work as men

20
G L O B A L E D U C A T I O N M O N I T O R I N G R E P O R T 2 0 1 6S U M M A R Y
Individuals and societies benefit when girls and women receive better quality education. Education broadens women’s employment opportunities. Literacy skills help women gain access to information about social and legal rights and welfare services. Education can increase women’s political engagement by imparting skills that enable them to participate in democratic processes. Low levels of education are a significant risk factor in intimate partner violence.
More educated mothers are better able to feed their children well and keep them in good health. Mothers’ education also has powerful intergenerational effects, changing family preferences and social norms. Four extra years in school in Nigeria was estimated to reduce fertility rates by one birth per girl. Short-term education supporting mothers of young children can have a significant impact on health and nutrition. Targeted non-formal education may be effective in helping women plan childbirth.
Education can reduce maternal mortality. Increasing female education from zero to 1 year would prevent 174 maternal deaths per 100,000 births.
SOCIAL DEVELOPMENT INFLUENCES EDUCATION
Just as education has positive effects on social development, social development affects education, both positively and – where not inclusive – negatively. Health and nutrition form a foundation for education systems: They condition children’s ability to attend school and learn, and their families’ ability to support them. In Kenya, girls who received deworming treatment were 25% more likely to pass the national primary school exit exam. Living conditions in early childhood set the stage for learning. Access to quality health care for teachers can reduce teacher absenteeism and attrition.
Access to water, sanitation, hygiene and energy has a positive influence on education. In Ghana, halving water fetching time increased school attendance among girls, especially in rural areas. In rural Peru, as the number of households with access to electricity increased from 7.7% in 1993 to 70% in 2013, children’s studying time rose by 93 minutes a day.
INTEGRATED SOCIAL AND EDUCATION INTERVENTIONS ARE NEEDED
Progress in gender parity in education has not systematically translated to gender equality. For example, in Asian countries such as Japan and the Republic of Korea, while women’s education has risen,
female labour force participation remains limited despite demand for educated labour due to an ageing workforce. Similarly, sustained health-related behaviour change is not possible with education interventions alone.
Four extra years in school in Nigeria was estimated to reduce fertility rates by one birth per girl
FIGURE 3:There has been progress in improving basic education and health outcomes and providing essential basic services, but major challenges remainAccess to basic services, and health and education outcome improvements, 2000 and latest year
0
2000latest year
20 40 60 80 100 120 140 160
Gros
s in
take
ra
tio to
the
last
gra
de
of p
rimar
y sc
hool
(%) Low income
Lower middle incomeUpper middle income
High incomeLow income
Lower middle incomeUpper middle income
High incomeLow income
Lower middle incomeUpper middle income
High incomeLow income
Lower middle incomeUpper middle income
High incomeLow income
Lower middle incomeUpper middle income
High incomeLow income
Lower middle incomeUpper middle income
High income
Unde
r-5
mor
talit
y ra
te
(per
1,00
0)
Popu
latio
n w
ith a
cces
s to
non
-sol
id
fuel
(%)
Popu
latio
n w
ith a
cces
s
to e
lect
ricity
(%
)
Popu
latio
n w
ith a
cces
s to
impr
oved
w
ater
sou
rce
(%)
Popu
latio
n w
ith a
cces
s to
impr
oved
sa
nita
tion
faci
litie
s (%
)
Notes: The ‘latest year’ is 2012 for access to non-solid fuels and access to electricity, 2014 for gross intake ratio to the last grade of primary education, and 2015 for under-5 mortality rate and access to water and sanitation facilities. Sources: UIS database and World Bank (2016).

S U M M A R YG L O B A L E D U C A T I O N M O N I T O R I N G R E P O R T 2 0 1 6
21
These patterns underscore the need for broader interventions and policies that integrate education with actions such as legislative change or workforce policies. Social protection programmes that seek to reduce risk and vulnerability – such as pensions, cash transfers and microfinance – can have outcomes in multiple areas, from lessening poverty to improving access to education. For instance, family-friendly policies and flexible work arrangements can encourage continued female labour force participation.
Addressing deep-set gender bias through programmes that bring men and women together can be effective. In Brazil, Program H includes group education sessions, youth-led campaigns and activism to transform gender stereotypes among young men; it has been adopted in over 20 countries.
Selina Akter, second year midwifery student, plays the role of a mother as students practise postnatal care at the Dinajpur nursing institute in Bangladesh.
CREDIT: Nicolas Axelrod/Ruom

22

23
S U M M A R YG L O B A L E D U C A T I O N M O N I T O R I N G R E P O R T 2 0 1 6
Peace: political participation, peace and access to justice
Persistent violence and armed conflict undermine personal security and well-being. Preventing violence and achieving sustainable peace require democratic and representative institutions and well-functioning justice
systems. Education is a key element in political participation, inclusion, advocacy and democracy. While education can contribute to conflict, it can also reduce or eliminate it. Education can play a vital role in peacebuilding and help address the alarming consequences of its neglect. Education initiatives, in particular driven by civil society organizations, can help marginalized populations gain access to justice.
EDUCATION AND LITERACY MAKE POLITICS MORE PARTICIPATORYEducation increases knowledge about key political leaders and the workings of political systems. Individuals need information and skills to register to vote, understand the stakes and take an interest in election results. In western Kenya, a scholarship programme targeting girls from politically marginalized ethnic groups led to increased secondary school participation and boosted their political knowledge. In Pakistan, a voter-awareness campaign before the 2008 elections increased women’s likelihood of voting by 12 percentage points. In Nigeria, an anti-violence campaign before the 2007 elections reduced intimidation and led to 10% higher voter turnout.
Better education can also help people be more critically minded and politically engaged, and can increase representation by marginalized groups. Students are more likely to engage in politics with well-designed civics education and an open learning environment that supports discussion of controversial topics and allows students to hear and express differing opinions. A study of 35 countries showed that openness in classroom discussion led to an increase in the intention to participate in politics. In Israel and Italy, an open, participatory classroom climate has been shown to help students become more civically and politically involved.
Better education and women’s involvement in national and local decision-making bodies are closely linked. Greater representation of women in politics and public office can reduce gender disparity in education by providing positive role models for women and increasing their educational aspirations. Across India’s 16 biggest states, increasing the number of women involved in district politics by 10% would lead to a nearly 6% rise in primary school completion, with a larger impact on girls’ education.
Education makes it more likely that discontented citizens will channel their concerns through non-violent civil movements such as protests, boycotts, strikes, rallies, political demonstrations, social non-cooperation and resistance. Across 106 countries over 55 years, ethnic groups with more education were more likely to engage in non-violent protests.
Broad and equitable access to good quality education helps sustain democratic practices and institutions. Higher literacy levels accounted for half the regime transitions towards democracy between 1870 and 2000.
EDUCATION AND CONFLICT: A COMPLEX RELATIONSHIPThe poverty, unemployment and hopelessness resulting from the lack of a good education can act as recruiting agents for armed militia. In Sierra Leone, young people with no education were nine times as likely to join rebel groups as those with at least secondary education. Inequality in education exacerbates the issue. Data from 100 countries over 50 years found that those with wider education gaps were more likely to be in conflict. Yet more education is not a panacea: When education levels rise but labour markets are stagnant, frustration can boil over.
Schools that inculcate prejudice, intolerance and historical distortions can become breeding grounds for violence. In many countries, curricula and learning materials have been shown to reinforce stereotypes and exacerbate
Higher literacy levels accounted for half the regime transitions towards democracy between 1870 and 2000

24
G L O B A L E D U C A T I O N M O N I T O R I N G R E P O R T 2 0 1 6S U M M A R Y
political and social grievances. In Rwanda, a review of education policies and programmes over 1962–1994 found that the content contributed to categorizing and stigmatizing Hutu and Tutsi into exclusive groups. Language in education can also be a source of wider grievances.
Armed conflict is one of the greatest obstacles to progress in education. In conflict-affected countries, 21.5 million children of primary school age (35% of the total) and almost 15 million adolescents of lower secondary age (25%) are out of school. In
the Syrian Arab Republic, over half a million children were out of primary school in 2013. Schools are often used for military purposes. Teachers are at risk: In Colombia, 140 teachers were killed between 2009 and 2013. Widespread forced recruitment of children into armed groups persists.
Refugees present a huge challenge for education systems. Refugee children and adolescents are five times likelier to be out of school than their non-refugee peers. In some refugee settings, pupil/teacher ratios are as high as 70:1 and many teachers are unqualified.
Education can help address differences between ethnic and religious groups. But where schools maintain the status quo through curricula or school segregation, they can ingrain discriminatory attitudes. In Bosnia and Herzegovina, schools have been segregated along ethnic and linguistic lines since the end of the war in 1996. Curricular content can help or harm intergroup relations after conflict. The success of any curricular reform depends on the availability of motivated, engaged and trained teachers.
Well-designed formal and non-formal peace education can reduce student aggression, bullying and participation in violent conflict. Education needs to be integrated in international peacebuilding agendas, but security issues tend to be prioritized instead. Of the 37 publicly available full peace agreements signed between 1989 and 2005, 11 do not mention education at all.
EDUCATION CAN BE CRUCIAL IN BUILDING A FUNCTIONING JUSTICE SYSTEMA functioning justice system is critical for sustaining peaceful societies. However, many citizens lack the skills to gain access to complex justice systems. In 2011, according to court user survey results in the Former Yugoslav Republic of Macedonia, only 32% of individuals with primary education were well or partially informed about the judicial system and its reforms, compared with 77% of those with higher education. Community-based education programmes can help increase understanding of legal rights, particularly for the marginalized.
Building the capacity of judicial and law enforcement officers is critical. Insufficient training and capacity-building can hold back justice and result in delays, flawed or insufficient evidence-gathering, lack of enforcement, and abuse. In Haiti, the national police went from being the least to the most trusted public institution over five years through a seven-month UN recruit training programme.
FIGURE 4:Education conditions for refugee children vary widely Primary and secondary enrolment rates, selected refugee sites in selected countries, 2014
Keny
a
Paki
stan
Bang
lade
sh
Chad
Mal
aysi
a
Suda
n
Ugan
da
Ethi
opia
Sout
h Su
dan
Yem
en
Rwan
da
Iran,
Isl.
Rep
Egyp
t
Enro
lmen
t rat
es (%
)
Primary
Secondary
100
90
80
70
60
50
40
30
20
10
0
Source: GEM Report team analysis (2016) based on 2014 UNHCR data.
Data from 100 countries over 50 years found that those with wider education gaps were more likely to be in conflict

25
S U M M A R YG L O B A L E D U C A T I O N M O N I T O R I N G R E P O R T 2 0 1 6
Children look through a destroyed classroom window at Yerwa Primary School, Maiduguri, Borno state, damaged by Boko Haram during attacks in 2010 and 2013. The school, established in 1915, was the first primary school in northeast Nigeria.
CREDIT: Bede Sheppard/Human Rights Watch

26

27
S U M M A R YG L O B A L E D U C A T I O N M O N I T O R I N G R E P O R T 2 0 1 6
Place: cities and human settlements
Urbanization is one of today’s defining demographic trends – over half of the world lives in cities and urban areas, and most projected urban population growth to 2050 will happen in lower income cities. The GEM Report looks at
the ways cities and urbanization affect education, and how education affects urban issues.
The scale and speed of urban change necessitate good governance, flexibility and innovation. Education should be integrated into urban planning so that the education needs and rights of all are met as urban populations change. But the broad education sector is largely missing from key urban development discussions. Education stakeholders and urban leaders need stronger advocacy and leadership if education is to gain a seat in discussions on the future of cities.
CITIES AFFECT EDUCATION PLANNINGGlobally, about half of urban growth is due to natural population growth and half to migration from rural areas. Such growth raises demand for basic education, lifelong learning, skills development and teachers, and increases the need to foster social cohesion and tolerance of cultural diversity through education, including for slum dwellers, migrants and refugees.
More than one-third of urban residents in lower income countries live in slums or shanty towns in city centres or urban peripheries. Slums’ conditions vary greatly, but many are characterized by poor access to basic services, including education. Data compiled from 130 slum settlement profiles from 12 cities and towns in Uganda found that while most settlements had access to schooling, the respondents highlighted the need to increase the number of accessible public schools.
Migrants to cities looking for employment face challenges such as discrimination, language barriers, unemployment and exploitation in the informal economy. Addressing these requires a focus on skills development.
Urban education systems that receive forcibly displaced children and youth need to adapt to support their long-term integration — particularly as the global refugee crisis is deepening. By late 2014, 6 out of 10 refugees lived in urban areas. More than half the world’s refugees are under 18. In Turkey, 85% of Syrian refugee children in camps attend school, compared with 30% of those in urban areas.
The prevalence of private schools, especially in major cities and peri-urban areas, is often underestimated or disregarded in discussions of public education. Their growth in peri-urban areas is mostly informal, often not captured in official statistics, and critically neglected. The 2010/11 private school census of Lagos state, Nigeria, revealed that over 85% of pre-primary and 60% of primary students were enrolled in private schools.
EDUCATION HAS ECONOMIC, SOCIAL AND ENVIRONMENTAL EFFECTS ON CITIES …Good quality primary and secondary education and high enrolment rates in tertiary education are fundamental for fostering innovation and increasing productivity in knowledge economies. Cities attract human capital and foreign direct investment by positioning themselves as global hubs for higher education, skills, talent, knowledge and innovation. The megacity of Shanghai, China, attracts a wide range of talent, has access to over 100,000 graduates and has doubled the proportion of college-educated labour force in a decade. Stanford University has reportedly had significant global economic impact: 18,000 firms created by its alumni are based in urban areas of California.
Informal work is a major source of employment and income in lower income countries, especially in cities, and an important stopgap employer in higher income economies during economic crises. Recognizing and including informal work in urban economies is important for prosperity and social inclusion in cities.
By late 2014, 6 out of 10 refugees lived in urban areas. More than half the world’s refugees are under 18

28
G L O B A L E D U C A T I O N M O N I T O R I N G R E P O R T 2 0 1 6S U M M A R Y
Education also has a positive social impact, particularly in reducing crime. In England and Wales (United Kingdom), prolonging compulsory schooling has led to a major reduction in crime and violence. In the United States, investing in early childhood education has had long-term effects on reducing crime in adulthood.
Education can improve awareness of environmental challenges and responsibilities in cities. Educational tools have been important in the mass adoption of bus rapid transit and cycling. In Lagos, Nigeria, an extensive communication programme on a new bus rapid transit system helped reduce implementation delays. In countries with cycling cities, such as Denmark, Germany and the Netherlands, education is woven into an integrated approach with children receiving extensive training from an early age.
… BUT CAN ALSO CONTRIBUTE TO URBAN INEQUALITYTo ensure that education does not exacerbate social stratification, governments need to balance education-related activities that can improve a city’s competitiveness with those that can improve social inclusion.
There is as much – if not more – substantial inequality in education within urban areas as between urban and rural areas. The potential benefits of being in an urban area can be undermined by a lack of policies addressing inequity. Discriminatory policies and practices, such as inequitable distribution of good teachers, can also exacerbate inequality. In the Concepción metropolitan area of Chile, major differences were found in the distribution of schools of good quality.
Private schools, often resulting from poor government provision, can both alleviate and exacerbate inequality. School choice – allowing parents to choose between public, private, charter or other non-state institutions – is often both a cause and consequence of demographic stratification.
Inequality in education can be perpetuated by negative attitudes. Teachers routinely exhibit discriminatory attitudes towards children of migrants and minorities, which
can contribute to their social marginalization. In Shanghai, first-grade teachers were more likely to report that migrant students performed below their grade level in language, even after controlling for background characteristics. Education can also perpetuate social exclusion if schools serving the disadvantaged are violent.
Segregation by ethnicity, social class or race is a dominant feature of education in cities in the United States, much of Europe and countries with legacies of troubled race relations, such as South Africa. Education-based segregation is greater in high tech, knowledge-based metropolitan areas. In 90% of the 30 largest US metropolitan areas, segregation between upper and lower income households has increased. Research from 13 major European cities indicates that socio-economic and spatial segregation is rising as more educated populations fuel the growth of knowledge-intensive industries.
FIGURE 5:Developing countries have rural–urban disparity but also very high intra-urban disparity Disparity based on location (rural–urban) and wealth (bottom and top quintile) in lower secondary completion rates
Cam
bodi
a
10090
80
70
60
5040
30
2010
0
Low
er s
econ
dary
com
plet
ion
rate
(%)
Paki
stan
Hond
uras
Nep
al
Indi
a
Suda
n
Syria
n A.
R.
Phili
ppin
es
Thai
land
Egyp
t
Viet
Nam
Jord
an
Pale
stin
e
Urban rich
Rural rich
National
Rural poor
Urban poor
Source: GEM Report team analysis (2016) based on Demographic and Health Surveys, Multiple Indicator Cluster Surveys and national household survey data.

S U M M A R YG L O B A L E D U C A T I O N M O N I T O R I N G R E P O R T 2 0 1 6
29
EDUCATION AND LIFELONG LEARNING CAN INFLUENCE URBAN PLANNING AND HELP TRANSFORM CITIES
Education has the potential to influence urban planning, if part of an integrated effort. In Berlin, neighbourhood management projects have been launched to create a ‘socially integrative city’ through activities, education and employment opportunities.
Realizing this potential requires better multidisciplinary training enabling urban planners to work effectively across disciplines and sectors to promote more sustainable living environments. In most countries, urban planning schools and programmes are limited. India has about 1 planner for every 100,000 urban residents, compared to 1 for every 5,000 in Canada and the United States.
Education-led participatory approaches, recognizing the needs of the disadvantaged, improve urban planning and decision-making. Shack/Slum Dwellers International network has helped community members document inequalities
and demand services from local government. In partnership with the Association of African Planning Schools, it has engaged in efforts to increase the relevance of urban planning, especially in relation to informal settlements.
Informed city leaders can productively use education and lifelong learning to transform cities. In Medellín, Colombia, the mayor helped transform the city from one of the world’s most violent to one of its most innovative through an education-led social change strategy. As cities grow increasingly important, improving local autonomy and emphasizing education strategies are key to making them sustainable and inclusive.
India has about 1 planner for every 100,000 urban residents, compared to 1 for every 5,000 in Canada and the United States
Favelas in Rio de Janeiro, which formed when lots of people moved from the Brazilian country-side to the city.
CREDIT: Anna Spysz/GEM Report

30

31
S U M M A R YG L O B A L E D U C A T I O N M O N I T O R I N G R E P O R T 2 0 1 6
Partnerships: enabling conditions to achieve SDG 4 and the other SDGs
The 2030 Agenda views today’s social, economic and environmental challenges as indivisible, requiring integrated responses. SDG 17 articulates means of achieving the SDGs and calls for a revitalized global partnership. Its targets
highlight the need for cooperation to ensure adequate financing, enhance policy coherence and build multistakeholder partnerships, among other aims.
FINANCEThe GEM Report team estimates that the total annual cost of ensuring that every child and adolescent in low and lower middle income countries has access to good quality education from the pre-primary to upper secondary level will rise from US$149 billion to US$340 billion by 2030. The International Commission on the Financing of Global Education Opportunities, announced at the Oslo Summit on Education for Development in July 2015, calls for a New Compact on education, including specific measures to mobilize domestic funds and address the funding gap.
The Education 2030 Framework for Action set two benchmarks on domestic financing for education: 4% to 6% of gross domestic product (GDP) and 15% to 20% of public expenditure. Mobilizing more domestic resources will be critical. In about half of all lower income countries, tax ratios are below 15% of GDP, compared with 18% in emerging economies and 26% in advanced economies. Raising the tax ratio in poorer countries requires domestic and global efforts. Education can improve taxpayer behaviour and increase compliance. Low literacy was associated with reduced tax revenue in 123 countries studied with data from 1996 to 2010. Those who avoid paying taxes are often highly
educated elites, but education is associated with positive tax-related attitudes. In Latin America, nine countries have included tax education in their curricula through joint efforts between education ministries and tax authorities.
Addressing tax evasion and avoidance is also a global responsibility. Recent estimates suggest that lower income countries lose about US$100 billion annually due to multinational tax avoidance via offshore investments. Coordinated domestic and international action on tax incentives, treaties and harmful corporate decisions is needed for lower income countries to recoup lost tax revenue.
Many countries could reallocate expenditure for the benefit of education. Two ways to prioritize spending for education are to remove fossil fuel subsidies and to earmark education funds. In Indonesia, public expenditure on education increased by over 60% between 2005 and 2009, largely due to fuel subsidy reforms.
Even assuming domestic revenue mobilization is improved, however, an annual US$39 billion financing gap remains. International aid will continue to be a necessity for many low income countries. Yet the volume of aid to education fell by about US$600 million from 2013 to 2014. In this context, three options show promise: earmarking more funds for education through multilateral mechanisms; using more aid to build national authorities’ capacity to increase domestic resources; and better targeting aid to the countries and education levels most in need. There is much room for improvement: Despite the significant benefits of early investment in education, early childhood care and education received only US$ 106 million in direct aid in 2014, less than 3% of the amount for post-secondary.
POLICY COHERENCESector-specific approaches are insufficient to meet the interdependent challenges of sustainable development. The broad SDG agenda requires multisector approaches. In education, cross-sector interventions include integrated initiatives in school feeding and school health, early childhood development, and skills and livelihood training.
At the national level, successful efforts to improve multisector planning reflect the importance of political will, institutional support, adequate capacity and sufficient data. In Nigeria, debt relief funds were used to support local service delivery in
Lower income countries lose about US$100 billion annually due to multinational tax avoidance

32
G L O B A L E D U C A T I O N M O N I T O R I N G R E P O R T 2 0 1 6S U M M A R Y
education, health and water and sanitation in support of the Millennium Development Goals. Colombia’s national development plan views education, peace and equity as presidential priorities; it aims to be the most educated country in Latin America by 2025.
Government agencies typically tend to focus on policy formulation and implementation in their respective sectors, hampering coordination and collaboration. Well-developed national plans that are linked to good education financing plans and decentralized planning and financing systems, and that lead to good cross-sector integration, are the exception rather than the rule in most poorer countries.
Donor agencies face two challenges in delivering programmes that are consistent with the integrated planning needs of the SDGs: they may lack a coherent vision of their approach to development, and they have difficulties coordinating multisector programmes. Aid is not being allocated adequately according to country needs. In Liberia and Mauritania, about half the children complete primary school, but Liberia receives 10 times the amount of aid to basic education per school-age child.
PARTNERSHIPSLocal and national government authorities, civil society, academics, the scientific community, the private sector and global multistakeholder organizations are some of the partners that can help implement global agendas such as the SDGs. Civil society, the private sector and multistakeholder partnerships have substantial roles in financing, implementing and ensuring mutual accountability of the new agenda, which is expected to be driven by national governments.
Increased civil society activity was a major achievement of the EFA agenda. But there are challenges in designing civil society partnerships more productively. How can organizations heavily dependent on donor funding maintain an independent voice? Another challenge is the enormous variety of disparate actors under the civil society umbrella.
The dynamism and funding that the private sector can bring to the SDGs is reason for optimism. But while some hail the growth of private involvement as bringing financing, flexibility, innovation and improved learning outcomes, sceptics see a potential for widening inequality and undue market influence in schooling.
The role of coordination and financing bodies is critical. The global education coordination mechanism includes the SDG-Education 2030 Steering Committee, Global Education Meetings, regional meetings and collective bodies of NGOs. The Steering Committee is expected to be the main mechanism to support countries, review progress and encourage coordination of partner activities. The Global Partnership for Education, the education sector’s principal multistakeholder partnership, could learn from such health sector partnerships as the Global Fund for Tuberculosis, Aids and Malaria and GAVI, which leverage substantial funds. The
new Education Cannot Wait fund aims to raise money for targeted education for those affected by conflict, natural disasters and disease outbreaks.
FIGURE 6:Aid to basic education is not related to needTotal aid to basic education per primary school-age child (2014) and primary completion rate (2008–2014)
Tota
l aid
to b
asic
edu
catio
n pe
r prim
ary
scho
ol-a
ge c
hild
(c
onst
ant 2
014
US$)
70
60
50
0
40
20
30
10
80
25 50 75 1000Primary completion rate (%)
Chad
Niger
MauritaniaUganda
Senegal
Afghanistan
HaitiLiberia
Timor-Leste
Namibia
Mongolia
Sources: GEM Report team analysis based on OECD Creditor Reporting System data (2016); World Inequality Database on Education.
The role of coordination and financing bodies is critical to the success of the SDG agenda

33
S U M M A R YG L O B A L E D U C A T I O N M O N I T O R I N G R E P O R T 2 0 1 6
Projections: How will expanding education affect sustainable development outcomes?
PROJECTING GLOBAL EDUCATIONAL ATTAINMENT TO 2030 AND BEYOND
The 2016 GEM Report projects prospects for achieving universal secondary completion by 2030 using a globally
representative data set and sophisticated methodology. The message is stark: The world will be 50 years late in achieving its global education commitments. On current trends, universal primary completion will be achieved in 2042; universal lower secondary completion in 2059; and universal upper secondary completion in 2084. The poorest countries will achieve universal primary education over 100 years later than the richest. The principal conclusion is that, in low and middle income countries alike, the SDG scenario requires an unprecedented break with past trends if the attainment component of target 4.1 is to be achieved.
FORECASTING EFFECTS ON DEVELOPMENT OUTCOMES
While the projection exercise suggests that the SDG education target may not be met, even modest progress can make a big difference to the next generation. To gain a sense of how education expansion contributes to other SDGs, the GEM Report analyses how education can help save lives (by reducing infant and child mortality and increasing adult life expectancy), lift people and countries out of poverty (by increasing aggregate national economic growth and reducing absolute extreme poverty) and reduce disaster vulnerability.
Achieving universal upper secondary completion by 2030 would reduce the under-5 mortality rate in sub-Saharan Africa from 68 to 54 deaths for every 1,000 live births by 2030 and from 51 to 38 deaths for every 1,000 live births by 2050. Since children’s health can benefit from community-level effects and the diffusion of healthy practices and behaviours, child mortality might drop even more than these estimates suggest.
Education can boost per capita income by raising labour productivity and accelerating technological development and adoption. In low income countries, universalizing upper secondary completion would increase per capita income by 75% by 2050. Even if achieving SDG target 4.1 is not sufficient to eliminate extreme poverty by 2030, it could bring poverty elimination forward 10 years.
FIGURE 7:Not even universal primary completion will be achieved by 2030 in low and middle income countries on past trendsProjected attainment rates of 15- to 19-year-olds by education level and country income group, 2010-2080
Low incomeLower middle incomeUpper middle incomeHigh income
Prim
ary
atta
inm
ent r
ate
(%)
0
100
50
75
25
2010
2020
2030
2040
2050
2060
2070
2080
Primary education
Lower secondary education
2010
2020
2030
2040
2050
2060
2070
2080
Low
er s
econ
dary
att
ainm
ent r
ate
(%)
0
100
50
75
25
Upper secondary education
2010
2020
2030
2040
2050
2060
2070
2080
Uppe
r sec
onda
ry a
ttai
nmen
t rat
e (%
)
0
100
50
75
25
Source: Barakat (2016).

34
G L O B A L E D U C A T I O N M O N I T O R I N G R E P O R T 2 0 1 6S U M M A R Y
Education and sustainability: what we know and what we need to do
The preceding section has showcased the many links between education and sustainable development. They suggest that the benefits of completing primary and secondary education are substantial, not only for individuals
but for their families, communities and workplaces. More educated men and women tend to be more environmentally aware, more resilient to the impact of climate change, more productive and income generating, and more likely to live healthy lives, be politically engaged and exercise control over their lives. The benefits of educating girls and women are numerous and intergenerational.
There is concern that evolving global conditions are altering education’s effects. The world economy, for example, has created enormous wealth for some but left many behind, their lives and livelihoods vulnerable to economic
dislocation, persistent poverty or both. Economic down cycles exacerbate political insecurity and conflict, forcing millions to flee. Dislocation due to natural disasters and climate change undermines country efforts to ensure all young people complete at least 12 years of education and to provide ample opportunity for lifelong learning.
For education to be transformative in support of the new sustainable development agenda, ‘education as usual’ will not suffice. Learning should foster thinking that is relational, integrative, empathetic, anticipatory and systemic. Schools should become exemplary spaces that breathe sustainability – inclusive, democratic, healthy, carbon-neutral places that lay the foundation for achieving the SDGs.
The policy recommendations below suggest how education systems can contribute more effectively to sustainable development.
■ Support collaborations and synergies across all sectors and partners. Since systemic problems require multiple actors and diverse perspectives, stronger efforts are needed to involve all partners, including ministries, education experts, and civil society, at the local and national level, and across sectors.
■ Governments need to view formal and non-formal education and training as key to their efforts to tackle cross-sector problems. Education can be an important tool for capacity-building in all sectors. Many SDG targets require specialized skills and expertise that education systems provide.
■ Education can help reduce income inequality, but not on its own. Expanding access by marginalized groups to good quality primary and secondary education will help ensure decent incomes and reduced disparity. Changes to labour market regulations and technology should not penalize workers in less secure jobs, especially in the informal sector.
■ Education systems need increased and predictable financing to (a) universalize completion of primary and secondary education; (b) increase numbers of qualified, knowledgeable and motivated teachers; (c) provide good quality education to marginalized populations; and (d) prepare for the impact of climate change and the possibility of protracted conflict.
For education to be transformative in support of the new sustainable development agenda, ‘education as usual’ will not suffice
Education can help reduce disaster-related deaths, since educated people tend to exhibit more awareness of risks, a higher degree of preparation and appropriate responses, and smaller average losses when disaster strikes. If universal secondary education were achieved by 2030, then by 2040–2050 there would be 10,000 to 20,000 fewer disaster-related deaths per decade, compared to the 250,000 deaths between 2000 and 2010, if disaster frequency remained constant. Universal secondary education would have a particularly strong impact on disaster-related deaths in Asia, since it has the largest populations and many of the most vulnerable reside in coastal areas.

35
S U M M A R YG L O B A L E D U C A T I O N M O N I T O R I N G R E P O R T 2 0 1 6
IMPROVING EQUITY
■ Universal primary and secondary education, especially for girls, is central to promoting women’s autonomy and decision-making. Achieving this target would curtail population growth, transform social norms and practices across generations, and limit the burden on the planet.
■ Education policies targeting minority, refugee and internally displaced populations should prioritize appropriate languages of instruction and ensure the use of non-biased curricular and learning materials. Building up a pool of qualified teachers proficient in appropriate languages is important in countries with high proportions of ethnic minorities and migrant populations.
■ Urban planning needs to involve education planning, and not leave rural areas behind. Planning of education, among other basic services, for slum dwellers is vital. Public amenities and good quality teachers should be equitably distributed, and schools made safe and violence free. Rural areas with declining populations and rural school consolidation require planning attention and community involvement.
CHANGING THE FOCUS OF EDUCATION
■ In developing skills policies, education systems should consider both medium- and long-term needs and the implications of sustainable growth. Teaching green skills to students and providing workers with opportunities to retrain and improve their skills are needed, as are changes in secondary and tertiary level curricula. Better cooperation with business and industry would improve relevance and quality of teaching.
■ Civic, peace and sustainability education programmes can be important levers for SDG progress. Effectively implemented, they can ensure a more equitable justice system, build capacity in judicial and law enforcement, foster less violent and more constructive societies, increase understanding of the links between culture, economy and environment, and prioritize actions that improve the lot of future generations.
The challenges of monitoring education in the Sustainable Development Goals
SDG 4, with its 10 targets, represents a level of ambition for the next 15 years that goes beyond any previous global education agreement. The GEM Report presents the challenges of monitoring progress on education in
the 2030 Agenda. It analyses all SDG 4 targets – some of which are poorly formulated – and discusses the technical challenges of monitoring the respective indicators. It also examines efforts to develop valid, reliable and comparable measurement tools.
The GEM Report asks what the priorities are for global education monitoring and where countries and organizations need to focus resources. It examines the institutional, political and technical context within which indicators will be measured.
THE ROLE OF THE GEM REPORTThe GEM Report has a mandate to help the international community understand whether and how the world is making progress in education and lifelong learning. While the EFA Global Monitoring Report is seen as having fulfilled its mandate, the landscape is rapidly changing, with the expanded scope of the 2030 Agenda posing new challenges.

36
G L O B A L E D U C A T I O N M O N I T O R I N G R E P O R T 2 0 1 6S U M M A R Y
A set of monitoring indicators has been formulated (Box 1), though the methodology for measuring many of them is still being developed. Many indicators only partly cover the concepts in each target. Alternative ways to measure and monitor targets at the national and regional levels should also be explored.
In coming years, the GEM Report will take a comprehensive look at global progress in education using available indicators, questioning their usefulness, reflecting on the quality of sources, introducing new ways of looking at evidence and advocating for improvement.
The GEM Report has a mandate to show whether and how the world is making progress in education and lifelong learning
BOX 1
Targets and proposed global/thematic indicator framework for SDG 4 on education
GOAL 4. Ensure inclusive and equitable quality education and promote lifelong learning opportunities for all
Target 4.1. By 2030, ensure that all girls and boys complete free, equitable and quality primary and secondary education leading to relevant and effective learning outcomes
1. Percentage of children and young people: (a) in grades 2/3; (b) at the end of primary; and (c) at the end of lower secondary achieving at least a minimum proficiency level in (i) reading and (ii) mathematics, by sex. [Global indicator 4.1.1]
2. Administration of a nationally representative learning assessment (i) during primary (ii) at the end of primary and (iii) at the end of lower secondary education3. Gross intake ratio to the last grade (primary, lower secondary)4. Completion rate (primary, lower secondary, upper secondary)5. Out-of-school rate (primary, lower secondary, upper secondary)6. Percentage of children over-age for grade (primary, lower secondary)7. Number of years of (i) free and (ii) compulsory primary and secondary education guaranteed in legal frameworks
Target 4.2. By 2030, ensure that all girls and boys have access to quality early childhood development, care and pre-primary education so that they are ready for primary education
8. Proportion of children under 5 years of age who are developmentally on track in health, learning and psychosocial well-being, by sex [Global indicator 4.2.1]9. Percentage of children under 5 years of age experiencing positive and stimulating home learning environments10. Participation rate in organized learning (one year before the official primary entry age), by sex [Global indicator 4.2.2]11. Gross pre-primary enrolment ratio12. Number of years of (i) free and (ii) compulsory pre-primary education guaranteed in legal frameworks
Target 4.3. By 2030, ensure equal access for all women and men to affordable and quality technical, vocational and tertiary education, including university
13. Gross enrolment ratio for tertiary education14. Participation rate in technical-vocational education programmes (15- to 24-year-olds)15. Participation rate of youth and adults in formal and non-formal education and training in the previous 12 months, by sex [Global indicator 4.3.1]
Target 4.4. By 2030, substantially increase the number of youth and adults who have relevant skills, including technical and vocational skills, for employment, decent jobs and entrepreneurship
16.1. Percentage of youth and adults who have achieved at least a minimum level of proficiency in digital literacy skills16.2. Percentage of youth and adults with information and communications technology (ICT) skills by type of skill [Global indicator 4.4.1]17. Youth/adult educational attainment rates by age group, economic activity status, levels of education and programme orientation
Target 4.5. By 2030, eliminate gender disparities in education and ensure equal access to all levels of education and vocational training for the vulnerable, including persons with disabilities, indigenous peoples and children in vulnerable situations
Parity indices (female/male, rural/urban, bottom/top wealth quintile and others such as disability status, indigenous peoples and conflict-affected as data become available) for all education indicators on this list that can be disaggregated [Global indicator 4.5.1]18. Percentage of students in primary education whose first or home language is the language of instruction19. Extent to which explicit formula-based policies reallocate education resources to disadvantaged populations
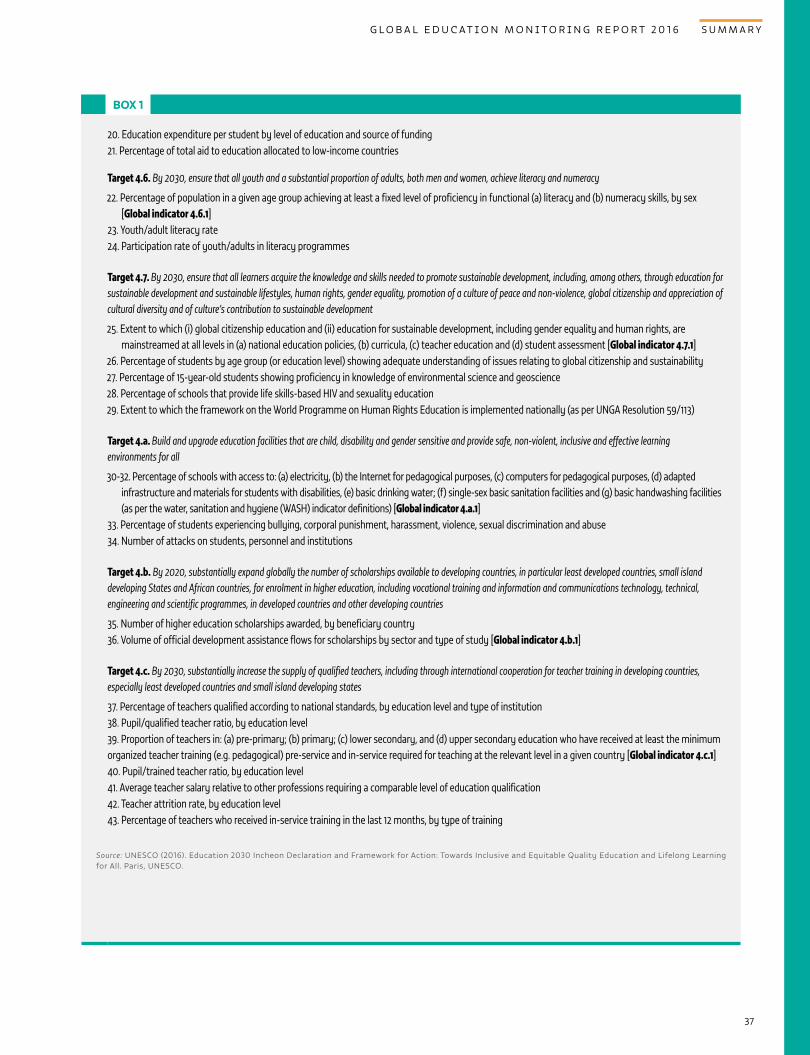
37
S U M M A R YG L O B A L E D U C A T I O N M O N I T O R I N G R E P O R T 2 0 1 6
BOX 1
20. Education expenditure per student by level of education and source of funding21. Percentage of total aid to education allocated to low-income countries
Target 4.6. By 2030, ensure that all youth and a substantial proportion of adults, both men and women, achieve literacy and numeracy
22. Percentage of population in a given age group achieving at least a fixed level of proficiency in functional (a) literacy and (b) numeracy skills, by sex [Global indicator 4.6.1]
23. Youth/adult literacy rate24. Participation rate of youth/adults in literacy programmes
Target 4.7. By 2030, ensure that all learners acquire the knowledge and skills needed to promote sustainable development, including, among others, through education for sustainable development and sustainable lifestyles, human rights, gender equality, promotion of a culture of peace and non-violence, global citizenship and appreciation of cultural diversity and of culture’s contribution to sustainable development
25. Extent to which (i) global citizenship education and (ii) education for sustainable development, including gender equality and human rights, are mainstreamed at all levels in (a) national education policies, (b) curricula, (c) teacher education and (d) student assessment [Global indicator 4.7.1]
26. Percentage of students by age group (or education level) showing adequate understanding of issues relating to global citizenship and sustainability27. Percentage of 15-year-old students showing proficiency in knowledge of environmental science and geoscience28. Percentage of schools that provide life skills-based HIV and sexuality education29. Extent to which the framework on the World Programme on Human Rights Education is implemented nationally (as per UNGA Resolution 59/113)
Target 4.a. Build and upgrade education facilities that are child, disability and gender sensitive and provide safe, non-violent, inclusive and effective learning environments for all
30-32. Percentage of schools with access to: (a) electricity, (b) the Internet for pedagogical purposes, (c) computers for pedagogical purposes, (d) adapted infrastructure and materials for students with disabilities, (e) basic drinking water; (f) single-sex basic sanitation facilities and (g) basic handwashing facilities (as per the water, sanitation and hygiene (WASH) indicator definitions) [Global indicator 4.a.1]
33. Percentage of students experiencing bullying, corporal punishment, harassment, violence, sexual discrimination and abuse34. Number of attacks on students, personnel and institutions
Target 4.b. By 2020, substantially expand globally the number of scholarships available to developing countries, in particular least developed countries, small island developing States and African countries, for enrolment in higher education, including vocational training and information and communications technology, technical, engineering and scientific programmes, in developed countries and other developing countries
35. Number of higher education scholarships awarded, by beneficiary country36. Volume of official development assistance flows for scholarships by sector and type of study [Global indicator 4.b.1]
Target 4.c. By 2030, substantially increase the supply of qualified teachers, including through international cooperation for teacher training in developing countries, especially least developed countries and small island developing states
37. Percentage of teachers qualified according to national standards, by education level and type of institution38. Pupil/qualified teacher ratio, by education level39. Proportion of teachers in: (a) pre-primary; (b) primary; (c) lower secondary, and (d) upper secondary education who have received at least the minimum organized teacher training (e.g. pedagogical) pre-service and in-service required for teaching at the relevant level in a given country [Global indicator 4.c.1]40. Pupil/trained teacher ratio, by education level41. Average teacher salary relative to other professions requiring a comparable level of education qualification42. Teacher attrition rate, by education level43. Percentage of teachers who received in-service training in the last 12 months, by type of training
Source: UNESCO (2016). Education 2030 Incheon Declaration and Framework for Action: Towards Inclusive and Equitable Quality Education and Lifelong Learning for All. Paris, UNESCO.

38
G L O B A L E D U C A T I O N M O N I T O R I N G R E P O R T 2 0 1 6S U M M A R Y
Primary and secondary education
Sustainable Development Goal 4.1
Target 4.1 envisages universal primary and secondary completion as a path to relevant and effective learning. Progress towards this target will be seen as a key measure of government and international community
commitment to the SDGs. Critics of the target believe a push towards universal upper secondary completion distracts from the priority of at least nine years of basic education for all.
ACCESS, PARTICIPATION AND COMPLETIONAccess needs to be monitored closely in the new agenda. While the agenda aims to achieve 12 years of education for the current cohort by 2030, it should not be forgotten that 25 million children do not even begin primary school. Almost 30% of children from the poorest households in low income countries have never been to school.
Target 4.1 deals with participation in primary, lower secondary and, for the first time, upper secondary education. In 2014, 91% of children of primary school age, 84% of adolescents of lower secondary age and 63% of youth of upper secondary age were in school. These estimates indicate a total of 263 million were not in school: 61 million of primary school age, 60 million of lower secondary age and 142 million of upper secondary age.
TA R G E T 4 . 1
FIGURE 8:In just 2 out of 90 low and middle income countries have the poorest young people attained at least 12 years of education Years of education attained among 20- to 24-year-olds, by wealth, selected countries, 2008 and 2014
Year
s of
edu
catio
n
15
12
9
6
3
0
Nig
er
Mal
i
S. T
ome/
Prin
cipe
Mau
ritan
ia
Mad
agas
car
Bang
lade
sh
Haiti
Lao
PDR
Surin
ame
Indo
nesi
a
Peru
Pale
stin
e
Moz
ambi
que
Guat
emal
a
Cong
o
Colo
mbi
a
Boliv
ia
Kyrg
yzst
an
Tim
or-L
este
Chin
a
Zim
babw
e
Barb
ados
Viet
Nam
Arge
ntin
a
Jam
aica
Kaza
khst
anUk
rain
e
Beni
n
Sout
h Su
dan
Chad
Gam
bia
Togo
Indi
a
Mal
dive
s
Mex
ico
Bosn
ia/H
erze
g.
Paki
stan
Sene
gal
Mal
awi
Hond
uras
Leso
tho
Nam
ibia
Urug
uay
Egyp
t
Bela
rus
Suda
n
Côte
d’Iv
oire
Burk
ina
Faso
Buru
ndi
Libe
ria
Com
oros
Cam
eroo
n
Swaz
iland
Ghan
a
Dom
inic
an R
ep.
Jord
an
Mor
occo
C. A
. R.
Yem
en
Beliz
e
Nig
eria
Keny
a
Phili
ppin
es
Ecua
dor
Mon
golia
Serb
ia
Guin
ea
Bhut
an
Afgh
anis
tan
Ethi
opia
Iraq
D. R
. Con
go
Cam
bodi
a
Gabo
n
Cost
a Ri
ca
Tuni
sia
TFYR
Mac
edon
ia
Rwan
da
Ugan
da
Zam
bia
Nep
al
Guya
na
Alba
nia
Rep.
Mol
dova
Tajik
ista
n
Arm
enia
Pana
ma
Mon
tene
gro
Sier
ra L
eone
U. R
. Tan
zani
a
Richest
Average
Poorest
Source: GEM Report team analysis using household surveys.

39
S U M M A R YG L O B A L E D U C A T I O N M O N I T O R I N G R E P O R T 2 0 1 6
The new agenda marks an important step forward with its emphasis on completion relative to participation. Over 2008–2014, the primary completion rate was 92% in upper middle income, 84% in lower middle income and 51% in low income countries; in the last, among the poorest girls, it was 25%. The upper secondary completion rate was 84% in high income, 43% in upper middle income, 38% in lower middle income and 14% in low income countries. Not even the richest in high income countries achieve universal completion at 93%. In low income countries, just 1% of the poorest girls complete upper secondary school.
COMPULSORY AND FREE EDUCATIONOne of the thematic indicators is the number of years of (i) free and (ii) compulsory primary and secondary education guaranteed in legal frameworks. Out of 190 countries with data on compulsory education, 44 countries (23%) stipulate fewer than nine years of compulsory education.
The median number of years is 9 for compulsory education, 11 for free education. But the concept of free education is problematic in terms of measuring progress on the target: even where fees are abolished, multiple education costs may burden families.
The share of total education expenditure borne by households at each level is a stronger indication of the extent to which education is free.
QUALITYThe proposed monitoring framework does not focus on quality except in indicators related to learning outcomes and equity.
Using an indicative framework to guide discussions of quality, two issues are selected: classroom-related inputs and processes. Textbook availability and use are critical dimensions of quality, yet school visits and classroom observations indicate official data on them are not very reliable. In Chad, about 90% of grade 2 and 6 reading and mathematics students had to share textbooks with at least 2 others.
It is difficult to advocate the use of classroom observation to compare education systems. Yet broadly consistent monitoring tools bring critical issues of teaching practice and pedagogy to policy-makers’ attention. A survey of 15,000 classrooms in Brazil, Colombia, Honduras, Jamaica and Peru showed that teachers spent about 60–65% of their time on academic instruction, well below the recommended 85%. It is important to continue the search for tools that are adaptable yet reliable, valid, cost-efficient and easy to use at scale.
LEARNING OUTCOMESTo improve learning outcomes, a benchmark showing whether progress is taking place is vital. However, there are questions about what ‘relevant and effective learning outcomes’ are, how to measure them and how to use the findings.
Measuring the proposed global indicator – reading and mathematics skills – requires consensus on the content of the learning outcomes to be assessed, the quality standards assessments need to meet and the reporting and defining benchmarks to be used.
LEARNING OUTCOME MEASURES: DEFINING THE CONTENT
To define a minimum proficiency level in domains such as reading and mathematics, any assessment needs basic parameters. What happens when common ground between different curricula needs to be found? What is an expected progression of learning across curricula? What questions show that a learner has reached a particular level of proficiency? How are the levels of proficiency defined?
Two contested issues demonstrate the tensions. First, early-grade assessment of reading and mathematics is divisive, for political and technical reasons. Yet it draws attention to major challenges on the ground. In Malawi in 2012, 90% of grade 2 students could not read a single word in Chichewa; almost 40% still could not do so by grade 4.
Out of 190 countries with data on compulsory education, 23% stipulate fewer than nine years of compulsory education
40
G L O B A L E D U C A T I O N M O N I T O R I N G R E P O R T 2 0 1 6S U M M A R Y
Second, the global indicator on reading and numeracy proficiency excludes those out of school. In rural Pakistan, 89% of grade 10 students could read a grade 2 story in Urdu, Sindhi or Pashto but only 64% of all 14-year-olds could do so.
LEARNING OUTCOME MEASUREMENT TOOLS: ASSURING THE QUALITY OF ASSESSMENTS
One thematic indicator is whether a country has carried out a nationally representative learning assessment during primary, at the end of primary and at the end of lower secondary education. Clear standards for assessments will be necessary, as will a strong mechanism to ensure that assessments meet these standards.
Two dimensions of assessment quality are relevant: (a) an enabling institutional context needs to ensure sustainability and strong links with the education system; and (b) nationally representative assessments should be valid and reliable, providing relevant information to policy-makers and the public. Nationally representative assessments need to be aligned with education goals and student learning objectives as well as with opportunities to develop teachers professionally.
The question of how to ensure that an assessment is fit for the purpose of monitoring raises two issues. First, overly stringent technical requirements could put the necessary capacity beyond the reach of many countries and result in a small pool of service providers administering most assessments, undermining their relevance and use by countries. Second, resources to bolster national capacity to conduct robust learning assessments should be allocated more efficiently.
LEARNING OUTCOME MEASURES: REPORTING RESULTS FROM DIFFERENT ASSESSMENTS
Measuring learning outcomes on a global scale requires agreement on reporting and defining benchmarks by level (or age) and subject. This entails developing a set of items from different types of assessments that can be linked through analysis of their relative level of difficulty. Yet linking items is not just a technical issue but has to do with the intended purpose of the indicator.
Globally comparable learning outcome indicators need to serve not only the objective of global monitoring but also country needs. Efforts to meet both may be helped by the recently established Global Alliance to Monitor Learning.
Early childhood
Sustain
able Development Goal 4.2
TA R G E T 4 . 2
Target 4.2 reaffirms the international community’s focus on ensuring strong foundations for all children through early childhood care and education. Monitoring the concepts in the target poses three challenges: (a) there is not yet
sufficient information on how many children benefit from pre-primary education for at least one year; (b) the proposed indicators do not capture the concept of quality of provision; and (c) while the target goes beyond care and education to early childhood development, the feasibility of introducing a monitoring mechanism for the latter is uncertain.
ACCESS AND PARTICIPATIONComparing participation rates across countries is more difficult for pre-primary than for primary and secondary education. Pre-primary education age groups and starting ages are less standardized than at other levels. Relatively few countries have free and/or compulsory pre-primary education: It is compulsory in 50 countries, and free and compulsory for at least one year in 38.
Pre-primary education is compulsory in 50 countries, and free and compulsory for at least one year in 38

41
S U M M A R YG L O B A L E D U C A T I O N M O N I T O R I N G R E P O R T 2 0 1 6
Globally, 67% of children one year younger than the primary school entrance age are enrolled in pre-primary or primary education. This estimate is close to but does not always coincide with household survey estimates of previous experience in pre-primary education among first-grade students, which can also track attendance levels by household wealth. Among 3- to 4-year-olds in low and middle income countries, children in the richest households were almost six times as likely as the poorest children to attend early childhood education.
QUALITYThe target emphasizes the provision of education of good quality. Quality may be understood as the extent to which school and classroom settings (including structures and teaching processes) and systems support the holistic development of children, particularly those at risk of social exclusion. While countries need to set their own goals and quality standards, there are tools to monitor quality in early childhood provision in a comparable way, though they have prompted policy debates. Among 21 low and middle income countries in a World Bank review of early childhood policies, 13 set basic standards on pupil/teacher ratios but only 8 enforced them.
CHILD DEVELOPMENT OUTCOMESTarget 4.2 focuses on ensuring children begin formal schooling developmentally on track and ‘ready for primary school’. This holistic view marks a shift from a view of child development based exclusively on health-related indicators. Deciding how best to measure child development is complex. There is a need to track normative development across cultures and develop measurement approaches based on the findings.
The measure with the highest current coverage is the UNICEF Early Childhood Development Index (ECDI). Across 56 mostly low and middle income countries over 2010–2015, it found that about 70% of 3-year-olds and 80% of 4-year-olds were developmentally on track. The index consists of four components but is strongly determined by one of them, literacy and numeracy, which can be criticized as reflecting early education norms rather than cognitive capacity.
A key factor helping children reach their potential is a home environment that provides interactions and learning materials. Adult household members in Ukraine engaged almost all 3- to 4-year-olds in at least four activities, compared with only 40% of children in Ghana. Across 54 mostly low and middle income countries over 2010–2015, 19% of households had at least 3 children’s books and 7.5% had at least 10. Among the poorest 20%, less than 1% of households had at least 10 books.
Chad
Sier
ra L
eone
D. R
. Con
goM
ali
Bosn
ia/H
erze
g.Be
nin
Cong
o
Beliz
e
Mya
nmar
Gam
bia
TFYR
Mac
edon
ia
Lao
PDR
%
0
20
40
60
80
Adjusted net enrolment ratio, last year of pre-primary education
Attended pre-primary school the previous year
100
Kyrg
yzst
anM
onte
negr
o
Om
an
Dom
inic
an R
ep.
Nep
al
S. T
ome/
Prin
cipe
Surin
ame
Barb
ados
Ghan
a
Qat
arKa
zakh
stan
Mon
golia
Cost
a Ri
caAr
gent
ina
Zim
babw
e
Sain
t Luc
iaPa
nam
a
Guya
na
El S
alva
dor
Rep.
Mol
dova
Jam
aica
Pale
stin
e
Viet
Nam
Thai
land
Serb
ia
Bela
rus
FIGURE 9:Accounts of participation in early childhood care and education, programmes differ between households and schools Pre-primary adjusted net enrolment ratio in the last year of pre-primary education, 2014, and percentage of students in the first grade of primary school who participated in pre-primary education the previous year, selected countries, 2010–2015
Sources: UIS database for the adjusted net enrolment ratio; MICS final and key findings reports for the percentage of students in the first grade of primary school who attended pre-school during the previous school year.
42
G L O B A L E D U C A T I O N M O N I T O R I N G R E P O R T 2 0 1 6S U M M A R Y
Target 4.3 introduces technical, vocational and tertiary education into the global development agenda. They were considered part of Education for All, but only as support for alternate goals.
The global indicator for the target — the percentage of youth and adults participating in formal or non-formal education or training in the previous 12 months — also embraces adult education. Hence, the GEM Report covers technical-vocational, tertiary and adult education under target 4.3 from the angle of the three concepts in its formulation: access, affordability and quality.
TECHNICAL AND VOCATIONAL EDUCATION AND TRAININGTechnical and vocational education and training (TVET) is provided at institutions, the workplace or a combination of the two. Given the variety of policy frameworks, institutional arrangements and organizational approaches, national statistical systems may only capture a partial picture, making TVET provision difficult to compare across countries.
Current monitoring mechanisms emphasize enrolment in institutions, especially those supervised by education ministries. This considerably narrows the scope of monitoring the target. To include workplace-based education and training requires data from labour force, enterprise or household surveys, which need to coordinate their definitions and questionnaires more closely. Analysis for the GEM Report from 12 countries showed about 20% of youth had participated in workplace-based programmes.
Questions of affordability should focus on the extent to which government policy helps address inequality in TVET access. The extreme diversity of providers, cost structures, public policies and national contexts makes it unlikely that a single indicator can describe
affordability. A possible approach might be to look at the amount of institution income covered by students, compared with the amount of government financial support students receive.
One approach to assessing TVET quality is to focus on whether reliable standards are codified in a national qualification framework. At least 140 countries have such frameworks. They vary in effectiveness but can help learners, providers and employers focus on outcomes rather than how qualifications are acquired.
TERTIARY EDUCATIONTertiary education ranges from short courses to bachelor, master and doctoral programmes. Institutions vary widely in terms of size, cost, courses, procedures and quality. The question of equity needs to take into account hurdles at various stages from access to graduation. Global enrolment in tertiary education doubled from 100 million in 2000 to 207 million in 2014, but disparity across and within countries is huge. In the Philippines in 2013, 52% of the richest 25- to 29-year-olds, but only 1% of the poorest, completed at least four years of tertiary education.
Affordability in tertiary education depends on the relationship between costs and income. Total costs can be compared with average household income levels from household surveys. While this is a useful guide, it does not show how many young people cannot afford higher education. A possible measure is to compare the financial burden for households with government financial assistance to households. Success in targeting those most in need should also be monitored.
Technical, vocational, tertiary and adult education
Sustainable Development Goal 4.3
TA R G E T 4 . 3
New analysis from 12 countries shows about 20% of youth had participated in workplace-based programmes

43
S U M M A R YG L O B A L E D U C A T I O N M O N I T O R I N G R E P O R T 2 0 1 6
Differences in national policy structures and resources, and in university missions, pose considerable barriers to a meaningful global measure of quality in tertiary education. University rankings attract attention because they are simple to understand, but they are based on research rather than teaching quality or student learning.
ADULT EDUCATIONAdult learning, education and training opportunities form a strategy for achieving target 4.3, according to the Education 2030 Framework for Action. Adult education may be formal (institutionalized), non-formal or informal.
The diversity of provision makes monitoring participation particularly difficult. While some information exists on adult learners in formal education, this is a very small part of the picture. In the 28 European Union countries, about 6% of adults participated in formal education and 37% in non-formal in 2011, according to a survey that could provide lessons to develop instruments to measure adult education participation globally.
Assessment of affordability is constrained not only by the greater role of private financing but also by the lack of information even on public financing. Less than one in six countries spent more than 0.3% of GDP on adult education. Overall, more information on public expenditure is needed to understand how it is targeted at the groups most in need.
Monitoring adult education, including its quality dimensions, is challenging. The third Global Report on Adult Learning and Education concluded that data problems exist in all world regions, undermining knowledge of adult education’s impact. It calls on countries to design systems that address obstacles impeding data gathering for monitoring and evaluation.
FIGURE 10:There are vast differences in tertiary attainment between the poor and the richPercentage of 25- to 29-year-olds who have completed at least four years of tertiary education, by wealth, selected countries, 2008–2014
Nig
erUg
anda
C. A
. R.
Mal
awi
Gam
bia
Cong
oBu
rkin
a Fa
soBu
rund
i
Libe
ria
Beni
nRw
anda
Chad
Côte
d’Iv
oire
Togo
Sene
gal
Mal
iZi
mba
bwe
Cam
eroo
nLe
soth
oCo
mor
osTi
mor
-Les
teSu
rinam
eGu
yana
Mau
ritan
iaCa
mbo
dia
Guat
emal
aSw
azila
ndEt
hiop
iaD.
R. C
ongo
Guin
eaBa
ngla
desh
Haiti
Nam
ibia
Hond
uras
Nig
eria
Ghan
aN
icar
agua
Indo
nesi
aDo
min
ican
Rep
.Ira
qCo
lom
bia
Peru
Tajik
ista
nBo
snia
/Her
zeg.
Boliv
iaPa
kist
anIn
dia
Phili
ppin
esCh
ina
Egyp
t
Mad
agas
car
Sier
ra L
eone
Ecua
dor
Tert
iary
edu
catio
n at
tain
men
t rat
e (%
)
0
10
20
30
40
50
60
70
80
Serb
iaPa
lest
ine
Mex
ico
Arge
ntin
aM
alta
Hung
ary
Jord
anM
onte
negr
o
Germ
any
Bulg
aria
TFYR
Mac
edon
ian
Rep.
Mol
dova
Arm
enia
Kaza
khst
anSp
ain
Mon
golia
Net
herla
nds
Fran
ceBe
lgiu
mUn
ited
King
dom
Ukra
ine
Richest
Total
90
100
Poorest
Moz
ambi
que
Zam
bia
Source: GEM Report team analysis of household survey data.
44
G L O B A L E D U C A T I O N M O N I T O R I N G R E P O R T 2 0 1 6S U M M A R Y
Target 4.4 raises three important questions: What skills ‘for employment, decent jobs and entrepreneurship’ are particularly relevant for global monitoring across diverse contexts? Are skills mainly acquired in education and training,
or elsewhere? Are available measures valid and feasible at low cost?
Uncertainty around these questions is reflected in the indicators proposed. One is the education attainment rate in the adult population, which is not a measure of skill. The other, information and communications technology (ICT) and digital literacy skills, risks narrowing the agenda but is also an attempt to focus on concrete, measurable skills.
COGNITIVE SKILLSBasic cognitive skills include literacy and numeracy. New analysis for the GEM Report shows that high literacy skills almost double the probability of holding a decent job.
ICT has become essential to daily life and work. In the European Union, 44% of adults could use basic arithmetic formulas in a spreadsheet in 2014, ranging from 16% in Romania to 63% in Finland.
Digital literacy skills are a better marker, as they can be directly assessed. In the Czech Republic, 85% of grade 8 students demonstrated a functional working knowledge of computers in 2013, compared with 13% in Thailand and 9% in Turkey. A global tool will need to address rapid technological change over time and, especially, the cultural biases inherent in the questions currently used.
NON-COGNITIVE SKILLS …There has been growing interest in skills that are believed to involve less cognitive processing, though in practice many of the most valued workplace skills – such as the fundamental but elusive skills of creativity, critical thinking, problem-solving and collaboration – escape easy categorization.
There is a lack of evidence showing the level at which non-cognitive skills, such as perseverance, self-control, or social and emotional skills, best predict a positive employment outcome. The optimal level likely depends on the employment context.
Developing measures to allow cross-country comparisons of non-cognitive skills is challenging. The GEM Report recommends avoiding large-scale measurement for global monitoring purposes and calls for attention to the research on measuring their acquisition and impact in the workplace.
… AND THEIR COMBINATIONS FOR THE WORLD OF WORKTwo examples of blended cognitive and non-cognitive skills relevant for the world of work are financial literacy and entrepreneurship skills. Attempts to develop an empirical measure of financial literacy have advanced in recent years. By one definition, 33% of adults worldwide are financially literate, ranging from 13% in Yemen to 71% in Norway. Assessments of entrepreneurship skills, still largely at the research stage, raise the question of what topics to integrate in school curricula.
Skills for workSus
tainable Development Goal 4.4
TA R G E T 4 . 4
In the European Union, 44% of adults used basic arithmetic formulas in a spreadsheet in 2014

45
S U M M A R YG L O B A L E D U C A T I O N M O N I T O R I N G R E P O R T 2 0 1 6
The desire to ‘leave no one behind’ permeates the 2030 Agenda for Sustainable Development and is expected to spur demand for global monitoring and reporting of inequality. The GEM Report addresses three main issues: what
are appropriate ways to measure inequality and its evolution, how to collect information identifying individuals as members of vulnerable groups, and what broader aspects of equity in education can be measured, beyond parity.
INEQUALITY MEASURESThree main factors complicate measurement of inequality in education. First, inequality can be examined with reference to a wide range of indicators with respect to, for instance, access or learning. Second, different inequality measures can be used to see how an education indicator is distributed in the population, each with advantages and disadvantages. Different measures can lead to different conclusions about the degree of inequality and change over time. Third, policy-makers need to know how an indicator varies by individual characteristics, such as wealth, but it is often difficult to compare these characteristics across countries.
The Inter-agency and Expert Group on SDG Indicators has proposed the parity index as the global measure of inequality in education. This measure is the easiest to communicate to a broad audience and has been effective in describing gender disparity for two decades. Among the characteristics it can be applied to, disparity by wealth is the most extreme. In upper middle income countries, the wealth parity index of completion rates is 0.90 in primary education, 0.71 in lower secondary and 0.44 in upper secondary. In low income countries, the wealth parity index is 0.36 in primary education, 0.19 in lower secondary and 0.07 in upper secondary.
The establishment of the Inter-Agency Group on Education Inequality Indicators is a step in the right direction as it enables consistent analysis of survey data and pooling of untapped data sources. Progress at the global coordination level needs to trickle down to the country level.
GENDERParity was achieved globally in 2014 in primary, lower secondary and upper secondary education, though only 63%, 46% and 23% of individual countries achieved parity at the respective levels. National averages, moreover, mask disparity within countries and among particular groups. Sub-Saharan Africa reports gender parity of those who have completed primary education among the richest 20%, while among the poorest 20% just 83 females per 100 males completed primary education. The disparity widens to 73 females for lower secondary and 40 for upper secondary.
Adoption of the parity index to monitor gender aspects of target 4.5 extends its use beyond enrolment ratios to all education indicators, including learning outcomes. While this is positive, the index addresses only one of several domains in gender equality in education. To improve monitoring of gender equality in education, efforts need to focus on collecting more comprehensive data on gender aspects of curricula, textbooks, assessments and teacher education; and closer links are needed between those working on gender equality indicators in education and more broadly.
EquitySus
tainable Development Goal 4.5
TA R G E T 4 . 5
In low income countries, for every 100 among the richest youth who complete primary, lower secondary and upper secondary education, only 36, 19 and 7 do so, respectively, among the poorest youth

46
G L O B A L E D U C A T I O N M O N I T O R I N G R E P O R T 2 0 1 6S U M M A R Y
DISABILITY
Determining progress on equal access to education for people with disabilities requires an internationally comparable measure of disability, yet disability takes diverse forms. By one measure, across 30 education systems in Europe, 3.7% of compulsory education pupils were identified as having a special educational need in 2010. UNICEF and the
TABLE 2:Gender parity index, by region and country income group, 2014
Primary education Lower secondary education Upper secondary education
Gender parity index Countries with parity (%) Gender parity index Countries with parity (%) Gender parity index Countries with parity (%)
World 0.99 63 0.99 46 0.98 23
Low income 0.93 31 0.86 9 0.74 5Lower middle income 1.02 52 1.02 33 0.93 17Upper middle income 0.97 71 1.00 60 1.06 22High income 1.00 81 0.99 59 1.01 37
Caucasus and Central Asia 0.99 100 0.99 83 0.98 29Eastern and South-eastern Asia 0.99 86 1.01 57 1.01 37Europe and Northern America 1.00 93 0.99 67 1.01 31Latin America and the Caribbean 0.98 48 1.03 39 1.13 19Northern Africa and Western Asia 0.95 56 0.93 46 0.96 33Pacific 0.97 64 0.95 44 0.94 0Southern Asia 1.06 29 1.04 25 0.94 38Sub-Saharan Africa 0.93 38 0.88 19 0.82 6
Note: All values shown are medians. Source: UIS database.
FIGURE 11: Gender disparity is higher among the poorestGender parity index for selected education indicators, interaction with wealth, by region, 2008–2014
Gend
er p
arity
inde
x
0.7
0.6
0.4
0.5
1.1
1.0
0.8
0.9
1.4
1.3
1.2
Ever
bee
n to
sch
ool
Parity
Richest
Average
Poorest
Sub-Saharan Africa
Com
plet
ed p
rimar
y
Com
plet
ed lo
wer
sec
onda
ry
Com
plet
ed u
pper
sec
onda
ry
Ever
bee
n to
sch
ool
Southern Asia
Com
plet
ed p
rimar
y
Com
plet
ed lo
wer
sec
onda
ry
Com
plet
ed u
pper
sec
onda
ry
Ever
bee
n to
sch
ool
Northern Africa and Western Asia
Com
plet
ed p
rimar
y
Com
plet
ed lo
wer
sec
onda
ry
Com
plet
ed u
pper
sec
onda
ry
Ever
bee
n to
sch
ool
Europe and Northern America
Com
plet
ed p
rimar
y
Com
plet
ed lo
wer
sec
onda
ry
Com
plet
ed u
pper
sec
onda
ry
Ever
bee
n to
sch
ool
Latin America and the Caribbean
Com
plet
ed p
rimar
y
Ccom
plet
ed lo
wer
sec
onda
ry
Com
plet
ed u
pper
sec
onda
ry
Ever
bee
n to
sch
ool
Eastern and South-eastern Asia
Com
plet
ed p
rimar
y
Com
plet
ed lo
wer
sec
onda
ry
Com
plet
ed u
pper
sec
onda
ry
Note: Values for Eastern and South-eastern Asia and for Northern Africa and Western Asia refer only to low and middle income countries. Source: GEM Report team analysis (2016) based on household survey data.

47
S U M M A R YG L O B A L E D U C A T I O N M O N I T O R I N G R E P O R T 2 0 1 6
Washington Group on Disability Statistics are leading efforts to develop an operational measure of disability. It is also important to monitor whether educators are well prepared and school infrastructure adapted to address the needs of learners with disabilities.
LANGUAGEThe continuing neglect of mother-tongue-based multilingual education helps explain large disparities in education outcomes. More efforts are needed to monitor language policies in education. By one measure, about 40% of people around the world lack access to instruction in a language they speak or understand. Monitoring national policy documents cannot provide information on whether students have access to teaching and learning materials in their home language, teachers are prepared or official policies are implemented on the ground. In the Mopti region of Mali, only 1% of primary schools provided bilingual instruction in the appropriate language and by a trained teacher, despite national policy.
MIGRATION AND FORCED DISPLACEMENTDespite problems accommodating domestic rural migrants, who often move into slum or peri-urban areas with limited public school access, migration to urban areas generally facilitates access to public services. In the case of
international migrants, the challenge for policy-makers is that these students tend to be concentrated in schools in disadvantaged areas.
The main challenges concern the forcibly displaced. Internally displaced people remain relatively invisible. In 19 of 42 displacement camps in 6 states of Nigeria in June 2015, children had no access to formal or non-formal education. Refugees are the most vulnerable group: 50% of refugees at primary school age and 75% at secondary school age are out of school worldwide. Monitoring the education status of migrants and forcibly displaced people is difficult. Coordinated efforts need to be stepped up to better understand the reasons for the disparity in their access to education.
Literacy and numeracy
Sustain
able Development Goal 4.6
D
TA R G E T 4 . 6
Target 4.6 maintains the international focus on adult literacy that was part of the fourth EFA goal, and brings two important innovations. First, the global indicator on literacy and numeracy is formulated explicitly in terms of
skills proficiency. This comes close to the view of literacy as not just a set of basic cognitive skills but also the ability to use them to contribute to societies, economies and personal change. Second, explicitly referring to numeracy calls attention to its properties.
PARTICIPATION IN ADULT LITERACY PROGRAMMESMeasuring adult participation in formal and non-formal literacy programmes has proved surprisingly difficult. The Global Report on Adult Learning and Education needs to develop a standardized reporting template that at least captures adult participation in publicly provided or sponsored literacy programmes.
50% of refugees at primary school age and 75% at secondary school age are out of school worldwide

48
G L O B A L E D U C A T I O N M O N I T O R I N G R E P O R T 2 0 1 6S U M M A R Y
New analysis for the GEM Report used a question once regularly included in Demographic and Health Surveys; it showed that between 2004 and 2011 only 6% of adults aged 15 to 49 had ever participated in a literacy programme in 29 low and middle income countries. The majority of illiterate adults were female and poor, yet more men and richer adults had participated.
LITERACY RATESAlthough the SDG agenda rightly shifts attention to measures of proficiency in literacy skills, the needed measurement tools are not widely available, so reporting on youth and adult literacy based on traditional literacy rates continues. Over 2005–2014, some 758 million or 15% of adults globally lacked functional literacy skills; 63% of whom are women.
LITERACY AND NUMERACY PROFICIENCYInformation on adult literacy and numeracy proficiency levels, which are directly assessed, is available for many high income countries. Among participants in the OECD Programme for the International Assessment of Adult Competencies (PIAAC), 15% failed to reach a basic literacy proficiency standard, which involved drawing low-level inferences from texts; the rates ranged from less than 5% in Japan to almost 28% in Italy.
International collaboration is needed to facilitate comparative literacy and numeracy assessments. To provide useful monitoring data by 2030, a successful approach has to balance countries’ ability to proceed on their own against the need for assessments to meet global standards.
FIGURE 12:Assessing literacy on a continuous scale more accurately reflects adult skills Adult population by literacy proficiency level, 2011–2014
%
80
60
40
20
0
Ghan
a, u
rban
100
Keny
a, u
rban
Boliv
ia, u
rban
Colo
mbi
a, u
rban
Viet
Nam
, urb
an
Geor
gia,
urb
anAr
men
ia, u
rban
Ukra
ine,
urb
an
STEP
Chile
Turk
ey
Italy
Isra
el
Spai
nGr
eece
Sing
apor
e
PIAAC
Slov
enia
Fran
cePo
land
Unite
d St
ates
Germ
any
Irela
nd*U
nite
d Ki
ngdo
m
Cana
daDe
nmar
k
Lith
uani
a
Aust
ria*B
elgi
umSw
eden
Esto
nia
Kore
aAu
stra
lia
Nor
way
New
Zea
land
Net
herla
nds
Czec
h Re
p.Sl
ovak
ia
Finl
and
Japa
n
Level 1Below level 1 Level 3 and aboveLevel 2
Note: For countries with an asterisk (*), the PIAAC data refer to individual regions only: England and Northern Ireland for the United Kingdom, and Flanders for Belgium. Sources: OECD (2013; 2016) and GEM Report team analysis using World Bank STEP data.

49
S U M M A R YG L O B A L E D U C A T I O N M O N I T O R I N G R E P O R T 2 0 1 6
More than any other target, 4.7 touches on the social, humanistic and moral purposes of education. It explicitly links education to other SDGs and captures the transformative aspirations of the new global development agenda.
The GEM Report focuses on the proposed global indicator and examines how global citizenship and sustainable development are included in system-wide interventions, curricular materials such as national curriculum frameworks and textbooks, and teacher education programmes.
Identifying indicators to monitor knowledge, skills and attitudes needed to promote sustainable development is arduous. The report examines initiatives that could be used to monitor acquisition of relevant knowledge and skills, as well as youth and adult attitudes.
Target 4.7 is closely aligned with a lifelong learning framework, and does not specify the education levels or age groups to which its themes apply. The proposed global and thematic indicators mainly focus on children and adolescents in formal education. None of the proposed thematic indicators explicitly capture adult learners in non-formal and informal education.
CURRICULACurricula are the main way knowledge and skills to promote sustainable development and global citizenship are typically conveyed. One thematic indicator proposes measuring national implementation of the World Programme on Human Rights Education framework. The indicator captures elements of target 4.7 as regards human rights, fundamental freedoms and tolerance, among others.
Another proposed thematic indicator for target 4.7 – the percentage of schools providing life skills-based education on HIV/AIDS and on sexuality – responds to five elements of target 4.7: human rights, gender equality, culture of peace, non-violence, and knowledge and skills to promote sustainable development and lifestyles. The inclusion of
this indicator in education management information systems and school-based surveys has been piloted in some countries, which will allow for better future monitoring.
Further research into subject curricula would aid in understanding progress on target 4.7. Systematic lists of national curriculum frameworks and related materials are needed. GEM Report analysis of over 110 national curriculum framework documents for primary and secondary education in 78 countries showed that, over 2005–2015, three-quarters of countries had some emphasis on sustainable development issues, but far fewer made reference
to terms related to global citizenship. Gender equality was also less prevalent: Less than 15% of countries integrated key terms such as gender empowerment, gender parity or gender-sensitive, while half mentioned gender equality.
TEXTBOOKSRecent advances in textbook content analysis are promising for gauging curricular content. For the GEM Report, three data sets on secondary school textbooks in history, civics, social studies and geography were compiled. Analysis showed close to 50% of the textbooks mentioning human rights over 2000–2013, compared with around 5% over
Sustainable development and global citizenship
Sustain
able Development Goal 4.7
TA R G E T 4 . 7
Three-quarters of 78 countries had some emphasis on sustainable development issues in their curricula over 2005-2015

50
G L O B A L E D U C A T I O N M O N I T O R I N G R E P O R T 2 0 1 6S U M M A R Y
1890–1913. Just above 10% of textbooks in Northern Africa and Western Asia mentioned women’s rights in the last decade. Such analysis shows it is possible to develop valid and reliable measures using textbooks. A regular monitoring mechanism should be established to provide globally comparable data on textbook contents.
TEACHER EDUCATIONTeachers should be prepared to teach in areas related to sustainable development and global citizenship. Only 8% of 66 countries surveyed integrated sustainable development in teacher education in 2013, up from 2% in 2005. Teacher training programme content is seldom readily available, but some information, mostly regional, has been collected. Stronger efforts are urgently needed to assess concepts in target 4.7 for teacher preparation and training. Applying a standard coding protocol to the curricula of teacher training institutions would make it possible to analyse the effectiveness of professional development in preparing teachers to respond to various communities of students.
ACTIVITIES OUTSIDE THE CLASSROOM
Students are introduced to sustainability and global citizenship issues not only in school but also through academic clubs, student associations, sport, debate clubs, theatre productions, music groups, volunteer work and other activities. An analysis for the GEM Report found that well-designed, inclusive activities accessible to all improved conflict resolution and social cohesion, increased awareness of legal frameworks and concepts related to human rights, and promoted a sense of global citizenship. Existing data collection tools pay insufficient attention to the quality of experiences and development processes in such activities. The absence of shared reporting standards limits the chance of obtaining globally comparable and reliable data.
FIGURE 13:Human rights is the most prevalent concept in national curricula Percentage of countries including each of the key terms in their national curriculum frameworks, 2005–2015
Rights
Sustainable development
Renewable energy sources
Democracy
Ecology
Waste management
Freedom
Environmental education
Economic sustainability
Peace
Globalization
Multiculturalism/interculturalism
Global citizen(ship)
Migration/immigration
Global competition
Global–local thinking
Global inequality
Gender equality
Gender equity
Gender sensitivity
Gender parity
Empowerment
Social justice
Environmental sustainability
Social sustainability
Abuse/harassment/violence
Human rights education
Climate change
Education for sustainable development
Peace education
Hum
an ri
ghts
Sust
aina
ble
deve
lopm
ent
Peac
e an
d
non-
viol
ence
Glob
al c
itize
nshi
pGe
nder
equ
ality
%
Note: The analysis is based on a sample of 78 countries. Source: IBE (2016).
90705030100 10080604020
51
S U M M A R YG L O B A L E D U C A T I O N M O N I T O R I N G R E P O R T 2 0 1 6
OUTCOMESMonitoring the core aspiration of target 4.7 – acquisition of knowledge and skills needed for global citizenship and sustainable development – is not easy. A basic, interdependent understanding of world history, geography, international institutions and global processes could serve as a starting point, but few cognitive assessments exist in this area. In many countries, only two-thirds of students are familiar with the Universal Declaration of Human Rights.
A major challenge has to do with tension between local values and increasing global commitments. Recent initiatives seek to improve monitoring mechanisms for target 4.7 regarding adolescents, mainly in secondary education. In 2016, UNESCO and the International Association for the Evaluation of Educational Achievement officially began collaborating on measuring global citizenship and sustainable development knowledge. The Southeast Asia Primary Learning Metrics, focusing on global citizenship in grade 5, aims to develop comparative assessments that are more attuned to local conditions.
Education facilities and learning environments
Sustain
able Development Goal 4.A
TA R G E T 4 . A
Target 4.a recognizes child-centredness, democratic participation and inclusiveness as principles of a child-friendly school. Not all these are amenable to global monitoring, but three aspects of them are: school infrastructure, ICT
use, and violence and attacks in schools.
SCHOOL INFRASTRUCTUREImproving water, sanitation and hygiene facilities in education institutions can have significant positive effects on health and education outcomes. Yet only 71% of primary schools had adequate water supply in 2013, and the figure was just 52% in the 49 least developed countries.
When schools are unsafe, the impact of natural hazards is magnified. Some countries inspect school safety closely, but not all can afford to monitor in
detail. Participatory tools have been developed to help students and the community provide information on school conditions.
People with disabilities need to overcome a wide range of physical and social obstacles to gain access to schools. It is difficult to know if facilities are suitable for children with disabilities due to the lack of a definition of accessible schools and, often, limited monitoring capacity.
INFORMATION AND COMMUNICATION TECHNOLOGY IN SCHOOLSThe basis for monitoring ICT in education is the 2003 Geneva Plan of Action of the World Summit on the Information Society, which had two targets related to education.
Only 52% of primary schools had adequate water supply in 2013 in the least developed countries

52
G L O B A L E D U C A T I O N M O N I T O R I N G R E P O R T 2 0 1 6S U M M A R Y
Using ICT in schools requires readily and regularly available electricity. In many sub-Saharan African countries, the lack of mains electricity hampers the use of ICT. In the Central African Republic, practically no primary or secondary school was connected to an electrical grid. In Guinea and Madagascar, there are more than 500 learners per computer.
VIOLENCE AND ATTACKS IN SCHOOLSSchool-related violent acts or threats occur on school premises but also on the way to school, at home or in cyberspace. While attention usually focuses on extreme events, such as shootings, more common forms of violence have the largest negative impact on the education experience of children and adolescents. They tend to be under-reported, as they often involve taboos.
Bullying is the most widely documented form of violence in schools. In the 2011 Trends in International Mathematics and Science Study, about 41% of grade 8 students reported having been bullied at least once in the previous month. Physical violence is very common. About 40% of 13- to 15-year-olds in 37 countries reported having been involved in physical fights over 2009–2012. Sexual violence is a highly destructive form of violence in schools, much of whose scale and scope remain hidden. Overall, international surveys need to better coordinate the questions they use to ensure consistent measurement of global school-based violence trends.
Monitoring of attacks related to education is also vital to respond effectively and hold perpetrators accountable. Military use of schools took place in 26 countries over 2005–2015. In 2009–2012, 1,000 or more education-related attacks per country took place in six countries.
FIGURE 14:Most primary schools do not have electricity in some of the poorest countries Proportion of primary and secondary schools with electricity, 2009–2014
Scho
ols
with
ele
ctric
ity (%
)
100
80
60
40
20
0
C. A
. R.
Mad
agas
car
Sier
ra L
eone
Buru
ndi
Nig
erN
epal
Mya
nmar
Mal
iD.
R. C
ongo
Togo
Guin
eaCo
mor
osU.
R. T
anza
nia
Mal
awi
Lao
PDR
Sene
gal
Beni
nN
icar
agua
Zam
bia
Gam
bia
Côte
d’Iv
oire
Ghan
aEr
itrea
Indi
aVe
nezu
ela,
B. R
.Ba
ngla
desh
Nam
ibia
Bhut
anCa
bo V
erde
Bots
wan
aEc
uado
rIn
done
sia
Phili
ppin
esBe
lize
Mor
occo
S. T
ome/
Prin
cipe
Cost
a Ri
caSu
rinam
eBr
azil
Para
guay
Arge
ntin
aSw
azila
ndEl
Sal
vado
rSo
uth
Afric
aUr
ugua
yAl
geria
Thai
land
Jord
anIra
n, Is
l. Re
p.Se
yche
lles
Mau
ritiu
sM
aldi
ves
Sing
apor
eRe
p. o
f Kor
eaM
alay
sia
Hong
Kon
g, C
hina
Qat
arPa
lest
ine
100
80
60
40
20
0
Om
anEg
ypt
Turk
s/Ca
icos
IsTr
inid
ad/T
obag
oSi
nt M
aart
enSt
Vin
cent
/Gre
nad.
Sain
t Luc
iaSt
Kitt
s/N
evis
Mon
tser
rat
Jam
aica
Gren
ada
Dom
inic
aCu
raça
oCu
baCa
yman
IsBr
. Virg
in Is
Barb
ados
Baha
mas
Arub
aAn
tigua
/Bar
buda
Angu
illa
Kyrg
yzst
anGe
orgi
aAr
men
iaBe
laru
s
Secondary
Primary
Source: UIS database.
About 40% of 13- to 15-year-olds in 37 countries reported having been involved in physical fights over 2009–2012

53
S U M M A R YG L O B A L E D U C A T I O N M O N I T O R I N G R E P O R T 2 0 1 6
Target 4.b, focusing on specific countries, does not appear consistent with a universal agenda. Like all the targets, it aspires to reduce inequality between countries, but it could exacerbate inequality within countries because
scholarship beneficiaries tend to have advantaged backgrounds. In addition, many scholarship recipients do not return to their countries. This would suggest that scholarships tend to support the higher education institutions of richer countries instead of benefiting poorer ones.
The formulation of target 4.b is lacking in several respects. It is recommended that scholarships be counted as eligible only if they refer to study at higher education institutions in countries other than students’ home countries and are at least partly publicly funded.
The outbound mobility ratio, i.e. the number of students from a country studying abroad, expressed as a percentage of total tertiary enrolment in that country, is 1.8% for developing countries. However, in some countries, notably among small
FIGURE 14:Most primary schools do not have electricity in some of the poorest countries Proportion of primary and secondary schools with electricity, 2009–2014
Scho
ols
with
ele
ctric
ity (%
)
100
80
60
40
20
0
C. A
. R.
Mad
agas
car
Sier
ra L
eone
Buru
ndi
Nig
erN
epal
Mya
nmar
Mal
iD.
R. C
ongo
Togo
Guin
eaCo
mor
osU.
R. T
anza
nia
Mal
awi
Lao
PDR
Sene
gal
Beni
nN
icar
agua
Zam
bia
Gam
bia
Côte
d’Iv
oire
Ghan
aEr
itrea
Indi
aVe
nezu
ela,
B. R
.Ba
ngla
desh
Nam
ibia
Bhut
anCa
bo V
erde
Bots
wan
aEc
uado
rIn
done
sia
Phili
ppin
esBe
lize
Mor
occo
S. T
ome/
Prin
cipe
Cost
a Ri
caSu
rinam
eBr
azil
Para
guay
Arge
ntin
aSw
azila
ndEl
Sal
vado
rSo
uth
Afric
aUr
ugua
yAl
geria
Thai
land
Jord
anIra
n, Is
l. Re
p.Se
yche
lles
Mau
ritiu
sM
aldi
ves
Sing
apor
eRe
p. o
f Kor
eaM
alay
sia
Hong
Kon
g, C
hina
Qat
arPa
lest
ine
100
80
60
40
20
0
Om
anEg
ypt
Turk
s/Ca
icos
IsTr
inid
ad/T
obag
oSi
nt M
aart
enSt
Vin
cent
/Gre
nad.
Sain
t Luc
iaSt
Kitt
s/N
evis
Mon
tser
rat
Jam
aica
Gren
ada
Dom
inic
aCu
raça
oCu
baCa
yman
IsBr
. Virg
in Is
Barb
ados
Baha
mas
Arub
aAn
tigua
/Bar
buda
Angu
illa
Kyrg
yzst
anGe
orgi
aAr
men
iaBe
laru
s
Secondary
Primary
Source: UIS database.
Scholarships$
Sustain
able Development Goal 4.B
TA R G E T 4 . B
Information collected for this report from 54 government scholarship programmes indicates that some 25,000 scholarships were offered in 2015
FIGURE 15:Half of all aid for scholarships and imputed student costs is concentrated in 13 middle income countries Distribution of scholarships and imputed student costs by recipient country, 2014
China
Morocco
India
Algeria
Turkey
Tunisia
Cameroon
Viet Nam
Ukraine
Iran, Isl. Rep.
Brazil
Indonesia
Syrian A. R.
Other
Least developed countries and small island developing states, 386
370
162
113
112
9185818074
7171
6051
US$996 million
Source: GEM Report team analysis (2016) using OECD DAC data.

54
G L O B A L E D U C A T I O N M O N I T O R I N G R E P O R T 2 0 1 6S U M M A R Y
Teachers
Sustainable Development Goal 4.C
TA R G E T 4 . C
There has been dissatisfaction that the SDGs treat teachers as a ‘means of implementation’, which risks underestimating the profession’s fundamental contribution to the provision of good quality education and an
enabling learning environment. The formulation of the target is weak, with a limited conception of key teacher issues.
The GEM Report addresses the monitoring implications of the more general commitment, expressed in the Education 2030 Framework for Action, to ‘ensure that teachers and educators are empowered, adequately recruited, well-trained, professionally qualified, motivated and supported’.
ADEQUATE SUPPLY OF QUALIFIED TEACHERSOvercrowded classrooms remain common in many of the poorest countries, pointing to an inadequate supply of teachers. There are two major challenges in defining a teacher shortage: Statistics on average teacher availability hide substantial inequality within countries, and the quantity of teachers cannot be isolated from quality. Policy-makers have often responded to expanding enrolment and increasing class size by lowering hiring standards.
Data are scarce on what the target refers to as the supply of ‘qualified’ teachers, which tends to be understood mainly in terms of academic qualifications. In 2014, on average, 82% of teachers had the minimum qualifications required to teach in pre-primary education, 93% in primary education and 91% in secondary education.
island developing states, it is considerably higher. In Saint Lucia, five nationals study abroad for every ten students in the country.
Surprisingly, there is no consolidated global evidence on scholarship numbers, let alone recipients’ nationalities or fields of study. Information collected for the GEM Report from 54 government scholarship programmes indicates that some 22,500 scholarships were offered in 2015, corresponding to 1% of the number of mobile students from low and lower middle income countries.
A global mechanism for monitoring scholarships is needed to report on indicators such as number of scholarships awarded, number of scholarship years awarded, number of recipients who complete their studies and number of recipients who return home.
Aid data can give partial information on scholarship programmes. In 2014, US$2.8 billion of aid was allocated to scholarships and imputed student costs. Of this, US$386 million was directed to least developed countries and small island developing states.

55
S U M M A R YG L O B A L E D U C A T I O N M O N I T O R I N G R E P O R T 2 0 1 6
The global indicator for target 4.c – the percentage of teachers with minimum training – has wider coverage but lacks a benchmark with which to compare national standards. Even so, there is clear evidence that many teachers have not received the minimum training. In the Caribbean, 85% of primary school teachers are trained. In Northern Africa and Western Asia, 73% of pre-primary school teachers are trained. In sub-Saharan Africa, less than half of pre-primary and three quarters of upper secondary school teachers are trained.
Aid to teacher training tripled over 2002–2014 to US$251 million, equivalent to 2% of total direct aid to education. Least developed countries received 41% of total aid to teacher training and small island developing states 7%.
TEACHER MOTIVATION AND SUPPORTHow to motivate and support teachers is a major policy concern reflected in the Education 2030 Framework for Action. Collecting information directly from teachers on factors such as motivation and job satisfaction entails considerable challenges.
The report looked at external factors, primarily related to government policy: induction and mentoring, continuous professional development, working conditions and remuneration. The 2013 Teaching and Learning International Survey found that about 25% of lower secondary school teachers with fewer than five years of experience said they had been assigned a mentor, dropping to 6% in Chile and 9% in Italy.
A competitive remuneration package is an essential component of recruiting and retaining the best people to the profession. In the Dominican Republic, the average teacher earned about 70% as much as other professionals, while in Uruguay, teachers enjoyed a slight advantage.
Overall, there is a long way to go before reliable data on salaries, working conditions and attrition can be captured.
FIGURE 16:More than half of pre-primary and one-quarter of secondary school teachers in sub-Saharan Africa are not trainedPercentage of trained teachers, by education level and region, 2014
Trai
ned
teac
hers
(%)
100
80
60
40
20
0
Caucasus and Central Asia
Pre-primary
90
70
10
30
50
South-eastern Asia
Northern Africa and Western Asia
Caribbean Sub-Saharan Africa
Primary Secondary
Source: UIS database.

56
G L O B A L E D U C A T I O N M O N I T O R I N G R E P O R T 2 0 1 6S U M M A R Y
FinanceSus
tainable Development Goal 4.5
TA R G E T 4 . 5
The 2030 Agenda includes three targets related to means of implementation, but none refer to education financing – even though lack of equitable and adequate financing was a key reason the world fell short of achieving the EFA
goals in 2015.
Regardless of the absence of a financing target, comprehensive and regular education financing data are a prerequisite for effective education sector planning and for monitoring the commitment of all partners to the global education agenda.
NATIONAL EDUCATION ACCOUNTSDebates on education financing rarely consider how the sources of education expenditure – government spending, external assistance and household spending – combine and affect one another. Faced with a similar challenge, the health sector developed national health accounts to collect and process health expenditure data.
A recent project aims to introduce a national education account (NEA) methodology in eight countries. For example, the government of Nepal spends 3.5% of GDP on education, 2.6 percentage points less than Viet Nam. But when households and other sources are taken into account, the order is reversed: Nepal allocates 1.5 percentage points more to education than Viet Nam.
IMPROVING FINANCIAL DATATo build strong NEAs, information on expenditure flows from governments, aid partners and households needs to improve.
PUBLIC EXPENDITURE
The Education 2030 Framework for Action proposed two benchmarks as ‘crucial reference points’: allocate at least 4% to 6% of GDP to education, and/or allocate at least 15% to 20% of public expenditure to education. Globally, countries
TABLE 3:Public education expenditure, by region and country income group, 2014
Public education expenditureas % of GDP
Number of countriesthat spent <4% of GDP
Public education expenditureas % of public expenditure
Number of countriesthat spent <15% of public
expenditure
Number of countries that spent<4% of GDP and <15% of public
expenditure
World 4.6 51 14.2 70 35
Low income 3.9 13 16.7 9 9Lower middle income 4.1 13 15.6 13 10Upper middle income 4.6 9 15.7 11 7High income 4.9 16 11.9 37 9
Caucasus and Central Asia 2.8 4 12.9 3 3Eastern and South-eastern Asia 3.9 7 15.4 6 4Europe and Northern America 5.0 7 12.1 31 5Latin America and the Caribbean 4.9 7 16.1 6 3Northern Africa and Western Asia ... 3 ... 5 3Pacific ... 2 ... 2 1Southern Asia 3.8 5 15.3 4 4Sub-Saharan Africa 4.3 16 16.6 13 12
Note: All values shown are medians. Source: UIS database

57
S U M M A R YG L O B A L E D U C A T I O N M O N I T O R I N G R E P O R T 2 0 1 6
spend 4.6% of GDP on education and allocate 14.2% of public expenditure to education; at least 35 countries spend less than 4% of GDP and allocate less than 15% of public expenditure to education.
Analysis of the key public education financing indicators reveals an erratic supply of information. Only 60% of countries have data on total education expenditure as a percentage of GDP for any given year since 2000. To ensure that good data on education expenditure are available, good public expenditure management at the national level is vital.
A review of public expenditure must extend to its equity focus and the extent to which it compensates for disadvantage in education. Comparison across countries is feasible but requires considerable effort towards introducing a process, agreeing on a framework and actually carrying out an assessment. To get countries on board, the emphasis should be on establishing a peer review mechanism through which they can learn from one another.
AID EXPENDITURE
Aid needs to increase at least sixfold to fill the US$39 billion annual financing gap, but in 2014, aid levels were 8% lower than at their peak in 2010. The gap could be filled if donors dedicated 0.7% of gross national income (GNI) to aid and allocated 10% of aid to basic and secondary education; since 2005, total aid flows have fluctuated at around 0.3% of donor countries’ national income.
Poorer countries should be prioritized in aid, yet low income countries received 28% of total aid to basic education in 2014 while accounting for 43% of children who do not complete primary school.
Levels of humanitarian aid need to be tracked as well. In 2015, education received US$198 million, or less than 1.9% of total humanitarian aid.
HOUSEHOLD EXPENDITURE
The share of households in total education expenditure tends to be much higher in poorer than in richer countries. Reducing that share is key to fulfilling the new education targets’ focus on equity. Information on household expenditure is available in most countries. Analysis for the GEM Report showed that at least 99 of the low and middle income countries included relevant questions in a national expenditure survey between 2008 and 2014; 67 included questions on individual expenditure items. However, such data are rarely used. Policy-makers may be unaware of the data’s existence and importance, or their capacity to analyse them and draw relevant conclusions is limited.
FIGURE 17:Aid to education has yet to return to 2010 levelsTotal aid to education disbursements, 2002–2014
Cons
tant
US$
201
4 bi
llion
s
0
4
2
Total aid to basic education
6
10
8
14
12
16
2002
Total aid to secondary education
Total aid to post-secondary education
2003 2004 2005 2006 2007 2008 2009 2010 2011 2012 2013 2014
Source: GEM Report team analysis based on information in the OECD CRS database.
6.5
8.5
9.8
11.0
12.1 11.9
14.0 14.213.6
12.813.6
13.1
8.9
2.6
4.2
4.5
4.9
5.1 4.8
5.4 5.65.4
5.25.3 4.9
4.0
1.0 1.11.3
2.9 3.2 3.6
1.2
4.1
1.6
4.5
1.9
5.0
2.0
5.1
2.5
6.1
2.4
6.2
2.2
5.9
2.3
5.3
2.8
5.6
2.8
5.3
58
G L O B A L E D U C A T I O N M O N I T O R I N G R E P O R T 2 0 1 6S U M M A R Y
Education systems
A broad range of validated, largely qualitative indicators of education systems and policies is needed to support monitoring of the Education 2030 agenda. While a
global framework might be desirable, in practice a regional or subregional approach is more feasible.
GLOBAL TOOLS FOR MONITORING EDUCATION SYSTEMSIn 1996, the UNESCO International Bureau of Education (IBE) established the World Data on Education series. It has been a valuable source of information on education systems at the global level, but resource constraints plagued its development and there is no plan to update the series, which was last published in 2011.
UNESCO does provide other global databases of education systems related to compulsory and free education or TVET systems.
A more in-depth look into policies is provided by the World Bank’s Systems Approach for Better Education Results (SABER), launched in 2011. It examines 13 aspects of national education systems. For it to serve as a global monitoring tool, at least two issues need to be addressed: agreement on the scope, coverage and regularity of the reviews; and greater country ownership.
REGIONAL TOOLS FOR MONITORING EDUCATION SYSTEMSMonitoring may be best served at a regional rather than global level. Members of a regional entity are more likely to voluntarily exchange information on their education systems. Three examples stand out. The Eurydice Network on Education Systems and Policies in Europe, established in 1980, has grown into a network of 40 national units in 36 countries. The OECD’s Indicators of Education Systems (INES) programme was introduced in 1992. One of its three networks evolved in 2009 into the INES Network for System-Level Indicators (NESLI). The Organization of Ibero-American States has an education strategy and a specialized body to review progress on indicators, some of which are system-related.
The GEM Report makes a strong case for education system indicators to be monitored to facilitate dialogue and encourage governments to learn from one another at the regional level.
While a global framework for reviewing education systems and policies might be desirable, in practice a regional or subregional approach is more feasible

59
S U M M A R YG L O B A L E D U C A T I O N M O N I T O R I N G R E P O R T 2 0 1 6
Education in the other Sustainable Development Goals
The 2030 Agenda for Sustainable Development recognizes not only the importance of a separate education goal but also the need to achieve other goals through education. Among SDGs other than SDG 4, there are indicators
that refer to education directly and indirectly.
DIRECT REFERENCES TO EDUCATIONEducation is directly mentioned in five global indicators outside SDG 4: on government spending on education, health and social protection; on education as a means of achieving gender equality; on youth not in education, employment or training; and on global citizenship education and education for sustainable development.
INDIRECT REFERENCES TO EDUCATIONIn addition to monitoring indicators that explicitly refer to education, future GEM Reports will pay attention to indirect references to education in the other SDGs. Three examples
are highlighted: education as a factor associated with other development outcomes; indicators that refer to human resource capacity, which are related to professional and higher education; and the potential role of adult education.
Disaggregating relevant global indicators by education levels would shed more light on the underlying inequality that obstructs achievement of the SDG targets. Global indicators that could be monitored this way include those related to poverty, malnutrition, child marriage, access to improved sanitation, access to electricity, unemployment, slum populations, recycling, disaster deaths, violence and birth registration. For example, across 54 low and middle countries with data for 2008–2015, the average number of births per 1,000 women was 176 among women with no education, 142 with primary education, 61 with secondary and 13 with tertiary.
FIGURE 18:Education is positively associated with desirable development outcomesAdolescent birth rate (births per 1,000 women, aged 15 to 19 years), 1997–2014
1998
Birt
hs p
er 1,
000
wom
en
0
50
100
150
200
250
300No educationPrimarySecondaryHigher
2011
Cameroon
Western and Central Africa
1998 2014
Ghana
1997 2009
Madagascar
Eastern and Southern Africa
2000 2011
Ethiopia
2001 2011
Nepal
Southern Asia
2007 2013
Pakistan
1997 2013
Yemen
Northern Africa and Western Asia
2000 2014
Egypt
2000 2012
Haiti
Latin America and the Caribbean
2000 2012
Peru
2000 2014
Cambodia
Eastern and South-eastern Asia
1997 2012
Indonesia
Source: Demographic and Health Survey STATcompiler (2016).
Education is directly mentioned in global indicators for five sustainable development goals outside SDG 4

60
G L O B A L E D U C A T I O N M O N I T O R I N G R E P O R T 2 0 1 6S U M M A R Y
Priorities for monitoring education in the Sustainable Development Goals
The review of the monitoring challenges of each SDG 4 target points to priorities for action at the national, regional and global levels. These are meant to ensure that there is sufficient comparable information to foster a
global dialogue over progress toward SDG 4. Doing so does not undermine country monitoring of its own progress in education, which focuses on its national context and specific needs.
The proposed monitoring framework provides a platform for international and national agencies to exchange information about progress and measurement challenges. The newly established Technical Cooperation Group, with strong country representation, will further develop and help implement this framework, thereby advancing the international dialogue on education monitoring.
AT THE NATIONAL LEVEL: BUILD CAPACITY IN SIX KEY AREASSix key steps are proposed for countries to make substantive progress in the next three to five years to strengthen national monitoring while also contributing to the global monitoring of education.
Equity. Cooperation is necessary between education ministries and national statistical agencies to shed light on basic disparities and use a wider variety of data sources.
Learning outcomes. Countries need to ensure that a robust sample-based national learning assessment is in place that can be used to monitor progress in learning over time.
Quality. Countries need to monitor curricula, textbooks and teacher education programmes closely to ensure adequate commitment to the objectives of target 4.7.
Lifelong learning. Countries need to monitor education needs, opportunities and accomplishments of their adult populations who will have to take critical decisions on sustainable development.
Systems. Regional organizations offer countries appropriate forums for exchanging information on the characteristics of their education systems and learning from one another.
Finance. Countries are encouraged to adopt the national education accounts approach to understand better how education expenditure is shared between governments, donors and households.
AT THE REGIONAL LEVEL: SUPPORT PEER LEARNINGUsing regional networks as peer learning mechanisms, countries can exchange information, for example on the aims and policies they apply to tackle disadvantage in education, and on the extent to which they pursue education for sustainable development and global citizenship education.
AT THE GLOBAL LEVEL: FOSTER CONSENSUS AND COORDINATIONThree steps are proposed to coordinate measurement tools and research on global issues. An international household survey programme dedicated to education is needed to fill several major gaps. A consistent approach to monitoring learning outcomes is also required, including a code of conduct among donors to avoid overlap. The establishment of a research hub for global education measurement issues is strongly recommended, with a special focus on helping build consensus on key education outcomes.
A data revolution in education has to involve agreement on basic concepts, investment in robust systems and coordination to ensure accessibility, openness and accountability of data.

61
S U M M A R YG L O B A L E D U C A T I O N M O N I T O R I N G R E P O R T 2 0 1 6
A shoe rack in a school in the Chittagong, Bangladesh, showing the number of children attending class that day.
CREDIT: Ripon Barua/UNESCO
61


Education for People and Planet: Creating Sustainable Futures for All
explores the complex relationship between education and the new
2030 Agenda for Sustainable Development, covering six fundamental
pillars – Planet, Prosperity, People, Peace, Place and Partnerships. This
report shows that education will not deliver its full potential unless
participation rates increase dramatically and sustainable development
guides education system reform. It also warns of the destructive
impact that climate change, conflict, unsustainable consumption and
the increasing gap between rich and poor have on education. A huge
transformation is needed if we are to create sustainable futures for all.
This summary edition of the Global Education Monitoring Report (GEM
Report) is the first in a series that will assess the progress of education
under the new Sustainable Development Goals (SDGs). The GEM Report
provides evidence-based recommendations on the policies, strategies
and programmes needed to meet the ambitious Education 2030
vision. It discusses the challenges of monitoring progress on the new
global education goal and targets to ensure improvement in access,
participation, completion, learning and reduced inequality. It provides
readers with an authoritative source to enable them to argue for the
value and importance of education at all levels of decision-making.
The GEM Report is an editorially independent, evidence-based
publication that serves as an indispensable tool to promote informed
dialogue and increase awareness about progress and challenges in
education. This series of reports has assessed progress in education
in some 200 countries and territories since 2002. Building on this
experience, and with a new mandate to monitor education progress
in the SDGs, the GEM Report will serve as a key global resource for the
follow-up and review process over the next 15 years.
C R E A T I N G S U S T A I N A B L E F U T U R E S F O R A L L
Education for people and planet:
www.unesco.org/publishing • www.unesco.org/gemreport
SustainableDevelopmentGoals
United NationsEducational, Scientific and
Cultural Organization
Sustainable DevelopmentGoals