education development index for bangladesh - world bank web view68828education development index for...
TRANSCRIPT

EDUCATION DEVELOPMENT INDEX FOR BANGLADESH
In Quest of a Mechanism for Evidence Based Decision Making In Primary Education
Human Development UnitSouth Asia RegionThe World Bank May 2009
68828

The World Bank
World Bank Office DhakaPlot – E-32, Agargaon,Sher-e-Bangla Nagar,Dhaka – 1207, BangladeshTel: 880-2-8159001-28Fax: 880-2-8159029-30www. worldbank. org. bd
The World Bank1818 H Street, N. W. Washington DC 20433, USATel: 1-202-473-1000Fax: 1-207-477-6391
Standard Disclaimer:This volume is a product of the staff of the International Bank for Reconstruction and Development/The World Bank. The findings, interpretations, and conclusions expressed in this paper do not necessarily reflect the views of the Executive Directors of the World Bank or the governments they represent. The World Bank does not guarantee the accuracy of the data included in this work. The boundaries, colors, denominations, and other information shown on any map in this work do not imply any judgment on the part of the World Bank concerning the legal status of any territory or the endorsement or acceptance of such boundaries.
Copyright Statement:The material in this publication is copyrighted. The World Bank encourages dissemination of its work and will normally grant permission to reproduce portion of the work promptly.
Design:Cover Designed by Senjuti Jui Nasir
Printed by Creative Idea
CURRENCY AND EQUIVALENTCurrency Unit = TakaUS$ 1 = Taka 68FISCAL YEAR: July 1 – June 30
ABBREVIATIONS AND ACRONYMSBANBEIS – Bangladesh Bureau of Education Information and Statistics BAPS – BRAC Adolescent Primary SchoolBBS - Bangladesh Bureau of StatisticsBIDS – Bangladesh Institute of Development StudiesBPS – BRAC Primary SchoolBRAC - Bangladesh Rural Advancement CommitteeCAMPE – Campaign For Popular Education DHS - Demographic and Health SurveyDPE – Directorate of Primary EducationEFA – Education For AllFFE – Food For Education GDP – Gross Domestic ProductGER – Gross Enrollment RateGNI – Gross National IncomeGoB - Government of BangladeshGPS – Government Primary SchoolHIES - Household Income and Expenditure SurveyIDA – International Development AssociationIDEAL – Intensive District Approach to Education for AllMDG - Millennium Development GoalMoPME – Ministry of Primary and Mass EducationNAPE – National Academy for Primary EducationNCTB – National Curriculum and Textbook BoardNER – Net Enrollment RateNGO – Non Government OrganizationNPA – National Plan of ActionNRNGPS – Non-registered Non-Government Primary SchoolPCA – Principal Component AnalysisPEDP - Primary Education Development ProjectPLCE – Post Literacy and Continuing Education PTI – Primary Teacher InstitutePTR – Pupil Teacher RatioRNGPS – Registered Non-Government Primary SchoolROSC – Reaching Out of School ChildrenSDC – Swiss Development CooperationSMCs- School Management CommitteesTIMMS – Trends in International Mathematics and Science Study
iii
Vice President : Isabel M. GuerreroCountry Director : Ellen A. GoldsteinSector Director : Michal RutkowskiSector Manager : Amit DarTask Manager : Syed Rashed Al Zayed

Acknowledgements
This report is prepared by a joint team of the World Bank and the DFID. The team members are
Syed Rashed Al Zayed (World Bank), Helen J. Craig (World Bank), Subrata S. Dhar (World
Bank), Pema Lazhom (World Bank), Fazle Rabbani (DFID), Kriapli Manek (DFID), and Selim
Raihan (Consultant, World Bank) under the overall guidance of Michal Rutkowski (Sector
Director, SASHD), Amit Dar (Sector Manager, SASHD), and Ellen A. Goldstein, Country
Director for Bangladesh (SACBG). The activity was funded by DFID.
The team would first like to thank the officials of Directorate of Primary Education for providing
the data set to use, reviewing the report and suggesting improvements. MIS unit of LGED has
kindly provided assistance in making the maps. The team benefitted enormously from the
valuable feedback received from the participants of the stakeholder workshops.
Deepa Sankar (World Bank, Delhi) provided valuable guidance from the very beginning of the
effort. The team would also like to acknowledge the valuable contribution of Mokhlesur Rahman,
Yoko Nagashima and Shaikh Shamsuddin Ahmed. The team also appreciates Nazma Sultana for
her help in formatting the document and also for providing logistical supports.
Peer reviewers of the report are Yidan Wang and Lianqin Wang. The team has immensely
befitted from their feedback and suggestions.
iv

Foreword
This Policy Note on the Education Development Index (EDI) for Bangladesh was prepared by a
joint team of the World Bank and Department for International Development (DfID). The note
aims at designing an Education Development Index (EDI) for Bangladesh. This is the crucial first
step towards developing a comprehensive and composite index of educational performance in
Bangladesh. The broad objective of this effort is to facilitate better decision making in resource
allocation for the education sector. On the ground, annual updating of the EDI will help monitor
progress in primary education and compare achievements across different upazilas and districts.
Administrative data from the Department of Primary Education (DPE) were used in developing
this index. The methodology and initial findings were shared with different stakeholders,
including DPE officials, during preparation of the report.
The study has identified some regions (e.g, Sylhet and Chittagong Hill Tracts) which severely lag
behind others in terms of educational attainment. A positive correlation between inputs and
outputs is also evident. With some exceptions, economically disadvantaged regions have lower
EDI rankings. A dismal picture also emerges in the thanas within metropolitan areas, particularly
in the slum areas. This problem demands serious attention from policy makers.
We hope this report will assist policy makers in formulating effective policies and targeting
interventions so that Bangladesh can achieve the Millennium Development Goals related to
education.
v
Michal RutkowskiDirector, Human Development South Asia Region
Ellen GoldsteinCountry Director World Bank Office, Dhaka
Chris AustinCountry Representative DFID

TABLE OF CONTENTS
Abbreviations And Acronyms………………………………………………………………………. iiiAcknowledgement……………………………………………………………………………………. Foreword……………………………………………………………………………………………….
ivv
Executive Summary…………………………………………………………………………………. vii
Section 1: Introduction……………………………………………………………. 01 A word of Caution……………………………………………………………………. . . 02 Need for a strategic instrument………………………………………………………. . 02 Scope and coverage of the study……………………………………………………… 04
Section 2: Methodology and Sources of Data……………………………………. 06 Methodology…………………………………………………………………………. . 06 Data Source…………………………………………………………………………. . 08
Section 3: Primary Education Sector of Bangladesh……………………………. . 10 Size and providers of the sector…………………………………………………. . 10 Financing…………………………………………………………………………. . 11 Recent achievements and EFA goals……………………………………………. 11
Section 4: Results and result analysis……………………………………………. 14
Section 5: Conclusion…………………………………………………………………… 23
Annexes……………………………………………………………………………………. 27Annex 1(a): Steps of constructing an EDI…………………………………………. . 28Annex 1(b): Definition of PCA……………………………………………………. . . 31Annex 2: Stakeholder Workshop…………………………………………………… 37Annex 3(a): District Ranking………………………………………………………. 39Annex 3(b): Upazilas by EDI Deciles……………………………………………… 42Annex 4(a): Map 1 – EDI Ranking (Overall)- Distribution of Districts……………. 50Annex 4(b): Map 2 – EDI Ranking (Overall)- Distribution of Upazilas…………… 51Annex 4(c): Map 3 –Distribution of Upazilas by Primary Enrolment……………… 52Annex 4(d): Map 3 –Distribution of Upazilas by Incidence of Poverty……………. 53
References…………………………………………………………………………………… 54
vi
Executive Summary
Objective
The study aims at developing an Educational Development Index (EDI) for Bangladesh. The
present effort is the crucial first step towards developing a comprehensive and composite index of
educational performance in Bangladesh. While the broader objective of the activity is to facilitate
the decision making process for resource allocation and policy directions, the primary objective is
to monitor progress in the primary education sector for district/upazila comparisons for better
decision making processes. The exercise has been considerably constrained by the lack of
dependable robust data. It is hoped that this report will make the policymakers aware of the need
and importance of collection of reliable and more comprehensive information on a regular basis.
Need for a Strategic Instrument
While Bangladesh’s achievement towards universal access to education and gender parity at
primary and secondary level are remarkable, the country still needs to do a lot to achieve the
Education for All (EFA) goals. Existing research shows disparity in educational attainment in
different geographical regions of the country. Despite sincere efforts, previous research has also
shown that the poor have undoubtedly suffered from inadequate budget allocation. Levels of
achievements are also not same across the country. Aggregate level analysis at the national level
or even at the divisional level obscures regional disparities. Analyzing multiple indicators of
heterogeneous nature to assess the overall development is a complex task. Though, all of these
indicators are individually important, the policy makers need a specific strategic instrument that
will sum up all parameters and will assist in identifying the regions lagging behind in comparison
to the national average or neighboring regions and parameters that require special attention.
Based on this background the need for developing an Index is felt which can capture, in single
index, the level of educational achievement by divisions, districts and upazilas.
Scope and coverage of the study
Current effort of developing an EDI for Bangladesh has only covered the Primary education
sector of the country. This is the biggest education sector of the country serving 17 million
children through more than 80,000 schools and 350,000 teachers. The index has been measured
at the upazila, district and the division level.
vii

A word of caution
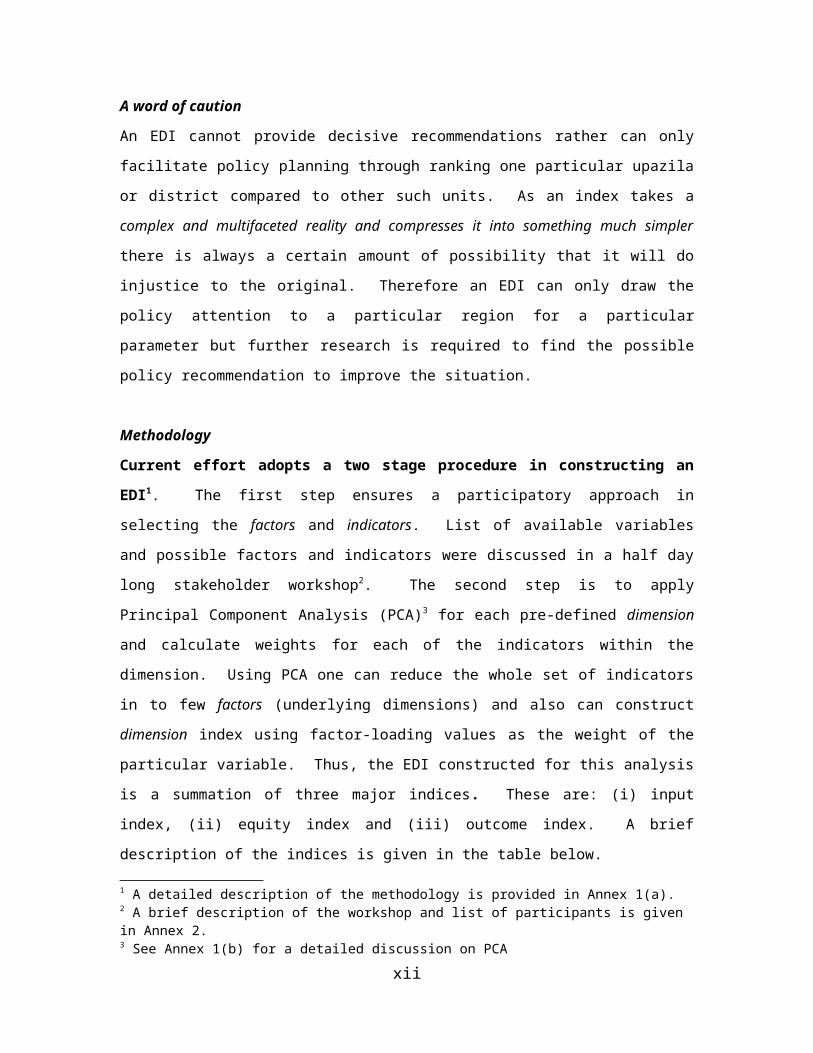
An EDI cannot provide decisive recommendations rather can only facilitate policy planning
through ranking one particular upazila or district compared to other such units. As an index takes
a complex and multifaceted reality and compresses it into something much simpler there is
always a certain amount of possibility that it will do injustice to the original. Therefore an EDI
can only draw the policy attention to a particular region for a particular parameter but further
research is required to find the possible policy recommendation to improve the situation.
Methodology
Current effort adopts a two stage procedure in constructing an EDI1. The first step ensures a
participatory approach in selecting the factors and indicators. List of available variables and
possible factors and indicators were discussed in a half day long stakeholder workshop 2. The
second step is to apply Principal Component Analysis (PCA)3 for each pre-defined dimension and
calculate weights for each of the indicators within the dimension. Using PCA one can reduce the
whole set of indicators in to few factors (underlying dimensions) and also can construct
dimension index using factor-loading values as the weight of the particular variable. Thus, the
EDI constructed for this analysis is a summation of three major indices. These are: (i) input
index, (ii) equity index and (iii) outcome index. A brief description of the indices is given in the
table below.
1 A detailed description of the methodology is provided in Annex 1(a). 2 A brief description of the workshop and list of participants is given in Annex 2. 3 See Annex 1(b) for a detailed discussion on PCA
viii

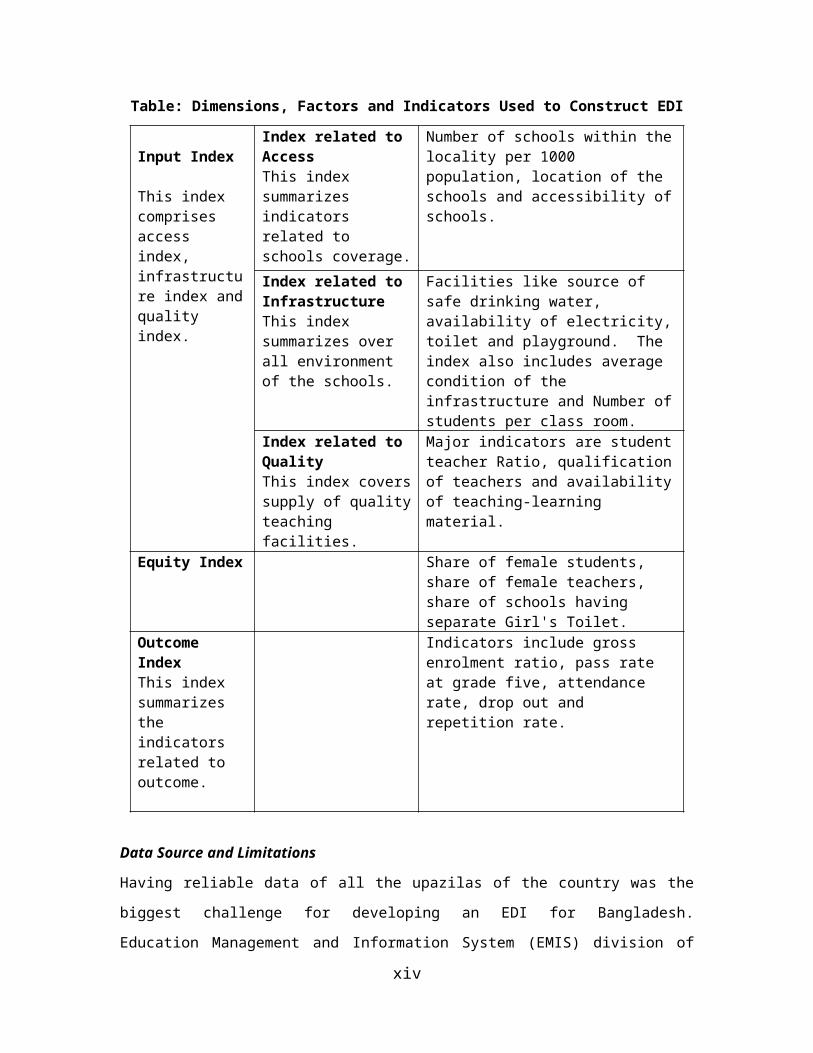
Table: Dimensions, Factors and Indicators Used to Construct EDI
Input Index
This index comprises access index, infrastructure index and quality index.
Index related to Access This index summarizes indicators related to schools coverage.
Number of schools within the locality per 1000 population, location of the schools and accessibility of schools.
Index related to InfrastructureThis index summarizes over all environment of the schools.
Facilities like source of safe drinking water, availability of electricity, toilet and playground. The index also includes average condition of the infrastructure and Number of students per class room.
Index related to Quality This index covers supply of quality teaching facilities.
Major indicators are student teacher Ratio, qualification of teachers and availability of teaching-learning material.
Equity Index Share of female students, share of female teachers, share of schools having separate Girl's Toilet.
Outcome Index This index summarizes the indicators related to outcome.
Indicators include gross enrolment ratio, pass rate at grade five, attendance rate, drop out and repetition rate.
Data Source and Limitations
Having reliable data of all the upazilas of the country was the biggest challenge for developing an
EDI for Bangladesh. Education Management and Information System (EMIS) division of
Directorate of Primary Education (DPE) under Ministry of Primary and Mass Education
(MoPME) undertakes a census of all the primary schools of the country every year. So far they
have published 3 censuses. These data sets cover all 11 types of primary schools including
Madrashas (Ebtedayee) and Kindergarten. In 2007, 83 thousand schools have been covered.
Quality of the data set, however, could be improved as it suffers from the following
shortcomings:
First, as this data is self reported by the schools there is always a possibility of faulty and
inflated reporting. One of the previous reports identified that enrolment rate reported by DPE
in 2005 does not correspond to the Household Income and Expenditure Survey (HIES 2005)4.
4 EFA report by the WB calculates GER and NER, for the year 2005, as 87.5 and 66.5 respectively, which is much smaller that what DPE reports, 97.4 and 86.7, respectively.
ix

Second, this data set doesn’t cover the full range of primary education institutions. Though
the data set covers NGO-run schools a good share of schools are still missing. BRAC runs
some 30 thousand primary schools which are not covered by this data set. Moreover some
15000 Ananda Schools under Reaching Out of School (ROSC) project that cater about half a
million disadvantaged children in 60 underserved and poverty stricken upazilas are also
missing from this data set5.
Third, in the metropolitan areas there are a lot of private schools. It is not clear whether all
the schools of this type were covered or not.
Result and Result Analysis
It is important to note that in terms of availability and reliability of information required for
developing a complete Education Development Index readiness of Bangladesh is not satisfactory.
Hence the results presented in this report are rather provisional. Annex 3 provides a list of
upazilas and districts with overall and individual ranking. This section will only analyze some of
the striking facts. Annex 4 provides maps of Bangladesh with EDI Ranking. The key results are
as follows:
The study has identified some regions those are severely lagging behind other regions. These
regions need special attention. The result is, however, not at all surprising. The Sylhet
region, one of the lowest performing regions, has a history of struggling in terms of
educational attainment. Chittagong hill tracts also have their own reality.
The study has also found that most of the regions are concentrated around the middle. About
75 percent of the upazilas fall between 4 th to 7th overall EDI quartile. This is also true in case
of individual indices. A significant share of children (8 out of 17 million) fall below the
average region.
A positive correlation between the inputs and the outputs is also evident. Outcome has the
strongest positive relationship with Infrastructure and Quality Related Inputs. This result
supports the argument that supply of schools alone cannot ensure expected outcome. Quality
outcome is a function of adequate supply of facilities, educational environment and input
related to quality.
Thanas (Upazilas) under metropolitan areas are not performing well as it is generally
expected. This dismal picture in terms of educational attainment of the metropolis should,
however, not be considered a new finding.
5 DPE Data set still covers more than 85 percent of the enrolled students.
x

With some exceptions, economically disadvantaged regions are suffering in terms of overall
EDI ranking. Most of the areas with highest incidence of poverty are identified as poorly
performing areas according to EDI6. However it would be wrong to conclude that it is
poverty that makes a particular region a dismal performer in terms of educational attainment.
Some coastal regions show comparatively high educational outcomes (especially, primary
completion rate) though these regions are amongst the poorest areas of the country 7. Richer
upazilas marginally tend to do better in terms of educational development but there are a
considerable number of rich upazilas in the poorly performing groups and vice-versa8.
Recommendations
It is encouraging that DPE has put a data collection and dissemination system in place. This
mechanism, however, needs improvement. Availability of data is essentially the first step but
unless proper packaging, communication, and follow through are ensured a complete
management information system cannot be established. Data needs to be elevated to the status of
information through cleaning, controlling, organizing, analyzing, and integrating with other.
Once information is distilled to evidence, it must be communicated to the "movers and shakers";
the policy makers, politicians, program managers, planners, decision makers, the public, the
mothers, or whoever needs to know. Once this happens, evidence transforms to new knowledge.
This knowledge is the input for policy formulation and action9. Below are some specific
recommendations for improvement of DPE’s information collection system:
First, both EMIS and the M&E division under DPE need massive support in terms of
equipment, software, human resources and training.
Second, adequate mechanism to ensure reliability of the information is essential. A
strategy should be developed for collecting more reliable data. After each pre-defined
interval, full fledged census should be done which will employ enumerators to physically
6 Please see Annex 4: Map 2 shows distribution of Upazilas by EDI ranking, and Map 4 demonstrates poverty incidence by upazilas. It is evident that extreme poverty has, in general, a positive correlation with backwardness in educational attainment7 Coastal Development Strategy: Unlocking the Potentials of the Coastal Zone (Draft 2005), Program Development Office for Integrated Coastal Zone Management Plan (PDO-ICZMP), http://www. bnnrc. net/resouces/cds. pdf8 Poverty estimates used for this task are pretty old. No poverty mapping is available since 2005. PREM team of the World Bank is coming with a new poverty map using the HIES2005 data along with the Census 2000. Initial findings of the effort show that Sylhet region, the region identified as region of pocket poverty in all previous poverty mapping activities, may have improved significantly in recent years probably because of increased remetances. This means, educational attainment did not fly along with economic development in this particular region. . 9 De Savigny, D.; Binka, F. (2004)
xi
visit the schools and collect information. If self reported census is done between two full
censuses a sample verification check should be done for each interim census to determine
the level of confidence.
Third, a mechanism of systematic review of information needs has to be established.
M&E division can be the center for this. Type and need of information may not remain
the same over the years. Researchers may also be asked to share their experience and
requirement.
xii

Objectives:The primary objective is to monitor progress in the primary education sector for district/upazila comparisons for better decision making processes. The broader objective is to facilitate the decision making process for resource allocation and policy directions
An EDI can help inBenchmarking status of Education development spatially / regionally. Gauging overall progress in education development, over period of time. Generating evidence for planning and targeted interventions and financing spatiallyDemonstrating the use of data and creating better awareness of the importance of reliable and robust data.
Section 1: Introduction
1. The study aims at developing an Educational Development Index (EDI) for Bangladesh.
The idea behind the EDI is to create a
statistical measurement that would show the
comparative positions of districts and
upazilas in terms of a number of educational
parameters like access and drop out at the
primary level. Such an index is also
expected to show correlations between
various inputs and outputs of primary
education in the country. The results of the
EDI are expected to draw policy attention to
the crucial parameters needed to be dealt
with effectively for achieving equity in
access and attainment in educational development in Bangladesh.
2. The present effort is the crucial first step towards developing a comprehensive and
composite index of educational performance in Bangladesh. While the broader objective of
the activity is to facilitate the decision
making
process for resource allocation and policy
directions, the primary objective is to
monitor progress in the primary education
sector for district/upazila comparisons for
better decision making processes. It will
allow policy makers to look at the needs
of the communities in terms of educational
parameters. The exercise has been
considerably constrained by the lack of
dependable robust data. Adequate
information is key to effective and
1
informed policy making. One important outcome of the activity will be to demonstrate the
importance of reliable and robust data. It is hoped that this report will make the policymakers
aware of the need and importance of collection of reliable and more comprehensive information
on a regular basis.
A word of caution
3. An EDI cannot provide decisive recommendations rather can only facilitate policy
planning through ranking one particular upazila or district compared to other such units.
As an index takes a complex and multifaceted reality and compresses it into something much
simpler there is always a certain amount of possibility that it will do injustice to the original 10.
For this reason, it is important to realize that index may be useful for particular purposes, but it
also has limitations. For example, in this particular case, if one upazila is ranked among the
bottom ones in terms of “Enrolment” it only says that less share of eligible children, compared to
other upazilas, are getting enrolled in the schools but does not necessarily explain the reasons of
this backwardness which can be either scarcity of schools or poverty status of the upazila or
remoteness or a combination of all of the above. Thus, an EDI can only draw the policy attention
to a particular region for a particular parameter but further research is required to find the
possible policy recommendation to improve the situation.
Need for a Strategic Instrument
4. While Bangladesh’s achievement towards universal access to education and gender
parity at primary and secondary level are remarkable, the country still needs to do a lot to
achieve the Education for All (EFA) goals. World Bank report on Bangladesh’s position in
terms of EFA goals (World Bank, 2008) reports that some 25 percent of 6-15 years old children
are still out of school in Bangladesh11. Drop-out rate is alarmingly high both at primary and
secondary levels. Among those dropped out, 59 percent never completed primary education.
Learning achievement is low. The poor are less likely to go to schools and hence, don’t benefit
much from public spending in education.
5. Existing research shows disparity in educational attainment in different geographical
regions of the country. The 2005 Household Income and Expenditure Survey (HIES 2005)
found that in literacy and in access to schools some regions are consistently lagging behind
10 UNESCO (2006), EFA Global Monitoring Report, http://www. unesco. org/education/GMR2006/full
11 This report mostly used HIES 2005 to calculate enrolment and dropout rates.
2

others. For example, Sylhet division has only 36 percent literate population. The division also
has the lowest Access to School having only 76 percent of the 6-10 year-old children enrolled in
schools compared to Khulna, the top one, 87 percent. Access to school by the poor children in
this division is much less than the national average, only 52 percent compared to 72 percent,
respectively (BBS, 2005).
6. Equity in public spending is crucial. Despite sincere efforts, previous research shows that
the poor have undoubtedly suffered from inadequate budget allocation – especially for the social
sectors including education. Primary education remains essentially publicly financed in
Bangladesh till today. Government is the largest service provider in the primary education sector.
Almost 42 percent of the primary students are served by the private sector including NGOs. But
most of those institutions are publicly subsidized. In addition to the supply side interventions
through subsidies and other types of investments, Government of Bangladesh (GoB) has
introduced a demand-side intervention, namely Primary Stipend Program, with a target to
“alleviate the demand side and supply side constraints that prevent millions of children from
accessing and participating fully and successfully in formal primary education.” (World Bank,
2008). Efficient and objective distribution of public resources, therefore, is crucial to ensuring
effective role of public investment in achieving EFA goals.
7. Regions need special attention on different parameters. Levels of achievements are not the
same across the country. Aggregate level analysis at the national level or even at the divisional
level obscures regional disparities. Moreover, analyzing multiple indicators of heterogeneous
nature to assess the overall development is a complex task. Though, all of these indicators are
individually important, the policy makers need a specific strategic instrument that will sum up all
parameters and will assist in identifying the regions lagging behind in comparison to the national
average or neighboring regions and parameters that require special attention. Currently, policy
makers have no agreed-upon guiding mechanism to develop an efficient strategy.
8. Based on this background, the need for developing an Index is felt which can capture, in
single figure, the level of educational achievement by divisions, districts and upazilas. As
this index becomes more developed over time, it will assist policy makers as well as
Development Partners (DPs) in understanding the relative educational needs of different regions
across Bangladesh and make informed policy decisions about targeting of resources towards the
areas where they can have most impact.
3
9. India has the most recent example of developing an EDI and utilizing the findings in
formulating policy decisions. In order to identify the most deprived districts in terms of
educational development, district level Education Development Indices (EDI) were estimated for
the year 2003-04 (Jingran and Sankar, 2006). An analysis of comparing the “Per Child
Allocations/ Expenditure (PCAs/PCEs) with the EDIs shows that there is an apparent disconnect
between the ‘real investment needs’ of the districts, reflected in their status of educational
development (as measured by educational development index –EDI) and the actual allocations
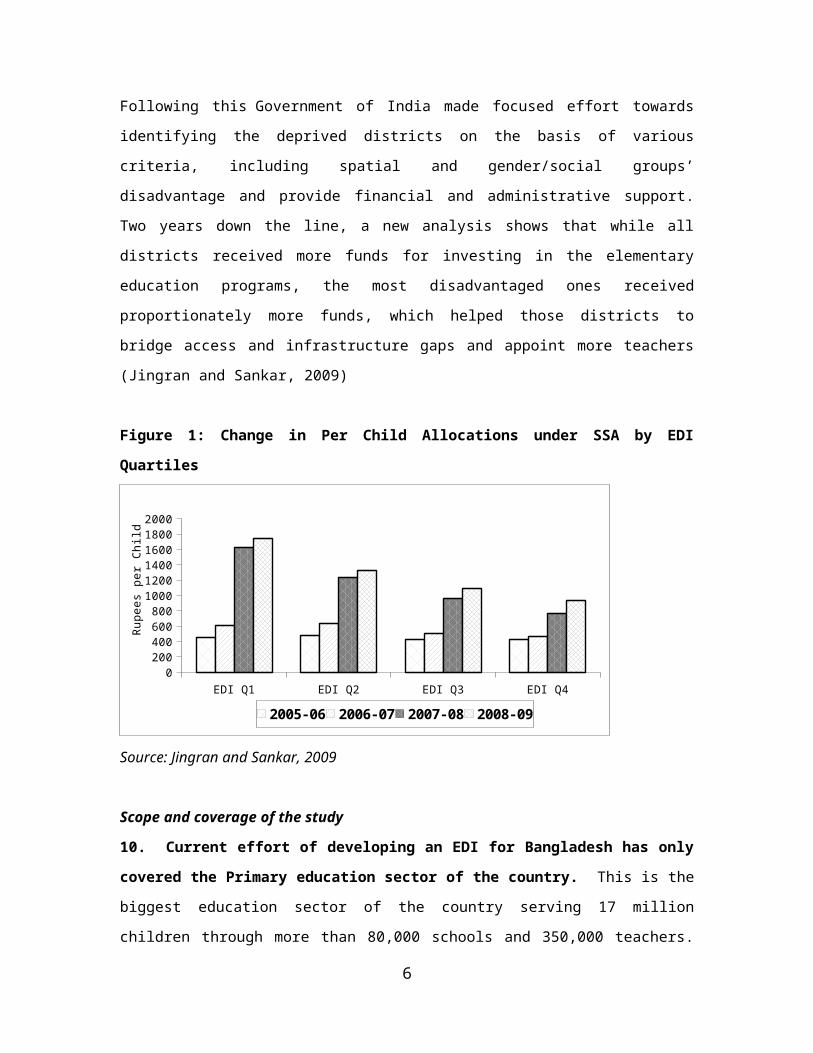
made on an annual basis under ”Shorbo Shikhya Aviyan ( SSA)”. Following this Government of
India made focused effort towards identifying the deprived districts on the basis of various
criteria, including spatial and gender/social groups’ disadvantage and provide financial and
administrative support. Two years down the line, a new analysis shows that while all districts
received more funds for investing in the elementary education programs, the most disadvantaged
ones received proportionately more funds, which helped those districts to bridge access and
infrastructure gaps and appoint more teachers (Jingran and Sankar, 2009)
Figure 1: Change in Per Child Allocations under SSA by EDI Quartiles
EDI Q1 EDI Q2 EDI Q3 EDI Q40
200400600800
100012001400160018002000
2005-06 2006-07 2007-08 2008-09
Rupe
es p
er C
hild
Source: Jingran and Sankar, 2009
Scope and coverage of the study
10. Current effort of developing an EDI for Bangladesh has only covered the Primary
education sector of the country. This is the biggest education sector of the country serving 17
million children through more than 80,000 schools and 350,000 teachers. The index has been
4

measured at the upazila, district and the division level12. Six broad parameters and 24 sub-
parameters (individual indicators) have been selected. The broad parameters are (i) Access
Related Inputs (ii) Environment/Infrastructure Related Input (iii) Quality Related Input (iv)
Outcome/Internal Efficiency and (v) Gender Parity.
11. While an ideal EDI should only include outcome parameters as is done by UNESCO
(UNESCO, 2006), the current study will include both input and output parameters. There
are several reasons for including both kinds of parameters: first, there is time-lag in translating
inputs and process into outcomes and hence, it is important to assess the status of the inputs
independent of outcomes; second, past experience shows that having adequate resources in place
do not necessarily ensure educational development unless the quality of those resources and
efficient utilization are ensured.
12. The paper is organized as follows: As the main goal of this report is to develop a procedure
for creating an EDI for the primary education sector of Bangladesh, the methodology is described
in details with justifications of several steps in the Section 2. Sources of information and
limitations are also discussed in this section. A description of the Primary Education Sector of
Bangladesh is given in Section 3. Section 4 presents the results and also explains how these
results should be interpreted. Section 5 is the conclusion and recommendations. In addition,
there are several annexes that include detailed results including upazila and district lists with
ranks, a technical detail of the PCA, a step-by-step example of how an EDI can be constructed
and a brief description of the stakeholder workshop that was organized at the beginning of the
task to discuss the methodology with relevant stakeholders.
12 Inclusion of metropolitan regions in an overall analysis is debatable. As metropolises face a different reality than the rural or semi-urban regions it would be unwise to judge these regions at the same scale. On the other hand, as this analysis is incorporating only education related inputs and outputs metropolitans can also be kept as part of analysis so that their educational attainment can also be evaluated in the same scale as their rural and semi-urban counterparts.
5
Section 2: Methodology and Sources of Data
Methodology
13. Different studies have employed different methodologies to construct EDI. For example,
UNESCO used four parameters, such as universal primary education, adult literacy, quality
education and gender, to construct EDI for 121 countries (UNESCO 2006). India has had various
efforts to construct Education Development Indices (EDIs) in recent years. The Ministry of
Human Resource Development (MHRD) supported a study in 1998-99. One noteworthy recent
one is the study conducted by the Institute of Applied Manpower Research (IAMR) sponsored by
Planning Commission (Yadav and Srivastava, 2005). The most important and complete one is
the study done by Dhir Jingran and Deepa Sankar in 2005/6. They developed district level
educational development indices taking into account education development related indicators
related to dimensions such as inputs and equity for the year 2003-04 (Jhingran and Sankar 2006).
The EDI constructed by Jingran and Sankar (2006) is a summation of the following indices—
input index, equity index and outcome index.
Table 2: Structural Representation of the EDI by Jhingran and Sankar (2006)
Dimension Indicator Dimension Indices
Sub-EDI Indicators
ED
UC
AT
ION
DE
VE
LO
PME
NT
IN
DE
X
Access Primary School Coverage Access Index
INPUT INDEX
Primary: UP ratio
Infrastructure
Classroom availabilityInfrastructure
IndexToilets availability
Drinking water availability
Teacher PTR Teacher IndexEnrolment % of 6-14 years in school Enrolment Index OUTPUT/
OUTCOME INDEXCompletion
Primary school completion Completion
IndexUP completion
Equity Girls’ enrolment Equity Index EQUITY INDEXFemale literacy
Source: Jingran and Sankar, 2009
14. Example of using mathematically viable procedure in constructing EDI is rare. The
methodology used to construct EDI in the UNESCO (2006) study was rather crude. Similar
weights were assigned to all the parameters, which fails to consider the fact that different
6

A two stage procedure is adopted
o First step is a
participatory approach in
selecting the factors and
indicators through a half
day long stakeholder
workshop.
o The second step is to
apply PCA for each pre-
defined dimension.
parameters might have different importance in the constructed aggregate EDI. Therefore, such a
simple approach cannot be considered to be scientific and appropriate. The methodology used in
the Indian Planning Commission Study (1999) was very much subjective. No justification has
been provided with respect to how those subjective weights were derived. Jingran and Sankar
(2006) and Jadhav and Srivastava (2005)13 used a better and more scientific approach, the
Principal Component Analysis (PCA) to construct an overall EDI for India.
15. The objective of PCA is to reduce the dimensionality (number of indicators) of the data
set but retain most of the original variability in the data. This involves a mathematical
procedure that transforms a number of possibly correlated variables into a smaller number of
uncorrelated variables called principal components. The first principal component accounts for
as much of the variability in the data as possible, and each succeeding component accounts for as
much of the remaining variability as possible. Thus using PCA one can reduce the whole set of
indicators into few factors (underlying dimensions) and also can construct dimension index using
factor-loading values as the weight of the particular variable. A detailed description of PCA is
provided in Annex 1(b).
16. Current effort adopts a two stage
procedure in constructing an EDI. The first step
ensures a participatory approach in selecting the
factors and indicators. List of available variables
and possible factors and indicators were discussed
in a half day long stakeholder workshop14. After a
long discussion the factors and variables under
each factor were selected15. Thus The EDI
constructed for this analysis is a summation of
13 Institute of Applied Manpower Research (2005), Educational Development Index in India: An inter-state Perspective, Delhi. 14 A brief description of the workshop and list of participants is given in Annex 2. 15 This is quite important. One limitation of PCA is that one cannot guarantee that while determining the underlying dimensions (factors) from a large set of variables using PCA it will conform to the theoretical reasoning or common understanding while assigning the individual variables to different factors (underlying dimensions). One remedy is to have pre-defined dimensions according to theoretical reasoning or common understanding and carry out PCA for each pre-defined dimension in order to get dimension index. Both Jadhav and Srivastava and Jhingran and Sankar identified several dimensions for their effort to construct an EDI for India. However, both the efforts apparently used their own reasoning and understanding to identify the dimensions, factors and variables. Determining the dimensions and underlying factors (indicators) through a stakeholder workshop thus reduces possibility of biased selection.
7

three major indices. These are: (i )input index, (ii) equity index and (iii) outcome index. Input
index summarizes the extent of inputs related to access, infrastructure and quality. Outcome
index includes enrolment rate, pass rate, repetition rate and dropout rate. A brief description of
the indices is given in the table below. The second step is to apply PCA for each pre-defined
dimension and calculate weights for each of the indicators within the dimension.
Table 3: Dimensions, Factors and Indicators Used to Construct EDI
Input Index
This index comprises access index, infrastructure index and quality index.
Index related to Access This index summarizes indicators related to schools coverage.
Number of schools within the locality per 1000 population, location of the schools and accessibility of schools.
Index related to InfrastructureThis index summarizes over all environment of the schools.
Facilities like source of safe drinking water, availability of electricity, toilet and playground. The index also includes average condition of the infrastructure and Number of students per class room.
Index related to Quality This index covers supply of quality teaching facilities.
Major indicators are student teacher Ratio, qualification of teachers and availability of teaching-learning material.
Equity Index Share of female students, share of female teachers, share of schools having separate Girl's Toilet.
Outcome Index This index summarizes the indicators related to outcome.
Indicators include gross enrolment ratio, pass rate at grade five, attendance rate, drop out and repetition rate.
Data Source
17. Having reliable data of all the upazilas of the country was the biggest challenge for
developing an EDI for Bangladesh Education Management of Information System (EMIS)
division of Directorate of Primary Education (DPE) under Ministry of Primary and Mass
Education (MoPME) undertakes a census of all the primary schools of the country every year. So
far they have published 3 censuses. The first one is known as “PEDPII Baseline Survey 2005”.
8
These data sets cover all 11 types of primary schools including Madrashas (Ebtedayee) and
Kindergarten. In 2007, 83 thousand schools have been covered.
18. It is noteworthy that the reliability of this data could have been improved as it suffered
from the following shortcomings. First, as this data is self reported by the schools there is
always a possibility of faulty and inflated reporting. One of the previous reports identified that
enrolment rate reported by DPE in 2005 does not correspond to the Household Income and
Expenditure Survey (HIES 2005)16. Second, this data set doesn’t cover the full range of primary
education institutions. Though the data set covers NGO-run schools a good share of schools are
still missing. BRAC runs some 30 thousand primary schools which are not covered by this data
set. Moreover some 15000 Ananda Schools under Reaching Out of School (ROSC) project that
cater about half a million disadvantaged children in 60 underserved and poverty stricken upazilas
are also missing from this data set. Third, in the metropolitan areas there are a lot of private
schools. It is not clear whether all the schools of this type were covered or not 17. However, this
study still uses the DPE data set assuming a certain level of accuracy of the information and
concludes with the expectation that steps will be taken to collect more reliable and complete
information in future.
16 EFA report by the WB calculates GER and NER, for the year 2005, as 87.5 and 66.5 respectively, which is much smaller that what DPE reports, 97. 4 and 86.7, respectively. 17 The DPE Data set still represents institutes that cater more than 85 percent of the student population.
9

Primary Education Sector at a Glance80 thousand primary schools with 47 percent public.
17 million students with 51 percent female.
Teaching force of 350,000
Public expenditure on Education is 1. 6 percent of GDP and around 15 percent of Total Public Expenditure
Section 3: Primary Education Sector of Bangladesh18
19. The primary education system comes under the purview of the Ministry of Primary and Mass
Education (MOPME) which is responsible for overall
policy direction with the Directorate of Primary
Education (DPE) below it responsible for primary
education management and administration.
Size and providers of the
sector
20. There are some 80 thousand primary schools
catering more than 17 million children. Some 51
percent of the total primary student population are female.
There are 11 types of institutions currently providing education in the primary education sub-
sector. In 2007, about 47 per cent of primary education institutions were public (Government
Primary Schools or GPS, Table 4). RNGPS, which are privately operated but receive public
subsidy for teacher salaries- represented about one fourth of the schools in Bangladesh.
Table 4: Number of Primary Education Institutions, Teachers and Students
in Bangladesh (2007)
Type of School
Number
of
Schools
No. of Teachers % of
Female
Teachers
Number of Pupils% of Girls
StudentsTotal Female Total Girls
Govt. Primary Schools 37672 182374 91521 50.2 9377814 4829793 51.5
Regd. NGPS 20107 79085 25482 32.2 3538708 1791500 50.6
Non-regd. NGPS 973 3914 2532 64.7 164535 81041 49.3
Kindergarten 2253 20874 11520 55.2 254982 108520 42.6
NGO Schools 229 1106 732 66.2 32721 16515 50.5
Ebtedaee Madrasahs* 6726 28227 2987 10.6 947744 455761 48.1
Source: Directorate of Primary Education, MoPME
Finance
18 Some parts of this section are updated reproduction of the World Bank (2008) report on EFA.
10
21. Education expenditures increased significantly from 1.6 per cent of total GDP in 1990
to over 2.4 per cent in 1995-96 (Figure 2). The share of education in GDP was quite stable at
2.1 to 2.2 per cent since 1999. Public education expenditure as a share of total government
spending increased from about 12 per cent in 1990-91 to 16 per cent in 1999-00 and has remained
around 15 per cent. In addition to direct financing, the Government has introduced demand side
interventions such as stipend and fee waiver programs, put in place incentives for the private
sector to provide education services and recently introduced community based programs for
hard-to-reach out of school children, among other programs.
Figure 2: Public Expenditure on Education as Share of Total Public Expenditure and GDP
1011121314151617181920
1990-91 1995-96 1999-00 2001-02 2002-03 2003-04 2004-05
Shar
e of
Pub
lic E
xpen
ditu
re
-0.20.40.60.81.01.21.41.61.82.02.22.42.6
Shar
e of
GD
PTotal Public Expenditure as Share of GDP %Public Expenditure on Education as Share of GDP %Expenditure on Education as Share of Total Public Expenditure %
Source: Al Samarrai, 2007
Recent Achievements and EFA goals
22. Despite the pervasiveness and depth of poverty in Bangladesh and its vulnerability to
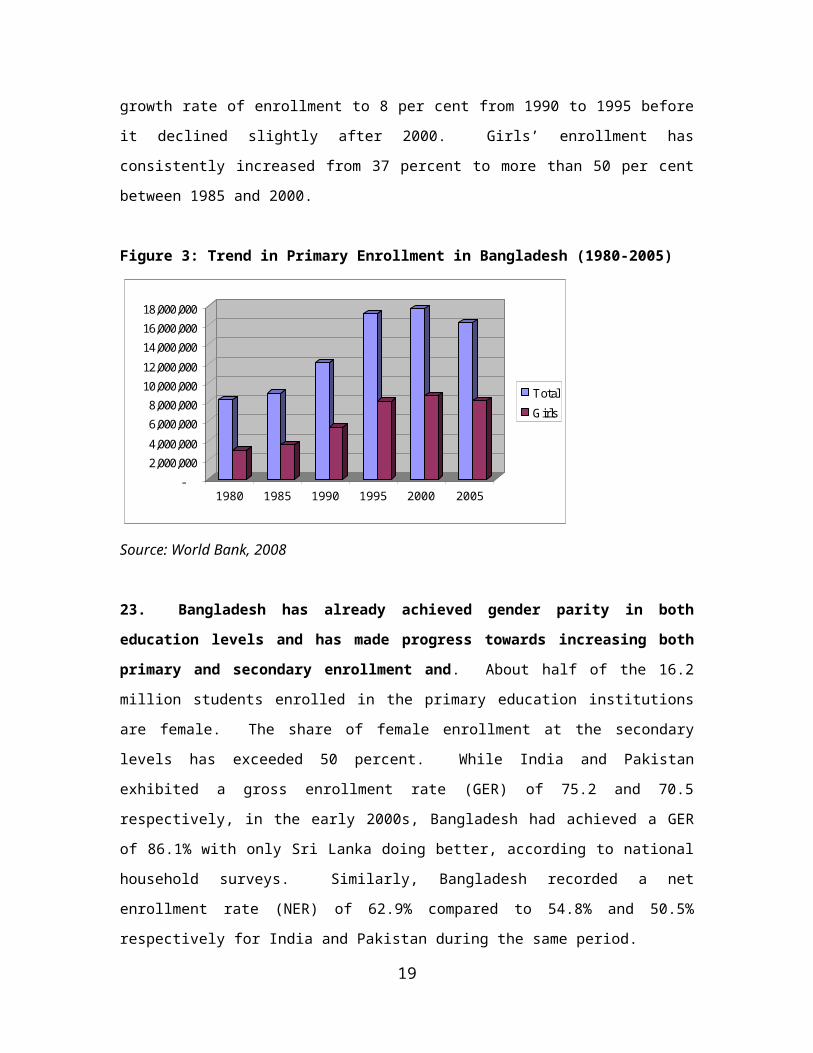
natural calamities, primary school enrollment has steadily increased and students enrolled
are distributed across eleven types of schools19. Enrollment in GPS is by far the largest at 59
per cent, followed by RNGPS (22 per cent) Primary enrollment appears to have steadily increased
in Bangladesh since the early 1980s. With the rapid expansion of private schools in the early
1990, the number of children enrolled in primary school exceeded 12 million raising the annual
growth rate to 7 per cent over the period 1985-90. The trend was sustained in the following five
19 Poverty is still pervasive in Bangladesh in spite of the fact that poverty incidence between 2000 and 2005 has declined from 49% to 40% according to recent estimates by the Bangladesh Bureau of Statistics.
11

years increasing the annual growth rate of enrollment to 8 per cent from 1990 to 1995 before it
declined slightly after 2000. Girls’ enrollment has consistently increased from 37 percent to more
than 50 per cent between 1985 and 2000.
Figure 3: Trend in Primary Enrollment in Bangladesh (1980-2005)
-2,000,0004,000,000
6,000,0008,000,000
10,000,00012,000,000
14,000,00016,000,00018,000,000
1980 1985 1990 1995 2000 2005
Total
Girls
Source: World Bank, 2008
23. Bangladesh has already achieved gender parity in both education levels and has made
progress towards increasing both primary and secondary enrollment and. About half of the
16.2 million students enrolled in the primary education institutions are female. The share of
female enrollment at the secondary levels has exceeded 50 percent. While India and Pakistan
exhibited a gross enrollment rate (GER) of 75.2 and 70.5 respectively, in the early 2000s,
Bangladesh had achieved a GER of 86.1% with only Sri Lanka doing better, according to national
household surveys. Similarly, Bangladesh recorded a net enrollment rate (NER) of 62.9%
compared to 54.8% and 50.5% respectively for India and Pakistan during the same period.
24. Bangladesh is unlikely to achieve universal primary enrollment and completion by 2015
if the current trends in access and completion do not improve. The NER of children aged 6-
10 has modestly increased by about 4 percentage points between 2000 and 2005 although primary
completion rate of children 15-19 has gone up by over six percentage points in the same period.
The HIES data show that the NER of children from the poorest quintile has not only increased
modestly from 52.6% in 2000 to 56.8% in 2005 but it is still very low. The same is true when
primary completion rate is considered. Further, the gender gap in completion rate (in favor of
girls) is wider among children 15-19 of the poorest quintile (14%) compared to that of the richest
12

quintile (1.9%). This requires policymakers to pay more attention to boys in poor households in
order to raise their educational attainment.
25. Progress in school quality is more difficult to assess because of the lack of systematic
assessment and monitoring of learning achievement results20. As many developing countries,
Bangladesh does not systematically collect learning achievement tests that are nationally
representative of primary school students. Therefore, the quality of primary education was
assessed by reviewing some studies related to learning outcomes in Bangladesh. They generally
point to low levels of learning achievement, poor literacy and numeracy skills acquired during the
primary school cycle as well as to a gender gap in test scores in favor of boys (World Bank,
2008).
20 This assumes that the quality of school is proxied by the learning achievement tests, bearing in mind that there are other important dimensions of school quality that cannot be captured by test scores.
13

Summary of Findings
Sylhet and Chittagong Hill Tracts are systematically Lagging Behind.
Most of the regions are middling
A positive correlation between the inputs and the outputs
Nine million children fall below average region
Metropolitan regions are not performing well as it is generally expected.
With some exceptions, the economically disadvantaged regions are suffering. However, it is also evident that poverty is not the single most important reason of educational backwardness.
Section 4: Result and Result Analysis
26. In the current effort, EDI is calculated for each
upazila and district of the country. These results are
aggregated at the divisional level to get an aggregate
picture. This section will start with aggregate picture at
the division level. However, within each division,
districts and upazilas vary widely in terms of EDIs.
Hence division level EDI does not have much use in
policy formulation. In some cases, upazilas vary in
terms of EDI within districts. Still district level EDI
shows almost the same pattern as found in analyzing
upazila level EDI. Annex 3 provides a list of upazilas
and districts with overall and individual ranking. This
section will only analyze some of the striking facts.
27. Among the six divisions of the country Sylhet
performs the worst in terms of education
development at the primary level followed by
Chittagong and Barishal. Table 5 presents an
aggregate picture at the division level. Among the
bottom 10 percent of the upazilas 52 percent are from the Sylhet division. Dhaka and Khulna top
the list among the divisions (represented by 35 and 27 percent of the top 10 percent upazilas,
respectively). Sylhet is the only division that has no representation among the top 10 percent of
the upazilas. In terms of Outcome Index, 58 percent of the bottom 10 percent upazilas are also
from the same division. The result is quite similar to the findings of several other previous
reports. For example, the report of the Poverty Mapping project of Bangladesh government
identified Sylhet, Chittagong and Mymensingh as the lowest performing regions in terms of
primary enrolment21. HIES 2005 has also identified Sylhet as the worst performing region in
terms of literacy (BBS, 2005). Variations among the upazilas within the divisions are also
interesting. For example, while 35 percent of the top 10 percent upazilas are from Dhaka, 6
percent of the bottom 10 percents are also from the same division. This is also true in case of
21 IRRI, BARC, BBS, LGED (2005), Geographical Concentration of Rural Poverty in Bangladesh,
14
individual indices. Rajshahi is highly represented both among the top 10 percent and the bottom
10 percent of upazilas in terms of availability of access related inputs.
Table 5: Representation of Each Division as Share of Upazilas for Overall and Individual EDI
Overall Access Infrastructure Quality Outcome Gender
Top
10%
Botto
m 10%
Top
10%
Bottom
10%
Top
10%
Bottom
10%
Top
10%
Bottom
10%
Top
10%
Bottom
10%
Top
10%
Bottom
10%
Barisal 8.2 - 4.1 10.4 - 10.4 16.3 2.1 18.4 2.1 8.2 2.1
Chittagong 8.2 31.3 16.3 20.8 28.6 37.5 8.2 25.0 10.2 2.1 16.3 39.6
Dhaka 34.7 6.3 18.4 18.8 42.9 16.7 4.1 31.3 14.3 25.0 57.1 6.3
Khulna 26.5 2.1 22.5 4.2 2.0 18.8 28.6 2.1 28.6 6.3 10.2 4.2
Rajshahi 22.5 8.3 38.8 22.9 20.4 2.1 42.9 8.3 28.6 6.3 8.2 41.7
Sylhet - 52.1 - 22.9 6.1 14.6 - 31.3 - 58.3 - 6.3
Source: Author’s Calculation
28. District level ranking provides more disaggregated picture. Narayanganj, an old port
city adjacent to the capital, tops among the districts while Sunamganj of Sylhet division is
the last one on the list in terms of overall EDI ranking. Khulna, the divisional headquarters of
Khulna division, is the second on the list followed by Dhaka, the divisional headquarters of the
Dhaka Division. Among other divisional head quarters Rajshahi is ranked as 10 th followed by
Chittagong (11th) and Barisal (12th). Sylhet, headquarters of Sylhet division, is ranked among the
worst 5 districts. In fact, seven of the bottom 10 districts are from Sylhet division (all of bottom
5) and Chittagong Hill-tracts. Surprisingly, only 2 of the top ranked districts in terms of overall
ranking are also present among the top 10 districts in terms of “Availability of Access related
Inputs”. This is also true for the bottom 10 districts in the Access Index. Other than Sunamganj
and Habiganj of the Sylhet Division, none of the worst 10 districts in overall ranking are present
in the bottom 10 list of Access Index. Opposite scenario is perceived in case of Outcome Index.
Six of the top 10 districts of the Overall Index are among the top 10 in the Outcome Index. Seven
of the bottom 10 districts in the Outcome Index are in the bottom 10 list of the overall index. It is
because of the fact that while calculating the Overall Index from the individual indices Outcome
Index received the highest weight which supports the general consent of the stakeholders that was
received during the stakeholder consultation workshop.
15

Table 6: Best 10 and Worst 10 Districts
Overall Index Access Input Index Infrastructure Input Index Outcome Input Index
District Name
Overall
Rank District Name
Overall
Rank District Name
Overall
Rank
Best 10
NARAYANGONJ PANCHAGARH 15 DHAKA 3 KHULNA 2
KHULNA JAIPURHAT 16 NARAYANGONJ 1 SATKHIRA 17
DHAKA MEHERPUR 46 CHITTAGONG 11 MANIKGONJ 9
BAGERHAT DINAJPUR 13 GAZIPUR 5 JESSORE 14
GAZIPUR RAJSHAHI 10 MUNSHIGONJ 32 NAWABGONJ 6
NAWABGONJ THAKURGAON 42 RAJSHAHI 10 BAGERHAT 4
JHENAIDAH KHAGRACHHARI 60 NAWABGONJ 6 RAJSHAHI 10
FENI JHENAIDAH 7 FENI 8 MAGURA 19
MANIKGONJ LALMONIRHAT 37 JAIPURHAT 16 PATUAKHALI 38
RAJSHAHI KHULNA 2 CHUADANGA 34 NARAYANGONJ 1
Worst 10
NETROKONA PABNA 54 BAGERHAT 4 KISHORGONJ 33
SHERPUR HOBIGONJ 59 GAIBANDHA 57 PABNA 54
GAIBANDHA KISHORGONJ 33 PATUAKHALI 38 SHERPUR 56
RANGAMATI MYMENSINGH 47 NARAIL 31 CHUADANGA 34
HOBIGONJ PATUAKHALI 38 MOULVIBAZAR 62 JAMALPUR 53
KHAGRACHHARI GOPALGONJ 48 KHAGRACHHARI 60 NETROKONA 55
SYLHET SIRAJGONJ 45 SUNAMGONJ 64 HOBIGONJ 59
MOULVIBAZAR BRAHMONBARIA 52 GOPALGONJ 48 MOULVIBAZAR 62
BANDARBAN MADARIPUR 43 RANGAMATI 58 SYLHET 61
SUNAMGONJ SUNAMGONJ 64 BANDARBAN 63 SUNAMGONJ 64
Source: Author’s Calculation
16
29. In terms of overall ranking most of the upazilas fall between 4th and 7th EDI quartiles.
Figure 4 shows distribution of the upazilas according to the overall EDI score. About 75 of the
upazilas fall between 4th and 7th quartile. This is also true in case of individual indices.
Figure 4: Distribution of Upazilas by EDI Quartiles
1=lowest; 10 highest
0
20
40
60
80
100
120
140
160
1 2 3 4 5 6 7 8 9 10
Edi Score Group
N of
Upa
zila
s
Source: Author’s Calculation
30. Cantonment thana (upazila) under Dhaka tops the upazila level ranking followed by
Batiaghata of Khulna. As expected from the division and district level rankings upazilas from
Sylhet and Chittagong Hill-tracts occupy the bottom of the list. Out of bottom 50 upazilas 39
(78%) are from these two regions. All of the bottom 25 upazilas are from these two regions.
Figure 5 shows average scores of upazila deciles for all the individual indices. As expected, on
average, the better the upazilas are in overall ranking the better are their average score in
individual indices. It is notable that, in terms of average scores, lowest 30 percent upazilas are
almost similar to the middle 40 percent upazilas.
17

0
20
40
60
80
100
120
140
160
180
200
Access Infrastructure Quality Outcome Gender
Average Score
Lowest 30 Percent Middle 40 Percent Top 30 Percent
Figure 5: Individual Indices by EDI Deciles
Source: Author’s Calculation
31. The average scenario mentioned above may, however, be misleading. It would be
deceptive if any policy maker takes the overall ranking alone in decision making. The upazila
wise analysis shows that overall ranking does not necessarily mean that the top ranked upazila is
doing well in all aspects. In fact the picture is quite the opposite. For example, while
Cantonment thana ranked as the top upazila in overall ranking its position in the Access Input
Index is quite striking (53rd) and so is the position in Outcome ranking (188th). But because this
thana is doing very well in other Indices its overall score becomes the highest. Narayanganj
shadar, district headquarter of Narayanganj which tops the overall district ranking, ranked as 365 th
in terms of outcome while its position in the overall index is 16 th. This is also true in case of
Batiaghata, the second on the list, whose position in the Infrastructure Input Index is 383 while its
position in the Outcome Index is at the top.
32. An important outcome is that the current analysis finds a positive correlation between
the inputs and the outputs. Correlation co-efficient between overall input (combination of
Access, Infrastructure and Quality related input) and overall output (combination of Outcome and
Gender parity) is .43 (significant at 5% level). It is also inspiring that outcome has positive
18

correlation with all the input factors. A correlation matrix is given in table 7. It is evident from
the table that Outcome has the strongest positive relationship with Infrastructure and Quality
Related Inputs. This result supports the argument that supply of schools alone cannot ensure
expected outcome. Quality outcome is a function of adequate supply of facilities, educational
environment and input related to quality.
Table 7: Correlation between Individual Indices
Access
Infrastructur
e Quality Outcome Gender
Access 1
Infrastructure 0.2345 1
Quality 0.1091 -0.224 1
Outcome 0.2571 0.0578 0.3138 1
Gender 0.0544 0.5705 -0.2128 -0.0676 1
Source: Author’s Calculation
33. A striking but not totally surprising result has been found for the metropolitan areas.
In contrast to the general perception thanas under metropolitan areas are not performing
well enough. For example, though Cantonment thana under Dhaka metropolis has topped among
the upazilas, some thanas from the same metropolis ranked even below 200 (e. g, Sutrapur).
Thanas like Motijheel and Tejgaon, two of the core thanas of the Dhaka metropolitan area, have
been ranked 86th and 95th, respectively. Several other examples can also be provided. The story is
more or less the same for all the metropolitan areas. This dismal picture in terms of educational
attainment of the metropolis should, however, not be considered a new finding. World Bank
report on Bangladesh’s MDG situation (World Bank 2007) had identified the performance of the
metropolitan regions as catastrophic. It reported that the rapid growth in the metropolitan areas
is not matched by commensurate growth in services, in part due to resource constraint and in
part due to reluctance on the part of the policy makers to make metropolitan areas more
attractive than they already are. Even further, CAMPE in its report of 1999 (CAMPE, 1999)
found that in terms of educational access the metropolitan areas are at a vulnerable state. This
report also identified Khulna Rural as the best performing area. Net enrolment rate for slum
children of Dhaka city was found to be only around 60 percent-considerably lower compared
even to their rural counterparts.
19

34. Apparently, education policies are systematically ignoring the metropolitan areas since
long ago despite the fact that share of population living in the metropolis is increasing in
geometric progression. Since this increase is mostly resulting from the migration of poor rural
people to the metropolis ignoring metropolitan areas in terms of education development is mainly
affecting the ultra poor segment. In last 20 years metropolitan areas experienced at least three
fold increase in terms of population with a two fold increase of the slum population in the capital
city alone in last 10 years (from 1.5 in 1995 to 3.4 in 2005) 22. The Government has almost
stopped establishing new schools decades ago (BANBEIS 2005). Cost of establishing schools
has become so high that private sector is also unwilling to invest in this sector. Number of
private schools has increased in these regions but those are only accessible to the children from
the rich families. The famous demand side intervention “Primary Stipend” program also keeps
metropolitan areas out of its domain. And last but not the least, because of the extreme mobile
nature23 of the slum population in the metros NGOs are also reluctant to run programs in these
areas. As a result, metro areas are scoring severely low in terms of Access Input and Outcome
(enrolment rate, drop out, repetition, pass rate) Index. Moreover, the existing schools in these
regions are overpopulated. Teacher-student ratio is extremely high. The only dimension in
which these regions are doing very well is Infrastructure Index which assesses the condition of
the infrastructure and other facilities in the existing schools.
35. Figure 6 shows cumulative distribution of total primary aged population of the country
by EDI decile. Population is almost evenly distributed around the middle. Slightly less than half
of the primary aged children (about 8 million) are living in the below average regions.
22 Center for Urban Studies (May 2006), Slums of Urban Bangladesh: Mapping and Census, 2005. 23 And sometimes illegal
20
Figure 6: Cumulative Distribution of Primary Aged Children by EDI Decile
0
50
100
1 2 3 4 5 6 7 8 9 10
EDI Decile
Cum
ulat
ive
Shar
e
Source: Author’s Calculation
36. It is evident that, with some exceptions, economically disadvantaged regions are
suffering in terms of overall EDI ranking. According to the “poverty incidence” calculation24,
the areas with highest incidence of poverty are the depressed basins in Sunamganj, Habiganj and
Netrokona25 districts in the greater Sylhet region; the northwestern districts of Jamalpur,
Kurigram, Nilphamari and Nawabganj; and, in the south, Cox’s Bazar and coastal islands of
Bhola, Hatia and Sandeep. This spatial pattern is similar with regard to incidence of extreme
poverty. Most of these regions are also identified as poorly performing areas according to EDI 26.
Chittagong Hill-tract, one of the most backward regions according to overall EDI ranking, is also
branded as one of the most disadvantaged regions of the country, both economically and socially.
24 Geographical Concentration of Rural Poverty in Bangladesh (2004), The Bangladesh Rural Poverty Mapping Project, by IRRI, BARC, BBS and LGED25 The paper reports Netrokona as a part of the Sylhet region which is, in fact, adjacent to Sylhet but not an administrative part of greater Sylhet. 26 Please see Annex 4: Map 2 shows distribution of Upazilas by EDI ranking, and Map 4 demonstrates poverty incidence by upazilas. It is evident that extreme poverty has, in general, a positive correlation with backwardness in educational attainment
21

0
5
10
15
20
25
30
(%)
Share of Upazilas
Bottom 20% Top 20%
EDI Groups
Poverty Level 1 Poverty Level 2 Poverty Level 3 Poverty Level 4
37. It, however, needs further research to find policy options for disadvantaged regions. It
is not always poverty that makes a particular region a dismal performer in terms of
educational attainment. For example, some coastal regions show comparatively high
educational outcomes (especially, primary completion rate) though these regions are amongst the
poorest areas of the country27. Figure 7 shows distribution of Upazilas by proverty status among
the different EDI groups. The graph shows a pattern that richer upazilas marginally tend to do
better in terms of educational development but there are a considerable number of rich upazilas in
the poorly performing groups and vice-versa28.
Figure 7: Distribution of the Upazilas by Poverty Status and EDI (overall)
Source: Author’s Calculation [Source of upazila ranking: GoB and WFP (2004), Food Security Atlas of Bangladesh; Geographical Concentration of Rural Poverty in Bangladesh (2004), The Bangladesh Rural Poverty Mapping Project; ]
27 Coastal Development Strategy: Unlocking the Potentials of the Coastal Zone (Draft 2005), Program Development Office for Integrated Coastal Zone Management Plan (PDO-ICZMP), http://www. bnnrc. net/resouces/cds. pdf28 Poverty estimates used for this task are pretty old. No poverty mapping is available since 2005. PREM team of the World Bank is coming with a new poverty map using the HIES2005 data along with the Census 2000. Initial findings of the effort show that Sylhet region, the region identified as region of pocket poverty in all previous poverty mapping activities, may have improved significantly in recent years probably because of increased remetances. This means, educational attainment did not fly along with economic development in this particular region.
22

Section 5: Conclusion
38. The objectives of the EDI study have been met with the development of the draft educational
developmental index for all Upazilla and districts of the country. The purpose, as mentioned
earlier, to see the spatial disparity of educational development has also been achieved through
development of the rankings and the maps.
39. It is, however, worth mentioning that in terms of availability and reliability of
information required for developing a fail-safe Index readiness in Bangladesh is not
satisfactory. Hence the results presented in this report are rather provisional. An improved and
systematic data collection mechanism and regular dissemination of information will build a
strong information base for the policy makers. Therefore the first set of recommendations of this
report relates to better management of information. Findings of this report are somewhat
expected. Some low-performing regions are identified who are systematically failing to perform
acceptably. It is noteworthy that these regions have their own characteristics. Policy options
should take these peculiarities in to consideration. Solutions may be dissimilar for resolving
difficulties of different regions with different realities.
40. Figure 8 shows a pathway for evidence-based planning in which monitoring, evaluation,
and forecasting are essential but insufficient steps29. Monitoring and evaluation is often not
treated as a coherent element in a routine pathway to evidence-based decision-making.
Availability of data is essentially the first step but unless proper packaging, communication, and
follow through are ensured a complete management information system can not be established.
Data needs to be elevated to the status of information through cleaning, controlling, organizing,
analyzing, and integrating with other. Once information is distilled to evidence, it must be
communicated to the "movers and shakers"; the policy makers, politicians, program managers,
planners, decision makers, the public, the mothers, or whoever needs to know. Once this
happens, evidence transforms to new knowledge. This knowledge is the input for policy
formulation and action.
29 Part of this paragraph and the figure is adopted from earlier work of de Savigny, D. ; Binka, F. (2004), Monitoring Impact on Malaria Burden in Sub-Saharan Africa. American Journal of Tropical Medicine and Hygiene
23

Recommendation to Overcome Data Limitations
Both EMIS and the M&E division under DPE need massive support in terms of equipment, software, human resources and training.
Instead of self reported census a system of periodic physical verification is necessary.
A mechanism of systematic review of information needs has to be established.
A culture of regular dissemination of information needs to be introduced.
Metropolitan regions are not performing well as it is generally expected.
Economically disadvantaged regions are suffering.
Figure 8: A Pathway to Evidence-Based Planning
Inform Plans & Influence decisions
Integrate, Interpret &
Evaluate
Data Organize &
Analyze
Impact
Package & Disseminate Knowledge
Action
Implement Programs &
reforms
Monitor progress & evaluate
EMIS
Govt
EMIS – Informing
decisions and Implementation
EMIS
EMIS
Information
EMIS
Evidence
41. It is encouraging that DPE has put a data collection and dissemination system in place.
It has an EMIS division to collect and manage information of at least 85 percent of the
institutions which provide primary level education in Bangladesh. A full fledged Monitoring and
Evaluation division has also been established recently.
The data collection mechanism, however, needs
improvement. It is important to note that improvement
cannot come without investing more. These days, the
EMIS section needs continuous technical and human
resource improvement. Mechanism of maintaining flow
of reliable data also needs to be improved. Some
lackings in DPE’s data collection mechanism and
recommendations for improvement are discussed below.
42. First, both EMIS and the M&E division under
DPE need massive support in terms of equipment,
software, human resources and training. Collecting
and managing data for some 80 thousand institutions is
not an easy task. Current capacity of EMIS is quite
inadequate for this. It has human resources but not
enough facilities for improvement. It has computers but does not have modern software. Most of
its staff never received adequate training.
24

43. Second, the data collection mechanism DPE follows is inadequate. All the last 3 censuses
were self reported information from the field. Head teachers of the schools fill up the
questionnaires by themselves. Adequate mechanism to ensure reliability of the information is
absent. DPE should develop a strategy for collecting more trustworthy data. A full fledged
census should be done, after each pre-defined interval, which will employ enumerators to
physically visit the schools and collect information. Self reported census can be done between
two full censuses. However, a sample verification check should also be done for each interim
census (i. e., self reported ones) to determine the level of confidence.
44. Third, a mechanism of systematic review of information needs has to be established.
M&E division can be the center for this. Type and need of information may not remain the
same over the years. Existing questionnaire may have particular deficiencies. The proposed
review mechanism should consider experience of the enumerators and improve the instruments.
Researchers may also be asked to share their experience and requirement.
45. Findings of the report identify some regions which are severely lagging behind. The
result is, however, not at all surprising. The Sylhet region, one of the lowest performing regions,
has a history of struggling in terms of educational attainment. Chittagong hill tracts also have
their own reality. Districts and upazilas prone to disasters are also mostly suffering compared to
average upazilas and districts. Remote places, such as, chars and seasonal famine stricken
regions are also consistent under-performers.
46. One striking result is the performance of the metropolitan regions. A considerable
portion of the metropolitan thanas is performing well below the average. These results,
however, are not quite unexpected. Education policy can no longer ignore these regions. Several
actions can be recommended. First, supply shortage is the first issue to be dealt with. Given that
slum population in the metro areas is increasing geometrically the government needs to establish
new low cost schools. Ananda School (ROSC Project) type learning centers may be opened in
identified poverty stricken areas. Second, private sectors and NGOs should get help from the
government. One option is to provide free place for schools or at lower cost. Third, demand-side
intervention, such as, stipend program should include metropolis. The current program covers
only the rural and semi-urban regions. The same program may not be suitable for the cities
25

where inequity is much higher than in the rural areas. Specific and targeted program may be
required.
47. The report concludes with two expectations. First, the application of this study will not be
limited to academic arena or for academic purposes. The results are real, despite the limitations
of the data, and could be used in policy making. Moreover, the results match not only with field
experiences from those areas but also with the poverty and food insecurity situations. Second,
several issues regarding the current status of data collection, analysis and dissemination in
particular and monitoring and evaluation in general have come to attention. These issues
basically highlighted the urgent need for capacity building of the whole process for better results
monitoring and policy inputs.
26

Annexes
27
Annex 1 (a)
Steps of Constructing an EDI
48. A two stage procedure is adopted in the current effort
o First step is a participatory approach in selecting the factors and indicators through a
half day long stakeholder workshop.
o The second step is to apply PCA for each pre-defined dimension.
49. The objective of PCA is to reduce the dimensionality (number of indicators) of the data
set but retain most of the original variability in the data. This involves a mathematical
procedure that transforms a number of possibly correlated variables into a smaller number of
uncorrelated variables called principal components. The first principal component accounts for
as much of the variability in the data as possible, and each succeeding component accounts for as
much of the remaining variability as possible. Thus using PCA one can reduce the whole set of
indicators in to few factors (underlying dimensions) and also can construct dimension index using
factor-loading values as the weight of the particular variable. A detailed description of PCA is
provided in Annex 1(b).
50. One limitation of PCA, however, is that one cannot guarantee that while determining
the underlying dimensions (factors) from a large set of variables using PCA it will conform
to the theoretical reasoning or common understanding while assigning the individual
variables to different factors (underlying dimensions). One remedy is to have pre-defined
dimensions according to theoretical reasoning or common understanding and carry out PCA for
each pre-defined dimension in order to get dimension index. This is a commonly adopted practice
in constructing index using PCA. Both Jadhav and Srivastava and Jhingran and Sankar
identified several dimensions for their effort to construct an EDI for India. However, both the
efforts apparently used their own reasoning and understanding to identify the dimensions, factors
and variables those should be included under each factor.
51. In order to avoid the risk of bias in selection of factors and indicators the current effort
adopts a two stage procedure. The first step ensures a participatory approach in selecting the
factors and indicators. List of available variables and possible factors and indicators were
discussed in a half day long stakeholder workshop. After a long discussion the factors and
variables under each factor were selected. Thus The EDI constructed for this analysis is a
summation of three major indices. These are: (i )input index, (ii) equity index and (iii) outcome
28
index. Input index summarizes the extent of inputs related to access, infrastructure and quality.
Outcome index includes enrolment rate, pass rate, repetition rate and dropout rate.
52. The second step is to apply PCA for each pre-defined dimension. The first task under
PCA is to extract the Principal Components (factors). This depends upon the Eigen value of the
factors. The Eigen value of a PC explains the amount of variation extracted by the PC and hence
gives an indication of the importance or significance of the PC. According to Kaiser’s Criterion
only PCs having Eigen values greater than one should be considered as essential and should be
retained in the analysis. Weight for each variable is calculated from the product of factor
loadings of the principal components with their corresponding Eigen values. In the first step, all
factor loadings are considered in absolute term. Then the principal components, which are higher
than one, are considered and their factor loadings are multiplied with the corresponding Eigen
values for each variable. In the next step, the weight for each variable is calculated as the share
of the aforementioned product for each variable in the sum of such product. The index is then
calculated using the following formula
n n
Xi Lij . Ej
i=1 j=1
I = n n
Lij . Ej
i=1 j=1
Where I is the Index, Xi is the ith Indicator ; Lij is the factor loading value of the ith variable on the
jth factor; Ej is the Eigen value of the jth factor.
53. The overall EDI is calculated based on the individual EDI calculations. One can
calculate the overall EDI as horizontal sum of the individual EDIs. However, this accords all the
dimensions similar weights which is not fully logical. Another option is to apply a two-stage
PCA approach. In this method PCA is run for all the five dimensions and thus weight for each
dimension is determined. One problem with this approach is that PCA may drop the dimension
(regarded as individual variable at this stage) that has less variation in it. Therefore this report
uses this but considers all the factors as extracted. The benefit is that the factors are getting
weights according to their average variation within themselves.
29

Table 4: Summary of the Steps of Constructing an EDI.
Step 1Identifying Dimensions and Indicators
Literature Review – list of possible indicatorsStakeholder Workshop Identify the
dimensions and indicators under each dimension
Step 2Principal Component Analysis
Normalization of values Values can only be between 0 and 1
PCA – Factor Extraction for each dimension separately
Factor loadings calculation Eigen Value Calculation
PCs (factors) selected using Kaiser’s criteria
Calculation of Weights Weight for each variable is calculated from the product of factor loadings of the principal components with their corresponding Eigen values.
Constructing Dimension Index Dimension Factors received weights according to their internal variation
Constructing over all index
30
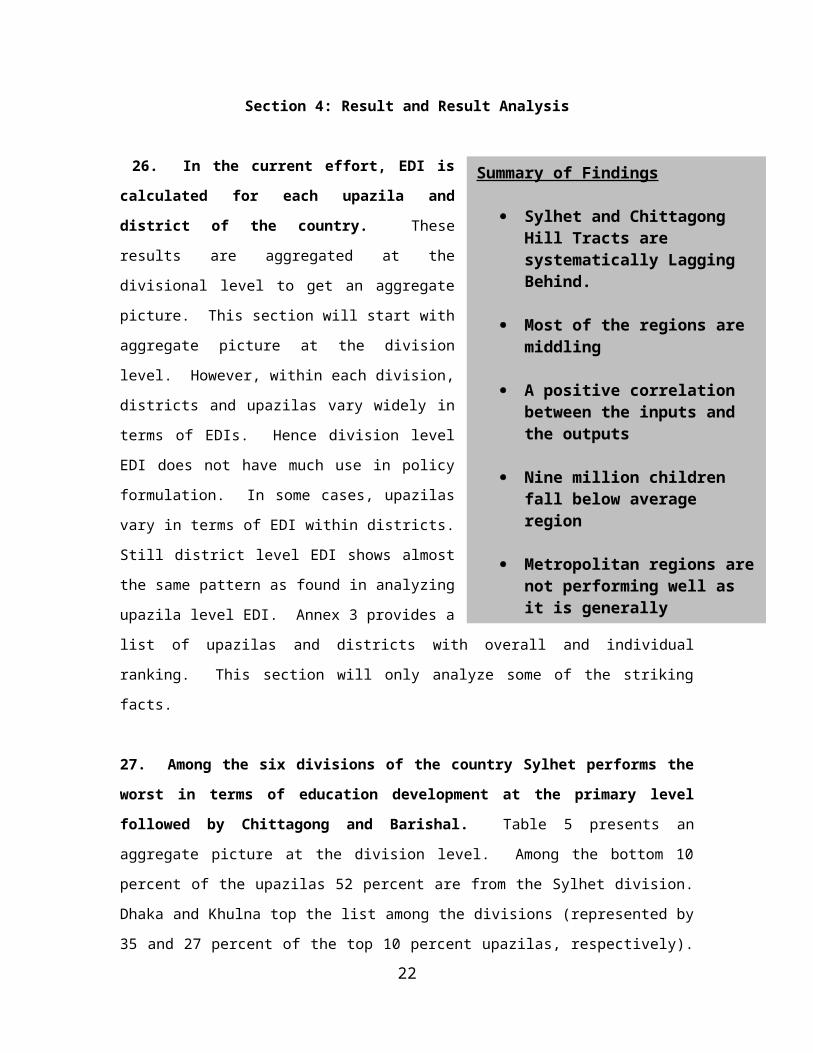
Annex 1 (b)
Definition of PCA
54. Principal Component Analysis (PCA), invented in 1901 by Karl Pearson, involves a
mathematical procedure that transforms a number of possibly correlated variables into a smaller
number of uncorrelated variables called Principal Components (or Factors). PCA involves the
calculation of the eigenvalue decomposition of a data covariance matrix or singular value
decomposition of a data matrix, usually after mean centering the data for each attribute. The
results of a PCA are usually discussed in terms of component scores and loadings (Shaw, 2003).
Depending on the field of application, it is also named the discrete Karhunen-Loève transform
(KLT), the Hotelling transform or proper orthogonal decomposition (POD).
55. It is important to note that not all PCs can be retained in the analysis. The first PC accounts
for as much of the variability in the data as possible, and each succeeding component accounts for
as much of the remaining variability as possible.
56. The PCA method enables to derive the weight for each variable associated with each
principal component and its associated variance explained. In context of constructing a
composite index where it is necessary to assign weight to each indicator, PCA can be used in
weighing each indicator according to their statistical significance (Filmer and Pritchett, 1998,
cited in Jhingran and Sankar, 2008)
57. The method of Principal Components will construct out of a set of original variables (may be
normalized) Xjs (J=1 …… k) and new variables Pjs. Pjs are known as the Principal Components
which are linear combinations of the Xjs.
Equation 1
P1= ∑ a1jXj
P2= ∑ a2jXj
Pk= ∑ akjXj
The a’s are the factor loadings. Steps of PCA is given below
31
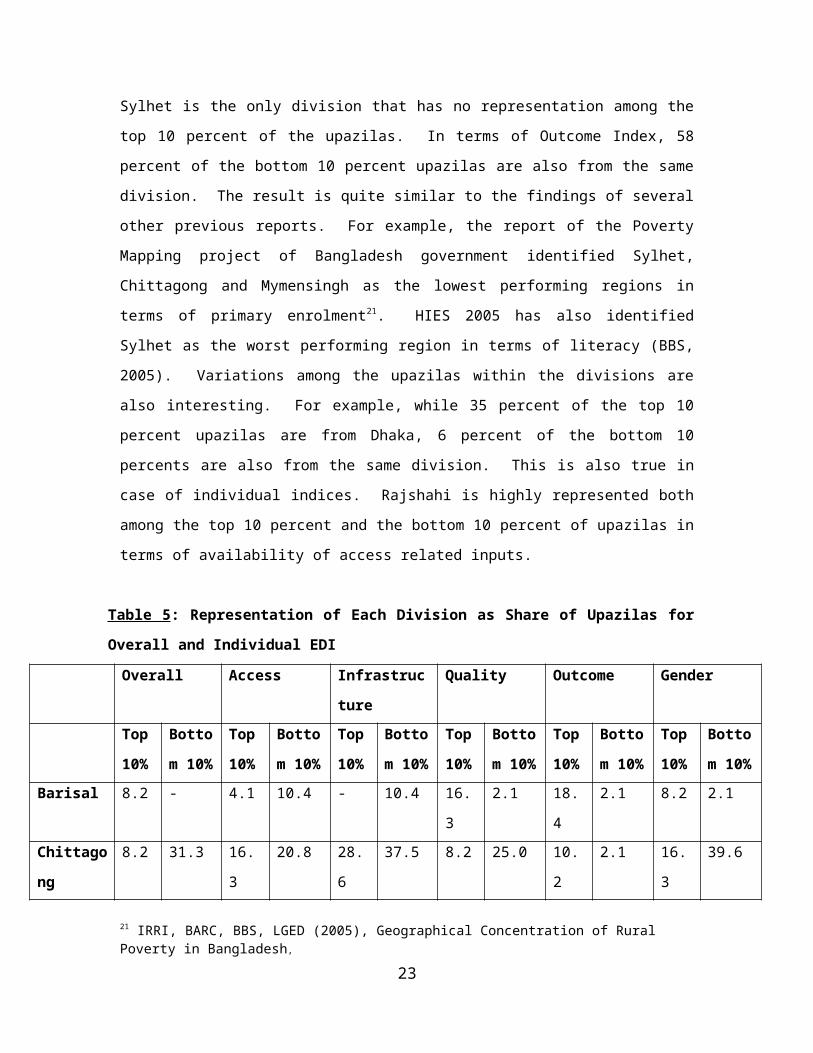
Steps of PCA
Step 1 - Normalization
58. First the Best and Worst values in an indicator are identified. The BEST and the WORST
values will depend upon the nature of a particular indicator. In case of a positive indicator, the
HIGHEST value will be treated as the BEST value and the LOWEST, will be considered as the
WORST value. Similarly, if the indicator is NEGATIVE in nature, then the LOWEST value will
be considered as the BEST value and the HIGHEST, the WORST value. Once the Best and
Worst values are identified, the following formula is used to obtain normalize values:
{Best Xi- Observed Xij}
NVij = 1-
{Best Xi- Worst Xi}
Normalized Values always lies between 0 and 1.
Step 2 - Extracting Factors
59. The first step of extracting Factors (Pjs) is to calculate the factor loadings (a’s) of the
variables under consideration. In PCA, the factor loadings are mathematically determined to
maximize among variables or to maximize the sum of squared correlations of the factors with the
original variables. The factors are ordered with respect to their variations so that the first few
account for most of the variation present in the original variables.
The second step is to select which factors will be retained. This depends upon the Eigen value of
the factors. The Eigen value of a PC explains the amount of variation extracted by the PC and
hence gives an indication of the importance or significance of the PC. Technically Eigen Value is
calculated as sum of square of loadings of each PCs. According to Kaiser’s Criterion only PCs
having Eigen values greater than one should be considered as essential and should be retained in
the analysis.
32
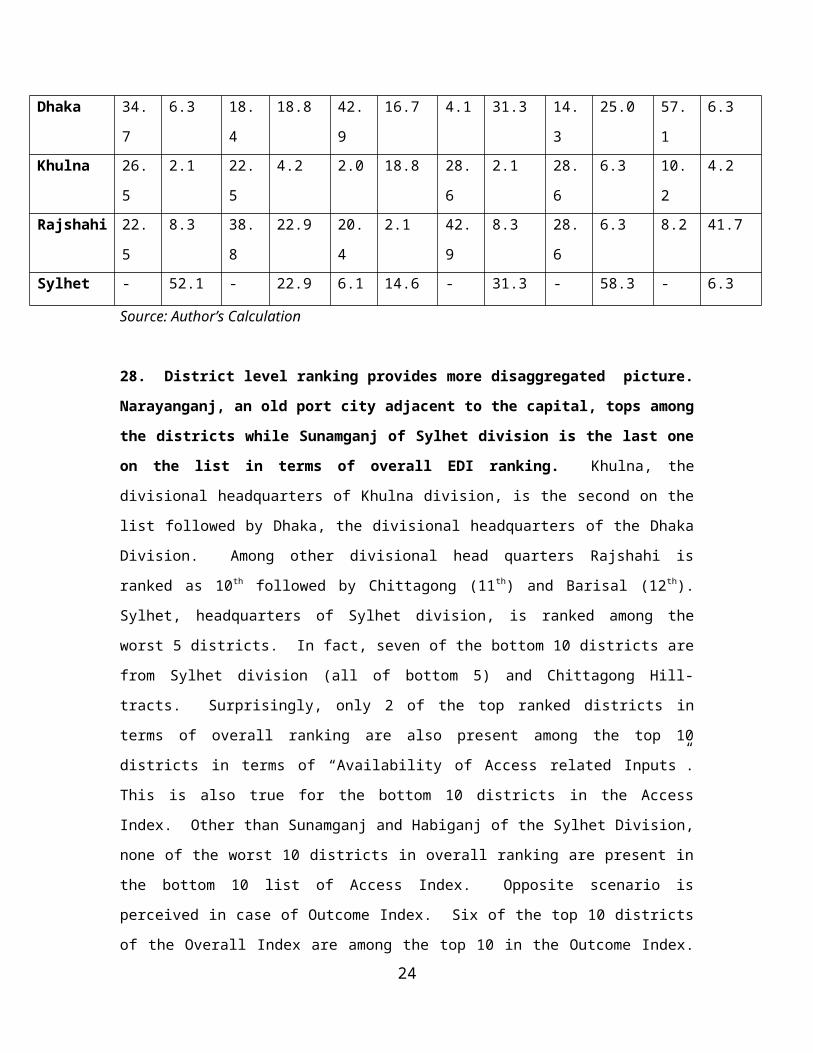
Step -3: Assigning Weight
60. Weight for each variable is calculated from the product of factor loadings of the principal
components with their corresponding Eigen values. At first step all factor loadings are
considered in absolute term. Then the principal components, which are higher than one, are
considered and their factor loadings are multiplied with the corresponding Eigen values for each
variable. In the next step, the weight for each variable is calculated as the share of the
aforementioned product for each variable in the sum of such product.
Step – 4: Constructing Composite Index
61. The following formula is used to determine the Index
n n
Xi Lij . Ej
i=1 j=1
I = n n
Lij . Ej
i=1 j=1
Where I is the Index, Xi is the ith Indicator ; Lij is the factor loading value of the ith variable on
the jth factor; Ej is the Eigen value of the jth factor
Numerical Example
62. Suppose PCA is applied on a data set containing 4 variables. So four PCs will be calculated.
Table below shows the Eigen values and total variance explained by the PC.
33
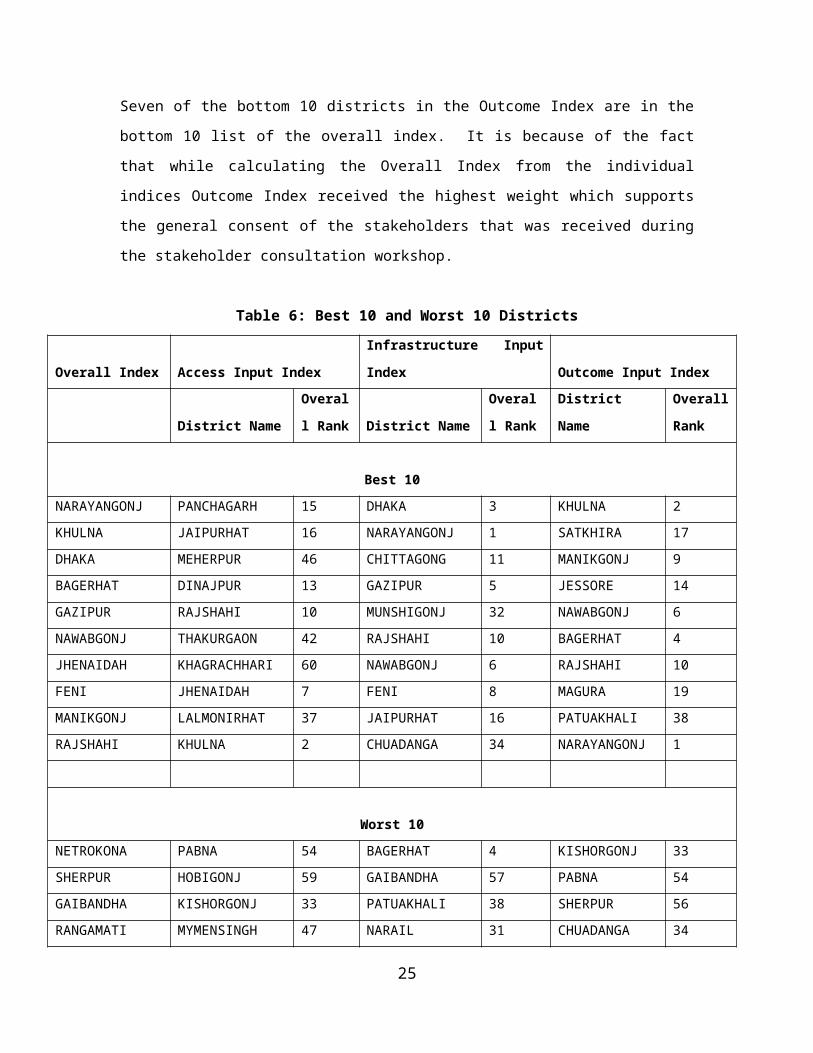
Table 1. 1: Eigen values and total variance explained by the PC
Principal
Components
Eigen Values Total Variance
Explained
Cumulative Variance
First 1.79951 44.99 44.99
Second 1.12999 28.25 73.24
Third 0.64060 16.01 89.25
Fourth 0.42991 10.75 100.00
Based on Kaiser’s criterion, from the above table it appears that only first and second PC can be
retained in the analysis. The two PC’s together explains 73.24 percent of variation among the
dimension.
63. Next, factor loading for each variable is calculated for the selected principal components
(higher than one). Table 1.2 gives the results of these calculated factor loadings.
Table 1.2: Factor loadings for the variables
Variables Factor Loadings
First Principal Component Second Principal
Component
Variable 1 0.8611 -0.0303
Variable 2 0.7447 -0.4129
Variable 3 0.0856 0.9092
Variable 4 -0.7043 -0.3632
Table 1. 3 shows how weights are calculated for each of the variables. As has been mentioned
before, the factor loadings of first and second principal components are considered in absolute
terms. Then the column of first principal component is multiplied by the corresponding eigen
value (1.79951) and the column of second principal component is multiplied by its corresponding
eigen value (1.12999). For each variable the weight is derived as the summation of the
aforementioned two products. The last column of Table 3 shows the weights in percentage form.
34

Table 1. 3: Weights of each variable
Eigen Values WeightsWeights in Percentage
Principal
Component 1 2 1 2 1. 79951 1. 12999 Variable 1 0.8611 0.0303 1.549558 0. 034239 1. 583797 25. 34198Variable 2 0.7447 0.4129 1.340095 0. 466573 1. 806668 28. 90809Variable 3 0.0856 0.9092 0.154038 1. 027387 1. 181425 18. 90372Variable 4 0.7043 0.3632 1.267395 0. 410412 1. 677807 26. 84622 SUM 6.249697 100
Properties and Limitations of PCA
64. PCA is theoretically the optimal linear scheme, in terms of least mean square error, for
compressing a set of high dimensional vectors into a set of lower dimensional vectors and then
reconstructing the original set. It is a non-parametric analysis and the answer is unique and
independent of any hypothesis about data probability distribution. However, the latter two
properties are regarded as weakness as well as strength, in that being non-parametric, no prior
knowledge can be incorporated and that PCA compressions often incur loss of information.
65. The applicability of PCA is limited by the assumptions made in its derivation. These
assumptions are:
Assumption on Linearity: We assumed the observed data set to be linear combinations of
certain basis. Non-linear methods such as kernel PCA have been developed without
assuming linearity.
Assumption on the statistical importance of mean and covariance: PCA uses the
eigenvectors of the covariance matrix and it only finds the independent axes of the data
under the Gaussian assumption. For non-Gaussian or multi-modal Gaussian data, PCA
simply de-correlates the axes. When PCA is used for clustering, its main limitation is
that it does not account for class separability since it makes no use of the class label of
the feature vector. There is no guarantee that the directions of maximum variance will
contain good features for discrimination.
35

Assumption that large variances have important dynamics: PCA simply performs a
coordinate rotation that aligns the transformed axes with the directions of maximum
variance. It is only when we believe that the observed data has a high signal-to-noise
ratio that the principal components with larger variance correspond to interesting
dynamics and lower ones correspond to noise.
66. Essentially, PCA involves only rotation and scaling. The above assumptions are made in
order to simplify the algebraic computation on the data set. Some other methods have been
developed without one or more of these assumptions; these are briefly described below.
36

Annex 2Stakeholder Workshop
67. On September 12, 2008 a stakeholder workshop was arranged to discuss the methodology of
constructing an EDI for the primary education sector of Bangladesh. The workshop was chaired
by Chowdhury Mufad, Joint Program Director, DPE. The workshop was a well represented one
by Government officials, NGO workers and Development Partners. Objective of the workshop
was:
Sharing the idea of EDI, its importance and future use.
Describing the proposed methodology.
Selecting the factors and indicators.
Discussing some strategic issues:
Should the metropolitan areas be kept separate in the analysis? Should the Hill
Tracts be also kept separate in the analysis?
How to deal with the missing enrolment information (i. e. , ebtedayee madrasha,
NGO schools etc. )?
What should be the output of the exercise? What is the best way to disseminate
the results?
The table below shows the list of participants.
Sl No. Name Organization
1. Dr. Selim Raihan University of Dhaka2. Syed Rashed Al-Zayed World Bank3. Dr. S R Howlader RBM, PEDPII4. M. Tofazzel Hossain Miah M&E, Directorate of Primary
Education5. Erum Mariam IED, BRAC Univeristy6. Takayuki Sugawara JICA7. Md. Ataul Hoaque ROSC, DPE8. Mosharraf Hossain ROSC, DPE9. A N S Habibur Rahman ROSC, DPE10. Dr. A K M Khairul Alam ROSC, DPE11. Tahmina Khatun ROSC, DPE12. Syeda Nurjahan ROSC, DPE13. A K M Rashedul Alam ROSC, DPE14. Md. Shamsul Alam ROSC, DPE15. Sawkat A. Siddique NCB16. Ohidur Rashid UNICEF17. Irene Parveen UNICEF18. Monica Malakar SIDA
37

19. Shajeda Begum DPE (M&E)20. Shireen Jahan Khan DPE21. Romij Ahmed DPE22. Md. Mezaul Islam DPE23. Md. Latiful Bari IIRD24. Shamima Tasnim CIDA25. Mokhlesur Rahman World Bank26. Pema Lhazom World Bank27. Fave Mabban Dfid28. Helen J. Craig World Bank29. Chowdhury Mufad Ahmed PEDPII, DPE
38

Annex 3a
District Ranking
District AccessInfrastructur
eQualit
yOutcom
eGende
rRan
kScore
NARAYANGONJ 54.5 41.2 59.0 64.5 58.7 1KHULNA 59.8 24.9 75.6 69.3 48.7 2DHAKA 59.2 45.2 58.2 54.7 60.3 3BAGERHAT 59.1 21.9 74.4 66.8 53.5 4GAZIPUR 53.6 35.5 69.1 56.5 60.4 5NAWABGONJ 52.3 32.2 69.5 67.5 48.2 6JHENAIDAH 60.2 30.3 75.1 62.9 46.1 7FENI 59.4 31.6 69.8 58.0 52.3 8MANIKGONJ 52.6 28.7 70.0 68.4 46.3 9RAJSHAHI 61.7 34.0 72.1 66.1 38.0 10CHITTAGONG 57.4 35.9 61.6 56.7 52.9 11BARISAL 50.9 25.1 65.9 60.1 56.8 12DINAJPUR 62.4 28.4 69.7 58.8 46.9 13JESSORE 55.5 24.4 70.3 68.0 42.5 14PANCHAGARH 65.7 26.0 67.7 57.1 48.2 15JAIPURHAT 64.9 31.5 69.4 57.9 41.0 16SATKHIRA 54.2 24.9 71.6 68.7 38.1 17TANGAIL 53.0 27.6 67.4 57.7 51.6 18MAGURA 57.6 25.7 71.9 65.6 38.6 19BHOLA 57.7 25.8 73.6 56.2 48.1 20COMILLA 53.3 27.7 65.6 63.0 46.1 21RANGPUR 55.7 26.3 73.0 55.8 49.4 22PIROJPUR 56.9 22.6 68.4 63.1 43.6 23NARSINGDI 56.1 29.6 58.5 52.6 56.2 24NATORE 52.1 30.9 72.3 63.7 36.3 25NILPHAMARI 59.6 26.4 71.5 55.8 43.4 26NAOGAON 54.6 25.8 72.1 62.8 38.4 27NOAKHALI 51.6 29.4 66.0 54.5 50.4 28JHALOKATHI 54.7 22.8 72.3 62.5 40.4 29KURIGRAM 55.0 27.7 70.3 61.3 38.4 30NARAIL 56.3 21.4 73.8 57.1 44.6 31MUNSHIGONJ 51.6 35.0 62.6 50.3 51.4 32KISHORGONJ 50.7 26.8 69.2 47.7 55.6 33CHUADANGA 58.8 31.1 71.9 45.1 48.8 34CHANDPUR 55.9 22.8 64.5 64.3 38.7 35BARGUNA 52.9 23.6 72.0 60.3 40.0 36LALMONIRHAT 60.0 27.2 68.5 50.7 45.9 37PATUAKHALI 49.7 21.8 74.1 64.8 36.3 38KUSHTIA 57.5 28.1 68.6 55.6 40.8 39COX'S BAZAR 55.9 30.6 65.3 48.6 49.4 40BOGRA 56.4 27.9 68.3 58.3 38.4 41THAKURGAON 61.2 24.1 68.2 54.3 42.1 42
39
MADARIPUR 46.5 22.4 59.6 64.1 43.3 43
District AccessInfrastructur
eQualit
yOutcom
eGende
rRan
kScore
FARIDPUR 54.6 24.1 66.2 56.4 41.9 44SIRAJGONJ 48.2 26.4 70.3 57.9 39.2 45MEHERPUR 62.7 29.5 67.9 49.9 39.2 46MYMENSINGH 50.3 25.3 68.8 48.6 48.6 47GOPALGONJ 49.5 18.3 66.8 60.9 41.4 48LUXMIPUR 53.7 29.7 67.0 49.4 43.6 49RAJBARI 55.5 28.0 69.9 58.2 31.4 50SHARIATPUR 51.9 24.9 62.2 47.9 51.3 51BRAHMONBARIA 47.0 26.9 69.6 50.2 45.6 52JAMALPUR 51.0 27.6 67.9 43.7 48.2 53PABNA 50.8 29.2 72.7 46.7 40.0 54NETROKONA 52.1 22.5 69.0 40.6 51.5 55SHERPUR 58.4 23.9 63.6 46.1 43.5 56GAIBANDHA 54.6 21.9 66.8 53.5 35.0 57RANGAMATI 53.0 16.8 69.2 60.7 24.0 58HOBIGONJ 50.8 24.2 63.0 39.1 47.1 59KHAGRACHHARI 60.5 20.5 65.0 49.3 27.0 60SYLHET 51.9 30.2 56.6 33.0 45.3 61MOULVIBAZAR 55.1 20.6 59.4 36.8 40.3 62BANDARBAN 59.0 14.9 66.4 49.5 19.3 63SUNAMGONJ 41.5 19.8 61.1 28.9 38.7 64
40

Annex 3b
Upazilas by EDI Deciles
Decile 1 (Lowest Decile) Decile 2 Decile 3District Upazila District Upazila District Upazila
Bandarban ALIKADAM BandarbanBANDARBAN
SADAR Barguna AMTALI
Bandarban LAMA Barisal HIZLA BargunaBARGUNA
SADARBandarban NAIKHANGCHHARI Bogra SHARIAKANDI Barisal BAKHERGONJBandarban ROANGCHHARI Bogra SHONATOLA Barisal MEHENDIGONJBandarban RUMA Brahamanbaria NASIRNAGAR Bhola TOZUMUDDINBandarban THANCHE Comilla MURADNAGAR Brahamanbaria BANCHARAMPUR
Brahamanbaria SARAIL Cox'S Bazar TEKNAF BrahamanbariaBRAHMONBARIA
SADARCox'S Bazar PEKUA Gaibandha FULCHHARI Brahamanbaria NABINAGAR
GaibandhaGAIBANDHA
SADAR Gaibandha SHUNDORGONJ ChandpurCHANDPUR
SADAR
Habiganj AJMIRIGONJ Gopalganj KOTALIPARA ChuadangaCHUADANGA
SADARHabiganj BANICHANG Gopalganj MAKSUDPUR Chuadanga DAMURHUDAHabiganj NABIGONJ Habiganj CHUNARUGHAT Comilla MEGHNA
Jessore BAKSHIGONJ HabiganjHABIGONJ
SADAR Faridpur ALPHADANGAKhagrachhari DIGHINALA Habiganj LAKHAI Faridpur BOALMARIKhagrachhari LAKXMICHHARI Habiganj MADHABPUR Faridpur SADARPURKhagrachhari PANCHHARI Jessore DEWANGONJ Gaibandha GOBINDOGONJKishoreganj ASTOGRAM Jessore MADARGONJ Gaibandha PALASHBARIKishoreganj MITHAMOIN Khagrachhari MATIRANGA Gaibandha SHADULLAPURLalmonirhat LUXMIPUR SADAR Khagrachhari RAMGARH Gaibandha SHAGHATA
Maulvibazar JURI Kishoreganj ITNA GopalganjGOPALGONJ
SADARMaulvibazar KAMALGONJ Kurigram RAJIBPUR Gopalganj KASHIANIMaulvibazar KULAURA Kushtia DAULATPUR Jessore ISLAMPUR
Maulvibazar RAJNAGAR MadaripurMADARIPUR
SADAR Jessore MELANDAHNetrakona KHALIAJHURI Maulvibazar SREEMANGAL Kishoreganj KARIMGONJ
Pabna BHANGURA Munshiganj TONGIBARI Lalmonirhat RAMGATI
Pabna CHATMAHAR Mymensingh DHUBAURA MaulvibazarMOULVIBAZAR
SADARRangamati BAGHAICHHARI Mymensingh HALUAGHAT Meherpur MUJIBNAGAR
Rangamati BILAICHARI NarsingdiNARSINGDI
SADAR Munshiganj SREENAGARRangamati JURACHHARI Netrakona KANDUA Mymensingh GAFFARGAONRangamati LANGADU Netrakona MOHANGANJ Mymensingh ISWARGONJSunamganj BISWAMBARPUR Noakhali BEGUMGANJ Mymensingh MUKTAGACHHA
Sunamganj CHATAK Pabna BERA MymensinghMYMENSING
SADAR
41
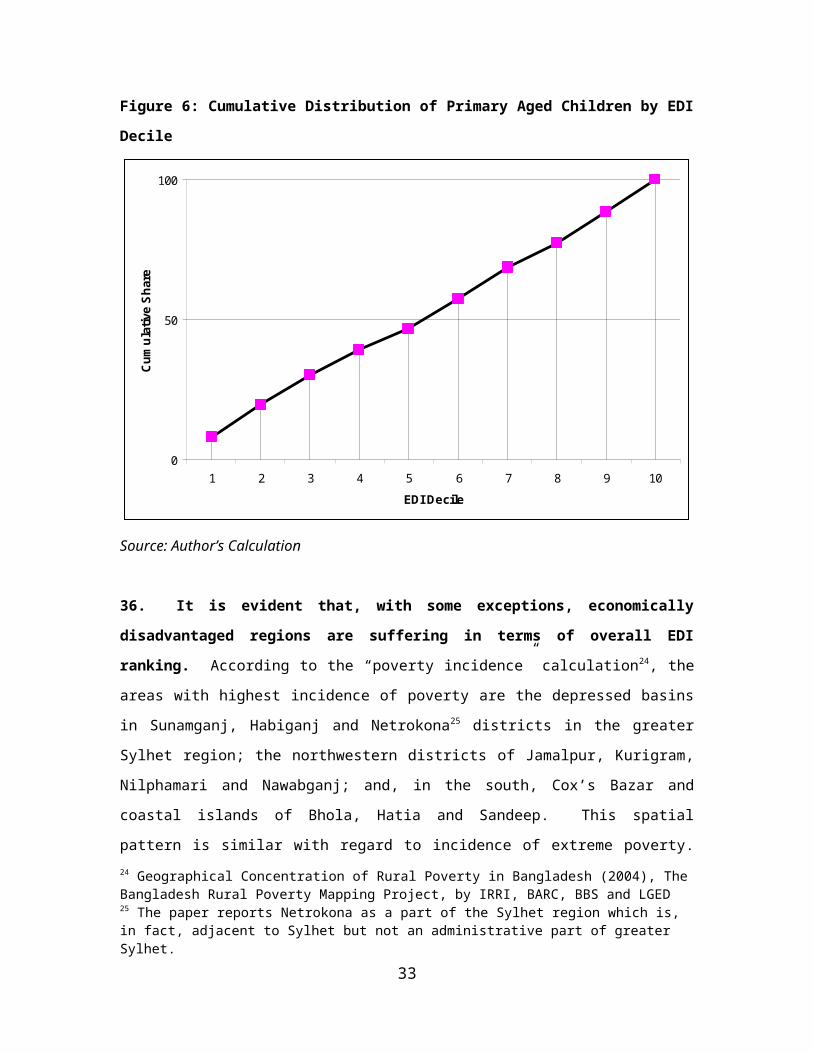
Sunamganj DERAI Pabna SUJANAGAR Narsingdi RAYPURASunamganj DHARAMPASHA Patuakhali GOLACHIPA Natore SHINGRASunamganj DOWARABAZAR Rangamati BARKAL Netrakona ATPARASunamganj JAGANNATHPUR Rangamati KOWKHALI Netrakona BARHATTASunamganj JAMALGONJ Rangamati NANIARCHAR Netrakona DURGAPUR
Sunamganj SHALLA RangamatiRANGAMATI
SADAR Netrakona MADAN
SunamganjSUNAMGONJ
SADAR Sherpur JHENAIGATI NoakhaliNOAKHALI
SADARSunamganj TAHIRPUR Sherpur NALITABARI Pabna ATGHARIA
Sylhet BALAGANJ Sherpur SREEBORDI Pabna SANTHIASylhet BIANIBAZAR Sirajganj CHOWHALI Patuakhali BAUPHALSylhet BISHWANATH Sirajganj KAZIPUR Rajbari GOALANDASylhet COMPANIGONJ Sirajganj SHAJADPUR Rajbari PANGSHASylhet GOAINGHAT Sirajganj ULLAPARA Shariatpur DAMUDDASylhet GOLAPGONJ Sylhet JAINTAPUR Shariatpur GOSHAIRHAT
Sylhet JAKIGONJ Sylhet SYLHET SADAR ShariatpurSHARIATPUR
SADAR
Sylhet KANAIGHAT ThakurgaonTHAKURGAON
SADAR Sherpur SHERPUR SADAR
42

Decile 4 Decile 5 Decile 6District Upazila District Upazila District Upazila Barguna BETAGI Bagerhat MOROLGONJ Bogra DHUPCHACHIABhola CHARFASHION Bhola LALMOHAN Bogra SHIBGONJBogra BOGRA SADAR Chandpur SHAHRASTI Bogra SHERPURBogra DHUNUT Chandpur HAIMCHAR Chandpur FARIDGONJBogra NANDIGRAM Chandpur KACHUA Chandpur HAJIGANJBogra SHAJAHANPUR Chittagong SANDWIP Chittagong FATIKCHARIBrahamanbaria KASHBA Comilla BRAHMANPARA Chittagong PATIYAChandpur MATLAB Comilla LAKSHAM Comilla HOMNAChittagong CHANDANAISH Cox'S Bazar COX'S BAZAR Cox'S Bazar RAMUChittagong SATKANIA Cox'S Bazar MAHESHKHALI Dhaka SUTRAPURComilla TITAS Dhaka SAVAR Dhaka NAWABGANJCox'S Bazar PEQUA Dhaka DOHAR Dhaka MIRPURFaridpur CHARBHARDRASON Dinajpur BIROL Dinajpur FULBARIFaridpur MADHUKHALI Habiganj BAHUBAL Dinajpur BIRGONJFaridpur NAGARKANDA Jessore SHARISHABARI Dinajpur KAHAROLEJamalpur JAIPURHAT SADAR Kishoreganj BAJITPUR Faridpur BHANGAJhenaidah NOLCHHITI Kurigram FULBARI Faridpur SADAR
KhagrachhariKHAGRACHHARI SADAR Kurigram BHURUNGAMARI Feni SONAGAZI
Khagrachhari MANIKCHHARI Lakshmipur ADITMARI Jhalokati SHARSHAKhulna KAYRA Lakshmipur KALIGONJ Jhalokati CHOUGACHHA
Kishoreganj NIKLI LakshmipurLALMONIRHAT SADAR Jhalokati AVOYNAGAR
Kurigram NAGESWARI Lakshmipur HATIBANDHA Jhenaidah KATHALIAKurigram ROWMARI Lalmonirhat RAYPUR Joypurhat SOILKUPAKushtia KUMARKHALI Madaripur SHIBCHAR Khulna DAKOPEKushtia KUSHTIA SADAR Magura MAGURA SADAR Madaripur RAZOIRMadaripur KALKINI Manikganj DAULATPUR Magura MOHAMMADPURMeherpur MEHERPUR SADAR Meherpur GANGNI Munshiganj GAZARIAMymensingh FULPUR Mymensingh FULBARIA Mymensingh NANDAILMymensingh GOURIPUR Mymensingh TRISHAL Naogaon MANDANaogaon ATRAI Mymensingh BHALUKA Narail KALIANaogaon NAOGAON SADAR Naogaon SHAPAHAR Narayanganj ARAIHAZARNaogaon NIAMATPUR Natore GURUDASHPUR Narsingdi PALASHNaogaon RANINAGAR Netrakona PURBADHALA Natore NATORE SADAR
Narail NARAIL SADAR NetrakonaNETROKONA SADAR Natore BARAIGRAM
Netrakona KALMAKANDA Pabna PABNA SADAR Nawabganj SHIBGONJNilphamari DIMLA Pirojpur BHANDARIA Nilphamari DOMARNilphamari JALDHAKA Pirojpur PIROJPUR SADAR Patuakhali KOLAPARANilphamari KISHOREGONJ Rajshahi BAGHMARA Patuakhali DASHMINANoakhali HATIYA Rangamati KAPTAI Patuakhali MIRZAGONJPabna FARIDPUR Rangpur GANGACHHARA Pirojpur NESARABADRajbari BALIAKANDI Rangpur MITHAPUKUR Rajbari RAJBARISatkhira SHAMNAGAR Sherpur NAKLA Rangpur PIRGONJShariatpur BHEDORGANJ Sirajganj RAYGONJ Satkhira TALA
43
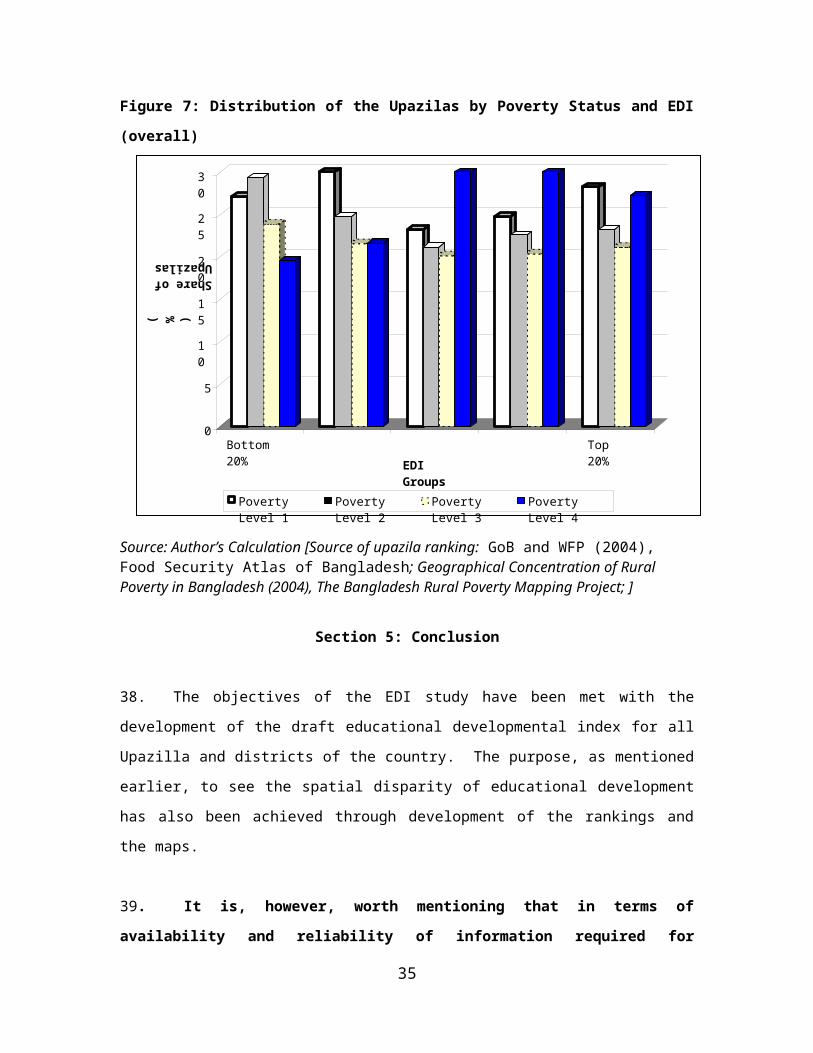
Shariatpur JAJIRA Sirajganj BELKUCHI Satkhira ASHASHUNIShariatpur NARIA Sirajganj SIRAJGONJ SADAR Sirajganj KAMARKHANDATangail KALIHATI Sylhet FENCHUGONJ Tangail BHUAPURTangail MIRZAPUR Tangail NAGARPUR Tangail TANGAIL SADARThakurgaon BALIADANGI Thakurgaon RANISHANKOIL Thakurgaon HORIPUR
44

Decile 7 Decile 8 Decile 9District Upazila District Upazila District Upazila Barguna BAMNA Bagerhat SARANKHOLA Barisal AGAILJHARABarisal MULADI Barguna PATHARGHATA Barisal BARISAL SADARChandpur MATLAB UTTAR Barisal BANARIPARA Bhola BORHANUDDINChittagong HATHAZARI Bhola MANPURA Bhola DAULATKHANChittagong BASHKHALI Bogra GABTOLI Bhola BHOLA SADARChuadanga ALAMDANGA Chittagong MIRERSWARAI Bogra KAHALOOComilla NANGALKOT Chittagong SITAKUNDA Brahamanbaria AKHAURAComilla CHANDINA Chittagong ANWARA Chittagong DOUBLEMURINGDhaka ADSABAR Comilla BARURA Chittagong BOALKHALI
Dhaka RAMNACox'S Bazar UKHIYA Chittagong LOHAGORA
Dinajpur NAWABGONJ Dinajpur CHIRIRBANDAR Chittagong PACHLAISHDinajpur GHORAGHAT Dinajpur KHANSHAMA Chittagong ROWZANGazipur KALIAKOIR Dinajpur BIRAMPUR Chittagong CHANDGAONJamalpur KHETLAL Dinajpur PARBOTIPUR Chittagong RANGUNIA
JessoreJAMALPUR SADAR Feni DAGONBHUIYA Chuadanga JIBAN NAGAR
Jhalokati BAGARPARA Gazipur SREEPUR Comilla CHOWDDAGRAMJhalokati JESSORE SADAR Gazipur KAPASIA Comilla DEBIDHARJhenaidah RAJAPUR Gazipur KALIGONJ Comilla COMILLA SADAR
JoypurhatJHENAIDAH SADAR Jamalpur PACHBIBI Dhaka TEJGAON
Khulna PAIKGACHA Jhalokati JHIKARGACHHA Dhaka MOTIJHEELKishoreganj HOSSAINPUR Kishoreganj PAKUNDIA Dhaka KERANIGONJKishoreganj BHAIROB Kishoreganj TARAIL Dinajpur DINAJPUR SADARKurigram RAJARHAT Kurigram ULIPUR Feni CHAGALNAIYAKurigram CHILMARI Kushtia KHOKSHA Feni FENI SADARLakshmipur PATGRAM Kushtia BHERAMARA Feni PARSHURAMManikganj SHIBALOY Lalmonirhat RAMGONJ Gopalganj TONGIPARAManikganj SINGAIR Magura SHREEPUR Jamalpur AKKELPURMunshiganj SIRAJDIKHAN Manikganj HARIRAMPUR Jamalpur KALAI
MunshiganjMUNSHIGONJ SADAR Munshiganj LOWHAJANG Jhalokati KESHABPUR
Naogaon PORSHA Naogaon DHAMURHAT Joypurhat HARINAKUNDANaogaon PATNITALA Naogaon MOHADEBPUR Khulna DUMURIANarail LOHAGARA Narsingdi SHIBPUR Kishoreganj KULIARCHARNarsingdi MONOHORDI Noakhali COMPANIGONJ Kishoreganj KATIADI
Natore BAGATIPARA Panchagarh ATWARI KishoreganjKISHOREGONJ SADAR
Nawabganj NACHOL Panchagarh TETULIA Kushtia MIRPUR
NawabganjNAWABGONJ SADAR Panchagarh
PANCHAGARH SADAR Magura SHALIKHA
NilphamariNILPHAMARI SADAR Patuakhali DUMKI Manikganj GHIOR
Panchagarh BODA Pirojpur NAZIRPUR Naogaon BADALGACHHIPanchagarh DEBIGONJ Rajshahi DURGAPUR Narayanganj RUPGONJ
45

Pirojpur KAUKHALI Rajshahi BAGHA Noakhali SENBAGHRangamati RAJASTHALI Rajshahi TANORE Noakhali CHATKHILRangpur KAWNIA Rajshahi GODAGARI Pabna ISHWARDIRangpur TARAGONJ Rangpur BADARGONJ Rajshahi PUTHIASatkhira SATKHIRA SADAR Rangpur PIRGACHHA Rajshahi MOHANPURTangail GOPALPUR Satkhira DEBHATA Rajshahi CHARGHATTangail MODHUPUR Satkhira KOLAROA Rangpur RANGPUR SADARTangail GHATAIL Sirajganj TARASH Satkhira KALIGONJThakurgaon PIRGONJ Tangail SHOKHIPUR Tangail BASHAIL
46

Decile 10 (Highest Decile)District Upazila Bagerhat MOLLARHATBagerhat RAMPALBagerhat CHITALMARIBagerhat KACHUABagerhat FAKIRHATBagerhat MONGLA
BagerhatBAGHERHAT SADAR
Barisal GOURNADIBarisal BABUGONJBarisal UZIRPURChittagong PAHARTALIChittagong BANDARChittagong KOTWALIComilla BURICHANGCox'S Bazar KUTUBDIADhaka DHAMRAIDhaka DHANMONDIDhaka GULSHANDhaka KOTWALIDhaka DEMRADhaka LALBAGDhaka CANTONMENTDinajpur BOCHAGONJDinajpur HAKIMPURFeni FULGAZIGazipur GAZIPUR SADARGazipur TONGIJhalokati MANIRAMPURJoypurhat KALIGONJJoypurhat COTCHANDPURJoypurhat MOHESHPURKhulna TERAKHADAKhulna FULTALAKhulna KHULNA SADARKhulna DIGHULIAKhulna BATIAGHATAKhulna RUPSHAKurigram KURIGRAM SADARManikganj SATURIA
ManikganjMANIKGONJ SADAR
Narayanganj SONARGAONNarayangan BANDAR
47
jNarayanganj
NARAYANGONJ SADAR
Narsingdi BELABNatore LALPURNawabganj GOMASTAPURNawabganj BHOLAHATNilphamari SAIDPURRajshahi PABARajshahi BOALIA(SADAR)Tangail DELDUAR
48

49
Annex 4a
50
Annex 4bAnnex 4c

51
Annex 4d

REFERENCES
Abdalla A. , A. N. M. Raisuddin, and S. Hussein (July 2004). Bangladesh Educational Assessment. Pre-primary and Primary Madrasah Education in Bangladesh. . USAID, Washington DC.
Bangladesh Bureau of Statistics (BBS) (1996). Household Income & Expenditure Survey 1995-1996, Bangladesh Bureau of Statistics (BBS), Dhaka: Ministry of Planning, Government of the People’s Republic of Bangladesh.
Bangladesh Bureau of Statistics (BBS) (2001). Household Income & Expenditure Survey 2000, Bangladesh Bureau of Statistics (BBS), Dhaka: Ministry of Planning, Government of the People’s Republic of Bangladesh.
Bangladesh Bureau of Statistics (BBS) (2005). Household Income & Expenditure Survey 2000, Bangladesh Bureau of Statistics (BBS), Dhaka: Ministry of Planning, Government of the People’s Republic of Bangladesh.
Bangladesh Rural Advancement Committee (BRAC) (2005). Annual report 2004, Dhaka
Barrett, A. and K. Dunn (2006). “Reaching the MDGs in Urban Bangladesh,” Presented at Workshop on Towards a strategy for Achieving the MDG outcomes in Bangladesh June 5 and 6, Dhaka: The World Bank.
CAMPE (1999), Hope Not Complacency - State of Primary Education in Bangladesh 1999. http://www. campebd. org/content/EW_1999. htm
CAMPE (2000), Education Watch (2000) - A Question of Quality – State of Primary Education in Bangladesh, Volume 1, Dhaka: University Press Ltd.
CAMPE (2001), Education Watch (2001) - Renewed Hope Daunting Challenges – State of Primary Education in Bangladesh, Dhaka: University Press Ltd.
CAMPE (2003), Education Watch (2002), Literacy in Bangladesh: Need for a New Vision, 2002, Dhaka: University Press Ltd.
Center for Urban Studies (May 2006), Slums of Urban Bangladesh: Mapping and Census, 2005.
CPD (2001), Policy Brief On “Education Policy”, CPD Task Force Report (2001). http://www. sdnpbd. org/sdi/issues/education/Document/education-policy-cpd. pdf
De Savigny, D. ; Binka, F. (2004), “Monitoring Impact on Malaria Burden in Sub-Saharan Africa”. American Journal of Tropical Medicine and Hygiene. http://www. ajtmh. org/cgi/content/full/71/2_suppl/224
Dhir Jhingran and Deepa Sankar (2006), Orienting Outlays towards Needs: An evidence based, equity-focused approach for Shava Shiksha Abhiyan
Dhir Jhingran and Deepa Sankar (2009), Addressing Educational Disparity: Using District level Education Development Indices (EDI) for equitable resource allocations in India
52
GoB/PMED (2002), EFA Plan of Action (January 2002) - National Plan of Action- Education For all in Bangladesh,
GoB and WFP (2004), Food Security Atlas of Bangladesh.
Government of India (2006), Education Development Index, Education Division, Planning Commission, Govt. of India
Institute of Applied Manpower Research (2005), Educational Development Index in India: An inter-state Perspective, Delhi.
IRRI, BARC, BBS, LGED (-----------), Geographical Concentration of Rural Poverty in Bangladesh, http://www. barc. gov. bd/documents/RurPovMapBD_4BCA. pdf
PEDP II Baseline Survey Report (June 2006), Directorate of Primary Education, Ministry of Primary and Mass Education, Government of the Peoples’ Republic of Bangladesh.
Program Development Office for Integrated Coastal Zone Management Plan (PDO-ICZMP, Draft 2005), Coastal Development Strategy: Unlocking the Potentials of the Coastal Zone, Dhaka, Bangladesh http://www. bnnrc. net/resouces/cds. pdf
Samer Al-Samarrai (January 2007), “Financing basic education in Bangladesh”, Working paper prepared for the Consortium for Research on Educational Access, Transitions and Equity (CREATE), Institute of Education and Development, BRAC University, Dhaka, Bangladesh.
Shaw PJA (2003), Multivariate statistics for the Environmental Sciences, Hodder-Arnold.
Stopnitzky, Y. , R. A. Zayed, and Q. Khan (2006). “Addressing the Crisis in Secondary Education for the Poor in Metropolitan Areas,” Presented at Workshop on Towards a strategy for Achieving the MDG outcomes in Bangladesh June 5 and 6, Dhaka: The World Bank.
UNESCO (2006), EFA Global Monitoring Report, http://www. unesco. org/education/GMR2006/full
UNDP (2005). Millennium Development Goals: Bangladesh Progress Report 2005. Oxford University Press, New York.
World Bank (2005). “Attaining the Millennium Development Goals in Bangladesh: How Likely and What Will It Take To Reduce Poverty, Child Mortality and Malnutrition, Gender Disparities, and to Increase School Enrollment and Completion?” Human Development Unit, South Asia Region, The World Bank.
World Bank (2006). World Development Indicators, World Bank, Washington, DC.
World Bank (2008), Education for All In Bangladesh: Where Does Bangladesh Stand in Achieving the EFA goals by 2015.
53