edmonton waterworks - epcor · edmonton waterworks . annual report to . ... 4.1 liquid alum...
TRANSCRIPT
EDMONTON WATERWORKS
ANNUAL REPORT TO ALBERTA ENVIRONMENT AND WATER
2017
Approval Number 638-03-00
2017 ANNUAL REPORT
TABLE OF CONTENTS PAGE
1.0 Overview
1.1 Overview .................................................................................................................. 1 1.2 Process Schematic – Rossdale (Plants 1 & 2) ......................................................... 5 1.3 Process Schematic – E. L. Smith (Plant 4) .............................................................. 6 1.4 Summary of Violations and Major Incidents ............................................................. 7 1.5 Alberta Environmental Operator Certifications ....................................................... 10 1.6 Demand Production Statistics (Estimated highlift flow) .......................................... 16 1.7 Energy Consumption and Usage ........................................................................... 17
2.0 Raw Pumpage, Treated Pumpage and Distribution System
2.1 Storage Capacities of Reservoirs .......................................................................... 18 2.2 Reservoir Pressure Operating Ranges .................................................................. 19 2.3 Fire Hall and other City Pressure Limits ................................................................. 20 2.4 Regional Customers .............................................................................................. 21 2.5 Pumping Facilities within the City of Edmonton Distribution System ..................... 22 2.6 Production Summary ............................................................................................. 24 2.7 Raw Water Intake (ML) .......................................................................................... 25 2.8 Treated Water Production (ML) ............................................................................. 26
3.0 Water Quality
3.1 Raw Water Quality – North Saskatchewan River ................................................... 27 3.2 Treated Water Quality Entering the Distribution System ........................................ 28 3.3 Rossdale Filters 1 - 9 Particle Counts (no./mL,>2um) ........................................... 29 3.4 E.L. Smith Filters 1 - 9 Particle Counts (no./mL,>2um) .......................................... 30 3.5 E.L. Smith Filters 10 -18 Particle Counts (no./mL,>2um) ....................................... 31 3.6 Rossdale Filters 1 – 9 Turbidity (NTU) ................................................................... 32 3.7 E.L. Smith Filters 1 – 9 Turbidity (NTU) ................................................................. 33 3.8 E.L. Smith Filters 10 – 18 Turbidity (NTU) ............................................................. 34 3.9 Combined Filter Effluent Water Quality .................................................................. 35 3.10 Rossdale UV Disinfection – Filters 1 - 3 ................................................................. 36 3.11 Rossdale UV Disinfection – Filters 4 - 6 ................................................................. 37 3.12 Rossdale UV Disinfection – Filters 7 - 9 ................................................................ 38 3.13 E. L. Smith UV Disinfection – UV Reactors 1 - 4 ................................................... 39 3.14 Log Removal .......................................................................................................... 40
4.0 Chemicals
4.1 Liquid Alum Chemical Consumption ...................................................................... 41 4.2 Primary Polymer (Magnafloc LT 27AG) Chemical Consumption ........................... 42 4.3 Carbon Chemical Consumption ............................................................................. 43 4.4 Chlorine and Sodium Hypochlorite Chemical Consumption ................................... 44

4.5 Filter Polymer (Magnafloc LT 7996) Chemical Consumption ................................. 45 4.6 Aqua Ammonia Chemical Consumption ................................................................ 46 4.7 Caustic Soda Chemical Consumption .................................................................... 47 4.8 Fluoride Chemical Consumption ............................................................................ 48 4.9 Sodium Bisulfite Chemical Consumption ............................................................... 49
5.0 Waste Streams
5.1 Waste Stream Volumes (ML) ................................................................................. 50 5.2 Rossdale Clarifier Blowdown, Clarifier Washdown and Backwash Water
Waste Stream Data ........................................................................................................ 51 5.3 Rossdale Waste Stream Data ................................................................................ 52 5.4 E.L. Smith Clarifier Blowdown, Clarifier Washdown and Backwash Water Waste
Stream Data ........................................................................................................... 53 5.5 E.L. Smith Waste Stream Data .............................................................................. 54
6.0 Reservoir Chlorine Residual Part 1 .............................................................. 55 6.1 Reservoir Chlorine Residual Part 2 ......................................................................... 56 7.0 Quality Assurance
7.1 Water Quality Objectives ...................................................................................... 57 7.2 Summary of Major Chemicals, Microbiological and Physical Parameters ............ 58 7.3 Summary of Laboratory Analysis .......................................................................... 59 7.4 Bacteriological Data: Water Treatment Plants ...................................................... 60 7.5 Bacteriological Data: Distribution System ............................................................. 61 7.6 Giardia and Cryptosporidium ................................................................................ 65 7.7 Treated Water Entering the Distribution System .................................................. 68 7.8 Rossdale and E.L. Smith combined Filter Effluent Water Analysis ....................... 76 7.9 Routine Distribution System ................................................................................. 78 7.10 Castledowns, Clareview and Kaskitayo Reservoir................................................ 82 7.11 Londonderry, Millwoods, and North Jasper Place Reservoir ................................ 86 7.12 Ormsby, Papaschase 1 and Papaschase 2 Reservoir ......................................... 90 7.13 Rosslyn 1, Rosslyn 2 and Thorncliff Reservoir ..................................................... 94 7.14 Routine Distribution System, Field Reservoirs, Fire Stations
and Staff Residences ......................................................................................... 98 7.15 Raw River Water ................................................................................................ 101 7.16 Statistics on Water Quality Complaint Samples ................................................. 112 7.17 Method Detection Limits ..................................................................................... 113 7.18 Explanation of Notations Used ........................................................................... 122

1.1 Overview
Through 2017, EPCOR Water Services Inc. (EWSI) continued to satisfy all water
demand requirements while meeting our strict water quality criteria. Despite
continued growth of the service population, total demand in 2017 fell as
compared to 2016 and 2015. This could be a result of cooler, wetter summer
conditions but also decreasing demands from the industrial and commercial
segments, perhaps indicating an impact of the economy. Overall residential per
capita and total per capita values also continued to trend downward primarily due
to the installation of water efficient fixtures and appliances.
Rossdale and E.L. Smith WTPs were converted from Direct Filtration (DF) to
conventional treatment on February 18th as very mild temperatures resulted in
the upstream creeks starting to flow. Some odours were detected and carbon
was turned on for 8 days. As the temperatures decreased towards the end of
February, Rossdale was able to be converted back into direct filtration mode on
March 10 until March 21, where warm temperatures again brought spring runoff
conditions. Though colour peaked at 83 TCU, spring runoff did not bring any
significant taste and odour concerns and carbon was finally turned off on April 7.
There were two rainfall/mountain runoff events near the end of May and mid-
June, which resulted in peak turbidities of approximately 550 and 1300 NTU,
respectively. These events were handled well with no production problems
encountered. There were no other significant rainfall events affecting water
quality the rest of the year.
While raw water quality was reasonably stable, there were a couple of significant
infrastructure failures that impacted production at E.L. Smith. In late 2016 and
again in the fall of 2017, leaks were discovered on one of the two pipelines which
convey raw water from the low lift pumphouse to the WTP. While each leak was
ultimately repaired, production was impacted due to the requirement to shut
down the pumphouse feeding the line. The fish return pumps in one of the lowlift
pumphouses at E.L. Smith WTP also failed without warning and had to be
repaired offsite.
Edmonton WTPs continued to focus on optimizing chemical dosing and
minimizing release of water treatment plant solid residuals to the NSR. A new
filter polymer (LT-7995) was implemented at both WTPs as pilot trial tests
demonstrated improved filter run times and effluent quality, particularly during
direct filtration. A new grade of fluoride (hydrofluosilicic acid) was also
implemented at both WTPs. The new product had much lower levels of impurities
than the previous product.
As previously mentioned, fall water quality was very good and the Rossdale WTP
was able to convert to direct filtration on September 5 for 14 days before
returning to conventional mode after a moderate increase in turbidity and colour.
It was able to revert to direct filtration mode on October 5 followed by E.L. Smith
on October 18 (with a short transition to conventional mode between October 31
and November 10). Overall, the WTPs were able to reduce total solids
discharged to the NSR by 25% during the months of January, February,
November and December 2017 compared to baseline conventional operation. In-
stream sampling and monitoring of WTPs clarifier waste stream discharges to
NSR continued in 2017 to further understand the impacts of residuals discharge
on the river environment.
There was one AEP approval contravention at the WTPs in 2017, as detailed in
Section 1.4 Summary of Violations and Notifications. WTPs continue to improve
the integrated safety and environmental management system in accordance with
the ISO14001:2004 and OHSAS 18001:2007 standards. The WTPs and
reservoirs were re-registered to OHSAS 18001:2007 and registered to the new
ISO 14001:2015 standard in November 2017.

EWSI continued to upgrade the water treatment plants and the reservoir assets.
Total expenditures in 2017 were approximately $29.2M. Some of the major
projects are as follows:
• E.L. Smith Solar – preliminary feasibility studies and public consultation
occurred in 2017 with the intent of having a 12MW solar farm installed
adjacent to the E.L. Smith WTP by the end of 2019;
• Rossdale & E.L. Smith - Filter underdrains and the air scour system were
upgraded at Rossdale and filter media topped up at E.L. Smith on a number
of filters. These projects will continue in 2018;
• Roofing upgrades were carried out on various buildings at E.L. Smith and
Rossdale, as well as reservoir concrete restoration work at Papaschase,
Kaskitayo and E.L. Smith cell #1 reservoirs;
• A new small booster pumping station in the Laurel neighborhood of SE
Edmonton was started in late 2017, to be completed in early 2018.
In 2017, Water Distribution and Transmission repaired 242 water main breaks on
the distribution system in Edmonton, with the majority of main breaks occurring
on cast iron pipes. While this number is the lowest number of main breaks
experienced since 1961, the trend of a higher proportion of breaks occurring on
larger diameter mains continued. The general trend of decrease in water main
break activity continued and this improvement in overall reliability of the water
distribution system can be attributed to the water main replacement programs as
well as the use of more reliable pipe materials in both replacement and new
water main construction.
In 2017, the Uni-Directional Flushing program completed flushing and valve
exercising in about 36% of Edmonton (2,505 runs).This program is now a six-
year cycle with area prioritization emphasis placed on water quality parameters,
percentage of Cast Iron Mains, and the relative success of the previous flush.
The transmission valve inspection program is ongoing.

EWSI continues to provide water and wastewater services and expertise to
numerous communities in Alberta, British Columbia, Regina, as well as industrial
sites in Fort McMurray and British Columbia’s Elk Valley.
As we move into 2018, we will continue to focus our efforts on the production of
and distribution of high quality water, customer satisfaction, protection of the
environment, workplace safety and cost effectiveness. We will continue to ensure
our customers receive best value for the services we provide them. More detail
on our progress towards meeting our EnviroVista Stewardship community will be
included in our annual EnviroVista report, which will uploaded to epcor.com by
June 30th, 2018.
(End of Section)

1.2 Process Schematic - Rossdale (Plants 1 & 2)
Clarifers
Stilling Basin
Clarifers
Low Lift Pumps
Stilling Basin
UV Inactivation
On Site Reservoirs
High Lift Pumps
Field Reservoirs & Customers
9 Filters
North Saskatchewan River
Clarifier Drains to River
Bypass* (when required)
Backwash & Filter to Waste to River*
Filter Polymer
Sodium Hypochlorite
Alum
Primary Polymer
Carbon (Seasonally)
Ammonia Sodium Hypochlorite (trim) Caustic Soda Fluoride
Sodium Hypochlorite
* All chlorinated waste streams are dechlorinated prior to discharge to the river
Clarifier Drains to River
Field Reservoirs & Customers
Clarifer 3
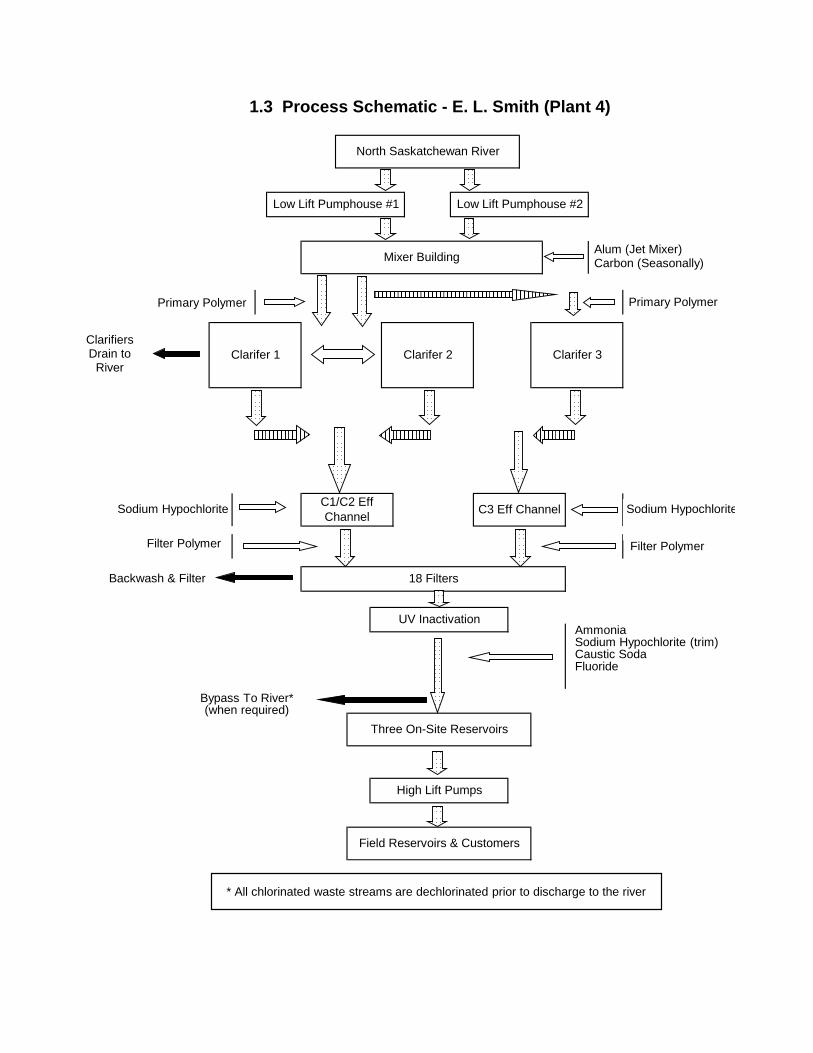
1.3 Process Schematic - E. L. Smith (Plant 4)
Clarifer 2
Low Lift Pumphouse #1
Clarifer 1
Low Lift Pumphouse #2
Mixer Building
UV Inactivation
Three On-Site Reservoirs
High Lift Pumps
North Saskatchewan River
C3 Eff Channel
18 Filters
C1/C2 Eff Channel
Ammonia Sodium Hypochlorite (trim) Caustic Soda Fluoride
Sodium Hypochlorite
Alum (Jet Mixer) Carbon (Seasonally)
Backwash & Filter
Clarifiers Drain to
River
Bypass To River* (when required)
Filter Polymer
Sodium Hypochlorite
Filter Polymer
Primary Polymer Primary Polymer
* All chlorinated waste streams are dechlorinated prior to discharge to the river

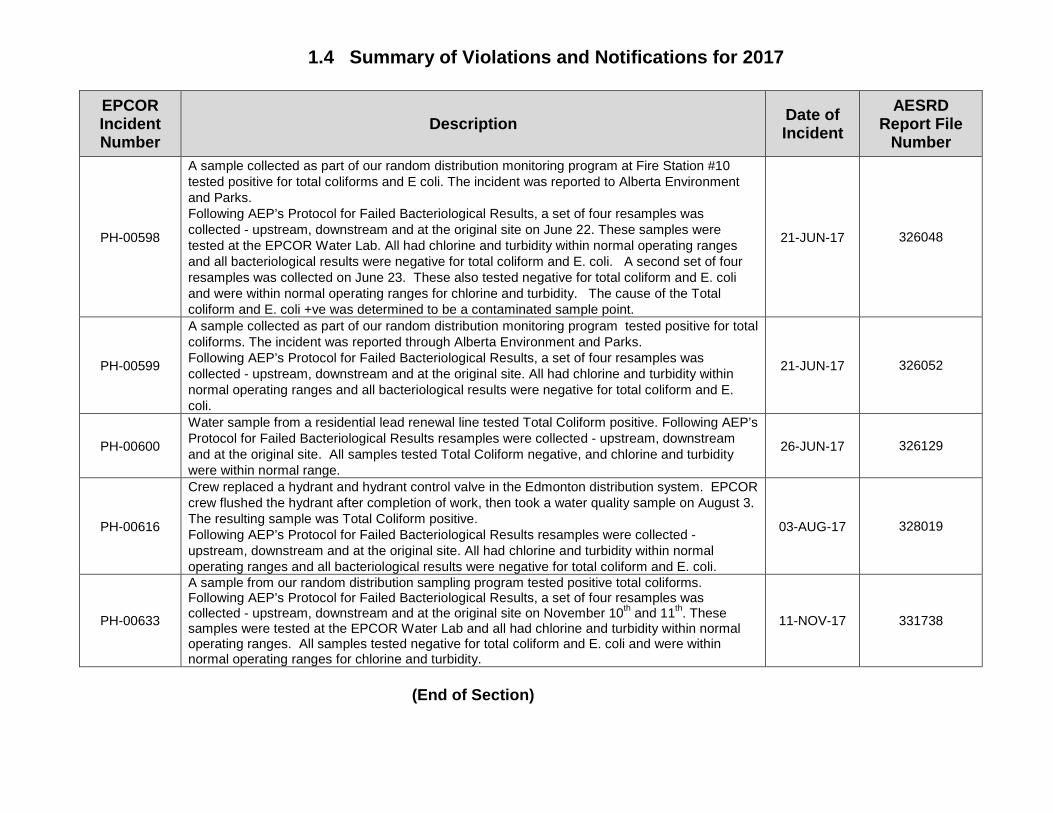
1.4 Summary of Violations and Notifications for 2017
EPCOR Incident Number
Description Date of Incident
AESRD Report File
Number
ENV-01350
EPCOR crew was replacing defective valve 9101 in the vicinity of 93rd street and 65th avenue in Edmonton. This was a planned maintenance event; however, a complete shutdown of the water line was not achieved. When the valve was cut out and pulled from the excavation, potable chlorinated water was released. The water filled the excavation and flowed down the street to a catch basin. Dechlorination pucks were immediately put into the excavation to dechlorinate the water as it was released. As the weather was very cold at the time and some catch basins were frozen the water proceeded down into the nearby Mill Creek ravine. Water continued to flow between 09:30 am until 2:00 pm when the main was shutdown.
12-JAN-17 319911
ENV-01365
On January 31st, during quarterly sampling and testing, waste stream 6 was found to have a chlorine residual between 0.20 mg/L-0.30 mg/L at the Rossdale Water Treatment plant. A contractor was working in clarifier C2-2 and its effluent flume to perform structural repairs. Operations had re-directed the drain of a water quality analyzer board (which sits next to C2-2) to C2-2 main drain during the repair. However, dechlorination pucks were not checked and replenished during this period of time, resulting in release of chlorinated waste via Waste Stream (WS) #6 to the North Saskatchewan River (NSR). It appears that approximately 10 minute long discharges were occurring 6 times a day between January 17 and 31. The total volume of the potentially chlorinated release over the 14 day period from January 17 to January 31 is estimated to be approximately 140 m3.
31-JAN-17 320557
PH-00565
Lab personnel was contacted by Alberta Environment and Parks and Alberta Health for a positive result for total coliforms at the Prov Lab for a sample submitted by our sampler as part of the random distribution monitoring program. The sample was collected at the Fire Station #14 located at 7314 - 144 Ave. EPCOR Dispatch was contacted to resample. Five resamples were collected as per the AEP Protocol for Failed Bacteriological Results. Chlorine and turbidity were all within normal operating ranges. Total Coliform and E. coli were negative. It was suspected that the normal disinfection procedure that was followed was not sufficient to remove levels of contamination that the utility tap might have had.
10-FEB-17 320893
PH-00572
As part of our random distribution system monitoring, a sample collected at a City of Edmonton Fire Station was submitted to Prov. Lab. for analysis and came back positive for total coliforms. EPCOR sent our full time sampling Technician to resample. Four resamples were collected as per the AEP Protocol for Failed Bacteriological Results. Chlorine and turbidity were all within normal operating ranges. Total Coliform and E. coli were negative. It was suspected that the normal disinfection procedure that was followed was not sufficient to remove levels of contamination that the utility tap might have had.
24-MAR-17 322336

1.4 Summary of Violations and Notifications for 2017
EPCOR Incident Number
Description Date of Incident
AESRD Report File
Number
PH-00587
Water sample taken from a hydrant replacement H8678 came back Total Coliform positive. Following AEP’s Protocol for Failed Bacteriological Results resamples were collected - upstream, downstream and at the original site. The result was Total Coliform positive even though Chlorine and turbidity were within normal range. One 1 of 4 results from the resamples failed with a TC positive result on the left cap of the replaced hydrant. Resample results were reported from the lab Manager to AEP hotline and determined although this was a second positive it is not a violation, it is considered a contaminated sample point.
02-JUN-17 325217
PH-00596
On Saturday June 17 there was a temporary shutdown to install a new hydrant on an existing watermain. After the construction work was completed the main was back in service and we began to flush out of the new hydrant. After approximately 45 minutes of flushing an in-service sample was taken. This sample tested for Total Coliform. Chlorine and turbidity were within normal ranges. This hydrant was then taken out of service. Following AEP’s Protocol for Failed Bacteriological Results resamples were collected - upstream, downstream and at the original site. All had chlorine and turbidity within normal operating ranges and all bacteriological results were negative for total coliform and E. coli.
18-JUN-17 325861
ENV-01501
Water Trouble responded to water discharging out of a catch basin adjacent to the Mill Creek Ravine on June 19th. Initially, this water was thought to be the result of a mainbreak and a release of chlorinated water was reported to Alberta Environment and Parks. De-chlorination equipment (pucks) and erosion control was deployed at the scene. Upon further investigation it was determined that the water surfacing from the catch basin was de-chlorinated (zero chlorine) and therefore was very unlikely to be attributed to a mainbreak. The EPCOR Water Infrastructure Project completed a de-chlorination and flush of the isolated previously super chlorinated section of new 300mm PVC pipe at 91 Street and 84 Avenue, two blocks away from the discharging catch basin on June 19, 2017. Previous flushing activities (two prior flushes) had taken place at this site, with no issues. As previous flushes in the area did not result in any surcharging water, it was suspected that there was an issue with the combined sewer on 84 Avenue. City of Edmonton Drainage Operations was contacted on June 20, 2017 and completed an investigation (camera and HydroVac) of the sewer line. The City found a sewer plugged with gravel in the immediate area of 9323 84 Avenue that is the root cause of the discharge. The plugged sewer caused the backup of water onto the street and overflow down into the Mill Creek Ravine.
19-JUN-17 325895
1.4 Summary of Violations and Notifications for 2017
EPCOR Incident Number
Description Date of Incident
AESRD Report File
Number
PH-00598
A sample collected as part of our random distribution monitoring program at Fire Station #10 tested positive for total coliforms and E coli. The incident was reported to Alberta Environment and Parks. Following AEP’s Protocol for Failed Bacteriological Results, a set of four resamples was collected - upstream, downstream and at the original site on June 22. These samples were tested at the EPCOR Water Lab. All had chlorine and turbidity within normal operating ranges and all bacteriological results were negative for total coliform and E. coli. A second set of four resamples was collected on June 23. These also tested negative for total coliform and E. coli and were within normal operating ranges for chlorine and turbidity. The cause of the Total coliform and E. coli +ve was determined to be a contaminated sample point.
21-JUN-17 326048
PH-00599
A sample collected as part of our random distribution monitoring program tested positive for total coliforms. The incident was reported through Alberta Environment and Parks. Following AEP’s Protocol for Failed Bacteriological Results, a set of four resamples was collected - upstream, downstream and at the original site. All had chlorine and turbidity within normal operating ranges and all bacteriological results were negative for total coliform and E. coli.
21-JUN-17 326052
PH-00600
Water sample from a residential lead renewal line tested Total Coliform positive. Following AEP’s Protocol for Failed Bacteriological Results resamples were collected - upstream, downstream and at the original site. All samples tested Total Coliform negative, and chlorine and turbidity were within normal range.
26-JUN-17 326129
PH-00616
Crew replaced a hydrant and hydrant control valve in the Edmonton distribution system. EPCOR crew flushed the hydrant after completion of work, then took a water quality sample on August 3. The resulting sample was Total Coliform positive. Following AEP’s Protocol for Failed Bacteriological Results resamples were collected - upstream, downstream and at the original site. All had chlorine and turbidity within normal operating ranges and all bacteriological results were negative for total coliform and E. coli.
03-AUG-17 328019
PH-00633
A sample from our random distribution sampling program tested positive total coliforms. Following AEP’s Protocol for Failed Bacteriological Results, a set of four resamples was collected - upstream, downstream and at the original site on November 10th and 11th. These samples were tested at the EPCOR Water Lab and all had chlorine and turbidity within normal operating ranges. All samples tested negative for total coliform and E. coli and were within normal operating ranges for chlorine and turbidity.
11-NOV-17 331738
(End of Section)

1.5 Alberta Environment Operator Certifications (Effective up to year end 2017) Operator Contact Number: EPCOR Water Services Dispatch (24-hr) (780) 412-6800
ROSSDALE WATER TREATMENT PLANT (LEVEL IV) Employee Name Title Alberta Environment Certification Level
Director, Edmonton Water Treatment Plants Senior Manager, Operations Operations Engineer WT III, WWT III Manager, Operations WT IV Manager, Transmission Operations WT III Day Foreman WT III Operations Foreman WT III Operations Foreman WT IV HEI Foreman WT IV Operations Foreman WT IV Operations Foreman WT IV Operations Foreman WT IV Transmission Foreman WT III Training Operator Foreman WT III Lead Hand, Operator WT II Operator I WT III Operator I WT II Lead Hand, Operator WT II Operator I WT II Lead Hand, Operator WT III Operator I WT II Lead Hand, Operator WT IV, WD III, WWT II,
WWC III Operator I WT II Lead Hand, Operator WT II Operator I WT II Operator I WT II Operator I WT II, WD II, WWT II,
WWC II Operator I WT II, WWT IIOperator I WT I Operator I WT I Operator I
E.L. SMITH WATER TREATMENT PLANT (LEVEL IV) Employee Name Title Alberta Environment Certification Level
Director, Edmonton Water Treatment Plants Senior Manager, Operations Operations Engineer Manager, Operations WT IV Day Foreman WT IV HEI Foreman WT IV Training Operator Foreman WT IV Operations Foreman WT III

1.5 Alberta Environment Operator Certifications (Effective up to year end 2017) Operator Contact Number: EPCOR Water Services Dispatch (24-hr) (780) 412-6800
E.L. SMITH WATER TREATMENT PLANT (LEVEL IV) (CONTINUED) Employee Name Title Alberta Environment Certification Level
Operations Foreman WT IV Operations Foreman WT IV Operations Foreman WT IV Operations Foreman WT IV Lead Hand, Operator WT II Lead Hand, Operator WT II Lead Hand, Operator WT III Lead Hand, Operator WT III Operator I WT III Operator I WTII, WDII, WWT I,
WWC II Operator I WT II, WD II, WWT I,
WWC I, Operator I WTII, WDI, WWCI,
WWTI Lead Hand, Operator WT II Operator I WT II Operator I WT I
Operator I WT III, WWT II
DISTRIBUTION SYSTEM (LEVEL IV FACILITY) WATER DISTRIBUTION (WD) – Network Maintenance
Employee Name Title Alberta Environment
Certification Level Senior Manager, Distribution Maint. Foreman III WD III
Foreman III WD III Foreman III WD III
Foreman I WD IV Foreman I WD II Foreman I WD II Foreman I WD II Foreman I WD II Foreman I WD II Foreman I WD II Foreman I WD II Foreman I WD II Foreman I WD II Foreman I WD II Foreman I WD II Foreman I WD II Foreman I WD II Equipment Operator III WD II Equipment Operator III WD II

1.5 Alberta Environment Operator Certifications (Effective up to year end 2017) Operator Contact Number: EPCOR Water Services Dispatch (24-hr) (780) 412-6800
DISTRIBUTION SYSTEM (LEVEL IV FACILITY) (CONTINUED) WATER DISTRIBUTION (WD) – Network Maintenance
Employee Name Title Alberta Environment
Certification Level Equipment Operator III WD I Equipment Operator III WD II
Equipment Operator III WD I Equipment Operator III WD I Equipment Operator III WD II Equipment Operator III WD II Equipment Operator III WD II Equipment Operator III WD I Equipment Operator III WD I Equipment Operator III WD I Equipment Operator III WD II Equipment Operator III WD I Labourer II WD I Labourer II WD I Labourer II WD I Labourer II WD II Labourer II WD I Labourer II WD I Labourer II WD I Labourer II WD I Labourer II WD I Labourer II WD I
Labourer II WD II Labourer II WD I
Labourer II WD I Labourer II WD I Labourer II WD II Labourer II WD II
Labourer II WD I
Manager, Dist Maint Foreman III WD IV Truck Driver III WD I Truck Driver III WD I Truck Driver III WD I
WD I WD I WD I
Truck Driver III Truck Driver III Labourer III Labourer II WD I
Welder WD II Foreman I WD I Labourer III WD I

1.5 Alberta Environment Operator Certifications (Effective up to year end 2017) Operator Contact Number: EPCOR Water Services Dispatch (24-hr) (780) 412-6800
DISTRIBUTION SYSTEM (LEVEL IV FACILITY) (CONTINUED) WATER DISTRIBUTION (WD) – Network Maintenance
Employee Name Title Alberta Environment
Certification Level Labourer III WD II Labourer III WD II Maintenance Repairman I WD I Maintenance Repairman I WD I Maintenance Repairman I WD I Labourer II WD I
Water Sys Tech Support Specialist WD II Water Sys Tech Support Specialist WD II Water Sys Tech Support Specialist WD IV
DISTRIBUTION SYSTEM (LEVEL IV FACILITY) WATER DISTRIBUTION (WD) – Network Operations
Employee Name Title Alberta Environment Certification Level
Senior Manager, Distribution Operations Manager, Dist Procedures & Training Network Operator WD IV, WWC II, WT I Network Operator WD IV, WWC I Network Operator WD IV, WWC II
Network Operator WD IV, WWC II, WT I
Foreman III WD III Foreman I WD II Foreman I WD II Foreman I WD II Foreman I WD II Labourer III WD II Labourer III WD II Labourer III WD II Labourer III WD II Labourer III WD I Labourer II WD II Labourer II WD II Labourer II WD I
Labourer II WD II Labourer II WD I
Labourer II WD I Labourer II WD I Labourer II WD II
Labourer II WD I

1.5 Alberta Environment Operator Certifications (Effective up to year end 2017) Operator Contact Number: EPCOR Water Services Dispatch (24-hr) (780) 412-6800
DISTRIBUTION SYSTEM (LEVEL IV FACILITY) (CONTINUED) WATER DISTRIBUTION (WD) – Network Operations
Employee Name Title Alberta Environment Certification Level
Manager, Preventative Maintenance Foreman III WD II Foreman I WD II Foreman I WD II Water Systems Serviceman WD II Water Systems Serviceman WD II Water Systems Serviceman WD II
Water Systems Serviceman WD II Water Systems Serviceman WD II Water Systems Serviceman WD III Water Systems Serviceman WD II Water Systems Serviceman WD II Water Systems Serviceman WD II Water Systems Serviceman WD II Water Systems Serviceman WD II Labourer II WD I Labourer II WD I Labourer II WD III Labourer II WD I Labourer II WD I
Labourer II WD I
Manager, Metering & Operations Foreman III WD IV Meter Mech. II WD II Meter Installer II WD II Meter Installer II WD II Meter Installer I WD II Meter Installer I WD I Meter Installer I WD II Meter Installer I WD II Meter Installer I WD I Meter Installer I WD II Meter Installer I WD II Meter Installer I WD II Meter Installer I WD II Meter Installer I WD I Meter Installer I WD I Meter Installer I WD I
Manager, Customer Services Public Service Representative I WD I

1.5 Alberta Environment Operator Certifications (Effective up to year end 2017) Operator Contact Number: EPCOR Water Services Dispatch (24-hr) (780) 412-6800
DISTRIBUTION SYSTEM (LEVEL IV FACILITY) (CONTINUED) WATER DISTRIBUTION (WD) – Network Operations
Employee Name Title Alberta Environment Certification Level Public Service Representative I WD II Public Service Representative I WD I Public Service Representative I WD I
Team Lead, Dispatch & Inspections WD IV, WWC II, WT I, WWT I
Inspector – Water Metering WD II
DISTRIBUTION SYSTEM (LEVEL IV FACILITY) TECHNICAL SERVICES
Employee Name Title Alberta Environment Certification Level Senior Manager Dist Tech Services Manager, Claims & Escalations WD II Manager, Field Operations WD II
(End of Section)
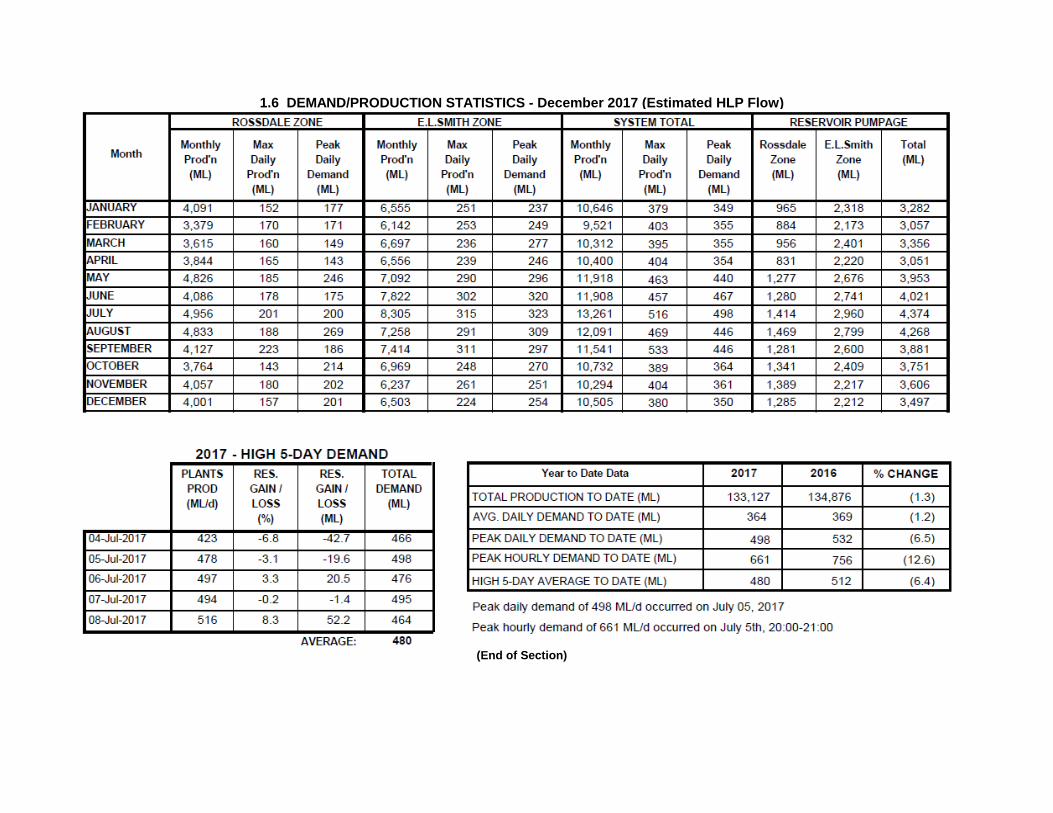
ROSSDALE ZONE E.L.SMITH ZONE SYSTEM TOTAL RESERVOIR PUMPAGEMONTHLY MAXIMUM PEAK MONTHLY MAXIMUM PEAK MONTHLY MAXIMUM PEAK ROSSDALE E. L. SMITH TOTAL
MONTH PROD'N DAILY DAILY PROD'N DAILY DAILY PROD'N DAILY DAILY ZONE ZONE (ML) (ML) FLOW DEMAND (ML) FLOW DEMAND (ML) FLOW DEMAND (ML) (ML)
(ML) (ML) (ML) (ML) (ML) (ML)JANUARY 4,091 6,555 10,646 1,035 2,457 3,492FEBRUARY 3,379 6,142 9,521 996 2,278 3,274MARCH 3,615 6,697 10,312 1,131 2,457 3,588APRIL 3,844 6,556 10,400 1,261 2,674 3,935MAY 4,827 7,092 11,918 1,526 3,121 4,647JUNE 4,086 7,822 11,908 1,317 2,820 4,137JULY 4,956 8,304 13,261 1,447 2,772 4,219AUGUST 4,833 7,258 12,091 1,298 2,855 4,152SEPTEMBER 4,127 7,414 11,541 1,076 2,618 3,694OCTOBER 3,764 6,969 10,732 1,029 2,423 3,452NOVEMBER 4,057 6,237 10,294 914 2,400 3,313DECEMBER 4,002 6,503 10,505 937 2,519 3,456
49581 83549 133129 453592017 - HIGH 5 DAY DEMAND
PLANTS RES. RES. TOTAL 2017 2016 % CHANGEPROD'N GAIN/LOSS GAIN/LOSS DEMAND TOTAL PRODUCTION TO DATE (ML) 133,127 134,786 (1.3)
ML/d % ML ML AVG. DAILY DEMAND TO DATE (ML) 364 369 (1.2)04-Jul-17 423 -6.8 -42.7 466 PEAK DAILY DEMAND TO DATE (ML) 498 532 (6.5)05-Jul-17 478 -3.1 -19.6 498 PEAK HOURLY DEMAND TO DATE (ML) 661 756 (12.6)06-Jul-17 497 3.3 20.5 476 HIGH 5-DAY AVERAGE TO DATE (ML) 480 547 (6.4)07-Jul-17 494 -0.2 -1.4 49508-Jul-17 516 8.3 52.2 464 Peak daily demand of 498 ML/d occurred on July 5, 2017
AVERAGE: 480 Peak hourly demand of 661 ML/d occurred on July 5, 20:00 - 21:00.
Year to Date Data
1.6 DEMAND/PRODUCTION STATISTICS - December 2017 (Estimated HLP Flow)
(End of Section)

Energy ConsumptionPower Consumption (kWh):
2017 2016 Change - %Rossdale W.T.P. 31,830,769 33,054,292 -3.70%E. L. Smith W.T.P. 44,971,093 44,052,026 2.09%Field Pump Stations 12,916,456 12,649,502 2.11%TOTAL 89,718,318 89,755,820 -0.04%
Gas Consumption (GJ):
2017 2016 Change - %Plants 91,700 94,927 -3.40%Pumping Stations 3,679 3,602 2.15%TOTAL 95,379 98,529 -3.20%
Water Production/Pumpage(ML):
2017 2016 Change - %Rossdale W.T.P. 49,580 52,545 -5.64%E. L. Smith W.T.P. 83,547 82,325 1.48%Pump Stations 44,162 45,359 -2.64%TOTAL 133,127 134,870 -1.29%Note: The reservoirs and booster stations are not included into these totals.
Energy Usage
2017 2016Energy Consumption for Treatment and Pumpage (kWh)
89,718,318 89,755,820
Energy in kW.h per ML pumped
674 665
Gas Consumption - All Facilities (GJ)
95,379 98,529
Gas Consumption - All Field Pump Stations (GJ)
3,679 3,602
(End of Section)
1.7 Energy Consumption and Usage

Available Storage (ML)
Fire Storage (ML)
Operating Storage (ML)
Dead/ Emergency
(ML)
Gross Storage (ML)
Rosslyn 97.54 12.56 110.1 12.93 123.03
Clareview 50.51 2.95 53.46 11.14 64.60
Papaschase 66.80 9.71 76.51 5.63 82.14
Londonderry 39.10 2.58 41.68 3.56 45.24
North Jasper Place 29.74 4.66 34.4 11.66 46.06
Ormsby 37.41 2.99 40.4 4.87 45.27
Thorncliff 37.10 2.93 40.03 3.4 43.43
Kaskitayo 21.78 3.96 25.74 3.2 28.94
Mill Woods 46.98 5.92 52.9 3.33 56.23
Castle Downs 22.70 2.41 25.11 8.93 34.04
Sub Total 449.66 50.67 500.33 68.65 568.98
Rossdale 80.42 0.00 80.42 16.98 97.40
E.L. Smith 95.20 0.00 95.20 42.30 137.50
Sub Total 175.62 0.00 175.62 59.28 234.9
GRAND TOTAL 625.28 50.67 675.95 127.93 803.88
2.1 Storage Capacities of Reservoirs
(End of Section)
Field Reservoir Sites
Water Treatment Plant Reservoirs

FacilitiesTREATMENT PLANTS Min. High PRV
Rossdale 840 (708) 860 (710) 880 (712) 900 (714) 950 (719) 960-980
E.L.Smith 950 (718) 960 (719) 980 (721) 1000 (723) 1080 (731) 1175
RESERVOIRS Inlet Disch. Fill Alarm High PRVClareview 650 649 430 (693) 530 (703) 550 (706) 580 (709) 620 (712) 610
Rosslyn 1 670 310 (702) 370 (708) 390 (710) 420 (713) 450 (716)
Rosslyn 2 671 300 (702) 330 (705) 380 (710) 410 (713) 440 (716)
North Jasper Place 675 675 290 (705) 350 (711) 370 (713) 390 (715) 470 (723)
Thorncliff 672 672 350 (708) 380 (711) 420 (715) 440 (717) 495 (723)
Ormsby 1 679 679 325 (712) 355 (715) 365 (716) 380 (718) 460 (726)
Castledowns 1* 679 260 (705) 300 (710) 380 (718) 400 (720) 570
Papaschase 1 693 variable 120 (705) 160 (710) 200 (714) 300 (724)
Londonderry 678 678 210 (700) 430 (722) 460 (725) 490 (728) 540 (733) 570
Castledowns 679 678 260 (705) 430 (722) 460 (725) 490 (728) 540 (733) 570
Rosslyn 3 669 500 (720) 530 (723) 560 (726) 630 (733) 660
Ormsby, Lewis Estates 679 625 (743) 645 (746) 660 (747) 680 (750) 710
Kaskitayo 2 674 674 345 (709) 550 (730) 590 (734) 640 (739) 690 (744) 680
Papaschase 2 689 690 70 (696) 380 (729) 410 (732) 450 (736) 500 (741) 520
Mill Woods 679 679 270 (706) 520 (732) 550 (735) 590 (739) 620 (742) 630
BOOSTER STATIONS
Low Suct. Trip Alarm Min Normal High High High
Burnewood 695 60 (701) 550 (751) 560 (752) 580 (754) 610 (757) 620-640
Ellerslie 695 695 60 (701) 540 (750) 550 (751) 560 (752) 580 (754) 600 (756)
Terwillegar ~683 60 (689) 480 (732) 540 (738) 590 (743) 650 (749) 640
Parkland 682 620 (745) 650 (749) 700 (754) 720 (756)
Walker 724 160 410 (759) 440 (762) 480 (765) 500 (767) 650
Big Lake 678 270 365 (709) 395 (713) 425 (714) 475 (719) 625*Emergency Only
(End of Section)
2.2 Reservoir Pressure Operating Ranges
Elev., m
Discharge
Discharge Normal Range
Normal
Operating Pressure Range, kPa (mTH)
622
621

Elevationm Min. Max. Min. Max.
# Fire Hall1 10351 96 St. 661.759 703 722 400 5402 10217 107 St. 667.018 708 717 400 4903 11226 76 Ave. 667.792 708 717 395 4855 9020 111 Ave. 663.986 708 717 430 5206 8105 96 St. 663.863 708 717 430 5207 5025 118 Ave. 655.873 705 713 480 5608 12503 128 St. 674.153 708 713 330 4109 5604 50 St. 693.967 730 740 350 455
11 6110 98 Ave. 664.07* 708 717 430 52012 9020 156 St. 673.546 711 720 360 45013 4035 119 St. 669.812 716 723 450 52015 5120 97 St. 675.232 708 715 320 39016 2940 66 St. 693.516 730 740 350 45517 15505 Castledowns Rd. 680.669 715 740 340 58520 2303 105 St. 679.57 713 720 325 39521 10909 120 Ave. 668.127 708 713 390 440 Decom. 201722 10124 123 St. 668.561 708 716 385 46524 131 Haddow Cl. 685* 717 730 305 430 New 200926 2803 34 St. 712.5 742 766 295 525 New 201127 1203 Ellwood Rd. SW 686 724 749 375 615 New 201728 12110 26 Ave. SW 695 719 756 230 625 New 2015
Other City PointsWestview Village 696.7 729 742 320 450Whitemud Co-op 692 723 733 300 400Sobeys 167 Ave 91 St 682* 720 735 370 520Home Depot 17 St 707.6* 748 757 400 480Home Depot Windermere 684* 730 742 400 660 New 2011Clover Bar 731.87 803 762 300 700 New 2013TAMS 750.14 778 807 270 560 New 2013NOTE: 50 kPa ALLOWANCE FOR ALARM LIMITS AT MINIMUM AND MAXIMUM OBJ
(End of Section) * appoximate elevation
2.3 Fire Hall & Other City Pressure Limits
kPa m T. Head LOCATION
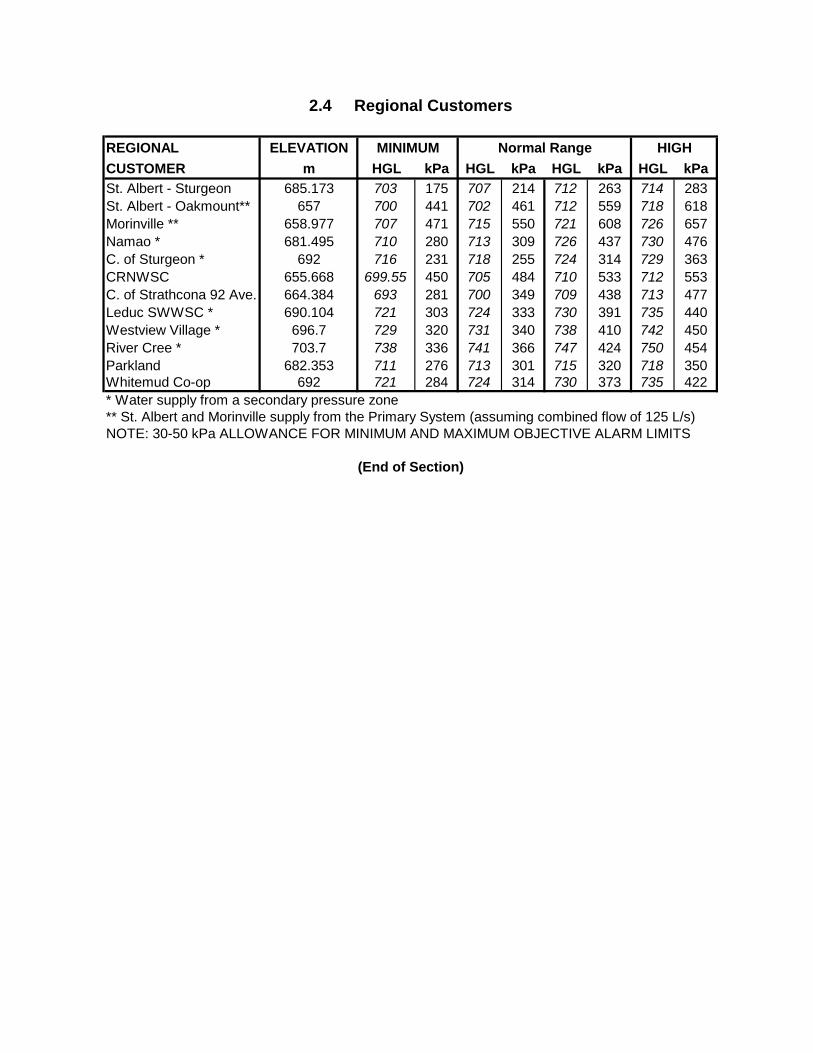
REGIONAL ELEVATIONCUSTOMER m HGL kPa HGL kPa HGL kPa HGL kPaSt. Albert - Sturgeon 685.173 703 175 707 214 712 263 714 283St. Albert - Oakmount** 657 700 441 702 461 712 559 718 618Morinville ** 658.977 707 471 715 550 721 608 726 657Namao * 681.495 710 280 713 309 726 437 730 476C. of Sturgeon * 692 716 231 718 255 724 314 729 363CRNWSC 655.668 699.55 450 705 484 710 533 712 553C. of Strathcona 92 Ave. 664.384 693 281 700 349 709 438 713 477Leduc SWWSC * 690.104 721 303 724 333 730 391 735 440Westview Village * 696.7 729 320 731 340 738 410 742 450River Cree * 703.7 738 336 741 366 747 424 750 454Parkland 682.353 711 276 713 301 715 320 718 350Whitemud Co-op 692 721 284 724 314 730 373 735 422* Water supply from a secondary pressure zone** St. Albert and Morinville supply from the Primary System (assuming combined flow of 125 L/s)NOTE: 30-50 kPa ALLOWANCE FOR MINIMUM AND MAXIMUM OBJECTIVE ALARM LIMITS
2.4 Regional Customers
(End of Section)
MINIMUM Normal Range HIGH

Maximum DesignFacilities Year Fixed Variable Discharge Flow
Built Total Speed Speed by Pump(ML/d)
Rossdale Plant 1947 6 4 2 4 @ 100, 2 @ 105E.L. Smith Plant 1976 4 2 2 2 @ 95, 2 @ 205
Clareview 1979 3 1 2 1 @ 14, 2 @ 30Rosslyn 1 1955 3 3 0 3 @ 20Rosslyn 2 1969 1 1 0 1 @ 22North Jasper Place 1974 4 3 1 2 @ 13, 2 @ 26Thorncliff 1970 3 3 0 3 @ 12Ormsby Place 1969 3 2 1* 2 @ 16, 1@ 32Papaschase 1 1976/82 2 2 0 2 @ 20
Londonderry 1974/79 3 1 2 2 @ 15, 1 @ 21 Castledowns 1979 3 1 2 3 @ 17Rosslyn 3 1963 3 3** 0 2 @ 26; 1@18
Parkland Booster St. 1973 2 2 0 1 @ 2, 1 @ 4Ormsby, Lewis Estates 1969 3 0 3 1 @ 20, 1@ 15, 1 @ 5
Papaschase 2 1968/71 3 2 1 2 @ 13, 1 @ 23Mill Woods 1977 5 3 2 3 @ 16, 1 @ 24, 1 @ 32Kaskitayo 1980 5 3 2 3 @ 10, 2 @ 15Terwillegar Booster St. 1998 3 2 1 3 @ 17
Burnewood Booster St. 1985 4 2 2 3 @ 19, 1 @ 14Ellerslie Booster St. 2007 2 0 2 2 @ 6
Walker Booster St. 2015 5 0 5 2 @ 2, 2 @ 7, 1@ 17Big Lake Booster St. 2016 5 0 5 2 @ 8, 2 @ 25, 1 @ 34TOTAL 76 37 35
2.5 Pumping Facilities
** Rosslyn Pump 5 was converted to a booster pump in 2013 and contributes to the North Secondary zone so it now counts as a Rosslyn 3 pump.
South Tertiary Zone
Water Treatment Plants
Primary Zone
North Secondary Zone
South Secondary Zone
West Secondary Zone
*Ormsby Pump #3 can be used to support Primary Pressure Zone or West Secondary Pressure Zone depending on the discharge header valve configuation. The totals include this pump once.
South Quaternary Zone
Number of Pumps

(End of Section)

Water Production 2017 2016 2015Treated and Pumped into the System 133,127 134,870 139,217
Water Treated at Rossdale Plants 49,580 52,545 54,130
Water Treated at E. L. Smith Plant 83,547 82,325 85,087
Supplied to Residential Customers 63,307 63,408 64,991
Supplied to Commercial/Industrial Customers 27,537 28,131 29,016
Supplied to Suburban Customers 34,655 34,825 35,986
Percentage Accounted for from:
Metered & Bulk Sources 95% 94% 94%
Assumed System Leakage 5% 6% 6%
Average Day Pumpage (ML) 365 370 381
Peak Day Demand (ML) 498 532 574
Population Served 2017 2016 2015Approximate Population Served (City) 941,871 899,447 895,000
Approximate Population Served (Region)* 335,000 313,000 294,000
Approximate Population Served (Total) 1,276,871 1,212,447 1,189,000#DIV/0! 5.3% 2.0% #DIV/0!
Per Capita Consumption (L/cap) 2017 2016 2015
Average Day Demand 286 305 321
Peak Day Demand 390 439 483
2.6 Production Summary
*Note: beginning in 2015 regional customer population reporting is standardized. The method is to use the census year (2011, 2016...) as a base, then apply a growth factor to subsequent years and round to the nearest thousand. 2013, 2012, and 2011 will be corrected to follow this method. 2009 will be changed back to the original reported value.
(End of Section)

Month
Rossdale E.L. Smith
Plant 1 Plant 2Plant Total
2017
2.7 Raw Water Intake (ML)
Min Max Avg Total Min Max Avg Total
Plant TotalMin Max Avg
Plants
Combined
Total
62 83 12,411January 2,305 42 84 2,350 116 298 7,7554,656 2507674
17 110 11,037February 2,337 0.0 117 1,463 136 291 7,2373,800 2585283
12 73 11,746March 824 41 140 3,253 204 276 7,6694,077 24710527
50 81 12,009April 1,776 71 101 2,580 224 289 7,6544,355 2558659
57 94 13,325May 2,108 90 111 3,075 54 316 8,1425,184 2639968
24 80 13,257June 320 97 164 4,166 260 341 8,7714,486 29213911
24 89 14,984July 1,836 69 195 3,645 260 357 9,5045,481 30711859
19 95 13,696August 2,395 23 110 2,953 56 331 8,3495,348 2699577
21 109 12,942September 1,138 74 151 3,389 50 347 8,4164,527 28111338
999,999 1.3 12,411October 4.3 56 150 4,194 59 294 8,2134,198 2651350.1
11 63 11,970November 1,301 41 150 3,255 56 291 7,4154,556 24710843
23 60 11,857December 1,599 39 115 2,835 62 256 7,4224,435 2399152
Annual Total 17,943 37,158 55,101 96,546 151,647
357501950.011011 26510249Annual
Min/Max/Avg

Month
Rossdale (Plant 1 & Plant 2) E.L. Smith
Avg
Min Max
2017
2.8 Treated Water Production (ML)
Avg AvgMaxMin
Estimated (Highlift Flow)
AvgMaxMin
Plants Combined
Flow Meters Flow Meters
Total
Total Total Total
6,166.95 1,811.69 31.0 6,540.50 1,811.69 31.00 1700.7 5.4 4096.4 31.0 1,796.97 1700.2 1,796.97January 0.0 213 0.0 2824,091 6,182 2960.0 6,555 343 10,647132 199 211
5,800.09 1,658.15 28.0 6,139.42 1,658.15 28.00 1456.0 9.2 3386.9 28.0 1,655.82 1454.1 1,655.82February 0.0 214 0.0 2833,379 5,802 2980.0 6,142 340 9,521121 207 219
6,347.91 1,164.02 31.0 6,729.56 1,164.02 31.00 1659.0 12.9 3629.8 31.0 1,196.61 1660.7 1,196.61March 0.0 214 0.0 2833,615 6,315 2980.0 6,697 333 10,312117 204 216
6,181.65 918.11 30.0 6,551.17 918.11 30.00 1691.8 17.7 3855.0 30.0 913.58 1685.1 913.58April 4.8 213 87 2833,844 6,186 29890 6,556 347 10,400128 206 219
6,695.93 1,474.65 31.0 7,054.82 1,474.65 31.00 1690.1 18.1 4850.6 31.0 1,437.61 1695.8 1,437.61May 8.6 215 0.0 2924,827 6,733 3050.0 7,092 384 11,919156 217 229
7,447.94 1,906.93 30.0 7,824.87 1,906.93 30.00 1642.7 12.9 4087.7 30.0 1,909.95 1631.8 1,909.95June 0.0 214 90 3094,086 7,445 32493 7,822 397 11,907136 248 261
7,918.51 1,997.62 31.0 8,308.95 1,997.62 31.00 1757.8 17.0 4976.0 31.0 2,002.25 1760.8 2,002.25July 4.9 215 0.0 3494,956 7,914 3620.0 8,304 428 13,260160 255 268
6,882.20 1,983.55 31.0 7,244.37 1,983.55 31.00 1719.8 18.2 4878.2 31.0 1,969.66 1746.7 1,969.66August 0.0 216 0.0 3534,833 6,896 3710.0 7,258 390 12,091156 222 234
7,066.04 1,913.06 30.0 7,435.76 1,913.06 30.00 1608.9 11.8 4117.6 30.0 1,935.19 1588.2 1,935.19September 0.0 215 0.0 3374,127 7,044 3560.0 7,414 385 11,540138 235 247
6,568.33 1,865.15 31.0 6,955.64 1,865.15 31.00 1610.6 6.9 3788.0 31.0 1,852.07 1627.8 1,852.07October 0.0 212 0.0 2843,764 6,581 3000.0 6,969 346 10,733121 212 225
5,911.46 1,793.62 30.0 6,249.66 1,793.62 30.00 1625.8 5.2 4031.6 30.0 1,806.71 1593.9 1,806.71November 0.0 213 0.0 2844,058 5,898 3750.0 6,237 343 10,295135 197 208
6,108.03 1,863.02 31.0 6,494.34 1,863.02 31.00 1732.3 5.4 4018.8 31.0 1,853.94 1743.6 1,853.94December 0.0 215 0.0 2814,002 6,117 2960.0 6,503 339 10,506129 197 210
Annual Total
Annual
Min/Max/Avg 3530.02160.0
49,583 83,54879,114 133,131
0.0 375217 229136 365
NOTES: ' -- ' indicates plant offline
- Estimated flows are based on UV effluent flow meters to address inaccuracy of highlift flow meters.
- As of July 1, 2009, plants combined data is the sum of Rossdale flow meters and E.L. Smith estimated flow
data.

Colour (TCU)Month
Min
3.1 Raw Water Quality - North Saskatchewan River
Max Avg
pHTurbidity (NTU) pHTurbidity (NTU)
AvgMaxMin
2017
Rossdale E.L. Smith
Fluoride
(mg/L)
Fluoride
(mg/L)
Min AvgMax Min Max Avg AvgMaxMin Min AvgMax
Colour (TCU)
Avg Avg
January 8.0 8.1 8.1 7.9 3.9 1.4 2.0 1.6 31 3.3 8.0 8.0 0.12 0.12 5.7 4.5 4.1 6.6 7.0 5.5
February 7.9 8.1 8.0 7.8 30 1.4 3.6 1.5 6.8 3.0 7.9 8.0 0.12 0.12 10.0 4.7 4.3 28.0 26.1 9.4
March 7.7 8.3 8.2 7.8 60 1.7 9.6 1.3 40 7.3 7.9 8.0 0.13 0.13 16.8 1.6 2.6 83.4 80.1 15.5
April 7.8 8.2 8.2 7.7 1,100 16 110 13 1,000 100 7.9 8.0 0.11 0.10 41.3 23.5 10.3 76.3 68.5 36.4
May 8.0 8.3 8.4 7.8 550 20 75 23 550 80 8.2 8.2 0.12 0.12 27.9 18.5 17.0 63.1 63.7 26.7
June 8.0 8.4 8.6 8.0 850 13 100 21 1,300 140 8.3 8.2 0.13 0.12 26.9 10.1 9.3 73.3 78.3 26.0
July 8.2 8.5 8.7 8.4 17 1.9 7.5 2.7 300 11 8.5 8.4 0.13 0.13 7.5 5.0 4.5 12.0 11.4 7.1
August 8.2 8.5 8.6 8.3 11 1.4 2.5 1.6 50 3.4 8.5 8.4 0.13 0.13 5.0 3.2 3.2 8.7 8.7 4.8
September 8.1 8.5 8.5 8.3 25 1.6 4.7 1.5 19 3.4 8.4 8.3 0.13 0.12 4.9 2.4 2.2 10.7 11.2 4.7
October 8.2 8.4 8.5 7.7 6.7 1.9 2.9 1.8 5.3 2.6 8.3 8.3 0.12 0.12 5.1 3.2 3.6 8.3 7.8 5.0
November 8.0 8.3 8.3 8.0 8.5 1.5 3.0 1.4 8.5 3.1 8.2 8.2 0.12 0.12 4.2 3.4 3.5 5.8 6.5 4.4
December 8.0 8.2 8.4 8.0 2.6 1.2 1.6 1.0 3.6 1.5 8.1 8.1 0.12 0.12 3.3 2.5 2.1 4.0 4.4 3.5
AnnualMin/Max/Avg 8.5 7.7 8.7 7.7 30 1,300 1.0 27 1,100 1.2 8.2 8.2 0.12 0.12 13.2 83.4 1.6 2.1 80.1 12.4
NOTES: ' -- ' indicates plant offline

Rossdale
Month
Min
3.2 Treated Water Quality Entering the Distribution System
Max Avg
Turbidity
(NTU)
Chloramine
Residual (mg/L) pHFluoride
Residual (mg/L)
AvgMaxMin AvgMaxMin AvgMaxMin Min AvgMax Min AvgMax Min Max Avg Min Max Avg
2017
E.L. Smith
Turbidity
(NTU)
Chloramine
Residual (mg/L) pHFluoride
Residual (mg/L)
Total Hardness (mg/L as CaC03)
Colour
(TCU)
Colour
(TCU)
Avg Avg Avg Avg
Total Hardness (mg/L as CaC03)
January 1.90 2.21 7.9 8.0 0.64 0.76 1.87 2.29 7.5 8.3 0.63 0.72 2.04 8.0 0.67 0.8 189 0.04 0.07 0.04 0.8 189 0.68 8.0 2.05 0.07 0.09 0.05
February 1.70 2.25 7.5 8.0 0.63 0.73 1.89 2.23 7.5 7.9 0.62 0.73 2.02 7.8 0.66 0.8 192 0.04 0.06 0.03 0.9 192 0.69 7.9 2.03 0.06 0.09 0.03
March 1.90 2.18 7.6 8.0 0.63 0.78 1.85 2.24 7.6 8.4 0.64 0.75 2.02 7.9 0.69 0.6 187 0.04 0.12 0.03 0.7 188 0.68 7.9 2.02 0.05 0.08 0.04
April 1.90 2.28 7.6 8.0 0.62 0.75 1.92 2.33 7.8 8.2 0.60 0.75 2.05 7.9 0.66 1.0 148 0.04 0.07 0.03 0.8 148 0.67 7.8 2.08 0.05 0.10 0.04
May 1.90 2.22 7.6 7.9 0.60 0.77 1.63 2.16 7.5 8.3 0.62 0.80 2.03 7.7 0.67 1.1 163 0.03 0.08 0.03 0.8 164 0.66 7.8 2.03 0.05 0.08 0.03
June 1.70 2.18 7.6 8.2 0.64 0.77 1.70 2.32 7.5 7.8 0.61 0.77 2.06 7.6 0.68 1.1 167 0.04 0.04 0.03 0.8 167 0.70 7.8 2.04 0.05 0.08 0.03
July 1.90 2.19 7.7 7.9 0.64 0.80 1.77 2.29 7.6 7.8 0.60 0.77 1.99 7.7 0.66 0.7 169 0.04 0.07 0.04 0.8 170 0.69 7.8 2.00 0.06 0.09 0.04
August 1.70 2.32 7.8 8.1 0.60 0.80 1.84 2.23 7.6 8.0 0.61 0.71 1.99 7.8 0.65 0.4 163 0.04 0.06 0.04 0.5 164 0.66 7.9 1.97 0.06 0.10 0.04
September 1.80 2.22 7.6 8.3 0.62 0.75 1.84 2.33 7.7 8.0 0.60 0.80 2.02 7.8 0.65 0.4 160 0.04 0.05 0.03 0.6 160 0.68 7.9 2.01 0.07 0.13 0.04
October 1.90 2.33 7.7 8.2 0.60 0.72 1.91 2.23 7.8 8.3 0.60 0.80 2.06 8.0 0.68 0.7 159 0.05 0.08 0.03 1.0 160 0.66 8.1 2.05 0.10 0.17 0.04
November 1.90 2.29 7.8 8.2 0.61 0.72 1.92 2.16 7.5 8.2 0.60 0.78 2.05 7.9 0.68 0.9 170 0.04 0.08 0.04 1.0 172 0.67 8.2 2.03 0.07 0.11 0.05
December 1.70 2.24 7.7 8.2 0.63 0.87 1.63 2.36 7.8 8.2 0.60 0.80 2.06 7.9 0.70 0.8 173 0.04 0.08 0.04 0.7 174 0.67 8.1 2.05 0.06 0.09 0.04
Annual
1.71 2.33 7.5 8.3 0.60 0.87 1.63 2.36 7.5 8.4 0.60 0.80 0.03 0.17 0.06 0.04 0.12 0.03 2.03 7.9 0.68 2.03 7.8 0.67 171 0.8 0.8 170Min/Max/
Avg
NOTES: ' -- ' indicates plant offline

Month Min
3.3 Rossdale Filters 1 - 9 Particle Counts (no./mL, >2um)
Filter
Max Avg
1 2 3 4 5 6 7 8 9
AvgMaxMin AvgMaxMin AvgMaxMin Min Max Avg Min AvgMax Min AvgMax Min Max Avg Min Max Avg
2017
January 1 45 1 45 1 44 1 45 2 45 1 45 1 45 1 48 7 5 5 5 11 6 5 5 ------
February 1 44 1 43 1 44 1 44 1 39 1 42 1 43 1 34 7 5 6 5 7 5 6 5 ------
March 1 45 1 46 1 45 1 45 1 42 1 48 1 47 1 49 8 9 6 7 10 6 6 7 ------
April 1 46 1 50 1 45 1 45 1 47 1 46 1 44 1 43 11 10 8 8 13 7 7 8 ------
May 1 31 1 33 1 29 1 30 1 32 1 40 1 36 1 41 1 38 3 4 3 2 4 3 5 4 3
June 1 29 1 30 1 41 1 24 1 45 1 42 1 31 1 38 1 40 2 2 3 2 3 2 2 3 2
July 1 34 1 43 1 31 1 22 3 37 3 19 2 35 5 32 2 44 7 7 7 7 10 8 8 9 9
August 1 34 1 34 1 28 1 31 1 38 1 28 1 36 1 45 8 8 8 7 10 9 8 8------
September 1 29 1 24 1 29 1 27 1 44 1 45 1 45 1 35 1 45 3 3 2 2 9 9 8 9 9
October 1 40 1 43 1 43 1 43 1 45 1 39 1 45 1 41 14 13 15 12 12 11 11 12------
November 1 43 1 45 1 45 1 45 1 35 1 42 1 45 1 36 6 5 5 6 6 5 7 6------
December 1 43 1 41 1 33 1 45 1 43 1 45 1 41 1 43 1 44 4 4 2 3 5 5 5 4 3
Annual
Min/Max/Avg 1 46 1 50 1 45 1 45 1 47 1 48 1 47 1 49 1 45 7 6 6 5 8 7 7 6 7
NOTE: ' -- ' indicates filter offline

Month Min
3.4 E.L. Smith Filters 1 - 9 Particle Counts (no./mL, >2um)
Filter
Max Avg
1 2 3 4 5 6 7 8 9
AvgMaxMin AvgMaxMin AvgMaxMin Min Max Avg Min AvgMax Min AvgMax Min Max Avg Min Max Avg
2017
January 1 36 1 45 1 43 1 45 1 40 1 45 1 45 1 45 1 46 4 5 5 5 3 5 13 9 10
February 1 31 1 44 1 45 1 44 1 39 1 45 1 45 1 39 1 45 5 5 5 5 5 5 13 10 10
March 1 50 1 46 1 50 1 51 1 50 1 48 1 50 1 50 1 41 8 6 6 6 8 6 7 12 5
April 1 50 1 50 1 50 1 50 1 50 1 49 1 46 1 45 1 45 7 8 9 8 6 7 7 9 7
May 1 28 1 32 1 42 1 39 1 31 1 30 1 44 1 39 1 41 5 6 5 5 6 5 6 7 5
June 1 44 1 39 1 45 1 45 1 46 1 31 1 34 1 43 1 44 3 3 5 4 3 4 4 5 4
July 1 44 1 35 1 27 1 39 1 36 1 35 1 43 1 45 1 45 7 6 5 6 7 6 11 15 10
August 1 37 1 35 1 29 1 41 1 36 1 45 1 45 1 45 1 45 9 8 8 9 10 10 17 17 15
September 1 45 1 42 1 34 1 36 1 36 1 37 1 45 2 45 1 44 11 8 7 7 8 8 12 18 12
October 1 35 1 40 1 26 1 40 1 37 1 40 1 44 1 45 1 45 7 7 7 7 8 7 10 14 12
November 1 32 1 42 1 40 1 31 1 31 1 33 1 36 1 44 1 42 4 4 4 4 5 5 7 8 7
December 1 43 1 29 1 12 1 38 1 25 1 30 1 30 1 32 1 31 3 3 3 3 4 3 5 5 5
Annual
Min/Max/Avg 1 50 1 50 1 50 1 51 1 50 1 49 1 50 1 50 1 46 6 6 6 6 6 6 9 11 9
NOTE: ' -- ' indicates filter offline
Month Min
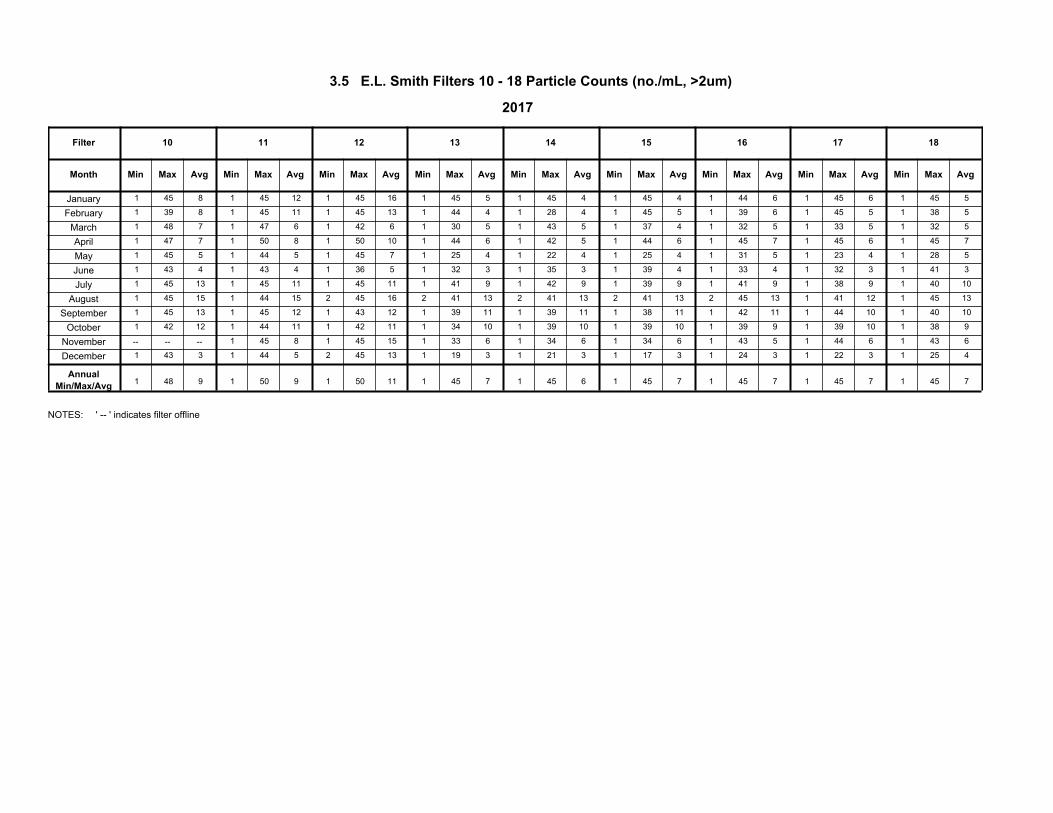
3.5 E.L. Smith Filters 10 - 18 Particle Counts (no./mL, >2um)
Filter
Max Avg
10 11 12 13 14 15 16 17 18
AvgMaxMin AvgMaxMin AvgMaxMin Min Max Avg Min AvgMax Min AvgMax Min Max Avg Min Max Avg
2017
January 1 45 1 45 1 45 1 45 1 45 1 45 1 44 1 45 1 45 8 12 16 5 4 4 6 6 5
February 1 39 1 45 1 45 1 44 1 28 1 45 1 39 1 45 1 38 8 11 13 4 4 5 6 5 5
March 1 48 1 47 1 42 1 30 1 43 1 37 1 32 1 33 1 32 7 6 6 5 5 4 5 5 5
April 1 47 1 50 1 50 1 44 1 42 1 44 1 45 1 45 1 45 7 8 10 6 5 6 7 6 7
May 1 45 1 44 1 45 1 25 1 22 1 25 1 31 1 23 1 28 5 5 7 4 4 4 5 4 5
June 1 43 1 43 1 36 1 32 1 35 1 39 1 33 1 32 1 41 4 4 5 3 3 4 4 3 3
July 1 45 1 45 1 45 1 41 1 42 1 39 1 41 1 38 1 40 13 11 11 9 9 9 9 9 10
August 1 45 1 44 2 45 2 41 2 41 2 41 2 45 1 41 1 45 15 15 16 13 13 13 13 12 13
September 1 45 1 45 1 43 1 39 1 39 1 38 1 42 1 44 1 40 13 12 12 11 11 11 11 10 10
October 1 42 1 44 1 42 1 34 1 39 1 39 1 39 1 39 1 38 12 11 11 10 10 10 9 10 9
November 1 45 1 45 1 33 1 34 1 34 1 43 1 44 1 43 8 15 6 6 6 5 6 6------
December 1 43 1 44 2 45 1 19 1 21 1 17 1 24 1 22 1 25 3 5 13 3 3 3 3 3 4
Annual
Min/Max/Avg 1 48 1 50 1 50 1 45 1 45 1 45 1 45 1 45 1 45 9 9 11 7 6 7 7 7 7
NOTES: ' -- ' indicates filter offline

Month Min
3.6 Rossdale Filters 1 - 9 Turbidity (NTU)
Filter
Max Avg
1 2 3 4 5 6 7 8 9
AvgMaxMin AvgMaxMin AvgMaxMin Min Max Avg Min AvgMax Min AvgMax Min Max Avg Min Max Avg
2017
January 0.02 0.09 0.03 0.03 0.08 0.02 0.05 0.10 0.03 0.04 0.09 0.03 0.06 0.10 0.03 0.04 0.10 0.02 0.02 0.09 0.01 0.04 0.10 0.02 ------
February 0.02 0.09 0.04 0.02 0.07 0.02 0.05 0.10 0.03 0.04 0.09 0.02 0.03 0.07 0.02 0.04 0.10 0.02 0.02 0.05 0.01 0.04 0.09 0.02 ------
March 0.02 0.09 0.04 0.02 0.05 0.01 0.04 0.08 0.03 0.03 0.08 0.02 0.03 0.07 0.02 0.03 0.08 0.02 0.02 0.06 0.01 0.03 0.07 0.01 ------
April 0.02 0.08 0.03 0.01 0.03 0.01 0.04 0.09 0.03 0.03 0.10 0.02 0.03 0.06 0.02 0.03 0.08 0.02 0.02 0.06 0.01 0.03 0.08 0.01 ------
May 0.02 0.08 0.03 0.02 0.07 0.01 0.03 0.08 0.03 0.03 0.08 0.02 0.03 0.08 0.02 0.02 0.08 0.01 0.02 0.06 0.01 0.03 0.08 0.02 0.03 0.09 0.02
June 0.02 0.07 0.03 0.02 0.06 0.01 0.04 0.08 0.03 0.03 0.08 0.02 0.02 0.07 0.01 0.04 0.08 0.02 0.01 0.05 0.01 0.03 0.08 0.02 0.03 0.09 0.02
July 0.02 0.08 0.04 0.02 0.07 0.02 0.04 0.08 0.03 0.04 0.08 0.03 0.03 0.08 0.02 0.04 0.08 0.01 0.02 0.08 0.01 0.04 0.08 0.03 0.04 0.08 0.02
August 0.02 0.08 0.04 0.03 0.08 0.02 0.04 0.08 0.03 0.04 0.08 0.02 0.03 0.07 0.01 0.04 0.09 0.02 0.02 0.06 0.01 0.03 0.08 0.02------
September 0.01 0.07 0.02 0.03 0.08 0.02 0.03 0.08 0.02 0.03 0.07 0.02 0.03 0.09 0.01 0.04 0.10 0.02 0.02 0.08 0.01 0.02 0.08 0.00 0.03 0.09 0.01
October 0.01 0.10 0.04 0.05 0.10 0.02 0.06 0.10 0.03 0.03 0.09 0.01 0.05 0.10 0.02 0.02 0.10 0.01 0.03 0.10 0.01 0.04 0.10 0.02------
November 0.02 0.08 0.03 0.05 0.11 0.02 0.04 0.08 0.03 0.04 0.08 0.02 0.02 0.05 0.01 0.03 0.08 0.02 0.02 0.08 0.01 0.03 0.08 0.01------
December 0.02 0.07 0.03 0.04 0.08 0.02 0.04 0.07 0.03 0.03 0.07 0.02 0.02 0.05 0.01 0.03 0.07 0.02 0.02 0.05 0.02 0.02 0.08 0.01 0.02 0.06 0.01
AnnualMin/Max/Avg
0.03 0.10 0.01 0.03 0.11 0.01 0.04 0.10 0.02 0.03 0.10 0.02 0.03 0.10 0.01 0.04 0.10 0.01 0.02 0.10 0.01 0.03 0.10 0.00 0.03 0.10 0.01
NOTES: ' -- ' indicates filter offline

Month Min
3.7 E.L. Smith Filters 1 - 9 Turbidity (NTU)
Filter
Max Avg
1 2 3 4 5 6 7 8 9
AvgMaxMin AvgMaxMin AvgMaxMin Min Max Avg Min AvgMax Min AvgMax Min Max Avg Min Max Avg
2017
January 0.02 0.08 0.03 0.03 0.08 0.02 0.06 0.08 0.04 0.03 0.08 0.03 0.03 0.07 0.02 0.03 0.08 0.02 0.03 0.08 0.02 0.04 0.08 0.03 0.03 0.08 0.02
February 0.02 0.07 0.03 0.03 0.08 0.02 0.06 0.08 0.05 0.03 0.07 0.03 0.03 0.07 0.02 0.03 0.07 0.02 0.03 0.08 0.02 0.04 0.08 0.03 0.03 0.08 0.02
March 0.02 0.07 0.03 0.03 0.08 0.03 0.06 0.08 0.05 0.03 0.07 0.03 0.03 0.08 0.02 0.03 0.08 0.02 0.03 0.10 0.02 0.04 0.09 0.03 0.03 0.11 0.02
April 0.02 0.08 0.03 0.03 0.08 0.02 0.05 0.08 0.05 0.03 0.08 0.03 0.03 0.08 0.02 0.03 0.08 0.02 0.03 0.10 0.02 0.04 0.10 0.03 0.03 0.10 0.02
May 0.02 0.08 0.03 0.03 0.08 0.02 0.05 0.08 0.05 0.03 0.08 0.03 0.03 0.08 0.02 0.03 0.08 0.02 0.03 0.08 0.02 0.04 0.10 0.03 0.03 0.11 0.02
June 0.02 0.08 0.03 0.04 0.08 0.02 0.05 0.08 0.03 0.03 0.08 0.02 0.03 0.08 0.02 0.03 0.08 0.02 0.03 0.08 0.02 0.05 0.08 0.04 0.03 0.08 0.02
July 0.02 0.08 0.03 0.04 0.08 0.02 0.06 0.08 0.05 0.03 0.08 0.03 0.03 0.08 0.02 0.03 0.08 0.02 0.04 0.08 0.02 0.05 0.08 0.04 0.03 0.08 0.02
August 0.02 0.08 0.03 0.04 0.08 0.03 0.06 0.08 0.05 0.04 0.08 0.03 0.03 0.08 0.02 0.03 0.08 0.02 0.04 0.08 0.03 0.05 0.08 0.04 0.04 0.08 0.02
September 0.02 0.08 0.03 0.04 0.08 0.03 0.06 0.08 0.05 0.03 0.08 0.02 0.03 0.08 0.02 0.03 0.08 0.02 0.03 0.08 0.02 0.05 0.08 0.04 0.03 0.08 0.02
October 0.02 0.10 0.04 0.04 0.10 0.03 0.07 0.11 0.05 0.04 0.10 0.02 0.03 0.10 0.02 0.03 0.10 0.02 0.04 0.10 0.02 0.05 0.10 0.01 0.04 0.10 0.02
November 0.02 0.09 0.03 0.04 0.09 0.03 0.06 0.10 0.05 0.03 0.09 0.02 0.03 0.09 0.02 0.03 0.09 0.02 0.03 0.09 0.02 0.05 0.10 0.04 0.03 0.09 0.02
December 0.03 0.09 0.03 0.03 0.08 0.02 0.06 0.09 0.06 0.03 0.09 0.03 0.03 0.08 0.01 0.02 0.07 0.02 0.03 0.09 0.02 0.05 0.09 0.04 0.03 0.09 0.02
AnnualMin/Max/Avg
0.03 0.10 0.02 0.04 0.10 0.02 0.06 0.11 0.03 0.03 0.10 0.02 0.03 0.10 0.01 0.03 0.10 0.02 0.03 0.10 0.02 0.05 0.10 0.01 0.03 0.11 0.02
NOTES: ' -- ' indicates filter offline
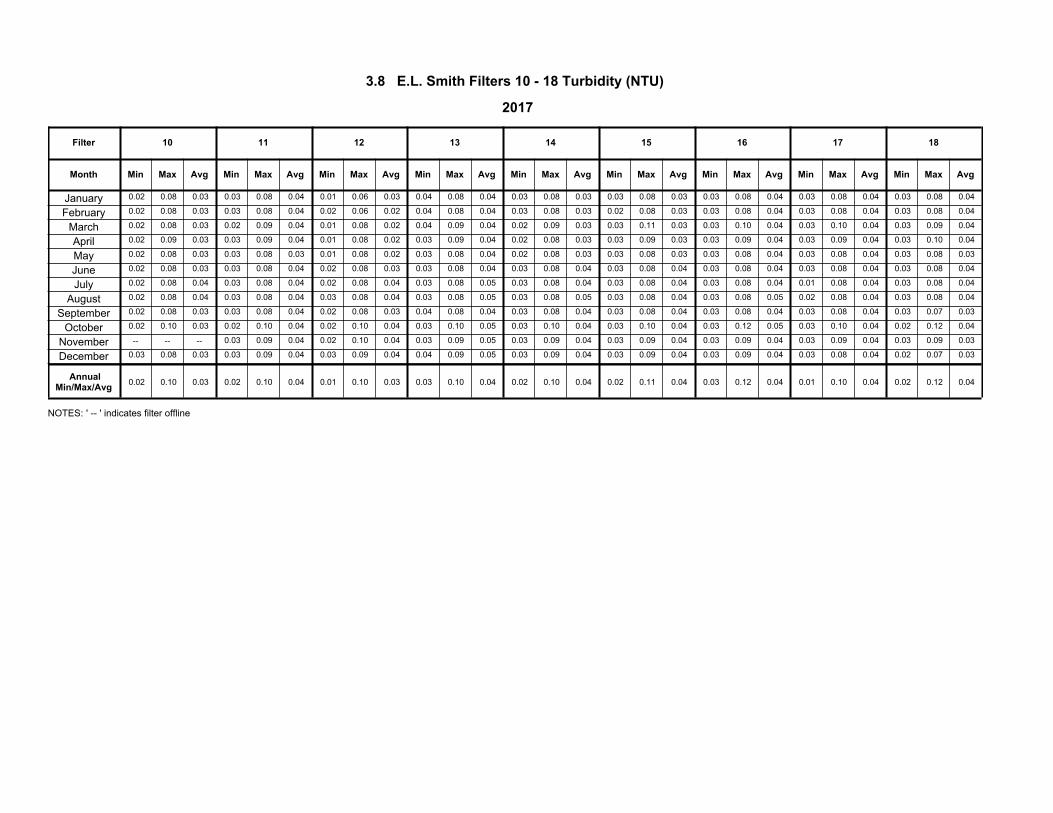
Month Min
3.8 E.L. Smith Filters 10 - 18 Turbidity (NTU)
Filter
Max Avg
10 11 12 13 14 15 16 17 18
AvgMaxMin AvgMaxMin AvgMaxMin Min Max Avg Min AvgMax Min AvgMax Min Max Avg Min Max Avg
2017
January 0.02 0.08 0.03 0.04 0.08 0.03 0.03 0.06 0.01 0.04 0.08 0.04 0.03 0.08 0.03 0.03 0.08 0.03 0.04 0.08 0.03 0.04 0.08 0.03 0.04 0.08 0.03
February 0.02 0.08 0.03 0.04 0.08 0.03 0.02 0.06 0.02 0.04 0.08 0.04 0.03 0.08 0.03 0.03 0.08 0.02 0.04 0.08 0.03 0.04 0.08 0.03 0.04 0.08 0.03
March 0.02 0.08 0.03 0.04 0.09 0.02 0.02 0.08 0.01 0.04 0.09 0.04 0.03 0.09 0.02 0.03 0.11 0.03 0.04 0.10 0.03 0.04 0.10 0.03 0.04 0.09 0.03
April 0.02 0.09 0.03 0.04 0.09 0.03 0.02 0.08 0.01 0.04 0.09 0.03 0.03 0.08 0.02 0.03 0.09 0.03 0.04 0.09 0.03 0.04 0.09 0.03 0.04 0.10 0.03
May 0.02 0.08 0.03 0.03 0.08 0.03 0.02 0.08 0.01 0.04 0.08 0.03 0.03 0.08 0.02 0.03 0.08 0.03 0.04 0.08 0.03 0.04 0.08 0.03 0.03 0.08 0.03
June 0.02 0.08 0.03 0.04 0.08 0.03 0.03 0.08 0.02 0.04 0.08 0.03 0.04 0.08 0.03 0.04 0.08 0.03 0.04 0.08 0.03 0.04 0.08 0.03 0.04 0.08 0.03
July 0.02 0.08 0.04 0.04 0.08 0.03 0.04 0.08 0.02 0.05 0.08 0.03 0.04 0.08 0.03 0.04 0.08 0.03 0.04 0.08 0.03 0.04 0.08 0.01 0.04 0.08 0.03
August 0.02 0.08 0.04 0.04 0.08 0.03 0.04 0.08 0.03 0.05 0.08 0.03 0.05 0.08 0.03 0.04 0.08 0.03 0.05 0.08 0.03 0.04 0.08 0.02 0.04 0.08 0.03
September 0.02 0.08 0.03 0.04 0.08 0.03 0.03 0.08 0.02 0.04 0.08 0.04 0.04 0.08 0.03 0.04 0.08 0.03 0.04 0.08 0.03 0.04 0.08 0.03 0.03 0.07 0.03
October 0.02 0.10 0.03 0.04 0.10 0.02 0.04 0.10 0.02 0.05 0.10 0.03 0.04 0.10 0.03 0.04 0.10 0.03 0.05 0.12 0.03 0.04 0.10 0.03 0.04 0.12 0.02
November 0.04 0.09 0.03 0.04 0.10 0.02 0.05 0.09 0.03 0.04 0.09 0.03 0.04 0.09 0.03 0.04 0.09 0.03 0.04 0.09 0.03 0.03 0.09 0.03------
December 0.03 0.08 0.03 0.04 0.09 0.03 0.04 0.09 0.03 0.05 0.09 0.04 0.04 0.09 0.03 0.04 0.09 0.03 0.04 0.09 0.03 0.04 0.08 0.03 0.03 0.07 0.02
AnnualMin/Max/Avg
0.03 0.10 0.02 0.04 0.10 0.02 0.03 0.10 0.01 0.04 0.10 0.03 0.04 0.10 0.02 0.04 0.11 0.02 0.04 0.12 0.03 0.04 0.10 0.01 0.04 0.12 0.02
NOTES: ' -- ' indicates filter offline

Month
Min
3.9 Combined Filter Effluent Water Quality
Max Avg
Particle Counts (no./mL,>2um) Turbidity (NTU) Particle Counts (no./mL,>2um) Turbidity (NTU)
AvgMaxMin AvgMaxMin AvgMaxMin
2017
Rossdale E.L. Smith
1 23 1 19January 6 6 0.04 0.05 0.03 0.05 0.08 0.03
1 21 2 16February 7 5 0.03 0.06 0.03 0.05 0.08 0.02
1 28 2 18March 6 6 0.03 0.05 0.03 0.03 0.07 0.01
2 27 2 24April 7 8 0.03 0.05 0.03 0.04 0.10 0.03
1 16 1 15May 5 3 0.03 0.06 0.01 0.04 0.05 0.03
1 16 1 15June 4 2 0.04 0.05 0.03 0.04 0.05 0.03
1 19 3 19July 9 8 0.04 0.05 0.03 0.05 0.06 0.04
1 22 1 21August 12 8 0.04 0.05 0.03 0.05 0.08 0.03
1 26 1 21September 10 7 0.04 0.05 0.02 0.05 0.09 0.03
1 26 1 20October 9 12 0.04 0.06 0.03 0.06 0.11 0.03
1 22 1 13November 6 5 0.04 0.06 0.01 0.05 0.09 0.03
1 21 1 16December 4 3 0.04 0.06 0.03 0.05 0.14 0.03
Annual
Min/Max/Avg 24 1 28 1 7 6 0.04 0.06 0.01 0.05 0.14 0.01
NOTES: ' -- ' indicates plant offline

MonthMin
3.10 Rossdale UV Disinfection - Filters 1 - 3
Max Avg
Flow (MLD)
TotalMaxMin AvgMaxMin TotalMaxMin Min Max Avg Min TotalMax Min AvgMax
2017
1 2 Transmittance
(%)
3Filter
Flow (MLD) Flow (MLD)Dosage (mJ/cm²) Dosage (mJ/cm²) Dosage (mJ/cm²)
January 33.4 59.4 10.2 28.8 584.5 32.6 57.0 10.4 28.8 570.6 33.1 56.9 10.4 28.4 559.6 89.7 95.1 93.7 39.3 39.4 39.8
February 33.3 59.8 12.5 30.1 493.2 33.9 56.3 10.7 29.2 491.7 32.4 55.8 13.0 30.6 494.5 91.0 96.9 93.7 35.5 35.7 36.1
March 32.9 54.4 10.0 31.3 414.2 34.0 50.5 12.4 30.2 329.7 33.7 55.6 13.0 31.5 483.1 92.2 97.3 94.7 35.8 36.4 38.1
April 34.2 57.3 18.4 29.1 262.9 34.0 49.1 11.7 29.2 519.0 33.5 51.0 11.8 28.2 488.4 88.7 95.9 92.0 36.0 35.5 35.7
May 33.1 57.4 10.0 34.2 587.5 33.7 54.9 10.1 36.1 589.2 33.4 57.7 12.1 35.3 553.5 88.6 93.5 91.9 35.4 35.6 36.3
June 33.2 58.0 7.8 33.8 398.8 33.8 52.6 10.4 33.9 514.4 33.2 55.2 10.3 34.7 440.6 89.7 94.1 92.4 35.5 35.6 35.6
July 32.9 62.7 8.6 40.5 597.3 32.7 55.8 8.7 41.1 640.4 32.6 62.2 11.4 39.2 610.7 91.6 95.6 94.0 36.6 36.6 36.4
August 33.2 67.6 9.9 38.6 615.4 33.8 64.4 9.4 38.4 638.7 32.8 67.1 10.0 38.8 621.9 93.6 96.5 95.4 37.3 37.1 38.3
September 34.1 55.2 13.5 38.5 271.9 34.2 48.2 15.9 39.1 303.9 33.9 58.4 11.9 35.4 299.8 92.9 97.2 95.3 36.2 35.5 36.5
October 32.8 56.3 11.7 31.3 503.5 33.5 56.6 10.0 32.6 514.6 33.1 56.6 11.0 31.6 434.7 91.1 95.4 93.8 36.0 36.0 37.5
November 33.1 55.7 10.2 34.3 538.5 33.8 59.1 10.6 33.5 508.2 33.9 57.2 11.9 33.8 458.7 92.0 96.3 94.0 35.9 35.5 37.3
December 33.8 52.3 11.3 32.0 519.7 33.5 57.5 10.0 32.9 517.4 33.6 56.1 10.3 30.8 511.1 93.7 96.0 95.3 35.8 35.7 37.4
32.8 67.6 7.8 40.5
5787
32.6 64.4 8.7 41.1
6138
32.4 67.1 10.0 39.2
5957
88.6 97.3
Annual
Total
93.8 36.3 36.3 37.2
AvgMin/Max/Annual
NOTES: - Each filter has a UV reactor
- Transmittance (%) is a grab sample of the filter effluent prior to the UV reactor of a random online filter
' -- ' indicates filter and UV reactor offline

MonthMin
3.11 Rossdale UV Disinfection - Filters 4 - 6
Max Avg
Flow (MLD)
TotalMaxMin AvgMaxMin TotalMaxMin Min Max Avg Min TotalMax Min AvgMax
2017
4 5 Transmittance
(%)
6Filter
Flow (MLD) Flow (MLD)Dosage (mJ/cm²) Dosage (mJ/cm²) Dosage (mJ/cm²)
January 33.6 56.1 12.9 27.7 558.0 32.0 58.1 12.8 28.6 463.5 31.6 58.7 10.6 29.8 570.4 89.7 95.1 93.7 39.9 43.3 39.2
February 34.2 58.8 11.6 29.3 520.6 33.6 65.4 12.2 30.5 353.4 32.7 44.6 14.7 33.4 488.7 91.0 96.9 93.7 38.0 45.0 35.4
March 33.7 120.9 13.3 32.0 470.6 32.6 73.4 11.5 30.6 329.1 33.3 54.4 11.5 34.8 628.2 92.2 97.3 94.7 43.3 46.6 36.2
April 34.2 56.0 14.5 27.6 509.0 32.3 47.6 13.0 30.3 501.4 33.5 54.2 11.3 30.0 564.0 88.7 95.9 92.0 38.2 38.7 35.3
May 32.9 61.4 11.4 33.7 577.8 33.2 73.9 8.9 34.0 566.2 33.3 55.9 10.5 37.3 663.7 88.6 93.5 91.9 38.5 39.5 35.9
June 31.8 52.7 11.8 33.6 405.1 32.7 164.5 13.8 34.0 414.1 34.2 59.7 10.6 36.5 524.0 89.7 94.1 92.4 37.4 37.1 35.4
July 32.9 73.8 10.0 40.1 626.3 33.3 75.4 11.7 39.7 594.8 34.0 58.1 10.6 42.6 650.3 91.6 95.6 94.0 40.6 41.9 36.9
August 33.7 84.2 10.0 37.6 589.4 32.5 86.5 10.3 37.4 630.0 32.7 68.7 10.1 41.7 666.1 93.6 96.5 95.4 44.1 45.3 38.0
September 34.3 82.5 11.2 39.1 278.5 32.8 89.6 10.1 36.9 690.8 33.4 55.2 12.4 41.6 596.8 92.9 97.2 95.3 43.8 47.4 36.7
October 0.0 32.2 76.9 10.1 34.3 469.6 32.9 73.5 10.2 36.5 334.8 91.1 95.4 93.8 48.8 37.7----------
November 34.4 54.0 11.2 32.7 545.7 33.2 65.7 12.1 31.3 493.8 0.0 92.0 96.3 94.0 35.7 42.6 ----------
December 34.9 65.4 11.8 33.5 508.8 34.5 66.2 12.0 31.8 516.6 34.8 50.6 12.2 36.6 450.7 93.7 96.0 95.3 37.3 46.8 35.8
31.8 120.9 10.0 40.1
5590
32.0 164.5 8.9 39.7
6023
31.6 73.5 10.1 42.6
6138
88.6 97.3
Annual
Total
93.8 39.6 43.6 36.6
AvgMin/Max/Annual
NOTES: - Each filter has a UV reactor
- Transmittance (%) is a grab sample of the filter effluent prior to the UV reactor of a random online filter
' -- ' indicates filter and UV reactor offline

MonthMin
3.12 Rossdale UV Disinfection - Filters 7 - 9
Max Avg
Flow (MLD)
TotalMaxMin AvgMaxMin TotalMaxMin Min Max Avg Min TotalMax Min AvgMax
2017
7 8 Transmittance
(%)
9Filter
Flow (MLD) Flow (MLD)Dosage (mJ/cm²) Dosage (mJ/cm²) Dosage (mJ/cm²)
January 33.0 53.4 12.0 31.5 587.9 32.6 57.4 11.2 32.0 584.1 0.0 89.7 95.1 93.7 38.8 39.5 ----------
February 32.8 59.1 14.3 29.5 233.9 33.0 61.8 10.0 33.7 511.2 0.0 91.0 96.9 93.7 36.0 36.3 ----------
March 33.7 55.0 10.0 34.3 592.2 32.1 54.4 13.3 34.2 614.1 0.0 92.2 97.3 94.7 36.0 36.6 ----------
April 33.7 59.2 9.1 31.8 615.5 33.2 56.2 15.2 33.1 586.2 0.0 88.7 95.9 92.0 35.3 35.3 ----------
May 32.7 58.7 10.1 38.7 544.8 32.6 60.8 10.3 37.9 651.8 32.6 50.9 11.2 39.4 339.5 88.6 93.5 91.9 36.3 36.3 35.9
June 33.7 57.0 11.2 37.7 596.1 31.8 55.2 12.2 37.0 530.9 33.1 58.6 11.2 38.7 473.5 89.7 94.1 92.4 35.4 35.6 35.3
July 33.6 59.5 10.2 45.7 734.4 32.4 54.0 10.8 37.4 65.8 33.4 55.5 10.1 45.7 665.8 91.6 95.6 94.0 37.2 35.7 35.6
August 33.9 72.3 9.7 42.2 635.8 0.0 33.5 53.3 10.4 43.1 733.4 93.6 96.5 95.4 38.0 35.7----------
September 31.8 59.7 10.5 41.0 753.1 34.7 97.7 11.0 40.8 421.7 32.8 52.1 9.6 42.0 718.5 92.9 97.2 95.3 36.2 37.5 35.4
October 33.5 59.0 11.4 37.0 605.1 34.5 72.3 10.5 37.9 597.4 32.1 54.6 10.2 33.9 527.1 91.1 95.4 93.8 36.1 37.0 35.5
November 33.7 55.4 11.2 37.5 609.5 34.6 58.3 11.1 38.4 645.0 31.6 49.0 10.3 31.9 518.3 92.0 96.3 94.0 35.4 35.8 35.2
December 34.1 43.9 16.2 34.2 92.8 34.2 57.8 14.8 39.4 477.2 32.7 57.8 10.3 31.8 628.8 93.7 96.0 95.3 35.2 36.0 35.8
31.8 72.3 9.1 45.7
6601
31.8 97.7 10.0 40.8
5685
31.6 58.6 9.6 45.7
4605
88.6 97.3
Annual
Total
93.8 36.4 36.6 35.6
AvgMin/Max/Annual
NOTES: - Each filter has a UV reactor
- Transmittance (%) is a grab sample of the filter effluent prior to the UV reactor of a random online filter
' -- ' indicates filter and UV reactor offline

MonthMin
3.13 E.L. Smith UV Disinfection - UV Reactors 1 - 4
Max Avg
Flow (MLD)
TotalMaxMin AvgMaxMin TotalMaxMin Min Max Avg Min TotalMax Min AvgMax
2017
1 2Transmittance
(%)
4Filter
Flow (MLD) Flow (MLD)Dosage (mJ/cm²) Dosage (mJ/cm²) Dosage (mJ/cm²)
TotalMaxMinAvgMaxMin
Flow (MLD)Dosage (mJ/cm²)
3
January 47.6 117.5 29.6 91.6 2,347.0 45.0 165.6 23.7 83.0 677.0 47.9 111.8 29.4 89.1 2,366.7 95.1 93.7 67.7 73.2 65.5 92.3 1,931.5 80.3 35.5 120.6 42.7 46.3
February 47.6 122.9 39.0 100.0 1,937.1 48.5 123.6 40.0 80.2 1,130.2 47.6 111.1 41.8 106.5 1,990.6 97.6 94.2 69.3 70.1 68.7 91.6 1,696.6 86.9 37.5 51.1 39.9 46.1
March 45.1 149.2 41.2 95.3 2,115.1 54.0 137.0 35.0 93.4 552.5 48.7 166.0 36.7 104.8 2,376.5 97.4 95.4 72.3 74.9 65.5 94.1 2,033.6 95.3 34.5 135.6 40.3 46.4
April 49.4 106.2 32.2 98.4 1,810.8 48.0 126.4 29.6 93.9 1,846.9 46.9 99.6 44.7 99.2 1,557.3 95.5 92.9 69.0 62.5 64.0 90.7 1,819.3 92.1 29.0 97.6 39.6 46.3
May 48.1 87.5 48.4 88.6 2,147.9 49.8 301.2 47.3 87.8 1,996.2 49.3 93.6 50.1 103.0 2,281.2 94.0 91.7 70.9 66.8 67.6 89.0 1,597.3 78.9 46.0 94.9 35.6 46.7
June 48.1 102.6 46.8 88.7 2,116.6 56.1 92.4 42.9 83.0 1,953.4 51.0 92.4 47.6 93.3 2,241.7 93.8 91.9 75.2 71.6 70.9 89.7 1,891.1 78.8 42.4 87.9 41.6 46.3
July 49.1 101.8 29.0 123.9 2,361.8 51.1 109.0 26.6 117.6 2,198.0 42.7 122.5 25.4 92.1 2,129.8 95.8 94.1 69.9 68.2 66.2 91.9 2,136.7 111.1 25.9 92.2 41.2 46.7
August 59.1 106.9 39.0 109.0 2,178.9 49.1 131.9 35.6 103.8 2,027.1 51.1 102.0 32.9 138.7 1,999.0 96.6 95.2 72.1 65.3 65.4 92.4 1,716.5 95.6 33.3 124.6 36.5 46.2
September 48.4 122.9 46.2 97.1 2,225.4 49.3 110.8 44.3 94.2 2,076.1 49.3 105.3 50.7 122.6 2,464.8 97.3 96.0 75.4 76.7 71.6 93.9 1,427.6 84.9 31.5 110.6 37.4 45.6
October 41.8 101.6 26.5 100.4 2,028.5 49.4 120.6 41.1 123.1 2,190.0 45.2 112.7 41.0 142.1 2,422.4 97.1 94.8 57.9 65.4 64.1 92.9 865.3 131.8 47.5 104.4 38.8 47.9
November 35.8 119.6 22.3 76.5 1,428.2 39.1 123.9 31.4 123.8 2,021.7 35.4 114.5 31.0 109.9 2,141.8 97.6 94.4 57.4 63.7 63.7 91.5 1,555.4 83.6 40.9 108.6 35.4 47.3
December 46.4 115.3 39.1 96.4 1,722.9 46.1 117.2 20.0 98.7 1,236.1 42.3 121.4 29.8 101.1 2,474.0 95.9 95.0 55.0 68.3 60.5 94.0 1,591.0 84.5 37.2 123.3 44.5 51.3
35.8 149.2 22.3 123.9
24,420
39.1 301.2 20.0 123.8
19,905
35.4 166.0 25.4 142.1
26,446
89.0 97.6
Annual
Total
94.1 67.6 68.2 66.2 35.4 135.6 25.9 131.8
20,262
46.9Annual
AvgMin/Max/
NOTES: ' -- ' indicates UV reactor offline
- Transmittance (%) is a grab sample of the combined filter effluent prior to the UV reactor
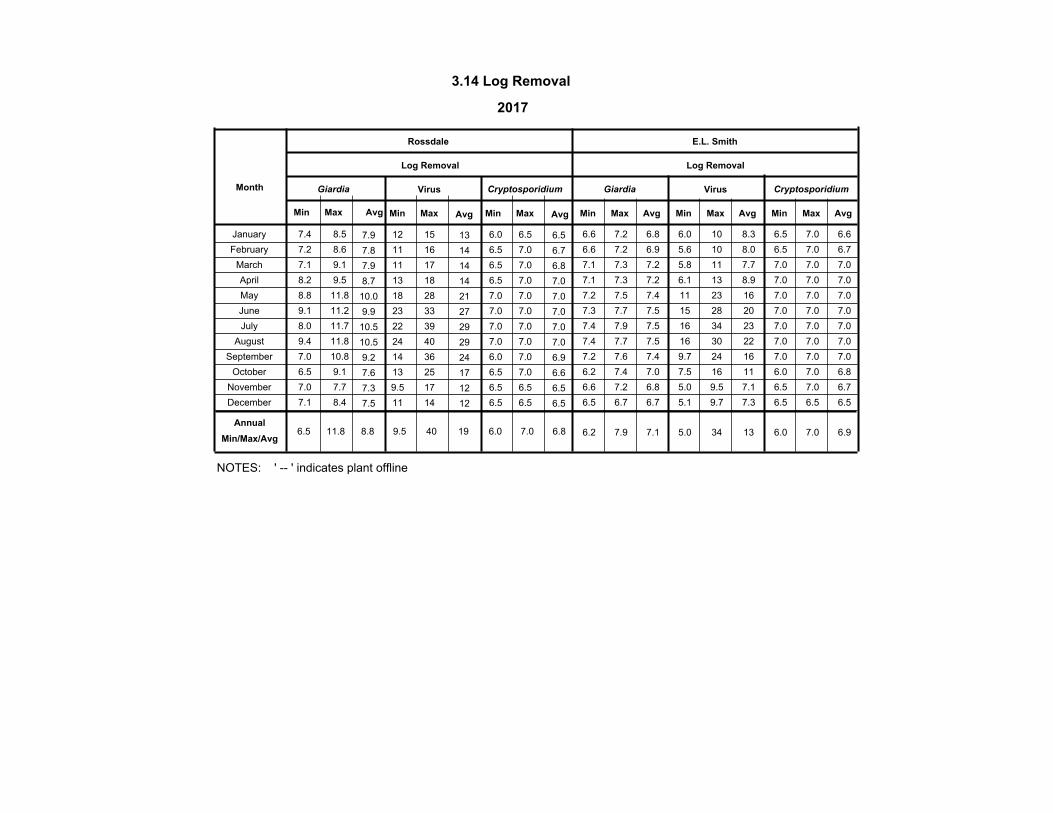
Month
Min
3.14 Log Removal
Max Avg
Giardia Virus Cryptosporidium
AvgMaxMin AvgMaxMin Min AvgMax Min AvgMax Min Max Avg
2017
Rossdale E.L. Smith
Log Removal Log Removal
Giardia Virus Cryptosporidium
7.4 8.5 12 15 6.0 6.5 6.6 7.2 6.0 10 6.5 7.0 6.8 8.3January 6.6 6.5 13 7.9
7.2 8.6 11 16 6.5 7.0 6.6 7.2 5.6 10 6.5 7.0 6.9 8.0February 6.7 6.7 14 7.8
7.1 9.1 11 17 6.5 7.0 7.1 7.3 5.8 11 7.0 7.0 7.2 7.7March 7.0 6.8 14 7.9
8.2 9.5 13 18 6.5 7.0 7.1 7.3 6.1 13 7.0 7.0 7.2 8.9April 7.0 7.0 14 8.7
8.8 11.8 18 28 7.0 7.0 7.2 7.5 11 23 7.0 7.0 7.4 16May 7.0 7.0 21 10.0
9.1 11.2 23 33 7.0 7.0 7.3 7.7 15 28 7.0 7.0 7.5 20June 7.0 7.0 27 9.9
8.0 11.7 22 39 7.0 7.0 7.4 7.9 16 34 7.0 7.0 7.5 23July 7.0 7.0 29 10.5
9.4 11.8 24 40 7.0 7.0 7.4 7.7 16 30 7.0 7.0 7.5 22August 7.0 7.0 29 10.5
7.0 10.8 14 36 6.0 7.0 7.2 7.6 9.7 24 7.0 7.0 7.4 16September 7.0 6.9 24 9.2
6.5 9.1 13 25 6.5 7.0 6.2 7.4 7.5 16 6.0 7.0 7.0 11October 6.8 6.6 17 7.6
7.0 7.7 9.5 17 6.5 6.5 6.6 7.2 5.0 9.5 6.5 7.0 6.8 7.1November 6.7 6.5 12 7.3
7.1 8.4 11 14 6.5 6.5 6.5 6.7 5.1 9.7 6.5 6.5 6.7 7.3December 6.5 6.5 12 7.5
Annual
Min/Max/Avg 6.5 11.8 9.5 40 6.0 7.0 6.2 7.9 5.0 34 6.0 7.0 8.8 19 7.1 13 6.9 6.8
NOTES: ' -- ' indicates plant offline

Month
Dosage (mg/L) Consumption (kg)
Plant 1 Plant 2
2017
4.1 Liquid Alum Chemical Consumption
E.L. Smith E.L. Smith
Plant 2Plant 1
Rossdale Rossdale
Plant Total
29,201 31,349 60,550 159,534January 9.45 6.48 6.12
97,172 109,364 206,536 382,029February 26.2 31.9 22.3
97,309 233,526 330,835 734,873March 47.8 39.3 53.4
482,356 709,182 1,191,537 2,266,447April 143 133 133
455,186 669,359 1,124,544 1,969,029May 116 107 107
72,795 876,036 948,831 2,036,941June 114 104 96.6
106,871 237,118 343,989 817,188July 40.9 30.2 28.3
127,855 157,827 285,682 507,239August 29.4 25.9 25.9
58,625 142,836 201,461 547,241September 31.8 18.3 25.0
76,719 76,719 341,548October 20.2 9.09 ----
16,092 40,346 56,438 187,403November 11.7 6.00 6.00
19,786 35,066 54,852 77,247December 4.93 6.00 6.00
Annual Total
Annual Avg
1,563,247 3,318,728 4,881,975 10,026,720
43.9 43.2 49.6
NOTES : ' -- ' indicates plant offline
- Liquid alum consumption (kg) at 100% by weight (solution delivered to sites at a
concentration of 48.5%)

Month
Dosage (mg/L) Consumption (kg)
Plant 1 Plant 2
20174.2 Primary Polymer (Magnafloc LT 27AG) Chemical Consumption
E.L. Smith E.L. Smith
Plant 2Plant 1
Rossdale Rossdale
Plant Total
0 0 0 377.62January 0.19----
175 244 419 729.34February 0.26 0.24 0.24
157 488 645 1,487.43March 0.19 0.23 0.26
617 900 1,517 2,351.92April 0.31 0.35 0.35
732 1,068 1,800 2,248.95May 0.28 0.35 0.35
119 1,564 1,682 2,083.50June 0.24 0.38 0.34
559 1,084 1,644 1,562.79July 0.16 0.30 0.31
682 840 1,522 1,506.22August 0.18 0.28 0.28
324 650 974 1,826.31September 0.22 0.26 0.28
0 195 196 1,179.76October 0.24 0.20--
0 0 0 483.94November 0.18----
December --------------
Annual Total
Annual Avg
3,366 7,034 10,400 15,838
0.31 0.30 0.22
NOTES: ' -- ' indicates plant offline
- Primary polymer consumption (kg) at 100% by weight mixed at the sites to required solution

Month
Dosage (mg/L) Consumption (kg)
Plant 1 Plant 2
2017
4.3 Carbon Chemical Consumption
E.L. Smith E.L. Smith
Plant 2Plant 1
Rossdale Rossdale
Plant Total
January --------------
26,463 26,403 52,866 79,670February 40.2 39.8 40.0
36,275 51,344 87,619 145,353March 49.6 56.3 55.2
14,460 18,221 32,681 28,221April 9.92 27.6 27.7
May --------------
June --------------
July --------------
August --------------
September --------------
October --------------
November --------------
December --------------
Annual Total
Annual Avg
77,197 95,969 173,166 253,244
43.6 43.9 34.4
NOTES: ' -- ' indicates carbon not being used

Month Dosage (mg/L) Consumption (kg)
Plant 1 Plant 2
2017
4.4 Sodium Hypochlorite Chemical Consumption
E.L. Smith
Plant 2Plant 1
Rossdale
Plant Total
Dosage
(mg/L)
Consumption
(kg)
936,311 976,269 1,912,581 3,405,328January 3.34 3.32 3.25
1,012,020 621,143 1,633,163 3,392,536February 3.56 3.29 3.47
426,688 1,438,578 1,865,266 3,365,700March 3.38 3.68 4.13
876,922 1,233,262 2,110,183 3,686,722April 3.64 3.79 3.87
869,417 1,323,088 2,192,506 3,528,708May 3.28 3.44 3.30
138,889 1,819,078 1,957,967 3,632,345June 3.15 3.55 3.44
693,771 1,530,000 2,223,771 3,962,581July 3.16 3.30 2.97
907,534 1,170,854 2,078,388 3,311,149August 3.02 3.17 3.02
394,958 1,328,271 1,723,229 3,012,210September 2.72 3.12 2.77
1,498,316 1,498,316 3,016,155October 2.78 2.86 ---- 450,764 1,119,938 1,570,702 2,694,018November 2.76 2.74 2.69
613,412 1,056,060 1,669,471 2,736,557December 2.74 2.98 3.07
Annual Total
Annual Avg
39,744,009
3.25 3.27 3.13
7,320,687 15,114,857 22,435,544
NOTES: ' -- ' indicates plant offline
- Sodium hypochlorite consumption (kg) at 0.8% by weight (sodium hypochlorite generated onsite at a
concentration of 0.8%)
- Plant 1 was converted to sodium hypochlorite from chlorine on Feb 2, 2015.
- Plant 2 was converted to sodium hypochlorite from chlorine on Feb 10, 2015.
- Plant Total Consumption is the combined addition of Plant 1, Plant 2 and Post Filter Trim.

Month
Dosage (mg/L) Consumption (kg)
2017
4.5 Filter Polymer (Magnafloc LT 7981) Chemical Consumption
E.L. Smith E.L. SmithRossdale Rossdale
January 4,916 3,122 0.70 0.65
February 4,168 1,654 0.48 0.57
March 807 1,572 0.41 0.11
April 1,263 2,600 0.64 0.16
May 1,087 2,519 0.50 0.14
June 568 1,236 0.29 0.06
July 1,255 1,047 0.20 0.13
August 1,569 1,519 0.30 0.19
September 2,035 1,513 0.37 0.25
October 2,819 1,976 0.50 0.34
November 1,866 1,499 0.35 0.26
December 2,078 1,481 0.35 0.27
Annual Total
Annual Avg
21,738 24,430
0.42 0.26
NOTES: ' -- ' indicates plant offline
- Filter polymer consumption (kg) at 100% by weight mixed at the sites to required solution

Month
Dosage (mg/L) Consumption (kg)
2017
4.6 Aqua Ammonia Chemical Consumption
E.L. Smith E.L. SmithRossdale Rossdale
January 22,678 14,428 0.62 0.61
February 21,214 11,487 0.61 0.61
March 22,730 12,189 0.60 0.61
April 22,164 12,579 0.59 0.60
May 22,977 15,060 0.57 0.58
June 25,189 12,955 0.57 0.58
July 27,410 15,558 0.57 0.59
August 23,906 15,377 0.57 0.59
September 24,457 12,947 0.57 0.59
October 23,287 11,939 0.57 0.59
November 20,943 12,917 0.57 0.59
December 20,587 12,446 0.56 0.57
Annual Total
Annual Avg
159,881 277,542
0.58 0.59
NOTES: ' -- ' indicates plant offline
- Aqua ammonia consumption (kg) at 100% by weight (solution delivered to sites at a
concentration of 19.0%)

Month
Dosage (mg/L) Consumption (kg)
2017
4.7 Caustic Soda Chemical Consumption
E.L. Smith E.L. SmithRossdale Rossdale
January 9,732 448 0.54 3.15
February 64,894 31,427 9.48 13.0
March 165,065 51,845 9.90 12.2
April 550,008 221,854 27.5 39.4
May 417,579 186,394 18.8 27.7
June 400,357 138,460 16.3 24.8
July 112,552 14,801 1.41 6.16
August 51,682 8,161 0.80 3.52
September 50,062 5,212 1.06 3.51
October 27,884 2,060 1.67 2.95
November 17,190 3.48 ----
December --------
Annual Total
Annual Avg
660,661 1,867,005
11.0 14.7
NOTES: ' -- ' indicates plant offline
- Caustic soda consumption (kg) at 100% by weight (solution delivered to sites at a
concentration of 50.0%)
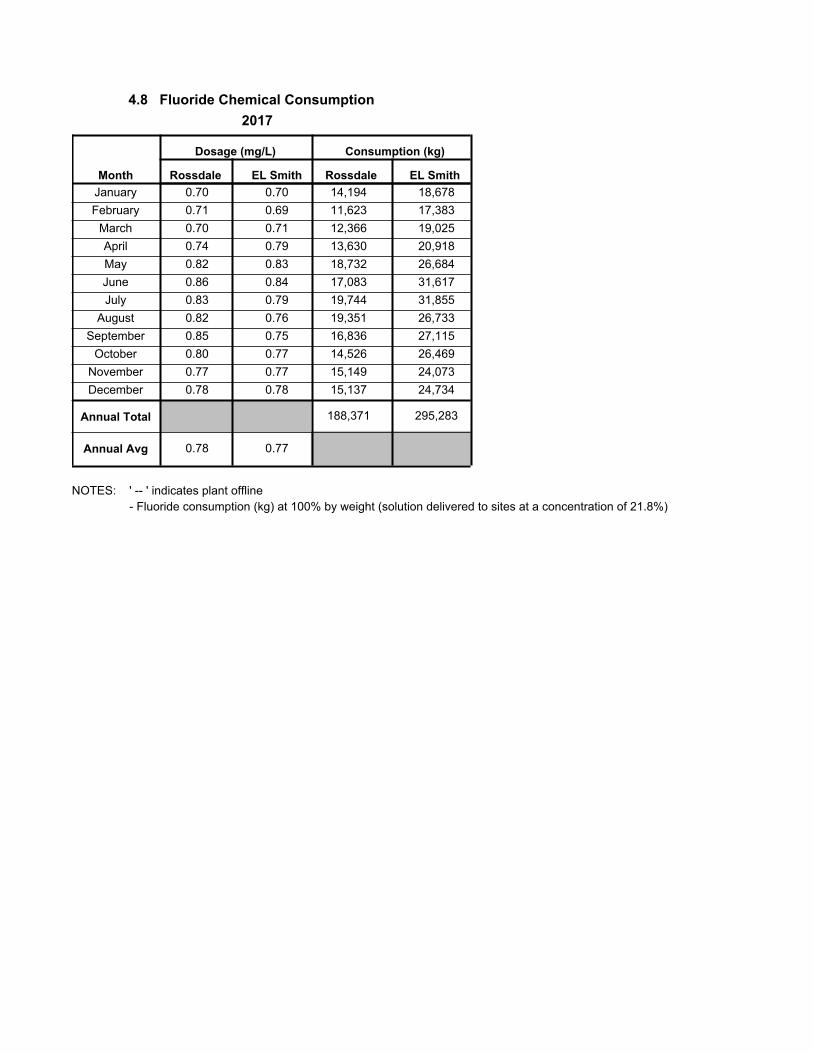
Month
Dosage (mg/L) Consumption (kg)
2017
4.8 Fluoride Chemical Consumption
EL Smith EL SmithRossdale Rossdale
January 18,678 14,194 0.70 0.70
February 17,383 11,623 0.71 0.69
March 19,025 12,366 0.70 0.71
April 20,918 13,630 0.74 0.79
May 26,684 18,732 0.82 0.83
June 31,617 17,083 0.86 0.84
July 31,855 19,744 0.83 0.79
August 26,733 19,351 0.82 0.76
September 27,115 16,836 0.85 0.75
October 26,469 14,526 0.80 0.77
November 24,073 15,149 0.77 0.77
December 24,734 15,137 0.78 0.78
Annual Total
Annual Avg
188,371 295,283
0.78 0.77
NOTES: ' -- ' indicates plant offline
- Fluoride consumption (kg) at 100% by weight (solution delivered to sites at a concentration of 21.8%)

MonthDosage
(mg/L)
Consumption
(kg)
20174.9 Sodium Bisulfite Chemical Consumption
E.L. Smith
De-chlorinated
Waste Stream
to Outfall (ML)
De-chlorinated
Waste Stream
to Outfall (ML)
Consumption
(kg)
Dosage
(mg/L)
Rossdale
January 43,606 14.2 1,174 18.1 26,153 555
February 39,733 14.2 1,071 18.8 19,384 409
March 38,025 16.0 911 19.6 20,574 435
April 42,246 16.1 1,010 11.8 15,781 488
May 46,131 19.2 988 21.4 18,166 337
June 43,829 19.1 899 21.5 19,091 470
July 50,966 16.9 1,160 17.5 23,609 507
August 47,455 17.9 1,058 18.5 24,222 490
September 45,374 19.2 969 26.5 24,114 388
October 52,002 16.8 1,219 25.3 28,602 427
November 45,601 15.6 1,138 19.3 24,988 518
December 41,880 16.1 1,137 20.8 22,309 447
Annual
Total
Annual
Avg
12,735 536,850
16.8 19.9
3,087 5,471
NOTES: ' -- ' indicates Plant Offline
- Sodium bisulfite consumption (kg) at 38% by weight (solution delivered to sites at a concentration of
38.0%)

5.1 Waste Stream Volumes (ML)
2017
Clarifier
Blowdown
Clarifier
Washdown
Backwash
Water
Filter to
Waste
Bypass Plant Total Clarifier
Blowdown
Clarifier
Washdown
Backwash
Water
Filter to
Waste
Bypass LLP Flush HLP
Cooling
Plant Total De-chlorinated
Waste Flow to
Outfall
Rossdale E.L. Smith
Month
January 144 255 141 25 308 470 362 24 0.6 23 1,174565 1,187----
February 186 45 131 77 18 289 369 296 110 0.3 24 1,071456 1,088--
March 169 129 92 49 321 312 269 15 0.6 27 911440 946----
April 317 78 68 46 261 335 336 43 0.9 24 1,010509 1,000----
May 194 100 53 8.3 296 16 353 245 77 0.7 29 988356 1,016--
June 235 86 48 30 317 16 309 224 22 0.8 34 899398 922--
July 274 123 110 8.0 348 411 332 60 0.7 38 1,160514 1,190----
August 250 144 103 17 309 370 334 38 0.6 32 1,058514 1,083----
September 181 32 102 99 12 295 13 394 233 34 0.6 33 969427 1,003
October 100 126 140 33 311 445 367 81 0.5 28 1,219400 1,233----
November 195 124 112 30 352 422 248 121 0.3 25 1,138461 1,168----
December 169 146 75 17 366 341 150 37 0.2 21 1,137406 916----
2,413 77 1,544 1,117 295 3,775 44 4,530 3,395 662 7 340 12,735 5,446 12,753Annual
Total
NOTES: - Clarifier washdown volume(s) estimated for clarifier cleaning
- LLP flush, HLP cooling and chlorinated waste flow to outfall are not applicable to the Rossdale WTP
- De-chlorinated waste flow to outfall is the estimated chlorinated waste flow to outfall for dechlorination
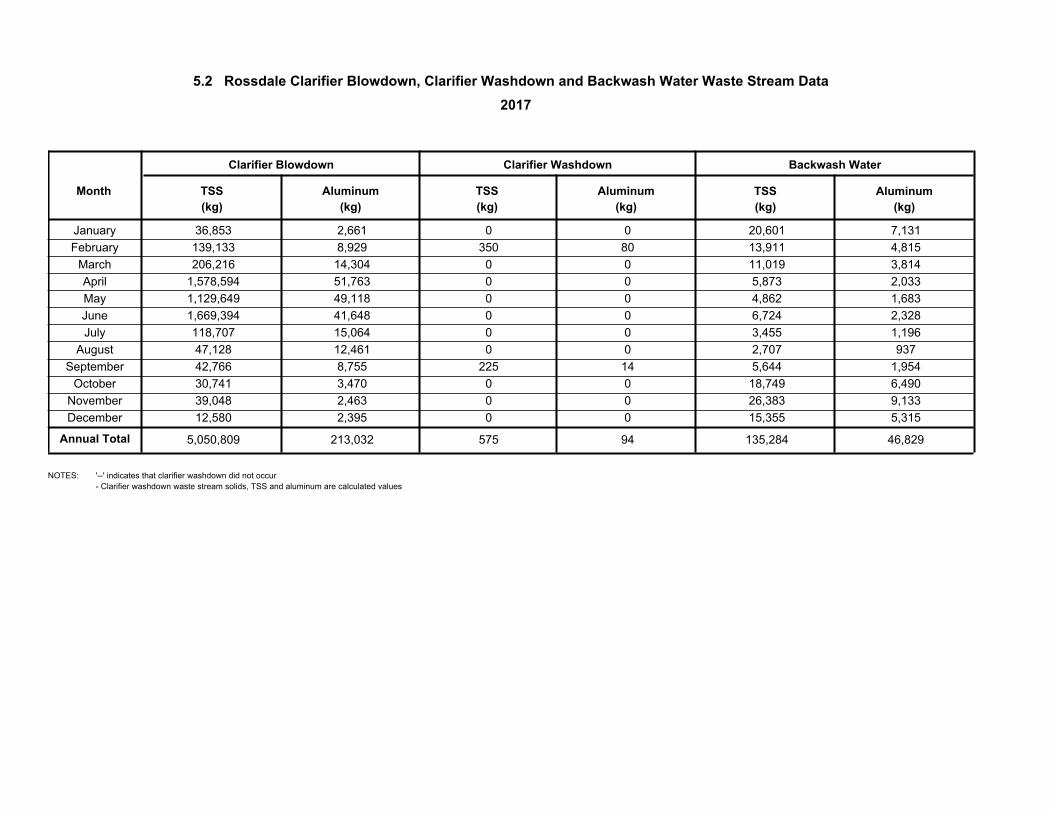
Month
5.2 Rossdale Clarifier Blowdown, Clarifier Washdown and Backwash Water Waste Stream Data
TSS
(kg)
Aluminum
(kg)
2017
Clarifier Blowdown Backwash WaterClarifier Washdown
Aluminum
(kg)
TSS
(kg)
TSS
(kg)
Aluminum
(kg)
January 36,853 2,661 0 0 20,601 7,131
February 139,133 8,929 350 80 13,911 4,815
March 206,216 14,304 0 0 11,019 3,814
April 1,578,594 51,763 0 0 5,873 2,033
May 1,129,649 49,118 0 0 4,862 1,683
June 1,669,394 41,648 0 0 6,724 2,328
July 118,707 15,064 0 0 3,455 1,196
August 47,128 12,461 0 0 2,707 937
September 42,766 8,755 225 14 5,644 1,954
October 30,741 3,470 0 0 18,749 6,490
November 39,048 2,463 0 0 26,383 9,133
December 12,580 2,395 0 0 15,355 5,315
Annual Total 5,050,809 213,032 575 94 135,284 46,829
NOTES: '--' indicates that clarifier washdown did not occur
- Clarifier washdown waste stream solids, TSS and aluminum are calculated values
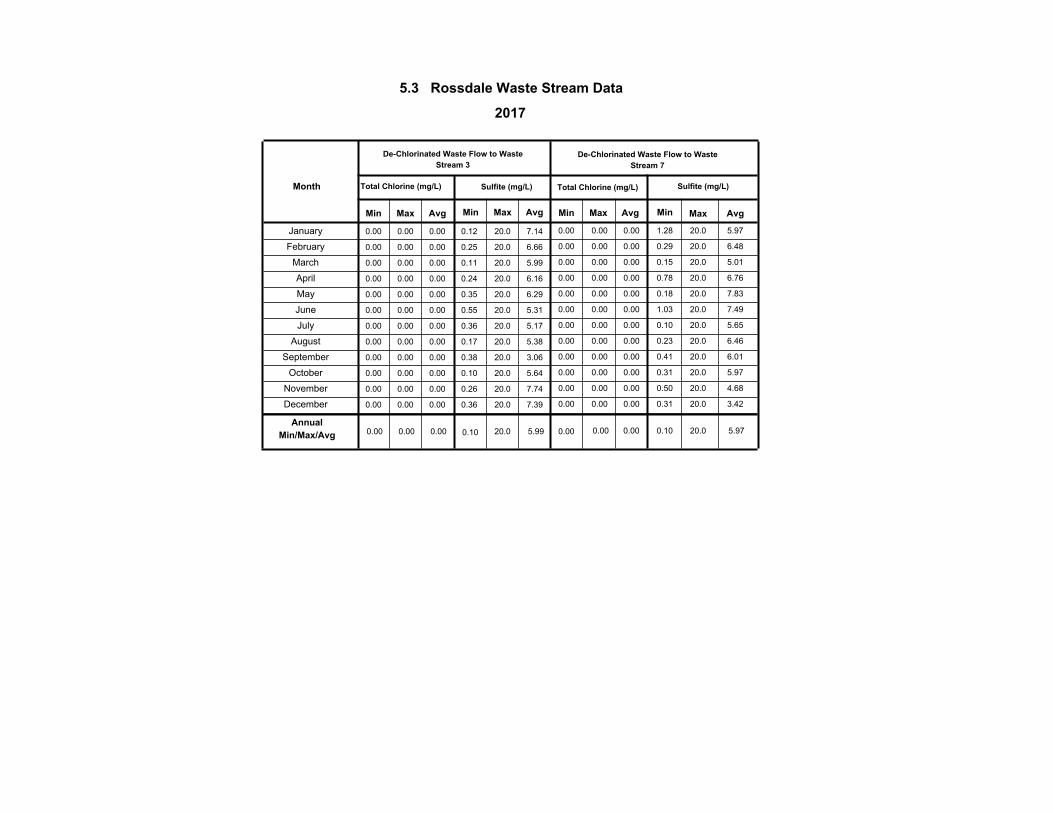
Month
5.3 Rossdale Waste Stream Data
2017
Total Chlorine (mg/L)
Min Max Avg Min Max Avg
Total Chlorine (mg/L)
Min Max Avg Min Max Avg
Sulfite (mg/L)
De-Chlorinated Waste Flow to Waste
Stream 3
De-Chlorinated Waste Flow to Waste
Stream 7
Sulfite (mg/L)
January 0.00 0.00 0.00 0.000.00 0.007.140.12 20.0 20.0 5.971.28
February 0.00 0.00 0.00 0.000.00 0.006.660.25 20.0 20.0 6.480.29
March 0.00 0.00 0.00 0.000.00 0.005.990.11 20.0 20.0 5.010.15
April 0.00 0.00 0.00 0.000.00 0.006.160.24 20.0 20.0 6.760.78
May 0.00 0.00 0.00 0.000.00 0.006.290.35 20.0 20.0 7.830.18
June 0.00 0.00 0.00 0.000.00 0.005.310.55 20.0 20.0 7.491.03
July 0.00 0.00 0.00 0.000.00 0.005.170.36 20.0 20.0 5.650.10
August 0.00 0.00 0.00 0.000.00 0.005.380.17 20.0 20.0 6.460.23
September 0.00 0.00 0.00 0.000.00 0.003.060.38 20.0 20.0 6.010.41
October 0.00 0.00 0.00 0.000.00 0.005.640.10 20.0 20.0 5.970.31
November 0.00 0.00 0.00 0.000.00 0.007.740.26 20.0 20.0 4.680.50
December 0.00 0.00 0.00 0.000.00 0.007.390.36 20.0 20.0 3.420.31
Annual
Min/Max/Avg 0.00 0.00 0.00 0.00 0.00 5.990.10 20.0 0.10 5.9720.00.00

Month
5.4 E.L. Smith Clarifier Blowdown, Clarifier Washdown and Backwash Water Waste Stream Data
TSS
(kg)
Aluminum
(kg)
2017
Clarifier Blowdown Backwash WaterClarifier Washdown
Aluminum
(kg)
TSS
(kg)
TSS
(kg)
Aluminum
(kg)
January 75,575 6,963 0 0 33,246 11,508
February 207,210 16,675 0 0 31,179 10,793
March 350,084 32,064 0 0 14,650 5,071
April 2,271,607 98,929 0 0 22,474 7,779
May 1,865,462 85,140 0 0 19,235 6,658
June 2,952,365 88,310 0 0 34,455 11,927
July 304,800 34,662 0 0 24,030 8,318
August 133,218 21,147 0 0 4,423 1,531
September 132,737 22,830 0 0 4,463 1,545
October 101,758 14,427 0 0 19,125 6,620
November 88,314 8,180 0 0 29,153 10,091
December 37,699 3,371 0 0 17,563 6,080
Annual Total 8,520,829 432,699 0 0 253,996 87,922
NOTES: '--' indicates that clarifier wash did not occur
- Clarifier washdown waste stream solids, TSS and aluminum are calculated values

Month
5.5 E.L. Smith Waste Stream Data
2017
Min Max Avg
pH
Min Max Avg Min Max Avg
Sulphite (mg/L) Total Chlorine (mg/L)
De-chlorinated Waste Flow to Outfall
January 7.46 8.270.000.002.502.50 0.002.50 7.86
February 7.17 8.120.000.002.501.13 0.002.50 7.84
March 6.81 7.940.000.002.502.50 0.002.50 7.66
April 6.53 7.480.000.002.502.50 0.002.50 7.01
May 6.59 7.710.000.002.502.48 0.002.50 7.18
June 6.50 8.390.000.002.502.49 0.002.50 7.30
July 7.52 8.100.000.002.502.50 0.002.50 7.81
August 7.60 8.220.000.007.600.63 0.002.57 7.89
September 6.58 8.090.000.002.502.50 0.002.50 7.54
October 6.65 7.970.000.002.502.50 0.002.50 7.65
November 6.87 8.100.000.004.390.83 0.002.50 7.77
December 6.76 8.160.000.002.502.50 0.002.50 7.89
Annual
Min/Max/Avg0.002.517.600.63 0.000.00 7.6 8.4 6.5

6.0 Reservoir Chlorine Residual (mg/L) - Part 1
2017
Day Min
Reservoir
Max Avg
OrmsbyPapaschase 1 Clareview Discharge
AvgMaxMin AvgMaxMin Min Max Avg Min Max Avg
Millwoods Discharge Kaskitayo
1.65 1.42 1.29 2.04 2.17 1.94 2.02 1.57 1.77Jan 1.36 2.19 2.06 1.56 2.26 2.11
1.70 1.58 1.18 2.05 2.12 1.95 1.98 1.43 1.81Feb 1.31 2.16 2.05 1.13 2.20 2.10
1.68 1.32 1.31 2.10 2.08 1.93 1.94 1.46 1.75Mar 1.27 2.12 1.99 1.03 2.19 2.05
1.20 1.29 2.07 2.09 1.89 1.61Apr 1.23 2.23 1.91 1.55 2.15 1.99-- -- --
1.46 1.07 1.24 1.84 1.95 1.76 1.77 1.44 1.57May 1.22 2.07 1.88 1.38 2.04 1.90
1.00 1.36 1.02 1.77 2.15 1.89 1.65 1.34 1.55Jun 1.17 2.06 1.85 1.33 2.02 1.83
1.43 1.00 1.00 1.68 2.00 1.70 1.66 1.27 1.46Jul 1.10 2.01 1.80 1.58 1.91 1.80
1.43 1.02 1.00 1.65 2.14 1.78 1.65 1.26 1.45Aug 1.13 2.04 1.80 1.50 1.99 1.79
1.18 1.00 1.07 1.73 2.06 1.83 1.71 1.37 1.43Sep 1.17 2.02 1.84 1.48 1.98 1.82
1.44 1.10 1.18 1.74 2.11 1.78 1.76 1.41 1.57Oct 1.16 2.00 1.88 1.31 1.88 1.70
1.48 1.39 1.33 1.81 2.04 1.84 1.79 1.59 1.68Nov 1.23 1.97 1.89 ------
1.66 1.53 1.41 1.80 2.21 1.92 1.80 1.65 1.72Dec 1.23 1.98 1.91 ------
Min/Max/
Avg
Monthly
1.45 1.95 1.00 1.79 2.21 1.00 1.00 2.10 1.60 1.10 2.23 1.91 1.03 2.26 1.92
NOTES: '--' Indication Analyzer Offline
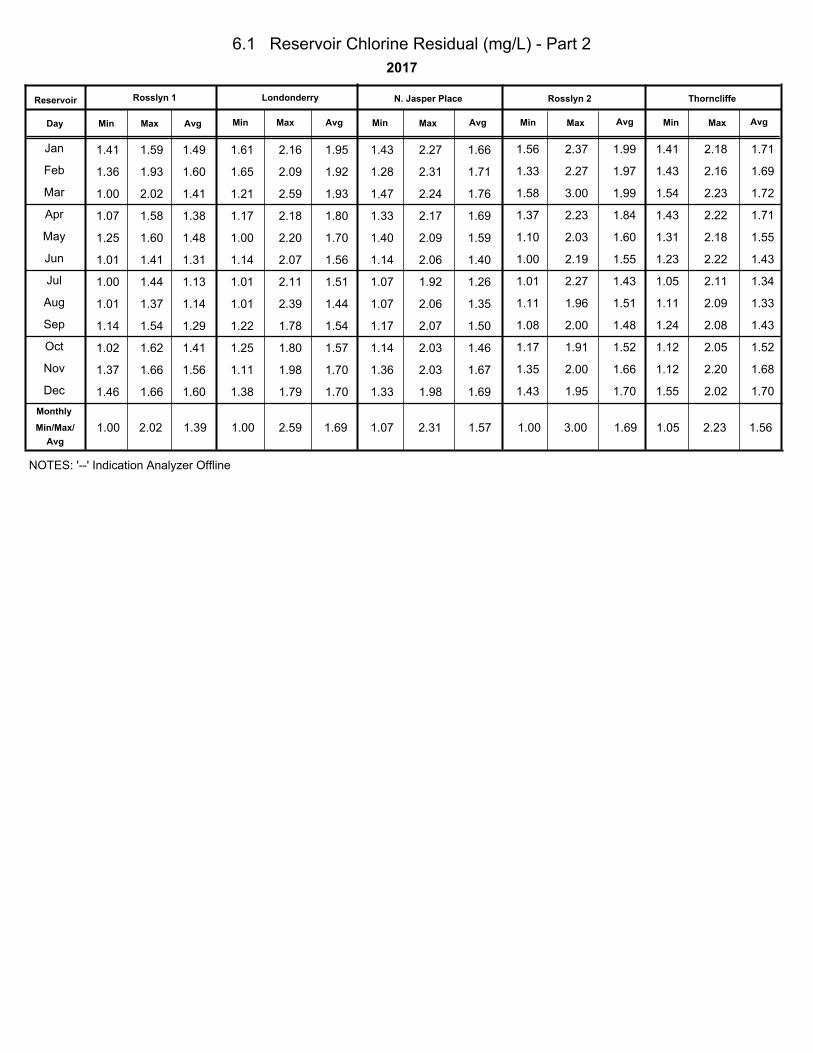
6.1 Reservoir Chlorine Residual (mg/L) - Part 2
2017
Day Min
Reservoir
Max Avg
LondonderryRosslyn 1 N. Jasper Place
AvgMaxMin AvgMaxMin Min Max Avg Min Max Avg
Rosslyn 2 Thorncliffe
1.61 1.43 1.41 2.27 2.16 1.59 1.95 1.49 1.66Jan 1.56 2.37 1.99 1.41 2.18 1.71
1.65 1.28 1.36 2.31 2.09 1.93 1.92 1.60 1.71Feb 1.33 2.27 1.97 1.43 2.16 1.69
1.21 1.47 1.00 2.24 2.59 2.02 1.93 1.41 1.76Mar 1.58 3.00 1.99 1.54 2.23 1.72
1.17 1.33 1.07 2.17 2.18 1.58 1.80 1.38 1.69Apr 1.37 2.23 1.84 1.43 2.22 1.71
1.00 1.40 1.25 2.09 2.20 1.60 1.70 1.48 1.59May 1.10 2.03 1.60 1.31 2.18 1.55
1.14 1.14 1.01 2.06 2.07 1.41 1.56 1.31 1.40Jun 1.00 2.19 1.55 1.23 2.22 1.43
1.01 1.07 1.00 1.92 2.11 1.44 1.51 1.13 1.26Jul 1.01 2.27 1.43 1.05 2.11 1.34
1.01 1.07 1.01 2.06 2.39 1.37 1.44 1.14 1.35Aug 1.11 1.96 1.51 1.11 2.09 1.33
1.22 1.17 1.14 2.07 1.78 1.54 1.54 1.29 1.50Sep 1.08 2.00 1.48 1.24 2.08 1.43
1.25 1.14 1.02 2.03 1.80 1.62 1.57 1.41 1.46Oct 1.17 1.91 1.52 1.12 2.05 1.52
1.11 1.36 1.37 2.03 1.98 1.66 1.70 1.56 1.67Nov 1.35 2.00 1.66 1.12 2.20 1.68
1.38 1.33 1.46 1.98 1.79 1.66 1.70 1.60 1.69Dec 1.43 1.95 1.70 1.55 2.02 1.70
Min/Max/
Avg
Monthly
1.39 2.02 1.00 1.69 2.59 1.00 1.07 2.31 1.57 1.00 3.00 1.69 1.05 2.23 1.56
NOTES: '--' Indication Analyzer Offline