editorial board members of east african journal of...
TRANSCRIPT


Editorial Board Members of East African Journal of Veterinary and Animal
Sciences (EAJVAS)
Biannual Peer Reviewed Journal Hosted by College of Veterinary Medicine, Haramaya
University
Editor-in-chief
Dr. Mengistu Urge (PhD), School of Animal and Range Sciences, College of Agriculture and Environmental
Sciences, Haramaya University, P. O. Box 138, Dire Dawa, Ethiopia; Email: [email protected].
Associate Editor
Dr. Berhanu Sibhat (DVM, MSc, Associate Professor), College of Veterinary Medicine, Haramaya
University, P. O. Box 138, Dire Dawa, Ethiopia, Email: [email protected]
Editorial Manager
Dr. Tesfaheywet Zeryehun (DVM, MSc, Associate Professor), College of Veterinary Medicine, Haramaya
University, P. O. Box 301, Dire Dawa, Ethiopia, Email: [email protected]
Technical Editors:
Dr. Berhanu Tilahun, Haramaya University, Ethiopia
Dr. Mohammed Kurtu, Haramaya University, Ethiopia
Dr. Negassi Amha, Haramaya University, Ethiopia
Dr. Amha Kebede, Haramaya University, Ethiopia
Dr. Nega Assefa, Haramaya University, Ethiopia
Dr. Tessema Zewdu, Haramaya University, Ethiopia
International Advisory Board:
Prof. Chemeda Fininsa, Haramaya University, Ethiopia
Dr. Jemal Yusuf, Haramaya University, Ethiopia
Prof. Nigussie Dechassa, Haramaya University, Ethiopia
Prof. Gobena Ameni, Aklilu Lemma Institute of Pathobiology, Addis Ababa University, Ethiopia
Prof. Melaku Tefera, Lilongwe University, Malawi
Prof. Yemane Berhane, Addis Ababa University, Addis Ababa, Ethiopia
Dr. Getachew Animut, Agricultural Transformation Agency, Ethiopia
Prof. Wondwossen Gebreyes, Ohio State University, USA
East African Journal of Veterinary and Animal Sciences
(EAJVAS)
Editorial Office
College of Veterinary Medicine
Haramaya University
P. O. Box 138
Dire Dawa, Ethiopia
Tel. +251-25-5530446
Fax. +251-25-5530325/31
Email: [email protected]


East African Journal of Veterinary and Animal Sciences
(EAJVAS)
Volume 1, No. 1, 2017
Research Articles
Fethu Lemma, Sisay Alemu, and Sisay Haile
Prevalence of Bovine Trypanosomosis in Abeshige District of Gurage Zone, South Western
Ethiopia
1
Agari Feyisa, Anwar Hassen, Nateneal Tamerat, and Ashebr Abrha
Isolation and Identification of Streptococcus Uberis in Lactating Cows of Haramaya University
Dairy Farm
7
Walkite Furgasa, Negesse Mekonnen, and Anwar Hassen
Detection of Anthelmintic Resistance in Gastrointestinal Nematodes of Small Ruminants
in Haramaya University Farms
13
Mengistu Urge, Kassa Shawle, Getachew Animut, Tesfaheywet Zeryehun, and
Meskerem Adamu
Protective Efficacy of Lepidium sativum, Capsicum frutescens and their Mixtures against
Experimentally Induced Eimeria tenella Infection in Broiler Chickens
19
Efrem Gebrehawariat, Getachew Animut, Mengistu Urge, and Yoseph Mekasha
Husbandry Practices, Farmers’ Perception and Constraints of Pig Farming in Bishoftu and
Holeta Areas, Central Ethiopia
31
Jelalu Kemal, Mathewos Israel, and Sisay Alemu
Prevalence and Species of Ticks on Cattle in Borecha District, Southern Ethiopia
41
Sisay Alemu, Fethu Lemma, Jelalu Kemal, Ashebr Abraha, and Tahir Adem
Prevalence and Characterization of Hydatid Cyst in Cattle at Halaba Kulitto Municipal
Abattoir, South Ethiopia
47


East African Journal of Veterinary and Animal Sciences (2017) Volume 1(1): 1-6
___________________________________________ *Corresponding Author. E-mail: [email protected] ©Haramaya University, 2017
Prevalence of Bovine Trypanosomosis in Abeshige District of Gurage Zone, South Western Ethiopia
Fethu Lemma*, Sisay Alemu, and Sisay Haile
College of Veterinary Medicine, Haramaya University, P. O. Box 138, Dire Dawa, Ethiopia
Abstract: A cross sectional study was conducted from November 2014 to May 2015 in Abeshige
district of Gurage Zone in Southwestern Ethiopia with the objectives of estimating the prevalence
and identifying the species of trypanosomes. A total of 498 blood samples were collected and tested
using conventional thin smear and buffy coat techniques. The result revealed an overall prevalence
rate of 12.4% trypanosomosis. There were no significant difference in prevalence between animals
of different location, age, sex and breed (p>0.05). The mean PCV of parasitemic animals (24.5%) was
significantly lower than that of aparasitemic animals (29%) (p<0.05). The most commonly
encountered trypanosome species among parasitemic cattle was T. congolense (67.7%) followed by T.
vivax (29%) and mixed (T. congolense and T. vivax) (2.3%) infections. In conclusion, the result indicated
trypanosomosis to be a major livestock production challenge in the study area that warrant control
strategies.
Keywords: Bovine trypanosomosis; Buffy coat; Thin smear; PCV
Introduction Bovine trypanosomosis causes a significant loss in
animal production and greatly hampers agricultural
development in Africa (Uilenberg, 1998). The existing
threat of Africa animal trypanosomosis ranked among
the top priority cattle diseases on sustainable livestock
production and mixed farming system which present a
major constraint in the development of the African
continent (Abenga et al., 2002; Samdi et al., 2010a). These
constitute a major threat to achieving food security in
several parts of Sub-Saharan Africa and Ethiopia (Samdi
et al., 2010b). In Ethiopia, animal trypanosomosis is one
of the most important diseases limiting livestock
productivity and agricultural development due to its high
prevalence in the most arable and fertile land of
Southwestern and Northwestern part of the country
following the greater river basins of Abay, Omo, Ghibe
and Baro (Shimels et al., 2005). Over 6 million heads of
cattle and equivalent number of other livestock species
are at risk of contracting the diseases. More than 20,000
heads die per annum and annual loss attributed to the
diseases is estimated to be over US$236 million. Loss
due to reduced meat and milk production and draft
power is not included in this figure (OAU, 2002).
In Ethiopia, the most important trypanosome species
affecting livestock are T. congolense, T. vivax and T. brucei
in cattle, sheep and goats, T. evansi in camels and T.
equiperdem in horses (Getachew, 2005). Although
trypanosomosis is considered as an important disease of
cattle in the region (Terzu, 2004) no study has yet been
carried out on the epidemiology, prevalence and
economic significance of bovine trypanosomosis in
Abeshige district of Gurage Zone, Ethiopia. Therefore,
the objective of this study was to estimate the prevalence
of bovine trypanosomosis and identify species of
trypanosomes affecting cattle in selected Kebeles of the
study area.
Materials and Methods Description of the Study Area
Abeshige district is located 165 kms South of Addis
Ababa in Gurage Zone of Southern Nations
Nationalities and Peoples Regional State, Ethiopia. The
altitude of the study area ranges from 1001-2000 masl. It
is located at latitude of 8° 20′ 0″ N, and longitude of 37°
40′ 0″E longitude. It is characterized by minimum and
maximum temperature ranging from 15.5-25oC and the
mean annual rainfall of 801-1400mm.The farming
system is characterized by a mixed crop-livestock
production system with the estimated population of
48,455 cattle, 2,615 sheep, 9,083 goats, 7,702 equine and
44,381 poultry (ADFDO, 2006). The district is divided
into 26 rural kebeles. Three Kebeles were selected for the
purpose of the study by simple random sampling
technique.
Study Animals
The study was conducted on cattle reared under
extensive production system with consideration of
different risk factors like age, sex and breed. The study

Fethu et al. East African Journal of Veterinary and Animal Sciences Volume 1(1): 1-6
2
animals were classified into different age groups
according to the descriptions of Nicholson and
Butterwarth (1986). Animals between one and three year
of age were considered as young and those above three
years as adults.
Study Design A cross-sectional study was conducted from November 2014 to June 2015 to estimate the prevalence of bovine trypanosomosis in selected rural kebeles in the study areas.
Sampling Method and Sample Size Determination
Animals were sampled from the three rural kebeles based
on proportional bases. At the rural kebele level, animals
were selected by simple random sampling using lottery
method. The number of cattle sampled from a particular
herd in a given rural kebele depends on proportional
weighting. The sample size was determined using the
equations given by Thrusfield (2007) whereby:
2
2 .
e
PQZn
Where, Q = 1-P
Z = 1.96
e = precision error (0.05); P = expected
prevalence of about 50%.
Accordingly, a total of 384 animals were randomly
selected. However, to avoid loss of sample units and to
increase precision, additional 114 samples were
collected. Thus, the total sample size was 498.
Parasitological Diagnosis
Blood samples were collected into two heparinized
haematocrit capillary tubes from each animal from ear
vein punctured by sterile lancet. The tubes were filled
with blood to3/4 of their heights and sealed at one end
with crystal sealant. The capillary tubes were then loaded
on the microhematocrit centrifuge machine
symmetrically and centrifuged at 1200 rpm for 5
minutes. Packed cell volume (PCV) was determined
using hematocrit reader. Animals with PCV <24% were
considered as anemic (Murray et al., 1983). After the
PCV was read, capillary tubes were broken 1mm below
the buffy coat and the content were transferred on
microscopic slides, mixed and covered with a 22x22 mm
cover slip. Then it was examined using ground buffy
coat technique to detect the presence of the parasites
(Paris et al., 1982). For preparation of the thin smear, first
the slide was polished with dry and clean cloth. The
blood in microhematocrit capillary tube was expressed
approximately 20 mm away from one end on the slide.
The spreader (another slide) was placed on a head of the
drop of the blood approximately at an angle of 45°. The
spreader slide was drawn back to make contact with
blood. Then, the blood was allowed to run to both ends
of the spreader slide and spread the blood along the slide
with steady motion. The slide was dried by waving it in
the air and fixed for 5 minute with methyl alcohol. The
smear was flooded with Giemsa staining solution for 45
minute. Excess stain was drained and washed off by
using distilled water and allowed to dry for examination.
Microscopic examination was made under oil emersion
objective (Losos, 1986; Losos and Kede, 1972).
Data Processing and Analysis The data collected were entered and managed in
Microsoft excel. Coded data was transferred to Stata
version 11.0 statistical software (STATA, 4905 Lakeway
Drive, College Station, Texas, USA) program for
analysis. The prevalence of the disease was determined
by dividing the number of positive samples by the total
number of samples tested for the disease. Chi-square test
was used to assess if there was a statistically significant
difference in infection among explanatory variables. The
mean PCV of parasitemic and aparasitemic animals were
compared using 𝑡-test to assess whether the means of
two groups are statistically different from each other. P-
value less than 0.05 was considered significant.
Results Trypanosome Prevalence and Species
The overall prevalence recorded was 12.4% [CI: 10.7-
14.1] (n=62). No statistically significant difference was
observed between the three rural kebeles (p>0.05) (Table
1).
Table 1. The prevalence of trypanosomosis in the study area
Rural kebele’s
No. of cattle examined
Total Positive
Trypanosome species Prevalence (%)
X2
p-value
T. c1
T. v2
Mixed (T.c/T.v)3
Nachakulit 166 24 15 (62.5) 7 (29) 0 14.4 Kulit-2 166 24 14 (58.3) 5 (20.8) 2 (8.3) 14.4 2.183 0.336 Hudade-4 166 19 13 (68.4) 6 (13.6) 0 11.4 Total 498 62 42 (67.7) 18 (29) 2 (3) 12.4
T.c1= Trypanosoma congolense, T.v2=Trypanosoma vivax, T.c and T.v3 = mixed.

Fethu et al. Prevalence of bovine trypanosomosis in southwestern Ethiopia
3
Most of the infections in trypanosome positive animals
were due to Trypanosoma congolense followed by
Trypanosoma vivax and the rest were mixed infections of
the two (Table 1). Relatively numerically higher
prevalence was recorded among male animals than that
of females, but the difference between sex groups was
not statistically significant (p>0.05) (Table 2). The
infection rate in adult cattle was slightly higher than the
young but it was not significant (p>0.05).
Table 2. Prevalence of trypanosome infection among age, sex and breed
Risk factor Number of cattle Examined
No. of Positive samples
Prevalence (%)
χ2
p-value
Sex Female 264 25 9.4 5.35 0.461 Male 234 37 15.8 Age Young (1-3years) 245 27 11 Adult (>3 years) 247 35 14.2 2.183 0.336 Breed Local 423 51 12 1.241 0.987 Crossbreed 75 11 14.6
Hematological Findings Among a total of 498 animals examined, 12.2% of the
animals were anemic (Table 3). There was strong
statistical difference between the mean PCV of
parasitemic and aparasitaemic animal (p<0.01).
Table 3. Mean PCV of parasitemic and aparasitemic animals
Conditions No. Examined
No. examined PCV (%) >24
No. examined PCV (%) <24
Mean PCV (%)
t- test p- value
Parasitemic 62 34 (54.8) 28 (45.2) 24.5 13.342 0.003 Aparasitemic 436 403 (92.4) 33 (7.5) 29 Total 498 437 (87.7) 61 (12.2) 26.25
Discussion The overall prevalence indicated the disease to be an
important constraint in livestock production in the study
area. The prevalence value of the present study is in
agreement with the 12.4% prevalence in Metekel and
Awi Zones in northwestern Ethiopia (Solomon and
Fitta, 2010) and 12.41% in Hawa Gelan in Oromia
Region (Tewodros et al., 2012). However, the present
prevalence is higher as compared to the studies
conducted previously in different part of Ethiopia
(Basaznew et al., 2012; Teka et al., 2012; Zelalem et al.,
2014; Amanuel et al., 2015; Gamechu et al., 2015; Reta et
al., 2015). Prevalence of 9.1% by Abenga et al. (2001) and
2.2% by Samdi et al. (2011) from Nigeria, Kaduna state
central abattoir was also reported. In contrast to the
present result, higher prevalence was previously
reported in different parts of Ethiopia (Shimelis et al.,
2001; Dawud and Molalegne, 2011; Abraham and
Tesfaheywet, 2012; Thomas et al., 2006). Similarly,
higher prevalence of 46.8% reported by Sam-Wobo1 et
al. (2010) and 31.62% by Ayodele et al. (2013) also were
reported from Ogun and Jos States of Nigeria,
respectively. The differences in the prevalence of the
disease reported from different regions might be due to
the variability in agro-ecology of the study areas and
difference in season during data collection (Thomas et
al., 2006). The identified Trypanosoma spp. was T.
congolense, T. vivax and mixed infections. This findings
were similar with results reported from different areas in
Ethiopia (Abraham and Tesfahiwot, 2012; Wagari et al.,
2012; Gamechu et al., 2015). Prevalence rate of 33.33%
for T. congolense (Tewodros et al., 2012), 28.89% for T.
vivax (Gamechu et al., 2015) and 2.27% (Reta et al., 2015)
for mixed (T. congolense and T. vivax) reported from other
parts of the country also confirms the importance of this
parasite in hampering animal productivity. The
differences in prevalence rate among the studies might
be due to the fact that T.congolense requires an absolute
presence of the biological vector (Glossina spp.), whereas
T. vivax is more readily transmitted mechanically by
biting flies than tsetse flies (Langridge, 1976) and also T.
congolense is mainly confined to the blood, while T. vivax
and T. brucei can also invade the tissues (Hoare, 1972). T.
vivax is highly susceptible to treatment while the
problems of drug resistance are higher in T. congolense
(Leak, 1999).
The hematological findings showed that mean value in
parasitemic animals was much lower than the

Fethu et al. East African Journal of Veterinary and Animal Sciences Volume 1(1): 1-6
4
aparasitemic animals (p<0.05). This finding is in
agreement with the previous result reported by Cherinet
et al. (2006), Abebayehu et al. (2011) and Abraham and
Tesfaheywet (2012). The parasitemic cattle with mean
PCV <24% in this study could be due to direct impact
of the disease since trypanosomes destroy RBC
membranes resulting in early removal of the defective
cells by the reticulo-endothelial system of the animals
and therefore result in anemia (Murray et al., 1977;
Afework et al., 2000).
Absence of difference in prevalence of the infection
between sex groups is in agreement with that reported
previously in the country (Abebayehu et al., 2011). This
result is also similar with previous results of Terzu and
Getachew (2008) and Teka et al. (2012) who obtained no
significant difference in susceptibility between the two
sexes. This might be due to similar exposure of both
sexs to the flies in grazing areas (Muturi, 1999; Terzu,
2004; Nega et al., 2004). Similarly, age wise prevalence
difference observed was also insignificant indicating that
both young and adult animals are equally exposed to the
fly in the field. Tethered young animals were also
infected by the infection showing the flies are also found
around homestead, but with low density relative to the
grazing area (Fimmen et al., 1999). On the other hand,
the prevalence of the disease in local breeds was slightly
lower than the in crossbreeds, although not statistically
not significant (p>0.05). This might be due to the fact
that both local and cross breed cattle are grazing
together and have probability of equal exposure
(Quadeer et al., 2008).
Conclusion and Recommendations
In the present study, two species of trypanosomes were
identified. T. congolense was the predominant species in
the area followed by T. vivax and mixed infection (T.
congolense and T. vivax). The 12.4% prevalence of bovine
trypanosomosis suggests that the disease remains to be
the major threat to livestock production. Therefore,
appropriate control through different chemotherapeutic
and chemoprophylactic drugs as well as tsetse control
programs should be designed in order to reduce the
impact of trypanosomosis in the study area. An active
and continuous surveillance is also needed for better
understanding of the epidemiology of the
trypanosomosis. Further study should also be conducted
in order to identify potential tsetse fly species in the
study area.
Acknowledgments The authors would like to thank the owners of the animals for allowing taking the blood sample and
developmental agents for their cooperation throughout sampling time.
Conflict of Interests The authors declare that they have no competing interests.
References Abebayehu Tadesse, Eset Hadgu, Brhanu Mekbib,
Rahmeto Abebe & Solomon Mekuria (2011). Mechanically transmitted bovine trypanosomosis in Tselemty Woreda, Western Tigray, and Northern Ethiopia. Agricultural Journal, 6: 10-13.
Abenga, J. N., Enwezor, F. N. C., Lawani, F. A. G., Osue, H. O. & Ikemereh, E. C. D. (2001). Trypanosome Prevalence in Cattle in Lere Area in Kaduna State, North Central Nigeria. International Journal of Animal Veterinary Advances, 2(2): 47-50.
Abenga, J. N., Ewenzer, F. N. C., Lawani, F. A. G., Ezebuiro, C., Sule, J. & David K. M. (2002). Prevalence of trypanosomiasis in trade cattle at slaughter in Kaduna state, Nigeria. Journal of parasitology, 23: 107-110.
Abeshige District Finance and Development Office (ADFDO) (2006). Abeshge district finance and Economic Development Office, Welkite Ethiopia.
Abraham Zekarias and Tesfaheywet Zeryehun (2012). Prevalence of Bovine Trypanosomosis in Selected District of Arba Minch, SNNPR, Southern Ethiopia. Global Veterinaria, 8, 168-173.
Afework Yohaness, P.H. Clausen, Getachew Abebe, Tilahun Getachew & Mehlitz D. (2000). A prevalence of multiple drug-resistant T. congolense population in village cattle of Mekele district, North-Wet Ethiopia. Acta Tropica, 76: 231-138.
Amanuel Dawit, Tadele Alemayehu, Kassahun Bekele, Tilahun Zenebe, Girma Kebede and Tadele Kabeta (2015). Prevalence of Bovine Trypanosomosis, and it’s Associated Risk Factors in Abaya District, Borena Zone, Ethiopia. Nature and Science, 13: 64-70.
Ayodele, O.M., Akinyemi, F., Charles, D., Kim, P., Michae, V. (2013). A longitudinal survey of African animal trypanosomiasis in domestic cattle on the Jos Plateau, Nigeria: prevalence, distribution and risk factors. Parasites and Vectors, 6: 239.
Basaznew Bogale., Kebede Wodajo and Mersha Chanie (2012). Occurrence and Identification of Bovine Trypanosomosis in Genji District, Western Ethiopia. Acta Parasitologica Globalis, 3 (3).
Dawud Ali & Molalegne Bitew (2011). Epidemiological study of Bovine Trypanosmosis in Mao- Komo Special District, Benishangul-Gumuz Regional State Western Ethiopia. Global Veterinaria, 6: 402-408.
Fimmen, H.O., Mehlitz, D., Horchiner, F. & Korb, E. (1999). Colostral antibodies and Trypanosoma congolense infection in calves. Trypanotolerance research and application. GTZ, No.116, Germany, pp: 173-187.
Gamechu Feyisa, Aynalem Mandefro, Birhanu Hailu, Gamechu Chala & Gezahegne Alemayehu (2015).

Fethu et al. Prevalence of bovine trypanosomosis in southwestern Ethiopia
5
Epidemiological Status and Vector Identification of Bovine Trypanosomiosis in Didessa District of Oromia Regional State, Ethiopia. International Journal of Nutrition and Food Science, 4(3): 373-380.
Getachew Abebe (2005). Trypanosomosis in Ethiopia, Addis Ababa University, Faculty of Veterinary Medicine, DebreZeit, pp: 18-20.
Hoare, C. A. (1972). The trypanosomiasis of mammals, Oxford: 1st Ed. London, UK, Blackwell Scientific. Publications, pp: 749.
Langridge, W. P. (1976). A tsetse and trypanosomosis survey in Ethiopia, Ministry of overseas development, United Kingdom.
Leak, S. G. A. (1999). Tsetse Biology and Ecology; their role in the epidemiology and control of trypanosommiasis.CAB International Wallingford (UK).
Losos, G. J. (1986). Infectious tropical diseases of domestic animals. Longman, UK, 186 p.
Losos, G. J. I. & Kede, B. O. (1972). Review of pathology of disease in domestic and laboratory animals caused by T. vivax, T. brucei, T. rhodesiense and T. gambiense. Journal of Veterinary Pathology, 9: 1-17.
Murray, M., Murray P. K. & McIntyre, W. I. M. (1977). An improved parasitological technique for the diagnosis of African trypanosomisis. Transaction of the Royal Society of Tropical Medicine and Hygiene, 71: 325-326.
Murray, M., Murray, P. K & McIntyre, W. I. M. (1983). An improved parasitological technique for the diagnosis of African trypanosomosis. Transactions of the Royal Society of Tropical Medicine and Hygiene, 71, 325-326.
Muturi, K. (1999). Epidemiology of bovine trypanosomosis in selected sites of the Southern Rift Valley of Ethiopia. Msc thesis, Addis Ababa University with Freie Universitants, Berlin.
Nega Tewolde, Getachew Abebe, Eilser, M., Dermott, M. C., Grierner, J., Afework, M., Kyule, M., Munstermann, S., Zessin K. H. & Clausen, P. H. (2004). Application of field methods to assess Isometamedium resistance of trypanosome in cattle in Western Ethiopia. Acta Tropica, 90: 163-170.
Nicholson, M. J. & Butterworth, M. H. (1986). A guide to condition scoring of zebu cattle. International Livestock Centre for Africa (ILCA).
Organinization of African Union (OAU) (2001). Trypanosomosis, Tsetse and Africa. The year book report (2001).
Paris, J., Murray, M. & Mcodimba, F. (1982). A comparative evaluation of the parasitological technique available for the diagnosis of Trypanosomosis in Cattle. Acta Tropica. 39: 1-11.
Quadeer, M.A, Danbirni, S, Usman, M, Akogun, O.B., Gundiri, M. A. & Bobbo, A. G. (2008). Prevalence of bovine trypanosomosis in Bassa Local Government Area, Plateau State, Nigeria. Nigerian Journal of Parasitology, 29: 136-13.
Reta Duguma, Senbeta Tasew, Abebe Olani, Delesa Damena, Dereje Alemu, Tesfaye Mulatu, Yoseph Alemayehu, Moti Yohaness, Merga Bekana, Antje H., Emmanuel, A., Vincent, D. & Luc, D. (2015). Spatial distribution of Glossina spp. and Trypanosoma spp. in south-western Ethiopia. Parasites and Vectors, 8: 1-10.
Samdi, S. M., Abenga, J. N., Attahir, A. & Wayo, B. M. (2010a). Constraints in the Control of African Trypanosomiasis: The Prevailing Factors in Curmin Kaduna. .Advanced International Journal of Animal Science and Veterinary, 2: 31- 36.
Samdi, S. M., Abenga, J. N., Attahir, A. & Wayo, B. M. (2010b). Impact of Trypanosomiasis on Food Security in Nigeria. Advanced International Journal of Animal Science and Veterinary, 2: 47- 50.
Samdi, S. M., Fajinmi, A. O., Kalejaye, J. O., Wayo, B., Haruna, M. K., Yarnap, J. E., Mshelia, W. P., Usman, A. O., Hamra, S. M., Jijitar, A., Ogunwole, R., Ovbagbedia, R. P. & Bizi, R. (2011). Prevalence of trypanosomosis in cattle at slaughter in Kaduna centeral abbatoir, Nigeria. Asian Journal of Animal Science, 5: 162-165.
Sam-Wobo1, S. O., Igenezoa, A. J., Idowu, O. A., Otesile, E. B., Ekpo, U. F. & Kehinde, O. O. (2010). Bovine trypanosomosis and its impact on cattle in derived savanna areas of Ogun State, Nigeria. Journal of Public Health and Epidemiology, 1: 43-47.
Shimelis Dagnachew, Aran K. & Getachew Abebe, (2005). Epidemiology of tsetse transmitted trypanosomosis in Abay (Blue Nile) basin of North West Ethiopia, In: Proceedings of the 28th meeting of the International Scientific Council for Trypanosomosis.
Shimelis Dagnachew, Aran K. S. & Getachew Abebe (2001). Epidemiology of bovine trypanosomosis in the Ghibe valley settlement area of Nono district, South West Ethiopia. Ethiopia Veterinary Association Journal, 12: 243.
Solomon Mekuria & Fitta Gadissa (2010). Survey on bovine trypanosomosis and its vector in Metekel and Awi zones of northwest Ethiopia. Acta Tropica, 117: 146-151.
Teka Wondowsen, Dechasa Terefe & Anteneh Wondimu (2012). Prevalence study of bovine trypanosomosis and tsetse density in selected villages of Arbaminch, Ethiopia. Journal of Veterinary Medicine and Animal Health, 4: 36-41.
Terzu Daya (2004). Seasonal Dynamics of Tsetse and Trypanosomosis in selected sites of Southern Nation, Nationalities and Peoples Regional State (SNNPRS), Ethiopia. Msc thesis, Addis Ababa University, Faculty of Veterinary Medicine, Debre Zeit, Ethiopia, pp: 1-180.
Terzu Daya and Getachew Abebe (2008). Seasonal Dynamics of Tsetse and Trypanosomosis in selected sites of Southern Nation, Nationalities and Peoples Regional State, Ethiopia. Ethiopian Veterinary Journal, 12: 77-92.

Fethu et al. East African Journal of Veterinary and Animal Sciences Volume 1(1): 1-6
6
Tewodros Fantahun, Mitiku Tekeba, Tadegegn Mitiku & Mersha Chanie (2012). Prevalence of Bovine Trypanosomosis and Distribution of Vectors in Hawa Gelan District, Oromia Region Ethiopia. Global Veterinaria, 9: 297-302.
Thomas Cherenet, Sani, R.A., Speybroeck, N., Panandam J.M., Nadzr, S. & Van den Bossche, P. (2006). A comparative longitudinal study of bovine trypanosomiasis in tsetse-free and tsetse-infested zones of the Amhara region, northwest Ethiopia. Veterinary Parasitology, 140: 251-258.
Thrusfield, M. (2007). Veterinary Epidemiology 3rd ed., Blackwell Scientific, London, pp: 225-228.
Uilenberg, G. (1998). A field Guide for diagnosis, treatment and prevention of African animal
trypanosomosis. Adapted from the original edition by Boyt. W. P. Food and Agriculture organization of United Nations (FAO), Rome, pp: 43-135.
Wagari Tafese, Achenef Melaku & Tewodros Fentahun (2012). Prevalence of bovine trypanosomosis and its vectors in two districts of East Wollega Zone, Ethiopia. Journal of Veterinary Research, 79(1) 4 pages. doi: 10.4102/ojvr.v79i1.385.
Zelalem Abera, Merga Fekadu, Tadele Kabeta, Girma Kebede and Tesfaye Mersha (2014). Prevalence of Bovine Trypanosomosis in BakoTibe District of West Shoa and Gobu Seyo Districts of West Wollega Zone, Ethiopia. European Journal of Biological Sciences, 6: 71-80.

East African Journal of Veterinary and Animal Sciences (2017) Volume 1 (1): 7-12
___________________________________________ *Corresponding Author. E-mail: [email protected] ©Haramaya University, 2017
Isolation and Identification of Streptococcus Uberis in Lactating Cows of Haramaya University Dairy Farm
Agari Feyisa, Anwar Hassen, Nateneal Tamerat*, and Ashebr Abraha
College of Veterinary Medicine, Haramya University, P.O.Box-138, Dire Dawa, Ethiopia
Abstract: A cross-sectional study was carried out in 40 lactating dairy cows of Haramaya University
dairy farm from November 2014 to April 2015 to isolate Streptococcus uberis and assess risk factors. A
checklist, farm inspection, and clinical examination of cattle were employed to collect data before
laboratory examination of milk samples. Lactating animals were examined for the presence of clinical
signs of mastitis. Physical examination of milk samples and California Mastitis Test (CMT) were
conducted. Milk samples collected from clinically mastitic cows and CMT positive samples were
subjected to microbiological examinations. Isolation and identification of Streptococcus uberis were
carried out according to standard microbiological procedure. From 40 cows udders examined, 17
(42.5%) and 3 (7.5%) were sub-clinically and clinically affected, respectively. Streptococcus uberis was
isolated from 2 (5%) of these cows. Out of 160 quarters examined, 11 (6.88%), 20 (12.5%) and 50
(31.25%) of the quarters were blind, clinically mastitic and sub-clinically mastitic, respectively.
Streptococcus uberis was isolated from hind quarters of two sub-clinically mastitic dairy cattle. In
conclusion, the present study revealed low isolation rate, however, it’s potential to spread and negative
impact on quality milk production should not be neglected. Therefore, emphasis should be given to
the control of mastitis due to this pathogen by improving hygienic and sanitation management
measures.
Keywords: CMT, Isolation, Mastitis, Microbiological examination, Streptococcus uberis
Introduction
Ethiopia is endowed with the largest livestock population in Africa with an estimated total cattle population of 53.99 million (CSA, 2013). However, this population size is not commensurate with its potential benefit to the country due to different constraints, among which animal diseases takes the top rank. The livestock production sector, particularly, dairy production, has not been fully exploited and promoted in the country (MOA, 2012). Mastitis is one of the most important threat and highly prevalent problem in dairy cattle affecting the world’s dairy industry (Viguier et al., 2009). Mastitis is an inflammation of the parenchyma of the mammary gland characterized by changes in the milk appearance and pathological alterations in the glandular tissue in clinical cases (Radiostits et al., 2007). However, in subclinical mastitis, there is no visible change in the milk or udder which makes it difficult to detect, even though milk production decreases and composition is altered due to bacteria. Subclinical mastitis is 3 to 4 times more common than the clinical mastitis (Mungube et al., 2005) and it results in severe economic losses from reduced milk production, treatment cost, increased labor, milk being withheld following treatment and premature culling (Viguier et al., 2009; Abureema, 2013). Environmental mastitis is associated with bacteria that are transferred from the environment to the cow rather than from other infected quarters. The most common
environmental mastitis causing bacteria are coliforms and environmental streptococci (Garcia, 2004; Radiostits et al., 2007). Among environmental streptococci, Streptococcus uberis is one of the most common mastitis pathogens found in dairy herds throughout the world and responsible for a significant proportion of clinical and subclinical mammary gland infections (Rambeaud, 2002; Tillman, 2006). Streptococcus uberis is a gram-positive, facultative anaerobic and catalase negative bacteria which hydrolyzes esculin. It has complex and variable nutrition requirements, which reflect its adaptation as a commensal or pathogen and explain its high percentage as environmental mastitis causing pathogen in dairy cattle (Hossain et al., 2015). It is also ubiquitous in the cow’s environment and found in manure and other organic matter, including bedding. Although its main source is the environment, a contagious cow-to-cow transmission may also occur (Celia et al., 2008). The high infection rates of Streptococcus uberis in the dry period and the failure of post milking teat disinfection to control disease emphasize the independence of milking and transmission. Although the organism is sensitive in vitro to a range of antibiotics, intramammary therapy often is ineffective and chronic infections are common in some herds. Under these circumstances cow-to-cow transmission may become more important. More importantly, Streptococcus uberis can sometimes be

Agari et al East African Journal of Veterinary and Animal Sciences 1(1): 7-12
8
associated with somatic cell count problems at low bacterial count (Andrews, 2004). Previously, environmental mastitis constituted less than ten percent of total mastitis cases, but more recently there has been an increase in the incidence of environmental mastitis, particularly associated with S. uberis infection (Tiwari et al., 2013). Isolation of S. uberis, as a cause of bovine mastitis has come under increased scrutiny in dairy cattle, which were previously considered as minor pathogens associated with a mild inflammatory reaction but they are now known to cause bovine mastitis (Hussein, 2012). In fact, a high incidence of S. uberis as significant agents of mastitis in New Zealand and USA draw huge attention to this micro-organism as cause of clinical and subclinical mastitis (Rossitto et al., 2002; McDougall et al., 2004). Although an increasing isolation of S. uberis mastitis has been reported throughout the world including Ethiopia, it still is relevant and important to study the recent status of environmental mastitis pathogen like S. uberis. Therefore, the present study was conducted with the objectives of isolating and identifying S. uberis in Haramaya University Dairy Farm.
Materials and Methods Study Area The present study was conducted in Haramaya University Dairy Farm where there was no regular and systematic detection of mastitis pathogens. Haramaya University is located at 09o N and 42oE at an altitude of 1950 meters above sea level. The area receives a bimodal rainfall; long rainy season (July to September) and short rainy season (March to June). The average rainfall is about 790mm. The mean maximum and minimum temperature are 23.6oC and 10.1oC, respectively (HADB, 2014).
Study Population During the study period a total of 40 lactating cross bred (Holstein Friesian X Zebu) cows were present in the farm and all the cows were included in the study. The cows were kept under intensive husbandry practice and milked twice daily using a milking machine.
Study Design A cross-sectional study was employed from November 2014 to April 2015. Clinical examination and laboratory test were conducted to isolate and identify S. uberis in lactating dairy cows of Haramaya University. Checklist, personal observation and farm records were used to collect data including husbandry system, age, parity, hygienic condition, lactation stage, production level, milking practices, barn drainage and milking personnel hygiene.
Study Methodology
Physical examination of udder and milk: The udder was examined visually and thorough palpation for detection
of injury, blindness, presence of cardinal signs of inflammation, tick infestation and swelling. Viscosity and appearance of milk secreted from each quarter was examined for abnormalities in color, consistency, presence of clot, blood, flakes, and any other visible abnormalities. Depending on the clinical inspection findings, cases were categorized as clinical mastitis positive or negative. After physical examination of the udder, milk samples were screened by California Mastitis Test (CMT) according to Quinn et al. (2002). A squirt of milk sample from each quarter of the udder was placed in a separate cup on the CMT paddle and an equal amount of CMT reagent was added and mixed well. Mixing was accomplished by gentle circular motion of the paddle in a horizontal plane for few seconds. The CMT results were read immediately and scored based on the amount and thickness of gel formed. Milk samples from animals with CMT positive were used for microbiological analysis. Milk samples collection and transportation for bacteriological examination was conducted as follows: Udder washing was performed only when it was found with paste of dung. Teats were thoroughly cleaned with soap and water and dried with clean towel before milk collection. The teats were disinfected with cotton wool moistened with 70% ethanol and air dried before sampling. From each quarter an approximately 10ml of milk sample was collected into sterile universal bottle. All samples were labeled using the cow’s identification number and quarter using permanent marker, the samples were placed in icebox and transported (Quinn et al., 2002) to Haramaya University College of Veterinary Medicine Microbiology Laboratory for bacteriological examination. The milk samples were cultured to isolate S. uberis according to procedures recommended by Quinn et al. (2002). A loop full of milk was taken after mixing by swirling and inoculated onto blood agar enriched with 5% sheep blood. The inoculated plates were labeled and given numbers corresponding to the milk sample. Plates were incubated at 37oC and reading was made initially after 24 hours then repeated after 48 hours of incubation. Identification of the bacteria on primary culture was done on the basis of colony morphology, hemolytic characteristics, and Gram stain reaction including shape and arrangements of the bacteria. The small-medium sized colonies that were hemolytic or non-hemolytic on 5% sheep blood agar and yielding gram positive cocci were sub-cultured onto nutrient agar to obtain a pure isolate for further identification and subjected to catalase test. The catalase test was performed by transferring a bacterial colony with a sterile wire loop onto a cover slip and a drop of 3% H2O2
was added. Any colony that showed a positive reaction was discarded. Bacterial isolates that were Gram positive and negative for catalase production were set up for aesculin hydrolysis incorporated into the primary isolation media (Edward’s medium). Esculin hydrolysis

Agari et al Isolation of Streptococcus Uberis in Lactating Cows
9
positive cocci were transferred to Mac-Conkey agar to detect growth. Bacteria which did not grow on Mac-Conkey agar were considered as S. uberis. Bacteria which grew on Mac-Conkey agar were considered as
Enterococcus faecalis (Quinn et al., 2002).
Statistical Analysis
The data was collected and recorded on specifically
designed formats for this purpose and entered on
Microsoft excel spreadsheet and analyzed with STATA
version 12 statistical software. Descriptive statistics
including frequency and percentage were used to
summarize the data generated from the study.
Results
Among the 40 lactating cows examined, three (7.5%)
and 17(42.5%) were affected by clinical and subclinical
mastitis, respectively and two (5%) were identified
positive for S. uberis (Table 1).
Table 1. Isolation of Streptococcus uberis in relation to cow level mastitis forms
Mastitis form Number of animal affected
Percentile S. uberis positive (%)
Clinical 3 7.5% 0 (0%) Subclinical 17 42.5% 2 (11.76%) Overall 20 50% 2 (5%)
Isolation of S. uberis on the bases of animals’ age groups
revealed prevalence of 5.88% for young and 4.34% for
adult ages. S. uberis isolation was observed only in
multiparous cows (5.56%). On the other hand, cows in
late lactation were affected at 6.7% rate while cows in
early lactation had 8.3% prevalence. In addition,
isolation of S. uberis was observed in animals with high
production and low production with isolation rates of
11.1% and 5%, respectively (Table 2).
Table 2. Isolation of Streptococcus uberis with respect to host related factors Factors Categories Number examined Positive (%)
Age
Young adult (3-5 years) 17 1 (5.88%)
Adult (>5years) 23 1 (4.34%)
Parity
Primiparous 4 0
Multiparous 36 2 (5.56%)
Lactation stage
Early (≤ 4 months) 12 1 (8.3%)
Mid (5-7 months) 13 0 (0%)
Late (>7 months) 15 1 (6.7%)
Milk yield Low (≤ 5 lt) 20 1 (5%)
Medium (6-10 lt) 11 0 (0%)
High (>10 lt) 9 1 (11.1%)
Eleven (6.88%) of the 160 quarters were blind whereas
20 (12.5%) and 50 (31.25) were positive for clinical and
sub clinical mastitis, respectively. On quarters’ level, S.
uberis was isolated from hind quarters of two (1.25%)
cows with sub clinical mastitis (Table 3).
Table 3. Quarter level mastitis form and isolation of S. uberis
Mastitis form
No Mastitis + (%) Streptococcus uberis positive (%)
Clinical 20 (12.5%) 0 (0%)
Subclinical 50 (31.25) 2 (4%)
Quarter No of quarter examined Streptococcus uberis positive (%) Blind (%)
RF 40 0 (0%) 2 (5%)
LF 40 0 (0%) 1 (2.5%) RR 40 1 (2.5%) 3 (7.5%) LR 40 1 (2.5%) 5 (12.5)
Total 160 2 (1.25%) 11 (6.88%)
RF=Right Front; LF=Left Front; RR=Right Rear; LR=Left Rear.

Agari et al East African Journal of Veterinary and Animal Sciences 1(1): 7-12
10
Discussion
The overall isolation of S. uberis is 5% which is slightly
greater than noted by Belayneh et al. (2014), Bitew et al.
(2010) and Bedada and Hiko (2011) who reported
prevalence of 1.2%, 2.5% and 0.9% S. uberis. However,
the current finding is in line with the findings of Girma
et al. (2012), G/Michael et al. (2013) and Kerro and
Tareke (2003) who reported 5.8%, 5.2% and 5.1%
prevalence of S. uberis, respectively. This discrepancy
between different studies is probably due to the fact that
environmental Streptococcus (S. uberis) infection is strongly
influenced by hygienic status, poor housing conditions
and sanitation problem (Radiostits et al., 2007). Despite
the observed poor drainage and inadequate hygienic
state of the farm, the prevalence of S. uberis remains low.
This could be due to the fact that udder infection with
S. uberis is highly established in dry cows managed to stay
in deep straw beddings, which is reported as major risk
factor as it favours bacterial multiplication (Andrews,
2004).
Streptococcus uberis was isolated only from cows with
subclinical mastitis. Belayneh et al. (2014) and Bitew et al.
(2010) also isolated S. uberis only from animals with
subclinical mastitis with prevalence of 1.3% and 2.63%,
respectively. The present finding is also in agreement
with Zadoks (2002) finding who reported S. uberis as a
major cause of subclinical mastitis in dairy herds. On the
other hands Girma et al. (2012), Bedada and Heko (2011)
and Sori et al. (2005) reported higher isolation of S. uberis
from clinical cases rather than subclinical cases. This
difference could be attributed to variation in sample size
and study setting among various studies.
In this study, isolation of S. uberis is observed in 2
(5.56%) cows that has two previous births. This finding
is supported by Zadoks et al. (2001) who reported lower
incidence of S. uberis in lower parity cows than higher-
parity cows. Kerro and Tareke (2003) and Getahun et al.
(2008) also showed direct relationship between parity
and prevalence of mastitis. The high isolation rate in
aged multiparous animals might be due to increase in
teat patency and frequency of previous exposure (Ayano
et al., 2013). S. uberis isolation both in young adult
1(5.88%) and adult cows 1(4.34%) is in accordance with
that noted by Pryor (2008) who reported age to have no
influence on S. uberis isolations.
Isolation of S. uberis only from hind quarters concur
with Pryor (2008) and Zadoks (2002) findings who
reported the incidence of mastitis caused by any
pathogen to vary between the quarters of the udder with
the rear two quarters more likely to be infected than the
front two quarters, which could be related to greater
production capacity of hind quarter, likelihood of fecal
accumulation, environmental contamination and
difficulty of cleaning of the hind quarter (Sori et al.,
2005).
Higher prevalence at early lactation stage than late in
the present study is in agreement with the findings of
Abureema (2013) who indicated S. uberis to be the most
common isolate at early lactation. However, Chairman et
al. (2012) noted S. uberis to be dominant pathogen at all
stages of lactation since S. uberis mastitis is mainly the
result of heavy contamination of the teats and udder
with water, mud and faecal matter at any stage during
lactation (Radiostits et al., 2007).
Isolation of S. uberis in both high 1(11.1%) and low
1(5%) milk production group agrees with the finding of
Charles (2014) and Moges et al. (2012) who reported
higher mastitis in cows with high milk yield. This could
be due to ease with which injuries are sustained in large
udders, so that foci for the entrance of microorganisms
are created and stress associated with a high milk yield
may weaken the defense system of the cow (Charles,
2014).
Conclusion and Recommendations Even though occurrence of S. uberis can be considered
low in the current study, as high as 50% of mastitis
prevalence level is worrisome. It is necessary to take
appropriate measures to minimize the overall mastitis
problem and to prevent potentially harmful effect of S.
uberis and its spread to other farms in the surrounding.
Therefore, husbandry and sanitation management,
screening of animals for subclinical mastitis and
appropriate dry cow management should be employed
to reduce the possible risk of S. uberis.
Conflict of Interests
The authors declare that they have no competing
interests.
References Abureema, S. (2013). Characterization of Streptococcus
uberis from bovine milk. PhD Thesis, RMIT
University, Melbourne, Victoria, Australia.
Andrews, A. H. (2004). Mastitis. In: Edmondson, P.W.
and Bramley, A.J. (Eds.) Bovine Medicine Diseases
and Husbandry of Cattle. 2nd ed. Blackwell Science
Ltd, 9600 Garsington Road, Oxford OX4 2DQ, UK,
pp: 333-334.
Alemu Aylate, Fikiru Hiriko, Alemante Molla Simyalew
& Aster Yohannes (2013). Prevalence of subclinical
mastitis in lactating cows in selected commercial
Agari et al Isolation of Streptococcus Uberis in Lactating Cows
11
dairy farms of Holeta district. Journal of Veterinary
Medicine and Animal Health, 5: 67-72.
Bedada, B. A. & Hiko Adem. (2011). Mastitis and
antimicrobial susceptibility test at Asella, Oromia
regional state, Ethiopia. Journal of Microbiology and
Antimicrobials, 3: 228-232.
Redeat Belayneh, Kelay Belihu & Asamenew Tesfaye
(2014). Microbiological study on bacterial causes of
bovine mastitis and its antibiotics susceptibility
patterns in East Showa zone, Akaki district, Ethiopia.
Journal of Veterinary Medicine and Animal Health, 6, 116-
122.
Molalign Bitew, Arega Tafere & Tadele Tolosa (2010).
Study on bovine mastitis in dairy farms of Bahir dar
and its environs. Journal of Animal and Veterinary
Advances, 9: 2912-2917.
Viguier, C., Arora, S., Gilmartin, N., Welbeck, K., &
O'Kennedy, R. (2009). Mastitis detection: Current
trends and future perspectives. Trends in
Biotechnology, 27: 486-493.
Celia, K. L., Nelson, D. & Kerr, D. E.
(2008).Characterization of a bacteriophage lysin
(Ply700) from Streptococcus uberis. Veterinary
Microbiology, 130 (1-2): 107-117.
Chairman, N., Dyson, R., Hodge, A., Robertson, N. &
Chaplin, S. (2012). A survey of mastitis pathogens in
the South eastern Australian dairy industry, Parkville,
Australia.
Charles, M.K. (2014). Prevalence, control and
antimicrobial susceptibility patterns of bovine
mastitis causing bacteria in Mityana district. MSc
Thesis, Makerere University, Kampala, Uganda.
CSA (2011). Central Statistical Agency Agricultural
sample survey, report on livestock and livestock
characteristics volume II, private peasant holdings.
Addis Ababa, Ethiopia.
CSA (2013). Central Statistical Agency Agricultural
sample survey, report on livestock and livestock
characteristics, private peasant holdings. Addis
Ababa, Ethiopia.
Lidet G/Michael, Benti Deressa, Feyissa Begna, &
Abebe Mekuria, (2013). Study on prevalence of
bovine mastitis in lactating cows and associated risk
factors in and around Areka town, Southern of
Ethiopia. African Journal of Microbiology Research, 7:
5051-5056.
Garcia, A. (2004). Contagious vs. environmental
mastitis. South Dakota state university, Brookings,
USDA, pp: 1-4).
Getahun, K., Kelay Belihu, Merga Bekana & Fikre
Lobago (2008). Bovine mastitis and antibiotic
resistance patterns in Selalle smallholder dairy farms,
Central Ethiopia. Tropical Animal Health and
Production, 40: 261-268.
Sisay Girma, Alo Mammo, Ketema Bogele, Teshale Sori,
Fanos Tadessse, & Tariku Jibat (2012). Study on the
prevalence of bovine mastitis and its major causative
agents in Western Hararghe zone, Doba district,
Ethiopia. Journal of Veterinary Medicine and Animal
Health, 4: 116-123.
HADB (2014). Haramaya woreda Agricultural
Development Bureau, Haramaya district, Ethiopia.
Hossain, M., Egan, S. A., Coffey, T., Ward, P. N.,
Wilson, R., Leigh, J. A., & Eme, R. D. (2015).
Virulence related sequences; insights provided by
comparative genomics of Streptococcus uberis of
differing virulence. BMC Genomics, 16: 334.
Hussein, S. A. (2012). Prevalence and bacterial etiology
of subclinical mastitis in dairy cows in Al
Sulaimaniyah district. Kufa Journal of Veterinary
Medicine Science, 3: 190-203.
Iqbal, M., Khan, M.A., Daraz, B., & Saddique, U. (2004).
Bacteriology of mastitic milk and in vitro
antibiogram of the isolates. Pakistan Veterinary
Journal, 24: 161-164.
Kerro D.O., & Tareke, F. (2003). Bovine mastitis in
selected areas of Southern Ethiopia. Tropical Animal
Health and Production, 35:197-205.
McDougall, S., Parkinson, T.J., Leyland, M., Anniss,
F.M., & Fenwick, S.G. (2004). Duration of infection
and strain variation in Streptococcus uberis isolated
from cow’s milk. Journal of Dairy Science, 87, 2062-
2072.
MOA (Ministry of Agriculture) (2012). Ministry of
Agriculture, Ethiopia animal health year book.
Federal Ministry of Agriculture Animal and Plant
Health Regulatory Directoriate (APHRD), Ministry
of Agriculture, Addis Ababa, Ethiopia.
Nibret Moges, Tekle, Hailemariam, Tewodros,
Fentahun, Mersha, Chanie, & Achenef, Melaku
(2012). Bovine mastitis and associated risk factors in
smaller holder lactating dairy farms in Hawassa,
Southern Ethiopia. Global Veterinaria, 9: 441-446.
Mungube, E. O., Tenhagen, B. A., Fikru Regassa, Kyule,
M. N., Shiferaw, Y., Kassa, T., & Baumann, M. P.
(2005). Reduced milk production in udder quarters
with subclinical mastitis and associated economic
losses in crossbred dairy cows in Ethiopia. Tropical
Animal Health and Production, 37: 503–512.
Pryor, S. M. (2008). Bovine mastitis and ecology of
Streptococcus uberis. PhD Thesis, Waikato
University, Waikato, New Zealand.
Quinn, P. J., Carter, M. E., Markey, B., & Carter, G. R.
(2002). Bacterial causes of Bovine Mastitis. Veterinary

Agari et al East African Journal of Veterinary and Animal Sciences 1(1): 7-12
12
Microbiology Microbial Diseases, 8th Ed. Mosby
international Limited, London, pp: 465-475.
Radiostits, O. M., Gay, C. C., Hinchcliff, K. W., &
Constable, P. D. (2007). A textbook of the diseases
of cattle, sheep, goats, pigs and horses, 10th Ed.
Ballier, Tindall, London, pp: 674-762).
Rambeaud, M. (2002). Dynamics of leukocytes and
cytokines during experimentally-induced
Streptococcus uberis mastitis. MSc Thesis,
Tennessee University, Knoxville.
Rossitto, P. V., Ruiz, L., Kikuchi, Y., Glenn, K., Luiz,
K., Watts, J. L., & Cullor, J. S. (2002). Antibiotic
susceptibility oat terns for environmental Streptococci
isolated from bovine mastitis in Central California
dairies. Journal of Dairy Science, 85: 132-138.
Hundera Sori, Ademe Zerihun, & Sintayehu, Abdicho
(2005). Dairy cattle mastitis in and around Sebeta,
Ethiopia. International Journal of Applied Research in
Veterinary Medicine, 3: 332-338.
Tillman, W. S. (2006). The Development of a Streptococcus
uberis mastitis challenge protocol. MSc Thesis, North
Carolina State University, Raleigh, North Carolina.
Tiwari, J.G., Babra, C., Tiwari, H.K., Williams, V., Wet,
S.D., Gibson, J., Paxman, A., Morgan, E.,
Costantino, P., Sunagar, R., Isloor, S., & Mukkur, T.
(2013).Trends in therapeutic and prevention
strategies for management of bovine mastitis: An
overview. Journal of Vaccines and Vaccination, 4: 176-
187.
Zadoks, R. N. (2002). Molecular and mathematical
epidemiology of Staphylococcus aureus and Streptococcus
uberis mastitis in dairy herds. Epidemiology and Infection,
130: 335-349.
Zadoks, R. N., Allore, H. G., Barkema, H. W.,
Sampimon, O. C., Wellenberg, G. J., Grohn Y. T., &
Schukken, Y. H. (2001). Cow and quarter-level risk
factors for Streptococcus uberis and Staphylococcus aureus
mastitis. Journal of Dairy Science, 84: 2649–2663.

East African Journal of Veterinary and Animal Sciences (2017) Volume 1(1): 13-18
___________________________________________ *Corresponding Author. E-mail: [email protected] ©Haramaya University, 2017
Detection of Anthelmintic Resistance in Gastrointestinal Nematodes of Small Ruminants in Haramaya University Farms Walkite Furgasa1, Negesse Mekonnen2*, and Anwar Hassen3
1College of Veterinary Medicine, Wollega University, P. O. Box 395, Nekemte, Ethiopia 2Department of Animal Production and Technology, College of Agriculture and Environmental Science, Bahir Dar University 3College of Veterinary Medicine, Haramaya University, P. O. Box 138, Dire Dawa, Ethiopia
Abstract: The present study evaluated the status of anthelmintic resistance of gastrointestinal (GI)
parasites of small ruminants. The study was conducted from December 2014 to January 2015 in
Haramaya University sheep and goat farms. A fecal egg count reduction test (FECRT) was performed
in naturally infected sheep and goats. A total of 30 black head Ogaden sheep and 30 Hararghie
highland goats of age form 6-18 months not treated in the previous 8 weeks and with a fecal egg
counts (FECs) greater than 150 eggs per gram of faeces were selected for the test. Both sheep and
goats were grouped into two treatments and one control group (albendazole, ivermectin, and the
control). In sheep, the percentage reductions in FECs and the 95% (lower and upper) confidence
limit (CL) for albendazole was 82% (95%, CL 60-92), and for ivermectin 68% (95%, CL 0-90). In
goats, the percentage reductions in FECs for albendazole was 63% (95%, CL 28-81), and for
ivermectin 41% (95%, CL 0-72). The result show that albendazole and ivermectin resistance was
detected in nematode parasites of sheep and goats. To overcome the problem, the farm should use
anthelmintics only when necessary, employ rotation of anthelmintic every two or three years, use the
correct dose of anthelmintics, reduce dependence on anthelmintics and use other management
options such as rotational grazing, and adopt strategies to preserve susceptible worms.
Keywords: Anthelmintic resistance; Sheep and goat; Albendazole; ivermectin, Fecal egg count reduction
Introduction Ethiopia has 25,489,204 sheep and 24,060,792 goats’ populations (CSA, 2015). The proportion of total annual meat production in Ethiopia from cattle, sheep, and goats was 63%, 25%, and 12%, respectively. At the national level, sheep and goats account for about 90% of the live animal and 92% of skin and hide export trade value (FAO, 2004). In Ethiopia, small ruminant production and productivity is affected by diseases, inadequate nutrition, and poor management system (Addis, 2015). Several studies in different parts of Ethiopia revealed that gastro intestinal (GI) parasites are one of the major problems causing morbidity, production loss, and mortality (Shimelis et al., 2011; Sabkeber et al., 2014; Sisay et al., 2007). The treatment and control of parasitic helminthes largely depends on the use of few classes of anthelmintics drugs. Consequently, anthelmintic resistance is becoming a serious problem worldwide, especially in developing countries where there is no rational use and variety of anthelmintic drugs (Urquhart et al., 1996). Anthelmintic resistance is a heritable change in the ability of individual parasites to survive the recommended therapeutic dose of anthelmintics (Taylor et al., 2002). According to World Association for the Advancement of Veterinary Parasitology (WAAVP), resistance is present if the percentage reduction in egg count is less than 95% and the lower limits of 95%
confidence level is less than 90%. If only one of the two criteria is met, resistance is suspected (Coles et al., 1992; Coles et al., 2006). Anthelmintic resistance in GI nematodes of small ruminant has been reported in different parts of the world, which made it a seriously increasing problem (Wolstenholme et al., 2004). Resistance to the major classes of anthelmintics has been recorded in Europe (Coles et al., 2004), Asia (Gills, 1993), North America (Uhlinger et al., 1992) and Latin America (Echevarria et al., 1996). In Ethiopia, anthelmentic resistance in small ruminants has been reported by many researchers from different part of the country (Ayalew et al., 2014; Desie et al., 2013; Getachew et al., 2013, Sisay et al., 2006a; Sisay et al., 2006b). A study conducted by Sissay (2007) on small ruminant helminth parasites in eastern Ethiopia identified more than nine genera of nematode parasites and the use of anthelmintics has been practiced for a long time and constitutes a considerable share of the costs spent by the country in the control of helminthosis (Demelash et al., 2006). However, the control of GI nematode parasites of livestock in smallholder farmer and pastoralist communities is done with limited anthelmintic drug and is performed mainly during the rainy seasons (Sisay et al., 2007). Drugs are relatively expensive and are often not easily accessible to smallholder farmers and stock owners in pastoralist communities, while frequent and indiscriminate use of different classes of anthelmintics

Walkite et al East African Journal of Veterinary and Animal Sciences 1(1): 13-18
14
has been reported in institutional and large commercial farms (Sissay et al., 2006a). Despite the frequent use of anthelmintic drugs in Haramaya University sheep and goat farms, the prevalence of GI nematodes is extremely high (Sabkeber et al., 2014). The higher prevalence might be due to anthelmintics drug resistance or problem in the quality of the drugs. Therefore, the objective of this study was to assess if there is anthelmintics drug resistance in the GI nematodes of sheep and goats in Haramaya University farm.
Materials and Methods Study Area and Duration The study was conducted in Haramaya University sheep and goat farms from Decmber 2014 to January 2015. The farm is situated at an altitude of 1600 to 2100 meter above sea level, with the mean annual temperature and relative humidity of 18°C and 65%, respectively (Sisay et al., 2006a). Geographically, it is located at latitude 09º 24' 10"N and longitude 041º 59' 58" E. There are four seasons in the area; a short rain season (from March to mid-May), a short dry season (from end of May to end of June), a long wet season (early July to mid-October) and a long dry season (end of October to end of February). Haramaya area receives an average annual rain fall of 900 mm, with a bimodal distribution pattern, picking in mid April and mid-August. The vegetation that constitutes the available pasture lands of the university is predominantly native grasses and legumes (HADB, 2009).
Study Animals The sheep farm consist more than 134 (26 male and 108 female) sheep of different breeds. The flock consists of indigenous black head Ogaden breed (69), Hararghie highland (46), Washera (12), and exotic Dorper pure breed (7). The sheep breeds, except the Dorper, are kept in semi-intensive management system that is they graze the same field with Borena cattle breed and supplemented with concentrate at night. In addition to these, the farm has small paddocks where sheep graze for some time and are housed in separate housing units that accommodate 30-40 sheep per unit. The goat farm has 226 goats (32 male and 194 female) of different breeds and their crosses. Hararghie highland (56), Somali (52), Abargelle (45), Boer (10), Anglo-Nubian (1), and crosses of different breed (30) forms the goat population of the farm at the begging of the study. Hararghie highland, Somali and Abargelle goats are managed in semi-intensive system. All the remaining goat breeds are managed under intensive management. All the different breeds and cross breeds have separate pen. The separate grazing land for goat is also occasionally grazed by cattle, but sheep and goats are almost kept on separate grazing areas with rare cases of grazing the same area one after the other.
The farms have been using anthelmintics to control GI nematodes infection and the most frequently used
anthelmintics were albendazole and ivermectin. The treatment frequency is at least twice per year and changed based on the condition of the animals. The conditions used as a justification for deworming were poor appetite, coughing and sneezing, diarrhea and loss of body condition. Sheep and goats that show these clinical signs are treated with the available anthelmintic without confirmatory diagnosis.
Experimental Design Animals in both farms have identification number and based on their ear tag the animals used for the experiment were selected using simple random sampling technique. Before the actual experiment, equal number of black head Ogaden sheep (40) and Hararghie highland goat (40) were randomly selected considering the dropout during the experiment. Only animals that did not taken anthelmintics for the past 2 months were included in the study. Three gram of fecal materials were collected directly from the rectum by inserting two fingers and placed in universal bottle and labeled with necessary information. The fecal samples were screened in the Veterinary Parasitology laboratory of the University for the presence of nematode eggs within 2 hours after collection. Simple floatation and modified McMaster egg counting technique were used. Only sheep and goats with more than 150 egg per gram (EPG) of faeces were included in the study. The FECRT compares the treatment groups with untreated groups. The efficacies of albendazole and ivermectin were tested and interpreted according to the guideline provided by WAAVP recommendation (Coles et al., 1992). Finally, 60 animals (30 for each species) were selected for the experiment based on the criteria set by WAAVP and assigned randomly to albendazole (10), ivermectin (10) and control (10) groups. Different age groups (6-18 months) and female sheep and goats were used for the study since there were no sufficient male goats in the farms. Individual animals were weighed and the two groups treated according to manufacturers recommended dose orally or subcutaneously depending on the type of drug, but the control groups were not. Albendazole 300mg bolus manufactured by Chengdu Qiankun veterinary pharmaceuticals Co. Ltd, China was used at a dose of 7.5mg/kg, orally. Ivermectin 1% (50ml injection) manufactured by Laboratorios Microsules, Uruguay, was used at a dose of 0.2mg/kg, subcutaneously.
The second rectal sample was taken after 10 days post treatment for albendazole and 14 days for ivermectin with their corresponding control group. The FECs were performed using Modified McMaster counting technique and the changes in the EPG count were recorded with a minimum detection limit of 50 EPG (Cole et al., 2006). Furthermore, the EPG was classified as light, moderate and heavy infection for a count of 50 to 799, 800 to 1200 and over 1200, respectively (Urquhart et al., 1996).

Walkite et al Detection of Anthelmintic Resistance in Gastrointestinal Nematodes
15
Table 1. The degree of infestation of sheep and goats
Degree of Infestation
Number of Goat (%) Number of Sheep (%) Total (%)
Light 3 (10%) 10 (33.3%) 13 (21.7) Moderate 3 (10%) 2 (10%) 5 (8.3) Heavy 24 (80%) 18 (60%) 42 (70)
Analysis and Interpretation of Data The effectiveness of albendazole and ivermectin was evaluated on the basis of the reduction in faecal egg count. Calculation of the arithmetic mean, percentage reduction and 95% upper and lower confidence limits was according to Coles et al. (1992). A computer program, RESO, Version 2 (Anonymous, 1990) was used for this calculation. Resistance is considered to be present if the percentage reduction in egg count is less than 95% and the 95% confidence level is less than 90%.
If only one of the two criteria is met resistance is suspected (Coles et al., 1992).
Results The percentage reduction of faecal egg counts after treatment with albendazole and Ivermectin was 82% and 68%, respectively (Table 2). The lower confidence limit was within range of resistant parasites for both anthelmintics. The result revealed the development of resistance against albendazole and ivermectin by the GI nematodes of sheep in Haramaya University farm.
Table 2. Mean faecal egg counts and percentage reductions after treatment of sheep with Albendazole and Ivermectin
FECRT summary results Treatment groups
Albendazole Ivermectin control
Number of animals (n) 10 10 10
Pre-treatment mean EPG 1640 1645 1370 Post-treatment mean EPG 180 465 1460 Reduction (%) 82 68 - Upper 95% CI (%) 92 90 - Lower 95% CI (%) 60 0 - Interpretation resistant resistant -
EPG= egg per gram; Mean EPG = arithmetic mean of faecal nematode egg counts; Control = Untreated group of animals, CI= confidence interval. The percentage reduction of faecal egg counts after treatment with albendazole and Ivermectin was 63% and 41%, respectively (Table 3). The lower confidence limit was within range of resistant parasites for both anthelmintics. The result revealed the development of
resistance against albendazole and ivermectin by the gastrointestinal nematodes of goats in Haramaya University farm.
Table 3. Mean faecal egg counts and percentage reductions after treatment of goats with Albendazole and Ivermectin
FECRT summary results Treatment groups
Albendazole Ivermectin Control
Number of animals (n) 10 10 10 Pre-treatment mean EPG 3100 3455 1685 Post-treatment mean EPG 595 1220 2065 Reduction (%) 63 41 -
Upper 95% CI (%) 81 72 - Lower 95% CI (%) 29 0 -
Interpretation resistant resistant -
Mean EPG = arithmetic mean of faecal nematode egg counts; Control = Untreated group of animals, CI= confidence interval.
Discussion
The results obtained from the FECRT and 95% confidence limits indicated the presence of resistance to albendazole by the GI nematodes in Haramaya University sheep farm. The current finding was comparable with reports from Western Oromia for albendazole with 98% percentage reduction, 95% upper confidence limit (UCL) 100% and lower confidence
limit (LCL) 86% (Aga et al., 2013). Similar result was reported for albendazole against GI nematodes of sheep from Southern Ethiopia by Desie et al. (2013) with percentage reduction of 95%, 95%UCL (98.2%) and LCL (86.5%). However, the current finding of GI nematode resistance test against albendazole was contradictory with the reports from Wolaita Soddo by Desie and Amenu et al. (2010) with percentage reduction

Walkite et al East African Journal of Veterinary and Animal Sciences 1(1): 13-18
16
of 100%, Bersissa and Ajebu (2008) from Hawassa with percent reduction of 100%, Getachew et al. (2013) from Bedelle with percentage reduction of 95.6%, 95% UCL (97.6%) and LCL (93.6%). Similarly, Kassahun et al. (2005) from Southern Ethiopia reported with percentage reduction of 100% using albendazole against GI nematode in sheep, and Sissay et al. (2006b) in experiment done in eastern Ethiopia done in different peasant association with percentage reduction 95% and above, and 95% UCL (>96%) and LCL (>91%). The result obtained from the FECRT and the 95% confidence limits showed the presence of resistance to Ivermectin by the GI nematodes in Haramaya University sheep farm. Ivermectin resistance is not common in GI nematodes of sheep in Ethiopia. However, in other countries, resistance againest GI nematodes of sheep were reported. A study conducted on 25 lambs in New Zealand showed a reduction of the FECs only by 18% which was an indication for the emergence of Ivermectin resistance by the GI nematodes of sheep (Leathwick et al., 2001). However, many reports from Ethiopia showed the effectiveness of ivermectin against GI nematode of sheep. Sissay et al. (2006a) from Eastern Ethiopia reported a percentage reduction of (98%), 95% UCL (99%) and LCL (95%), Desie et al. (2013) from Southern Ethiopia, with percentage reduction of (96.7%), 95% UCL (100%) and LCL (91%), and Getachew et al. (2013) from western Oromia, with percentage reduction of (96.7%), 95% UCL (98.8%) and LCL (94.5%) confirmed the effectiveness of this drug. The result obtained from the FECRT and the 95% confidence limits showed the presence of resistance to Albendazole by the GI nematodes in Haramaya University goat farm. Similar findings were reported by Sissay et al. (2006a) from the same farm (Haramaya University goat farm) before ten years with percentage reduction of (57%), 95% UCL (63%) and LCL (49%) which confirmed the persistence and heritability of resistant genes in nematodes both in the host and in the refugia population for more than a decade. Desie et al. (2013) from Southern Ethiopia reported suspected resistance to albendazole against GI nematodes of goats with percentage reduction of (99.6%), 95% UCL (99%) and LCL (88.3%). On the other hand, Sissay et al. (2006b) from Eastern Ethiopia (Haramaya district small holder’s goat flock) reported the effectiveness of albendazole with percentage reduction of (95%), 95% UCL (97%) and LCL (94%). This might be due to difference in the study area (different district), both the parasite population in the host and the refugia are different. The present finding obtained from the FECRT and 95% confidence limits indicated the presence of resistance to Ivermectin by the GIT nematodes in Haramaya University goat farm. Similar result was reported by Sissay et al. (2006a) from the same farm before a decade with percentage reduction of 67%, 95% UCL (73%) and 95% LCL (60%). This might indicate the transfer of resistance genes vertically within
generations for several years and its persistence after development in an area. On the other hand, many research findings were contradictory to the current finding of GI nematode resistance against ivermectin in Haramaya University goat farm. A study conducted by Sissay et al. (2006b) on goats in Eastern Ethiopia against GI nematodes indicated a percentage reduction of 96%, 95% UCL (97%) and 95% LCL (93%). Similarly, Desie et al. (2013) from southern Ethiopia reported a percentage reduction of 97.1%, 95% UCL (99.1%) and 95% LCL (99.0%). The present finding confirmed the development of resistance for albendazole and ivermectin by GI nematodes of sheep and goats in Haramaya University farms. Different factors might contribute for the development of anthelmintics resistance in the farm such as the treatment frequency, inaccurate dosage determination, and indiscriminate use of anthelmintic, treatment without confirmatory diagnosis and management system (Suarez and Cristel, 2014). Besides these, the substandard drug quality might be the other probable reason for the ineffectiveness of the drug which needs to be investigated in the future in order to be sure about the cause for the development of resistance in both species. In the majority of cases treatment frequencies in Haramaya University farms were influenced by clinical conditions of animals such as poor body conditions, coughing, sneezing, diarrhoea, emaciation and poor appetite. Indiscriminate use of anthelmintic will favor the selection pressure in which the susceptible population will extinct in the area whereas the resistant population will dominate both in the host and refugia. The other contributing factor for the development of resistance in the farms were animal weight estimation by guessing to calculate the dosage which might accounted for error such as under or overdosing. Under dosing has been repeatedly blamed for the buildup of resistance which permits the survival of resistant heterozygous individuals and increases their chances of producing highly resistant parasites (Vadlejch et al., 2014). Another factor that could explain the high levels of resistance in the farms were the use of the same drugs for many years in the same area. Frequent and longstanding use of the same anthelmintic is among the means to efficiently select one sub population of worms that presents the capability to survive for a particular type of drug. On the contrary, alternate use of the anthelmintic family reduces the effect of the selection pressure exerted by each type of drug and resistance development (Vadlejch et al., 2014). The management system in the farms is generally poor, the same grazing land was used before and after anthelmintic treatment which predisposed animals for the re-infection and contamination of the environment with surviving resistant strains. The gaps of the current study were inability to perform copro-culture before and after treatment, and lack to identify which species of nematodes developed resistance.

Walkite al Detection of Anthelmintic Resistance in Gastrointestinal Nematodes
17
Moreover, the efficacy of the starting materials (drugs) is not known, hence it is not possible to directly declare that there is resistance; in previous reports, there was an evidence that dosage regimen for goats should be higher than sheep and manufacturers recommended doses usually are said not to be working. Hence different dose regimens should have been used in goats.
Conclusion and Recommendations The growing resistance of GI nematodes of sheep and goats, to available veterinary anthelmintics, is a serious problem and a global issue. Our study findings indicated that GI nematodes of sheep and goats, in Haramaya University farm, might be resistant to albendazole and ivermectin. Based on literature and observations during the study period, it can be recommended that the farm should refrain from using frequent and unnecessary treatments, implement alternative use of anthelmintics such as a change of drugs every two/three years, reduce dependence on anthelmintics by employing management practices such as rotational grazing, improve the management of the farms and implement correct dosing of anthelmintics. Future researches should focus on the identification of resistant species by copro-culture before and after treatment, and perform in vitro egg hatchability assay using known standard drugs.
Acknowledgements We would like to forward our appreciation to Haramaya University, College of Veterinary Medicine, Parasitology laboratory team and personnel working in Haramaya University sheep and goat farm for their cooperation during the study.
Conflict of Interests The authors declare that they have no competing interests.
Reference Addis Getu (2015). Review on Challenges and
Opportunities Sheep Production, Ethiopia. African Journal of Basic and Applied Sciences, 7: 200-205.
Anonymous (1990). Faecal egg count or worm counts reduction test analysis (RESO), CSIRO, Australia.
Ayalew Niguse, Dawit Shimelis & Teka Feyera (2014). Epidemiology and Chemotherapy of Gastrointestinal Parasites of Sheep in and Around Jigjiga, Eastern Ethiopia, European Journal of Biological Sciences, 6: 46-53.
Bersissa Kumsa and Ajebu Nurfeta. (2008). Comparative efficacy of albendazole, tetramisole and ivermectin against gastrointestinal nematodes in naturally infected sheep in Hawassa, Southern Ethiopia. Revue de Medecine Veterinaire, 159: 593-598.
Coles, G. C., Bauer, C. & Borgsteede, M. (1992). “World Association for the Advancement of Veterinary Parasitology (WAAVP) methods for the detection of
anthelmintic resistance in nematodes of veterinary importance. Veterinary Parasitology, 44: 35-44.
Coles, G. C., Jackson, F., Pomroy, W.E., Prichard, R.K., Samson-Himmelstjerna, G. V., Silvestre, A., Taylor, M. A. & Vercruysse, J. (2006). The detection of anthelmintic resistance in nematodes of veterinary importance: A Review. Veterinary Parasitology, 136: 167-15.
Coles, G. C., Jackson, F., Taylor, M. A. & Wolstenholme, A. J. (2004). Collaborating to tackle the problem of anthelmintic resistance. Veterinary Record, 155: 253-254.
CSA (2015). Ethiopian agricultural sample survey. Vol II. Report on livestock and livestock characteristics (private peasant holdings). Statistical Bulletin 570. Addis Ababa: Ethiopia.
Demelash Biffa, Yilma Jobre & Hassen Chakka (2006). Ovine helminthosis, a major health Constraint to productivity of sheep in Ethiopia. Anima Health Research Review, 7: 110-118.
Desie Sheferaw & Amenu Asha (2010). Efficacy of selected anthelmintics against gastrointestinal nematodes of sheep owned by smallholder farmers in Wolaita, Southern Ethiopia. Ethiopian Veterinary Journal, 14: 31-38
Desie Sheferaw, Dejene Getachew, Jemere Bekele & Yifat Denbarga (2013). Assessment of anthelmintic resistance in gastrointestinal nematodes of small ruminants, Dale district, Southern Ethiopia. Journal of Veterinary Medicine and Animal Health, 5: 257-261.
Echevarria, F., Borba, M., Pinheiro, S., Waller, P. & Hansen, J. (1996). The prevalence of anthelmintic resistance of sheep in Southern Latin America, Brazil. Veterinary Parasitology, 62: 199-206.
Food and Agricultural organization (FAO) (2004). Livestock sector brief: Ethiopia. Livestock information, sector analysis and policy branch (AGAL), FAO, Rome, Italy.
Getachew Terefe, Urgessa Faji & Yacob Hailu. (2013). Field investigation of anthelmintic efficacy and risk factors for anthelmintic drug resistance in sheep at Bedelle District of Oromia Region, Ethiopia. Ethiopian Veterinary Journal, 17 (2): 37-49.
Gills, B. S. (1993). Anthelmintic resistance in India. Veterinary Record, 133: 603-604.
HADB (2009). Concise annual reports of Haramaya District Agricultural Development Bureau, Haramaya.
Kassahun Asmare., Esayas Gelaye & Gelagaye Ayelet. (2005). Anthelmintic resistance test in gastroin-testinal nematodes of small ruminants in Southern Ethiopia. Bulletin of Animal Health and Production in Africa, 53: 89-95.
Leathwick, D. M., Moen, I. C., Miller, C. M. & Sutherland, I. A. (2001). Ivermectin-resistant Ostertagia circumcincta from sheep in the lower North Island and their susceptibility to other macrocyclic lactone anthelmintics. New Zealand Veterinary Journal, 49: 123-124.

Walkite et al East African Journal of Veterinary and Animal Sciences 1(1): 13-18
18
Sabkeber Mideksa, Negesse Mekonnen & Yimer Muktar (2014). Prevalence and burden of nematode parasites of small ruminants in and around Haramaya University. World Applied Sciences Journal, 34: 644-651
Shimelis Dagnachew, Asmare Amamute & Wudu Temesgen (2011). Epidemiology of gastrointestinal helminthiasis of small ruminants in selected sites of north Gondar zone, northwest Ethiopia, Ethiopian Veterinary Journal, 15: 57-68
Sissay Menkir, Asefa Asmare, Uggla, A. & Waller, P.J. (2006a). Anthelmintic resistance of nematode parasites of small ruminants in eastern Ethiopia: exploitation of refugia to restore anthelmintic efficacy. Veterinary Parasitology, 135: 337-346.
Sissay Menkir, Assefa, Asmare, Uggla, A. & Waller, P. J. (2006b). Assessment of anthelmintic resistance in nematode parasites of sheep and goats owned by small holder farmers in Eastern Ethiopia. Tropical Animal Health and Production, 38: 215-222.
Sissay Menkir, Uggla, A. & Waller, P. J (2007). Prevalence and seasonal incidence of nematode parasites and fluke infections of sheep and goat in eastern Ethiopia. Tropical Animal Health and Production, 39, 521-531.
Suarez, V. H & Cristel, S. L. (2014). Risk factors for anthelmintic resistance development in cattle gastrointestinal nematodes in Argentina. Brazilian Journal of Veterinary Parasitology, 23: 129-135.
Takele Sori, Yacob Hailu and Getachew Terefe (2013). Parasite control practices and anthelmintic efficacy field study on gastrointestinal nematode infections of Horro sheep in Western Oromiya, Ethiopia. African Journal of pharmacy and pharmacology, 7: 2972-2980.
Taylor, M. A., Hunt, K. R. & Goodyear, K. L. (2002). Anthelmintic resistance detection methods: a review. Veterinary Parasitology, 103: 183-194.
Uhlinger, C; Fleming, S. & Moncol, D. (1992). Survey for drug resistant gastrointestinal nematodes in 13 Commercial sheep flocks. Journal of the American Veterinary Medical Association, 201: 77-80.
Urquhart, G. M., Armour, J., Duncan, J. L., Dunn, A. M. & Jenning, F. W. (1996). Veterinary Parasitology, 2nd
edition, Blackwell Science, UK Vadlejch, J., Kopecky, O., Kudrnacova, M., Cadkova,
Z., Jankovska, I. & Langrova, I. (2014). The effect of risk factors of sheep flock management practices on the development of anthelmintic resistance in the Czech Republic. Small Ruminant Research, 117: 183-190.
Wolstenholme, A. J., Prichard, R., Samson-Himmelstjerna, G. V. & Sangster, N. C. (2004). Drug resistance in veterinary helminthes. Trends in Parasitology, 20:469-476.

East African Journal of Veterinary and Animal Sciences (2017) Volume 1 (1) 19-30
___________________________________________ *Corresponding Author. E-mail: [email protected] ©Haramaya University, 2017
Protective Efficacy of Lepidium sativum, Capsicum frutescens and their Mixtures against Experimentally Induced Eimeria tenella Infection in Broiler Chickens Mengistu Urge1*, Kassa Shawle2, Getachew Animut3, Tesfaheywet Zeryehun4, and Meskerem Adamu5
1 School of Animal and Range Sciences, Haramaya University, P. O. Box 138, Dire Dawa, Ethiopia 2Department of Animal and Range Sciences, Wolaita Sodo University, P. O. Box 138, Wolaita Sodo, Ethiopia 3Agricultural Transformation Agency, P. O. Box 708, Addis Ababa, Ethiopia. 4College of Veterinary Medicine, Haramaya University, P. O. Box 301, Dire Dawa, Ethiopia 5Debre Zeit Agricultural Research Center, P. O. Box 32, Debre Zeit, Ethiopia
Abstract: This study was aimed at evaluating the anticoccidial efficacy of Lepidium sativum
(Garden cress (GC)), Capsicum frutescens (Hot red pepper (Hrp)) and their mixtures powder in
broiler chickens. A total of 144 Cobb-500 broiler chickens were randomly allocated into six
treatment groups with three replications. The experiment lasted for 42 days. Rations were
fortified with 0.75% GC, 0.75% Hrp, 0.38% GC+0.38% Hrp and 0.0125% amprolium in groups
3, 4, 5, and 6, respectively and fed to the chicks starting on day two of age. Ration fed to chicks
in group 1 and 2 were without any additives. Chicks in groups 2, 3, 4, 5 and 6 were infected with
~105 sporulated Eimeria tenella oocyst per chick at the age of 15 days. Animal performance,
oocysts output, cecal lesion score, carcass and serum parameters were recorded during the
experiment. Uninfected-unfortified and amprolium ration groups in the starter period and group
that received ration fortified with a mixture of GC+Hrp and uninfected-unfortified ration in the
finisher phase resulted in a higher body weight gain (BWG). Across the entire experimental
period, BWG was higher in the uninfected-unfortified ration group. The average feed intake in
the entire period was higher in uninfected-unfortified ration, GC and amprolium groups. Broiler
chicks fed a diet fortified with GC 0.75% or amprolium (0.0125%) as additive were equally
effective to reduce E. tenella oocyst shed at day 6, 7, 8 and average total count post inoculation.
Infected chickens fed diet fortified with GC, Hrp and their mixtures showed cecal lesion similar
to those fed with infected-unfortified diet group at day 7 post inoculation. Highest intestinal
length at 27 days post inoculation was observed in the uninfected-unfortified ration group and
the shortest length was noticed in infected-unfortified ration group. In conclusion, broilers fed
diet fortified with GC 0.75%, Hrp 0.75%, GC 0.38%+Hrp 0.38% mixture and amprolium
0.0125% showed better BWG at the end of the production phase than infected-unfortified ration
group. Garden cress and amprolium lowered oocyst shed indicating better protection against E.
tenella infection.
Keywords: Cecal lesion; Eimeria tenella; Feed additive; Oocyst shed; Phytogenic
Introduction Coccidiosis is a protozoan disease caused by Eimeria species that affect the intestinal tract of poultry and cause considerable economic loss to the poultry industry (Dalloul and Lillehoj, 2005). This disease causes moderate to severe damage to the intestinal epithelium, resulting in reduced growth rate, impaired feed conversion and often overt morbidity and mortality in chicken (Chandrakesan et al., 2009). Among the nine different Eimeria species known to infect chickens, E. tenella infection causes a severe disease characterized by hemorrhagic lesion development in the cecum leading to high morbidity and mortality, and reduced weight gain (McDougald and Fitz-Coy, 2008). In Ethiopia, the incidence of poultry coccidiosis has been reported to exist in many parts of the country. Lobago et al. (2005) reported 38% mortality in Kombolcha Poultry Multiplication Center and Dinka and Yacob (2012) noted 72% mortality in Debre zeit Agricultural Research Center poultry farm due to coccidiosis outbreak.
Currently, coccidiosis control programs in the poultry industry across the world are largely relying on chemotherapy and immunoprophylaxis measures. While these methods are effective for the control of avian coccidiosis, the continuous uses of anticoccidial drugs have led to the emergence of drug-resistant strains (Abbas et al., 2008). Furthermore, drug residue in poultry products has been a potential deterrent to the use of poultry products by consumers. Producers also incur high costs for medication, which results to increased cost of poultry products. Hence, searching for natural, cheap and safe alternative means of treatment against the control of coccidiosis infection has been an area of research in the recent past (Williams, 2006). Accordingly, anticoccidial properties of various natural products were reported (Abbas, 2012; Meskerem and Bookaewan, 2013). Herbs and spices rich in alkaloids, antioxidants (Naidoo et al., 2008) and diets high in n-3 fatty acids (Allen et al., 1996, 1997) are reported to have value for treating coccidiosis in chickens.

Mengistu et al. East African Journal of Veterinary and Animal Sciences Volume 1 (1) 19-30
20
Diwakar et al. (2010) noted that the essential oil derived from Lepidium sativum (garden cress (GC)) seed contains tocopherol, carotenoid, oleic acid and α-linolenic acid. Garden cress seed possesses varied medicinal properties and is known as “versatile medicine”. It has been used to treat various kinds of human and animal ailments such as diarrhea, dysentery, unidentified gastrointestinal disorder, stomach-ache, indigestion, febrile disease and skin disorders (Teklehaymanot et al., 2007). It also has antihypertensive, diuretic and hypoglycaemic effects (Maghrani et al., 2005), known to improve asthmatic attacks (Paranjape and Mehta, 2006), and possesses aperients, alterative, tonic and carminative activities (Sumangala et al., 2004; Patel et al., 2009). Similarly, Capsicum frutescens (hot red pepper (Hrp) is said to have a pungent taste because of capsaicin and it is used as spice, feed additive and drug (Nwaopara et al., 2007). Other biologically active phytochemical constituents in this plant include alkaloids, mucilages, reducing compounds, sterols and polyterpenes (Dougnon et al., 2014). These components gives Hrp several pharmacological properties especially against obesity, hyperglycemia, hypercholesterolaemia, hyperlipidaemia (Takashi et al., 2004), pain, gastric ulcer (Suk-Hyun et al., 2006), pneumonia (Newall et al., 1996), diarrhea and inflammation. Moreover, Hrp has been reported to have antioxidative (Sun et al., 2007), immunomodulatory (Takano et al., 2007) and anti-carcinogenic (Suk-Hyun et al., 2006) effects.
Furthermore, there is preclinical and clinical evidence that Hrp may have beneficial actions in protecting against lesion formation in the gastric and intestinal mucosa in part by alleviating oxidative stress (Holzer, 2004). Despite the aforementioned manifold health benefits of GC and Hrp, their natural anticoccidial effects against broiler coccidiosis was not sufficiently investigated. Therefore, the present study aimed to investigate the effects of Garden cress, Hot red pepper and their mixtures powder against E. tenella in experimentally infected Cobb-500 broiler chickens.
Materials and Methods Experimental Site, Feed Ingredients and Ration Formulation The experiment was conducted at Haramaya University poultry farm, Ethiopia, east of the capital Addis Ababa. The feed ingredients used to formulate the experimental rations are presented in Table 1. After contaminant materials were removed, the GC and Hrp were hammer milled to powder. Corn grain, noug seed meal and limestone were milled through a sieve size of 5 mm. Six standard isocaloric and isonitrogenous starter and finisher treatment rations were formulated (Table 1). The rations were formulated to meet the nutrient requirement of starter and finisher broilers as described by Leeson and Summers (2005).

Mengistu et al. Efficacy of Lepidium sativum, Capsicum frutescens and their Mixtures
21
Table 1. Ingredients used to formulate experimental rations and their chemical composition
Ingredients%
Treatment groups
G1 G2 G3 G4 G5 G6
Starter Finisher Starter Finisher Starter Finisher Starter Finisher Starter Finisher Starter Finisher
Corn grain 50 57 50 57 50 57 50 57 50 57 50 57 Noug Seed Meal 17 17.3 17 17.3 16 17.3 16 16.6 16.5 17.3 17 17.3 Soybean Meal 30 23 30 23 30 23 30 23 30 23 30 23 Garden Cress - - - - 0.75 0.75 - - 0.38 0.38 - - Hot red pepper - - - - - - 0.75 0.75 0.38 0.38 - - Amprolium - - - - - - - - - - 0.0125 0.0125 Premix* 0.5 0.5 0.5 0.5 0.5 0.5 0.5 0.5 0.5 0.5 0.5 0.5 Salt 0.5 0.4 0.5 0.4 0.5 0.4 0.5 0.4 0.5 0.4 0.5 0.4 Limestone 1.5 1.5 1.5 1.5 1.5 1.5 1.5 1.5 1.5 1.5 1.5 1.5 DL-meth. 0.1 0.1 0.1 0.1 0.1 0.1 0.1 0.1 0.1 0.1 0.1 0.1 L-lysine HCL 0.2 0.2 0.2 0.2 0.2 0.2 0.2 0.2 0.2 0.2 0.2 0.2 Dry matter (%) and nutrient contents (%DM) of the ration Dry Matter 93 93 93 93 92.7 93 92.7 93 92.7 93 93 93 Crude Protein 22.6 20.3 22.6 20.3 22.5 20.3 22.55 20.3 22.55 20.3 22.6 20.3 Ether extract 4.75 4.62 4.75 4.62 4.66 4.62 4.66 4.62 4.66 4.62 4.75 4.62 Crude fiber 7.17 7.0 7.17 7.0 7.2 7.0 7.4 7.0 7.3 7.0 7.17 7.0 ME (kcal/kg DM) 3171 3218 3171 3220 3178 3221 3172 3218 3174 3221 3189 3218 Calcium 0.93 0.91 0.93 0.91 0.92 0.91 0.92 0.91 0.92 0.91 0.93 0.91 Phosphorus 0.58 0.3 0.58 0.3 0.58 0.3 0.58 0.3 0.58 0.3 0.58 0.3
*Vitamin and mineral premix =25 kg contains: Vitamins: Vit. A (E672), 75,000,000 IU; Vit. D3 (E671), 25,000,000 IU; Vit. E (all-rac-alpha tocopherylacetate) (3a700), 20,000 mg; Vit. K3, 2,000 mg; Vit. B1, 1,500 mg; Vit. B2 (riboflavin), 5,000 mg; Vit. B3 (calcium-D-pantothenate), 9,001 mg; Vit. B6 (3a831), 5,000 mg; Vit. B12 (cyanocobalamin), 25,000 mcg; Vit. pp (nicotinic acid), 30,003 mg; Folic Acid, 1,000 mg; Biotin, 100,000 mcg, Choline, 648,750 mg; Minerals: Iron, 45,000; Copper (Cu, E4), 15,000 mg; Manganese (Mn, E5), 75,001 mg; Zinc oxide-Zinc (Zn, E6), 70,001 mg; Iodine (I, E2), 2,000 mg; Selenium (Se, E8), 400,050 mcg; Calcium, 1,231,662 mg; Magnesium, 12,687 mg; Sodium, 952 mg; Chloride, 185,313 mg; BHT, 500 mg. DM: Dry matter; ME: Metabolizable energy; G1: Uninfected-unfortified ration; G2: Infected-unfortified ration; G3: Infected-0.75% Garden cress; G4: Infected-0.75% Hot red pepper; G5: Infected-0.38% Garden cress+0.38% Hot red pepper; G6: Infected-0.0125% Amprolium.

Mengistu et al. East African Journal of Veterinary and Animal Sciences Volume 1 (1) 19-30
22
Managements of Experimental Broilers The experimental house and pens, watering and feeding troughs were thoroughly cleaned, disinfected and sprayed against external parasites before placing the birds. The chicks were vaccinated with HB1 at day 7 as eye drop as a preventive treatment against Newcastle disease. The chicks were brooded using 250 watt infrared electric bulbs as sources of heat and light. Teff straw was used as a litter material at a depth of approximately 7 cm. Feed and clean tap water were offered ad libitum throughout the experiment. Experimental Design and Treatments The experiment was carried out using a completely randomized design (CRD). One hundred forty four unsexed day old Cobb-500 broiler chickens with initial body weight of 38.5 ± 0.82 g (mean ± SD) were randomly allotted into six dietary groups each consisting three replicates of 8 chicks (Table 2). At the age of 15 days, all chickens except those in group 1 were orally inoculated with ~105 sporulated E. tenella oocysts per 1 mL of inoculums (Long et al., 1976) using a calibrated syringe. Chicken in group 3, 4, 5 and 6 were fed with ration fortified with 0.75% GC, 0.75% Hrp, 0.38% GC+0.38% Hrp mixture and 0.0125% amprolium, respectively from 2 to 42 days of age. The birds were monitored daily for the presence of clinical signs. Table 2. Layout of the experiment
Groups
Chicks/ treatment
Oocysts challenge
G1 Uninfected-unfortified ration
24 _
G2 Infected-unfortified ration )
24 +
G3 0.75% Lepidium sativum seed powder
24 +
G4 0.75% Capsicum frutescens powder
24 +
G5 0.38% L. sativum + 0.38% C. frutescens mixture
24 +
G6 0.0125% amprolium 24 +
Oocysts challenge = Challenge with ~100,000 sporulated E. tenella oocysts; (-) = No infection; (+) = Infection with sporulated E. tenella oocysts. Isolation and Propagation of Eimeria tenella Oocysts Eimeria tenella oocysts were identified by a combination of oocysts size, location in the gut and appearance of the lesions (McDougald and Fitz-Coy, 2008). Following evisceration at post-mortem of coccidia suspected birds, the cecal contents were washed into a beaker using tap water and the oocysts were isolated using a flotation procedure (Permin and Hansen, 1998). Oocysts were sporulated by incubating concentrated suspension of oocysts in distilled water with 2.5% potassium dichromate solution (K2Cr2O7) and with forced aeration at room temperature for 72 hours
(Bowman, 2009). The sporulated E. tenella oocysts were suspended in 2.5% K2Cr2O7 solution and refrigerated at 4 ºC until oral administration. The K2Cr2O7 solution was removed through 5 times centrifugation by distilled water and the sporulated E. tenella oocysts were suspended in distilled water at the time of oral administration. The sporulated E. tenella oocysts were orally inoculated in three chickens for oocyst multiplication. Chickens were monitored daily for the development of clinical coccidiosis and the presence of Eimeria oocysts in their feces. Then the reproduced oocysts were sporulated, stored and washed as described earlier for the actual experiment. Data Collection Intake and body weight gain: The amount of feed offered and refused was recorded daily and the amount consumed was determined as the difference between the feed offered and refused. Birds were weighed weekly in a group per pen and pen average was calculated by dividing the total pen weight by the broilers alive on that day. Body weight (BW) change was calculated as the difference between the final and initial BW. Average daily gain (ADG) was calculated as BW change divided by the number of experimental days. Feed conversion ratio was computed as the ratio of daily DM consumption per ADG. The general health of the birds daily and mortality as occurred were also recorded. Estimation of oocyst: Fresh fecal droppings from the ground of each pen were collected in sterile universal plastic bottles from all experimental groups on day 14 and oocysts counted were recorded as pre-inoculation measure. Oocyst count per gram of feces (OPG) was determined by McMaster egg counting technique and calculated using the technique described by Permin and Hansen (1998). During the post-inoculation period, fecal samples in each pen were collected from randomly selected sites on days 4, 5, 6, 7, 8, 9, 14, 20 and 27, mixed well, and the oocysts were counted and recorded. Pathological study: On day 7 and 27 post inoculation, three randomly selected chickens from each replicate were euthanized by cervical dislocation for cecal lesion scoring according to the method of Johnson and Reid (1970). The scoring scales ranged from 0 to +4, where: 0 = no lesion (the wall is thin and presents characteristic longitudinal groves and mucosal folds; the contents are homogenous and creamy and do not contain any particles; the color is chestnut), +1= mild lesion (with few scattered petechia, the cecal contents are normal; the petechiae are more visible on the serous membrane than on the mucosal side), +2= moderate lesion (with numerous petechia, bleeding and the cecal wall is slightly thickening; visible bloody contents at the proximal end), +3= severe lesion (with severe bleeding and clotting, the caecal walls are greatly thickened; the feacal contents have practically disappeared) and +4= extremely severe lesion (with severe bleeding, a much thickened or

Mengistu et al. Efficacy of Lepidium sativum, Capsicum frutescens and their Mixtures
23
rupture of caecal wall, feacal debris is no longer visible; it is enclosed in the caseous plugs; gangrene or death, assigned to dead fowl). Cecal and intestinal length (gizzard to cloaca) was also measured. Carcass measures: At the end of the experiment, three randomly selected broilers’ used for cecal lesion scoring at 27 days post-mortum were selected randomly from each replicate, starved for 12 hours, weighed and slaughtered. Birds were eviscerated and carcass cuts and non-edible offal components were determined according to the procedure described by Kekeocha (1985). Dressed weight was measured after the removal of blood and feather and the dressing percentage was calculated as the proportion of dressed carcass weight to slaughter weight. Eviscerated carcass weight was determined after removing blood, feather, shank, head, kidney, lungs, pancreas, crop, proventriculus, small intestine, large intestine, caeca and urogenital tracts. The eviscerated percentage was determined as the proportion of slaughter weight. Drumstick, thigh, breast meat, heart, gizzard and liver were separated, weighed and calculated as a percentage of slaughter weight. Fat around the proventriculus, gizzard, against the abdominal wall and the cloacae were separated, weighed and expressed as a percentage of slaughter weight. Serum biochemical parameters: Blood for serum biochemical analysis were collected from the same birds slaughtered for caecal lesion analysis. Each blood sample was collected without anticoagulant for serum biochemical analysis. Serum was separated after centrifugation at 3,000 rpm x g for 15 min and stored at -20 0C until analyzed. Total serum protein was determined by refractometer (George, 2001). Total serum immunoglobulin concentration was determined by serum zinc sulfate turbidity test by reading the optical density of the test and the control separately at 545 nm by using spectrophotometer (Mondesire, 2004). Data Processing and Analysis Data were analyzed using GLM model in a completely randomized design (CRD). Data analysis was done using
SAS (SAS Institute, 2008). Duncan’s multiple range test was used to detect the differences (p<0.05) among group means. Prior to statistical testing, mortality values were logarithmically transformed [log10(X+1)] to create a normal distribution. The difference between treatment groups were considered significant at p < 0.05 level.
Results Feed Intake, Body Weight Gain, Feed Conversion Ratio, and Mortality Body weight gain (BWG), feed intake (FI) and feed conversion ratio (FCR) during the first 15 days (pre-inoculation period) were not different (p>0.05) among treatment groups (Table 3). However, BWG and FCR were better during the third week (first week after inoculation) in uninfected-unfortified group followed by GC and amprolium received groups. At the end of week 4 higher BWG was recorded for uninfected-unfortified group. Overall BWG at the end of starter phase (1–21 days) was higher (P<0.05) in uninfected-unfortified and amprolium ration groups (Table 3). In the finisher phase (22–42 days) BWG in groups uninfected-unfortified and group consumed ration fortified with GC+Hrp mixture were not different and higher (p<0.05) than GC, Hrp and amprolium ration groups. When considered for the entire period of broiler production (1-42 days) BWG was highest for the uninfected-unfortified ration group, lowest for the infected-unfortified ration group, and intermediate for the other groups (p<0.05). However, FCR for the entire period was unaffected by treatment groups (p>0.05). Feed intake was lower for infected-unfortified treatment as compared to the uninfected-unfortified, 0.75% GC and amprolium groups.
Mortality was higher in the starter (1–21 days) than the finisher phase of the experiment with no deaths recorded in the group consumed ration fortified with 0.75% GC and 0.38% GC+0.38% Hrp mixture. In the finisher phase (22–42 days), mortality was recorded only in uninfected-unfortified and amprolium ration groups. However, mortality rate was not significant among the groups over the entire production period.
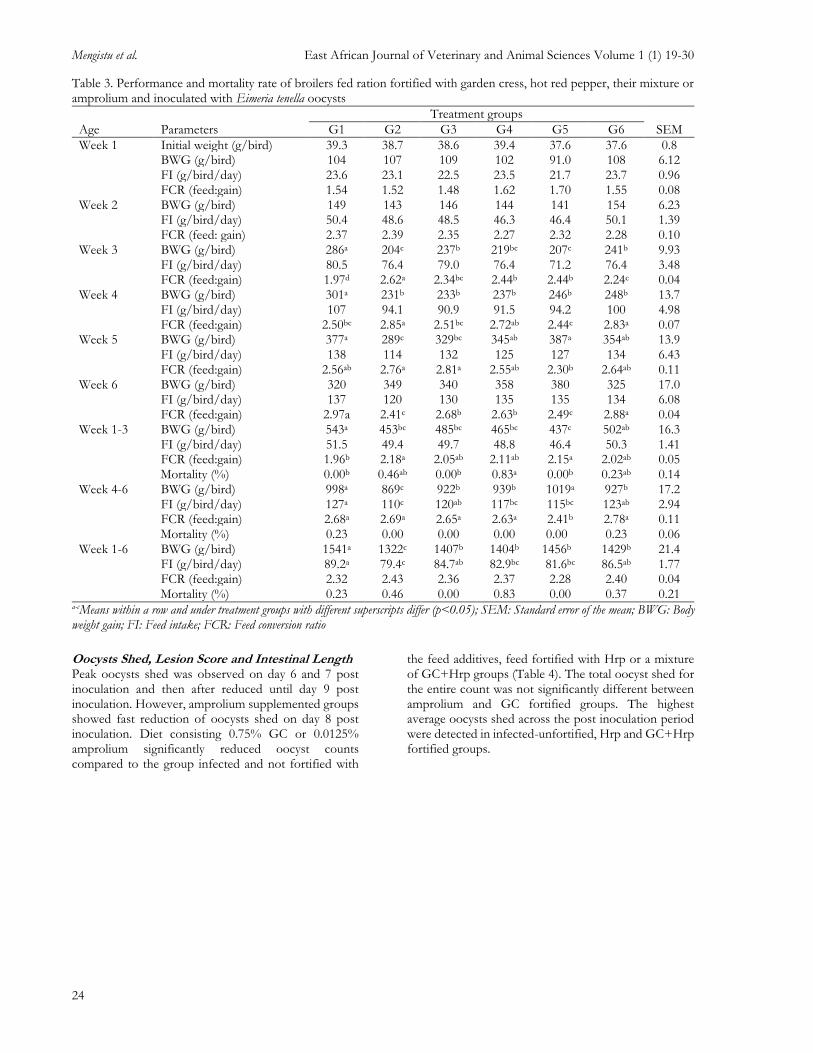
Mengistu et al. East African Journal of Veterinary and Animal Sciences Volume 1 (1) 19-30
24
Table 3. Performance and mortality rate of broilers fed ration fortified with garden cress, hot red pepper, their mixture or amprolium and inoculated with Eimeria tenella oocysts
Treatment groups
Age Parameters G1 G2 G3 G4 G5 G6 SEM
Week 1 Initial weight (g/bird) 39.3 38.7 38.6 39.4 37.6 37.6 0.8 BWG (g/bird) 104 107 109 102 91.0 108 6.12 FI (g/bird/day) 23.6 23.1 22.5 23.5 21.7 23.7 0.96 FCR (feed:gain) 1.54 1.52 1.48 1.62 1.70 1.55 0.08
Week 2 BWG (g/bird) 149 143 146 144 141 154 6.23 FI (g/bird/day) 50.4 48.6 48.5 46.3 46.4 50.1 1.39 FCR (feed: gain) 2.37 2.39 2.35 2.27 2.32 2.28 0.10
Week 3 BWG (g/bird) 286a 204c 237b 219bc 207c 241b 9.93 FI (g/bird/day) 80.5 76.4 79.0 76.4 71.2 76.4 3.48 FCR (feed:gain) 1.97d 2.62a 2.34bc 2.44b 2.44b 2.24c 0.04
Week 4 BWG (g/bird) 301a 231b 233b 237b 246b 248b 13.7 FI (g/bird/day) 107 94.1 90.9 91.5 94.2 100 4.98 FCR (feed:gain) 2.50bc 2.85a 2.51bc 2.72ab 2.44c 2.83a 0.07
Week 5 BWG (g/bird) 377a 289c 329bc 345ab 387a 354ab 13.9 FI (g/bird/day) 138 114 132 125 127 134 6.43 FCR (feed:gain) 2.56ab 2.76a 2.81a 2.55ab 2.30b 2.64ab 0.11
Week 6 BWG (g/bird) 320 349 340 358 380 325 17.0 FI (g/bird/day) 137 120 130 135 135 134 6.08 FCR (feed:gain) 2.97a 2.41c 2.68b 2.63b 2.49c 2.88a 0.04
Week 1-3 BWG (g/bird) 543a 453bc 485bc 465bc 437c 502ab 16.3 FI (g/bird/day) 51.5 49.4 49.7 48.8 46.4 50.3 1.41 FCR (feed:gain) 1.96b 2.18a 2.05ab 2.11ab 2.15a 2.02ab 0.05
Mortality (%) 0.00b 0.46ab 0.00b 0.83a 0.00b 0.23ab 0.14 Week 4-6 BWG (g/bird) 998a 869c 922b 939b 1019a 927b 17.2
FI (g/bird/day) 127a 110c 120ab 117bc 115bc 123ab 2.94 FCR (feed:gain) 2.68a 2.69a 2.65a 2.63a 2.41b 2.78a 0.11
Mortality (%) 0.23 0.00 0.00 0.00 0.00 0.23 0.06 Week 1-6
BWG (g/bird) 1541a 1322c 1407b 1404b 1456b 1429b 21.4 FI (g/bird/day) 89.2a 79.4c 84.7ab 82.9bc 81.6bc 86.5ab 1.77 FCR (feed:gain) 2.32 2.43 2.36 2.37 2.28 2.40 0.04
Mortality (%) 0.23 0.46 0.00 0.83 0.00 0.37 0.21 a-cMeans within a row and under treatment groups with different superscripts differ (p<0.05); SEM: Standard error of the mean; BWG: Body weight gain; FI: Feed intake; FCR: Feed conversion ratio
Oocysts Shed, Lesion Score and Intestinal Length Peak oocysts shed was observed on day 6 and 7 post inoculation and then after reduced until day 9 post inoculation. However, amprolium supplemented groups showed fast reduction of oocysts shed on day 8 post inoculation. Diet consisting 0.75% GC or 0.0125% amprolium significantly reduced oocyst counts compared to the group infected and not fortified with
the feed additives, feed fortified with Hrp or a mixture of GC+Hrp groups (Table 4). The total oocyst shed for the entire count was not significantly different between amprolium and GC fortified groups. The highest average oocysts shed across the post inoculation period were detected in infected-unfortified, Hrp and GC+Hrp fortified groups.

Mengistu et al. Efficacy of Lepidium sativum, Capsicum frutescens and their Mixtures
25
Table 4. Eimeria tenella oocyst excretions of broilers fed diet fortified with garden cress, hot red pepper, their mixtures or amprolium inoculated with Eimeria tenella oocysts
Days
Treatments (Oocyst per gram of feces * 1000) SEM G1 G2 G3 G4 G5 G6
Pre-inoculation 0.00 0.00 0.12 0.02 0.02 0.03 0.05 Day 4 PI 0.03 0.25 0.22 0.10 0.12 0.07 0.06 Day 5 PI 0.52b 8.80a 6.37ab 12.3a 5.85ab 11.2a 2.42 Day 6 PI 0.10c 99.6a 23.7bc 101a 71.0ab 54.4abc 20.9 Day 7 PI 0.00b 176a 77.7b 86.7ab 174a 60.0b 28.5 Day 8 PI 0.50d 47.0bc 42.9bc 75.4b 136a 15.2cd 12.5 Day 9 PI 0.07 9.67 18.4 9.73 11.1 7.03 4.8 Day 14 PI 1.70 19.7 15.6 32.9 19.9 15.0 14.2 Day 20 PI 26.4 11.2 9.87 17.4 3.00 0.73 9.37 Day 27 PI 5.85 0.90 0.60 0.58 7.90 0.38 3.54 Total count 35.2c 373a 196b 337a 429a 164b 31.8
a-d Means within a row with different superscripts differ (p<0.05); SEM: Standard error of the mean; PI: Post-inoculation; G1: Uninfected-unfortified ration; G2: Infected- unfortified ration; G3: Infected-0.75% Garden cress; G4: Infected-0.75% Hot red pepper; G5: Infected-0.38% Garden cress+0.38% Hot red pepper; G6: Infected-0.0125% Amprolium.
Cecal lesion was significantly different (p<0.05) among treatment groups at 7 days post inoculation (Table 5; Fig. 1). Infected broilers fed a diet for tified with 0.75% GC, 0.75% Hrp and their mixtures showed higher cecal lesion similar to those in infected-unfortified ration group. As expected, no lesions were observed in the cecum of uninfected-unfortified and amprolium fortified groups at 7 days post-inoculation. Significantly higher cecal lesion score was observed in the uninfected-unfortified ration group followed by 0.75%
GC fortified ration groups at 27 days post-inoculation. Shortest intestinal length (from gizzard to cloaca) at 7 days post-inoculation was recorded in uninfected-unfortified ration group followed by infected 0.38% GC+0.38% Hrp fortified ration groups. Longest length at 27 days post-inoculation was observed in the uninfected-unfortified ration group followed by infected 0.75% GC ration group and the shortest length was noticed in infected-unfortified ration group.
Table 5. Intestinal length and cecal lesion score of broilers fed with diet fortified with garden cress, hot red pepper, their mixtures, or amprolium and inoculated with Eimeria tenella oocysts
Parameters
Treatment groups
G1 G2 G3 G4 G5 G6 SEM
22 days of age (7 days post inoculation)
Slaughter weight (g) 529 510 506 519 458 535 34.0 Cecal length (cm) 11.5 12.7 11.3 12.2 10.6 12.1 0.71 Intestinal length (cm) 121c 137ab 140ab 147a 130bc 147a 4.94 Cecal lesion score 0.14b 1.83a 2.33a 2.19a 2.17a 0.00b 0.47 42 days of age (27 days post inoculation) Slaughter weight (g) 1574 1398 1568 1524 1541 1523 72.8 Intestinal length (cm) 195a 158c 187ab 179abc 180abc 170bc 7.61 Cecal length (cm) 17.2 17.2 18.5 18.6 17.8 17.5 0.83 Cecal lesion score 0.67a 0.00b 0.25ab 0.00b 0.00b 0.00b 0.15
a-c Means within a row and under treatment groups with different superscripts differ (p<0.05); SEM: Standard error of the mean; G1: Uninfected-unfortified ration; G2: Infected-unfortified ration; G3: Infected-0.75% Garden cress; G4: Infected-0.75% Hot red pepper; G5: Infected-0.38% Garden cress+0.38% Hot red pepper; G6: Infected-0.0125% Amprolium.

Mengistu et al. East African Journal of Veterinary and Animal Sciences Volume 1 (1) 19-30
26
Figure 1. Gross lesions of Eimeria tenella oocysts infected broiler chicken caeca. a: Unopened ceca severely affected and distended with blood; b: Opened filled with blood.
Carcass Measures Slaughter weight, dressed weight, eviscerated percentage, carcass, breast, drumstick, thigh, heart, liver and abdominal fat percentage were not significantly different (p>0.05) among the treatments. However,
lower percentage of gizzard was observed in amprolium followed by GC+Hrp mixture and infected-unfortified ration groups (Table 6).
Table 6. Carcass characteristics of Eimeria tenella oocysts inoculated broilers fed with diet fortified with garden cress, hot red pepper, their mixtures or amprolium
Treatment groups
Parameters G1 G2 G3 G4 G5 G6 SEM
Slaughter weight (g) 1574 1398 1568 1524 1541 1523 72.8 Dressed weight (g) 1438 1284 1437 1391 1412 1393 70.6 Dressing percentage 91.3 91.8 91.6 91.2 91.6 91.4 0.47 Eviscerated weight (g) 1143 1017 1117 1107 1097 1098 60.2 Eviscerated percentage 72.6 72.6 71.3 72.6 71.1 71.8 1.24 Carcass weight (g) 1065 952 1042 1032 1027 1030 58.2
Carcass percentage 67.7 67.9 66.5 67.7 66.6 67.4 1.32 Breast percentage 24.1 22.7 24.3 23.0 23.5 23.6 1.04 Drumstick percentage 8.68 8.51 8.88 8.70 8.92 8.71 0.27 Thigh percentage 10.2 10.4 10.2 10.5 10.4 10.0 0.33 Thigh + drumstick (%) 18.9 18.9 19.0 19.2 19.3 18.7 0.52 Heart percentage 0.58 0.67 0.64 0.68 0.61 0.64 0.06 Liver percentage 2.14 2.08 2.25 2.24 2.21 2.26 0.10 Gizzard percentage 1.93a 1.86ab 1.91a 2.11a 1.82ab 1.55b 0.11 Abdominal fat (%) 1.68 1.93 1.42 2.06 2.07 2.13 0.37
a,b Means within a row and under treatment with different superscripts differ (p<0.05); SEM: Standard error of the mean; G1: Uninfected-unfortified ration; G2: Infected- unfortified ration; G3: Infected-0.75% Garden cress; G4: Infected-0.75% Hot red pepper; G5: Infected-0.38% Garden cress+0.38% Hot red pepper; G6: Infected-0.0125% Amprolium. Serum Biochemical Parameters The effect of experimental diets on some serum biochemical parameters of broiler chickens at 22 days of age (7 days post-inoculation) is given in Table 7.
There was no significant differences (p<0.05) among groups in serum total protein and total serum immunoglobulin concentration.
a b

Mengistu et al. Efficacy of Lepidium sativum, Capsicum frutescens and their Mixtures
27
Table 7. Serum parameters of broilers fed diet fortified with garden cress, hot red pepper, their mixtures or amprolium and inoculated with E. tenella oocysts at 7 days post inoculation
Treatment groups
Parameters G1 G2 G3 G4 G5 G6 SEM
Total protein (g/dl) 3.10 2.80 2.70 3.03 2.33 3.20 0.23 TIG (mg/dl) 2.03 1.61 1.91 1.84 1.24 1.73 0.24
SEM: Standard error of the mean; TIG: Total immunoglobulin; G1: Uninfected-unfortified ration; G2: Infected-unfortified ration; G3: Infected-0.75% Garden cress; G4: Infected-0.75% Hot red pepper; G5: Infected-0.38% Garden cress+0.38% Hot red pepper; G6: Infected-0.0125% Amprolium.
Discussion Improved growth performance and feed intake of E. tenella infected broilers fed ration fortified with GC, Hrp, their mixture or amprolium than the infected-unfortified ration group in the finisher and entire production period indicate that such feed additives play a role in the prevention of E. tenella in broilers. This could be an attribute of the immuno-stimulant or the appetite and digestive enzymes stimulating properties of GC and Hrp (Jang et al., 2007) due to the different bioactive ingredients in these additives (Frankic et al., 2009). Feed supplements with herbs and spices increase stability of feed and beneficially influence the gastrointestinal ecosystem mostly through growth inhibition of pathogenic microorganisms, which consequently reduce exposure of the digestive system to the toxins of microbiological origin (Windisch et al., 2008). Subsequently, herbs and spices help to increase the resistance of the animals exposed to different stress situations and increase the absorption of essential nutrients, and improve the growth of animals (Windisch et al., 2008). In his review, Rosen (1995) noted that supplementation with ionophores or phenolic compounds improve performance of fast-growing broilers. Meskerem and Bookaewan (2014) also reported significantly higher BWG for chickens challenged with E. tenella and fed diet containing L. sativum than those fed the control diet. Significantly lower BWG in infected-unfortified diet group following the infection was a consequence of reduced feed intake and the probably disrupted intestinal integrity, which might have affected the absorption of nutrients and the efficiency of feed utilization, which is ascribed to be the common effects of coccidiosis (Walk et al., 2011). No mortality was observed in all phases of production period in groups fed diet fortified with GC or GC+Hrp even though no significant difference was recorded among the treatments. The result of the work by Meskerem and Bookaewan (2014) also demonstrated that supplementation with L. sativum following E. tenella infection significantly reduced mortality rate than those fed the control diet. Although broilers in the infected-unfortified, Hrp and GC+Hrp mixture ration groups had larger number of excreted oocysts, mortality remain lower across the production period. This was in agreement with the study conducted by Almeida et al. (2014) who infected broilers with E. acervulina and E. maxima and found larger oocyst count in the positive group, but similar mortality compared with the group
not infected. Lower mortality might be due to relatively lower cecal lesion scores across all the treatment groups. Sever infection that may lead to death should display cecal lesion score of +4 (Johnson and Reid, 1970), but in this experiment the average higher cecal score recorded was 2.33, which is not sever enough to cause high mortality. The parasite was not completely suppressed in any of the infected treatment groups. However, the coccidial oocyst loads of GC and amprolium groups were lower than the infected-unfortified and GC+Hrp groups. Lower oocyst in the GC group might be linked with the effect of the phenolic compounds, antioxidants and high n-3 fatty acids. L. sativum seed oil is rich in tocopherol, carotenoid and fatty acids such as oleic and α-linolenic acids (Diwakar et al., 2010). The hydrophobic essential oils possess the ability to intrude the bacterial cell membrane and disintegrate membrane structure and cause ion leakage (Windisch et al., 2009). It has been also reported that antioxidant-rich plant extracts and high n-3 fatty acids have a potential benefit in treating cecal coccidiosis infections in chickens (Allen et al., 1996; 1997; Naidoo et al., 2008).The result highlights the importance of commercial preparations of plant-based products to reduce the effect of coccidiosis infection in organic production systems (Abbas et al., 2012). Such products will improve intestinal health of chickens and thus reduce the effects caused by coccidiosis infection (Waldenstedt, 2003). Regarding anticoccidial property of the chemical amprolium, it acts as a thiamine analog that competitively inhibits the active transport of thiamine, negatively affecting Eimeria species without harming the broilers due to the comparatively greater sensitivity of the parasite than the host (Ruff and Chute, 1991). Broilers in the amprolium ration group showed no lesion in the cecum caused by E. tenella. Uninfected-unfortified group showed oocyst excretion between days 14 to 27 post-inoculation, even though there was no significant differences among treatments at these ages. As a result, cecal lesions at 27 days post inoculation were observed. This suggests contamination of pen litter of Eimeria parasites, even with the strict hygiene measures applied during the study. Flies, ants, other insects, and also the feet and hands of technicians may have served as vectors for the dissemination of the Eimeria parasites (Henken et al., 1994). But, BWG in the finisher and entire period was higher in uninfected-unfortified group than other treatment groups, suggesting that the low infection loads that occurred as a result of contamination

Mengistu et al. East African Journal of Veterinary and Animal Sciences Volume 1 (1) 19-30
28
did not influence performance attributes (Rosen, 1995). All infected chicken groups showed typical signs of coccidiosis including bloody diarrhea and weight loss compared to uninfected-unfortified group at the early age of infection. The higher cecal lesion occurred in GC during 27 days post-inoculation might be related to certain anti-nutritional factors present in GC. According to Agarwal and Sharma (2013), whole GC seed flour contains tannins, phytic acids, oxalic acid and cyanogens which might have an effect on lesion development in the cecum. Meskerem and Bookaewan (2014) noted that non-infected chickens fed a diet containing GC seed powder showed cecal lesions and mortality. The longer intestinal tract (gizzard to cloaca) recorded for the uninfected-unfortified group at 42 days of age might have provided larger absorptive capacity; hence the birds grew rapidly than infected-unfortified ration group. The shorter intestinal length observed in the infected-unfortified ration group might be due to the infection, thus, less surface area is available for absorption and consequently less tissue mass gain (Miles et al., 2006), which resulted to reduced performance of the birds. Carcass characteristics of broilers relative to live body weight did not significantly differ among treatment groups, which were in agreement with Ocak et al. (2008) who found no significant effect on carcass traits in broiler chickens supplemented with thyme (Thymus vulgaris). Inclusion of GC and Hrp into the diet of broilers also did not affect the development of liver and heart differently. Al-kassie et al. (2012) also reported no difference between treatments consumed different levels of Hrp and black pepper mixture on liver and heart percentage.
Conclusion Broilers fed ration fortified with GC 0.75%, Hrp 0.75%, GC 0.38%+Hrp 0.38% and amprolium 0.0125% in the entire production phase showed better BWG than infected-unfortified group. Garden cress (0.75%) and amprolium showed comparable reduction of E. tenella oocyst shed which is also an additional advantage over 0.75% Hrp and 0.38% GC+0.38% Hrp. However, 0.75% GC or 0.75% Hrp or 0.38% GC+0.38% Hrp can be used as an alternative feed additive to improve the body weight of broilers under areas where E. tenella infestation is common in all levels of production because of their availability, affordability and easy usage at farm level. However, the reason for the presence of slight cecal lesion in the GC group should be further investigated.
Acknowledgements The authors are greatly indebted to Haramaya University Research and Extension Affairs Office, Wolaita Sodo University and Ministry of Education for funding this project and providing necessary logistics. Haramaya University poultry farm, animal nutrition and animal physiology laboratory personnel are duly acknowledged
for their unreserved help during the trial and laboratory work.
Conflict of Interests The authors declare that they have no competing interests.
References Abbas, R. Z., Colwell, D. D. & Gilleard, J. (2012).
Botanicals: an alternative approach for the control of avian coccidiosis. World’s Poultry Science Journal, 68: 203-215.
Abbas, R. Z., Iqbal, Z., Sindhu, Z. D., Khan, M. N. & Arshad, M. (2008). Identification of cross resistance and multiple resistance in Eimeria tenella field isolates to commonly used anticoccidials in Pakistan. Journal of Applied Poultry Research, 17: 361-368.
Abbas, T.E. (2012). Phytogenic Feed Additives as a Coccidiostat in Poultry. Bulletin of Environment, Pharmacology and Life Sciences, 1(7): 22-24.
Agarwal, N. & Sharma, S. (2013). Appraisal of Garden Cress (Lepidium sativum L.) and Product Development as an all Pervasive and Nutrition Worthy Food Stuff. Annals. Food Science and Technology, 14(1): 77-84.
Al-Kassie, G. A. M., Butris, G. Y. & Ajeena, S. J. (2012). The potency of feed supplemented mixture of hot red Pepper and black pepper on the performance and some Hematological blood traits in broiler diet. International Journal of Advanced Biological Research, 2(1): 53-57.
Allen, P. C., Danforth, H. & Levander, O. A. (1997). Interaction of dietary flax-seed with coccidia infections in chickens. Poultry Science, 76: 822–827.
Allen, P. C., Danforth, H. D. and Levander, O. A. (1996). Diets high in n-3 fatty acids reduce cecal lesion scores in chickens infected with E. tenella. Poultry Science, 75: 179-185.
Almeida, G. F. D., Thamsborg, S. M., Madeira, A. M. B. N., Ferreira, J. F. S., Magalhães, P. M., Demattê, L. C., Filho, K. Horsted & Hermansen, J. E. (2014). The effects of combining Artemisia annua and Curcuma longa ethanolic extracts in broilers challenged with infective oocysts of Eimeria acervulina and E. maxima. Parasitology, 141: 347-355.
Bowman, D. D. (2009). Diagnostic parasitology, In: D.D. Bowman, (ed.). Parasitology for Veterinarians, 9th ed. Saunders, Elsevier, Inc. St. Louis, Missouri. USA, pp: 295–301
Chandrakesan, P., Muralidharan, K., Kumar, V. D., Ponnudurai, G., Harikrishnan, T. J. & Rani, K. S. V. N. (2009). Efficacy of a herbal complex against caecal coccidiosis in broiler chickens. Veterinary Archives, 79: 199-203.
Dalloul, R. A. & Lillehoj, H. S. (2005). Recent advances in immunomodulation and vaccination strategies against coccidiosis. Avian Diseases, 49:1–8.
Dinka Ayana & Yacob Hailu (2012). Coccidiosis in Fayoumi chickens at Debre Zeit agricultural research

Mengistu et al. Efficacy of Lepidium sativum, Capsicum frutescens and their Mixtures
29
center poultry farm, Ethiopia. European Journal of Applied Science, 4: 191-195.
Diwakar, B. T., Dutta, P. K., Lokesh, B. R. & Naidu, K. A. (2010). Physicochemical properties of garden cress (Lepidium sativum L.) seed oil. Journal of American Oil Chemistry Society, 87: 539-548.
Dougnon, T. J., Kiki, P., Dougnon, T. V. & Youssao, I. (2014). Evaluation of Capsicum frutescens powder effects on the growth performances, biochemical and hematological parameters in Hubbard broiler. Journal of Applied Pharmacological Science, 4(10): 038-043.
Frankic, T., Voljg, M., Salobir, J. & Rezar, V. (2009). Use of herbs and spices and their Extracts in animal nutrition. Acta argiculturae Slovenica, 92 (2): 95-102.
George, J. W. (2001). The usefulness and limitations of hand-held refractometers in veterinary laboratory medicine: an historical and technical review. Veterinary Clinical Pathology, 30: 201-10.
Henken, A. M., Ploeger, H. W., Graat, E. A. M. & Carpenter, T. E. (1994). Description of a simulation model for the population dynamics of Eimeria acervulina infection in broilers. Parasitology, 108: 503-512.
Holzer, P. (2004). TRPV1 and the gut: from a tasty receptor for a painful vanilloid to a key player in hyperalgesia. European Journal of Pharmacology, 500:231-241.
Jang, I. S., Ko, Y.H., Kang, S. Y. & Lee, C. Y. (2007). Effect of a commercial essential oil on growth performance, digestive enzyme activity and intestinal microflora population in broiler chickens. Animal Feed Science and Technology, 134: 304-315.
Johnson, J. & Reid, M. (1970). Anticoccidial drugs, lesion scoring techniques in battery and floor-pen experiments with chickens. Experimental Parasitology, 28: 30-36.
Kekeocha, C. C. (1985). Introduction to poultry keeping, In: Poultry Production Hand Book, Pfizer Corporation, Nairobi, pp: 1-15.
Leeson, S. & Summers, J. D. (2005). Commercial poultry nutrition, 3rd edition. Nottingham University Press, England.
Lobago Fikre, Worku Nega & Abebe Wossene (2005). Study on coccidiosis in Kombolcha poultry farm, Ethiopia. Tropical Animal Health and Production 37: 245–251.
Long, P. L., Joyner, L. P., Millard, B. J. & Norton, C. C. (1976). A guide to laboratory techniques used in the study and diagnosis of avian coccidiosis. Folia Veterinaria Latina 6: 201-17.
Maghrani, M., Zeggwah, N., Michel, J. & Eddouks, M. (2005). Antihypertensive effect of Lepidium sativum in spontaneously hypertensive rats. Journal of Ethnophamacology 100: 193-197.
McDougald, L. R. & Fitz-Coy, S. H. (2008). Coccidiosis, In Y.M. Saif, (ed.). Disease of Poultry, 12th ed. Blackwell Publishing. Ames, IA, USA, pp: 1068–1085.
McEwan, A. D., Fisher, W., Selman, L. F. & Perihale, W. J. (1969). A turbidity test for estimation of immunoglobulins levels in neonatal calf serum. Clinical Chemistry Acta, 27: 155-163.
Meskerem, A. & Bookaewan, C. (2013). Protective effects of Moringa stenoptala leaf supplemented diet on Eimeria tenella infected broiler chickens in Debre Zeit, Central, Ethiopia. Kasetsart Journal (Natural Science), 47: 398-406.
Meskerem, A. & Chaiwat, B. (2014). Effect of Lepidium sativum L. (Garden Cress) Seed and Its Extract on Experimental Eimeria tenella Infection in Broiler Chickens. Kasetsart Journal (Natural Science), 48: 28-37.
Miles, R. D., Butcher, G. D., Henry, P. R. & Littell, R. C. (2006). Effect of Antibiotic Growth Promoters on Broiler Performance, Intestinal Growth Parameters, and Quantitative Morphology. Poultry Science, 85: 476-485.
Mondesire, R. R. (2004). Immunodiagnostics and other emerging diagnostic techniques, In: Thrall, M.A., Baker, D. C., Campbell, T. W., DeNicola, D., Fettman, M. J., Lassen, E. D., Rebar, A. and Weiser, G. (eds.), Veterinary Hematology and Clinical Chemistry. Lippincott Williams and Wilkins, publisher, USA, pp: 55-68.
Naidoo, V., McGaw, L. J., Bisschop, S. P. R., Duncan, N. & Eloff, J. N. (2008). The value of plant extracts with antioxidant activity in attenuating cocidiosis in broiler chickens. Journal of Veterinary Parasitology, 153: 214-219.
Newall, C. A., Anderson, L. A. & Phillipson, J. D. (1996). Herbal Medicines: A Guide for Healthcare Professionals. Pharmaceutical Press, London, pp: 80-8.
Nwaopara, A.O., Odike, M.A.C., Ingbenebor, U. & Adoye, M.I. (2007). The combined effects of excessive consumption of ginger, Clove, Red Pepper and black pepper on the Histology of the liver. Pakistan Journal of Nutrition, 6 (6): 524-527.
Ocak, N., Erenter, G., Burak, A.K.F., Sungue, M., Altop, A. & Ozmen, A. (2008). Performance of broilers fed diets supplemented with dry peppermint (Mentha Piperita L.) or Thyme (Thymus Vulgaris L.) leaves as growth promoter source. Czech Journal of Animal Science 53: 169-175.
Paranjape, A. N. & Mehta, A. A. (2006). A study on clinical efficacy of Lepidium sativum seeds in treatment of bronchial asthma. Iranian Journal of Pharmacological Therapeutics, 5: 5559.
Patel, U., Kulkarni, M., Undale, V. & Bhosale, A. (2009). Evaluation of Diuretic Activity of Aqueous and Methanol Extracts of Lepidium sativum Garden Cress (Cruciferae) in Rats. Tropical Journal of Pharmaceutical Research 8 (3): 215-219.
Permin, A. & Hansen. J. W. (1998). The Epidemiology, Diagnosis and Control of Poultry Parasites. FAO animal health manuals, Rome, Italy. 155 pp.
Rosen, G. D. (1995). Antibacterials in poultry and pig nutrition. In: (ed. Wallace, R. J. and Chesson, A.) Biotechnology in Animal Feeds and Animal Feeding. VCH

Mengistu et al. East African Journal of Veterinary and Animal Sciences Volume 1 (1) 19-30
30
Verlagsgesellschaft GmbH, Weinheim, Germany, pp: 143-172.
Ruff, M. D. & Chute, M. B. (1991). Supplemental use of liquid amprolium in skip-a-day feeding of replacement pullets. Poultry Science, 70: 515-520.
SAS Institute (2008). SAS user guide: Statistics. Version 9.1 ed. SAS Institute Inc., Cary, NC Statistical analysis.
Suk-Hyun, C., Suh, Bong-Soon, Kozukue, E., Kozukue, N., Levin, C. E. & Friedman. (2006). Analysis of the contents of punget compounds in fresh Korean red peppers and in containing food. Journal of Agriculture Food Chemistry 54: 9024-9031.
Sumangala, S. G., Nagappa, G. M. & Mingruo, G. (2004). Chemical composition of Garden cress (Lepidium Sativum) seeds and its fractions and use of bran as a functional ingredient. Plant Foods for Human Nutrition, 59 (3): 105-111.
Sun, T., Xu, Z., Wu, C. T., Janes, M., Prinyawiwatkul, W. & No, H. K. (2007). Antioxidant Activities of Different Colored Sweet Bell Peppers (Capsicum annuum L.). Journal of Food Science, 72: 98-102.
Takano, F., Yamaguchi, M., Takada, S., Shoda, S., Yahagi, N., Takahashi, T. & Ohta, T. (2007). Capsicum ethanol extracts and capsaicin enhance interleukin-2 and interferon-gamma production in cultured murine Peyer's patch cells ex vivo. Life Science, 80: 1553-1563.
Takashi, K., Akiko, I. & Toshihiro, Y. (2004). Effect of red pepper Capsicum annuum var. conoides and garlic Allium sativum on plasma lipid levels and cecal microflora in mice fed beef tallow. Food Chemistry and Toxicology, 42 (10): 1695-1700.
Teklehaymanot Tilahun, Mirutse Giday, Girmay Medhin, & Yalemtsehay Mekonnen (2007). Knowledge and use of medicinal plants by people around Debre Libanos monastery in Ethiopia. Journal of Ethnopharmacology, 111: 271-283.
Waldenstedt, L. (2003). Effect of vaccination against coccidiosis in combination with an antibacterial oregano (Origanum vulgare) compound in organic broiler production. Acta Agriculturae Scandinavica 53: 101-109.
Walk, C. L., Cowieson, A. J., Remus, J. C., Novak, C. L. & McElroy, A. P. (2011). Effects of dietary enzymes on performance and intestinal goblet cell number of broilers exposed to a live coccidia oocyst vaccine. Poultry Science, 90: 91-98.
Williams, R. B. (2006). Relative virulence of a drug-resistant and a drug-sensitive strain of Eimeria acervulina, a coccidium of chickens. Veterinary Parasitology, 135: 15-23.
Windisch, W., Rohrer, E. & Schedle, K. (2009). Herbs and spices in the modern animal nutrition: backward or progress? Schriftenreihe aus dem Institut für Nutztierwissenschaften, Band 32, Tagungsbericht 02-04.09.2009, ETH Zürich, Switzerland (2009), pp:63-72 (In German).
Windisch, W., Schedle, K., Plitzner, C. & Kroismayr, A. (2008). Use of phytogenic products as feed additives for swine and poultry. Journal of Animal Science, 86 (E. Supl.): E140-E148.doi:10.2527/jas.2007-0459.

East African Journal of Veterinary and Animal Sciences (2017) Volume 1(1): 31-40
___________________________________________ *Corresponding Author. E-mail: [email protected] ©Haramaya University, 2017
Husbandry Practices, Farmers’ Perception and Constraints of Pig Farming in Bishoftu and Holeta Areas, Central Ethiopia Efrem Gebrehawariat1*, Getachew Animut2, Mengistu Urge3, and Yoseph Mekasha3
1Department of Animal Sciences, Wollega University, P. O. Box 395, Nekemte, Ethiopia 2Agricultural Transformation Agency, P. O. Box 708, Addis Ababa, Ethiopia 3School of Animal and Range Sciences, Haramaya University, P. O. Box 138, Dire Dawa, Ethiopia 3International Livestock Research Institute, P. O. Box 5689, Addis Ababa, Ethiopia
Abstract: The study was conducted to describe and compare the current pig production practices in
Bishoftu and Holeta towns and their surroundings, central Ethiopia. The areas were selected since
they are the most important pig production areas in the country. A structured questionnaire was used
to interview 20 and 23 pig farmers from Holeta and Bishoftu, respectively. The parameters studied
in the survey included socio-economic characteristics, production and management, ownership, herd
structure, purpose of keeping, feed resource, feeding and fattening practices, reproductive
management, meat utilization and marketing, and pig production constraints. Results indicate that
household characteristics of pig keepers did not differ significantly (P > 0.05) between the two study
areas. Pig farmers keep adapted exotic pig breeds. Herd composition did not differ statistically (P >
0.05) between the two study areas. Mean pig herd size per household was 5.72. The majority (58%)
practice both pig breeding and fattening. The two study areas were similar (P > 0.05) in the type of
pig house. Pigs were permanently housed by 88.4% of the households. Major feed sources offered to
pigs in both study areas include household wastes, market wastes and crop residues. Reproductive
managements did not differ significantly (P > 0.05) between the two study areas. Similar results (P >
0.05) were obtained for origin of animal stocks in the two study areas. Most (83.7 %) of the farmers
acquired their foundation stock from local markets. The farmers did not slaughter pigs for home
consumption and pigs were kept as a source of income. Farmers in both study areas named high cost
of feeds, followed by pig mortality due to diseases, marketing constraints and lack of capital as major
constraints for pig production. Despite the existence of production constraints, most respondents
had aspiration to continue rearing pigs and plan to expand pig farm. It can be concluded that an
improvement of pig production in Central Ethiopia should consider an improvement in feeding
practices, marketing system, prevention of diseases, and a reduction of inbreeding.
Keywords: Feed sources, Households; Pig farming; Husbandry practices; Small scale
Introduction Pigs are considered as the only litter-bearing animal among meat producing livestock having the shortest generation interval and high feed conversion efficiency. Pig production forms an integral part of farmer’s economy in many parts of the world, and plays enormous role in poverty reduction by creating employment opportunities for resource-poor farmers. Consequently, pig production is increasing from time to time in many parts of tropical countries (Serres, 2001). In the tropics pigs have been raised under various husbandry practices including free range feeding, tethering, and confinement (Kimbi et al., 2001). Traditionally kept pigs contributes about 80% of pigs kept in East Africa (Tanzania, Kenya and Uganda), 75% in Zimbabwe, 70% in Botswana (Setschewaelo, 1992), 65% in Sahel countries (Chad, Niger, Mali, Guinea Bissau, Senegal), and 80% in Namibia (FAO, 1998).
Ethiopia’s pig production is concentrated in limited areas and the population is estimated at about 33,000 (FAOSTAT, 2013). To date, the pig production in the country has received very little attention and no systematic documentation of farming practices has been done (Seid and Abebaw, 2010; Theodros et al., 2013; Yeshambel and Bimrew, 2014). To formulate policies, improve pig production and to increase the income of the pig farmers, farming practices should be evaluated. Grass root-level surveys are needed in order to obtain farmers' perceptions on the pig production and feed utilization. Such approach will certainly help to generate appropriate technologies within the prevailing conditions of the different pig farming areas. There is, therefore, an increasing need to technically assess the problem at the ground level and identify ways of overcoming constraints to improve pig production in the country. The main objective of the current study was therefore, to generate and avail information on purpose

Efrem et al East African Journal of Veterinary and Animal Sciences 1(1):31-40)
32
of keeping, management practices, meat utilization, marketing, and production constraints of pigs in two study areas of central Ethiopia.
Materials and Methods Description of the Study Areas A survey was conducted within and around Bishoftu and Holeta towns. These were selected since they are the most important pig production areas. Bishoftu is located in the central highlands of Ethiopia at about 45 km southeast of Addis Ababa and its geographic location is at 8°45'00" N latitude and 38°59'00" E longitude. The area has an altitude of about 1900 meters above sea level, with average annual rainfall of 849 mm. The average minimum and maximum temperature ranges from 10.5 to 26.1oC with a mean value of 18.7oC. The average relative humidity is 58.6% (DZARC, 2001). Holeta is located at 40 km distance west of Addis Ababa and its geographic location is at 9°04'00" N latitude and 38°30'00"E longitude. It lies at an altitude of 2400 meter above sea level. The average minimum and maximum temperatures are around 6.1 and 24oC, respectively. The annual rainfall of the area is 1250 mm. Data Collection A rapid field visit was conducted before the data collection to get information about the study area and help to select pig farmers. Based on the assessment of the rapid field visit and in consultation with regional Ministry of Agriculture offices, pig farms within the towns and small scale farms around the towns were purposively selected based on their pig production potential, experience in pig farming and access to market. Households that have at least two pigs or landless farmers who have a minimum of one year experience in pig production were included for the study. Structured questionnaire was used to collect information from all households who own pigs. Interview was made for each respondent with the help of trained enumerators. Secondary information was also collected from development agents and experts of livestock working in the towns/districts. Based on information on pig husbandry, management practices and farmers' perception about piggery in the region, prospects and constraints were assessed to draw recommendations. In general, the aspects covered in the farm questionnaires included farm-management practices, type of feeds and feeding practices, housing, reproduction, marketing and utilization of pig’s meat, and production constraints encountered in pig production. General information on the socio-economic characteristics of the respondents such as family size, age, education, sex, occupation, farm size, household size, etc. were also collected. Production and management practices such as housing, herd structure, purpose of keeping, feed resources, feeding practice and fattening practices were also included in the study. Reproductive parameters included in the survey were
breeding/mating system, methods of mating and weaning. Furthermore, information on meat consumption, buying and selling of animals, and on main constraints as they are perceived by farmers were collected. Data Processing and Analysis Data from the questionnaire was entered into SPSS (2007) database and validated for analysis. After validation, the data were analyzed using SAS (2004) statistical package. Descriptive statistics was employed for data involving frequencies and Pearson chi-square was used to compare variables between the two areas, whereas quantitative variables were analyzed using analysis of variance procedure. Indices were calculated to provide overall ranking of a particular trait according to the formula: Index = sum of [4 for rank 1 +3 for rank 2 +2 for rank 3 +1 for rank 4] given for an individual trait divided by the sum of [4 for rank 1 +3 for rank 2 +2 for rank 1 +1 for rank 4] summed over all traits.
Results and Discussions Characteristics of Pig Keepers Characteristics of pig farmers did not differ between the two study areas (Table 1). Male headed households were the majority involved in pig husbandry. This is similar to that has been reported earlier in other traditional production systems (Nsoso et al., 2006; Nwanta et al., 2011; Riedel et al., 2012; Nath et al., 2013; Ikwap et al., 2014). But, it is in contrast with the report in Kenya (Mutua, 2010), Zimbabwe, and South Africa (Halimani et al., 2013; Chiduwa et al., 2008) where pigs are traditionally owned by women. In Southern Africa also, females played a bigger role in pig farming (Madzimure et al., 2013). The present study revealed that a high proportion of middle aged and small proportion of young household heads were involved in pig production. This is in agreement with the findings of Ajala et al. (2007). About 46.5% of the respondents had finished secondary school and higher education (Table 1). This is in agreement with the findings of Yeshambel and Bimrew (2014) and Theodros et al. (2013). The highest percentage of the respondents having formal education also agrees with the observations of Adesehinwa et al. (2003) who reported that a higher percentage of pig farmers in Oyo State of Western Nigeria had formal education. In the current study, the high level of education amongst the pig farmers could help them to implement good husbandry and health-management practices to enhance pig productivity. On average respondent farmers had 9.73 years of experiences in pig husbandry indicating the presence of better know how in pig keeping in the present study area. This is in contrast with the findings of Yeshambel and Bimrew (2014) who reported pig keeping to be a recent introduction in Northwestern Ethiopia. More than half (53.5%) of the respondents’ in the study areas are full-time government employees who engaged in business and pig farming to earn additional income.

Efrem et al Husbandry Practices, Farmers’ Perception and Constraints of Pig Farming
33
Such findings have also been reported in other countries in Africa and Asia (Kagira et al; 2010, Costales et al., 2007; Lemke et al., 2006). In the study areas farmers keep adapted exotic pig breeds. This is similar to that reported in a mountainous area of Northeast India (Kumaresan et al., 2009). But, this is in contrast to other previous reports where the majority of the farmers who kept or prefer local or crossbred pigs (Kagira et al., 2010; Patr et al., 2014; Madzimure et al., 2013; Nath et al., 2013; Fualefac et al., 2014). This is also in contrast to reports that indicated most of the pigs raised in developing countries are crosses or local breeds raised under traditional production systems (Permin et al., 1999; Hide, 2003; Wabacha et al., 2004). Keeping adapted exotic breeds in the present study area may not be a matter of
preference, but lack of choice since there are no indigenous breeds or cross breeds in the country.
Livestock Holding Farmers predominantly own pigs (26.77%) and poultry (30.25%), they also rear other animals such as cattle (17.19%), small ruminants comprising sheep (16.54%) and goats (9.25%). Ownership patterns of other livestock species were similar for the two study areas (Table 2). The majority of the livestock and poultry in the present study are indigenous breeds or their crosses that are managed using traditional practices. Generally, few external inputs are purchased for livestock. The farmers in the present study are smallholder livestock keepers which are similar to report from North Vietnam (Lemke et al., 2007).
Table 1. Characteristic of pig owners in the study areas
Farmer’s characteristics
Bishoftu (N=20) Holeta (N=23) Total (N=43)
Number % Number % P-value Overall %
Sex 0.756 Male 18 90 20 87.00 88.40 Female 2 10 3 13.00 11.60
Age (years)* 41.85±10.93 39.48 ± 10.45 0.472 40.60 ± 10.62 25-29 3 15 5 21.74 18.60 30-34 4 20 3 13.04 16.28 35-39 2 10 4 17.39 13.95 40-44 3 15 4 17.39 16.28 45-49 2 10 2 8.70 9.30 50-54 3 15 2 8.70 11.63 55-59 2 10 3 13.04 11.63 ≥60 1 5 0 0 2.33
Family Size (n)* 4.90 ± 2.06 5.1 ± 2.33 0.728 4.98± 2.19 1-5 15 75 14 60.90 67.44 6-10 5 25 9 39.10 32.56 Educational level 0.928 Never been to school 5 25 4 17.40 20.90 Primary education 6 30 8 34.80 32.60 Secondary education 7 35 8 34.80 34.90 Higher education 2 10 3 13.00 11.60 Primary occupation 0.960 Full-time employee 5 25 6 26.10 25.60 Farmer 6 30 6 26.10 27.90 business 9 45 11 47.80 46.50 Experience in pig rearing* 8.28±5.39 11.00±5.87 0.122 9.73±5.75 1-5 years 10 50 7 30.43 39.53 6-10 years 4 20 5 21.74 20.93 11-15 years 3 15 3 13.04 13.95 16-20 years 3 15 8 34.78 25.58 Breed (%) 0.00 Local 0 0 0 0.00 0.00 Large White (Yorkshire) 20 100 23 100 100
P-value refers to the level of the difference between the proportions from the two study areas; *Mean ± Standard Deviation; N = number of respondents.

Efrem et al East African Journal of Veterinary and Animal Sciences 1(1):31-40)
32
Table 2. Number of livestock owned by pig farmers (mean ± SE) in the study areas
Livestock type Bishoftu (N=20) Holeta (N=23) Total (N=43) P-value
Cattle 3.50± 0.489 3.83±0.501 3.67±0.361 0.658 Sheep 3.30±0.442 3.74±0.549 3.53±0.356 0.545 Goat 2.20±0.268 1.78±0.301 1.98±0.204 0.313 Poultry 6.00±0.548 6.87±0.556 6.47±0.393 0.275 Pigs 5.25±0.459 6.13±0.551 5.72±0.283 0.501
N= number of respondents, *Mean ± Standard Error. Origin of Pig Stocks Similar results (P > 0.05) were obtained for origin of animal stocks in the two study areas (Table 3). Most of the farmers acquired their foundation stock from local markets while others got their foundation stock from home bred animals and neighbor herds and less than 10% of the respondents obtained foundation stock from family. Such observation coincide with results of
Hossain et al. (2011) who reported that farmers in Bangladesh purchased pig from market or neighbors and started a family level farming. This is also similar to that reported in traditional pig farming in Nagaland, India where foundation piglets are mostly acquired from local market (Patr et al., 2014).
Table 3. Acquisition Methods of the pig foundation stock
Origin of animal stocks*
Bishoftu (N =20) Holeta (N =23) Total (N =43)
Number % Number % P-value Overall %
Purchased 16 80 20 87.0 0.538 83.7 Homebred 6 30 9 39.1 0.531 34.9 Neighbours 5 25 7 30.4 0.692 27.9 Family 2 10 2 8.7 0.883 9.3
P-value refers to the level of the difference between the proportions from the two study areas; *Total observations >100% due to multiple responses; N= number of respondents. Herd Structure of Pig Herd composition did not differ statistically (P > 0.05) between the two study areas (Table 4). The mean herd size was small (5.72) and consisted mostly of sows, gilts and piglets. Most households had less than three sows in their herd and a relatively small number of piglets and only four farmers owned boars. It was recorded that 32.56% of the farmers kept less than 5 pigs and 67.44 % of farmers kept 5-10 pigs in their house. The small herd size ownership is probably associated with availability of land (Katongole et al., 2012). The low herd size observed in this study could also be due to the high cost of feeding. The pressure on land in the highlands of
Ethiopia may impose a pressure on livestock feed resources forcing the pig farmers to keep an average herd size of no more than five pigs. This observation is consistent with the findings under small-scale farming system in other countries (Ajala et al., 2007; Huynh et al., 2007). The current average herd size was smaller than what has been reported in Democratic Republic of the Congo (Bienvenu et al., 2014), India (Kumaresan et al., 2009; De et al., 2014) and higher than reported in Nigeria, northeast India, Zimbabwe (Ajala et al., 2007; Patr et al., 2014; Chiduwa et al., 2008) and in western Kenya (Kagira et al., 2010). But it is similar to that reported in North Vietnam (Lemke et al., 2007).
Table 4. Herd structure of pig farms in the study areas
Study area Piglet Male (0-2m)
Piglet Female (0-2m)
Sub-Adult Male (2-6m)
Sub-Adult Female (2-6m)
Adult Male (>6m)
Adult Female (>6m)
Total No. of pigs per household
Bishoftu 11 10 15 21 22 26 105 5.25 Holeta 9 13 29 35 22 33 141 6.13 Total 20 23 44 56 44 59 246 5.72 Percentage 8.13 9.35 17.89 22.76 17.89 23.98 100 SEM 0.126 0.122 0.108 0.171 0.071 0.145 P-value 0.537 0.793 0.016 0.173 0.316 0.649
m=months; SEM=standard error mean; p-value refers to the level of the difference between the proportions from the two study areas.

Efrem et al Husbandry Practices, Farmers’ Perception and Constraints of Pig Farming
33
Purpose of Keeping Pigs The two study areas were similar (P > 0.05) in purpose of keeping pigs (Table 5). Breeding, fattening, and mixed farming were considered as the purpose for keeping pigs in the study areas. Piglets for fattening were purchased from seller or from nearby farmers by 23% of the pig keepers who raised pigs primarily for fattening to sale. About 19% of the pig keepers are breeders keeping sows and are engaged in piglet production. The majority
(58%) were mixed farmers that practice both breeding and fattening. Farmers fattened own farm produced offspring, but some farmers bought additional piglets for fattening. This is in agreement with that observed in other smallholder systems (Lanada et al., 2005; Lemke et al., 2007; Mutua et al., 2011; Kagira et al., 2010; Patr et al., 2014).
Table 5. Purpose of keeping of pigs in the study areas
Bishoftu (N=20) Holeta (N=23) Total (N =43)
Number % Number % P-value Overall %
Purpose of keeping 0.693 Breeding 3 15 5 21.7 18.6 Fattening 4 20 6 26.1 23.3 Mixed/dual purpose 13 65 12 52.2 58.1
P-value refers to the level of difference between the proportions from the two study areas; N= number of respondents. Housing Practices In the present study, all the respondents in the study areas provide some form of housing to their pigs. The two study areas were similar (P > 0.05) in the type of pig house. Pigs were permanently housed by 88.4% of the households in a house constructed from mud walls either with thatched or zinc roof, while the rest of the households kept their pigs in temporary pig house in the backyard (Table 6). This practice is similar to that
observed in North Vietnam where pigs were permanently penned (Lemke et al., 2007). It is also consistent with pig production in Democratic Republic of Congo where the majority of the pigs were reared in pens without free roaming (Bienvenu et al., 2014). Moreover, the majority of the households in North East Indian State of Nagaland housed their pigs all the time (Njuki et al., 2010; Patr et al., 2014; Nath et al., 2013).
Table 6. Type of housing in the study areas
Bishoftu (N=20) Holeta (N=23) Total (N=43)
Number % Number % P-value Overall %
Type of house 0.569 Permanent house 18 90 20 87 88.4 Temporary house 2 10 3 13 11.6
Shelter 0.498 Together 14 70 15 65.22 67.4 Separated pen 6 30 8 34.78 32.6
P-value refers to the level difference between the proportions from the two study areas; N= number of respondents. In the present study very few households partially confined their pigs in temporary pig house/pen. In the temporary type of housing, pigs are housed in wooden or bamboo-made pens that are roofed with tin or locally available materials. This is consistent with the reports of low-input traditional free ranging pig farming system of other developing countries like Kenya (Kagira et al., 2010), Zimbabwe (Chiduwa et al., 2008) and other part of Africa (Madzimure et al., 2013). In this type of housing pigs were allowed to scavenge/graze during day and confined during night time. In Northeast India (Kumaresan et al., 2009) about 98% of the pig houses were of temporary type and made up of locally available materials. Kumaresan et al. (2009) also noted that permanent type of housing is more in urban areas where the exotic pig rearing is highly practiced. In other developing countries like Kenya and Nigeria, tethering of free-range pigs was undertaken during the rainy
season since pigs were predisposed to damaging of crops (Mutua et al., 2012; Ajala et al., 2007). In the present study area, farmers use similar (P > 0.05) housing management. About thirty-three percent of the households had separated fattening and maternity pens, while the rest sheltered their pigs together. Thirty-three percent of the pig house had concrete floors, and are cleaned regularly, while the rest were earthen floors. Majority (92%) of the pig farms had mud walls either with thatched or zinc roof. The floor space per animal was found to be adequate in 92.98% of the farms. Recommended pig housing system was not found in the present study areas, and pigs were kept together regardless of their age, sex and reproduction status. Feed Sources and Feeding System The major feed sources that were offered to pigs by farmers in the present study area include household

Efrem et al East African Journal of Veterinary and Animal Sciences 1(1):31-40)
36
wastes, market wastes and crop residues (Table 7). A large proportion of residues from cereal crops like maize, sorghum and millet which are available from households and unsuitable for marketing and family use are utilized as pig feeds. The market wastes varied from hotel wastes, potato peelings, fruits/vegetables and slaughter house wastes including blood and offal. Feeding household and market wastes and crop residues to pigs of all categories is a means of reducing feed cost.
Generally utilization of commercial feeds for pigs was limited in the study areas. This is similar to what has been reported in other traditional production systems (Nsoso et al., 2006; Lemke and Zarate, 2007; Kagira et al, 2010; De et al, 2014). The system of raising pigs on locally available resources has been reported in Northeast India (Kumaresan et al., 2009) and in North Vietnam (Lemke et al., 2006).
Table 7. Major pig feed sources in the study areas
Feed sources
Bishoftu (N =20) Holeta (N =23) Total (N =43)
Number % Number % P-value Overall %
Household wastes 15 75 16 69.6 0.692 72.1
Market wastes 13 65 15 65.2 0.988 65.1
Crop residues 13 65 14 60.9 0.780 62.8
Purchased feeds 2 15 2 8.7 0.520 11.6 Grazing 2 10 3 13 0.756 11.6
Percentages exceed 100% within a column due to multiple responses; P-value is a chi-square probability; N= number of respondents. In contrast to the present study locally available indigenous plant materials (forages) serve as the main feed for pigs in other pig dominated states of India like the northeast part of Sikkim Himalayan region (Nath et al., 2013) and Nicobar group of islands (De et al., 2014) as well as in other developing countries like Kenya (Mutua et al., 2012), Zimbabwe (Halimani et al., 2013) and Democratic Republic of Congo (Bienvenu et al., 2014). In this study, poor-quality feeds and inadequate feeding are mentioned to be the major factors limiting pig productivity, which needs to be addressed to enhance productivity and income from pig production. Higher percentage of farmers (88%) practiced group-feeding inside the pen. Very few farmers (12%) allow their pigs for scavenging. Almost all farmers (98.1%) used local feeders, made up of wooden board or concrete for feeding pigs. Other materials used as feeder and waterer were cut tier of vehicles and aluminum plates. Reproductive Management Natural service is the only breeding method used by producers in the study areas (Table 8). This is in contrast to the practice in other tropical smallholder farms (Gatenby and Chemjong, 1992; Lanada et al., 1999; Lemke et al., 2007) where sows are served by artificial insemination. The pig farmers recognized oestrus from the behavior of the sow based on standing reflex and by using boar. Heat detection techniques identified in this study coincided with results of Losada et al. (1997) who reported that majority of the farmers in east of Mexico city detected heat from the behavior and external changes in the reproductive organ of the sows.
Mean litter sizes in the present study was markedly low (6-7) which are in conformity with the report of Hossain et al. (2011) in Bangladesh and Chiduwa et al. (2008) in Zimbabwe. The average number of piglets per litter in commercial farms in Kenya was 8 (Wabacha et al., 2004).
The small litter size reported in this study can be attributed to poor diets and inbreeding (Toro et al., 1988). Inbreeding is a major issue in indigenous pig population for declining productivity (Patr et al., 2014). Majority of the sows in the current study farrowed twice a year, which is similar to the expected farrowing index of about 2.2 (Chiduwa et al., 2008). In the surveyed areas, the majority of farmers (81.4%) castrated their pigs at the age of 3-4 months using surgical method. This is similar to that reported in other traditional production systems (Nwanta et al., 2011; Nath et al., 2013). Farmers perceived that growth of the castrated pigs is better than the uncastrated ones. However, piglets with better vigor, body weight and health are kept uncastrated for breeding purpose. Majority of the farmers (86%) practiced pig weaning at 60 days and above. Delayed weaning of pigs was observed on majority of the farms which is similar to that reported in Kenya (Mutua et al., 2011; Kagira et al., 2010), Zimbabwe (Chiduwa et al., 2008) and Creole piglets in Guadeloupe (Gourdine et al., 2006), in Nepal (Gatenby and Chemjong, 1992) and the Solomon Islands (de Fredrick and Osborne, 1977). Early weaning is, however, not ideal for smallholder farming areas as the practice should be supported by suitable and sustainable feeding regimes. Consumption and Marketing The pig farmers in the study areas did not slaughter pigs for domestic consumption. This is because the majority of the communities are Orthodox and Muslims religion followers who do not consume pork since it is forbidden by the religion. As a result, farmers reared pigs mainly as a source of income. Earlier studies in other parts of the country also indicated that all respondents keep pigs entirely as a means of income generation (Theodros et al., 2013; Yeshambel and Bimrew, 2014). This is also similar to what has been reported in Western Kenya

Efrem et al Husbandry Practices, Farmers’ Perception and Constraints of Pig Farming
37
(Kagira et al., 2010) where pigs are mainly kept as source of income. In other countries, low-input pig production has role of both income- generation and source of meat for home consumption (Ajala et al., 2007; Lemke and Zarate, 2007; Patr et al., 2014). In other African countries smallholder pig production is primarily for market (Ajala et al., 2007; Kagira et al., 2010; Bienvenu et al., 2014) and consumption of animal products come only secondary. This lies in contrast with Asian areas where pigs are less market oriented but fulfill functions related to savings and household consumption (Kumaresan et al., 2009; Lemke et al., 2006).
According to respondents, there are no central markets for trading live pigs. Smallholder pig farmers use different marketing channels. From the farmers, the animals have to pass through several middle men before reaching direct consumers. Some pig farmers sell live pigs to agents or traders who come to collect them in villages. Pigs are also traded at the super market in Addis Ababa based on a negotiated price between the farmer and super market owner. The pig price paid to farmers is based on live weight, sex and age of the pig through negotiation implying that farmers have little influence on the price.
Table 8. Reproductive management of pigs in the study areas
Parameters Bishoftu (N=20) Holeta (N=23) Total (N=43)
Number % Number % P-value Overall %
Heat detection method 0.265 Boar 9 45 6 26.1 34.9
Standing reflex 6 30 6 26.09 27.9 Boar + standing reflex 5 25 11 47.8 37.2
Methods of mating 0.637 Live boar 16 80 17 73.9 76.7 AI 0 0 0 0 0 Never use boar or AI 4 20 6 26.1 23.3
Farrowing frequency per year
0.775
Twice 14 70 17 73.91 72.1
once 6 30 6 26.09 27.9 No of piglet per farrowing
0.971
<6 2 10 2 8.70 9.3 6-10 15 75 17 73.91 74.4 >10 3 15 4 17.39 16.3
Castration 0.571 Yes 17 85 18 78.3 81.4 No 3 15 5 21.7 18.6
Weaning age 0.597 Two months 3 15 3 13 14 >two months 17 85 20 87 86
P-value refers to the level of the difference between the proportions from the two study areas; N= number of respondents Constraints of Pig Production Lack of feeds, disease risks, marketing problem and shortage of financial sources were mentioned as the main constraints to intensify pig production (Table 9). Feed ranked to be the first limiting bottleneck for pig production as perceived by farmers. The major feedstuffs available for pig production are of low quality, which do not meet their productive and reproductive performances. In both study areas, the price of concentrate feed is high and unaffordable to the pig
farmers. Diseases were the second major constraints of pig production in the study area. The main disease constraints were diarrhea (39.5%), mange (37.2%), cough (20.9%), and worms (2.3%) which can lead to pig mortality. Marketing was equally reported by seventy percent of the farmers as a problem for pig production in the study areas. Quite a lot of farmers reported lack of collaterals to access bank loans as a factor that limits expansion of their enterprises.
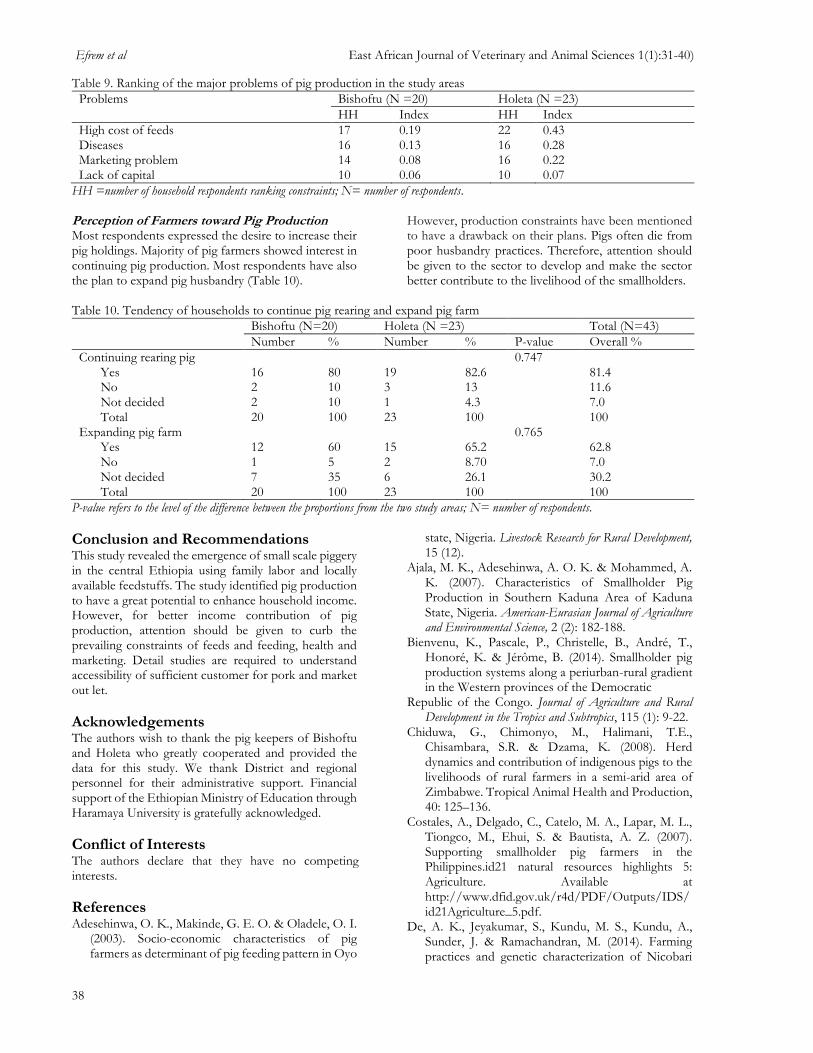
Efrem et al East African Journal of Veterinary and Animal Sciences 1(1):31-40)
38
Table 9. Ranking of the major problems of pig production in the study areas
Problems Bishoftu (N =20) Holeta (N =23)
HH Index HH Index
High cost of feeds 17 0.19 22 0.43 Diseases 16 0.13 16 0.28 Marketing problem 14 0.08 16 0.22 Lack of capital 10 0.06 10 0.07
HH =number of household respondents ranking constraints; N= number of respondents. Perception of Farmers toward Pig Production Most respondents expressed the desire to increase their pig holdings. Majority of pig farmers showed interest in continuing pig production. Most respondents have also the plan to expand pig husbandry (Table 10).
However, production constraints have been mentioned to have a drawback on their plans. Pigs often die from poor husbandry practices. Therefore, attention should be given to the sector to develop and make the sector better contribute to the livelihood of the smallholders.
Table 10. Tendency of households to continue pig rearing and expand pig farm
Bishoftu (N=20) Holeta (N =23) Total (N=43)
Number % Number % P-value Overall %
Continuing rearing pig 0.747 Yes 16 80 19 82.6 81.4 No 2 10 3 13 11.6 Not decided 2 10 1 4.3 7.0 Total 20 100 23 100 100
Expanding pig farm 0.765 Yes 12 60 15 65.2 62.8 No 1 5 2 8.70 7.0 Not decided 7 35 6 26.1 30.2 Total 20 100 23 100 100
P-value refers to the level of the difference between the proportions from the two study areas; N= number of respondents.
Conclusion and Recommendations This study revealed the emergence of small scale piggery in the central Ethiopia using family labor and locally available feedstuffs. The study identified pig production to have a great potential to enhance household income. However, for better income contribution of pig production, attention should be given to curb the prevailing constraints of feeds and feeding, health and marketing. Detail studies are required to understand accessibility of sufficient customer for pork and market out let.
Acknowledgements The authors wish to thank the pig keepers of Bishoftu and Holeta who greatly cooperated and provided the data for this study. We thank District and regional personnel for their administrative support. Financial support of the Ethiopian Ministry of Education through Haramaya University is gratefully acknowledged.
Conflict of Interests The authors declare that they have no competing interests.
References Adesehinwa, O. K., Makinde, G. E. O. & Oladele, O. I.
(2003). Socio-economic characteristics of pig farmers as determinant of pig feeding pattern in Oyo
state, Nigeria. Livestock Research for Rural Development, 15 (12).
Ajala, M. K., Adesehinwa, A. O. K. & Mohammed, A. K. (2007). Characteristics of Smallholder Pig Production in Southern Kaduna Area of Kaduna State, Nigeria. American-Eurasian Journal of Agriculture and Environmental Science, 2 (2): 182-188.
Bienvenu, K., Pascale, P., Christelle, B., André, T., Honoré, K. & Jérôme, B. (2014). Smallholder pig production systems along a periurban-rural gradient in the Western provinces of the Democratic
Republic of the Congo. Journal of Agriculture and Rural Development in the Tropics and Subtropics, 115 (1): 9-22.
Chiduwa, G., Chimonyo, M., Halimani, T.E., Chisambara, S.R. & Dzama, K. (2008). Herd dynamics and contribution of indigenous pigs to the livelihoods of rural farmers in a semi-arid area of Zimbabwe. Tropical Animal Health and Production, 40: 125–136.
Costales, A., Delgado, C., Catelo, M. A., Lapar, M. L., Tiongco, M., Ehui, S. & Bautista, A. Z. (2007). Supporting smallholder pig farmers in the Philippines.id21 natural resources highlights 5: Agriculture. Available at http://www.dfid.gov.uk/r4d/PDF/Outputs/IDS/id21Agriculture_5.pdf.
De, A. K., Jeyakumar, S., Kundu, M. S., Kundu, A., Sunder, J. & Ramachandran, M. (2014). Farming practices and genetic characterization of Nicobari

Efrem et al Husbandry Practices, Farmers’ Perception and Constraints of Pig Farming
39
pig, an indigenous piggermplasm of Nicobar group of islands, India. Tropical Animal Health and Production, 46: 655-661.
De Fredrick, D. F. & Osborne, H. G. (1977). Pig production in the Solomon Islands. III. The influence of breed, diet and housing on reproduction and growth. Tropical Animal Health and Production, 9: 203-210.
DZARC (Debre Zeit Agricultural Research Center) (200l). Annual metrology reports. Debre Zeit, Ehiopia.
FAOSTAT. (2013). www.faostat.org. FAO (Food and Agriculture Organization) (1998). Farm
Animal Genetic Resources: Biodiversity for food and agriculture. Food and Agriculture Organisation of the United Nation.
Fualefac, D. H., Raphae, K. J., Bime, M. J., Ndebi, G., Yemele, F., Zoli, P.A., Manjeli, Y., Teguia, A. & Tchoumboue, J. (2014). Socioeconomic and technical characteristics of pig farming in the urban and peri-urban zone of Dschang - West region of Cameroon. Discourse Journal of Agriculture and Food Sciences, 2(1): 11-20.
Gatenby, R. M. & Chemjong, P. B. (1992). Reproduction of pigs in the hills of eastern Nepal. Tropical Animal Health and Production, 24: 135-142.
Gourdine, J. L., Bidanel, J. P., Noblet, J. & Renaudeau, D. (2006). Effects of breed and season on performance of lactating sows in a tropical humid climate. Journal of Animal Science, 84: 360–369.
Halimani, T. E., Muchadeyi, F. C., Chimonyo, M. & Dzama, K. (2013). Opportunities for conservation and utilization of local pig breeds in low-input production systems in Zimbabwe and South Africa, Tropical Animal Health and Production, 45: 81–90.
Hide, R. (2003). Pig Husbandry in New Guinea: A Literature Review and Bibliography. Australian Centre for International Agricultural Research, Canberra.
Hossain, M.E., Chakma, S., Khatun, M.M., Hasanuzzaman, M., Miah, M.Y. & Biswas, M.A.A. (2011). Production systems of swine in the rural areas of Rangamati and Khagrachari districts of Bangladesh. Bangladesh Journal of Animal Science, 40 (1&2):28-33.
Huynh, T.T.T., Aarnink, A.J.A., Drucker, A. & Verstegen, M.W.A. (2007). Pig Production in Cambodia, Laos, Philippines, and Vietnam: A Review. Asian Journal of Agriculture and Development, 4 (1): 69-90.
Ikwap, K., Jacobson, M., Lundeheim, N., Owiny, D. O., Nasinyama, G. W., Fellstrom, C. & Erume, J. (2014). Characterization of pig production in Gulu and Soroti districts in northern and eastern Uganda. Livestock Research for Rural Development, 26 (4).
Kagira, J. M., Kanyari, P. W. N., Maingi, N., Githigia, S. M. and Ng’ang’a, J. C. & Karuga, J. W. (2010). Characteristics of the smallholder free-range pig
production system in western Kenya. Tropical Animal Health and Production, 42: 865-873.
Kimbi, E. C., Maiseli, A. G., Kaijage, J. T. & Mussei, A. N. (2001). Report on local feed resource base, feeding systems and feeding practices for pig production in Rungwe and Mbozi district. Reported to international review programme: ARIUyole, Mbeya, Tanzania.
Kumaresan, A., Bujarbaruah, K. M., Pathak, K. A., Das, A. & Bardoloi, R. K. (2009). Integrated resource-driven pig production systems in a mountainous area of Northeast India: production practices and pig performance. Tropical Animal Health and Production, 41: 1187-1196.
Lanada, E. B., Lee, J.A.L.M., More, S. J., Taveros, A. A. & Cotiw-an, B. S. (1999). The reproductive performance of sows raised by smallholder farmers in the Philippines. Preventive Veterinary Medicine, 41: 187-194.
Lanada, B., Lee, J., More, S.J., Basito, S. & Alberto, A.T. (2005). A longitudinal study of sows and boars raised by smallholder farmers in the Philippines. Preventive Veterinary Medicine, 70: 95-113.
Lemke, U., Kauffman, B., Thuy, L.T., Emrich, K. & Valle Zárate, A. (2006). Evaluation of smallholder pig production systems in North Vietnam: Pig production management and pig performances. Livestock Science, 105: 229-243.
Lemke, U. & Zarate, V. A. (2007). Dynamics and development trends of smallholder pig production systems in North Vietnam. Agricultural Systems, 96, 207-223.
Lemke, U., Kauffman, B., Thuy, L. T., Emrich, K. & Valle Zárate, A. (2007). Evaluation of biological and economic efficiency of smallholder pig production systems in North Vietnam. Tropical Animal Health and Production, 39: 237-254.
Losada, H., Pealing, R., Cortés, J. & Vieyra, J. (1997). The keeping of poultry and pigs in the backyards of the urbanized areas of Iztapalapa (east of Mexico City) as a proposal for sustainable production. Livestock Research for Rural Development, 9(3).
Madzimure, J., Chimonyo, M., Zander, K. K. & Dzama, K. (2013). Potential for using indigenous pigs in subsistence-oriented and market-oriented small-scale farming systems of Southern Africa. Tropical Animal Health and Production, 45: 135-142.
Mutua, F. (2010). Farmer Perceptions on Indigenous Pig Farming in Kakamega District, Western Kenya. Nordic Journal of African Studies, 19(1), 43-57.
Mutua, F. K., Dewey, C. E., Arimi, S. M., Schelling, E. & Ogara, W. O. (2011). Prediction of live body weight using length and girth measurements for pigs in rural Western Kenya. Journal of Swine Health and Production, 19(1): 27-33.
Mutua, F. K., Dewey, C., Arimi, S., Ogara, W., Levy, M. & Schelling, E. (2012). A description of local pig feeding systems in village smallholder farms of

Efrem et al East African Journal of Veterinary and Animal Sciences 1(1):31-40)
40
Western Kenya. Tropical Animal Health and Production, 44: 1157-1162.
Nath, B. G., Pathak, P. K., Ngachan, S. V., Tripathi, A. K. & Mohanty, A. K. (2013). Characterization of smallholder pig production system: productive and reproductive performances of local and crossbred pigs in Sikkim Himalayan region. Tropical Animal Health and Production, 45: 1513-1518.
Njuki, J., Pali, P., Mburu, S. & Poole, J. (2010). Pig Production, Management and Marketing in the North East Indian State of Nagaland. International Livestock Research Institute, Nairobi.
Nsoso, S. J., Mannathoko, G. G. & Modise, K. (2006). Monitoring production, health and marketing of indigenous Tswana pigs in Ramotswa village of Botswana. Livestock Research for Rural Development, 18(9).
Nwanta, J. A., Shoyinka, S. V. O., Chah, K. F., Onunkwo, J. I., Onyenwe, I. W., Eze, I., Iheagwam, C. N., Njoga, E. O., Onyema, I., Ogbu, K. I., Mbegbu, E. C., Nnadozie, P. N., Ibe, E.C. & Oladimeji. K. T. (2011). Production characteristics, disease prevalence, and herd-health management of pigs in Southeast Nigeria. Journal of Swine Health and Production, 19 (6): 331–339.
Patr, M. K., Sonuwara, B. & Bidyut, C. D. (2014). Problems and Prospects of Traditional Pig Farming for Tribal Livelihood in Nagaland. Indian Research Journal of Extension Education, 14 (4).
Permin, A., Yelifari, L., Bloch, P., Steehard, N., Hansen, N. P. & Nansen, P. (1999). Parasites of cross-bred pigs in the upper East region of Ghana. Veterinary Parasitology, 87: 63-71.
Riedel, S., Schiborra, A. C., HuelsebuschHuanming, M. & Schlecht, E. (2012). Opportunities and challenges for smallholder pig production systems in a mountainous region of Xishuangbanna, Yunnan Province, China, Tropical Animal Health and Production, 44: 1971-1980.
Statistical Agriculture Software (SAS) (2004). The Statistical Analysis System. Version 9.1.3 SAS Institute Inc., Cary, North Carolina, USA.
Seid Abdu & Abebaw Gashaw (2010). Production system dynamism and parasitic interaction of swine in and around Holetta, Ethiopia. Ethiopian Veterinary Journal, 14 (1): 71-81.
Serres, H. (2001). Manual of pig production in the tropics, 3rd editions, Biddies press Ltd. Walling ford, UK.
Setschewaelo, L. L. (1992). Characterization of livestock breeds in Botswana. Utilization of individual Animal Genetic Resource; their characterization, conservation and utilization. In: Proceedings of Research Planning Workshop held in Ethiopia, Addis Ababa, Ethiopia.
SPSS (Statistical Package for Social Science) (2007). Statistical Program for Social Study. Version 16.0, Chicago, Illinois, USA.
Theodros Tekle, Abreha Tesfaye & Tsegabirhan Kifleyohannes (2013). Smallholder pig production and its constraints in Mekelle and southern zone of Tigray region, north Ethiopia. Livestock Research for Rural Development, 25 (10).
Toro, M. A., Silio, L., Rodrigañez, J. & Dobao, M. T. (1988). Inbreeding and family index selection for prolificacy in pigs. Animal Science, 46: 79–85.
Wabacha, J. K., Maribei, J. M., Mulei, C. M., Kyule, M. N., Zessin, K. H. & Oluoch-Kosura, W. (2004). Characterization of smallholder pig production in Kikuyu Division, central Kenya. Preventive Veterinary Medicine, 63: 183-195.
Yeshambel Mekuriaw & Bimrew Asmare (2014). Assessment of Pig Production and Constraints in Mecha District, Amhara Region, Northwestern Ethiopia. Advances in Agriculture, Article ID 329254, http://dx.doi.org/10.1155/2014/329254.

East African Journal of Veterinary and Animal Sciences (2017) Volume 1(1): 41-46
___________________________________________ *Corresponding Author. E-mail: [email protected] ©Haramaya University, 2017
Prevalence and Species of Ticks on Cattle in Borecha District, Southern Ethiopia Jelalu Kemal1*, Mathewos Israel2, and Sisay Alemu1 1College of Veterinary Medicine, Haramaya University, P. O. Box 138, Dire Dawa, Ethiopia. 2Borecha District Agricultural and Rural Development Office, Southern Ethiopia.
Abstract: A cross sectional study was conducted from October 2014 to June 2015 to identify and estimate the abundance of bovine tick species. The ticks were collected from different attachment sites on cattle kept under extensive management system. Among the 384 animals examined, 63 percent (n=242) were infested by one or more tick species. A total of 4246 adult ticks were collected and five tick species belonging to two genera, namely Amblyomma and Rhipicephalus were identified. The prevalence of tick infestation in animals with poor body condition (73.95%) was significantly (P<0.05) higher compared to animals with good body condition (52%). The prevalence of tick infestation among the age groups was significant (P<0.05) and higher in old than young and adult. Boophilus tick species infested all body regions of animals. Amblyomma species concentrated on the scrotum/udder regions whereas Rhipicephalus were restricted to the ear, neck, udder/scrotum, ano-genital and tail of the animals. The prevalence and abundance of tick in the present study is high and can reduce animal productivity. Therefore, appropriate and strategic tick control program should be formulated and implemented and this should be based on the distribution pattern of the tick species.
Keywords: Bovine; Tick; Prevalence; Tick burden
Introduction Ethiopia has the largest livestock population in Africa and livestock contribute to the livelihoods of over 80% of the rural population by providing food such as milk and meat, and foreign currency earning to the country from export of live animals, hides and skins (Fufa et al., 2009). The utilization of hides and skins in Ethiopia is estimated at 48 for cattle, 75 for goats and 97% for sheep with off take rate of 7, 35, and 33%, respectively (Mahmud, 2000). Though hides and skin are very important source of export income, its contribution to the national economy is far below the expected potential mainly due to external parasite such as ticks (Kassa, 1998; Hagos et al., 2013) that cause significant economic losses through rejection and down grading of hides and skins. Ticks and Tick Borne Diseases (TBDs) are widely distributed throughout the world, particularly in tropical and sub-tropical regions. It was estimated that 80% of the world’s cattle population is exposed to ticks infestation (Fufa et al., 2009). Ticks have developed resistance to many classes of acaricide including organophosphates, formamidines (amitraz) and other acaricide group in different regions of the world. Target site mutations are the most common resistance mechanism observed, but there are examples of metabolic mechanism (Shearer and Wall, 2008). In Ethiopia, tick and tick borne diseases cause considerable losses to livestock industry and accounts for 75% of the animal exports loss. A conservative estimate of 1 million birr loss annually was incurred through rejection and down grading of hides and skin in the country (Hagos et al., 2013). Apart from direct effect on animal production and productivity, ticks are inviolably efficient vectors of pathogens to man and domestic animals (Pegram et al., 1981; Rahbari et al., 2009).
According to Walker et al. (2003) ticks that are considered to be most important to the health of domestic animals in Africa comprise about forty species. Among these, the most important tick species in cattle are Amblyomma gema, A. varigatum, A. cohaerens, A. lepidum (Sileshi et al., 2002; Ammanuel and Abdu, 2014), Boophilus, decoloratus (Sileshi, 2002), B. annulatus (Tamiru and Abebaw, 2010) Rhipicephalus pulchellus, R. pravus, R. everts everties (Alemayehu, 2000), and Haemaphysalis aciculifer (de castro, 1994; Mesele et al., 2010). The environmental condition and vegetation of Ethiopia are highly conducive for ticks and tick-borne disease perpetuation (Pegram et al., 1981). The infestation of tick results in retardation of animal growth, loss of milk, and meat production by affecting the market desirability (Tsegaye et al., 2014). Even though various researches were carried out in different parts of the country, there were no studies conducted regarding tick infestation problem and tick species distribution in the present study area. Therefore, the present study was designed to estimate the prevalence, identify tick speciesand associated risk factors.
Materials and Methods Study Area The study was conducted in four selected Kebeles (Yirba dumancho, Bonoyachire, Konsore fulassa and Sadamo dikicha) of Borecha district, Sidama Zone, Southern Ethiopia. Borecha is located at about 304 km from Addis Ababa, the capital city of Ethiopia. It has a total land mass of 39, 504 hectare out of which about 17,934, 17,778, and 6,487 ha were covered by perennial crops, forest and grazing land, respectively. Administratively, there are 39 rural kebeles and 4 urban Kebeles. It has an altitudinal range of 1700-2000 above sea level and its agro-ecological condition is 22% highland and 78% lowland. The average annual rainfall ranges from 1232

Jelalu et al East African Journal of Veterinary and Animal Sciences 1(1): 41-46
42
mm – 1242 mm and the annual average temperature is 16-29.8 oC. Study Animals The study population constituted local breeds that were available in the study area. Cattle in the rural areas are indigenous zebu breed kept in traditional management system. The animals depend on grazing throughout the year with little supplementation of crop residues.Cross breed cattle are increasing in number and they are primarily reared around urban and peri-urban areas. Study Design A cross sectional study was conducted from October 2014 to June 2015 to identify tick species and their preferred site of attachment on the animal body. All animals investigated were categorized in to age, sex, season, and body condition score (BCS) (Table 1). The age of the cattle were grouped into young (1 to 2 years), adult (3 to 7 years) and old (>8 years) as described by Gatenby (1991). The BCS of the animals were categorized into poor and good based on the appearance of ribs and dorsal spines as applied for indigenous cattle
(Nicholson and Butterworth, 1986). Samples were collected both in dry (December, January and February) and wet season of the year (October, November, March and April). Sampling Method and Sample Size Determination The study Kebele's were purposively selected based on the availability of transportation and logistics as well as their agro-ecological representativeness of all Kebele's of the district. From each selected Kebeles, the animals were selected by simple random sampling method. The sample size was determined by using the formula given by Thrustfield (1995). The expected prevalence of Ixodidae ticks of cattle in the district was assumed to be 50% since there was no known research conducted in the study area. The parameters used were 95% confidence interval and 5% desired level of precision. Accordingly, the sample was determined by employing the formula: N = 1.962 pexp (1-pexp)/d2, and by substituting these values in the formula, the sample size determined was n = 384. Where n = sample size; pexp = expected prevalence; d2 = expected precision which is usually 5% (0.05).
Table 1. Study animals in terms of age, sex, season, and body condition score
Factors Categories Number of animals examined
Sex Male 92 Female 292
Age Young 59 Adult 296 Old 29
Body condition Good 192 Poor 192
Season Dry 139 Wet 245
Kebele Yirba dumancho 112 Bonoyachire 100 Konsore fulassa 81 Sadamo dikicha 91
Tick Collection and Identification First, the animals were properly restrained and checked for any tick infestation. Adult ticks were collected from half body regions such as ears, heads, dewlaps, belly/flunk, udder/scrotum, fore/hind legs, perineum and tails. Ticks were removed carefully and gently in a horizontal pull to the body surface. The collected ticks were preserved in universal bottles containing 70% ethanol and labeled with respect to predilection site, age, sex, BCS of the animal, and date of collection and transported to district veterinary laboratory. Ticks were counted and subsequently identified to genus and species level by using stereomicroscope according to standard identification keys given by Walker et al. (2003).
Data Processing and Analysis The data collected were entered and managed in Microsoft excel. STATA (STATA Corporation, 2001) was employed for the data analysis. The overall prevalence of tick was determined by dividing the number of positive animals by total sample size and was
expressed as percentage. Chi-square (𝑥2) test was used to assess the association in tick infestation between different variables.
Results Overall Prevalence Out of the 384 animals examined, the prevalence of ticks was 63.02% (n=242) and the animals harbored at least one tick species of varying number (Table 2). There was no difference among the study kebeles.

Jelalu et al Prevalence and Species of Ticks on Cattle
43
Table 2. Prevalence of tick infestation in cattle by the sample Kebeles
Kebele No of animals examined
No of positive
Prevalence χ2 p-value
Yirba dumancho 112 66 58.9% 15.02 0.89 Bonoyachire 100 64 64% Konsore fulassa 81 62 76.5% Sadamo dikicha 91 50 54.9%
Total 384 242 63.02%
Relative Abundance of Tick Species Boophilus decoloratus is the most commonly found tick species followed by Ambylomma lepidium, Ambylomma
varigatum, Rhipiepcephalus eversi and Rhipiepcephalus mushamae, respectively (Table 3).
Table 3. Frequency of tick species identified in Borecha district
Tick species Frequency Percentage
B. decoloratus 2570 60.53 A. Lepidium 814 19.17 A. Varigatum 378 8.17
R. eversi 320 7.54 R. mushamae 164 3.86
Total 4246 100
Prevalence of Tick Infestation by Different Risk Factors The overall prevalence of tick infestation was 63%. There was no significant difference in the occurrences of tick infestation among the study Kebeles (Table 2). Slightly numerically higher prevalence was recorded in Yirba duwancho Kebele (41.5%) and lower prevalence in Sadamo dikicha Kebele (31.5%). The occurrence of tick infestation were not significantly different (p>0.05)
between sex. There was statistically significant association between age of the animals and level of tick infestation (P<0.05) (Table 4) in which older animals recorded the highest prevalence Animals with poor body condition had higher tick prevalence than animals with good body conditions (Table 4). There was no variation in tick infestation between seasons of the year (p>0.05) (Table 4).
Table 4. Prevalence of tick infestation in cattle of the study district by sex, body conditions, age and season
Factors No of animals examined
No of positive Animals
Prevalence χ2 p-value
Sex Male 92 61 66.30% 9.36 0.69 Female 292 181 61.98%
Age Young 59 33 55.93% 5.33 0.003 Adult 296 185 62.5% Old 29 24 82.75%
Body condition Good 192 100 52% 6.8 0.0001 Poor 192 142 73.95%
Season Dry 139 83 59.71% 3.55 0.36 Wet 245 159 64.89%
Total 384 242 63.02%

Jelalu et al East African Journal of Veterinary and Animal Sciences 1(1): 41-46
44
Distributions of Tick Species on Different Body Parts of the Animals A total of 4246 ticks belonging to five tick species of two genera were identified. Rhipicephalus (Boophilus) decoloratus was the most abundant tick species followed by A. lepidum, A. varigatum, R. evertsi and R. mushamae in
decreasing order (Table 5). Boophilus tick species infested all body regions of animals, Amblyomma species are concentrated on the scrotum/udder regions whereas Rhipicephalus was restricted to the ear, neck, udder/scrotum, ano-genital and tail of the animals.
Table 5. Species of ticks and their distribution on body regions of cattle in the study area
Body region A. varigatum A. lepidum B. decoloratus R. evertsi Total
Ear 0 0 6 (40)* 10 (92) 16 (132) Face 0 0 41 (222) 0 41 (222) Neck 1 (6) 1 (2) 126 (1308) 2 (182) 130 (1494) Brisket 8 (30) 13 (46) 38 (136) 0 59 (212) Abdomen 2 (14) 2 (10) 76 (498) 0 80 (526) Limbs Scrotum 14 (42) 14 (72) 36 (222) 0 54 (336) Udder 54 (262) 85 (652) 14 (78) 1 (4) 154 (996) Back 1 (6) 0 13 (38) 0 14 (44) Ano-gential 5 (18) 11 (32) 1 (2) 49 (202) 96 (254) Tail 0 0 8 (26) 1 (4) 9 (30)
Total tick 378 814 2570 484 4246
Numbers indicate animals harboring tick and count/burden of ticks, respectively.
Discussion This study revealed that ixodid ticks are widespread and most significant external parasites of cattle in the district with an overall 63.02% prevalence. The animals are infested with at least a single tick. This finding is in line with previous result reported by Ammanuel and Abdu (2014) who found 62.04% infestation rate in Wolaita Zone, Ethiopia. The result is comparable with Meaza et al. (2014) who reported 74% at Bahirdar. However, higher prevalence (89.4%) was reported by Nigatu and Teshome (2012) in western Amhara. Mesele et al. (2010) reported 97.8% prevalence which is by far higher than the current prevalence rate. Lower prevalence (27.3%) and (25.6%) was reported by Addisu and Addis (2015) at Bench Maji zone and Belew and Mekonnen (2011) at Holeta, central Ethiopia, respectively. This prevalence variation is most probably attributed to the differences in the agro-climatic condition and agro-ecology among the study areas. Tick activity can be influenced by rainfall, temperature, altitude and atmospheric relative humidity (Pegram et al., 1981). Although there are different species of ticks known to be found in other parts of the country (Tsegaye et al., 2014), only five species were identified in the present study. B. decolaratus was the most abundant tick species in the district (60.5%). This is in agreement with Sileshi et al. (2007) who noted B. decolaratus to be the commonest and most wide spread tick in Ethiopia among the ticks collected across all regions of the country, except Afar region. This is also in line with the findings of Tamiru (2008) in Asela, and Abebaw (2004) who reported the highest prevalence of B. decolaratus (80%). Lower prevalence of this species was reported by Alekaw (1998) in Metekel Ranch (5%), Ethiopia and Mesele et al. (2010) at Bedelle district (23.7%). This difference is attributable to the geographical location and altitude of the study areas since this tick species is abundant in wetter
highlands and sub-highlands receiving more than 800 mm rainfall annually (Pegram et al., 1981). A. lepidium was the second most abundant tick species in this study area. This tick is an important vector of Cowdria ruminatum which cause heart water in cattle (Walker et al., 2003). This tick was reported by several workers (Pegram et al., 1981; Sileshi, 1995; Mesele et al., 2010) in different part of the country and with varied prevalence. The tick is irregularly dispersed throughout most parts of the country. It occurs in arid and semi-arid areas and also in woodland, bush land as well as grassland with either trees or bushes present (Horak et al., 2011). A. varigatum was the third most abundant tick species in this study. Mesele et al. (2010) reported 14.1% prevalence of this species. The result reported for the survey conducted in western Shoa Bako district by Hussen (2009) indicated this tick species to be the first most abundant species with prevalence of 54.3%. Meseret et al. (2014) and Latif and Walker (2004) reported 38.87% and 32.2% prevalence at Haramaya district and Fiche Selale, respectively. Moreover, Solomon et al. (2007) noted this species to be the second abundant in cattle in Ghibe Tollay area showing seasonal peaks from April to June. The difference in result was due to the geographical location. A. varigatum is a potential vector of diseases caused by C. rumintium, T. mutan, T. velifera (benign bovine thelieriasis), viral disease, Nairob sheep disease and also aggravates the situation of bovine dermatophilosis (D. congolence) (Sileshi et al., 2007). Rhipicephalus eversi eversi is the fourth abundant tick species (7.5%) in the present study area. The prevalence of this species is lower than reports by Solomon et al. (2007) (21.19%) at Ghibe Tullary in central Ethiopia. This tick shows an apparent preference for any particular altitude, rainfall or season (Pegram et al., 1981). It is a possible vector of Babesia, Rickettisa and Theleria (Kettle,

Jelalu et al Prevalence and Species of Ticks on Cattle
45
1995). The occurrence of this species in and around the study area was also reported by other authors (de Castro 1994; Sileshi, 1995; Sileshi et al., 2007). R. mashamae is the fifth and least tick abundant species (3.9%) identified in the area. In this study only 164 ticks were collected. Tick infestation in the current study was significantly associated with age of the animals (p<0.05) in that older animals had significantly higher tick loads than adult animals. This is probably associated with a decrease in the immunity as the animals get older. Significant difference (p<0.05) was recorded among different body condition score groups with the higher prevalence in poor animals. Similar prevalence of tick infestation between the different sample Kebeles was due to the similarity of the environment. With regard to distribution pattern of ticks on the animal body, B. decolarantus was collected from all examined body region, even though the frequency of occurrence is more in the areas extending from face to the limbs, and less on ear, back, ano-gential and tail regions. This species was also the commonest tick collected accounting for 60.5% of all ticks on the study animals. R. evertsi and R. mushamae were the most restricted tick species identified. They were restricted to the ears, the neck and ano-gential areas with very few of them observed on the scrotal/udder area. Amblyomma species were more fairly distributed than Rhipicephalus counterparts, with the exceptions of their absence from the ear, face, back and tail. Amblyomma spp were more concentrated in the areas of scrotum or udder. The neck, udder and scrotum areas were affected with the highest number of tick (55.4%) followed by abdomen, ano-genital and limbs. Of the total 242 animals affected 154 (63.6%) of them had ticks on the scrotum or the udder depending on the sex of the animal. The previous findings of Okello-Onen et al. (1999), Solomon and Kassa (2001), Walker et al. (2003) and Belew and Mekonnen (2011) supported the present finding regarding the attachment sites of ticks. Several factors may determine the attachment site of ticks such as host density, interaction between tick species, time and season and inaccessibility for grooming. Information on predilection sites of ticks can increase the efficiency of control methods and aids sampling.
Conclusion and Recommendations This study showed high burden of ticks in the area with an overall prevalence of 63.02%. The most important and abundant tick species were B. decolaratus, A. lepidum, A. varigatum, R. evertsi and R. mushamae. The predilection sites identified for the tick species will help in designing tick control methods. Heavy infestations by different tick species can suppress the health of cattle, damage teats, hide and skin and reduce productivity of animals. Therefore, appropriate and timely strategic tick control program should be formulated and implemented based on the distribution pattern of ticks and factors responsible for their devastation.
Acknowledgments We would like to thank Dr. Kokeb Kore, Mr. Sintayou Alemu, and Mr. Abidisa Oshonu of Hawassa University and Dr. Habtamu Alemayehu of Borecha district veterinary open air clinic for their advice, support and encouragement during the work. We also would like to grateful to all those directly or indirectly engaged in this work.
Conflict of Interests The authors declare that they have no competing interests.
References Abebaw Gashaw (2004). Seasonal dynamics and host
preference of Boophilus decoloratus on naturally infested cattle in Jimma zone, south western Ethiopia. Ethiopian Veterinary Journal, 18 (1): 19-28.
Addisu Hailu & Addis Getu (2015). Breed Characterization Tools and Their Applications. International Journal of Genetics, 5(1): 07-14.
Alekaw Sinshaw (1998). Distribution of ticks and tick-borne diseases at Metekel Ranch. Ethiopian Veterinary Journal, 4(1): 30.
Alemayehu Regassa (2000). The use of herbal preparations for tick control in western Ethiopia. Journal of South Africa Veterinary Association, 71: 240-243.
Ammanuel Wolde & Abdu Mohamed (2014). Prevalence of Ixodid Ticks on Bovine in Soddo Zuria Districts, Wolaita Zone, Ethiopia. Acta Parasitologica Globalis, 5(3): 188-197.
Belew Tiki & Mekonnen Addis (2011). Distribution of Ixodid Ticks on Cattle in and Around Holeta Town , Ethiopia. Global Veterinaria, 7:527-531.
de Castro, J. J. (1994). Tick survey. A Survey of the Tick Species in Western Ethiopia, AG:DP/ ETH/83/023, Technical Report, Food and Agricultural Organization of the United Nations (FAO). Rome, Italy.
Fufa Abunna, Kasasa, D., Shelima, B, Bekele Megersa, Alemayehu Regassa & Kebede Amenu (2009). Survey of tick infestation in small ruminants of Miesso district, West Harergie, Oromia Region, Ethiopia. Tropical Animal Health and Production, 41: 969-972.
Gatenby, R. (1991). The Tropical Agriculture. London and Beging Stock McMillan Education Ltd.
Hagos Ashenafi, Yacob Hailu and Mulugeta Y. (2013). Impact of sheep and goats ectoparasites on the tanning industry in Tigray Region, Ethiopia Ethiopian Veterinary Journal, 17(2): 63-76.
Horak, I. G., Gallivan, G. J. & Spickett, A. M. (2011). The dynamics of questing ticks collected for 164 consecutive months off the vegetation of two landscape zones in the Kruger National Park (1988–2002). Part I. Total ticks, Amblyomma hebraeum and Rhipicephalus decoloratus.

Jelalu et al East African Journal of Veterinary and Animal Sciences 1(1): 41-46
46
Hussen, Y. (2009). Preliminary survey of cattle tick species and burden in and around Bako Town. School of Veterinary Medicine, Jimma University, Jimma, Ethiopia. Onderspoorts Journal of Veterinary Research, 78(2011), 10pp.
Kassa Bayou (1998). Control of sheep and goat skin diseases. In: proceedings of control of sheep and goat skin siseases for improved quality of hides and skins, February13–14, 1998, FAO, Addis Ababa, Ethiopia, pp: 13-15.
Kettle, D. S. (1995). Medical and Veterinary Entomology. 2nd Ed. UK: CAB International. pp. 420-460.
Latif, A. A. & Walker, A. R. (2004). An introduction to the biology and control of ticks in Africa.ICTTD-2 project, pp: 1-29.
Mahmud, M. (2000). Raw hides and skin improvement in Ethiopia status and challenges in Preceding the opportunities and challenges of goat production in East Africa, a Conference held from 10-12 November, 2000. Debub University, Hawassa, Ethiopia.
Meaza Gedilu, Abdu Mohamed & Yisehak Kechero (2014). Determination of the Prevalence of Ixodid Ticks of Cattle Breeds, Their Predilection Sites of Variation and Tick Burden Between Different Risk Factors in Bahir Dar, Ethiopia. Global Veterinarian, 13(4): 520-529.
Mesele Abera, Tirazu Mohammed, Rahmeto Abebe, Kassaye Aragaw & Jemere Bekele. (2010). Survey of ixodid ticks in domestic ruminants in Bedelle district, Southwestern Ethiopia. Tropical Animal Health and Production, 42: 1677-1683.
Meseret Gebreselama, Fikre Zeru and Gebremedhin Romha (2014). Identification and Prevalence of Ectoparasites in Cattle and Sheep in and Around Bishoftu Town, Central Ethiopia, Animal and Veterinary Sciences, 2(4): 124-129.
Nicholson, M. and Butterworth, T. (1986). A guide to body condition score in zebu cattle international livestock centre for Africa, Addis Ababa, Ethiopia.
Nigatu Kebede & Teshome Fetene (2012). Population dynamics of cattle ectoparasites in Western Amhara National Regional State, Ethiopia. Journal of Veterinary Medicine and Animal Health, 4: 22-26.
Okello-Onen, O. J., Tukahirwa, E. M., Perry, B. D., Rowlands, G. J., Nagda, S. M,. Musisi, G., Bode, E., Heinonen, R., Mwayi, W. & Opuda-Asibo, J. (1999). Population dynamics of ticks on indigenous cattle in pastoral dry to semi-arid range land zone of Uganda. Experimental and Applied Acarology, 23: 79-88.
Pegram, R., Hoogstral, G. & Wassef, H. Y. (1981). Ticks (Acari:Ixodiade) of Ethiopia. Distribution, ecology and relation of species infesting livestock. Bulletin of Entomology Research, 71: 335-359.
Rahbari, S., Nabian, S. & Bahohar, A. R. (2009) ‘Some observations on sheep sarcoptic mange in Tehran
provinces, Iran’, Tropical Animal Health and Production, 41: 397-401.
Shearer, D. & Wall, R. (2008). Veterinary Ectoparasites: Biology, Pathology, and Control. 2nd Edn. John Wiley & Sons, Chichester, pp: 304.
Sileshi Mekonnen. (1995). Tick and tick borne diseases and control strategies in Ethiopia. Second International Conference on Tick Borne Pathogens at the Host Vector Interface. A Global Prospective, August 28 - September 1, 1995, Kruger National park, South Africa.
Sileshi Mekonnen, Bryson, N. R. Fourie, L. J. Spickett, A. M. Taylor, R. J., Strydom T. & Horak, I. G. (2002). Acaricide resistant profiles of single and multi-host ticksfrom communal and commercial farming areas in the Eastern Cape and North-West Provinces of South Africa. Onderspoorts Journal of Veterinary Research, 69: 99-105.
Sileshi Mekonnen, Pegram, R. G., Solomon Gebre, Abebe, M., Yilma Jobre & Sileshi, Zewde (2007). A synthesis of review of Ixodids (Acari: Ixodiade) and Argas (Acari: Argasidae) ticks in Ethiopia and their possible role in diseases transmission. Ethiopian Veterinary Journal, 2: 1-22.
Solomon Gebre, Sileshi Mekonnen, Nigist Mekonnen, Thomas Cherinet, Getachew Tilahun, Abebe Mekonnen, Genet B., Demeke Sibhatu & Ejigu Zebene (2007). Distribution and seasonal variation of ticks on cattle at Ghibe Tollay in central Ethiopia, Ethiopian Veterinary Journal, 11:121-139.
Solomon Gebre & Kassa Gebre (2001). Development reproductive capacity and survival of Amblyomma variegartum and Boophilus decoloratus in relation to host resistance and climatic factors under different field conditions. Veterinary Parasitology, 75:241-253.
Stata Corporation. (2001). Stata Statistical Software. Release 7.0. College Station, TX: Stata Corporation
Tamiru Tessema & Abebaw Gashaw. (2010). Prevalence of ticks on local and crossbred cattle in and around Asella town, southeast Ethiopia. Ethiopian Veterinary Journal, 14(2), 79-89.
Tamiru Tessema. (2008). Survey of Bovine tick species in and around Asela Town, DVM Thesis, school of Veterinary Medicine, Jimma University, Jimma, Ethiopia.
Thrustfield, M. (1995). Veterinary Epidemiology. 2nd Ed. UK Black Well Science Ltd., pp: 182-198.
Tsegaye Ayalew, Yacob Hailu & Bersissa Kumsa. (2014). Ixodid ticks infesting cattle in three agroecological zones in central Oromia: species composition, seasonal variation, and control practices. Comparative Clinical Pathology, 23: 1103-1110.
Walker, A. A. Bouatour, A., Camicas, J. L. Estadapena, A. A, Harok, I. G., Hatif, A. A., Pegram, R. G. & Preton, P. M. (2003). Ticks of domestic animals in Africa: A guide to identification species. The University of Edinburgh, UK, pp: 67-80.

East African Journal of Veterinary and Animal Sciences (2017) Volume 1(1): 47-52
___________________________________________ *Corresponding Author. E-mail: [email protected] ©Haramaya University, 2017
Prevalence and Characterization of Hydatid Cyst in Cattle at Halaba Kulitto Municipal Abattoir, South Ethiopia
Sisay Alemu1*, Fethu Lemma1, Jelalu Kemal1, Ashebr Abraha1
, and Tahir Adem2
1 Haramaya University College of Veterinary Medicine, Ethiopia 2Halaba Kulitto Agricultural Office of Veterinary Clinic, Ethiopia
Abstract: A cross sectional study was conducted from October 2012 to July 2013 to determine the prevalence of hydatidosis in cattle slaughtered at Halaba kulitto municipal abattoir. A total of 384 cattle organ were examined and the result revealed an overall hydatidosis prevalence of 24.21% (93/384). The distribution of hydatid cysts in different internal organ were 12.8% (49/384), 3.1% (12/384), 0%, 0.5% (2/384), 1.3% (5/384), 4.7% (18/384), 0.8% (3/384) and 1.0% (4/384), respectively in lungs, liver, kidney, heart, spleen, lung and liver, lung, liver and spleen and in lung and spleen. The lung was the most affected organ followed by the liver. Sex and age of the animal did not have statistically significant effect (P>0.05). A total of 70 cysts were examined for viability and fertility test. Accordingly, 82.86% (58/70) and 53% (37/70) cysts were fertile and viable, respectively. The findings of the present study disclosed that hydatidosis was prevalent in cattle of the study area and responsible for high level of condemnation of different organs. Hence, an integrated control approach involving strategic de-worming of the final hosts with strong surveillance system and good management practice of animals are essential for the reduction of the parasite prevalence.
Keywords: Cattle; Hydatidosis; Municipal Abattoir; Organs; Prevalence
Introduction Ethiopia possesses the largest livestock population in Africa (CSA, 2014). However, the contribution of the livestock sector to the national economy has been reported to be small compared to its potential. One of the main causes of the mismatch between herd population size and production output from livestock in Ethiopia is undoubtedly the widespread occurrence of a multitude of infectious and parasitic diseases, causing morbidity, mortality and market restrictions, which drastically reduce animal production (Shapiro et al., 2015). Hydatidosis is one of the major parasitic problems of domestic animals and a zoonotic disease that cause considerable economic losses and public health problems worldwide (Ekert and Deplaszes, 2004). Echinococcosis is a zoonotic infection caused by adult or larval (metacestode) stages of cestodes belonging to the genus Echinococcosis and the family Taeniidae. Hydatidosis, which is a cystic echinococcosis, also known as hydatid disease, is an infection caused by the larval stage of the flatworm Echinococcus granulosus. It has a cosmopolitan distribution and is one of the most widespread parasitic zoonoses. Hydatidosis is of importance since humans serve as incidental intermediate hosts (Jones et al., 2012). Echinococcosis has greater public health and economic impact in countries where livestock production is based on extensive grazing system and is major component of the agriculture sector. Previously there was no any data on the prevalence of the disease and its rate in different organs in the study area. Hence, the objective of this study was to estimate the prevalence of hydatidosis in cattle slaughtered at Halaba kulitto municipal abattoir.
Materials and Methods Study Area The study was conducted from October, 2012 to July, 2013 in Halaba district municipal abattoir southern part of Ethiopia. Halaba district is located 315 kms west to Addis Ababa in Southern Nation Nationalities People Regional State. The geographical location of the district is 7o 17’ N latitude and 38o 06’ E longitude. The altitude ranges from 1100 meters to 1200 meter above sea level. The annual rainfall varies from 900mm to 1200mm while the minimum and maximum temperatures are in the order of 21oC and 29oC; 18oC and 24 oC in low and highland, respectively. The area is also characterized by two seasons, the wet season from May to October and the dry season from November to April (IPMS, 2005). The livestock population of Halaba district is cattle 166,871, sheep 60,475, goats 67,163, poultry 160,515, donkey 39,379, mule 227 and horse 61,123 (CSA, 2014). Study Animals The study was conducted on 384 local breed cattle sourced from neighboring district such as Kulito, Arsi Neglle, Ropi, Beshno and Guba. During the study period 10 heads of cattle were slaughtered per day on average. Study Design A cross-sectional study were carried out from October 2012 to July 2013 by collecting data on events associated with hydatidosis in cattle slaughtered at Halaba district municipal abattoir. Sampled animals were selected using simple random sampling method from cattle registered for slaughter. The data were collected at an interval of 10 days and 20 animals were investigated at each data

Sisay et al. East African Journal of Veterinary and Animal Sciences 1(1):47-52
48
collection day. Information such as body condition and age of the slaughtered animals was determined based on Nicholson and Butter Worth (1986) and De-Lahunfa and Habel (1986), respectively. Sample Size Determination There was no information available in the district before this study. Hence, the sample was calculated based on the formula given by Thrusfield (2005). Accordingly, assuming 50% expected prevalence of bovine hydatidosis, the required sample size was 384 cattle at 95% confidence level and 5% expected error. Study Methodology Ante-mortem Examination: During ante-mortem examination details of sex, age, and origin of each individual animal was recorded. Sources of cattle for slaughter were identified based on unique identification marks made on the body of each animal using ink from source markets and the markings were transferred to all carcasses and visceral organs after slaughter. Post-mortem Examination: During post- mortem examination organs of the abdominal and thoracic cavities, namely, liver, lung, heart, spleen and kidney were systematically inspected for the presence of hydatid cyst by applying routine meat inspection procedures which consists primary examination followed by a secondary examination when evidence of hydatid cyst were found. The primary examination involves visualization and palpation of organs and muscles, whereas secondary examination involves further incisions in each organ in case where a single or more hydatid cyst observed. When cysts were present the number of the cysts per organ per animal were recorded (FAO, 1994). Examination of cysts for fertility and viability: Individual hydatid cysts were carefully incised and examined for the presence of protoscolices, which resembled white dots on the germinal epithelium. Such cysts were characterized as fertile cysts. Fertile cysts were
further subjected to viability test (Daryani et al., 2007). A drop of the sediment containing the protoscolices were placed on the microscope glass slide and covered with cover slip and observed for amoeboid like peristaltic movements with 40x objective. For clear vision, a drop of 0.1% aqueous eosin solution was added to equal volume of protoscolices in hydatid fluid on microscope slide with the principle that viable protoscolices should completely or partially exclude the dye while the dead ones absorb it (Macpherson et al., 1985). Furthermore, infertile cysts were classified as sterile or calcified. Sterile hydatid cysts were characterized by their smooth inner lining usually with slightly turbid fluid in their content. Typical calcified cysts produce a gritty-sound heard at incision (Soulsby, 1982). Data Processing and Analysis The data was entered in to MS-Excel code and analyzed using SPSS-16.0 version and descriptive statistics like percentage were used. The relative frequencies of cysts detected in various organs were calculated. Cattle harbored hydatid cyst were categorized by the number of organs involved and cysts found in different organs. Chi-square (χ2) was used to test the existence of association between factors and prevalence. Significant association between variables was considered if the p-value is less than 0.05.
Results The number of animals infected with hydatid cysts with respect to origin is presented in table 1. The highest prevalence was recorded for animals sourced from Arsi Negele and Kulito. The prevalence of hydatidosis was 24.21% (93/384) (Table 2). Postmortem examination of visceral organs reveled 12.8% (49/384), 3.1% (12/384), 0%, 0.5% (2/384), 1.3% (5/384), 4.7% (18/384), 0.8% (3/384), and 1.0% (4/384), respectively in lungs, liver, kidney, heart, spleen, lung and liver, lung, liver and spleen and in lung and spleen. The present study showed the presence of hydatidosis in all origins of cattle (Table 2).
Table 1. Number of cattle infected by hydatidosis in relation to their origins
Origin No. of Animals examined Positive Prevalence (%)
Kulito 77 24 31.17 Arsi Negla 77 28 36.36 Ropi 77 16 20.78 Beshno 76 11 14.47 Guba 77 14 18.18
Total 384 93 24.2

Sisay et al Prevalence and Characterization of Hydatid cyst in Cattle
49
Table 2. Distribution of hydatid cyst in different organs
Organs examined No. of organs infected Percentage of infection (%)
Lung 49 12.8 Liver 12 3.1 Kidney 0 0 Spleen 5 1.3 Heart 2 0.5 Lung and Liver 18 4.7 Lung, liver, spleen 3 0.8 Lung, spleen 4 1.0
Total 93 24.2
The occurrences of bovine hydatidosis in different organs according to the two age group of animals slaughtered at the abattoir were 8.3% (1/12) in less than
5 years and 2.4% (92/372) in greater than 5 years of age, respectively (Table 3).
Table 3. The prevalence of hydatid cyst on different organs based on age
Organ examined Age No of examined animals
No of infected animals
Percentage χ2 P value
Lung < 5 years 12 1 8.3 0.218 0.622 >5 years 372 48 12.9
Liver < 5 years 12 0 0 0.400 0.379
>5 years 372 12 3.2 Heart < 5 years 12 0 0 0.065 0.721
>5 years 372 2 0.5 Spleen < 5 years 12 0 0 0.163 0.572
>5 years 372 5 1.3 Lung and liver < 5 years 12 0 0 0.609 0.279
>5 years 372 18 4.8 Lung, liver and spleen
< 5 years 12 0 0 0.098 0.662 >5 years 372 3 0.8
Lung and spleen < 5 years 12 0 0 0.130 0.61 >5 years 372 4 1.1
The percentage distribution of hydatid cysts in different organs on sex group was depicted in table 4. The number of female animals is very small as compared to males and may not show the actual situation. Among the 113 hydatid cysts observed, 70 were in liver, 33 in lungs, 8 in spleen and 2 in heart. Of these, 36 (31.86%), 18 (15.92%) and 16 (14.16%) and 43 (40.70%) were small, medium, large and calcified, respectively.
Out of the 70 cysts subjected to fertility test, 58 (82.86%) and 2 (17.14%) were fertile and sterile, respectively. The viability test indicated that 37 (53%) to be viable. Organ wise fertility of the hydatid cysts was higher for lung, followed by liver, spleen and heart in that order, while viability of the fertile cysts were higher for liver followed by lung, spleen and heart.

Sisay et al. East African Journal of Veterinary and Animal Sciences 1(1):47-52
50
Table 4. The prevalence of hydatid cyst on different organs based on sex
Organ examined
Sex No of examined animals
No of infected Animals
Percentage χ2 P- value
Lung Male 377 48 12.7% 0.015 0.0904
Female 7 1 14.3%
Liver Male 377 12 3.2 0.230 0.503
Female 7 0 0
Heart Male 377 2 0.5 0.037 0.786
Female 7 0 0 Spleen Male 377 5 1.3 0.094 0.667
Female 7 0 0 Lung and liver
Male 377 18 4.8 0.351 0.410 Female 7 0 0
Lung, liver and spleen
Male 377 3 0.8 0.056 0.739 Female 7 0 0
Lung and spleen
Male 377 4 1.1 0.075 0.700 Female 7 0 0
Discussion The findings of this study showed the existence of high prevalence of hydatidosis disease in cattle slaughtered at Halaba Kulitto municipal abattoir. This high prevalence of hydatidosis may be because of the presence of high number of stray dogs in the animal origin area. The high number of cyst in the lungs and liver may be due to the fact that these organs possess the first great capillaries sites which are encountered by migrating Echinococcus oncosphere which adopt the portal vein route and primarily dwell in the pulmonary and hepatic filtrating system sequentially before any other peripheral organ is involved (Ekert and Deplaszes, 2004). Similar finding was reported by Getachew and Jelalu (2014) with higher prevalence in lungs (19.53%) and heart (12.63%) in Addis Ababa Kara-alo PLC abattoir. The result of this study is comparable to other findings reported in different regions of Ethiopia and other countries (Baldock et al., 1985; Alemu, 2010). The prevalence recorded in the present study was greater than 11.9% reported by Zerihun (2011) from cattle in Mizan municipal abattoir, 8.28% in Al Baha region, Saudi Arabia (Ibrahim, 2010) and 11.9% by Zerihun (2011) in Mizan municipal abattoir, but lower than 54.4% reported by Ndrirangu et al. (2004) for cattle in Kenya, 38.3% in cattle slaughtered in the Ardabil province of North West Iran (Daryani et al. 2007), 38.9% for cattle in Pakistan Khan et al. (1990) and 32% in Niger Delta (Arene, 1985). 59% for cattle in Gondar abattoir (Nigatu, 2002); 32.1% in Tigray region (Gebretsadik, 2009); 48.9% in Debre markos municipal abattoir (Nigatu, 2009). The difference in the prevalence of hydatidosis among the different areas could be related to geography, dog population, source of cattle, dog management, de-worming practices, offal disposal habits and age of cattle slaughtered. In this study 53% of the tests were viable. Organ wise fertility of the hydatid cysts was 45.8%, 34.2%, 12.4% and 7.6%, for lung, liver, spleen and heart, respectively. While viability of these fertile cysts were 37.84%,
45.95%, 2.7 and 13.5 from lung, liver, heart and spleen, respectively. About 27.3% fertile, 72.7% infertile, 37.8% viable and 62.2% non-viable cysts were recorded in Kara-alo PLC abattoir (Getachew and Jelalu, 2014) which is higher in all cases than the present finding finding. Higher infection of hydatidosis was registered in adult cattle (>5 years old) compared to young cattle (<5 years) with variable prevalence among different organs examined. This is in line with Regassa et al. (2010) and Endrias et al. (2010) who found significantly higher prevalence of the disease in adult cattle. This could be due to immune status and longer exposure to the eggs of the parasite in adult than young animals.
Conclusion and Recommendations The present study showed hydatidosis to be a prevalent disease in the study area. Lung and liver were the major organs harboring hydatid cyst than other visceral organs and most of the cysts were found to be fertile. Moreover, the prevalence of hydatidosis is somehow varied among animals from different sources. Hence, an integrated parasitic control including treatment of final hosts of the parasite should be practiced in the area.
Acknowledgements We would like to thank the Agricultural Bureau of the Halaba kulitto and staffs of municipal abattoir for their support during the sample collection. Haramaya University in general and College of Veterinary Medicine in particular are also acknowledged for hosting and intellectual support.
Conflict of Interests The authors declare that they have no competing interests.
References Alemu Tilahun & Yitagel Terefe, T. (2013). Prevalence,
Cyst Distribution and Economic Significance in

Sisay et al Prevalence and Characterization of Hydatid cyst in Cattle
51
Cattle Slaughtered at Arbaminch Municipality Abattoir, Southern Ethiopia. Global Veterinaria, 11 (3): 329-334.
Arene, F. (1985). Prevalence of hydatidosis in domestic livestock in the Niger Delta. Tropical Animal Health and Production, 17: 3-4.
Baldock, F., Arthur, R. & Lawerce, A. (1985). A meat works survey of bovine hydatidosis in Southern Queen land. Australian Veterinary Journal, 62(7): 238-243.
CSA (Central Statistical Authority) (2014). Report on livestock and livestock characteristics; Volume II, Ethiopia, Addis Ababa.
Daryani, A., Alaei, R., Arab, R., Sharif, M. Dehghan, M. H. & Ziaei, H. (2007). The prevalence, intensity and viability of hydatid cysts in slaughtered animals in the Ardabil province of Northwest Iran. Journal of Helminthology, 81, 13-17.
De Lahunta, A. & Habel, R. E. (1986). Teeth Applied veterinary anatomy, W.B. Saunders Company, pp: 4-6.
Ekert, J. & Deplaszes P. (2004). Biological epidemiological and clinical aspects of echinococcosis, a zoonosis of increasing concern. Clinical Microbiology Reviews, 17: 107-135.
Endrias Zewedu, Yechale Teshome & Assefa Makwoya. (2010). Bovine hydatidosis in Ambo municipal abattoir, West Shoa, Ethiopia. Ethiopian Veterinary Journal, 14, (1): 1-14.
FAO (1994). Guidelines for Echinococcosis/ hydatidosis Surveillance Prevention and Control. FAO, Rome, 29: 147.
Gebretsadik Berhe. (2009). Abattoir survey on cattle hydatidosis in Tigray region of Ethiopia. Faculty of veterinary science, Mekele University, Ethiopia. Tropical Animal Health and Production, 41: 1347-1352.
Getachew Demssie & Jelalu kemal. (2014). Bovine Hydatidosis and its Economic Importance at Kara-Alo Abattoir PLC, Addis Ababa, Ethiopia. Journal of Veterinary Science and Technology, 5 (5): 206.
Ibrahim, M. (2010) Study of cystic echinococcosis in slaughtered animals in Al Baha region, Saudi Arabia: Interaction between some biotic and abiotic factors. Acta Tropica, 113: 26-33.
Improving Productivity and Market Success (IPMS) Ethiopia. (2005). Alaba Pilot Learning Site diagnosis and program design. IPMS, ILRI (International Livestock Research Institute), Addis Ababa, Ethiopia.
Jones, O., Kebede Nigatu, Kassa Tesfu, Tilahun Getachew & Macias, C. (2012). Occurrence of
bovine hydatidosis and evaluation of its risk to humans in traditional communities of Southern Region of Ethiopia. Ethiop. Journal of Health and Development, 26: 43-48.
Khan, M., Afzal, M. & Shujar, A. (1990). Prevalence and serology of hydatidosis in large ruminants of Pakistan. Animal science institute, national agriculture research center, Islamabad, Pakistan. Veterinary Parasitology, 37: 163-168.
Macpherson, C. N. L., Zeyhle, E. & Roming T. (1985). An echniococcosis pilot control programme for Northwest Turkan, Kenya. Annals of Tropical Medical Parasitology, 78(3): 188-192.
Nicholson, M. & Butterworth, M. H. (1986). A Guide to Body condition scoring of Zebu cattle. International livestock center for Africa, Addis Ababa, Ethiopia.
Ndrirangu, A., Nejeruh, M., Gathura B. & Kyule, N. (2004). The prevalence of hydatidosis in slaughtered live stock in Kenya. The Kenyan Veterinarian, 27: 73-77.
Nigatu Kebede, Getachew Tilahun & Wondwosen Alemu. (2009). Financial loss estimation, prevalence and characterization of hydatidosis of cattle slaughtered at Debre Markos municipal abattoir. Tropical Animal Health and Production, 41(8): 1787-9.
Nigatu Kebede. (2002). A retrospective survey of bovine hydatidosis in three abattoir of Amhara National Regional State, Northern Ethiopia. Aklilu lema institute of pathology, Addis Ababa University. Tropical Animal Health and Production, 42(3): 323-325.
Feyesa Regassa, Alemante Molla & Jemere Bekele. (2010). Study o nthe prevalence of cystic hydatidosis and its economic significance in cattle slaughtered at Hawassa municipal abattoir. Tropical Animal Health and Production, 42 (5): 977-984.
Shapiro, B. I., Gebru, G., Desta, S., Negassa, A., Nigussie, K., Aboset, G. & Mechal, H. (2015). Ethiopia Livestock Master Plan. ILRI Project Report. Nairobi, Kenya: International Livestock Research Institute (ILRI), 79p.
Soulsby, E. J. L. (1982). Helminthes, Arthropods and Protozoa of domesticated animals 7th Ed. English Language book society/Billiere Tindall, London, pp: 123-127.
Thrusfield, M. (2005). Veterinary Epidemiology, Third Edition, Blackwell Science Ltd., UK, pp: 229-245.
Zerihun Melkeselam (2011). Prevalence of hydatidosis cystic echinococcosis in Mizan municipal abattoir. DVM unpublished Thesis, Haramaya University, College of veterinary medicine, Ethiopia.

Sisay et al. East African Journal of Veterinary and Animal Sciences 1(1):47-52
52

53
Instructions to Authors
1. Aim The East African Journal of Veterinary and Animal Sciences (EAJVAS) publish original scientific papers and technological information on as aspects of veterinary and animal sciences to the users in Eastern Africa and elsewhere in the world. It also enhances exchange of ideas among scientists engaged in research and development activities and accepts papers from anywhere else in the word. 2. Scope Manuscripts related to economically important large and small farm animals, poultry, equine species, aquatic species, and bees, as well as companion animals such as dogs, cats, and cage birds, and laboratory animals are particularly welcome. Manuscripts written on the subjects of basic sciences and clinical sciences related to veterinary medicine, nutrition, and nutritional diseases, as well as the breeding and husbandry of the above-mentioned animals and the hygiene and technology of food of animal origin, as well as papers describing the animal-related aspects of Life Sciences at molecular level (proteomics) or environment and animals (or humans), biotechnology are also under the domain of the Journal. 3. General Style and Format
Manuscripts should be written in English and consecutively paged.
Manuscripts should not exceed 25 pages (double spaced. Font size 12, Times New Roman), including tables, figures and illustrations.
Manuscripts should have A4 size paper; margin 0f 2.5cm on the left, right, top and bottom side of each page.
Headings and sub-headings should be in title case; bold and numbered.
Only International System of Units (SI) is acceptable. Symbols and Numenculatures should conform to international recommendations with respect to specific field of specialization.
Manuscript must be the report of original research findings and should neither be simultaneously submitted to, nor previously published in any other journal. Manuscript submission implies that consents of all authors and permission of the concerned institute (s) have been granted
All correspondence will be made with the author whose name appears first unless indicated otherwise.
4. Research Articles 4.1 Title page
A full title of the manuscript (short but informative)
The name (s) of the author (s) and affiliation (s). Numerical superscripts should be used should be used against affiliations if the authors are more than one.
Short (running) title; not more than 6 words
4.2. Text pages Manuscripts submitted to East Africa Journal of Veterinary and Animal Sciences should be divided
into the following sections: Abstract, Introduction, material and methods, results, discussion,
conclusion, acknowledgment and references.
54
4.2.1 Abstract Abstracts should not exceed 250 words and should clearly show aim of the study, how the study was performed, key findings with statistically significance, conclusions, and potential implications. 4.2.2 Introduction This is a brief background of the subject It is not necessary to include all of the background literature but brief reference to the most pertinent ones generally is enough to inform readers with findings of others in the field. The specific questions to be addressed the study should also described. It should not contain both authors’ result and conclusion. 4.2.3 Material and Methods Describe general materials and methods once. The materials used, the procedures followed and the design applied should be described clearly and in enough detail for another researcher to duplicate the experiment. Be clear and explicit about relevant details. 4.2.4 Results This part should be included a concise textual description of the data presented in tables and figures. Repetition of the same data in different forms should be avoided. The results should not include materials appropriate to the discussion. 4.2.5 Discussion This section describes interpretation and implications of the results obtained. It also includes comparison of results with results of other related studies. Repetition of the same data in different forms should be avoided. The results should not included materials appropriate to the discussion
Note: The result and discussion part can be presented together or separately. The material and methods, results and discussion sections could include sub-headings. 4.2.6 Conclusions Describe briefly the contributions of present work and state future research needs, if any. 4.2.7 Acknowledgments All person who have made a genuine contribution and who endorse the data and conclusions may be included. Authors are responsible for obtaining written permission to use any copyrighted text and/or illustration. 4.2.7 Conflict of Interests Authors should declare absence of competing interest. 4.2.8 References All materials (literature) referred to must be cited. References must be cited and listed in the following forms.
A. In text citation:
In the text, a reference identified by means of an author‘s name should be followed by the date of the reference in parentheses. When there are more than two authors, only the first author‘s name should be mentioned, followed by ’et al.,‘. In the event that an author cited has had two or more works

55
published during the same year, the reference, both in the text and in the reference list, should be identified by a lower case letter like ’a‘ and ’b‘ after the date to distinguish the works. Examples:
Falani (2003), Scott et al. (2000), (Amadi, 1991), (Thompson and Bety, 1992), (Moses, 1999; Todor, 1987a,b; Tijani, 1995,1996), (Washi et al., 2009). Ethiopian name: if the first name is Kebede, it should be written as Kebede (2010) for a single author or Kebede and Moges (2010) for two authors or Kebede et al. (2010) for multiple authors.
B. In reference list: (1) Books
For one author
Alexie, S. (1992). The Business of Fancy dancing: Stories and Poems. Brooklyn, NY: Hang Loose Press.
For two to six authors
Moir, A., & Jessel, D. (1991). Brain Sex: The Real Difference between Men and Women. London: Mandarin.
For seven and more
Johnson, L., Lewis, K., Peters, M., Harris, Y., Moreton, G., Morgan, B. et al. (2005). How Far Is Far?
London: McMillan.
For no author
The CCH Macquarie Dictionary of Business. (1993). North Ryde, NSW: CCH Australia.
For institutions as authors
Queensland Health. (2002). Best Practice Guidelines for the Management of Type 1 Diabetes in Children and
Adolescents. Brisbane, Qld.: Queensland Health.
For different editions
DeHart, G. B., Alan Sroufe, L., & Cooper, R. G. (1995). Child Development: Its Nature and Course (4th
ed.). Boston: McGraw-Hill.
For edited books
Friedman, S. L., & Wachs, T. D. (Eds.). (1999). Measuring Environment Across the Life Span: Emerging
Methods and Concepts. Washington, DC: American Psychological Association.
For chapter in an edited book

56
Booth-LaForce, C., & Kerns, K. A. (2009). Child-parent attachment relationships, peer relationships,
and peer-group functioning. In K. H. Rubin, W. M. Bukowski, & B. Laursen (Eds.), Handbook of
Peer Interactions, Relationships, and Groups (pp. 490-507). New York, NY: Guilford Press.
(2) Journal articles
For one author
Schafer, J.L. & Kang, J. (2008). Average Causal Effects from Nonrandomized Studies: A Practical
Guide and Simulated Example. Psychological Methods. 13, 279-313.
For two or more authors
Keller, T. E., Cusick, G. R., & Courtney, M. E. (2007). Approaching the Transition to Adulthood:
Distinctive Profiles of Adolescents Aging out of the Child Welfare System. Social Services Review, 81,
453-484.
(3) Conference papers
Published conference paper
Bohrer, S., Zielke, T., & Freiburg, V. (1995). Integrated Obstacle Detection Framework for Intelligent
Cruise Control on Motorways. Paper presented at IEEE Intelligent Vehicles Symposium. Detroit, MI:
Piscataway.
For unpublished conference paper
Bowden, F.J. & Fairley, C.K. (1996, June). Endemic STDs in the Northern Territory: Estimations of Effective
Rates of Partner Change. Paper presented at the scientific meeting of the Royal Australian College of
Physicians, Darwin.
(4) Periodic and government reports
For article from newspapers or magazines
Mathews, J., Berrett, D., & Brillman, D. (2005, May 16). Other Winning Equations. Newsweek, 145(20),
58-59.
For government report
Queensland Health. (2005). Health Systems Review Final Report. Brisbane: Queensland Government.
United States.
For pamphlet
Department of the Interior. National Park Service. (1989) Ford's Theatre and the House Where Lincoln
Died. Washington: GPO.

57
(5) Theses
Akmel Mohammed (2010) The Validity of Local Institutions of Conflict Resolutions among the Afar: the Case
of Samu Robi Gala’lo woredas, MA Thesis, Addis Ababa University.
Axford, J.C. (2007). What Constitutes Success in Pacific Island Community Conserved Areas? (Doctoral
Dissertation, University of Queensland, 2007). Retrieved from
http://espace.library.uq.edu.au/view/UQ:158747
(6) Article Retrieved from an Online Database
Senior, B., & Swailes, S. (2007). Inside Management Teams: Developing a Team Work Survey
Instrument. British Journal of Management, 18, 138-153. doi:10.1111/j.1467-8551.2006.00507.x (with
doi no.)
Koo, D. J., Chitwoode, D. D., & Sanchez, J. (2008). Violent Victimization and the Routine
Activities/Lifestyle of Active Drug Users. Journal of Drug Issues, 38, 1105-1137. Retrieved from
http://www2.criminology.fsu.edu/~jdi/ (if doi is not available)
For online government publication
U.S. Department of Health and Human Services, National Institutes of Health, National Heart, Lung,
and Blood Institute. (2003). Managing Asthma: A Guide for Schools (NIH Publication No. 02-2650).
Retrieved from http://www.nhlbi.nih.gov/health/prof/lung/asthma/asth_sch.pdf
(7) Ethiopian Names
For Ethiopian authors, use their names as close to the original as possible in all publications. Ethiopian
name (Eg Mesfin Tolosa) should be treated as non-Ethiopian in the text section (e.g. Mesfin, 2010)
but treated according to their national usage Ethiopian names in the Reference list (e.g. Mesfin
Tolosa)
Do not look for a “family” or “surname” in Ethiopian names, as there are none.
E.g. Tewolde-Berhan Gebre-Egziabher, or Ayele Negash
4.3. Tables and Figures Tables: should be kept to a minimum and be designed to be as simple as possible. Tables are to be typed double-spaced throughout, including headings and footnotes. Each table should be on a separate page, numbered consecutively in Arabic numerals and supplied with a heading and a legend. Tables should be self-explanatory without reference to the text. The details of the methods used in the experiments should preferably be described in the legend instead of in the text. The same data should not be presented in both table and graph form or repeated in the text. Figure legends: should be typed in numerical order on a separate sheet. Graphics should be prepared using applications capable of generating high resolution GIF, TIFF, JPEG or Power point before pasting in the Microsoft Word manuscript file. Use Arabic numerals to designate figures and upper case letters for their parts (Figure 1). Begin each legend with a title and include sufficient description so that the figure is understandable without reading the text of the manuscript. Information given in legends should not be repeated in the text.

58
5. Review Articles Submissions of reviews and perspectives covering topics of current interest are welcomed and encouraged. Reviews should be concise and no longer than 4 to 6 printed pages (about 12 to 18 manuscript pages). Reviews are also peer-reviewed. 6. Short Communications A Short Communication is suitable for recording the results of complete small investigations or giving details of new models or hypotheses, innovative methods, techniques or apparatus. The style of main sections needs to conform to that of full-length papers. Short communications are 2 to 4 printed pages (about 6 to 12 manuscript pages-double spaced) in length. 7. Case reports Case reports should contain Introduction, Case history, and Results and discussion sections. The introduction should indicate the interest of the case for practitioners, the case history should describe the case and the procedures in detail, and the results and discussion section should outline the results with a pertinent discussion and envisaged differential diagnosis. Results and discussion should not be divided into two separate headings. Photographs are desirable. Case reports should be no longer than 5 pages, should have an abstract of 100 words at most, and are limited to 15 references 8. Submission of Manuscript Electronic submission of manuscripts is strongly encouraged, provided that the text, tables, and figures are included in a single Microsoft Word file (preferably in Times New Roman font). Submit manuscripts as e-mail attachment to the Editorial Office at: [email protected]. A manuscript number will be mailed to the corresponding author same day or within 48 hours. 9. Publication fee: There is no publication fee 10 Proofs and Reprints: Electronic proofs will be sent (e-mail attachment) to the corresponding author as a PDF file. Page proofs are considered to be the final version of the manuscript. With the exception of typographical or minor clerical errors, no changes will be made in the manuscript at the proof stage. Because EAJVAS will be published freely online to attract a wide audience, authors will have free electronic access to the full text (in PDF) of the article. Authors can freely download the PDF file from which they can print unlimited copies of their articles.
Copyright and Permissions
By submitting a manuscript to the editor or publisher you are deemed to have granted permission to publish the manuscript.
11. Proofs
Proofs will be sent via e-mail as an Acrobat PDF (Portable Document Format) file. Acrobat Reader will be required in order to read the PDF. This software can be downloaded from the following website:
http://www.adobe.com/products/acrobat/readstep2.html
This will enable the file to be opened, read on screen and printed out in order for any corrections to be added.

59
Note: The Journal “East African Journal of Veterinary and Animal Sciences” should be abbreviated as “East Afr J Vet Ani Sci” whenever necessary.

60

East African Journal of Veterinary and Animal Sciences
(EAJVAS)
Volume 1, No. 1, 2017
Research Articles
Fethu Lemma, Sisay Alemu, and Sisay Haile
Prevalence of Bovine Trypanosomosis in Abeshige District of Gurage Zone, South Western
Ethiopia
1
Agari Feyisa, Anwar Hassen, Nateneal Tamerat, and Ashebr Abrha
Isolation and Identification of Streptococcus Uberis in Lactating Cows of Haramaya University
Dairy Farm
7
Walkite Furgasa, Negesse Mekonnen, and Anwar Hassen
Detection of Anthelmintic Resistance in Gastrointestinal Nematodes of Small Ruminants
in Haramaya University Farms
13
Mengistu Urge, Kassa Shawle, Getachew Animut, Tesfaheywet Zeryehun, and
Meskerem Adamu
Protective Efficacy of Lepidium sativum, Capsicum frutescens and their Mixtures against
Experimentally Induced Eimeria tenella Infection in Broiler Chickens
19
Efrem Gebrehawariat, Getachew Animut, Mengistu Urge, and Yoseph Mekasha
Husbandry Practices, Farmers’ Perception and Constraints of Pig Farming in Bishoftu and
Holeta Areas, Central Ethiopia
31
Jelalu Kemal, Mathewos Israel, and Sisay Alemu
Prevalence and Species of Ticks on Cattle in Borecha District, Southern Ethiopia
41
Sisay Alemu, Fethu Lemma, Jelalu Kemal, Ashebr Abraha, and Tahir Adem
Prevalence and Characterization of Hydatid Cyst in Cattle at Halaba Kulitto Municipal
Abattoir, South Ethiopia
47