editor - shanlaxjournals.in · a yasotha, t sivakumar, thanga tamil vanan, m.sundara vinayaki &...
TRANSCRIPT

SHANLAX INTERNATIONAL JOURNAL OF COMMERCE
(A Peer-Reviewed-Refereed/Scholarly Quarterly Journal with Impact Factor)
Vol. 5 Special Issue 3 August, 2017 Impact Factor: 3.017
ISSN: 2320-4168 UGC Approval No: 44120
International Conference on
INDIA 2030
DEPARTMENT OF COMMERCE
Editor
Dr.B.Revathy Professor & Head, Department of Commerce
Manonmaniam Sundaranar University Tirunelveli
September 1st & 2
nd 2017
MANONMANIAM SUNDARANAR UNIVERSITY
Accredited with ‘B’ grade by NAAC
Tirunelveli – 627 012, Tamil Nadu, India


MANONMANIAM SUNDARANAR UNIVERSITY
Accredited with ‘B’ grade by NAAC
Tirunelveli – 627 012, Tamil Nadu, India
Prof. Dr.K.Baskar
Vice-Chancellor
MESSAGE
I am very happy that the Department of Commerce, Manonmaniam Sundaranar
University is organizing an International Conference on “India 2030”.
The vision of India’s future should be both comprehensive and harmonious. It must
encompass all the aspects that constitute the life of the country and its people. It must
balance and synthesize all the divergent views and forces that compete in the pursuit of
self-fulfilment. It must be based on an objective assessment of facts and a realistic
appraisal of possibilities, yet it must rise beyond the limitations of past trends,
immediate preoccupations and pressing challenges to perceive the emerging
opportunities and concealed potentials.
Importantly, the vision of India’s future should serve to awaken in all of us a greater
awareness of our cultural and spiritual strengths - which form the bedrock of our past
achievements and should form the foundation of our future accomplishments. Some of
our traditions must change, but knowledge, in essence, is India`s greatest endowment.
I believe that this conference would create a platform for the participants to enrich
knowledge on India 2030.
Prof. Dr.K.Baskar
Vice- Chancellor


PREFACE
India is well poised to become the third-largest economy by 2030, surpassing four developed
nations Japan, Germany, Britain and France, according to projections by a US government agency.
The estimate by the United States Department for Agriculture Economic Research Service (USDA), based
on data collated by World Bank and IMF, assumes the Indian economy will expand annually at an
average 7.4% to $6.84 trillion by 2030. This will make it bigger than that of the economies of Japan
($6.37 trillion) and Germany ($4.38 trillion). What’s more, India’s annual economic output will be almost
double that of Britain ($3.6 trillion) and France ($3.44 trillion) in the next 15 years. International
Monetary Fund’s Managing Director Christine Lagarde, who has repeatedly coined India as a “bright
spot”, has forecast that the Asia’s third largest will surpass Germany by 2030.
By 2030, India’s GDP in terms of purchasing power parity (PPP) will grow to $30 trillion from $8.7
trillion in 2016, while US will grow from $18.6 trillion to $28.3 trillion. The recent macroeconomic
projections for 2030 by the US Department of Agriculture portends well for India. In the next 15 years,
India is believed to rise up the rankings and for the first time, enter the top three to become the third
largest economy in the world. The statistics by the US Department of Agriculture will be good news for
the Narendra Modi-led government which was voted to power last year on the promise of strengthening
the flailing Indian economy and providing the much-needed reforms to boost growth. Reduced global oil
prices and renewed investor confidence have put India on the growth roadmap and helped it to become
one of the fastest growing developing economies.
“Within the next 15 years, India will have the largest, and among the youngest, workforces in the
world, and will need to create jobs for the roughly one hundred million young Indians who will enter the
job market in the coming decade. India’s fast growing young population is perceived to boost economic
activity and help the nation outpace ageing developed nations.
I am ever indebted and extremely grateful to our Honourable Vice Chancellor Prof.Dr.K.Baskar for all
his support and motivations in our academic pursuits. I thank our Registrar Dr.A.John De Britto for his
encouragements. My heartfelt thanks are due to my colleagues. I express my deepest sense of gratitude
to my beloved scholars & students of the department. I earnestly thank Shanlax Publications, Madurai
who gave a shape to this journal. Last but not the least I thank the ALMIGHTY for his blessings in all my
endeavors.
Editor
Dr. B. Revathy
Professor & Head, Department of Commerce
Manonmaniam Sundaranar University,
Tirunelveli-627 012


CONTENTS
S. No
Title Page.
No 1 A Study on the Challenges and Problems of Entrepreneurs in Small Scale Industries in
Tirunelveli District
Dr. S. Makesh Kumar
01
2 A Study on Awareness about Various Women Entrepreneurial Schemes Offered by
Central and State Government
Dr. R. Krishnaveni
08
3 A Study on Motivating Factors of Women Entrepreneurship Development in
Tirunelveli District
N.Sankara Nayagam & Dr.B.Revathy
13
4 Role of Women Empowerment through Microfinance – A Study with Special Reference
to Self Help Groups in Tirunelveli
Dr.S.Muthulakshmi
19
5 Role of Microfinance in Empowering Rural Women Entrepreneurs at Tirunelveli Taluk
Dr.N.Sankara Gomathi
24
6 Role of Self Help Groups in Women Empowerment in Manur Block
S. Pitchammal
30
7 Inter-District Disparity in Industrial Development of Tamilnadu
Dr. P. Muthumurugan & G.Elumalai
36
8 A Method of Studying the Oocyte Collection to Improve the Prolificacy of Caprine
Dr. M. Sundara Vinayaki
40
9 A Study on Impact of Foreign Direct Investment on Retail Sector in
Tirunelveli District
Dr. A. Mahalingam
42
10 Agriculture Transformation in India
S. Parasuraman & Dr. N. Sathiya
49
11 A Study on Marketing of Timber in Tirunelveli District
Dr.P. Nayagam
54
12 Income and Expenditure Pattern of Fisherfolk in Selected Coastal Villages of
Thoothukudi District in Tamilnadu
P.Vinoth & B. Revathy
61
13 Sustainability of Silvipasture System in Dry Land Ecosystem of Western Zone of Tamil
Nadu: A Survey
V.S. Mynavathia & C. Jayanthi
67
14 Job Dimensions of College Teachers
Dr.B.Revathy & Mr.M.Subramanian
71
15 A Study on Consumer Behavioural Attitude towards Online Shopping
Ms. K. Kanimozhi & Dr. B. Revathy
77
16 Foreign Direct Investment on Retail Sector with Specific Reference to Supermarkets in
Tamilnadu
Dr.S.Mahadevi
87
17 The Efficient Railway Signal Management System based on ZigBee Wireless
Communication
V.Vivek & D.Murugan
92

18 A Study on Performance and Effective Function of Rubber Board in Kanyakumari
District
B. Felix Francy & Dr. B. Revathy
100
19 A Study on Women Owned Micro Enterprises and Problems of Micro Women
Entrepreneurs in Tirunelveli District
Dr. R Santhi Salomi
104
20 Impact on Social Media Marketing in Advertising
M.Nithya
110
21 Analysis of Job Satisfaction of the Worker of Salt Pan in Tuticorin District
S.Muthu Raj
114
22 Women Status in Rural India with Swot Analysis
Dr.N. Suthendren
118
23 Study of Relationship between Emotional Intelligence and Work Attitude among
Women Employees in Private Sector
Dr. C. Geetha
123
24 Corporate Social Responsibility in Stress Management Policy in ITC Limited-Chennai
R.Thanga Selvi
127
25 A Study of First Generation Entrepreneurs in Small Scale Industry in
Tirunelveli District
Dr. A. Arul Kamalraj
134
26 Service Quality of Banking Industry in India 2030
Dr.P.Jeyasri & M.Sorna Priya
140
27 Entrepreneurial Ability and Traits among M.B.A Graduates in Kanyakumari District –
An Analytical Study
Dr. R. Siva Sankar
145
28 A Study of Consumer Behaviour Related to Quibell and Other Brands
Mr. E. Perumal & Mr. S. Sankar Gobinath
150
29 Digital India Opportunities and Challenges
Mrs.P.Suganya
155
30 An Econometric Analysis of Impact of Foreign Direct Investment and Foreign
Institutional Investment in Indian Economy
Dr. S. Henry Pandian & V. Arockia Amuthan
162
31 An Econometric Analysis of Visions of Rural Development Schemes in India
Dr. M. Dhinakaran & V. Arockia Amuthan
167
32 Role of District Industries Centre in Entrepreneurship Development in Kanyakumari
District
F.Eframe Sophia Selvam & Dr.T.M. Padmanabhan
173
33 Leveraging Via Consumers – An Emerging Trend Towards India 2030
Dr.J.Mahil Kamalam
181
34 “A Comparative Study on Women Entrepreneurship Attitude among Urban and Rural
in Kovilpatti”
Dr.P.K.Ajit
185
35 A Study of the Impact of Bank Lending to Weaker Sections of the Society at Udangudi
Block in Thoothukkudi District – An Empirical Study
Dr. J. Leelavathy Packiathai
195
36 Broiler Rabbit Farming – A Profitable Enterprise for Improving the Livelihood of Rural
Farmers
Pasupathi, Karu Purushothaman, M.R & H. Gopi
200
37 A Study on Opportunities and Challenges of Women Entreprenuers in Tirunelveli Area
V. Sree Mahalakshmi
202

38 A Study on Empowerment of Women through Mahatma Gandhi National Rural
Employment Guarantee Programme (Mgnrega)
B.G.Kohila & Dr. R. Mabel Sulochana
207
39 Socio-Economic Status of Dairy Farmers in the Industrial Areas of Vellore District –
Tamil Nadu, India
A Yasotha, T Sivakumar, Thanga Tamil Vanan, M.Sundara Vinayaki & S.Saraswathi
211
40 A Study on Credit Appraisal System of Sakthi Finance Limited, Coimbatore with Special
Reference to Commercial Vehicles
Mr. S. Sivakumar & Mrs. R. Soniya
215
41 A Study on Consumer Behaviours Towards Jewels Buyers in Kanyakumari District
G.Baby Alex & Dr.B.Revathy
220
42 Work- Life Balance among Textile Retail Employees in Tirunelveli District, Tamil Nadu
Dr.P.Jegatheeswari & Ms.M.Padma
224
43 Influence of Green Marketing Mix on Green Products Purchase Intention of Consumer:
A Mediation Effect of Consumers’ Environmental Concern Attitude
S.Shahul Hameed & M.Veeralakshmi
230
44 A Study on Rural Women Empowerment through Self Help Groups with Special
Reference to Suthamalli Area in Tirunelveli District
Dr. K. Viswa Sarojini Devi
235
45 A Study on the Problems and Prospects of Women Entrepreneurs
in the Perumbavoor Municipality of Ernakulam District
Ancy Jose & Mary Trazy Karen
241
46 Production and Marketing of Lemon in Tirunelveli District of Tamilnadu State
Dr.G. Chithiraikani
248


International Conference on INDIA 2030
1 Manonmaniam Sundaranar University, Tirunelveli
A STUDY ON THE CHALLENGES AND PROBLEMS OF ENTREPRENEURS
IN SMALL SCALE INDUSTRIES IN TIRUNELVELI DISTRICT
Dr. S. Makesh Kumar M.Com., M.Phil., M.B.A., Ph.D.,
Head, Department of BBA, Sri Sankara Bhagavathi Arts and Science College, Kommadikottai
Abstract Entrepreneurs are playing an important role in the economic development of underdeveloped countries. Entrepreneurs’ skills and knowledge, their talents and abilities in business and a compelling desire of wanting to do something positive are some of the reasons for the entrepreneurs to organize small scale industries. The main objectives of the study are to study the challenges faced by the entrepreneurs of small scale industries and the problems faced by the entrepreneurs of small scale industries in Tirunelveli District. The present study focuses on the entrepreneurs of small scale industries. The scope of the study encompasses the problems faced by entrepreneurs who are engaged in small scale industry. The research design adopted for the study is descriptive and exploratory in nature. The study depends mainly on the primary data collected through a well – framed interview schedule to elicit the well considered opinions of the respondents. Simple random sampling method was adopted to obtain responses from the respondents of small scale industries. Thus, the researcher has selected the sample respondents for the study by 300 entrepreneurs from small scale industries. Hence, the data were collected from 300 entrepreneurs of small scale industries in Tirunelveli District. The present study will help the planners and the decision makers who are involved in the development of entrepreneurs in small scale industries to review the existing policies and to make suitable suggestions to amend the provisions of the Act which governs the small scale industries. Keywords: Entrepreneurs, Small Scale Industries and Economic Development Introduction
Entrepreneurship is necessary to initiate the process of economic development of both
developed and developing countries as it is the back bone of economy of any country.
Entrepreneurship refers to combining the available resources of production in such a new way that
it produces the goods and services more satisfactory to the customers. Entrepreneur is a catalytic
agent of change. It is also instrumental in sustaining the process of economic development. Every
country tries to achieve economic development for prosperity and better life standard of its people.
Development has economic, social and political dimensions and is incomplete without the
development of women who constitute about 50 per cent of total population. So, contribution of
women is essential in economic activities for healthy nation building.
Objectives of the Study
The present study has been carried out with the following objectives.
1. To study the challenges faced by the entrepreneurs of small scale industries in Tirunelveli
District.
2. To identify the problems faced by the entrepreneurs of small scale industries in Tirunelveli
District.
3. To offer suitable suggestions based on the findings of the study.
Scope of the Study
The present study focuses on the entrepreneurs of small scale industries. The selected place
with its good infrastructural facility, offers sound prospects for industrial development. The scope
of the study encompasses the problems faced by entrepreneurs who are engaged in small scale
industry.

Vol. 5 Special Issue 3 August 2017 ISSN: 2320-4168
2 Shanlax International Journal of Commerce
Methodology
The research design adopted for the study is descriptive and exploratory in nature.
The methodology of study is based on the primary as well as secondary data. The study depends
mainly on the primary data collected through a well – framed interview schedule to elicit the well
considered opinions of the respondents. Simple random sampling method was adopted to obtain
responses from the respondents of small scale industries. Thus, the researcher has stratified the
sample respondents for the study by 300 entrepreneurs from small scale industries. Hence, the data
were collected from 300 entrepreneurs of small scale industries in Tirunelveli District. This study
employed both analytical and descriptive type of methodology. The study was conducted in two
stages, first with a preliminary pilot study followed by the main study. The secondary data were
collected from journals, magazines, reports, publications, books, dailies, periodicals, articles,
research papers, websites, books, bulletins, manuals and booklets.
Limitations of the Study
(i) The present study is mainly focused in Tirunelveli District.
(ii) It is not possible to study the entire universe due to lack of time and resources. So, the study is
based only on the information obtained from 300 respondents from small scale industries.
(iii) As the findings and conclusions of this study are based on data collected from the selected
entrepreneurs in the study area, it cannot be generalized for the entire nation.
Analysis and Interpretation
Table 1 Generation of Entrepreneurs
Source: Survey Data
The above table exhibits
that 51.3 per cent of
entrepreneurs belong to third
generation with respect to
their enterprises. Nearly 28.7
per cent of them belong to
second generation and only 20.0 per cent belong to first generation in this regard. It is inferred that
an overwhelming majority (80.0 per cent) belonging to the second and third generation, got
exposed to their family business right from their childhood. They support their parents and family
members in sustaining their enterprises.
Table 2 Entrepreneurs Investment
Source: Survey Data The above table shows that
35.0 per cent of entrepreneurs
have invested below Rs.2 lakhs
and 28.3 per cent have invested
between Rs.4-6 lakhs, 24.7 per
cent have invested between Rs.2-4
lakhs. Only 12.0 per cent of
entrepreneurs have invested
above Rs.6 lakhs. From the study, it is inferred that 35.0 per cent of entrepreneurs have invested
below Rs.2 lakhs.
Sl. No Generation No. of Entrepreneurs Percentage
1. First generation 60 20.0
2. Second generation 86 28.7
3. Third generation 154 51.3
Total 300 100
Sl. No Amount of
Investment (in Rs.) No. of
Entrepreneurs Percentage
1. Below 2 lakhs 105 35.0
2. 2-4 lakhs 74 24.7
3. 4-6 lakhs 85 28.3
4. Above 6 lakhs 36 12.0
Total 300 100

International Conference on INDIA 2030
3 Manonmaniam Sundaranar University, Tirunelveli
Table 3 Amount of Borrowing
Source: Survey Data
The above table discloses that
24.0 per cent of entrepreneurs
borrowed below Rs.50,000, 23.7 per
cent above Rs 2 lakhs, 20.7 per cent
between Rs.50,000 and 1 lakh: 17.3
per cent borrowed between Rs 1 lakh
and Rs.1.5 lakhs. From the study, it is
inferred that higher working capital
is needed for the small scale industries.
Table 4 Procurement Problems of Entrepreneurs
Source: Survey Data
It is inferred from the above
table that 47.3 per cent of
entrepreneurs failed due to
financial problems in acquiring raw
materials,
3.3 per cent pointed out the legal
problems in getting raw materials.
Such problems were faced by the entrepreneurs when they purchased raw materials from outside
the state, 20.0 per cent of entrepreneurs faced the problems of shortage of raw materials. Increasing
price of raw materials affected 26.7 per cent of the entrepreneurs, and only 2.7 per cent of
entrepreneurs had other problems regarding procurement of raw materials.
Table 5 Method of Marketing of Entrepreneurs Source: Survey Data
The above table reveals that
a majority (52.0 per cent) of
entrepreneurs market their
products through retail agents,
25.7 per cent of entrepreneurs
through wholesalers and 22.3
per cent of entrepreneurs have chosen direct selling and order based selling as their method of
marketing.
Table 6 Challenges Faced by Entrepreneurs Source: Primary data
It is clear from the Table
6 that a majority of
entrepreneurs have given
the first rank to knowledge
challenges. The table
exhibits that the sample
entrepreneurs have given
second rank to social
challenges. The table further
shows that the sample
entrepreneurs have given
Sl. No Amount of Borrowing
(in Rs.) No. of
Entrepreneurs Percentage
1. Below Rs.50,000 72 24.0 2. Rs.50,000-1,00,000 62 20.7 3. Rs.1,00,000-1,50,000 52 17.3 4. Rs.1,50,000-2,00,000 43 14.3 5. Above Rs.2,00,000 71 23.7
Total 300 100
Sl. No Nature of Problem No. of
Entrepreneurs Percentage
1. Financial problems 142 47.3 2. Legal Problems 10 3.3 3. Scarcity of raw materials 60 20.0 4. Increasing price 80 26.7 5. Other problems `8 2.7
Total 300 100
Sl. No Method of Marketing No. of
Entrepreneurs Percentage
1. Through direct sales 67 22.3 2. Through retail agents 156 52.0 3. Through wholesalers 77 25.7 Total 300 100
Sl. No Challenges Total Score Average Score Rank 1. Personal challenges 9672 32.24 XI 2. Social challenges 19674 65.58 II 3. Financial challenges 18690 62.30 III 4. Marketing challenges 15960 53.20 VII 5. Managerial challenges 15426 51.42 VIII 6. Technological challenges 14922 49.74 IX 7. Competition challenges 17457 58.19 IV 8. Mobility challenges 13896 46.32 X 9. Educational challenges 16080 53.60 VI 10. Accounting challenges 16686 55.62 V 11. Knowledge challenges 20184 67.28 I

Vol. 5 Special Issue 3 August 2017 ISSN: 2320-4168
4 Shanlax International Journal of Commerce
the third rank to financial challenges. It is further clear from the table that the sample
entrepreneurs have given the last rank to personal challenges.
General Problems faced by entrepreneurs of different age groups
In order to find out the significant difference in general problems among the entrepreneurs of
different age groups, analysis of variance (ANOVA) was attempted with the null hypothesis as,
“There is no significant difference in general problems among the entrepreneurs of different age
groups”. The results of ANOVA are given in Table 7.
Table 7 General Problems faced by entrepreneurs of different age groups
General Problems Age Sum of Squares df Mean Square F p Value Land Between Groups 10.454 3 3.485 2.728 .044
Within Groups 378.093 296 1.277 Total 388.547 299
Workers Between Groups 13.256 3 4.419 3.006 .031 Within Groups 435.074 296 1.470 Total 448.330 299
Finance Between Groups 103.578 3 34.526 19.471 .000 Within Groups 524.858 296 1.773 Total 628.437 299
Management Between Groups 110.858 3 36.953 16.855 .000 Within Groups 648.938 296 2.192 Total 759.797 299
Raw materials Between Groups 113.058 3 37.686 23.660 .000 Within Groups 471.462 296 1.593 Total 584.520 299
Standard of the product Between Groups 44.678 3 14.893 10.409 .000 Within Groups 423.509 296 1.431 Total 468.187 299
Grants/Subsidy Between Groups 86.356 3 28.785 21.692 .000 Within Groups 392.791 296 1.327 Total 479.147 299
Source: Computed data
Table 7 shows the results of ANOVA based on general problems faced by entrepreneurs. Since
the respective ‘p’ value of general problems faced by different age group of entrepreneurs with
reference to land, workers, finance, management, raw materials, standard of the product and
grants/subsidy are less than 0.05 the null hypothesis is rejected. Therefore it may be concluded that
age wise, there is a significant difference in general problems relating to land, workers, finance,
management, raw materials, standard of the product and grants/subsidy.
General Problems faced by entrepreneurs of different levels of education
In order to find out the significant difference in general problems among entrepreneurs of
different levels of education, analysis of variance (ANOVA) was attempted with the null hypothesis
as, “There is no significant difference in general problems among entrepreneurs of different levels
of education”. The result of ANOVA is given in Table 8.

International Conference on INDIA 2030
5 Manonmaniam Sundaranar University, Tirunelveli
Table 8 General Problems faced by entrepreneurs of different levels of education
General Problems Level of education Sum of Squares df Mean Square F p Value Land Between Groups 17.392 3 5.797 4.623 .004
Within Groups 371.155 296 1.254 Total 388.547 299
Workers Between Groups 46.224 3 15.408 11.342 .000 Within Groups 402.106 296 1.358 Total 448.330 299
Finance Between Groups 137.283 3 45.761 27.578 .000 Within Groups 491.154 296 1.659 Total 628.437 299
Management Between Groups 102.559 3 34.186 15.397 .000 Within Groups 657.237 296 2.220 Total 759.797 299
Raw materials Between Groups 177.952 3 59.317 43.186 .000 Within Groups 406.568 296 1.374 Total 584.520 299
Standard of the product Between Groups 67.742 3 22.581 16.691 .000 Within Groups 400.445 296 1.353 Total 468.187 299
Grants/Subsidy Between Groups 147.517 3 49.172 43.890 .000 Within Groups 331.629 296 1.120 Total 479.147 299
Source: Computed data
Table 8 shows the results of ANOVA based on general problems faced by them. Since the ‘p’
value of all the general problems faced by them is less than 0.05, the null hypothesis is rejected.
Therefore it may be concluded that level of education wise there is a significant difference in
general problems relating to land, workers, finance, management, raw materials, standard of the
product and grants/subsidy.
Financial Problems faced by entrepreneurs of different age groups
Entrepreneurs of different age groups face financial problems at different levels, while the
entrepreneurs of young ages face financial problems at a higher level, the entrepreneurs of old ages
face financial problems at a lower level. Hence the age has relationship with financial problems.
In order to find out the significant difference in financial problems among the entrepreneurs of
different age groups, analysis of variance (ANOVA) was attempted with the null hypothesis as,
“There is no significant difference in financial problems among the entrepreneurs of different age
groups”. The results of ANOVA are given in Table 9.
Table 9 Financial Problems faced by entrepreneurs of different age groups
Financial Problems Age Sum of
Squares df
Mean Square
F p
Value Not available in appropriate time
Between Groups
53.424 3 17.808 9.428 .000
Within Groups
559.096 296 1.889
Total 612.520 299 High rate of interest is charged
Between Groups
28.872 3 9.624 5.011 .002
Within Groups
568.475 296 1.921
Total 597.347 299

Vol. 5 Special Issue 3 August 2017 ISSN: 2320-4168
6 Shanlax International Journal of Commerce
Penal interest is charged Between Groups
50.212 3 16.737 10.944 .000
Within Groups
452.704 296 1.529
Total 502.917 299 Mode of payment is not convenient
Between Groups
70.552 3 23.517 13.335 .000
Within Groups
522.018 296 1.764
Total 592.570 299 Source: Computed data
Table 9 shows the results of ANOVA based on financial problems faced by entrepreneurs of
different age groups. Since the respective ‘p’ value of financial problems faced by them are less than
0.05 the null hypothesis is rejected. Therefore it may be concluded that age wise there is a
significant difference in financial problems.
Financial Problems faced by entrepreneurs of different levels of education
Entrepreneurs of different levels of education face financial problems at different levels. While
the entrepreneurs of school level education face financial problems at a higher level, the
entrepreneurs of college level education face financial problems at a lower level. Hence the level of
education has relationship with financial problems. In order to find out the significant difference in
financial problems among the entrepreneurs of different levels of education, analysis of variance
(ANOVA) was attempted with the null hypothesis as, “There is no significant difference in financial
problems among entrepreneurs of different levels of education”. The results of ANOVA are given in
table 10.
Table 10 Financial Problems faced by entrepreneurs of different levels of education
Financial Problems Level of
education Sum of
Squares df
Mean Square
F p
Value Not available in appropriate
time
Between Groups 46.319 3 15.440 8.072 .000
Within Groups 566.201 296 1.913
Total 612.520 299
High rate of interest is
charged
Between Groups 46.120 3 15.373 8.255 .000
Within Groups 551.226 296 1.862
Total 597.347 299
Penal interest is charged Between Groups 118.394 3 39.465 30.379 .000
Within Groups 384.523 296 1.299
Total 502.917 299
Mode of payment is not
convenient
Between Groups 36.633 3 12.211 6.502 .000
Within Groups 555.937 296 1.878
Total 592.570 299
Source: Computed data
Table 10 shows the results of ANOVA based on financial problems faced by entrepreneurs of
different levels of education. Since the respective ‘p’ value of financial problems faced by different
levels of education of entrepreneurs such as not available in appropriate time, high rate of interest
is charged, penal interest is charged and mode of payment is not convenient are less than 0.05 the
null hypothesis is rejected. Therefore it may be concluded that level of education wise there is a
significant difference in financial problems selected for the study.

International Conference on INDIA 2030
7 Manonmaniam Sundaranar University, Tirunelveli
Suggestions
Based on the findings of the study and the problems identified, the following measures are
suggested by the researcher.
Finance is considered as a lubricant for setting up and running an industry. Funds therefore,
need to be made available on time at soft terms and conditions to those who really need it.
Finance is the first major problem for the entrepreneurs of small scale industry. Hence, the
government can provide interest free loans to encourage entrepreneurs of small scale industry.
To attract more entrepreneurs of small scale industry, the subsidy for loans should be
increased.
Raw material is a must for any industry. However, the non-availability of raw materials
accompanied by their prohibitive cost have weakened the viability of the small scale industry.
Past experience bears evidence that small scale industries with employment potential cannot be
sustained for long unless a strong raw material-base is created in rural areas itself. Therefore,
an urgent policy is called for to strengthen the raw material base in small scale industries.
Sometimes the real problem in setting up small scale industries is not the non-availability of
facilities, but non-awareness of facilities available. The need is, therefore, to disseminate
information about what is available to provide to the entrepreneurs to facilitate them in setting
up small scale industries.
Conclusion
The development of the small scale industry depends on the efficiency of entrepreneurs.
The small scale industries are considered as ideal nurseries for the rapid growth and development
of entrepreneurs. The need of the hour is the growth of entrepreneurs in the country to accelerate
the process of economic growth. From the point of view of long-term perspective, however, the
capacity of small scale industries to become economically viable, technically progressive and
efficient and to develop competitive strength shall be the only justification for their continuance.
The present study will help the planners and the decision makers who are involved in the
development of entrepreneurs in small scale industries to review the existing policies and to make
suitable suggestions to amend the provisions of the Act which governs the small scale industries.
References
1. Poornima M. Charantimath, Entrepreneurship Development and Small Business Enterprises,
Pearson Publication, New Delhi, 2008.
2. Vasanth Desai, Small Scale Industries and Entrepreneurship, Himalaya Publishing House,
Mumbai, 2008.
3. Aruna, “Problems Faced by Micro, Small and Medium Enterprises – A Special Reference to Small
Entrepreneurs in Visakhapatnam”, IOSR Journal of Business and Management (IOSR-JBM),
Volume 17, Issue 4, Ver. V, Apr. 2015.

Vol. 5 Special Issue 3 August 2017 ISSN: 2320-4168
8 Shanlax International Journal of Commerce
A STUDY ON AWARENESS ABOUT VARIOUS WOMEN ENTREPRENEURIAL
SCHEMES OFFERED BY CENTRAL AND STATE GOVERNMENT
Dr. R. Krishnaveni
Head & Assistant Professor, Department of commerce, Infant Jesus College of Arts and Science for Women, Mulagumoodu
Abstract In this dynamic world, women entrepreneurs are a significant part of the global expedition for sustained economic development and social progress. Due to growing industrialization, urbanization, social legislation and along with the spread of higher education and awareness, the emergence of women owned businesses are highly increasing in the economies of almost all countries. Entrepreneurship emerges from an individual’s creative spirit into long-term business ownership, job creation, and economic security. Women bring commitment and integrity because they care about economic empowerment, entrepreneurial development and innovation. Women’s skills, knowledge, their talents and abilities in business and a compelling desire of wanting to do something positive are some of the reasons for the women entrepreneurs to organize industries. The government has realized the importance of women entrepreneurship. As a result, offers a variety of programmes for women entrepreneurs. Promotion of women entrepreneurship ensures economic independence. Social emancipation of women gains social status. It makes women conscious of their rights and gains equal status. Effective steps are needed to provide entrepreneurial awareness, orientation and skill development programs to women.
Introduction
Entrepreneurship is a typical global phenomenon attracting millions of economists, politicians,
and social workers. In developed countries, entrepreneurship has gained attention in the last
century. But in developing countries, it has been gained original consideration only in recent
decades. In this dynamic world, women entrepreneurs are a significant part of the global expedition
for sustained economic development and social progress. Due to growing industrialization,
urbanization, social legislation and along with the spread of higher education and awareness, the
emergence of women owned businesses are highly increasing in the economies of almost all
countries. Entrepreneurship emerges from an individual’s creative spirit into long-term business
ownership, job creation, and economic security. Women bring commitment and integrity because
they care about economic empowerment, entrepreneurial development and innovation. The hidden
entrepreneurial potentials of women have gradually been changing with the growing sensitivity to
the role and economic status in the society. So this study concentrates on Women entrepreneurs
necessary to know about various schemes offered by central and state government.
Statement of the Problem
Entrepreneurship is one of the important factors of industrialization; in the absence of
entrepreneurship, industrialization cannot take place. Entrepreneurs are playing an important role
in the economic development of underdeveloped country. Women’s skills, knowledge, their talents
and abilities in business and a compelling desire of wanting to do something positive are some of
the reasons for the women entrepreneurs to organize industries. The government has realized the
importance of women entrepreneurship. As a result, offers a variety of programmes for women
entrepreneurs. As compared to men, women are less motivated to start business units due to many
reasons. Thus, the study aims to understand the awareness about various schemes offered by the
government.
Objectives of the Study
To study the socio- economic background of the women entrepreneurs in Kanniyakumari
District.

International Conference on INDIA 2030
9 Manonmaniam Sundaranar University, Tirunelveli
To know the awareness level about the various entrepreneurial training programs of state and
central government.
Sampling Method
The investigator has
used simple random
sampling method for
selecting the samples. 50
sample respondents were
selected from Kanyakumari
district for the study.
Tools for Analysis
Based on the nature of
data and relevance of the
information required the
appropriate statistical tools
were used for analysis.
Percentage and Multiple
Regression Analysis were
used. The analyses were
made with the help of
Statistical Package for Social
Sciences.
Limitations of the Study
The study is restricted
only to a sample size of 50
women entrepreneurs in the
study area.
Some information was
not disclosed by women
entrepreneurs, has a
complete and thorough
study been not making.
Socio Economic conditions
of the respondents
Socio economic
conditions play a very
important role in
development of the women
entrepreneurs. The following
Table 1.1 clearly shows the
socio economic conditions of
the respondents.
Source: Primary data
Table 1.1 Socio Economic conditions of the respondents Age No. of respondents Percentage 18-30 08 16 30 -40 22 44 40-50 12 24 Above 50 08 16 Marital Status No. of respondents Percentage Unmarried 4 08 Married 39 78 Widow 5 10 Divorced / separated 2 04 Educational Qualification No. of respondents Percentage Illiterate 11 22 SSLC 9 18 Higher Secondary 18 36 Graduates 8 18 Post Graduate 4 8 Monthly income No. of respondents Percentage Below Rs. 5000 20 40 Rs.5000-10000 13 26 Rs.10000-15000 10 20 Rs.15000-20000 5 10 Above Rs.20000 2 4 Nature of Business No. of respondents Percentage Tailoring 9 18 Handicrafts 13 26 Beauty parlour 9 18 Pappad making 3 6 Computer Education/Tuition center 6 12 Coir making 10 20 Capital Investment No. of respondents Percentage Below Rs. 15000 5 10 Rs.15000-30000 15 30 Rs.30000-45000 20 40 Rs.45000-60000 3 6 Above Rs.60000 7 14 Sources of Inspiration No. of respondents Percentage Self interest 14 28 To do something constructive 10 18 Out of compulsion 8 20 Financial liberty 11 10 Advice by husband/friends/relatives 7 14 Experience No. of respondents Percentage Less than 3 years 24 48 3-6years 16 32 6-9 years 6 12 Above 9 years 4 8
Vol. 5 Special Issue 3 August 2017 ISSN: 2320-4168
10 Shanlax International Journal of Commerce
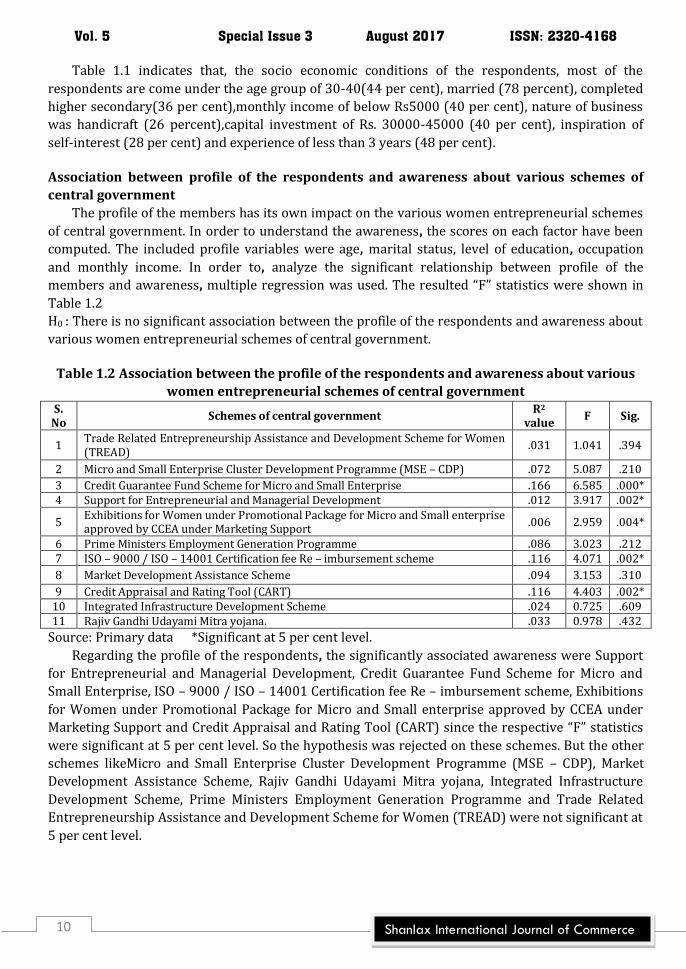
Table 1.1 indicates that, the socio economic conditions of the respondents, most of the
respondents are come under the age group of 30-40(44 per cent), married (78 percent), completed
higher secondary(36 per cent),monthly income of below Rs5000 (40 per cent), nature of business
was handicraft (26 percent),capital investment of Rs. 30000-45000 (40 per cent), inspiration of
self-interest (28 per cent) and experience of less than 3 years (48 per cent).
Association between profile of the respondents and awareness about various schemes of
central government
The profile of the members has its own impact on the various women entrepreneurial schemes
of central government. In order to understand the awareness, the scores on each factor have been
computed. The included profile variables were age, marital status, level of education, occupation
and monthly income. In order to, analyze the significant relationship between profile of the
members and awareness, multiple regression was used. The resulted “F” statistics were shown in
Table 1.2
H0 : There is no significant association between the profile of the respondents and awareness about
various women entrepreneurial schemes of central government.
Table 1.2 Association between the profile of the respondents and awareness about various
women entrepreneurial schemes of central government S.
No Schemes of central government
R2 value
F Sig.
1 Trade Related Entrepreneurship Assistance and Development Scheme for Women (TREAD)
.031 1.041 .394
2 Micro and Small Enterprise Cluster Development Programme (MSE – CDP) .072 5.087 .210
3 Credit Guarantee Fund Scheme for Micro and Small Enterprise .166 6.585 .000* 4 Support for Entrepreneurial and Managerial Development .012 3.917 .002*
5 Exhibitions for Women under Promotional Package for Micro and Small enterprise approved by CCEA under Marketing Support
.006 2.959 .004*
6 Prime Ministers Employment Generation Programme .086 3.023 .212 7 ISO – 9000 / ISO – 14001 Certification fee Re – imbursement scheme .116 4.071 .002*
8 Market Development Assistance Scheme .094 3.153 .310
9 Credit Appraisal and Rating Tool (CART) .116 4.403 .002* 10 Integrated Infrastructure Development Scheme .024 0.725 .609 11 Rajiv Gandhi Udayami Mitra yojana. .033 0.978 .432
Source: Primary data *Significant at 5 per cent level.
Regarding the profile of the respondents, the significantly associated awareness were Support
for Entrepreneurial and Managerial Development, Credit Guarantee Fund Scheme for Micro and
Small Enterprise, ISO – 9000 / ISO – 14001 Certification fee Re – imbursement scheme, Exhibitions
for Women under Promotional Package for Micro and Small enterprise approved by CCEA under
Marketing Support and Credit Appraisal and Rating Tool (CART) since the respective “F” statistics
were significant at 5 per cent level. So the hypothesis was rejected on these schemes. But the other
schemes likeMicro and Small Enterprise Cluster Development Programme (MSE – CDP), Market
Development Assistance Scheme, Rajiv Gandhi Udayami Mitra yojana, Integrated Infrastructure
Development Scheme, Prime Ministers Employment Generation Programme and Trade Related
Entrepreneurship Assistance and Development Scheme for Women (TREAD) were not significant at
5 per cent level.

International Conference on INDIA 2030
11 Manonmaniam Sundaranar University, Tirunelveli
Association between profile of the respondents and awareness about various schemes of
state government
The profile of the members has its own impact on the various women entrepreneurial schemes
of state government. In order to understand the awareness, the scores on each factor have been
computed. The included profile variables were age, marital status, level of education, occupation
and monthly income. In order to, analyze the significant relationship between profile of the
respondents and awareness, multiple regression was used. The resulted “F” statistics were shown
in Table 1.3
H0 : There is no significant association between the profile of the respondents andawareness about
various women entrepreneurial schemes of state government.
Table 1.3 Association between the profile of the respondents and awareness about various women entrepreneurial schemes of state government
S. No Schemes of state government R2 value F Sig.
1 Shree Shakthi Package for Women Entrepreneurs .127 0.434 .062
2 Anna Purna .159 4.161 .001*
3 Star Mahila Gold Loan Scheme .114 4.052 .002* 4 Can Mahila .283 3.192 .000* 5 Cent Kalyani .065 2.168 .064 6 KVB Mahila Swarna Loan .023 4.701 .002* 7 United Nari Samman Yojana .168 2.076 .072
Source: Primary data *Significant at 5 per cent level.
Table 1.3 shows that, Association between the profile variables and awareness of various state
government schemes. Regarding the profile of the respondents, the significantly associated
awareness were Anna Purna, Star Mahila Gold Loan Scheme, KVB Mahila Swarna Loanand Can
Mahilasince the respective “F” statistics were significant at 5 per cent level. So the hypothesis was
rejected on these schemes. But the other schemes likeShree Shakthi Package for Women
Entrepreneurs,Cent Kalyani, and United Nari Samman Yojana were not significant at 5 per cent
level.
Findings
1. Regarding the socio economic condition most of the respondents are come under the age group
of 30-40(44 per cent), married (78 percent), completed higher secondary (36 per cent),monthly
income of below Rs5000 (40 per cent), nature of business was handicraft (26 percent),capital
investment of Rs. 30000-45000 (40 per cent), inspiration of self-interest (28 per cent) and
experience of less than 3 years (48 per cent).
2. Multiple regression analysis was used to find out the association between the profile variables
and awareness of various central and state government schemes. The significantly associated
profile variables were age, level of education, occupation, marital status, and monthly income.
The significantly associated awareness about schemes were Support for Entrepreneurial and
Managerial Development, Credit Guarantee Fund Scheme for Micro and Small Enterprise, ISO –
9000 / ISO – 14001 Certification fee Re – imbursement scheme, Exhibitions for Women under
Promotional Package for Micro and Small enterprise approved by CCEA under Marketing
Support and Credit Appraisal and Rating Tool (CART), Anna Purna, Star Mahila Gold Loan
Scheme, KVB Mahila Swarna Loan and Can Mahila since the respective “F” statistics were
significant at 5 per cent level.

Vol. 5 Special Issue 3 August 2017 ISSN: 2320-4168
12 Shanlax International Journal of Commerce
Suggestions
1. Proper advertisement about central and state government schemes and technical education
should provide to the women entrepreneurs.
2. To open of women development cells and provide details about identification mechanism of
new enterprise, assistance in project formulation, follow up of training programmes, credit
facilities, financial incentive and subsidies.
Conclusion
Promotion of women entrepreneurship ensures economic independence. Social emancipation
of women gains social status. It makes women conscious of their rights and gains equal status. At
this juncture, effective steps are needed to provide entrepreneurial awareness, orientation and skill
development programs to women.The role of Women entrepreneur in economic development is
also being recognized and steps are being taken to promote women entrepreneurship. From these
suggestions it is quite visible that for development and promotion of women entrepreneurship, in
the region, there is a need for multi-dimensional approach from different sector, namely from the
government side, financial institutions, individual women entrepreneurs and many more, for a
flexible integrated and coordinated specific approach.

International Conference on INDIA 2030
13 Manonmaniam Sundaranar University, Tirunelveli
A STUDY ON MOTIVATING FACTORS OF WOMEN ENTREPRENEURSHIP DEVELOPMENT
IN TIRUNELVELI DISTRICT
N.Sankara Nayagam
Assistant Professor, Dept. of Commerce, Manonmaniam Sundaranar University College, Govindaperi
Dr.B.Revathy
Professor and Head, Department of Commerce, Manonmaniam Sundaranar University, Tirunelveli
Abstract Women Entrepreneurship is an important part of social and economic development of a country. Now women have realized their importance in the society and their participation in economic activities is also increasing. The present study aims to analyze the factors of various developments of women entrepreneurs in Small Scale Industries in the district. The results of the study would serve as a guide post for the development of the women entrepreneurs in Small Scale Industries in the area where the study has been undertaken. The present study has made an attempt to examine the degree of influence of factors leading to entrepreneurial motivation. The present study was based on both primary and secondary data. Well structured and pretested questionnaire was used for collecting primary data. The data were collected from 125 women entrepreneurs in Tirunelveli district by adopting convenience sampling method. It is concluded from the study that majority of the women entrepreneurs belong to the age group of 26 to 35 years because these age groups have no employment opportunities as well as they want to become entrepreneur. Most of the women entrepreneurs are married have been involved in the business, the reason is that they are willing to take risk in life, hence they become entrepreneur. The development of the industry depends on the efficiency of the women entrepreneur. Since the nature of entrepreneur and the financial, marketing and other problems that will restricts the development of the entrepreneurship, the researcher has carried out the present study. Keywords: Women entrepreneurs, Entrepreneurial motivation and Employment opportunities
Introduction
Women Entrepreneurship is an important part of social and economic development of a
country. Now women have realized their importance in the society and their participation in
economic activities is also increasing. Women empowerment is must for a modern developed
economy through women entrepreneurship. For ensuring empowerment of women, educational
attainment and economic participation are the key constituents. Women empowerment is the term
which has come to occupy an important position globally over the years. Various governments and
voluntary organizations or agencies carried out seminars, workshops and conferences to show the
value of women activities like arrangement of training for Women, technology development etc.
Right approach for women empowerment in developing economy will be entrepreneurship among
women which enhance their socio-economic status.
Statement of the Problem
Presently women entrepreneurs comprise of 10 per cent of the total entrepreneurs in India. It is
also clear that this percentage is growing every year. The role of women entrepreneurs helps to
solve the problems of unemployment and poverty. Development of women entrepreneurs is an
essential part of human resource development. Entrepreneurship amongst women has been a
recent concern. The development of women entrepreneurs is very low in India, especially in the
Tirunelveli District. Several government entrepreneurial programmes and schemes focus on
women in small scale Industries. Propounded by different departments and initiated at different
times, most of the schemes share a lot of common features. The Women Industries Programme

Vol. 5 Special Issue 3 August 2017 ISSN: 2320-4168
14 Shanlax International Journal of Commerce
(WIP) offers 50 per cent subsidy limited to Rs.25,000 for building construction and machinery for
the business under the small scale industries.
Although the significance of these factors is recognized, systematic studies on them do not exist,
partly due to the difficulties of conducting such studies and partly to the fact that policy conclusions
are not immediately obvious since the process of changing these factors will take time.
Nevertheless, given the fact that there is a large financial outlay on the part of the government
which has spent huge amounts on women development programmes, but with limited success, the
role of these factors in inhibiting women’s entrepreneurial growth demands serious enquiry,
particularly in Tirunelveli District with the advent of local level planning and proliferation of new
schemes modeled on the old pattern. In view of the above situation, the researcher decided to take
this study to identify the development of women entrepreneurs. The present study aims to analyze
the factors of various developments of women entrepreneurs in Small Scale Industries in the
district. The results of the study would serve as a guide post for the development of the women
entrepreneurs in Small Scale Industries in the area where the study has been undertaken.
Objectives of the Study
The study has the following objectives.
1. To analyze the personal profile of women entrepreneurs in Tirunelveli district.
2. To find out the motivating factors behind the women entrepreneurship.
3. To offer suitable suggestions based on the findings of the study.
Methodology
The present study was based on both primary and secondary data. Well structured and
pretested questionnaire was used for collecting primary data. The questionnaire was prepared by a
five-point Likert scale to collect the information required for the study after an in-depth review of
the previous studies related to the topic of the present study, discussions with the officials of the
District Industries Centre (DIC) and experienced women entrepreneurs in Small Scale Industries.
The data were collected from 125 women entrepreneurs in Tirunelveli district by adopting
convenience sampling method.
Limitations of the Study
1. The study covered only Tirunelveli district. Hence the findings and conclusions of the study are
entirely applicable to this district only and it may not hold good for other areas.
2. The study was based on the perceptions of the women entrepreneurs, whose attitudes may
change with the change of times. Therefore, the responses reflect only their contemporary
views on the prevailing conditions.
3. Present study covered only the women entrepreneurs engaged in manufacturing and service
sector under Small Scale Industries.
4. Data collection through interview schedule was a time consuming matter. The respondents
sometimes were found non-cooperative with the interviewer.
Analysis and Interpretation
Table 1 Age-wise Classification of the Respondents
Source: Primary Data
It is inferred from Table 1 that
out of 125 respondents, 20 (16%)
respondents are in the age group of
up to 25 years, 48 (38.4%) of them
belong to the age group of 26-35
years, 45 (36%) of them are in the
Sl. No Age No. of Respondents Percentage
to Total 1. Up to 25 years 20 16.0 2. 26-35 years 48 38.4 3. 36-45 years 45 36.0 4. Above 45 years 12 9.6
Total 125 100

International Conference on INDIA 2030
15 Manonmaniam Sundaranar University, Tirunelveli
age group of 36-45 years and the remaining 12 (9.6%) respondents fall under the age group of
above 45 years. It can be noted that most of them are relatively middle aged 38.4% of them from the
age group 26-35 years. Women entrepreneurs above the age of 45 are very limited in number.
Hence, it is inferred that middle age group is more interested. Of these two categories, middle aged
category has been placed number one, because this group is the productive age group which also
determines the relative strength of the entrepreneur and risk taking capacity.
Table 2 Marital Status-wise Classification of the Respondents
Source: Primary Data From above Table 2, it is clear that out
of 125 sample respondents, 91 (72.8%) of
the respondents are married while 26
(20.8%) of the respondents are unmarried,
6 (4.8%) of the respondents are widow and
2 (1.6%) of the respondents are divorced.
Hence, it is inferred that married people are
much interested in starting and running enterprises than the unmarried. This shows that they are
coming into the business world due to the family circumstances.
Table 3 Educational Qualification-wise Classification of the Respondents
Source: Primary Data
Table 3 reveals that out of 125
respondents, 45 (36%) of the respondents
have upto 12th Std qualification, 34 (27.2)
of them have under graduate, 22 (17.6%)
of them have post graduate, 10 (8%) of
them have diploma qualification and the
remaining 14 (11.2%) of them have
professional degree qualifications. It is clear that a majority (36%) of the respondents have upto
12th Std qualification.
Table 4 Type of Family-wise Classification of the Respondents
Source: Primary Data From the table 4, it is inferred that
80 (64%) of the respondents belong to
nuclear family and the fact that 45
(36%) of the respondents belong to
joint family.
Table 5 Size of the Industry
Source: Primary Data Table 5 clearly shows that 41.6 per cent
of the respondents have village/rural
industry, 22.4 per cent of the respondents
have tiny industry, 13.6 per cent of the
respondents have medium industry, 12 per
cent of the respondents have micro
industry and 10.4 per cent of the
respondents are small industry.
Sl. No Marital Status No. of
Respondents Percentage to
Total 1. Married 91 72.8 2. Unmarried 26 20.8 3. Widow 6 4.8 4. Divorced 2 1.6 Total 125 100
Sl. No Educational
Qualification No. of
Respondents Percentage
to Total 1. Upto 12th Std 45 36.0 2. Under Graduate 34 27.2 3. Post Graduate 22 17.6 4. Diploma 10 8.0 5. Professional Degree 14 11.2 Total 125 100
Sl. No Type of Family No. of
Respondents Percentage to
Total 1. Joint family 45 36.0 2. Nuclear family 80 64.0 Total 125 100
Sl. No Size of the Industry
No. of Respondents
Percentage to Total
1. Village/Rural 52 41.6 2. Tiny 28 22.4 3. Micro 15 12.0 4. Small 13 10.4 5. Medium 17 13.6 Total 125 100

Vol. 5 Special Issue 3 August 2017 ISSN: 2320-4168
16 Shanlax International Journal of Commerce
The analysis of the size of the industry of the respondents has revealed that a majority (41.6%) of
the respondents have village/rural industry.
Table 6 Type of Organisation
Source: Primary Data
Table 6 clearly shows that
70.4 per cent of the respondents
are involved in sole proprietor
type of organisation, 17.6 per
cent of the respondents involved
in partnership concern, 8 per
cent of the respondents are
involved in Private Limited
Concern and 4 per cent of the respondents are involved in co-operative society. The analysis of the
type of organisation of the respondents has revealed that a majority (70.4%) of the respondents are
involved in sole proprietor type of organisation.
Respondents view on Entrepreneurial Motivation
The factors loading to entrepreneurial motivation among women entrepreneurs in the present
study is confined to nine factors namely persuasion factor, work and income factor, innovative
factor, return and social interaction factor, opportunities factor, solution factor, confidence and
challenge factor, interference and improvement factor and own decision and confusion factor. The
respondents’ view on the factors are computed by the mean score the variables in each factor. The
mean score of the factors in rural, semi-urban and urban areas have been computed separately. The
significant difference among the three regions of respondents has been examined with the help of
one way analysis of variance. The results are given in Table 7.
Table 7 Respondents’ view on Entrepreneurial Motivation
Sl. No Factors Mean Score among the Respondents F
Statistics Urban Semi-urban Rural 1. Persuasion factors 3.7478 4.0627 3.7429 8.173* 2. Work and income factors 3.7457 3.9224 3.6549 3.167* 3. Innovative factors 3.6543 4.0507 3.5978 13.516* 4. Return and social interaction factors 3.4973 3.8955 3.2445 25.260* 5. Opportunities factors 3.3832 3.8106 3.1978 23.845* 6. Solution factors 3.6886 4.1130 3.8929 6.135* 7. Confidence and challenge factors 3.7880 4.1269 3.6951 12.164* 8. Interference and improvement factors 3.6209 4.0485 3.4753 31.121* 9. Own decision and confusion factors 3.4746 3.9353 3.3741 14.429*
Source: Primary data
*Significant at five per cent level
NS: Not Significant
The highly viewed factors among the women entrepreneurs in urban area are confidence and
challenge factors and persuasion factor since their mean scores are 3.7880 and 3.7478 respectively.
Among the respondents in semi-urban area, confidence and challenge factors and solution factor
since their mean scores are 4.1269 and 4.1130 respectively. Among the respondents in rural area,
the highly viewed factors are solution factor and persuasion factor since their mean scores are
3.8929 and 3.7429 respectively. Regarding the respondents view on the factors leading to
entrepreneurial motivation, significant difference among the three groups of respondents have
been noticed in the case of persuasion factor, work and income factor, innovative factor, return and
Sl. No Type of Organisation No. of
Respondents Percentage
to Total 1. Sole Proprietor 88 70.4
2. Partnership concern 22 17.6
3. Private Limited concern 10 8.0
4. Co-operative society 5 4.0
Total 125 100
International Conference on INDIA 2030
17 Manonmaniam Sundaranar University, Tirunelveli
social interaction factor, opportunities factor, solution factor, confidence and challenge factor,
interference and improvement factor and own decision and confusion factor since their respective
‘F’ statistics are significant at five per cent level.
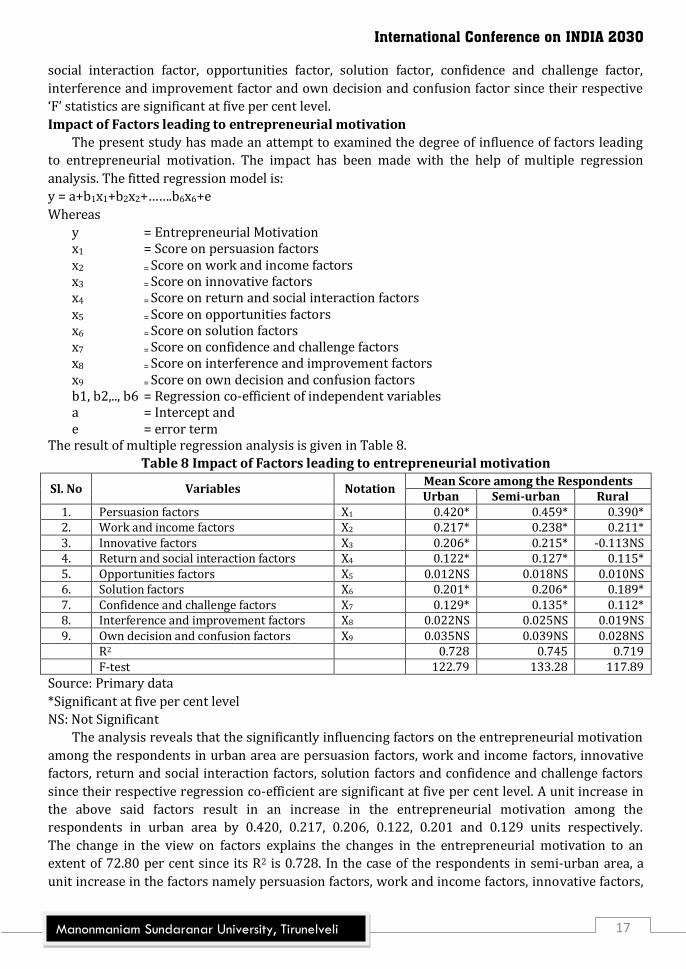
Impact of Factors leading to entrepreneurial motivation
The present study has made an attempt to examined the degree of influence of factors leading
to entrepreneurial motivation. The impact has been made with the help of multiple regression
analysis. The fitted regression model is:
y = a+b1x1+b2x2+…….b6x6+e
Whereas
y = Entrepreneurial Motivation x1 = Score on persuasion factors x2 = Score on work and income factors x3 = Score on innovative factors x4 = Score on return and social interaction factors x5 = Score on opportunities factors x6 = Score on solution factors x7 = Score on confidence and challenge factors x8 = Score on interference and improvement factors x9 = Score on own decision and confusion factors b1, b2,.., b6 = Regression co-efficient of independent variables a = Intercept and e = error term The result of multiple regression analysis is given in Table 8.
Table 8 Impact of Factors leading to entrepreneurial motivation
Sl. No Variables Notation Mean Score among the Respondents Urban Semi-urban Rural
1. Persuasion factors X1 0.420* 0.459* 0.390* 2. Work and income factors X2 0.217* 0.238* 0.211* 3. Innovative factors X3 0.206* 0.215* -0.113NS 4. Return and social interaction factors X4 0.122* 0.127* 0.115* 5. Opportunities factors X5 0.012NS 0.018NS 0.010NS 6. Solution factors X6 0.201* 0.206* 0.189* 7. Confidence and challenge factors X7 0.129* 0.135* 0.112* 8. Interference and improvement factors X8 0.022NS 0.025NS 0.019NS 9. Own decision and confusion factors X9 0.035NS 0.039NS 0.028NS
R2 0.728 0.745 0.719 F-test 122.79 133.28 117.89
Source: Primary data
*Significant at five per cent level
NS: Not Significant
The analysis reveals that the significantly influencing factors on the entrepreneurial motivation
among the respondents in urban area are persuasion factors, work and income factors, innovative
factors, return and social interaction factors, solution factors and confidence and challenge factors
since their respective regression co-efficient are significant at five per cent level. A unit increase in
the above said factors result in an increase in the entrepreneurial motivation among the
respondents in urban area by 0.420, 0.217, 0.206, 0.122, 0.201 and 0.129 units respectively.
The change in the view on factors explains the changes in the entrepreneurial motivation to an
extent of 72.80 per cent since its R2 is 0.728. In the case of the respondents in semi-urban area, a
unit increase in the factors namely persuasion factors, work and income factors, innovative factors,

Vol. 5 Special Issue 3 August 2017 ISSN: 2320-4168
18 Shanlax International Journal of Commerce
return and social interaction factors, solution factors and confidence and challenge factors result in
an increase in the entrepreneurial motivation by 0.459, 0.238, 0.215, 0.127, 0.206 and 0.135 units
respectively. The change in the view on factors explains the changes in the entrepreneurial
motivation to an extent of 74.50 per cent since its R2 is 0.745. In the case of the respondents in rural
area, a unit increase in the factors namely persuasion factors, work and income factors, return and
social interaction factors, solution factors and confidence and challenge factors result in an increase
in the entrepreneurial motivation by 0.390, 0.211, 0.115, 0.189 and 0.112 units respectively. The
change in the view on factors explains the changes in the entrepreneurial motivation to an extent of
71.90 per cent since its R2 is 0.719.
Suggestions
The majority of the entrepreneurs are in the age group of 26 to 35 years so the training and retraining of entrepreneurs in these age groups is very important. Such training programmes should include the psychology of doing business, new dimensions of life skills for business, building self-esteem, negotiation skills, marketing, international competition, etc.
The district has well educated entrepreneurs. Education has been instrumental in increasing the participation of entrepreneurial activities. Good academic background makes entrepreneurs confident in dealing with problems in business in an effective manner. Education is a powerful tool in breaking down the barriers to successful entrepreneurship. Government should provide better educational facilities and schemes to micro entrepreneurs.
As most of the entrepreneurs are married and most of them live in nuclear families, hence the family members should be made to realize the significance of entrepreneurship. Then, their attitude, role and expectation will change and they will provide the necessary capital, guidance and moral support to the entrepreneurs.
Women entrepreneurs should be encouraged to start their enterprise as joint companies rather than individual entities to avail the advantage of large scale operation.
Most of the women entrepreneurs are of the opinion that because of lack of training, they are not able to survive in the market. Hence, the government should conduct frequent training programmes with regard to new production techniques, sales techniques etc. This training should be made compulsory for women entrepreneurs.
Finance is the first major problem for women entrepreneurs. Hence the Government can provide interest free loans to encourage women entrepreneurs. To attract more women entrepreneurs, the subsidy for loans should be increased.
Conclusion
It is concluded from the study that majority of the women entrepreneurs belong to the age
group of 26 to 35 years because these age groups have no employment opportunities as well as they
want to become entrepreneur. Most of the women entrepreneurs are married have been involved in
the business, the reason is that they are willing to take risk in life, hence they become entrepreneur.
The development of the industry depends on the efficiency of the women entrepreneur. Since the
nature of entrepreneur and the financial, marketing and other problems that will restricts the
development of the entrepreneurship, the researcher has carried out the present study.
References 1. V. S. Dhekale, “Performance of Women Entrepreneurship in India”, International Journal of
Management (IJM) Volume 7, Issue 1, Jan-Feb 2016, pp. 123-131. 2. V.Manickavasagam, Kasthuri and P.Jayanthi, “Women Entrepreneurs: An Analysis”, Southern
Economist, May 2007, pp.43-44. 3. M.M.Shankar, M.E. Vijalakshmi, “A Study on the Motivating Factors of Women Entrepreneurs in
Chennai”, The ICFAI Journal of Management Research, Feb – 2007, Vol.VI, pp. 46-54. 4. Sukh Jeen Kaur, Dr.S.K.Saini, “Entrepreneurship among Rural Women”, Kisan world, January
2006, Vol.33, pp.47-49

International Conference on INDIA 2030
19 Manonmaniam Sundaranar University, Tirunelveli
ROLE OF WOMEN EMPOWERMENT THROUGH MICROFINANCE –
A STUDY WITH SPECIAL REFERENCE TO SELF HELP GROUPS IN TIRUNELVELI
Dr.S.Muthulakshmi, M.Com., M.Phil., M.B.A., M.A (YHE)., Ph.D. ,CCAM.,
Assistant Professor of Commerce, The M.D.T. Hindu College, Tirunelveli
Introduction
Women constitute about more than 50% of the world population. They are rich human
resources for development but they are underutilized. They are less educated, but work for long
hours and are paid less. This disparity creates inefficiencies, hampers growth and as a result, half of
world’s potential and human resources goes unharnessed. This ender inequalities needs to be
eliminated. Eliminating gender inequalities lead to significant productivity gains will provide large
societal benefits and will enhance poverty reduction efforts. Women, a weaker and oppressed
section are an important segment of Indian society. The neglect and discrimination of women in
India are well known. Women belong to the vulnerable part of the Indian society. They are the last
to receive education and first to drop out of it. They are the last to be consulted in decision making
about environment and first to be affected. Women only have a secondary role of play in the society
and often suffer discrimination in most of the spheres of life. It is essential on the part of
government to formulate measures for the upliftment of this weaker sex. Otherwise the neglecting
of women will be detrimental to the economic development of the nation. It is the platform for
women to develop their entrepreneurial skills, self-confidence and self-esteem, realize potentially
and increase their collective bargaining power through Self Help Group.
Concept of Self Help Group
SGH is a small group of rural poor, who have voluntarily come forward to form a group for
improvement of the social and economic status of the members.
It can be formal (registered) or informal.
The concept underlines the principle of thrift, credit and self help.
Members of SGH agree to save regularly and contribute to a common fund.
The members agree to use this common fund and such other funds other funds (like grants and
loans from banks), which they may receive as a group, to give small loans to needy members as
per the decision of the group.
The SGH members are encouraged to make voluntary savings at regular intervals so that
resources so pooled could be used to make small interest bearing loans to their members on a
rotational or needs basis. In India, innovative approach in SGH group movement was made by
NABARD by the introduction of pilot project in 1991. NABARD defines it as a group of 20 or less
people from a homogenous class who are willing to come together for addressing their common
problems. Generally the self help group is a development group and informal in nature may consist
of 10 to 20 persons. In case of areas with scattered and sparse population and difficult areas like
desert and hills, this number maybe from 5-20. The difficult areas have to be identified by the state
legal committee and the above relaxation in membership will be permitted only in such areas. The
group shall not consist of more than one member from the family. The central idea of self-help is:
“you alone can do it-but you can’t do it alone’’. The SGH method is used by the government, NGOs
and others worldwide. SGH are considered as an important institution at local level.

Vol. 5 Special Issue 3 August 2017 ISSN: 2320-4168
20 Shanlax International Journal of Commerce
Characteristics of SGH
Intimate knowledge of member intrinsic strength, and problems, flexible and responsive,
democratic in operation, collective leadership and mutual decision, collateral consist of mutual
confidence and trust.
Benefits form SGHS
SGH is a viable media for development of saving habit among the poor.
Access to larger quantum of resources.
Assurance of freedom, equality, self reliance, and empowerment.
In self help group collective action and solidarity is an important empowering mechanism.
Collective action implies cohesion of the group to perceive common interest and act collectively.
Functions of SGH
Conduct regular weekly meetings.
Promote savings attitude and habit among the members.
Build the common fund slowly and systematically.
As the propagator of voluntarism.
Promoter of thrift and savings.
Provides of timely emerging loans.
Establish linkage with bank and government departments.
Concept of inclusive growth
The eleventh plan defines inclusive growth to be “a growth process which yields broad-based
benefits and ensures equality of opportunity for all’’. The inclusive growth implies an equitable
allocation of resource with benefits accruing to every section of society, which is a utopian concept.
Inclusive growth is based-board. It is concerned with the pro-poor growth, growth with equity.
Inclusive growth is aimed at poverty reduction, human development, health and provides
opportunity to work and be creative.
Role of women in inclusive growth
Inclusive growth is necessary for sustainable development and equitable distribution of wealth
and prosperity. Achieving inclusive growth is the biggest challenge in a country like India. Poverty
alleviation is one of the big challenges for India. Eradication of poverty in India is generally only
considered to be a long – term goal. Poverty alleviation is expected to make better progress in the
next 50 years than in the past, as a trickle-down effect of the growing middle class. Increasing stress
on education, reservation of seats in government jobs and the increasing empowerment of women
and the economically weaker sections of society, are also expected to contribute to the alleviation of
poverty. To bring in inclusive growth, it is necessary to enhance the capabilities of women by
providing education, so that they get the opportunity of getting employed and be self sustainable.
Government of India has stepped up for inclusive growth by launching many initiative with feature
that are innovative flexible and reform oriented.
Statement of the problem
The self help groups are an efficient platform for delivering financial services to poor, remote
areas with little or no micro finance infrastructure. Even the very poor are able to save and their
savings increase with addition to their income. Members take out loans from the collective savings
funds, using them for domestic needs, income generation programmes, construction, health and
emergency needs. Self-help group also provides a common platform to discuss and solve the
problems of women in general. The self-help groups play a vital role in the improvement of the
economic status of the women and hence the study is essential and important to bring out the

International Conference on INDIA 2030
21 Manonmaniam Sundaranar University, Tirunelveli
impact made on the economic status of the women by the self-help groups. It is also merging as
effective alternative for e attaining the growth with inclusion in India.
Objective of the study
To study how the SHG has helped in creating employment in non-formal sector.
To find out the impact of SHG on income of women after joining the SHG.
To study the impact of SHG on savings, standard of living and other benefits accrued to SHG
members.
To study how it resulted in reduction in indebtedness.
Methodology
The present study uses both primary and secondary data. The study of impact of SHG is
undertaken for Rajapalayam in which 12 SHG were working of which the entire 12 were selected as
sample. From these selected SHGs, 24 members have been selected to collect the necessary primary
data. The researcher has made use of random sampling technique to locate the respondents. The
necessary primary data have been collected from the selected respondents with the help of
questionnaire. The secondary data are collected from various books, journals, magazines and
websites.
Findings and Discussions: The working of SHG has benefited the members in various ways.
Impact on employment
The linkage between poverty and unemployment is as good as the two sides of the same coin.
The SHG impact in terms of employment is clear in the following table.
Table-1 Impact on Employment
Source: primary data
Table-1 reveals that, the
percentage of females spending their
time in house work has been reduced
from 45.83% to 16.66% indicating
that they are finding gainful
employment after joining the SHG.
The activities where the employment
has increased are milk business,
tailoring, shopkeeper and grinding flour indicating the fact that more absorption is found in jobs
with small which are more suitable for females with low skill.
Impact on level of income
The more visible positive impact of SHG is observed in the form of increase in level of income
after joining the SHG group. Our observation on the basis of sample is presented below.
Table 2 SHGS Income Position
Sources: primary data
Table-2 includes the facts
that, majority (45.83%) of the
respondents have no income
before joining the SHG. But
after joining SHG has replaced
that the income of SHG
members increased to up to
S. No Nature of work Before % After % 1. Only house work 22 45.83 8 16.66
2. Milk business 4 8.33 6 12.5
3. Tailoring 10 20.83 14 29.17
4. Shopkeeper 2 4.18 6 12.5
5. Grinding flour 10 20.83 18 29.17
Total 48 100 48 100
S. No Income Income
before SHGs %
Income after SHGs
%
1. No income 22 45.83 8 16.67 2. Below 1000 16 33.3 26 54.2 3. 1000 t0 3000 8 16.67 10 20.83 4. Above 3000 2 4.17 4 8.33 Total 48 100 48 100

Vol. 5 Special Issue 3 August 2017 ISSN: 2320-4168
22 Shanlax International Journal of Commerce
1000 (54.2%). So there is a change in the income position of the members after joining the SHG. The
members of SHG were benefited positively in terms of fining better opportunity of income.
Impact of saving
The income in saving is one important healthy indicator of economic prosperity. The change in
level of savings before joining the SHG and after joining the SHG is noteworthy feature to study the
impact of SHG. In the following table the monthly savings of the respondents are presented.
Table 3 SHG Member’s Monthly Savings
Sources: primary data The above table reveals that,
70.8% of the respondents have no
savings before joining the SHG.
The savings of the SHG members
increased after joining SHG. The
increase in savings of the
members is attributed to the
strong will of the members for their economic betterment.
Impact on borrowing
The poor families struggling with poverty are compelled to borrow from various sources. As the
institutional sources are not available they are compelled to borrow from non institutional source.
In the following table the borrowing pattern of the SHG members before joining to SHG and after
joining SHG is presented.
Table-5 Sources of Borrowing of SHGS Member
Source: primary data
Table-5 indicates the fact tat,
poverty of SHG members
deprived them to borrow and
improve their economic
standards as it is reflected in zero
borrowing of 54.2% members
before joining the SHG. The major
source for borrowing during
economic crisis was money lenders as 29.2% members were borrowing from this source before
joining the SHG. The other informal sources were jewelry and relatives. But the joining of SHG has
replaced the informal sources of borrowing and the share of borrowing through SHG increased to
100%.
Impact on standard of living
The improvement in income due to gainful employment is reflected in increase in use of
modern instruments such as use of cooking gas, cooker, T.V, phone, cycle and motorcycle in the
family. These changes can be seen as physical indicator of improvement in the standard of living of
the SHG members. It is presented in the following table.
S. No Monthly saving of
SHGs Before joining
% After
joining %
1. No saving 34 70.8 0 0 2. 30 2 4.2 16 33.33 3. 40 4 8.3 18 37.5 4. 50 8 16.7 14 29.17 Total 48 100 48 100
S. No Name the loan giver
Loan after of SHGs (Before)
% Loan taker OSF SHGs
(after) %
1. No loan 26 54.2 0 0 2. Moneylender 14 29.2 0 0 3. Jewelry 6 12.5 0 0 4. Relativest 2 4.2 0 0 5. Bank through SHGs 0 0 48 100
Total 48 100 48 100

International Conference on INDIA 2030
23 Manonmaniam Sundaranar University, Tirunelveli
Table 6 Improvement in Standard of Living
Source: primary data
Note: 1=Gas, 2=Mixer, 3=Kukar, 4=Iron,
5=T.V., 6=others (cycle, motor cycle,
computer, sewing machine, etc.)
It is evident from the above table that the
SHG members are using modern instruments
in increasing number as their income
permits. Te additional income is in the hands
of women which is the major factor for this
positive change. The SHG members have improved their standard of living by enjoying the modern
amenities.
Conclusion
The self help group promotion institution by name SSSPT social sericulture service project trust
has acted as a catalyst. It was founded to act between united bank of India and SHG with the view to
promoting savings linked credit income generating activities under self employment programme.
The active participation of women SHGs in the village facilitated process of savings, issues of credit,
productive use of credit, incremental income and prompt repayment to recycling of credit among its
members. The organized action of women SHG had drastically checked the parasitic influences of
moneylenders, businessmen and other intermediaries who traditionally exploited the rural mass.
Reference
1. Dhameja S K (2002), Women Entrepreneurs: Opportunities, Performance and Problems, Deep
Publisher (P) Ltd., New Delhi
S. No Name of modern
instruments After joining
SHGs members %
1. 2 6 12.5 2. 3 18 37.5 3. 4 4 8.3 4. 5 8 16.7 5. 6 above 6 25 Total 48 100

Vol. 5 Special Issue 3 August 2017 ISSN: 2320-4168
24 Shanlax International Journal of Commerce
ROLE OF MICROFINANCE IN EMPOWERING RURAL WOMEN ENTREPRENEURS
AT TIRUNELVELI TALUK
Dr.N.Sankara Gomathi, M.Com., M.Phil., M.B.A., M.Sc (YHE)., Ph.D., PGDCA.,
Assistant Professor of Commerce, The M.D.T Hindu College, Tirunelveli
Introduction
In recent years women have made their mark in different walks of life and are competing
successfully with men despite the social, psychological and economic barriers. This has been
possible due to education, political awakening, urbanization, legal safeguards, social reforms, etc.
The emergence of women entrepreneur in a society depends to a great extent on the economic,
social, religious, cultural and psychological factors prevailing in the society. Women participation in
entrepreneurial activities in India is relatively a recent phenomenon. There is a noticeable increase
in the number of women entrepreneur and they are becoming ready to reach out for new jobs, new
responsibilities and new experience with a high amount of challenging spirit. Thus women
entrepreneur are the women or a group of women, who initiate, organize and operate a business
enterprise and are expected to innovate imitate or adopt an economic activity.
Micro Finance
The mantra “Micro Finance” is banking through groups. The term micro finance is of recent origin
and is commonly used in addressing issues related to poverty alleviation financial support to micro
entrepreneurs, gender development etc. The term “Micro” literay means “Small”. But it has not
defined any amount. As per micro credit special cell of the Reserve Bank of India the borrowal
amounts up to the limit of Rs.25,000/- could be considered as micro credit products an d this
amount could be gradually increased up to Rs.40,000 over a period of time. The term micro finance,
is used inter chargeably with the term micro credit however, while microcredit refers to prevegance
of loans in small quantities, the term micro finance has a broader meaning covering in its ambit
other financial services like saving, insurance etc. as well.
Dimensions of Micro Finance
The main dimensions of the micro finance approach are:
Savings / thrift precedes credit
Credit is linked with savings / thrift
Absence of subsidies
Groups plays an important role in credit appraisal, monitor easy and recovery.
Role of Microfinance in Women Empowerment
Microfinance for the poor and women has received extensive recognition as a strategy for poverty
reduction and for economic empowerment. Before 1990’s credit schemes for rural women were
almost negligible. The concept of women’s credit was born on the insistence be women oriented
studies that highlighted the discrimination and struggle of women in having the access if credit.
However, there is a perceptible gap in financing genuine credit needs of the poor especially women
in the rural sector. There are certain misconception about the poor people that they need loan at
subsidized rate of interest on soft terms, they lack education, skill, capacity to save, credit

International Conference on INDIA 2030
25 Manonmaniam Sundaranar University, Tirunelveli
worthiness and therefore are not bankable nevertheless, the experience of several that rural poor
are actually efficient managers of credit and finance. Availability of timely and adequate credit is
essential for them to undertake any economic activity rather than credit subsidy. The rural poor
with the assistance from NGO’s have demonstrated their potential for self help to secure economic
and financial strength.
Objectives of the Study
The main objectives of the paper are as follows:
1. To examine the challenges of women entrepreneurs in rural areas of Tirunelveli Taluk.
2. To study the factors responsible for becoming an entrepreneur.
3. To highlight the significance of microfinance in empowering women entrepreneur in rural
areas.
4. To analyze the problems faced by the women entrepreneurs in rural areas.
5. To offer concrete suggestions to improve their performance
Methodology of the Study
The study is based on both primary and secondary data. The primary data was collected by the
researcher with the help of a structured interview schedule. The secondary data has been collected
from books, journals and websites. The researcher has selected 60 sample respondents from
different villages of Tirunelveli taluk under convenience sampling method. Simple statistical tools
such as tabulation and percentage analysis were to analyse the collected data.
Results and Discussions
Age: The following table explains the age wise classification of the sample respondents.
Table 1 Age-Wise Classification of the Respondents
Source: Primary data
It is clear from the table 1 that
majority 36(60 percent) of the
respondents are at the age group of
between 20 and 30 years. 13(21.67
percent) are between 30-40 years, 6(10
percent) are above 40 years and 5(8.33
percent) are below 20 years.
Marital Status
The following table explains the marital status of the sample respondents.
Table 2 Marital Status of the Respondents
Source: primary data It is evident from the table 2 that
majority 48(80 percent) of the
respondents are married and the
remaining 12 (20 percent) are unmarried.
Education Qualification
The following table explains the educational qualification of the sample.
S. No Age (in years) Number of
Respondents Percentage
1. Below 20 5 8.33 2. 20 – 30 36 60 3. 30 – 40 13 21.67 4. Above 40 6 10
Total 60 100
S. No Marital status Number of
Respondents Percentage
1. Married 48 80
2. Unmarried 12 20
Total 60 100

Vol. 5 Special Issue 3 August 2017 ISSN: 2320-4168
26 Shanlax International Journal of Commerce
Table 3 Educational Qualifications of the Respondents
Source: primary data It is assessed form the table 3 that
majority 21 (35 percent) of the respondents
are diploma holders and completed different
technical courses, 18 (30 percent) of the
respondents are graduates, 12 (20 percent)
are post graduates and 9 (15 percent) are
completed school level education up to HSC.
Nature of Business
The following table explains the nature of business started by the sample respondents.
Table 4 Nature of Business of the Respondents
Source: primary data
The above table-5 reveals that
majority 23 (38.34 percent) of the
respondents had started cottage
industries by producing edible food
items such as pickles, chips, vadagam
etc., 17 (28.33 percent) of the
respondents are making handicrafts
items such as flower making, mat weaving etc., 11 (18.33 percent) of the respondents are doing job
works, and 9 (15 percent) of the respondents have started beauty parlors and small industries.
Source of Finance
The following table explains the sources of finance of the sample respondents.
Table 5 Sources of Finance of the Respondents
Source: primary data
It is clear from the above
table that majority 28 (46.67
percent) of the respondents
borrowed funds from
government agencies such as
DIC, NABARD etc, 16 (26.67
percent) of the respondents got
loan form financial institutions,
10 (16.66 percent) of the
respondents used their own
funds and 6 (10 percent) of the respondents borrowed fund from other sources such as money
lenders.
Significance of Microfinance
The following table explains the opinion of the respondents towards the significance of
microfinance.
S. No Educational
Qualification Number of
Respondents Percentage
1. Up to HSC 9 15 2. Graduation 18 30 3. Post graduation 12 20 4. Diploma 21 35
Total 60 100
S. No Nature of business
Number of respondents
percentage
1. Cottage Industries 23 38.34 2. Handicrafts 17 28.33 3. Job works 11 18.33 4. 0thers 9 15
Total 60 100
S. No Sources of
finance Number of
respondents Percentage
1. Own fund 10 16.66
2. Loan and financial
institution
16 24.67
3. Loan and government
agencies
28 24.67
4. Others 6 10
Total 60 100

International Conference on INDIA 2030
27 Manonmaniam Sundaranar University, Tirunelveli
Table 6 Reasons of the respondents Source: primary data
The above table shows that majority 23 (38.33 percent) of the respondents felt that they gained economic empowerment through microfinance by becoming an entrepreneur. Motivating Factors The following table explains the motivating factors for the respondents to become an entrepreneur.
Table 7 Motivators of the respondents Source: primary data
It is clear from the table
8 that majority 20 (38.33
percent) of the respondents
felt that low interest rates
are the main motivating
factor for availing
microfinance through SHG’s.
Influencing factors for availing microfinance to becoming an entrepreneur
The following table explains the factors responsible for the respondents to become an
entrepreneur by availing microfinance.
Table 8 Influencing factors
Source: primary data
It is revealed form the table 9
that major 22 (36.67 percent)
factor the respondents felt that is
to earn huge profit.
The following table explains
the challenges faced by the
women entrepreneurs to their
business in rural areas
Table 9 Challenges of the Respondents
Source: primary data
It is evident from the
table 11 the majority 19
(31.67 percent) of the
respondents felt that the
inadequate infrastructure
is the major challenge they
faced in their business in
their rural areas.
S. No Reasons Number of
respondents %
1. Economical empowerment 23 38.33
2. Social empowerment 11 18.33
3. Pride 13 21.67
4. Gender Equality 6 10
5. Political empowerment 7 11.67
Total 60 100
S. No Motivators Number of
respondents Percentage
1. Parents Repayment Schedules 8 13.33 2. Spouse Subsidies 12 20 3. Friends Loan Size 13 21.67 4. Relatives Easy Procedure 7 11.67 5. Voluntary low Interest Rate 20 33.33
Total 60 100
S. No Factors Number of
respondents %
1. To earn huge profit 22 36.67 2. To improve their standard of
living 13 21.67
3. To increase their social status 7 11.67 4. Self – huge 8 13.33 5. Saving for future 10 16.67
Total 60 100
S. No Challenges Number of
Respondents %
1. Inadequate infrastructure 19 31.67 2. Shortage of finance 13 21.67 3. Shortage of power supply 9 15 4. Lack of technical know-how 6 10 5. Supply of raw materials 5 8.33 6. Inadequate marketing arrangements 8 13.33
Total 60 100

Vol. 5 Special Issue 3 August 2017 ISSN: 2320-4168
28 Shanlax International Journal of Commerce
Findings of the Study
The major findings of the study are as follows:
1. Majority 36 (60 percent) of the respondents are at the age group of between 20 and 30 years.
2. Majority 48 (80 percent) of the respondents are married.
3. Majority 21 (35 percent) of the respondents are diploma holders and completed different
technical courses.
4. Majority 23 (40 percent) of the respondent’s monthly income is between Rs.5,000 and
Rs.10,000.
5. Majority 23 (38.34 percent) of the respondents had started cottage industries by producing
edible food items such as pickles, chips, vadagam etc.
6. Majority 28 (46.67 percent) of the respondents borrowed funds from government agencies
such as DIC, NABARD etc.
7. Major 22 (36.67 percent) factor the respondents felt that is to earn huge profit.
8. Majority 23 (38.33 percent) of the respondents felt that they wanted to become an
entrepreneur to gain economic stability.
9. Majority 19 (31.67 percent) of the respondents felt that the inadequate infrastructure is the
major challenge they faced in their business in their rural areas.
Suggestions
The following are the important suggestions related to the study.
1. The government should provide entrepreneurial development training programme especially
for women in rural areas.
2. The government agencies should make proper marketing arrangements to market the products
of women entrepreneurs in rural areas.
3. The commercial banks and other financial institutions should make should provide loans at low
interest rate.
4. The government should provide special subsidies to women entrepreneurs who start their
concern in priority sectors and priority areas.
5. The women entrepreneurs in rural areas should educate themselves with advanced
technological development and marketing strategies.
6. The women entrepreneurs in rural areas should not restrict themselves in making pickles and
garment, they should make themselves potential for starting high power industries with proper
skill development.
7. Continuous monitoring and improvement of training programmes should eventually spread the
cult of entrepreneurship among young women in rural areas.
8. Imparting training by experts in different fields namely production, marketing, banking,
accounts, industrial and consumer relations, legal issues etc., is and added value to women
entrepreneurs. The government should take necessary steps to provide such training
programmes in rural areas.
Conclusion
Women entrepreneurs are observed dealing with production of both consumer goods and
intermediate goods and articles. Like a male entrepreneur, a women entrepreneur also requires to
perform the functions of exploring the prospects of starting new enterprise, undertaking of risks
and the handling of economic uncertainties, introduction of innovations, co-ordination, control and
change management. Training and development of skills are essential for the development of
women entrepreneurs. Tax concessions, market subsidies, low interest rate, are the push factors

International Conference on INDIA 2030
29 Manonmaniam Sundaranar University, Tirunelveli
with which women can join the main stream of national economy and thereby, excel well and gets
the capacity of contributing global business environmental conditions. Women have the potential
and the well to establish and manage enterprises of their own.
References
1. Arora,R and Sood, S.K(2005)-Fundamentals of Entrepreneurship and Small Business
2. Baporikar, N. (2007) Entrepreneurship Development & Project Management Himalaya Publication
House.
3. Brush, C. (1997). Taori, Dr. Kamal – Entrepreneurship in the Decentralized Sector Women-Owned
Business: Obstacles and Opportunities, Journal of Development Entrepreneurship.
4. Dr.Selvaraj “Microfinance has Multiple Role in Rural Economy” Readers Shelf Dec – 2007
Vol.4.issue No.3.76-81.
5. Dr.Ramachandran and N. Kavitha “overview of Micro Finance for Women in India”, 2009.
6. Prabudeva M.K and B.P. Veerabhadrappa “Micro Finance: Financial Access or Poverty Alleviation”
Southern Economist June 1, 2009. P.No 20

Vol. 5 Special Issue 3 August 2017 ISSN: 2320-4168
30 Shanlax International Journal of Commerce
ROLE OF SELF HELP GROUPS IN WOMEN EMPOWERMENT IN MANUR BLOCK
S. Pitchammal
Assistant Professor, Department of Commerce, The M.D.T Hindu College, Tirunelveli
“Women are the noblest of god’s creation, supreme in their own sphere of activity”
-Mahatma Gandhiji
Introduction
A woman is never viewed as a person having her own rights but always as some one’s daughter,
wife and mother. In each and every movement woman is nominated by man. Woman in our country
play an equally important role through development of their resource-fullness and their skills.
Statement of the Problem
Women constitute about more than 50% of the world population. They are rich human
resources for development but they are underutilized. They are less educational but work for long
hours and are paid less. This disparity creates inefficiencies, hampers growth and as a result, half of
world’s potential and human resources goes unharnessed. This gender inequalities needs to be
eliminated. Eliminating gender inequalities lead to significant productivity gains will provide large
societal benefits and will enhance poverty reduction efforts. A woman is never viewed as a person
having her own rights but always as some one’s daughter, wife and mother. In each and every
movement woman is nominated by man. Woman in our country play an equally important role
though development of their resource-fullness and their skills. They are contributing significantly to
modern business and commercial world in their own way. Increasing opportunities for learning,
economic compulsions of the family and growing rate of urbanization have all contributed to the
opening of new career avenues to talented women.
Objectives
1. To study the concept of self help groups and its functions
2. To know about the socio-economic factors of members of SHGs in manur block in Tirunelveli
district.
3. To rank the benefits obtained by the women members of SHGs in manur in Tirunelveli district.
Sampling Design
For study purpose, the manur block in tirunelveli district has been selected. There are 27 self
help groups in manur block. Among these groups, 15 groups are doing business activities. Out of 15
business groups were selected by using convenience random sampling method. Primary data and
secondary data were used for the present study. In order to analysis the level of satisfactions
obtained by the women members after joining in self help groups, Garret ranking method was used.
Concept of Self Help Group
SHG is a small group of rural poor, who have voluntarily come forward to farm a group for
improvement of the social and economic status of the members.
It can be formal (registered) or informal.

International Conference on INDIA 2030
31 Manonmaniam Sundaranar University, Tirunelveli
The concept underlines the principle of thrift, credit and self help.
Members of SHG agree to save regularly and contribute to a common fund.
The Members agree to use this common fund and such other funds (like grants and loans from
banks), which they may receive as a group, to give small loans to needy members as per the
decision of the group.
The SHG members are encouraged to make voluntary savings at regular intervals so that
resources so pooled could be used to make small interest bearing loans to their members on a
relational or need basic. In India, innovative approach in SHG group movement was made by
NABARD by the introduction of pilot project in 1991. NABARD defines it as a group of 20 or less
people form homogenous class who are willing to come tighter for addressing their common
problems. Generally the self help group is a development group and informal in nature may consist
10 to 20 persons. In case of areas with scattered and sparse population and difficult areas like
desert and hills, this number may be form 5-20 . The difficult areas have to be identified by the state
level committee and the above relaxation in membership will be permitted only in such areas. The
group shall not consist of more than one member form the family. The central idea of self-help is:
“you alone can do it-but you can’t do it alone.” The SHG method is used by the government, NGOs
and others worldwide. SHG are considered as an important institution at local level.
Objectives of the Scheme
1. To increase the income level of the destitute women
2. To develop entrepreneurial culture among women
3. To create employment potential by encouraging self employed concept
4. To lap and exhibit the technical and managerial skills of the women entrepreneurs
5. To increase the supply of the products at a lower cost to the consumers of the local area by
minimizing the overhead cost and distribution cost which is very high with MNC’s
6. To utilize the available resources more efficiently without wasting in transportation and storage
Benefits of Self Help Gropus
Self help groups are an effective strategy for poverty alleviation, human development and social
empowerment. The purpose of the SHG is to build the functional capacity of the poor and the
marginalized in the fields of employment and income generating activities.
Forming a group can
Change the basic thinking of members about themselves and their ability to perform
independently;
Provide social recognition and acceptance for a given task through its collective approach;
Build collective strength and promote initiation of new projects/ideas to bring out necessary
changes in the lives of members;
Improve the economic status of its members by register savings/quick loans;
Promote group access to bank/loans;
Improve access to information about government/non-government & Beneficiary Oriented
Schemes/programmes;
Resolve social and other disputes;
Include the feeling of self-reliance leading to the development in the right direction
Functions of Self Help Groups
1. SHGs are mostly informal groups where members pool saving as a thrift deposit. The group has
common perception of need and collective activity.

Vol. 5 Special Issue 3 August 2017 ISSN: 2320-4168
32 Shanlax International Journal of Commerce
2. Many such groups formed around specific productive actives, promote savings among members
and use the pooled resources to meet the various credit needs of the members
3. Where funds generation is low in the initial phases, due to low saving capacities. This is
supplemented by external resources.
4. SHGs have also evolved their own functioning systems.
5. Creating economic self reliance of the rural poor by meeting consumption and credit needs as
and when they arise. This will prevent exploitation of the poorer sections by the non-industrial
credit belief.
6. Development of group dynamics, building, leadership quality to realize their potentially and
self-belief.
7. Assisting the members to complete the formalities and documentation required to obtain credit
form bank.
8. Helping banks in the recovery of credit by motivating the members for prompt repayment of
loans.
9. Training of members is the use of extension services and Government support.
10. Building common infrastructure for the benefit of its members.
11. Maintaining the proper books of accounts for credit rating and grading the SHGs
12. Utilization of group resources for the productive purposes like economic activities
13. Attending the meeting organized by the government and Non Governmental organizations.
14. Conducting the group meeting periodically.
The supports given by government agencies to the SHGs are
1. Formation of group from the members identified
2. Project identification for the selected group
3. Conducting entrepreneurship development programs
4. Helping the groups in developing infra structure, organizations, etc
5. Loan syndication with banks for term loan/ working capital loan.
6. Marketing assistance to market the products produced by the SHG
Analysis and interpretation
Members those are having homogeneous class, come from different socio-economic and
cultural background. The details are presented in table-1.
Table 1 Classification of respondents according to socio-economic factors
Demographic factors No. of respondents Percentage to total Age Below 30 years 31-40 years 41-50 years Above 50 years Total
15 35 19 6
75
20 47 25 8
100.00 Religions Hindus Christians Muslim Total
36 29 10 75
48 39 13
100.00

International Conference on INDIA 2030
33 Manonmaniam Sundaranar University, Tirunelveli
Community SC/ST B.C M.B.C F.C Total
20 35 18 2
75
27 47 24 2
100.00
Area of residence Rural Semi urban Urban Total
32 35 8
75
43 47 10
100.00
Literacy level Primary school Secondary school Higher secondary College Total
20 30 15 10 75
27 40 20 13
100.00
Experience Below 3 years 3-6 years 6-9 years Above 9 years Total
30 26 16 3
75
40 35 21 4
100.00
Marital status Married Unmarried Total
70 5
75
93 7
100.00 Type of family Nuclear family Joint family Total
69 6
75
92 8
100.00 Family income per month Less than Rs.10000 Rs.10000-Rs.15000 Rs.15000-Rs.20000 Rs.20000-Rs.25000 Total
36 20 15 4
75
48 27 20 5
100.00 The table-1 indicates that classifications of respondents according to socio - economic factors.
1. Thus it reveals that a majority of sample respondents are belonging to the age group of 31 years
- 41 years.
2. It can be concluded that more than 48% of the respondents are Hindus.
3. It indicates that more than 47% of the respondents belonged to the community category of
backward class
4. It portrays that majority of the respondents are residing at semi-urban areas
5. From the study it is clear that the majority at 30% of the respondents are secondary school
level
6. From the study clear that the majority of 30(40%) of the respondents are below 3 years
7. It reveals that majority of the members are married

Vol. 5 Special Issue 3 August 2017 ISSN: 2320-4168
34 Shanlax International Journal of Commerce
8. It is concluded that more than 92% of the respondents are from nuclear family
9. It is understood that more than 48% of the members are in the income group of less than
Rs.10000 only.
Table 2 Percent position and garret value
Garret ranking method
An attempt has been made to analysis the various benefit
of self help groups by using Garret ranking method.
100(Rij-0.5)
Percent position = ----------------,
Nj
Rij=rank given for the ith variable by the jth respondents,
Nj=number of variables ranked by the jth respondents.
Table-3 Members Opinion on Benefits of Self Help Groups
S.No Statement Total score
Average Rank
1 Developing entrepreneurial skills 3830 51.1 X 2 Financial assistance 4508 60.10 I 3 Increasing the status of women 4477 59.69 II
4 Training given in various business fields 4213 56.17 IX 5 Developing saving habit among the member of SHG 4394 58.58 IV 6 Promoting and ensuring the human rights of women at stages of their
life cycle 4438 59.17 III
7 Improved health and family welfare through better awareness 4296 57.28 VII 8 Better education for children and literacy due to increased awareness
about government welfare schemes 4256 56.74 VIII
9 Self help and mutual help 4314 57.52 VI 10 Getting social respect and recognition 4341 57.88 V
It is observed from the table-3 that "financial assistance" is given the first rank that is the
primary benefit received by the members of SHGs. second rank is given to the benefit of "increasing
the status of women". Third rank is given to the benefit of "promoting and ensuring the human
rights of women by the members" and the last rank is given to the benefit of "developing
entrepreneurial skills".
Conclusion
"You can tell the condition of a nation by looking at the status of its women"
- jawaharlal Nehru
It is concluded from the above analysis that even though the opinion of women members
towards self help groups is positive but the socio-economic conditions are not at all completely
fulfilled for their empowerment .Because till now they are the facing various problem like illiteracy,
conservative attitude of society, Health problems, Religious & social taboos, male dominance , lake
of infrastructural facilities, marketing problems , lack of confidence, lack of mobility, lack of
confidence and family commitments etc. which are obstacles for their development.
S. No Calculated
value Garret value
1 5 82
2 15 70
3 25 63
4 35 58
5 45 52
6 55 48
7 65 42
8 75 37
9 85 30
10 95 18

International Conference on INDIA 2030
35 Manonmaniam Sundaranar University, Tirunelveli
Empowering women is pre-requisite for creating a good nation, when women are empowered,
society with stability is assured. Empowering of women is essential as their thoughts and their
value systems lead the developments of a good family, good society and ultimately a good nation.
inspite of various constitutional safeguards and legislative measures as well as number of
programmes and policies initiated by the government for the betterment of women, no significant
development took place in the socio-economic conditions of women and they are still lagging
behind men in their participation in the process of development. Without the full and equal
participation of women, there can be no sustainable human development. Low socio-economic
status of women and less empowerment of women is an intense socio-economic problem not only
at national level but also at the global level that requires a long-term multi-pronged strategy to be
carried on continuously.

Vol. 5 Special Issue 3 August 2017 ISSN: 2320-4168
36 Shanlax International Journal of Commerce
INTER-DISTRICT DISPARITY IN INDUSTRIAL DEVELOPMENT OF TAMILNADU
Dr. P. Muthumurugan
Assistant Professor of Economics, Thiruvalluvar College, Papanasam, Tirunelveli
G.Elumalai
Ph.D-Scholar, Department of Environmental Economics, School of Economics
Madurai Kamaraj University, Madurai
Abstract The main aim of this paper is to examine the inter-regional disparity in industrial development of Tamilnadu, on the basis of composite index analysis. For this analysis four important variables have been selected for two bench mark years i.e. 1997-98 and 2007-08. The results of composite index analysis have clear pictured about inter- district variations in levels of industrial development. We hope that this paper will help to formulate appropriate plans for reducing regional variations in the level of industrial development in Tamil Nadu. Keywords: Composite index, Gross District Domestic Product (GDDP), Industrial development, Industrialization, Regional variations. Introduction
Industrialization is one of the pre-requisites of economic development of a country.
The standard of living in any economy is mainly determined by the degree of industrialization it has
attained. In fact, it is regarded as a panacea to break through economic stagnation and poverty.
Those who seek solutions to the various problems of under-developed economies through
industrialization advocate greater concentration of efforts on the industrial sector than agriculture,
as they believe that the former is more advantageous than the latter. First of all, as noted by Colin
Clarks, the operation of the law of increasing returns is more common in the industrial sector than
in agriculture. Secondly, the growth of manufacturing industry is more relevant than agriculture in
population dense underdeveloped economies as it absorbs the surplus population on the land.
This will help to break the vicious circle of poverty. Thirdly, it has also been argued that, when an
economy is on the path of development, the proportion of its population engaged in
non-agricultural occupations is quite high. Their income earning capacity will be generally higher.
At higher income levels, people spend an increasing proportion of their income on non-agricultural
products. Finally, the per capita income generated in manufacturing is generally higher than in
agriculture. Therefore, industrial development assumes great importance for overall development
of the economy. Even though, compared to among the regions of Tamilnadu, most of the regions are
considered to be the backward regions with inter-regional disparities in industrial development.
With an inherited imbalance, the developmental measures activities implemented in this areas, had
aggravated the situation. Any deliberate effort for reduce the disparities among the regions calls for
such policy measures as to stimulate the lagging regions. This implies the need for identification of
backward districts or regions. In a developing state like Tamilnadu, the identification of backward
districts of region could be helpful for the government or any other development agencies in
formulating regional plan to reduce disparities and strengthen the weak points and thus ensuring
regional balance of the state economy in the process of agricultural development. Among the
district of Tamilnadu, the most of the districts are very backward. But no effort was made to identify
the backwardness among the districts of Tamilnadu. Since regional studies have made little attempt
to explore the backwardness and the extent of regional variations among the districts of Tamilnadu,

International Conference on INDIA 2030
37 Manonmaniam Sundaranar University, Tirunelveli
it is essential to make a study in that direction. Therefore the present paper has been made an
attempt on inter-district variations in industrial development in Tamilnadu.
The main objectives of this paper are to examine the inter-district variations in industrial
development of Tamilnadu and to identify the positions of the each district in terms of selected
indicators. This paper has four sections, the first section reveals that introduction, second section of
this paper describes the database and methodology, third section reveals that results and
discussion and fourth section has depict conclusion.
Database & Methodology
The paper makes an attempt to examine the inter-district variations in levels of industrial
development of Tamilnadu with respect to the important indicators of the two bench mark year
i.e. 1997-98 and 2007-08 for 29 districts. The study entirely based on secondary data .The required
data for the analysis were collected from State Planning Commission, Tamilnadu, Tamilnadu
Economic Appraisals, Tamilnadu Census Reports, Statistical Handbooks, Tamilnadu.etc., The years
have been chosen to observe the decennial variation, which are reasonable time for frame for the
policy to get translated into actual plans and see its consequent impact on different indicators of
development .It was not possible to take back exercise, because insufficient data on all selected
variables, for which certain adjustments had to be made. In case of 2009-10 and up- to date data on
some selected variables are not available and also certain newly created districts were not
availability (i.e. Ariyalur and Tiruppur). And also this study has been expelled purely urban district
(e.i., Chennai). This paper is confined to 29 districts out of 32 districts and excludes some above
specified districts.
To determine the level of industrial development in Tamilnadu, we have 4 indicators used for
the analysis are given below
a. Number of Small Scale Industries per lakh population
b. Number of Working factories per lakh population
c. Number of Workers in working factories
d. Percentage share of Industrial sector to DDP
Method of Estimation of Composite index of development
The various steps involved in the computation of composite index of development are
presented below; Let [ ]Xij be the data matrix giving the values of the variables of the i-th district
i=1.2.3…n (Number of districts) and j-th indicators=1.2.3...k (number of indicators).For combined
analysis is transformed to [ ]Zij as follows:
[ ]Zij = Xij - X j
Sj
Where
Xj= mean of the jth indicator
Sj=Standard deviation of jth indicator
[ ]Zij is the matrix of standardized indicators.
From [ ]Zij identify the best value of each indicator. Let it be denoted as Zoj. The best value will
be either the maximum value or minimum value of the indicator depending upon the direction of
the indicator on the level of development. For obtaining the pattern of development Ci of ith district,
first calculate Pij as follows:
Pij= ( )Zij - Zoj 2
Pattern of development is given by

Vol. 5 Special Issue 3 August 2017 ISSN: 2320-4168
38 Shanlax International Journal of Commerce
C1 = j=1
kPij
( )CV j
(CV) j= Coefficient of Variation in, Xij for jth indicator, Composite index of development is given by
C
CiDi
C = C + 3SDi
C = Mean of Cj
Sdi= Standard deviation of Ci
Smaller value of Di will indicate high level of development and higher value of Di will indicate
low level of development.
Table Composite index of Development for Industrial sector in Tamilnadu
Source: Author’s calculation
Results and Discussions
The result of composite index of
development reveals that inter-district
variations in industrial sector
development of Tamilnadu. It shown in
table 3.1 which has been clearly
pictured about the regional variations
of Tamilnadu. It may be observed from
the results of composite indices of
development that the industrial
development in 1997-98, the district of
Coimbatore was first ranked and the
district of Perambalur was taken
ranked last. The value of index varied
from 0.0 to 0.82 .In 2007-08, the
districts Coimbatore was ranked first
and the district of Perambalur was
ranked last. The composite indices
varied from 0.39 to 0.88.
Conclusion
This paper has examined the
regional disparity of industrial
development among the districts of
Tamilnadu for two benchmark years
(i.e.1997-98 and 2007-08). Wide
disparities have been observed from
the results of composite index of
development. While compared with inter-district level, the Coimbatore has a topper in respect of
selected variables because the district having more industrial sector with SSIs. The district of
Perambalur has last rank in selected variables. The decennial impact of some districts have good
Districts 1997-98 2007-08
Index value
Rank Index value
Rank
Coimbatore 0 1 0.39608 1 Cuddalore 0.71935 16 0.77495 16 Dharmapuri 0.68759 14 0.73133 13 Dindugul 0.68551 12 0.73165 14 Erode 0.55828 6 0.57396 6 Kancheepuram 0.46914 3 0.47643 3 Kanniyakumari 0.67193 11 0.72684 12 Karur 0.76518 19 0.81108 19 Krishanagri NA NA 0.81207 20 Madurai 0.58413 8 0.60792 7 Nagapattinam 0.78304 24 0.8531 27 Namakkal 0.71194 15 0.7573 15 Perambalur 0.82311 28 0.88369 29 Pudukottai 0.74468 17 0.79296 17 Ramanathapuram 0.79068 26 0.84089 23 Salem 0.50298 4 0.53797 5 Sivagangai 0.76656 20 0.80991 18 Thanjavur 0.7642 18 0.81764 21 The Nilgris 0.77448 21 0.84582 25 Theni 0.77857 22 0.8402 22 Tirunelveli 0.68597 13 0.67579 9 Thiruvallur 0.55106 5 0.47109 2 Thiruvannamalai 0.77925 23 0.84702 26 Thiruvarur 0.79639 27 0.87875 28 Thoothukudi 0.59966 9 0.71132 11 Thiruchirappalli 0.64252 10 0.67682 10 Vellore 0.57231 7 0.61709 8 Villupuram 0.7856 25 0.84305 24 Virudhunagar 0.38005 2 0.47694 4

International Conference on INDIA 2030
39 Manonmaniam Sundaranar University, Tirunelveli
changes their pattern of industrial development, but some districts have same position (i.e., very
backward) in industrial development that are Ramanathapuram, Sivagangai, Nilgris,
Thiruvannamalai and Thiruvarur etc. From the results of composite index analysis have clear
pictured that the inter district variations in levels of industrial development. Therefore, government
and other development agencies have to concentrate on backward districts for make appropriate
plans for reduce the variations in industrial development of Tamilnadu.
Reference
1. Arief, S. (1982). Regional disparities in Malaysia. Social Indicators Research, 11(3), 259–267.
2. Bhatia, B. K. & Rai, S. C. (2004). Evaluation of socio-economic development in small areas. Project
Report, Planning Commission, Government of India, New Delhi.
http://planningcommission.nic.in/reports/sereport/ser/std_smlarea.pdf.
3. Choudhury, U. D. R. (1992). Inter-state and intra-state variations in economic development and
standard of living. Economic and Political Weekly, 27(49/50), 2651–2655.
http://www.jstor.org/stable/4399214.
4. Dasgupta, B. (1971). Socio-economic classification of districts: a statistical approach. Economic
and Political Weekly, 6(33), 1763–1774.http://www.jstor.org/stable/4382379.
5. Drewnowski, J. (1972). Social indicators and welfare measurement: remarks on methodology.
The Journal of Development Studies, 8(3), 77–90.

Vol. 5 Special Issue 3 August 2017 ISSN: 2320-4168
40 Shanlax International Journal of Commerce
A METHOD OF STUDYING THE OOCYTE COLLECTION TO IMPROVE
THE PROLIFICACY OF CAPRINE
Dr. M. Sundara Vinayaki
Assistant Professor, Department of Veterinary Physiology and Biochemistry,
Veterinary College and Research Institute, Tirunelveli
Abstract Livestock has been an important source of livelihood for small farmers. They contributed about 16% to their income, India’s livestock sector is one of the largest in the world. Animal husbandry is an integral component of Indian Agriculture. Goats contribute significantly to the Indian economy by sustaining livelihood and supplementing income of small farmers and rural poor’s. The share of goats to the total milk yield and meat production of India was recorded as 3.82% and 69.35%, respectively. Goat farming offers immense opportunities and potential for generating income and employment to land less, resource poor’s in state. Keeping in view, a study was conducted to improve the goat production by IVF method efficiency of Oocyte collection by aspiration method was assessed. A sum of 980 caprine ovaries were collected from local abattoir and used for the present study. Out of these ovaries a total of 3243 oocytes were collected. Out of which 2254 culturable oocytes were selected under stereomicroscope. The total number of oocytes and culturable oocytes recovered per ovary were 3.2 and 2.4 respectively 30%of the total population comprised fully and partially denuded oocytes which were not used. Aspitation yielded significantly higher number of Oocytes per ovary.It was found that aspiration method also used for collection oocytes form ovaries. Key words: caprine, oocytes, stereomicroscope, Aspirarion
Introduction
Embryo production in both invivo and in vitro methods can make increased assurance in
recreating life without any major loss of time.E.T is an area of reproductive physiology which has
excited the imagination of researchers,farmers and public alike because of its exiting multiple
applications in world animal production .In case of goat ,higher number of embryos could be
I.V.M.F.C.But large number of oocytes are required for I.V.M.F.C.Therefore success of these
techniques in goat production depends on the continuous supply of the quality oocytes in optimum
quantity.Surgical or laparoscopic methods are very expensive and also recovered per ovary is very
small.So this study was undertaken to indentify the Yield and quality of caprine Oocytes by using
aspiration method
Materials and methods
Collections of Ovaries: Ovaries from matured goats were collected from local abattoir in Sterile
Normal Saline solution (NSS 0.85%) supplemented with antibiotics (penicillin100 IU/ml,
streptomycin 50µg/ml) and antimycotics (Amphotericin 2.5mg/L) at 30-35Cْ in an isothermic
container and transported to laboratory within 2 h of slaughter.
Oocyte collections: Oocytes isolated from follicular fluid graded and thawed as per the technique
of Taru et al. (1996). The surrounding tissues were trimmed off and the ovaries were washed
several times with sterile NSS. The ovaries were than exposed to 70% ethyl alcohol for 30 seconds
and finally washed in m DPBS. Oocytes from surface follicle (>4mm) of goat ovaries were collected
by puncturing the follicles with 18 gauge needle in a petridish containing OCM. Morphologically
culturable oocytes i.e. those having compact, multilayered cumulus oocyte complexes (COCs) and
evenly granulated cytoplasm were selected under a stereomicroscope (Bausch and Lomb ) and
transferred to another petridish containing OCM followed by 5 washings in oocyte washing media
and finally washing in maturations medium

International Conference on INDIA 2030
41 Manonmaniam Sundaranar University, Tirunelveli
Result
A sum of 980 caprine ovaries were collected from local abattoir and used for the present study.
Out of these ovaries a total of 3243 oocytes were collected. Out of which 2254 culturable oocytes
were selected under stereomicroscope. The total number of oocytes and culturable oocytes
recovered per ovary were 3.2 and 2.4 respectively (Table 1, Fig 1). 30%of the total population
comprised fully and partially denuded oocytes which were not included in this study.
Table 1: Number of harvested and culturable oocytes obtained from caprine ovaries
Total number of ovaries Total number of oocytes harvested Total number of culturable
Oocytes recovered
980 3243 2254
Number of oocytes/ovary: 3.2
Number of culturable oocytes/ovary: 2.4
Fig 1 Culturable quality oocytes with compact cumulus granulose cells
(CGS) distinct zona pellucida ( ZP) and very evenly granulated ooplasm
Discussion
Yield of culturable quality oocytes was highest
with aspiration.This finding is in agreement with the
results of Vijayakumaran (1995), Kharche et al, (2006)
and Wang et al, (2007),Pawshe et al . (1994) obtained a
comparatively lower percentage of culturable oocytes
by puncture than the present study. But by sliciding
method low yield may be due to the damage caused by
the blade. Many factors have been found to affect the
yield and quality of oocytes viz, breed, season, time
interval from collection of ovaries to oocyte harvest,
temperature of media for transport of ovaries,retrieval technique and the criteria used for
classification Rahman et al.( 2008)This study revealed that yield of culturable quality oocytes was
significantly higher by aspiration method so this aspiration method may be used for I.V.M.F.C
techniques for collecting oocytes.
Conclusion
It could be concluded from the present study that yield of culturable quality oocytes was
significantly higher by aspiration method so this aspiration method may be used for I.V.M.F.C
techniques for collecting oocytes in caprines.
References
1. Pawshe, C.H., Totey,S.M. and Jain,S.K. 1994.A comparison of three methods of recovery of goat
oocytes for in vitro maturation and fertilization.Theriogenology.42:117-125
2. Vijayakumaran,V.1995.Effect of follicular size on in vitro maturation of goat oocytes.Ph.D.,
thesis.Tamil Nadu Veterinary and animal Sciences University,Madras, P.185
3. Sharma,G.T.Majumdar, A.C and Bonde,S.W. (1996).Chronology of maturational events in goat
oocytes cultured in vitro.Small Ruminant Research 22:25-30

Vol. 5 Special Issue 3 August 2017 ISSN: 2320-4168
42 Shanlax International Journal of Commerce
A STUDY ON IMPACT OF FOREIGN DIRECT INVESTMENT ON RETAIL SECTOR
IN TIRUNELVELI DISTRICT
Dr. A. Mahalingam
Assistant Professor of Commerce, M.S. University College, Panagudi, Tirunelveli District
Abstract Retailing is one of the largest sectors in India and one of the biggest sources of employment in the country. Though India is one among the largest Asian economies to liberalize its retail sector, a number of Indian retailers are entering this arena. Retailing involves the set of business activities that adds value to the products and services sold to the final consumers for their personal, family or household use. Retailers play a major role in the distributing system by helping manufacturers to reach out to the customers and at the same time, offering an array of value added services like breaking bulk, providing assortment holding inventory and providing information to their customers. The main aim of the study are to analyze the present trends in retail industry, study the impact of FDI in retailing and analyse the perception of retailers on the new FDI policy in retailing. This study has been done in two parts. In part 1 secondary data has been used from different studies, research papers, journals and websites and the second part consists of the experience survey of 260 retailers in Tirunelveli District. Convenience sampling method was used in this study. After analyzing retail Industry, it is concluded that the organized retail trading has opportunities to grow up in spite of the Foreign Direct Investment because of the economic growth of the country. Many retailers are facing financial, as well as non-financial problems. There is a serious problem in respect of their financial resources. Majority of the retailers suffering from lack of funds for investment. However Tirunelveli District retail market has a bright future to spread out their business in all corners by satisfying the needs of customers. Keywords: Foreign Direct Investment, Retailers, Retail Market and Perception
Introduction
Retail consists of the sale of physical goods or merchandise from a fixed location, such as a
department store, boutique or kiosk, or by mall, in small or individual lots for direct consumption
by the purchaser. Retailing may include subordinated services, such as delivery. Purchasers may be
individuals or businesses. In commerce, a "retailer" buys goods or products in large quantities from
manufacturers or importers, either directly or through a wholesaler, and then sells smaller
quantities to the end-user. After farming, retailing is India‘s major occupation. It employs 40 million
people. A sizeable majority of owner/employees are in the business because of lack of other
opportunities. The decade of liberalisation has so far been one of jobless growth. It is no wonder
that retail has become there fuge of these millions. Lopsided economic development is transforming
India from an agrarian economy directly to a service oriented post-industrial society. Even though
organized retail sector in India is at the infant stage, India has today become a budding target for
FDI. India today offers the most persuasive investment opportunity for mass merchants and food
retailers looking to expand overseas as Indian economy is growing at a rapid pace with consumers
having high purchasing power. With a robust economy experiencing unrelenting growth, India has
exerted a pull and an irresistible enticement to companies looking to expand their scope of
operations. FDI is a sturdy source for the intensification of retailing and will create enormous
opportunities for innovation in retail sector in India but at the same time it is quite likely that a
section of the domestic retailing industry will be severely hurt due to the entry of foreign retailers.
In this paper researchers have tried to accentuate both the thoughts in detail and concluded the
most constructive view on FDI in Indian retailing.

International Conference on INDIA 2030
43 Manonmaniam Sundaranar University, Tirunelveli
Objectives
To analyze the present trends in retail industry.
To study the impact of FDI in retailing.
To analyse the Perception of retailers on the new FDI policy in retailing
Foreign Direct Investment - Impact and Analysis
Market liberalization, a growing middle-class, and increasingly assertive consumers are sowing
the seeds for a retail transformation that will bring more Indian and multinational players on the
scene. The big Indian retail players looking to expand their operations include Shopper's Stop,
Pantaloon, Lifestyle, Subhiksha, Food World, Vivek's, Nilgiris, Ebony, Crosswords, Globus, Barista,
Qwiky's, Café Coffee Day, Wills Lifestyle, Raymond, Titan, Bata and Westside. Well established
business houses such as Wadia, Godrej, Tata, Hero, Malhotras, etc., are drawing up plans to enter
the fast-growing organized retail market in India. According to reports, Reliance Industries Ltd
plans to enter the retail business in a big way and has identified 18 cities, starting with Ahmadabad,
to set up malls. It will spend Rs 30-50 crore on each mall, which are to be modelled after those in
Dubai and East Asia. The international players currently in India include McDonald's, Pizza Hut,
Dominos, Levis, Lee, Nike, Adidas, TGIF, Benetton, Swarovski, Sony, Sharp, Kodak, and the Medicine
Shoppe. Global players are entering India indirectly, via the licensee/franchisee route, since Foreign
Direct Investment (FDI) is not allowed in the sector. Despite all these developments, the organized
retail business still comprises a small proportion of the total size of the Rs 9,00,00-crore ($200
billion) retail sector. Retail business growing at 5-6 per cent per annum. The size of organized
retailing was estimated around Rs.26,000 crore in 2004, about three per cent of the total. However,
it is now set to grow at 25-30 per cent per annum. In developed countries, organized retailing
makes for over 70 per cent of the total business. Recently, the Government announced its intention
to open up the retail sector to foreign investment. It is still, however, debating whether to allow 26
per cent or 49 per cent FDI in the sector.
Methodology
This study has been done in two parts. In part 1 secondary data has been used from different
studies, research papers, journals and websites and the second part consists of the experience
survey of 260 retailers in Tirunelveli District. Convenience sampling method was used in this study.
Analysis and Interpretation
Table 1 Ranking of Opinion on Advantages of FDI in Retail Sector
Sl. No Advantages of FDI Total Score Average Score Rank
1. All Product in One Place 15925 61.25 I
2. Availability of Branded Items 8369 32.19 V
3. Quality Product 13679 52.61 II
4. Price 11526 44.33 III
5. Provide Employment Opportunities 10028 38.57 IV
Source: Primary data
Table 1 shows that majority of the sample retailers had given the first rank to all product in one
place as the most advantages of FDI in retail sector. The table further shows that the sample
retailers had given second rank to quality product. The table reveals that the sample retailers had
given the third rank to Price. It is further clear from the table that the sample retailers had given the
last rank to availability of branded items.

Vol. 5 Special Issue 3 August 2017 ISSN: 2320-4168
44 Shanlax International Journal of Commerce
Table 2 Ranking of Opinion on Disadvantages of FDI in Retail Sector
Sl. No Disadvantages of FDI Total Score Average Score Rank
1. Against of Swadeshi Policy 17009 65.42 I
2. Discourage of Domestic Products 16112 61.97 II
3. High Penetration is Possible 14134 54.36 III
4. Cultural Change 11762 45.24 IV
Source: Primary data
Table 2 shows that majority of the sample retailers had given the first rank to against of
Swadeshi policy as the most disadvantages of FDI in retail sector. The table further shows that the
sample retailers had given second rank to discourage of domestic products. The table reveals that
the sample retailers had given the third rank to high penetration is possible. It is further clear from
the table that the sample retailers had given the last rank to cultural change.
Table 3 Aware about Foreign Direct Investment
Source: Primary data
Table 3 shows that 52.3 per
cent of the retailers aware about
foreign direct investment and 47.7
per cent of the retailers not aware
about foreign direct investment.
Table 4 Source through which know more details about Foreign Direct Investment
Source: Primary data
Table 4 shows that majority of 33.1 per cent of the retailers know about foreign direct investment through TV, 26.5 per cent of the retailers know about foreign direct investment through internet, 20.8 per cent of the retailers know about foreign
direct investment through Newspaper/Magazines and 19.6 per cent of the retailers know about foreign direct investment through discussion with others. Table 5 Experienced any impact on the current business
Source: Primary data Table 5 shows that 82.7 per cent of
the retailers have experienced impact on
the current business and 17.8 per cent of
the retailers have not experienced any
impact on the current business.
Table 6 FDI in retail will increase job opportunity
Source: Primary data Table 6 clearly reveals that
65.8 per cent of the retailers said
that FDI in retail will not increase
job opportunity and 34.2 per cent
of the retailers mentioned that FDI
in retail will increase job opportunity.
Sl. No Aware about Foreign
Direct Investment
No. of
Respondents Percentage
1. Yes 136 52.3
2. No 124 47.7
Total 260 100
Sl. No Sources No. of
Respondents
Percentage
1. Newspaper/Magazines 54 20.8
2. TV 86 33.1
3. Internet 69 26.5
4. Discussion with Others 51 19.6
Total 260 100
Sl. No Experienced any impact on the current business
No. of Respondents
Percentage
1. Yes 215 82.7 2. No 35 17.3 Total 260 100
Sl. No FDI in retail will increase job
opportunity No. of
Respondents Percentage
1. Yes 89 34.2 2. No 171 65.8 Total 260 100

International Conference on INDIA 2030
45 Manonmaniam Sundaranar University, Tirunelveli
Table 7 FDI in retail will increase standard of living
Source: Primary data Table 7 shows that 70 per cent of the retailers said that FDI in retail will not increase the standard of living and 30 per cent of the retailers mentioned that FDI in retail will increase the standard of living.
Perceptions of Retailers on the new FDI policy in Retailing based on gender
An attempt was made to know the perception of retailers on the new FDI policy in retailing
based on gender group such as male and female. To test the perception of retailers on the new FDI
policy in retailing based on gender, the following null hypothesis was proposed.
H0 : There is no significant difference in perception on the new FDI policy in retailing
among different gender group of retailers in Tirunelveli District.
The details of the result of Mann-Whitney U test is illustrated in Table 8.
Table 8 Mann-Whitney U Test: Perception on the new FDI policy in retailing among different
gender group of retailers
Particulars U-value Z-
value p-
value Mean rank
Male Female Supermarket has cheaper priced products 3321.000 -0.848 0.397 131.93 120.28 Supermarket customers are different than other outlets 3318.000 -0.861 0.397 131.95 120.19 Supermarket would bring more customers in the area 3540.000 -0.287 0.389 130.97 127.13 Supermarket has problems because of the presence of big retailers
3358.500 -0.774 0.774 129.23 139.55
Average expenditure of my customer would decrease because of Big retailers
3432.500 -0.562 0.439 129.55 137.23
My customers would increase with the presence of Big store
3548.000 -0.259 0.574 130.94 127.39
My supermarket has different attraction than Big store 3323.500 -0.837 0.796 131.92 120.36 My regular customers would still be here 3374.500 -0.714 0.475 129.30 139.05 Big store affects my sales 3620.000 -0.081 0.935 130.38 131.38 Smaller retailers have own strategy to attract customers 3095.000 -1.435 0.151 132.93 113.20 Oppose the FDI in multi-brand retail in India 3296.500 -0.912 0.362 132.04 119.52
Source: Primary data
The null hypothesis (H0) is retained at the 5% level of significance with regard to perception on
the new FDI policy in retailing such as supermarket has cheaper priced products, supermarket
customers are different than other outlets, supermarket would bring more customers in the area,
supermarket has problems because of the presence of big retailers, average expenditure of my
customer would decrease because of big retailers, my customers would increase with the presence
of big store, my supermarket has different attraction than big store, my regular customers would
still be here, big store affects my sales, smaller retailers have own strategy to attract customers and
oppose the FDI in multi-brand retail in India due to the p value is more than 0.05. It shows that
gender wise there is no significant difference in perception on the new FDI policy in retailing such
as supermarket has cheaper priced products, supermarket customers are different than other
outlets, supermarket would bring more customers in the area, supermarket has problems because
of the presence of big retailers, average expenditure of my customer would decrease because of big
Sl. No FDI in retail will increase
standard of living
No. of
Respondents Percentage
1. Yes 78 30.0
2. No 182 70.0
Total 260 100

Vol. 5 Special Issue 3 August 2017 ISSN: 2320-4168
46 Shanlax International Journal of Commerce
retailers, my customers would increase with the presence of big store, my supermarket has
different attraction than big store, my regular customers would still be here, big store affects my
sales, smaller retailers have own strategy to attract customers and oppose the FDI in multi-brand
retail in India among retailers in Tirunelveli District.
Perceptions of Retailers on the new FDI policy in Retailing based on age
An attempt was made to know the perceptions of retailers on the new FDI policy in retailing
based on age. The age of the retailers was classified as below 25 years, 26 to 35 years, 36 to 45
years, 46 to 55 years and above 55 years. To test the perceptions of retailers on the new FDI policy
in retailing based on age, the following null hypothesis was proposed.
H0 : There is no significant difference in perception on the new FDI policy in retailing
among different age group of retailers in Tirunelveli District.
The details of the result of Kruskal-Wallis test is reported in Table 9.
Table 9 Kruskal-Wallis Test: Perceptions of Retailers on the new FDI policy in Retailing
based on age
Perceptions Chi-
Square χ2
p value
Mean Rank Below
25 26-35 36-45 46-55
Above 55
Supermarket has cheaper priced products
6.988 0.137 161.50 145.12 129.59 127.06 109.62
Supermarket customers are different than other outlets
7.651 0.133 137.75 148.54 122.81 133.03 114.23
Supermarket would bring more customers in the area
6.470 0.167 146.50 127.53 121.50 129.83 154.88
Supermarket has problems because of the presence of big retailers
4.792 0.309 138.17 145.98 126.52 128.06 117.42
Average expenditure of my customer would decrease because of Big retailers
7.549 0.110 134.67 115.98 129.63 129.85 156.36
My customers would increase with the presence of Big store
0.453 0.978 147.08 128.25 129.35 131.26 133.09
My supermarket has different attraction than Big store
5.353 0.253 167.83 116.07 135.17 127.70 141.54
My regular customers would still be here
28.845 0.000 115.58 159.72 120.77 144.40 86.55
Big store affects my sales 7.371 0.118 138.42 145.39 132.54 123.01 112.18 Smaller retailers have own strategy to attract customers
4.295 0.368 164.42 116.55 131.86 134.54 138.33
Oppose the FDI in multi-brand retail in India
1.867 0.760 134.50 136.52 131.71 130.88 116.76
Source: Derived data
The table discloses that the null hypothesis (H0) is rejected at the 5% level of significance with
regard to the perceptions on the new FDI policy in retailing such as my regular customers would
still be here due to the p value is less than 0.05. It shows that age wise there is a significant
difference in perceptions on the new FDI policy in retailing such as my regular customers would
still be here among retailers in Tirunelveli District. The null hypothesis (H0) is retained at the 5%
level of significance with regard to the perceptions on the new FDI policy in retailing such as
supermarket has cheaper priced products, supermarket customers are different than other outlets,
supermarket would bring more customers in the area, supermarket has problems because of the
presence of big retailers, average expenditure of my customer would decrease because of big

International Conference on INDIA 2030
47 Manonmaniam Sundaranar University, Tirunelveli
retailers, my customers would increase with the presence of big store, my supermarket has
different attraction than big store, big store affects my sales, smaller retailers have own strategy to
attract customers and oppose the FDI in multi-brand retail in India due to the p value is more than
0.05. It shows that age wise there is no significant difference in perceptions on the new FDI policy in
retailing such as supermarket has cheaper priced products, supermarket customers are different
than other outlets, supermarket would bring more customers in the area, supermarket has
problems because of the presence of big retailers, average expenditure of my customer would
decrease because of big retailers, my customers would increase with the presence of big store, my
supermarket has different attraction than big store, big store affects my sales, smaller retailers have
own strategy to attract customers and oppose the FDI in multi-brand retail in India.
Suggestions
The retailers will have to invest time and resources in continuous improvement of service
standards and product assortment keeping in view the speedily evolving consumer dynamics.
Margin should be increased to the retailers in order to increase the sales.
Sales promotion schemes should be introduced to the retailers and customers at frequent
intervals.
Television advertisements are one of the strongest media to influence the prospective
customers. Hence, the retailers should concentrate more on TV advertisements.
More schemes are expected by the retailer’s like-displays and discounts.
The retailer should introduce more varieties.
Fragrance may be changed pleasantly to attract more customers.
The retail malls should maintain broad product line to minimize regional difference. All
categories of people should be in a position to get their required goods or products. The malls
are to be maintained in such a way that they are not associated or meant for one or two
segments of the people in the city.
Conclusion
Retailing is one of the largest sectors in India and one of the biggest sources of employment in
the country. Though India is one among the largest Asian economies to liberalize its retail sector, a
number of Indian retailers are entering this arena. Retailing involves the set of business activities
that adds value to the products and services sold to the final consumers for their personal, family or
household use. Retailers play a major role in the distributing system by helping manufacturers to
reach out to the customers and at the same time, offering an array of value added services like
breaking bulk, providing assortment holding inventory and providing information to their
customers. Though with excellent potential, Tirunelveli District poses a complex situation for
retailers, as this is a state where each region is a mini-district by itself. The demographics of a
region vary quite distinctly from others. In order to reach all classes of society in Tirunelveli
District, organized retail formats should design a comprehensive and prospective business model
which offers the quality products/services at affordable price and generate more socially balanced
business. After analyzing retail Industry, it is concluded that the organized retail trading has
opportunities to grow up in spite of the Foreign Direct Investment because of the economic growth
of the country. Many retailers are facing financial, as well as non-financial problems. There is a
serious problem in respect of their financial resources. Majority of the retailers suffering from lack
of funds for investment. However Tirunelveli District retail market has a bright future to spread out
their business in all corners by satisfying the needs of customers.

Vol. 5 Special Issue 3 August 2017 ISSN: 2320-4168
48 Shanlax International Journal of Commerce
References
1. Gowda (2014), “FDI in Multibrand Retailing In India – A SWOT Analysis”, International Journal
of Marketing, Financial Services & Management Research, Vol.3, No.1.
2. Fernande et Al., (2012), “FDI in Multi-brand Retail: Issues and Implications on Indian Economy”,
Pacific Business Review International, Volume 5, Issue 5.
3. Vaidehi and Alekhya (2012), “role of FDI in Retailing”, Asia Pacific Journal of Marketing &
Management Review, Vol.1, No. 2.
4. Jain (2013), “FDI in Multi-brand Retailing In India: Comparative Study with China”,
International Journal of Management & Information Technology, Volume 3, No 1.

International Conference on INDIA 2030
49 Manonmaniam Sundaranar University, Tirunelveli
AGRICULTURE TRANSFORMATION IN INDIA
S. Parasuraman
Research Scholar (FT), PG & Research Department of Commerce,
Sri Vijay Vidalaya College of Arts & Science, Dharmapuri, Periyar University, Tamil Nadu, India
Dr. N. Sathiya
Assistant Professor, PG & Research Department of Commerce,
Sri Vijay Vidalaya College of Arts & Science, Dharmapuri, Periyar University, Tamil Nadu, India
Abstract Agriculture is the backbone of Indian Economy. About 65% of Indian population depends directly on agriculture and it accounts for around 22% of GDP. Agriculture derives its importance from the fact that it has vital supply and demand links with the manufacturing sector. During the past five years agriculture sector has witnessed spectacular advances in the production and productivity of food grains, oilseeds, commercial crops, fruits, vegetables, food grains, poultry and dairy. India has emerged as the second largest producer of fruits and vegetables in the world in addition to being the largest overseas exporter of cashews and spices. Further, India is the highest producer of milk in the world.India has to go a long way to accelerate the vegetable production, considering the national and international demand. There is a need to achieve the target of 225 million tonnes by the end of 2020 and 350 million tonnes by 2030. Introduction
The transformation of the Indian agricultural sector has been driven by several factors, in many
instances similar to experience worldwide. These include supply side factors such as policies to
push growth, better and efficient use of resources like land and labour; introduction of new
technology and increased use of modern inputs like chemical fertilisers and expansion of irrigation
infrastructure; and, investments in general infrastructure like roads, power as well as demand side
factors such as population, income growth, urbanisation, and demand from the rest of the world
through gradual liberalisation of international trade. The specific roles played by these factors have
varied during the three phases discussed above.
Early Phase I: From 1952-53 to 1972-73
The first phase of transformation of Indian agriculture was mainly driven by the need to achieve
self-sufficiency in food grains as India was importing a large quantity of cereals, in particular to
meet domestic shortages. The area under irrigation was low and there were frequent droughts and
the prime objective at that time was to make adequate food supplies available to the increasing
population and ensuring provision of raw materials for the expansion of industrial sector. This was
sought to be achieved by way of imports, reorganisation of the agricultural sector, and a series of
development measures encompassing expansion of irrigation and extensive as well as intensive
farming. These initiatives were given further boost by strengthening agricultural administration
and kicking off special area programmes.
The advent of new high yielding varieties ushered in Green Revolution, which in combination
with expansion in area under cultivation and usage of chemical fertilisers increased the output of
cereals mainly – wheat and rice followed by other coarse cereals such as maize to a certain extent.
Thus a combination of technological development, significant investments as well as support by the
government led to a significant increase in production of cereals in particular.

Vol. 5 Special Issue 3 August 2017 ISSN: 2320-4168
50 Shanlax International Journal of Commerce
Table 1: Agricultural Transformation: Supply side
The gross cropped area during the
Phase-I of transformation expanded by
22 percent from 134.3 million hectares
to 164.4 million hectares and gross
irrigated area during the same period
increased from 23 million hectares to
39 million hectares, which is an
increase of 50 percent (Table 1). These
developments were coupled with a
massive 33 times increase in the usage
of fertilisers between TE 1952- 53 and TE 1972-73. There was also a significant increase in the road
network in the country and electricity generation also expanded considerably. All this was made
possible by a large 113 percent increase in investment in the agricultural and allied sectors, mainly
in public sector because public sector investment in the early 1960s accounted for roughly half the
share in total investment. As a result, supplies of cereals and other commodities such as fruits and
vegetables increased significantly.
Table 2: Agriculture Transformation: Demand side
On the demand side, during
Phase-I it was mainly the
population growth, which added
189 million persons to the
population that existed in early
1950s (Table 2). There was only
a marginal shift in urbanisation
as the share of rural population
in total population decreased
marginally from 83 percent in
the early 1950s to 1980. The per
capita income also expanded at a comparatively slower rate during this period and there was little
in terms of foreign demand because India was only a marginal player in international trade.
Figure 1: Growth of Per capita Consumption Expenditure (Percent)

International Conference on INDIA 2030
51 Manonmaniam Sundaranar University, Tirunelveli
Figure 2: Contribution to Growth in Food Consumption Basket (Percent)
Among the items in food basket, per capita consumption expenditure at constant prices on
cereals, fruits and vegetables, edible oils, and sugar witnessed significant increase, however,
expenditure on two livestock items milk and milk products and eggs, meat, and fish declined during
Phase-I (Figure 1). The bulk of the expansion in food basket during this phase was accounted for by
just two groups - cereals and fruits and vegetables (Figure 2). And, decline in the prominence of the
forestry sector is also mainly the consequence of rapid growth in the contribution of cereals and
fruits and vegetables.
Phase II: From 1972-73 to 1992-93
The second phase of transformation witnessed a play of a combination of expansion of the
Green Revolution into new crops and areas and introduction of the White Revolution, which laid the
foundations for consolidation of gains made due to the introduction of the Green Revolution in
Phase I and enormous growth of milk production in the country in Phase II. The early phase of
green revolution was largely associated with the spread of new technology to better endowed
regions, therefore, special efforts were then made to spread new technology into those regions,
which had remained outside the fold of technological revolution. Consequently, special programmes
were launched during late 1970s and mid- 1980s. The gross cropped area during this phase of
transformation expanded by just about 12 percent from 164 million hectares to 185 million
hectares, but gross irrigated area during this period continued the growth momentum witnessed in
Phase I and added 27 million hectares to 39 million hectares of irrigation capacity that existed in
the early 1950s. The other factors such as use of fertilisers, road network, and electricity generation
also expanded significantly though at a much slower pace than what was observed in the Phase I.
The investment in the agricultural and allied sectors also maintained its pace and increased by 96
percent between TE 1972-73 and TE 1992-93.
As per the capita income grew at a higher rate during this phase the consumption expenditure
at constant prices on food items such as milk and milk products and meat products (eggs, meat, and
fish), and fruits and vegetables increased (Figure 1) and a substantive part of growth in the food
basket was, therefore, contributed by these three broad groups (Figure 2). The contribution of
cereals was much less in comparison to both milk and milk products and fruits and vegetables and
also in comparison to the contribution made by cereals in Phase I.
Phase III: From 1992-93 to 2012-13
In the most recent phase of transformation, Phase III between TE 1992-93 to TE 2012-13,
which witnessed the launching of economic reforms and liberalisation of the economy, there was a

Vol. 5 Special Issue 3 August 2017 ISSN: 2320-4168
52 Shanlax International Journal of Commerce
significant shift in the drivers of transformation from the supply side factors to the demand side
factors. Though there was a respectable growth in gross irrigated area, which increased from 65
million hectares to 87 million hectares, yet growth in the gross cropped area slowed down
considerably (Table 1). Similarly, the immense increase in the usage of fertilisers experienced in
Phases I and II also decelerated. Although there was an increase in the road network and electricity
generation and investment in the agricultural and allied sectors also expanded.8
But the supplies of all main commodities like cereals, oilseeds, and sugarcane did not show
much increase. The only exceptions were fruits and vegetables and cotton the supplies of which
increased significantly during this period. Similarly, supplies of livestock products - milk, eggs, and
meat maintained their growth momentum even during this phase. As the per capita income grew at
a much higher rate in comparison to the earlier two phases, for this reason the per capita
consumption expenditure on food items such as meat and meat products (eggs, meat, and fish),
dairy products, fruits and vegetables, and other food items increased significantly (Figure 1).
The main leading development of this phase was a decline in per capita consumption expenditure
on cereals. As a result, much like in Phase II the bulk of growth in food consumption basket came
from the contribution of fruits and vegetables, dairy products, and meat products (Figure 2). The
other significant development was the emergence of external demand with significant increase in
exports from agricultural and allied sector. While the share of the agricultural exports in total
export is low, but the country has emerged as a net exporter of a range of agricultural and allied
products.
Phase IV: From 2012-13 to 2030
India's per capita GDP is expected to increase by 320 percent in the next 20 years (from 2012
till 2030, calculated at 2000 prices). This rising affluence and the growing population is likely to
increase India's overall food consumption by 4 percent per annum to reach INR 23 lakh crore in
2030 from INR 11 lakh crore in 2010 (at 2010 prices). Per capita consumption is expected to
increase from INR 9,355 to INR 15,731 (an annual increase of 3 percent, at 2010 prices). This
represents a huge investment opportunity across the food chain. Urban India's food consumption
will grow by 5 percent, nearly twice as fast as its rural counterpart (2.5 percent). It will change from
being primarily driven by basic foods to more "high value foods" like fruits, vegetables and complex
proteins. This is in line with global trends seen in countries like China, Japan, Indonesia, and Brazil
as they transitioned into middle-income economies.
Given the expected rise in consumption, agricultural output (at farm gate prices) could grow
from INR 12.69 lakh crore in 2011 to INR 29.28 lakh crore by 2030. At the same time, processing
could grow from INR 1.1 lakh crore in 2011 to INR 5.65 lakh crore by 2030, while India's food
exports could grow from INR 1.4 lakh crore in 2011 to INR 7.72 lakh crore by 2030.
As an outcome of the agricultural produce, processing and export growth, the food and
agricultural sector could potentially grow at 5.2 to 5.7 percent (in real terms) over the next 20
years. With such improvements, in 20 years the country can aspire to improve farmer income by
over four times (real terms) to keep pace and reduce the gap with the national average income.
Consumers could also benefit from the increase in supply to match per capita consumption, and
access to safe and healthy food at affordable prices. The challenge for the industry and policy
makers is to give the consumer enough choice by making available a world class variety of food
products in the most convenient manner. They will have to overcome supply side barriers and
ensure seamless end-to-end linkages to realise the true demand potential.

International Conference on INDIA 2030
53 Manonmaniam Sundaranar University, Tirunelveli
Conclusion
To accomplish the vision of the India 2030 - it gives highest priority to farmers, and entire
strategy is based on ‘farmer first’. It is determined to continuously strive hard to transform the
existing agricultural system into a vibrant agricultural innovation system. It would concentrate on
the following key areas.
Promote innovations and improve human resource capacity by involving all stakeholders in the
food-supply chain.
Strengthen institutional capacity for attaining sustainable food, nutrition, and livelihood
security, and also for global competitiveness.
Act as a catalyst in reclaiming degraded resources for agriculture, and conserve and enhance
national wealth of natural resources and bio-diversity.
Promote adaptation and preparedness for meeting climate change challenge, and evolve
mechanisms for effective drought and flood management.
Foster repositories of genetic resources related to crop, livestock, fish, insects and micro-
organisms for their sustainable utilization.
Improve knowledge management system to act as an efficient clearing-house of technology,
knowledge and information in agriculture and allied sectors.
Facilitate quarantine, evolve mechanisms for sanitary and phytosanitary inspection of
germplasm under exchange for research, and perform other regulatory functions.
Develop and facilitate gradual replacement of pesticides, and execute mechanisms for bio-
security of the country, especially that emerging from threat of gene piracy and cross-border
vector-borne diseases.
Reform agricultural education and extension systems, and enhance human resource befitting
global competition.
Foster linkages and collaborations with public and private, national and international
organizations.

Vol. 5 Special Issue 3 August 2017 ISSN: 2320-4168
54 Shanlax International Journal of Commerce
A STUDY ON MARKETING OF TIMBER IN TIRUNELVELI DISTRICT
Dr.P. Nayagam, M.Com., M.Phil.,B.Ed.,Ph.D.,
Asst. Professor, (SF), Department of Commerce, P.M.T. College, Melaneelithanallur
Introduction
The inherent features which had placed Timber in the forefront of all the important raw
materials used were many and valid; but one of its important attributes was its availability in many
species, in many sizes, in various shapes and in varied condition to suit almost every type of
demand. It was naturally one of the aesthetically pleasing materials because of its grain patterns
and its varied colours and its appearance could be easily improved by strains lacquers and other
types of varied finishes. It could be easily shaped with the help of tools, fastened with the help
of adhesives, nails, screws and bolts. The inherent features which had placed Timber in the
forefront of all the important raw materials used were many and valid; but one of its important
attributes was its availability in many species, in many sizes, in various shapes and in varied
condition to suit almost every type of demand. It was naturally one of the aesthetically pleasing
materials because of its grain patterns and its varied colours and its appearance could be easily
improved by strains lacquers and other types of varied finishes. It could be easily shaped
with the help of tools, fastened with the help of adhesives, nails, screws and bolts.
Objectives of the Study
After reviewing the various studies pertaining to the Timber marketing and forest economy
the six specific objectives of the study had been framed for conducting the present study.
To study the Forest Resources and the Trends in the production, consumption, Imports and
Export of Timber products in India.
To know about the profile of the Timber Traders in the Tirunelveli District.
To make an Evaluation the Marketing of Timber in Tirunelveli District.
To make a comprehensive analysis of the Financial position and the growth of the Timber
within Tirunelveli District.
To identify the problems faced by the Timber Traders in Tirunelveli District and
To summarise the Findings and to offer suitable suggestions, for the successful marketing of
Timber in Tirunelveli District.
Hypothesis:
To study anime at testing the following hypotheses framed in tune with the objectives of the
study.
There is no relationship between the years of existence and the levels of growth of the
sample Timber units.
The form of organization and the levels of growth of the sample Timbers unit.
The ownership of the saw mills of the sample timber Traders and their levels of growth
The mode of commencement of the sample Timber units and their levels of growth.
The registration with the District industries centre by the sample Timber units and their
levels of growth.
There is no relationship, but the availing of the Financial Assistance by the sample Timber
units and their levels of growth.

International Conference on INDIA 2030
55 Manonmaniam Sundaranar University, Tirunelveli
Timber Trading in Tirunelveli District
Obviously ‘Timber Trading’ adds to our comfortable living. Comparatively speaking with other
districts in Tamilnadu, Timber Trading in Tirunelveli district finds in ‘good condition’ this district
comprises taluks like Alangulam, Ambasamudram, Nanguneri, Palayamkottai, Tirunelveli,
Radhapuram, Tenkasi, Senkottai, Sankarankovil, Sivagiri. Taking care of this district, Hon’ble Chief
Minister of Tamilnadu J. Jayalalithaa has recently announced three more new taluks –
Kadayanallur, Manur and Thiruvengadam for perfect administration.
Obviously there are 150 ‘Saw Mills’ and 300 ‘Without Saw Mill Merchants’ in this district.
But more ‘Saw Mill Merchants’ are in Senkottai and Tenkasi among the 13 taluks. Obviously the
need of woods and timber in this district is somehow fulfilled by the traders but it is not
sufficient due to the increasing population and hence the use and usage of ‘Timber’ is increasing
day by day. As to fulfill the needs, various kinds of woods are imported from the ‘domestic and
abroad’ by way of ‘Logs and Saw’ woods like ‘Merba’ and ‘Vietnam Bin Koda’ is imported as ‘Sawn
Size’ and the others are imported as ‘Logs’.
Sampling Designs
The Tirunelveli District had been selected for the study, since the Timber industry was
one of the dominant Industries in the District. In the study area, there were 76 Registered Timber
Traders who had been marketing different varieties of Timber and who had been catering to
the requirements of the present as well as the potential customers. There was no need for a
sampling design as the primary Data needed for the present study had been collected by the
Researcher from all the seventy six Traders were by making it a census study.
Tools of Analysis
The collected data, both primary and secondary, were put to a critical statistical examination,
with the help of the chosen Tools. The Tabular analysis, the percentage analysis, Chi-Square Test, T
test, Kruskal Wallis Test, Mann Whiteney Test, ANOVA and Garrett Ranking had been very widely
used in this study and inferences had been drawn from the results obtained.
Testing the Hypotheses
1. Motivating Factors Based on Nature of organization
An attempt was made to know the motivating factors based on nature of organization such as
sole trader and partnership. To test the motivating factors based on nature of organization, the
following null hypothesis was proposed.
H0 : There is no significant difference between nature of organization and motivating factors. The
non-parametric statistics of Mann-Whitney U test was used to analyse the motivating factors
based on nature of organisation and test the proposed null hypothesis. The details of the result of
Mann-Whitney U test is illustrated in table 1.
Table 1 Mann-Whitney U Test: Motivating Factors Based on Nature of organization
A Mann-Whitney U test
was run to determine if
there were differences in
motivating factors between
sole trader and partnership.
The table discloses that
among with sawmill and without sawmill merchants, the null hypothesis (H0) is rejected at the
5% level of significance with regard to the motivating factors due to the p value is less than 0.05.
It shows that nature of organization wise there is a significant difference in motivating factors.
Factors U-
value Z-
value p-
value
Mean rank
Sole trader
Partnership
With sawmill 766.500 -3.235 0.001 57.74 83.02
Without sawmill 966.000 -2.578 0.010 58.56 77.69

Vol. 5 Special Issue 3 August 2017 ISSN: 2320-4168
56 Shanlax International Journal of Commerce
2. Motivating factors based on Age
An attempt was made to know the motivating factors based on age. The age of the respondents
was classified as below 40 years, 41 to 50 years, 51 to 60 years and above 60 years. To test the
motivating factors based on age, the following null hypothesis was proposed.
H1: There is no significant difference in motivating factors among different age group of with
sawmill and without sawmill merchants in Tirunelveli district. The non-parametric statistics of
Kruskal-Wallis test was used to analyze the motivating factors based on age and test the
proposed null hypothesis. The details of the result of Kruskal-Wallis test is reported in table 2
Table 2 Kruskal-Wallis Test: Motivating factors based on Age
Loans Chi- Square χ
2 p value Mean Rank
Below 40 41 to 50 51 to 60 Above 60 With sawmill 17.461 0.001 36.94 60.77 75.81 83.40
Without sawmill 0.692 0.875 66.69 60.56 65.37 65.73
The table discloses that among with sawmill merchants, the null hypothesis (H0) is rejected at
the 5% level of significance with regard to the motivating factors due to the p value is less
than 0.05. It shows that age wise there is a significant difference in motivating factors.
The table further discloses that among without sawmill merchants, the null hypothesis
(H0) is retained at the 5% level of significance with regard to the motivating factors due to the
p value is more than 0.05. It shows that age wise there is no significant difference in
motivating factors.
3. Motivating factors based on Educational qualification
An attempt was made to know the motivating factors based on educational qualification. The
educational qualification of the respondents was classified as SSLC, HSC, Graduate, Post Graduate
and Professional. To test the motivating factors based on educational qualification, the following
null hypothesis was proposed.
H1: There is no significant difference in motivating factors among different educational
qualification of with sawmill and without sawmill merchants in Tirunelveli district.
The non-parametric statistics of Kruskal-Wallis test was used to analyze the motivating factors
based on educational qualification and test the proposed null hypothesis. The details of the
result of Kruskal-Wallis test is reported in table 3
Table 3 Kruskal-Wallis Test: Motivating factors based on Educational qualification
Loans Chi- Square χ
2 p value Mean Rank
SSLC HSC Graduate Post Graduate
Professional
With sawmill
57.970 0.000 67.37 32.97 42.35 79.55 96.40
Without sawmill
29.097 0.000 50.31 78.06 59.51 111.29 23.50
The table discloses that among with sawmill merchants and without sawmill merchants, the
null hypothesis (H0) is rejected at the 5% level of significance with regard to the motivating
factors due to the p value is less than 0.05. It shows that educational qualification wise there is a
significant difference in motivating factors among with sawmill and without sawmill merchants.

International Conference on INDIA 2030
57 Manonmaniam Sundaranar University, Tirunelveli
4. Motivating factors based on Previous Occupation
An attempt was made to know the motivating factors based on previous occupation.
The previous occupation of the respondents was classified as Government service, private
employee, business and professional. To test the motivating factors based on previous occupation,
the following null hypothesis was proposed.
H1: There is no significant difference in motivating factors among different previous
occupation of with sawmill and without sawmill merchants in Tirunelveli district. The non
parametric statistics of Kruskal-Wallis test was used to analyze the motivating factors based on
previous occupation and test the proposed null hypothesis. The details of the result of Kruskal-
Wallis test is reported in table 4
Table 4 Kruskal-Wallis Test: Motivating factors based on Previous Occupation
Loans Chi- Square
χ2
p value
Mean Rank
Govt. Service Pvt
employee Business Professional
With sawmill 31.038 0.000 40.46 54.73 61.63 100.88
Without sawmill
16.538 0.001 66.17 57.89 123.50 95.00
The table reveals that among with sawmill merchants and without sawmill merchants, the null
hypothesis (H0) is rejected at the 5% level of significance with regard to the motivating factors due
to the p value is less than 0.05. It shows that previous occupation wise there is a significant
difference in motivating factors among with sawmill merchants and without sawmill merchants.
5. Motivating factors based on Monthly income
An attempt was made to know the motivating factors based on monthly income.
The monthly income of the respondents was classified as Up to Rs.2,00,000, Rs.2,00,000 to
4,00,000, Rs.4,00,000 to 6,00,000, Rs.6,00,000 to 8,00,000, Rs.8,00,000 to 10,00,000 and
above Rs.8,00,000. To test the motivating factors based on monthly income, the following
null hypothesis was proposed.
H1 : There is no significant difference in motivating factors among different monthly income
of with sawmill and without sawmill merchants in Tirunelveli district.
The non-parametric statistics of Kruskal-Wallis test was used to analyze the motivating factors
based on monthly income and test the proposed null hypothesis. The details of the result of
Kruskal-Wallis test is reported in table 5.
Table 5 Kruskal-Wallis Test: Motivating factors based on Monthly income
Loans
Chi- Square
χ2
p value
Mean Rank
Up to Rs.2,00,000
Rs.2,00,000 to 4,00,000
Rs.4,00,000 to 6,00,000
Rs.6,00,000 to 8,00,000
Rs.8,00,000 to 10,00,000
above Rs.8,00,000
With Sawmill
13.44 0.020 44.07 49.97 73.50 75.21 74.65 58.06
Without Sawmill
1.898 0.755 - 57.67 64.21 63.83 68.23 70.61
The table discloses that among with sawmill merchants, the null hypothesis (H0) is rejected at
the 5% level of significance with regard to the motivating factors due to the p value is less
than 0.05. It shows that monthly income wise there is a significant difference in motivating factors
among with sawmill merchants. The table further discloses that among without sawmill
merchants, the null hypothesis

Vol. 5 Special Issue 3 August 2017 ISSN: 2320-4168
58 Shanlax International Journal of Commerce
(H0) is retained at the 5% level of significance with regard to the motivating factors due to
the p value is more than 0.05. It shows that monthly income wise there is no significant
difference in motivating factors among without sawmill merchants.
6. Motivating factors based on Community
An attempt was made to know the motivating factors based on community.
The community of the respondents was classified as backward class, MBC/DNC, Scheduled Caste
and Forward Community. To test the motivating factors based on age, the following null
hypothesis was proposed.
H1: There is no significant difference in motivating factors among different community of with
sawmill and without sawmill merchants in Tirunelveli district.
The non parametric statistics of Kruskal-Wallis test was used to analyze the motivating factors
based on community and test the proposed null hypothesis. The details of the result of Kruskal-
Wallis test is reported in table 6
Table 6 Kruskal - Wallis Test: Motivating factors based on Community
Loans Chi- Square
χ2 p value
Mean Rank
Backward class
MBC / DNC
Scheduled Caste
Forward Community
With sawmill 34.094 0.000 47.92 61.50 86.18 91.48
Without Sawmill 27.094 0.000 56.02 56.26 94.13 43.60
The table discloses that among with sawmill merchants and without sawmill merchants, the
null hypothesis (H0) is rejected at the 5% level of significance with regard to the motivating
factors due to the p value is less than 0.05. It shows that community wise there is a significant
difference in motivating factors among with sawmill merchants and without sawmill merchants.
7. Age and Reason for selecting timber trade
In order to study the relationship between reason for selecting timber trade and age groups,
‘ANOVA’ test is attempted with the null hypothesis as, “there is no significant difference in
reason for selecting timber trade among different age group of merchants in Tirunelveli district”.
The result of ‘ANOVA’ test for reason for selecting timber trade among different age group of
merchants is presented in table 7. Table 7 Reason for selecting timber trade among different age group of timber merchants- ANOVA
Particulars Age Sum of
Squares df
Mean Square
F P
Value
With Sawmill merchant
Between Groups 30.386 3 10.129 4.910 0.003
Within Groups 249.614 121 2.063
Total 280.000 124
Without
sawmill merchant
Between Groups 26.617 3 8.872 4.867 0.003
Within Groups 220.583 121 1.823
Total 247.200 124
Table discloses that among with sawmill and without sawmill merchants, the calculated ‘F’
value of reason for selecting timber trade among different age group of with sawmill and without
sawmill merchants are 4.910 and 4.867 which is significant at the ‘p’ value of
0.003 and 0.003. Since the respective ‘p’ value is less than 0.05, the null hypothesis is rejected.
Therefore, it may be concluded that there is a significant difference in reason for selecting timber

International Conference on INDIA 2030
59 Manonmaniam Sundaranar University, Tirunelveli
trade among different age group of with sawmill and without sawmill merchants in Tirunelveli
district.
8. Gender and Reason for selecting timber trade
In order to study the relationship between reason for selecting timber trade and gender
groups, ‘independent samples t’ test is attempted with the null hypothesis as, “there is no
significant difference in reason for selecting timber trade among different gender group of
merchants in Tirunelveli district”. The result of ‘independent samples t’ test for reason for
selecting timber trade among different gender group of merchants is presented in table 8
Table 8 Reason for selecting timber trade among different gender group of timber
merchants- Independent samples ‘t’ test
Particulars F Sig. t df Sig.
(2-tailed)
With sawmill merchant 8.809 0.004 -0.699 123 0.486
Table discloses that among with sawmill merchants, the calculated ‘F’ value of reason for
selecting timber trade among different gender group of with sawmill merchants is
8.809 which is significant at the ‘p’ value of 0.486. Since the respective ‘p’ value is higher than
0.05, the null hypothesis is accepted. Therefore, it may be concluded that there is no significant
difference in reason for selecting timber trade among different gender group of with sawmill
merchants in Tirunelveli district.
Findings of Hypotheses Testing
It is identified that nature of organization wise there is a significant difference in motivating
factors.
It is found that age wise there is no significant difference in motivating factors.
Educational qualification wise there is a significant difference in motivating factors among with
sawmill and without sawmill merchants.
Previous occupation wise there is a significant difference in motivating factors among with
sawmill merchants and without sawmill merchants.
Monthly income wise there is a significant difference in motivating factors among with sawmill
merchants.
Monthly income wise there is no significant difference in motivating factors among without
sawmill merchants.
Community wise there is a significant difference in motivating factors among with sawmill
merchants and without sawmill merchants.
Age wise there is a significant difference in reason for selecting timber trade among with
sawmill and without sawmill merchants in Tirunelveli district.
Gender wise there is no significant difference in reason for selecting timber trade among with
sawmill merchants in Tirunelveli district.
Gender wise there is a significant difference in reason for selecting timber trade among
without sawmill merchants in Tirunelveli district.
Suggestions
After analyzing and interpreting the data, the following suggestions are made.
It is found from the study that few with sawmill merchants and without sawmill merchants
have been involved in export, whole sale and retail business and export and retail business.

Vol. 5 Special Issue 3 August 2017 ISSN: 2320-4168
60 Shanlax International Journal of Commerce
Hence it is suggested that with sawmill merchants and without sawmill merchants should take
necessary effort to involve export, whole sale and retail business and export and retail
business.
Only few with sawmill merchants and without sawmill merchants selling Vembu, Teak wood
and Maruthu timber. Hence it is suggested that with sawmill merchants and without sawmill
merchants should take necessary steps to sell Vembu, Teak wood and Maruthu timber highly.
Only few with sawmill merchants and without sawmill merchants market the timber in
local level and country level. Hence it is suggested that with sawmill merchants and without
sawmill merchants should take necessary steps to market their timber in local level and
country level.
Only few with sawmill merchants and without sawmill merchants motivating carpenters,
architects & engineers for sale of timber and providing added services for sale of timber.
Hence it is suggested that with sawmill merchants and without sawmill merchants should
highly motivate carpenters, architects & engineers for sale of timber.
Majority of with sawmill merchants and without sawmill merchants were very serious
problems with labour shortage, competition and high customs and transportation. Hence it is
suggested that with sawmill merchants and without sawmill merchants should take necessary
steps to arrange labour and arrange own transport and merchants should advertise their
products to reduce the competition.
Since the customers expect more varieties of timber, the merchants have to invest more on
the research and development so that they design different varieties of timber in order to
attract more customers.
The timber merchants have to concentrate on determining competitive prices and increasing
quality of timber.
Conclusion
It is concluded that marketing practices of with sawmill merchants and without sawmill
merchants are good. Merchants adopted different pricing strategy for sale of timber. The different
pricing strategy are single pricing, dual pricing, few pricing and multi pricing. Merchants used
different promotional tools for sale of timber. The different promotional tools are
advertisement, personal selling, offering discounts, free door delivery, providing added services,
motivation carpenters and motivating architects and engineers.

International Conference on INDIA 2030
61 Manonmaniam Sundaranar University, Tirunelveli
INCOME AND EXPENDITURE PATTERN OF FISHERFOLK IN SELECTED COASTAL
VILLAGES OF THOOTHUKUDI DISTRICT IN TAMILNADU
P.Vinoth, M.Com,NET, M.Phil
Research Scholar, Department of Commerce, Manonmaniam Sundaranar University, Tirunelveli
Dr. B. Revathy, M.Com, M.Phil, B.Ed, Ph.D.,DCA,MBA
Professor& Head, Department of Commerce, Manonmaniam Sundaranar University, Tirunelveli
Abstract The present research work examines income and expenditure pattern of the fisherfolk of rural coastal villages in Tuticorin district. It is an attempt to assess the standard of living, income, expenditure pattern of fisherfolk. Quantitative data are collected from respondents (n=650) using well-structured interview schedule. The result shows that the standard of living of fishermen families islow and poor. Majority of the fisherfolk are in the status of below poverty due to insufficient income and huge debt trap. F-test, Kruskal-Wallis Test and chi-square testare used to analyse the data. The Government and Voluntary Organisation should take steps to solve the problems of fisherfolk in rural coastal villages and should take appropriate steps to improve their standard of living. Keywords: Standard of living, income, expenditure, fisherfolk Introduction
India has enormous inland and marine waters, which provide vast livelihood and employment
opportunities. Fisheries are one of the main sources of livelihood for the rural poor, particularly the
fisher community. It is estimated that about 6.7 million people depend on fisheries. This includes
roughly 7, 25,000 fulltime and equal number of part-time fishermen are engaged in fishing
operations and over 1 million people are engaged in pre-post-harvest activities (Government of
India (GOI) 20010). The incidence of poverty in a marine fishery sector is much higher than any
other backward sectors in our country. Fisheries families living below the poverty line are
estimated about 60% which is far higher than the national average of 26%. (Drawes, E.,1982). India
is the seventh largest fishing nation of the world with an exclusive Economic Zone (EEZ) of 2.02
million square kilometers. The 3 million marine fishermen population is living in 7, 56.212
fishermen households spread over 3,202 fishing villages. There are 8.89,528 active fishermen of
which 7,17,999 has fishing as a fulltime occupation. Indian fisheries sector contributes an annual
per capita supply of 3.3 kilograms of animal protein food and about 3 percent of total export
earnings (Sudarsan 1991). In order to uplift the socio-economic status of traditional fishermen, the
Tamil Nadu State Fisheries Apex Co-operative Federation has implemented Integrated Marine
Fisheries Development Project in 78 fishing villages among 6 coastal districts of Tamil Nadu
(TAFCOFED). The fisher folk income level is not enough to meet their expenditure and their daily
earnings from fisheries are low, fluctuating and often uncertain which leads to affect their livelihood
security. As most of the fisher folk are illiterate they lack knowledge in improving their fishing
activities (R. Mahesh and D. Rajasenan, 2006). In the absence of adequate institutional credit, the
fisher folk’s only remedy is the informal credit system for which the fishermen have to pay an
exorbitant interest (K.G. Karmakar, et., al., 2009). There is an increasing exposure to the vagaries of
catch and price fluctuations, they depend for debts to the local moneylenders and the fish trader-
financers have multiplied. Due to the low incomes as well as lack of institutional credit systems,
fisher folk are in the grip of middlemen, who provide them loans on high interest rates and bind
them to sell their fish caught by them on reduced prices. Resultantly, the fishermen of the areas are

Vol. 5 Special Issue 3 August 2017 ISSN: 2320-4168
62 Shanlax International Journal of Commerce
under debt burdens since generations, despite of working day and night (Charu Gupta and Mukul
Sharma, 2010).
Statement of Problem
The fisher folk along the coastal area are socio-economically backward and they lack various
basic amenities like education, drinking water and food. Thus their standard of living is not upto the
expected level (M.A. Oladoja and O.A Adeokun, 2009). The housing condition of the fisher folk is
poor. Majority of them live in huts made of mud, only few of them reside in houses made of cement
and bricks (KDR, 2008). Infrastructure facilities like housing, sanitation health care are major
problem facing the fishing community (Asha Krishna Kumar, 2010). The fisher folk income level is
not enough to meet their expenditure and their daily earnings from fisheries are low, fluctuating
and often uncertain which leads to affect their livelihood security. As most of the fisher folk are
illiterate they lack knowledge in improving their fishing activities (R. Mahesh and D. Rajasenan,
2006. The life and livelihood of the traditional fishers started to come harder. (Shely and Alam,
1998). Livelihood systems of poor fishermen are often quite diverse and their socio economic status
is also low and livelihood options are limited, the natural calamities are additionally leads to the
poverty deprivation. Some of the important programmes taken up by the Government to ameliorate
various problems encountered by the sector.(Shely and Alam, 1998). Government lends money to
the co-opratives societies in the form of loan and subsidies. Likewise they also assist economically
backward people in coastal region for the purpose of fishery and fishery business, so as to increase
their standard of living (Vhankade P.G. 2011). The various welfare programmes envisaged by the
State fisheries Department to improve the living conditions of fisher folk like sanitation, housing,
health care, drinking water supply have so far failed to yield the desired results and workers and as
a community still remain socially and economically backward (Economic Review 1997).
Government and voluntary organization provides training and financial assistance to fisher folk
families. Most of the fisher folk are earning adequate income. Still their socio economic status is
very low. Hence the researcher has made an attempt to find out the reason for the income and
expenditure pattern of the fisher folk in selected rural coastal villages of Tuticorin districts in
tamilnadu.
Objectives
The present study is based on the following specific objectives.
1. To study the socio economic status of fisher folk in Tuticorin district.
2. To examine Income and Expenditure and its impact on the standard of living of fisher folk in
Tuticorin district.
3. To offer suitable suggestions based on the findings of the study.
Significance of the Study
The importance of the present study is as follows:-
1. This study helps to find out the economic profile of the fishermen.
2. The Analysis of Income and Expenditure pattern of the fisher folk, they can be advised to reduce
their expenses.
3. The study helps to understand the exact standard of living of fisherfolk.
Methodology
Sampling Procedure of the Study
The investigator has selected the “random sampling” to collect data from the respondents.The
study covers the coastal areas of vellapatti, Tharuvaikulam, Siluvaipatti, Punnakayil and

International Conference on INDIA 2030
63 Manonmaniam Sundaranar University, Tirunelveli
Thooothukudi areas are selected in Tuticorin districts. The total sample size came to 650
respondents. The structured interview schedule was used to collect the relevant data.
Source of Data
The data required for the study have been obtained from both primary and secondary source.
The primary data were collected through interview schedule and secondary source of data were
collected through journals, magazines, and websites. Data has been collected from 650 respondents
from the study area. The researcher has personally interviewed all the respondents.
1. Income Level of Fisherfolk
Table 1.1 Average Monthly Income
Source: Primary data
Table 1.1 clearly shows that
50 per cent of 325 respondents who
are earning average monthly income
from Rs.6001-9000, 22.3 per cent of
145 respondents from Rs.3001-6000,
19.2 per cent of 125 respondents,
below Rs.3000 and 8.5 per cent of 55
respondents above Rs.9001. It is concluded that, majority of the fisherfolk earn monthly income Rs.
6001-9000. The least of the fisherfolk earn monthly income of above Rs.9001.
Table 1.2 Earning members in the fisherfolk family
Source: Primary data It is understood from table 1.2 that
59.8 per cent of 389 respondents belong to
below 2 earning members in the family,
31.7 per cent of 206 respondents, 3 to 4
earning members in the family and 8.5 per
cent of 55 respondents, above 4 earning
members in the family.
1.3 Sufficient income
An attempt has been made to find out whether the income is sufficient to fisherfolk. The data
have been collected from the fisherfolk and presented in Table 1.3.
Table 1.3 Sufficient income
Source: Primary data
Table 1.3 reveals that 67.4 per cent of
438 respondents have no sufficient income
and only 32.6 per cent of 212 respondents
have sufficient income.
1.4 Problems faced by insufficient income and Educational Status of Fisherfolk
In order to examine the relationship between educational status of fisherfolk and problems
faced by insufficient income, a two-way table with educational status of fisherfolk and problems
faced by insufficient income was constructed. Accordingly, fisherfolk have been grouped into four
categories on the basis of their educational status. The details of problems faced by insufficient
income among fisherfolk on the basis of their educational status are presented in Table 1.4.
Sl. No Average Monthly Income No. of
Respondents %
1. Below Rs.3000 125 19.2
2. Rs.3001-6000 145 22.3
3. Rs.6001-9000 325 50.0
4. Above Rs.9001 55 8.5
Total 650 100
Sl. No Number of Earning
Members in the Family
No. of
Respondents %
1. Below 2 members 389 59.8
2. 3-4 members 206 31.7
3. Above 4 members 55 8.5
Total 650 100
Sl. No Sufficient income No. of
Respondents %
1. Yes 212 32.6
2. No 438 67.4
Total 650 100

Vol. 5 Special Issue 3 August 2017 ISSN: 2320-4168
64 Shanlax International Journal of Commerce
Table 1.4 Problems faced by insufficient income and Educational Status of Fisherfolk
Educational Status Problems faced by insufficient income
Total Insufficient to meet basic needs
Health problem
Education problem
Illiterate 35(7.9) 12(2.7) 16(3.7) 63(14.4) Primary 155(35.4) 56(12.8) 21(4.8) 232(52.9) Secondary 74(16.9) 31(7.1) 20(4.6) 125(28.5) Higher Secondary 8(1.8) 6(1.4) 4(0.9) 18(4.1) Total 272 (62.1) 105 (24) 61 (13.9) 438 (100)
Source: Primary Data
Table 1.4 makes it clear that there is a relationship between the educational status of fisherfolk
and problems faced by insufficient income. Educational status-wise analysis of problems faced by
insufficient income reveals that 35.4 per cent of the respondents who are of primary education
faced the problem of insufficient to meet basic needs, 16.9 per cent of the respondents who are of
secondary education the problem of insufficient to meet basic needs, 12.8 per cent of the
respondents who are of primary education health problem, 7.1 per cent of the respondents who are
of secondary education health problem and 4.8 per cent of the respondents who are of primary
education education problem. In order to test whether there is any significant relationship between
educational status of fisherfolk and problems faced by insufficient income, Chi-square test was
applied with the null hypothesis as “there is no significant relationship between problems faced
insufficient income and educational status of fisherfolk in Thoothukudi District”. Table 1.5 reveals
the working of Chi-square testfor problems faced by insufficient income and educational status of
fisherfolk.
Table 1.5 Problems faced by insufficient income and Educational
Status of Fisherfolk – Chi-Square Test
Source: Computed Data
Table 1.5 discloses that the calculated chi-
square value for problems faced by
insufficient income among different
educational status of fisherfolk is 14.855
which is significant at the ‘p’ value of 0.021. Since the ‘p’ value is less than 0.05, the null hypothesis
is rejected. It is concluded that there is a significant relationship between the problems faced by
insufficient income and educational status of fisherfolk in Thoothukudi District.
2. Expenditure Pattern of Fisherfolk
2.1 Monthly Expenditure
Fisher folk along the coastal area are social economically backward, and lack various basic
amenities like education, drinking water, food. Thus, their standard of living is not up to the
expected level (Oladoja and Adeokun, 2009).The following table shows the monthly expenditure of
fisherfolk.
Table 2.1 Monthly Expenditure
Source: Primary data Table 2.1 clearly discloses that 42.8 per cent
of 278 respondents are spending from Rs.5001-
7500 per month, 26 per cent of 169 respondents
from Rs.2501-5000 per month, 24 per cent of 156
respondents above Rs.7501 and 7.2 per cent of 47
respondents below Rs.2500 per month.
Particulars Value df p Value
Pearson Chi-Square 14.855 6 0.021
Likelihood Ratio 14.163 6 0.028
Linear-by-Linear Association .141 1 0.708
N of Valid Cases 438
Sl. No Monthly Expenditure No. of
Respondents %
1. Below Rs.2500 47 7.2
2. Rs.2501-5000 169 26.0
3. Rs.5001-7500 278 42.8
4. Above Rs.7501 156 24.0
Total 650 100

International Conference on INDIA 2030
65 Manonmaniam Sundaranar University, Tirunelveli
2.2 Monthly Deficit: The following table shows the monthly deficit of fisherfolk.
Table 2.2 Monthly Deficit
Source: Primary data
Table 2.2 indicates that 40.6 per cent of 149
respondents have monthly deficit from Rs.2001-
3000, 27.8 per cent of 102 respondents above
Rs.3000, 21 per cent of 77 respondents from
Rs.1001-2000 and 10.6 per cent of 39 respondents
below Rs.1000.
2.3 Earning Capacity of Fisherfolk based on the Monthly expenditure
An attempt was made to know the earning capacity of fisherfolk such as income earned
regularly, earned high income at peak season, adequate income received, bad debts raised due to
credit sales and Low price of fish at peak season based on the monthly expenditure such as Below
Rs.2500, Rs.2501-5000, Rs.5001-7500 and Above Rs.7501.
Table 2.3 Kruskal Wallis Test – Mean Rank for Earning Capacity and Monthly expenditure
Sl. No Earning Capacity Mean Rank
Below Rs.2500
Rs.2501-5000
Rs.5001-7500
Above Rs.7501
1. Income earned regularly 275.54 276.41 315.28 412.63 2. Earned high income at peak season 262.30 270.20 314.99 423.19 3. Adequate income received 312.66 317.77 322.58 3.46.30 4. Bad debts raised due to credit sales 314.13 320.08 324.91 334.63 5. Low price of fish at peak season 318.81 321.65 327.77 348.86
Source: Computed data
To test the earning capacity of fisherfolk based on monthly expenditure, the following null
hypothesis was proposed.
H0 : There is no significant difference in earning capacity among different monthly
expenditure of fisherfolks in Thoothukudi District.
The non parametric statistics of Kruskal-Wallis test was used to analyze the earning capacity
among different monthly expenditure of fisherfolks in this context. The details of the results of
Kruskal-Wallis test for earning capacity among different monthly expenditure of fisherfolk are
presented in Table 2.4. Table 2.4 Results of Kruskal-Wallis Test – Monthly expenditure of
Fisherfolk and Earning Capacity
Earning Capacity Chi-square value p Value Significant/Not
significant Income earned regularly 44.345 0.000 Significant Earned high income at peak season 58.086 0.000 Significant Adequate income received 2.799 0.424 Not Significant Bad debts raised due to credit sales 0.795 0.851 Not Significant Low price of fish at peak season 1.114 0.774 Not Significant
Source: Computed data
S-Significant (p<0.05); NS-Not Significant (p>0.05)
The table 2.4 lists the result of the Kruskal-Wallis test. Since the p-value is greater than 0.05, the
null hypothesis is accepted at 5 per cent level of significance. Hence, this means that all the
respondents have almost given similar rank to earning capacity except ‘Income earned regularly’
and ‘Earned high income at peak season’. It can be concluded that monthly expenditure of the
respondents does not affect the ranking given to earning capacity except ‘Income earned regularly’
Sl. No Monthly Deficit No. of
Respondents %
1. Below Rs.1000 39 10.6 2. Rs.1001-2000 77 21.0 3. Rs.2001-3000 149 40.6 4. Above Rs.3000 102 27.8 5. Nil 283 43.1
Total 650 100

Vol. 5 Special Issue 3 August 2017 ISSN: 2320-4168
66 Shanlax International Journal of Commerce
(C.V 44.345, p value 0.000, p<0.05) and ‘Earned high income at peak season’ (C.V 58.086, p value
0.000, p<0.05).
Findings
The researcher on the income and expenditure pattern of the fishermen aims at summarizing
the following findings from the earlier chapters. These chapters give a detail study regarding the life
and pattern and their income and expenditure pattern of the fishermen. The following findings of
the research are listed below
1. On analyzing the problems faced in fishering occupation, of the fisherfolk face low income as
their problem.
2. Proper education is not given to their children due to insufficient income.
3. Majority of the fisherfolk families feel that their expenses are more than their monthly income.
4. Majority of the fisherfolk spend Rs. 5001-7500 per month.
5. Majority of the fisherfolk children are doing fishing activities so they are illiterate.
Suggestions
1. Fishing is not a permanent job and the income from fishing is from hand to mouth, so the fishermen can engaged him in another job which gives him an additional earning to make up the family.
2. The government can help the fishermen by offering scholarships to the fisherfolk children which motivate the children to study more.
3. The children can be put in government schools where there is not only good education but also good food is available by the Chief Ministers ‘Mid Meals Scheme”. So the children are healthy and they learn better.
4. The government can help the fishermen children by offer scholarship to those who are interested to do their higher education.
5. Low income is due to poor fish production. So the government has set up “Fisheries Development Mission” with the aim of giving an incentive to the production of fisheries for increased domestic consumption and export in an environmentally sustainable manner.
6. Necessary and adequate measures must be initiated by the state Government, local civic body and revenue authorities to ensure better living and working conditions to the fishermen in Thoothukudi District.
Conclusion
The livelihood process will create opportunities for more income as well as improve the
resource base of the poor people of coastal areas. Moreover, institutions involved in income
generating activities and other support services may work in close cooperation among themselves
for development of sustainable livelihoods system and thus the process will ensure more
sustainable use of natural resource base of coastal fishing communities of Thoothukudi district. By
way of providing alternate employment the standard of living of the fisherfolk family will be
upgraded due to additional income of the family and also leisure time could be spent effectively.
Majority of the fisherfolk are in below poverty due to insufficient income and huge debt trap.
The Government and Voluntary Organisation should study the problems and prospects of fisherfolk
in rural coastal villages, and take appropriate steps to improve their standard of living.
References:
1. Mahesh. Joshy. (1996) Economics of Fisheries, APJ Publishing Corpration, Ansari Road, New
Delhi.
2. Rajan, J. (2000) Fishing Economy of Kerala,sujilee Publishing House, Chathanoor, Kollam.
3. Government of Tamilnadu (1997), Economic Review, State Planning Board.
4. Supra Raju S. (2003) Andhra Pradesh Marine Fisheries:A Comparision. Yogana Vol17, June 2003
pp.3-3

International Conference on INDIA 2030
67 Manonmaniam Sundaranar University, Tirunelveli
SUSTAINABILITY OF SILVIPASTURE SYSTEM IN DRY LAND ECOSYSTEM OF WESTERN
ZONE OF TAMIL NADU: A SURVEY
V.S. Mynavathi
Assistant Professor, Institute of Animal Nutrition, Kattupakkam,
Tamil Nadu Veterinary and Animal Sciences University, Coimbatore, India
C. Jayanthi
Director, Directorate of Crop Management, Tamil Nadu Agricultural University, Coimbatore, India
Abstract Study was carried out during 2009 to diagnose and assess the sustainability of silvipasture systems of Kangeyam belt, which falls under dry tract of Western zone of Tamil Nadu, India. Information collected through survey indicated that farming was the primary occupation of all farmers. Although the farm households had a large number of family members, only 26% of their total labour was devoted to farming due to either full or part time off farm employment. The average size of land holding is small. About 43% of the farmer’s own less than 5 ha land area and 30% and 27% of the farmer’s are big and marginal farmer’s respectively. Of these, 73% of the farmer’s owned pasture lands and about 77% of farmer’s are having sheep than other livestock like cattle, goat, buffalo and poultry. The main farming system of the zone is silvipasture system locally called “Korangadu”, typically consists of a mixture of Cenchrus grass and tree Acacia leucophloea. The paddock is not rotated for grazing in regular basis. Adoption of improved combination of fodder grass Cenchrus glaucas + Stylosanthes in 2 : 1 ratio inbetween Acacia leucophloea with sheep could able to improve the productivity, monetary returns and employment generation in rainfed areas where crop production suffers due to lack of water. In addition land, water and crop management techniques like broad bed furrow, seed hardening, micro sprinkler irrigation system, farm pond and vermicomposting will definitely improve the standard of living of small farmers in rainfed areas of Tamil Nadu. Key words: Sustainability, silvipasture, grazing, livelihood, rainfed areas.
Introduction
In India, nearly 100 million ha of land is under rainfed cultivation and therefore, rainfed
agriculture will continue to play an important role in the Indian economy. However, rainfed
agriculture in India is always a challenge as crop production depends on monsoon rains that are
erratic and ill distributed and the soils are poor in fertility. Also, the average holding of farm in India
has been declining, and over 80 million out of 105 million operational holdings are below the size of
1 ha (Mahapatra and Bapat, 1992). Agroforestry is sustainable agricultural practice which provides
optimum benefits to people, livestock and crops. The sustainability of natural ecosystems is also
improved when it support wildlife and called silvipastoral system. For agricultural based economies
where population pressure is high there implementation of silvipastoral system adds value in
conserving and utilizing land for maximum benefits. Silvipastoralism focuses on the production of
livestock and tree products in one integrated pasture system. (Esther Shekinah et al., 2005).
Silvipasture is important activity when it is economical to run a single species, cattle, under a
monoculture in a large silvipastoral operation. On small farms, in the tropics diversification of
animal and plant species is the most efficient utilization of the resource and provides a variety of
products. Realizing the importance of silvipasture management for meeting the biomass
requirement research work was initiated. So, an extensive survey was needed for knowing the
views on existing farming situations of the farming community to deal more efficiently with
problems of complex, marginal, diverse, risk-prone agriculture and disadvantaged farmers
operating in harsh environment. As the problems faced by the farmers vary from region to region

Vol. 5 Special Issue 3 August 2017 ISSN: 2320-4168
68 Shanlax International Journal of Commerce
due to change in climate or environment, soil, local needs and socio-economic factors comprising
income levels, credit flow, market demand, price structure, input availability. These factors were
considered before setting research priorities through diagnostic survey of the region to develop
sound farming system model. Before conducting any research on farming system in an area, the first
step of diagnosing of resource base of farmers and constraints is very crucial and has to play a
pivotal role. In view of this an on-farm study on characterization of prevailing farming systems of
Tirupur district (Tamil Nadu) was undertaken with the objectives to identify and characterize the
major farming system of the district, understand farmers practices being adopted in different
farming systems, identify technological interventions for improving profitability, potential
alternative and major constraints limiting the efficiency of different farming sub-systems and also
identify socio-economically viable farming systems for the farmers of the area.
Materials and methods
To meet the objectives of the on-farm study on characterization of prevailing farming systems
of Tirupur district (Tamil Nadu), the relevant information of different aspects of farming systems
was collected through primary as well as secondary sources. First of all, preliminary information
about Tirupur district of Tamil Nadu was gathered from district level office. For collection of
information related to different sub-systems a survey was carried out during 2008-09 using
pre-structured proforma. Survey was conducted by adopting random sampling method. Sampling
was done by randomly selecting 5 blocks, 10 villages and 5 farmers from each village. The selected
farmers were interviewed personally and information on different aspects of farming systems,
i.e., farm enterprises being adopted, farm resources (land, irrigation, water, human, livestock,
machinery etc.,), input use, cost and income in different enterprises and the constraints in farming.
The data collected through survey were subjected to general statistical analysis.
In this study, we categorised farms based on resource endowments, i.e. quantifiable biophysical
(e.g. land, labour and water availability) and socio-economic (e.g. education and wealth)
characteristics of the farm and its family. The survey aimed to understand farmers perspectives on
internal and external factors to their farms which influenced their adoption of the new technologies,
and to identify the issues that need to be considered in future for designing new options for
improving the livelihood of the resource poor farming community.
Results and Discussion
Base line data on the project area
The district Tirupur, which falls under dry tract of Western zone of Tamil Nadu, India.
Information collected through primary and secondary sources indicated that farming was the
primary occupation of all farmers. Although the farm households had a large number of family
members, only 26% of their total labour was devoted to farming due to either full or part time off
farm employment. The average size of land holding is small. About 43% of the farmer’s own less
than 5 ha land area and 30% and 27% of the farmer’s are big and marginal farmer’s respectively.
Of these, 73% of the farmer’s owned pasture lands and about 77% of the farmer’s are having sheep
than other livestock like cattle, goat, buffalo and poultry. Sheep play vital role by significantly
contributing to the production of meat, fibre and skin and also to the provision of rural
employment, especially in ecologically difficult areas. The area is best suited for livestock rearing.
The soil is of a red loam full of bunker gravel, known as “Odai jelli” which is the best land for rearing
livestock. The whole pasture is divided into a number of paddocks, from 10 to 25 acres for each
paddock and fenced all around with a live fence of mullukiluvai, a thorny shrub which is highly
drought resistant. The soil is very rich in calcium and phosphates. Pasture maintenance and

International Conference on INDIA 2030
69 Manonmaniam Sundaranar University, Tirunelveli
cultivation of fodder crops are carried out in rotation. This practice of rational method greatly
assists deep soaking of water into the soil, which in turn gives good and increased quantity of grass.
Crops grown are cotton, ragi and Sorghum. During the monsoon millet and sorghum are grown.
The main farming system of the zone is silvipasture system locally called “Korangadu”, typically
consists of a mixture of Cenchrus grass and tree Acacia leucophloea. The paddock is not rotated for
grazing in regular basis, leads to soil fertility deterioration. Though the rainfall may not be sufficient
to grow a cereal crop, it is generally sufficient to raise a crop of grass. The chief grass is kolukkattai
(Cenchrus species). It is a thick, succulent grass which maintains its vitality during severe drought.
Even under ploughing the grass is not killed. It seeds freely and sheds seeds easily. Hence a few
showers will make the pasture very green. The grass is very much relished by cattle. An interesting
feature of the grazing areas is the wide prevalence of white babul trees (Acacia leucopholeae).
They provide shade for the livestock’s at midday, and during the podding season supply pods for
the cattle to eat. During the season the pods are collected and stored and used with concentrates.
The Pods of Babul trees are rich in protein. Manure is not collected in the grazing area and the land
is ploughed once in four to five years and brought under cultivation and the grazing area is changed.
By leaving the cattle out day and night for months in the grazing area they become hardy and can
endure all kinds of weather. The issue that needs addressing is how current output trends of 4–5%
per annum can be sustained without disturbing the equilibrium between crops and livestock.
Improving food supply from animals through higher livestock numbers (as in the past) is now
severely constrained due to the feed-fodder deficit and declining per capita land availability.
Technological and management options are the only alternatives to accelerate the growth in
productivity, which is currently low. Adequate provision of feed is essential to livestock production,
and its scarcity has been one of the major limiting factors in improving productivity in India. Green
fodder contributes 26%, while concentrates contribute only 3 percent. The rest comes from grazing.
Stall-feeding is largely confined to buffalo, crossbred cattle, and draught animals. Small ruminants
mainly feed on grasses from village common property resources, roadsides, and harvested fields,
and supplementary feeding is lacking except in large commercial herds. Sheep husbandry is
practiced largely by the poor and is dependent on availability of grazing lands, which have been
deteriorating in terms of both quantity and quality. In contrast to the indigenous sheep breeds that
are capable of surviving even on sparse vegetation, the crossbred sheep require better nutrition.
Farming System and Social Dimensions
The vast majority of farm holdings are comprised of mixed crop-livestock systems and farmers
keep livestock depending on the crop residues available. The livestock holdings are tiny – two to
three animals of cows, and/or buffalo per holding. Large holdings are seen only few in this district.
There are some specialized dairy farms among the smallholders, but the numbers are very few and
they are mostly in the peri-urban areas. Malnutrition and poor health are the two most important
constraints to raising livestock productivity. Animals primarily feed on crop residues and common
grazing lands. Supplementation with green fodder and concentrate feed is inadequate. More than
70% of rural households possess one or two large animals or 2 to 5 small animals such as the goat,
sheep and poultry. Large animals are partially stall-fed and partly grazed on community land. Small
animals are maintained solely on grazing. Their movements are not controlled and they are free to
mix with other animals. Most small livestock holders do not have proper housing facilities for
livestocks. The livestocks are either kept outdoors or indoors with the humans. Some farmers
maintain thatched sheds for large animals. Small holders rarely apply scientific technology for
breeding, feeding, health care, or management.

Vol. 5 Special Issue 3 August 2017 ISSN: 2320-4168
70 Shanlax International Journal of Commerce
Grazing and Carrying Capacity
As grazing resources are shrinking, tree fodder will be an important alternative for feeding
sheeps. Twenty percent subabul (Leucaena spp.) leaves in a complete feed yielded better growth
and higher carcass production. Leaves of indigenous babul (Acacia nilotica) at 15% level in a
complete feed were found to improve milk productivity. Subabul also has potential as feed for
chevon production as it has no deleterious effect on various economic traits and carcass
characteristics.
Conclusion
There is a large gap between requirement and availability of feed and fodder. In India, the dry
fodder deficit is 31%, green fodder 23% and concentrates 47%. The feed deficiency is due to heavy
population pressure, the quantitative and qualitative deterioration in common grazing lands
resulting in low biomass production, and the lack of adoption of fodder production technologies.
Common grazing lands comprise an important source of grasses, and there exists considerable
scope to raise the production of grasses/shrubs from these lands through technological and
management interventions such as reseeding with high-yielding grasses and promotion of
rotational grazing practices. The results obtained during the past three decades indicate that fodder
and fuel wood production could be increased several folds from the existing levels through proper
management of drylands.
Research Intervention
Adoption of improved combination of fodder grass Cenchrus glaucas + Stylosanthes in 2 : 1 ratio
inbetween Acacia leucophloea with sheep could able to improve the productivity, monetary returns
and employment generation in rainfed areas where crop production suffers due to lack of water. In
addition land, water and crop management techniques like broad bed furrow, seed hardening, micro
sprinkler irrigation system, farm pond and vermicomposting will definitely improve the standard of
living of small farmers in rainfed areas of Tamil Nadu.
References
1. Mahapatra, I.C. and S.C. Bapat (1992) Farming systems research: Challenges and opportunities.
Pp. 382-390. In Proceedings of the XII National Symposium on Resource Management for
Sustained Crop Production, February 25-28, 1992. Indian Society of Agronomy, Bikaner,
Rajasthan.
2. Esther Shekinah,D., C.Jayanthi and N.Sankaran (2005) Physical indicators of sustainability –
A farming systems approach for the small farmer in the rainfed vertisols of western zone of
Tamil Nadu. Journal of Sustainable Agriculture. Vol. 25(3): 43-65.

International Conference on INDIA 2030
71 Manonmaniam Sundaranar University, Tirunelveli
JOB DIMENSIONS OF COLLEGE TEACHERS
Dr.B.Revathy
Professor& Head, Department of Commerce, Manonmanim Sundaranar University, Tirunelveli
Mr.M.Subramanian
Ph.D Scholar, Department of Commerce, Manonmanim Sundaranar University, Tirunelveli
Introduction
Job satisfaction is an integral component of the work climate. it is the result of establishing a
healthy organisational environment in an organisation. It includes a feeling of satisfaction or
dissatisfaction with the various segments of one’s job life. Job satisfaction is believed to be a good
indicator of an employee’s feeling s on his work. Job satisfaction is generally affected by the
discrepancy between reward expected and actually realised. Lesser the discrepancy , greater will be
the reward and satisfaction in fact ,means a feeling of contentment felt on what one has or achieves
whereas contentment is a feeling of satisfaction with what one has. Higher satisfaction contributes
to organisational commitment, job involvement better physical and mental health and quality of life
to employee. On the other hand, job dissatisfaction leads to absenteeism , labour turnover , labour
problems and a negative organisational climate. Hence , low job satisfaction is a sign of
deteriorating conditions in a concern. High job satisfaction on the other hand is the hallmark of well
– managed efficient organisation. Further the progress of any nation depends upon its education
and the standard of its educational institutions. The importance of education has been emphasized
in a variety of ways by different scholars and intellectuals from the beginning of human history
down to the present time. The reason is that it has been taken for granted as the most important
factor for bringing change in every aspect of human behaviour. While education develops the total
personality of an individual, it contributes also to the growth and development of society.
Education is imparted through various programmes and the teacher is the principal agency for
implementing all such programmes in educational institutions. It is incumbent upon the teachers to
take the advantage of the programmes to guide, inspire and motive the students for a disciplined
life and to inculcate values among them which are in consonance with india’s cultural heritage and
social objectives. The most important factor in educational reconstruction is the role of a teachers
personal qualities educational qualification, professional training and the place they occupy in the
institution as well as the community. The success of education to a great extent depends on the
quality of human resources , which in turn influences the standard of education. The role of teacher
is very important in imparting the knowledge and implementing the plans and programmes of the
nation.
Statement of the Problem
Education plays a major role in human development and higher education in particular, as an
indicator of the progress and prosperity of any nation. The quality of a nation is reflected by the
quality of its citizens depends on the quality and in turn success of any educational system largely
depends on teachers, irrespective of the institutions where they teach. Hence, from the time
immemorial the teacher has occupied an important position and enjoyed great respect in the
society.

Vol. 5 Special Issue 3 August 2017 ISSN: 2320-4168
72 Shanlax International Journal of Commerce
People need job satisfaction in their chosen vocation. In the absence of job satisfaction, the job
ceases to be a source of pleasure and dissatisfaction gradually creeps. It is also true m teaching
profession. The teachers, who are not satisfied with their job, may adjust well with their students
and will not be efficient . Hence, it is extremely essential that teacher should be satisfied with their
profession which also can contribute to shaping of their students into good citizens.
Significances of the Study
Education is a powerful instrument to bring out a desire change in the individual. Education is
meaningless without teaching. Further, role played by a teacher who shapes the minds of a society
played by a teacher who shapes the minds of a society is very vital and significant. That is why the
Indian society gives third place to education in workship which runs as “mother, father,guru and
god”. So time immemorial, teacher has occupied an important place in one’s life.
Objectives of the Study
1. To identify the factors influencing the job satisfaction / dissatisfaction of college teachers.
2. To analyse the relationship between socio-economic variables and job satisfaction of college
teachers and
Scope of the Study
The study is confined to the satisfaction of teachers working in arts and science colleges in
Tirunelveli city.
Socio-Economic Factors and Job Satisfaction
Though people have many common aspects, they differ in many respects. These differences are
usually significant. There are differences in personal or demographic characteristics of individuals.
They have different background experience both in their social milieu, as well as in the world of
work. In other words, they show variations in terms of their demographic and social background.
Not all background factors, the impact of which the employees carry to their work place, can
feasibly be traced and taken into account. They might have several personality dispositions, unique
set of needs, styles of life and goals. Their age, educational level marital status and various
experiences of Job Situations may be different.
Their social anchorage and situations can play a vital role in shaping their reactions and attitude
towards the work situation. They are subjected to numerous demands and pressures in different
situations. These may not be consistent with each other family troubles and housing problems may
haunt them while they are on the job. There are both on the job factors and off the job factors.
Their on the job- adjustment experiences are carried over to off-the-job situation and at the same
time this should not mean that off-the-job factors are completely wiped out in the job situation.
It is one of the expressed intentions of the present study to trace the relationship between
certain socio-economic background factors on the one hard and Job Satisfaction of the college
teachers on the other. The present article makes an attempt to examine
(1) the socio-economic factors of the college teachers and
(2) the relationship between the level of Job Satisfaction and socio-economic factors.
Demographic profile of the respondents
S.no Particulars Independent variables Frequency Percentage 1 Gender Male
Female 60 60
50 50
2 Age 21-30 31-40 Above 40
42 40 38
35 33 32

International Conference on INDIA 2030
73 Manonmaniam Sundaranar University, Tirunelveli
3 Marital status Married Un-married
78 42
65 35
4 Educational qualification M.phil Ph.d
90 30
75 25
5 Experience Upto 3years 4-8 years 9-15 years Above 15 years
44 25 23 28
37 21 19 23
6 Monthly income Upto Rs.10000 10000-25000 Above 25000
65 16 39
54 13 33
7 Spouse employee Yes No
63 57
53 47
8 Type of family Joint family Nuclear family
55 65
46 54
9 Size of family Upto 3 4-6 Above 6
33 75 12
28 62 10
10 Locality Rural Urban Semi-urban
26 73 21
22 61 17
1. Male and female respondents are equal in this study.
2. The respondents for, these three categories do not have much difference that is age between
21-30 we find 35%, 31-40 years 33% and above 40 years 32%.
3. Martial status is another important factor for a study to be conducted,in this study we find out
65% of the respondents are married and the rest 35% are unmarried.
4. Education qualifications has been selected that found exactly 50% of the respondents who have
completed m.phil followed by it is respondents who have completed ph.d have shown highest
percentage.
5. The majority of the respondents that is 37% come under the category experience upto 3years.
6. The income level is categories into three group as upto 10000 we find the majority of the
respondents about 54%.
7. Most of the respondents 53% of spouse employed and 47% are non employee.
8. Most of the respondents 54% are nuclear family and 46% are joint family.
9. Most of the respondents 62% are 4-6 members 28% are upto 3 ,embers in family size.
10. The majority of the respondents that is about 61% are found in urban region, 22% rural and
17% semi-urban.
11. Most of the respondents 85% own housing and the remaining of the respondents only 15% are
rented housing.
Overall Chi-Square S.No Particulars Degrees of freedom Table value Calculated value Statistical value
1. Age 2 5.991 0.2 Not Significant
2. Education qualification 7 14.067 168.7 Significant
3. Locality 2 5.991 41.15 Significant
4. Marital status 1 3.841 10.8 Significant
5. Nature of college 1 3.841 1.2 Not Significant
6. Designation 3 7.815 75.39 Significant
7. Experience 3 7.815 9.12 Significant

Vol. 5 Special Issue 3 August 2017 ISSN: 2320-4168
74 Shanlax International Journal of Commerce
8. Monthly income 2 5.991 30.025 Significant
9. Type of family 1 3.841 0.84 Not Significant
10. Family size 2 5.991 51.45 Significant
Hypothesis
1. There is no significant difference between the age of college teachers and job satisfaction.
2. There is significant difference between the education qualification of college teachers and job
satisfaction.
3. There is significant difference between the locality of college teachers and job satisfaction.
4. There is significant difference between the marital status of college teachers and job
satisfaction.
5. There is no significant difference between the nature of college teachers and job satisfaction.
6. There is significant difference between the designation of college teachers and job satisfaction.
7. There is significant difference between the experience of college teachers and job satisfaction.
8. There is significant difference between the monthly income of college teachers and job
satisfaction.
9. There is no significant difference between the type of family of college teachers and job
satisfaction.
10. There is significant difference between the family size of college teachers and job satisfaction.
Statements Contributing to Job Satisfaction
S.No Particulars SA A N D SD
1 I am successful teacher 58 59 3 - -
2 There are adequate laboratory facilities in the college 25 71 21 3 -
3 The library facilities is sufficient in the college 37 70 2 8 3
4 There are adequate toilet facilities in the college 32 75 9 4 -
5 Equipments and materials are provided 66 30 13 10 1
6 There is a good relationship between teachers and students 68 47 3 1 1
7 Importance of the job can be felt 79 40 1 - -
8 The staff room is well furnished 21 68 25 3 3
9 Future of the country is in the hands of the teachers 75 41 3 1 -
10 F.I.P facilities are not available 10 26 43 25 16
11 Adequate pension after retirement 16 32 58 8 6
12 Less salary for the deserved work 16 32 58 8 6
13 Adequate leave are levied 20 48 38 4 10
14 Need of teachers association 34 32 51 2 1
15 Termination from the job at any time 3 20 53 19 25
Ranking of statements
Weights allotted :
SA(strongly agree) – 5 points
A(agree) - 4points
N(neutral) - 3points
D(disagree) - 2points
SD(strongly disagree) - 1points

International Conference on INDIA 2030
75 Manonmaniam Sundaranar University, Tirunelveli
S.No Particulars SA A N D SD Total Mean score
Rank
1. I am a successful teacher 290 236 9 - - 535 4.46 IV 2. There are adequate laboratory facilities in
the college 125 284 63 6 - 478 3.98 VIII
3. The library facilities is sufficient in the college
185 280 6 16 3 490 4.08 VII
4. There are adequate toilet facilities in the college
160 300 27 8 - 495 4.13 VI
5. Equipments and materials are provided 330 120 39 20 1 510 4.25 V 6. There is good relationship between
teachers and students 340 188 9 2 1 540 4.50 III
7. Importance of the job can be felt/measured
395 160 3 - - 558 4.65 I
8. The staff room is well furnished 105 275 75 6 3 461 3.84 IX 9. Future of the country is in the hands of the
teachers 375 164 9 2 - 550 4.58 II
10. F.I.P facilities are not available 50 104 129 50 16 349 2.91 XIV 11. Adequate pension after retirement 80 128 174 16 6 404 3.37 XII 12. Less salary for the deserved work 80 72 147 46 14 359 2.99 XIII 13. Adequate leaves are levied 100 192 114 8 10 424 3.53 XI 14. Need of teachers association 170 128 153 4 1 456 3.80 X 15. Termination from job at any time 15 80 159 38 25 317 2.64 XV
It can be identify the which the best rank of the job satisfaction. Ist rank of the most
importantance of the job.so many college teachers decision in this factor.IInd rank is the next one
future of the country is in the hands of the teachers.and IIIrd one is the good relationship between
teachers and students. Most of the respondents says my job is important one so give the rank in this
factor.
Job satisfaction inventory into four heads
They are:
1. Physical facilities
2. Self Esteem
3. Salary & Frienge benefits
4. Opportunity and advancement
1. Physical facilities:
Laboratory facilities
Library facility
Staff room facility
Equipment & material
Toilet facilities.
2. Self Esteem:
I am successful teacher
I like my job
Good relationship me and my students
I feel the importance of my job
Future of the country in the hands of teachers.
3. Salary and Fringe benefits:
We get adequate pension after retirement.
My salary less than what i deserve for the work.

Vol. 5 Special Issue 3 August 2017 ISSN: 2320-4168
76 Shanlax International Journal of Commerce
We have adequate casual leave earned leave and medical leave facilities .
4. Opportunity for advancement:
F.I.P facilities are not available to us.
College environment is not very supportive to do research
General suggestion
The most important factor in which self-financing college teachers are dissatisfaction is salary
and fringe benefits though the qualifications are equal for the teachers of self financing college
teachers, the aided college teachers have been demanding parity of pay scales with aided college
teachers. Hence it is suggested that the government should pay of university grand pay to the
teachers of self financing teachers. Though establishment of parent teacher association meeting in
the college is compulsory they are not functioning property , hence adequate steps should be taken
to make parent teacher association more active and effective.
Conclusion
The study concludes that several factors play dominant role in the enhancement of job
satisfaction of college teachers. The major factor is connected with finance. Having admitted the fact
that the teachers form the back bone of educations, their job satisfaction must be maintained at the
highest possible level at the costs, naturally, the implementation of most of the suggestions made in
this study, involve heavy financial burden either on the government of the management.
The management of aided colleges too should be generous to teachers as most of the financial
aspects are taken care of by the government, if the aforesaid suggestions are carried out by the
government as well as management of the colleges, the job satisfaction of the college teachers, will
improve and thereby India will become a knowledge super power in the years to come.
References
1. Biswas P. & Tinkude(1994), a study of job satisfaction of Secondary teachers in relation to some
background variables. Journal of educational research and extension Vol. 30. Blood, M.R. (1969),
Work values and job satisfactions. 2.
2. Buch, M.B. Editor (1986), "Fourth survey of research in education" vol. 11, new Delhi, NCERT.
Frank J. Landy &, Don, A. Trumbo, Psychology of work behaviour. Job satisfaction and meaning
of work.3
3. Lathifa Belgam, N.H. & Dharmangadanb(2000), Sex differences job satisfaction of college
teachers in Kerala state: Indian journal of psychology 86 educational Vol. 31.
4. Maheswar, P. (2001), Job satisfaction of college Teachers in the context of type of management.
Journal of educational research and extension vol. 38-2. Philomena J.R. & Bhargave, College
teachers. Indian Journal of psychometric & education. Vol-32, No. 2.
5. Patnaik S.P. & Sharad Kumar (2002), a study of organizational Committeemen, attitude
Towards Work and job satisfaction of postgraduate teacher of Goa. Journal of educational
research & extension Vol 39-1.

International Conference on INDIA 2030
77 Manonmaniam Sundaranar University, Tirunelveli
A STUDY ON CONSUMER BEHAVIOURAL ATTITUDE TOWARDS ONLINE SHOPPING
Ms. K. Kanimozhi
Ph.D., Scholar, Department of Commerce, Manonmanim Sundaranar University, Tirunelveli
Dr.B.Revathy
Professor& Head, Department of Commerce, Manonmanim Sundaranar University, Tirunelveli
Abstract Shopping in India has undergone huge transformation over the past few years. It is no more confined to street bazaars, street markets or malls. Shoppers explore their internet to make their purchases. On line shopping industry is fast catching on in India. Online shopping has become popular not only in metro cities but also in small towns. The growth rate of India’s e-commerce industry is fascinating. It was reported as 88% in 2013 which is a clear contrast picture of the slower economic growth of India. The rising inflation rate in recent years has not slipped away the performance of online shopping industry in India. Companies are using the internet to put across and commune the information. Simultaneously it helps the companies to give an idea about their products and instantly getting the feedback of customer’s fulfillment to get stimulated turnover for future. The primary objective of the current study is to understand the online buying behavior of consumers in kanyakumari District. It has also made an attempt to get information about the scope of improvement in online shopping. Introduction
The introduction and implementation of internet technologies has created new market for
manufacturers and service providers and also has provided new arena for innovative marketing
strategies by the professionals. There are various reasons of shifting the customers buying patterns
towards online retail shops. The facility of comparing our product with competitive products on the
basis of price, colour, size and quality is one of the biggest benefits of online shopping. Moreover the
product remains at its place even we purchase it. It looks hilarious but this is also one of the most
significant reasons reported by the online shoppers. The other popular names for online shopping
are virtual store, e-shop, webshop, internet shop, web-store and online storefront etc. These days
Mobile commerce or m-commerce is also one of the popular means of shopping. The facilities of
various coupon and discount scheme are also fascinating the customers in online shopping. In our
time, internet is acknowledged as noteworthy valuable communication channel taxing with the
traditional ones, such as walkie-talkie, magazines, and small screen. From the past few years,
on-line shopping is the prevalent way of doing dealings in the field of E-Business and is
unquestionably going to be the future of shopping in the human race. The increasing consumer
base, principally of youths, is playing a significant role in the online shopping. Through this means,
the shopper can buy the product from wherever he wants. Because of wide communication network
e-commerce has become the new mediator between the companies/manufacturers and their
customers. The growth rate of India’s e-commerce industry is fascinating. It was reported as 88% in
2013 which is a clear contrast picture of the slower economic growth of India. The rising inflation
rate in recent years has not slipped away the performance of online shopping industry in India. If
one tries to identify the cause of this growth rate then it will not take many efforts to find the
answer. The more innovative ways of online payment and increasing internet penetration has given
a paradigm shift and push to this industry. The increase of internet technology in India has colossal
potential. It will trim down the cost of product and service delivery and lengthen geographical
boundaries in bringing buyers and sellers together. The boost in use of internet by the customers in
younger age bracket in India has provided a promising outlook for online retailers. The majority of

Vol. 5 Special Issue 3 August 2017 ISSN: 2320-4168
78 Shanlax International Journal of Commerce
the companies are operating their on-line portals to put up for sale (of both products & services), to
shrink marketing costs, and subsequently plummeting the prices of their products and services to
continue their position in the future market.
Earlier the Indian customers were more attracted towards electronic gadgets and mobile
phones for online shopping but now the products indicative of lifestyle, viz., watches, apparels,
perfumes, beauty products are also in high demand through the medium of online shopping.
The market is also developing for books, jewellery, home appliances and kitchen appliances etc.
The following facts can help the academicians and researchers to understand the size and
performance of Indian e-commerce industry.
• In 2013, the size of the market was $ 16 billion which was $ 8.5 billion in 2012.
• The growth rate in metro cities of India is expected to be much higher than the other cities of
the country
• The e-commerce industry is expected to be of $56 billion by 2023. But contradict to it, another
forecast supported by IANS, the e-commerce market is expected to grow by $ 50- 70 billion by
2020.
Companies are using the internet to put across and commune the information. Simultaneously it
helps the companies to give an idea about their products and instantly getting the feedback of
customer’s fulfillment to get stimulated turnover for future. In India the growth of the e-commerce
industry is tremendous. Considering the latest updates from IBN 7, the number of on line shopping
have crossed 600 in the year 2013 which was counted as only 100 in 2012. The popularity of local
e-commerce sites is also noteworthy in addition to global leaders like eBay and Amazon.
Objectives of the Study
The primary objective of the current study is to understand the online buying behaviour of
consumers in kanyakumari. It has also made an attempt to get information about the scope of
improvement in online shopping website. The objective of the study is destined to provide useful
information to marketing professionals to develop a better marketing strategy to boost online
shopping in Indian retail market.
Analysis & Interpretation
The article analyses the buying-behaviour of the respondents on online shopping influenced by
various demographic factors, habit of purchasing, preference of purchase and effect of price on
purchase through online shopping. The data are collected from 150 respondents of kanyakumari
chosen on convenience sampling method.
Analysis & Intrepretation
Table-1 Demographic Profile of the Respondents
Age No. of respondents Percentage 15-20 years 21 14 21-30 years 53 35 31-40 years 31 21 41-50 years 22 15 51-60 years 14 9 Above 60 years 9 6
Gender No. of respondents Percentage Male 89 59 Female 61 41
Marital Status No. of respondents Percentage
Married 117 78
Single 33 22

International Conference on INDIA 2030
79 Manonmaniam Sundaranar University, Tirunelveli
Educational Qualification No. of respondents Percentage
High school level 24 16
Under Graduate 43 29
Post Graduate 32 21
Professionals 21 14
Others 30 20
Occupation No. of respondents Percentage
Students 21 14
Business 39 26
Govt.Employees 21 14
Private Sector 50 33
Professionals 19 13
Monthly income No. of respondents Percentage
Below Rs. 10000 34 23
Rs.10000-30000 46 31
Rs.30000-50000 45 30
Above 50000 25 16
Residential Status No. of respondents Percentage
Urban 88 59
Rural 62 41
Source: Primary Data
Age-wise classification is an important factor in the purchasing behaviour on online shopping.
The respondents selected for the study are classified according to their age. The above table shows
that 14 percent of the respondents are 15 - 20 years old, 35 percent of the respondents are 21 – 30
years old, 21 percent of the respondents are in the age group of 31 – 40 years, 15 percent of the
respondents are in the age group of 41 – 50 years 9 percent of the respondents are in the age group
of 51 – 60 years and only 6 percent of the respondents are in the age group of ‘Above 60 Years’.
Gender plays an important role in the purchasing-behaviour on online. 59 percent of the
respondents are males and 41 percent of the respondents are females. It is clear that number of
females is less, hence it shows that male respondents are more interested to shop online than
females. The marital-status of the respondents is classified into Married and Single. 78 percentage
of the respondents are married, 22 percent of the sample respondents are single. The purchasing
behavior of the respondents on online depends, on the educational-qualification. 16 percent of the
respondents have High school level of education. 29 percent of the respondents are Under-
graduates, 21 percent of the respondents are Post graduates, 14 percent of the respondents are
Professionals and 20 percent of the respondents belong to ‘Other category. The occupation of the
respondents mainly determines their purchasing-behaviour on online shopping.
14 percent of the respondents are students, 26 percent of the respondents are engaged in
business activities, 14 percent of the respondents are government employees, 33 percent of the
respondents are professionals. 23 percent of the respondents earn monthly family income of ‘Less
than Rs.10000’. 31 percent of the respondents earn monthly family income between Rs.10000 –
Rs.30000, 30 percent of the respondents earn between RS.30000 – Rs.50000 and only 16 percent of
the respondents earn above Rs.50000. 59 percent of the respondents are in urban areas and 41
percent of the respondents are in rural areas.

Vol. 5 Special Issue 3 August 2017 ISSN: 2320-4168
80 Shanlax International Journal of Commerce
Types of Online Buyers
The respondents selected for the study are classified on the basis of frequency of purchase.
The classifications are
1) Trial online buyers
2) Occasional online buyers
3) Frequent online buyers and
4) Regular online buyers
Trial online buyers were taken as those who had purchase products online once in the last year.
Occasional online buyers were those respondents who had bought products or services online two
to four times in the last year. Frequent online buyers were those who had bought products or
services five to ten times online in the last year. Regular online buyers were taken as those who had
bought products or services more than ten times online the last year.
Table-2 Types of Online Buyers
Source: Primary Data It is clear from the above table that 16 percent of the respondents are Trial online buyers. 21 percent of the respondents are Occasional online buyers. 29 percent of the respondents are Frequent online buyers and 34 percent of the respondents are Regular online buyers.
Table-3 Items Purchased by the Respondents
Source: Primary Data
From the above table it is clear
that 3 percent of the respondents
have purchased books, 19 percent
of the respondents have purchased
tickets, while 11 percent of the
respondents have purchased video-
games. 15 percent of the
respondents have purchased
electronic equipment through
online shopping. 16 percent of the
respondents have purchased
computer wares. 13 percent of the
respondents have purchased clothing through online. 10 percent of the respondents have
purchased musical items and 13 percent of the respondents have purchased toys through online
shopping.
Table -4 Mode of Payment Source: Primary Data
It is clear from the above table that 18
percent of the respondents have made payment
through credit-card, 26 percent of the
respondents made payment through debit-cards,
32 percent of the respondents have made
payment through cash on delivery.
SI. No Frequency of purchase
(in the last year) No. of
respondents %
1 Once in the year (Trial) 24 16 2 2-4 times in the year (Occasional) 32 21 3 5 – 10 times (Frequent) 44 29 4 More than 10 times (Regular) 50 34 Total 150 100
SI. No Items No. of
respondents %
1 Books 5 3
2 Tickets 28 19
3 Video/DVD – Games 17 11
4 Electronics equipment 22 15
5 Computer Hardwar/Software 24 16
6 Clothing 19 13
7 Music 16 10
8 Toys 19 13
Total 150 100
SI. No Mode of payment No. of
respondents %
1 Credit cards 27 18 2 Debit cards 39 26 3 Online bank transfer 48 32 4 Cash on delivery 36 24
Total 150 100

International Conference on INDIA 2030
81 Manonmaniam Sundaranar University, Tirunelveli
Table-5 Previous Purchase Made by the Respondents
Source: Primary data
From the above table it clear that 18 percent of the respondents have made their previous purchase before a week, 25 percent of the respondents have made online shopping 15 days back, 19 percent of the respondents have made online shopping one month back,31 percent of the respondents have made online purchase six months back, while 7 percent of the respondents have made online shopping one year back.
Table-6 Sources of Knowledge
Source: Primary data
The above table indicates that 39 percent of the respondents came to know about online shopping through web-sites, 9 percent of the respondents came to know through advertisements, 25 percent of the respondents knew about online shopping through relatives, while 27 percent of the respondents knew about online shopping through friends.
Table-7 Favorite Web-Site
Source: Primary data The above table shows clearly that 42 percent of the respondents purchased online through amazon.com web-site, 23 percent of the respondents have used red bus web-site, 10 percent of the respondents browsed through Buy.com, 14 percent of the respondents prefered e.toys.com web-site for purchasing toys through online, while 11 percent of the respondents prefered Flip kart web-site for online shopping.
Table-8 Amount Spent Annually on Online Shopping Source: Primary data
The above clearly shows that 21 percent of
the respondents spent less than Rs.5000 annually
on online shopping. 27 percent of the respondents
spent Rs.5000 –Rs.10000 annually on online
shopping. 25 percent of the respondents spent
Rs.10000 – 15000, 12 percent of the respondents
spent Rs.15000 –Rs.20000 annually and only 15
percent of the respondents spent above Rs.20000
annually on online shopping. Table-9 Habit of Purchasing on Online
Source: Primary data
18 percent of the respondents
have purchased on online
regularly. 5 percent of the
respondents have purchased
irregularly on online, 23 percent of
SI. No Previous purchase
made
No. of respondents
%
1 Last week 27 18 2 Last 15 days 38 25 3 Last month 29 19 4 Six months back 47 31 5 Last year 9 7
Total 150 100
SI. No Sources of knowledge
No. of respondents
%
1 Web-site 59 39 2 Advertisement 13 9 3 Relatives 38 25 4 Friends 40 27
Total 150 100
SI. NO Web-site No. of
respondents %
1 Amazon.com 63 42
2 Red bus 34 23
3 Buy.com 15 10
4 e.Toys.com 21 14
5 Flip kart 17 11
Total 150 100
Si.No Amount No. of
respondents %
1 Less than Rs.5000 32 21 2 Rs.5000 –Rs.10000 41 27 3 Rs.10000 –Rs.15000 38 25 4 Rs.15000 –Rs.20000 17 12 5 Above Rs.20000 22 15
Total 150 100
SI.NO Habit of purchasing No. of respondents % 1 Regular 27 18
2 Irregular 8 5 3 As and when required 34 23
4 Whenever financial position permits 25 17
5 Festival / Function 56 37 Total 150 100

Vol. 5 Special Issue 3 August 2017 ISSN: 2320-4168
82 Shanlax International Journal of Commerce
the respondents bought on online as and when needed, 17 percent of the respondents bought on
online whenever financial position permits and 37 percent of the respondents buy on online only
during festival seasons or for functions.
Table-10 Opinion about Web-Sites
Source: Primary data
The above table clearly shows that 61
percent of the respondents prefered to visit
the same web-site whereas 39 percent of the
respondents did not prefer to visit the same
web-site again. Most of the visitors trust the
websites they visit often.
Table-11 Reaction to Discount in Prices
Source: Primary data
It is clear from the table that 92
percent of the respondents will wait till
discount in price is offered, whereas 8
percent of the respondents are not
influenced by discount offered in price.
Table-12 Factors influencing the selection of website
Source: primary data
The most important factor for the
selection of website is 'selection of
goods' with the highest score of
4.12.the second factor is price
competitiveness (53.76) followed by
the factor 'saves time to gather
information'(49.62).the other factors
influencing selectin of website is
convenience (44.57), accuracy of
context (41.46) and the fast
information download (39.41).in depth
information (38.62) and stylish
products (33.33).
Table-13 Relationship between intention factors of online buyers and age
Source: Primary Data
SL.No Intention factor of
online buyers
Age group in years Total
15-20 21-30 31-40 41-50 51-60 Above
60
1 Convenience 4
(18.1%) 14
(26.4%) 2
(6.5%) 10
(40.9%) 4
(35.7%) 4
(44.4%) 38
(25%)
2 Website design/features
12 (47.6%)
25 (47.2%)
5 (16.1%)
0 (0%)
0 (0%)
0 (0%)
42 (28%)
3 Time saving 2
(9.5%) 6
(11.3%) 9
(29%) 7
(31.8%) 8
(57.1%) 4
(44.4%) 36
(24%)
4 Security 3
(23.8%) 8
(5.7%) 15
(48.3%) 5
(22.7%) 2
(7.2%) 1
(11.2%) 34
(23%)
21
(100%) 53
(100%) 31
(100%) 22
(100%) 14
(100%)s 9
(100%) 150
(100%)
SI.NO Preference to visit the same
Web-site No of respondents %
1 Yes 92 61 2 No 58 39
Total 150 100
Si.No Discount offered No. of respondents %
1 Yes 138 92
2 No 12 8
Total 150 100
Sl.No Factors Garrett
Mean Score Rank
1 Selection of goods 64.12 I 2 Price competitiveness of
goods 53.76 II
3 Saves time to gather information
49.62 III
4 Convenience 44.57 IV 5 Accuracy of content 41.46 V 6 Fast information
download 39.41 VI
7 In-depth information 38.62 VII 8 Stylish products 33.33 VIII

International Conference on INDIA 2030
83 Manonmaniam Sundaranar University, Tirunelveli
From the above table it can be inferred that 47.6 percent of the respondents in the age group of
15-20 years have 21-30 years, have also the same intention website features while purchasing on
online. the respondents in the age group of 31-40 years purchase on online with the intention of
time saving (41.9%). the majority of respondents in the age group of 41-50 years(40.9%) are also
having the intention of convenience. Majority of respondents in the age group 51-60 years (57.1%)
and those above 60 years (44.4%)each have same intention 'time saving' while buying on online.
The respondents of all age groups lastly have the intention 'security' while buying on online.
Table-14 Relationship between intention of online buyers and gender
Source: Primary Data
From the above table it is clear
that males prefer website design
(24.7%) as well as time saving
(24.7%) intention factors while
pursing on online, whereas majority
of the female respondents have the
main intention as convenience
(44.2%) while purchasing on online.
Table-15 Relationship between intention of online buyers and educational qualification
Sl.No
Intention
Educational Qualification
Total High
School level
Under Graduate
Post Graduate
Professionals Others
1 Convenience 18 (75%)
7 (16.3%)
0 (0%)
12 (57.2%)
1 (3.3%)
38 (25%)
2 Website design/features
0 (0%)
29 (67.4%)
9 (28.1%)
2 (9.5%)
2 (6.7%)
42 (28%)
3 Time saving 6 (25%)
3 (7%)
5 (15.6%)
4 (19%)
18 (60%)
36 (24%)
4 Security 0 (0%)
4 (9.3%)
18 (56.3%)
3 (14.3%)
9 (30%)
34 (23%)
Total
24 (100%)
43 (100%)
32 (100%)
21 (100%)
30 (100%)
150 (100%)
Source: Primary Data
From the above table it can be inferred that for 75 percent of the respondents with school level
of education, purchase factor on online with the intention of convenience.67.4 percent of the under
graduate respondents buy on online due the influence of website design. security factor is the main
intention of post graduate (56.3%) respondents. in case of professionals (57.2%) of the
respondents buy on online due to the convenience factor as the main intention.security factor is the
least influencing intention in case of respondents with high school level of education.
Sl.No Intention Gender
Total Male Female
1 Convenience 11
(12.3%)
27
(44.2%)
38
(25%)
2 Website design/feat 22
(24.7%)
20
(32.7%)
42
(28%)
3 Time saving 22
(24.7%)
14
(23.7%)
36
(24%)
4 Security 34
(26.9%)
0
(0%)
34
(23%)
89
(100%)
61
(100%)
150
(100%)

Vol. 5 Special Issue 3 August 2017 ISSN: 2320-4168
84 Shanlax International Journal of Commerce
Table-16 Relationship between Intention of Online Buyers and Occupation
Sl.No Intention Occupation
Total Students Business
Govt. Employees
Private Sector
Professional
1 Convenience 6 (29%)
15 (38.5%)
9 (42.9%)
4 (8%)
4 (21%)
38 (25%)
2 Website design/features
15 (71%)
3 (7.7%)
0 (0%)
13 (26%)
11 (57.9%)
42 (28%)
3 Time saving 0 (0%)
11 (28.2%)
9 (429%)
15 (30%)
1 (5.3%)
36 (24%)
4 Security 0 (0%)
10 (25.6%)
3 (14%)
18 (36%)
3 (15.8%)
34 (23%)
Total
21 (100%)
39 (100%)
21 (100%)
50 (100%)
19 (100%)
150 (100%)
Source: Primary Data
From the above table it can be inferred that of the student respondents (71%) mostly buy
online due to website features factors and professionals (57.9%) mostly buy online due to website
features factor. Business people (38.5%) mostly buy on online due to convenience factor as well as
government employees (42.9%) also prefer to buy online due to convenience factor. The least
preferred factor among all the respondents, except those from the private sector.
Table-17 Relationship between Types of Online Buyers and Age
Sl.No Types of online
buyers
Age group in years
Total 15-20 21-30 31-40 41-50 51-60 Above
60 1 Trial buyers 0
(0%) 0
(0%) 0
(0%) 5
(22.75) 12
(85.7%) 7
(77.74%) 24
(16%) 2 Occasional Buyers 2
(9.5%) 12
(22.6%) 2
(6.5%) 12
(54.5%) 2
(14.3%) 2
(22.3%) 32
(21%) 3 Frequent 11
(52.4%) 16
(30.2%) 14
(45.2%) 3
(13.6%) 0
(0%) 0
(0%) 44
(29%) 4 Regular 8
(38.1%) 25
(47.2%) 15
(48.3%) 2
(9.2%) 0
(0%) 0
(0%) 50
(34%)
Total 21
(100%) 53
(100%) 31
(100%) 22
(100%) 14
(100%) 9
(100%) 150
(100%)
Source: primary data
From the above table it can be inferred that of the respondents in the age group of 15-20 years
(52.4%) are frequent online buyers. The respondents n the age group of 21-30 years (47.2%) are
regular online buyers and respondents in the age group 31-40 years (48.3%) are also regular online
buyers. Majority of respondents in the age 41-50 years category are occasional online buyers.51-60
years age group mostly (85.7%)and above 60 years old (77.7%) respectively are trial online buyers.
Table-18 Relationship between Type of Online Buyers and Gender
Sl.No Types of online buyers Gender
Total Male Female
1 Trial buyers 5 (5.6%) 19 (31.1%) 24 (16%)
2 Occasional buyers 9 (10.1%) 23 (37.7%) 32 (21%)
3 Frequent 37 (41.6%) 7 (11.5%) 44 (29%)
4 regular 38 (42.7%) 12 (19.7%) 50 (34%)
Total 89 (100%) 61 (100%) 150 (100%)
Source: Primary Data

International Conference on INDIA 2030
85 Manonmaniam Sundaranar University, Tirunelveli
From the above table it is evident that of the male respondents(42.7%) are regular online
buyers whereas majority of female respondents(37.7%) are occasional buyers,
Table-19 Relationship between Type of Online Buyers and Educational Qualification
Sl.No Types of online
buyers
Educational qualification
Total High school level Under graduate Post
graduate professionals others
1 Trial Buyers 15 (62.5%) 4 (9.3%) 0 (0%) 0 (0%) 5 (19.6%) 24 (16%)
2 Occasional buyers 5 (20.8%) 8 (18.6%) 2 (6.3%) 0 (0%) 17 (56.7%) 32 (21%) 3 Frequent
4 (16.7%) 22 (51.2%) 6(18.8%) 4 (19%) 8 (26.7%) 44 (29%)
4 Regular 0 (0%) 9 (20.9%) 24 (74.9%) 17 (81%) 0 (0%) 50 (34%) Total 24 (100%) 43 (100%) 32 (100%) 21 (100%) 30(100%) 150(100%)
Source: Primary Data
From the above table it is clear that of the respondents with high school level of education
majority(62.5%) are trial online buyers whereas in the graduate-respondents (51.2%)are frequent
online buyers. Respondents with post graduate education (74.9%)are regular online buyers. in case
of professional buyers (81%)are also regular online buyers.
Table-20 Relationship between Type of Online Buyers and Occupation of the Respondents
Sl.no Types of online
buyers
Occupation Total
Students Business Govt.
Employees Private Sector
Professional
1 Trial Buyers 1 (4.75%)
2 (5.2%)
11 (52.4%)
10 (20%)
0 (0%)
24 (16%)
2 Occasional buyers 1 (4.75%)
13 (33.3%)
6 (28.6%)
11 (22%)
1 (5.25%)
32 (21%)
3 Frequent
2 (9.5%)
10 (25.6%)
4 (19%)
27 (54%)
1 (5.25%)
44 (29%)
4 regular 17 (81%)
14 (35.9%)
0 (0%)
2 (4%)
17 (89.5%)
50 (34%)
Total
21 (100%)
39 (100%)
21 (100%)
50 (100%)
19 (100%)
150 (100%)
Source: Primary Data
From the above table it is clear that of the respondents who are students (81%) are regular
online buyers. in respondents who are doing business (35.9%) are regular online buyers.
Government employees mostly (52.4%) are frequent online buyers. in case of professionals (89.5%)
are regular online buyers.
Table-21 Relationship between Type of Online Buyers and Family Income
Sl.No Types of
online buyers
Monthly Family Income
Total Less than
Rs.10000
Rs.10000-
30000
Rs.30000-
50000
Above
Rs.50000
1 Trial buyers 9 (26.5%) 6 (13.3%) 6 (13.3%) 3 (12%) 24 (16%)
2 occasional buyers 6 (17.6%) 19 (41.3%) 17 (37.8%) 0 (0%) 42 (21%)
3 Frequent 2 (5.9%) 20 (43.5%) 13 (28.9%) 9 (36%) 44 (29%)
4 Regular 17 (50%) 11 (23.9%) 9 (20%) 13 (52%) 50 (34%)
Total 34 (100%) 56 (100%) 45 (100%) 25 (100%) 150 (100%)
Source: Primary Data
From the above table it can be inferred that respondents n the income group of less than
Rs.10000 are mostly regular online buyers (50%).Respondents in the income group of Rs.10000-
Rs.30000 mostly are frequent online buyers(43.5%).respondents in the income group Rs.30000-
Rs.50000 are mostly occasional online buyers and respondents in the income group of more than
Rs.50000 are mostly regular online buyers.

Vol. 5 Special Issue 3 August 2017 ISSN: 2320-4168
86 Shanlax International Journal of Commerce
Conclusion
Despite being a developing country, India has shown a commendable increase in the
ecommerce industry in the last couple of years, thereby hitting the market with a boom. Though the
Indian online market is far behind the US and the UK, it has been growing at a fast page.
Further, the addition of discounts, coupons, offers, referral systems, 30days return guarantee, 1-7
days delivery time, etc. to the online shopping and the E-Market have added new flavors to the
industry. Social media has now become the hub for the merchants which enables them to analyze
the customer choice based on their purchase activities. Social network like LinkedIn, Twitter,
Google+, Facebook and others have become a medium for easy log-in and purchase. Moreover, the
clients can stay updated via the posts published on this media. Further, the advertising &
promotions on these social sites has increased the chances of success of generating transactions to
many folds.
In the race to acquire customer, e-commerce sites offer deep discount and these discount vary
from site to site depending upon its capacity to negotiate with the supplier. To get the best
discounts, buyer need to search a plethora of sites. Here, Price comparison sites come in like
mysmartprice.com, Pricedekho.com, freekamal.com and Junglee, etc. . The website compare prices
over the entire web and provide users with the best available price. E-Commerce sale through these
website are increasing and will further increase as consumers get more and more discount savvy.
References
1. Amin, S., (2009), Why do so many people shop online?
http://www.articlesbase.com/print/1335596, Articlebase.com.
2. Anonymous, (2009),“How to shop online more safely,” http://www.microsoft.com/
protect/fraud/finances/shopping_us.aspx, Microsoft.com.
3. Bigné-Alcañiz, E., Ruiz-Mafé, C., Aldás-Manzano, J. and Sanz-Blas, S, (2008), “Influence of online
shopping information dependency and innovativeness on internet shopping adoption”, Online
4. Information Review, vol. 32, no. 5, pp. 648-667.
5. Bourlakis, M., Papagiannidis, S. and Fox, H, (2008), “E-consumer behaviour: Past, present and
future trajectories of an evolving retail revolution”, International Journal of E-Business
Research, vol. 4, no. 3, pp.64-67, 69, 71-76.73
6. Broekhuizen, T. and Huizingh, E, (2009), “Online purchase determinants: Is their effect
moderated by direct experience?” Management Research News, vol. 32, no. 5, pp. 440-457.
7. Butler, P. and Peppard, J, (1998), “Consumer purchasing on the internet: Processes and
prospects”, European Management Journal, vol. 16, no. 5, pp.600-610.
8. Chen, R. and He, F, (2003), “Examination of brand knowledge, perceived risk and consumers’
intention to adopt an online retailer”, Total Quality Management & Business Excellence, vol. 14,
no. 6, pp. 677.

International Conference on INDIA 2030
87 Manonmaniam Sundaranar University, Tirunelveli
FOREIGN DIRECT INVESTMENT ON RETAIL SECTOR WITH SPECIFIC REFERENCE
TO SUPERMARKETS IN TAMILNADU
Dr.S.Mahadevi M.Com.,M.Phil.,Ph.D.,PGDCA.,MBA, Assistant Professor of Commerce, Sri Parasakthi College for Women, Courtallam
Abstract Foreign direct investment (FDI) is a direct investment into production or business in a country by an individual or company of another country, either by buying a company in the target country or by expanding operations of an existing business in that country. Foreign direct investment is in contrast to portfolio investment which is a passive investment in the securities of another country such as stocks and bonds Foreign Investment is always accompanied with new technology and idea and leads to skill formation. This fact cannot be denied while weighing the disadvantages of FDI. This paper examines the formats and functioning of retail outlets in Tamilnadu. Introduction
India being second most-populous country has immense scope for retail expansion as along with time urbanization and consumerism has also been increasing. Further, India‘s GDP has also been growing at fast rate as it continued to be the second fastest growing economy in the world after China. As the income of the country increases, demand for goods also increases because there is positive relation between demand and income. Initially India was conservative regarding FDI; it imposed restriction on foreign companies to limit their share in equity capital of their Indian subsidiaries but over the time Government of India gradually liberalized foreign investment in various sectors. Retail Sector in India
Retailing in India is slightly different than in developed markets, in that it is divided in to
organized and unorganized retail. Organized retail could be described as when trading is taking
place under a license or through people that are registered for sales tax or income tax. Unorganized
retail is India’s more traditional style of low-cost retailing, for example, the local kirana shops,
owner-manned general stores, convenience stores, hand carts and pavement vendors. This division
of the retail sector, which has a very heavy weighting towards, unorganized, is just one of the issues
contributing to the sensitive debate on FDI in India at the moment.
Growth in Indian Retail Market
The Indian retail market is currently estimated at US $ 500 billion and is pegged the US $ 1
trillion mark by 2020. Food and Grocery is the largest category within the sector with a whopping
60% share, followed by the Apparel and Mobile Phone Segment.
Retail Market in India
Source: Deloitte Indian Retail Market- Opening more doors
(January 2015)
India’s Retail market, Food and Grocery currently comprises
the largest market segment at around 60 percent, followed by
apparel (8 percent), and mobile and telecom (6 percent). In
organized retail, apparel dominates at 33 percent followed by
food and grocery (11 percent), mobile and telecom (11 percent),
and consumer electronics (8 percent).

Vol. 5 Special Issue 3 August 2017 ISSN: 2320-4168
88 Shanlax International Journal of Commerce
Statement of the Problem
World bank attributes to the opening of the retail sector to FDI to be beneficial for India in
terms of price and availability of product as it would give a boost to food products, textiles and
garments, leather products, etc., to benefit from large scale procurement by international chains; in
turn, creating jobs opportunities at various levels. Shopping for food and grocery products has
witnessed a revolution in Indian retail market with the changes in the consumer buying behavior
driven by strong income growth, changing lifestyles and favorable demographic patterns. Most of
the food and grocery products reach the consumers through traditional kirana stores which are
unorganized. But the very fast changing trends in consumption patterns, food and eating habits of
consumers have contributed immensely to the growth of ‘Western’ format typologies such as super
markets, convenience stores, discount stores, and hyper markets.
Scope of the Study
The present study being a fact finding research, aims at finding out the inflows of FDI in India
from various countries; state, industry wise analysis as to point out those sectors which attract high
share of FDI and ultimately to ascertain whether the industrial development in India is being
influenced by the inflows of FDI or not. Since the topic itself is a contemporarily relevant, the
findings of this study assume greater significance. India is a developing country and Indian
consumers spend a larger of their income on food & Grocery, Beverages, Personal care product. This
retail segment is expected to accurately reflect the performance of organized retail and hence the
scope of study as limited to organized retail formats with food and grocery, Beverages, Personal
care as the major product category.
Significance of the Study
The most significant aspect of this study that it is collected the necessary information from food
and grocery, Beverages, Personal care product in supermarkets. The importance of FDI extends
beyond the financial capital that flows into a country. In addition, FDI inflows can be a tool for
bringing knowledge, managerial skills and capability, product design, quality characteristics, brand
names, channels for international marketing of products and consequent integration into global
production chains, which are the foundation of a successful exports strategy. FDI could benefit both
the domestic industry as well as the consumer, by providing opportunities for technological
transfer and up gradation access to global managerial skills and practices, optimal utilization of
human capabilities and natural resources, making industry internationally competitive, opening up
export markets, providing backward and forward linkages and access to international quality goods
and services and augmenting employment opportunities.
Objectives of the Study
This study has the following major objectives
1. To know the various routes of Foreign Direct Investment on retail sector in India.
2. To study the formats and functioning of retail outlets in Tamilnadu.
3. To determine the impact of Foreign Direct Investment on retail outlets with specific focus on
Supermarkets in Tamilnadu.
4. To study the prospects of organized retail business with special reference to supermarket in
Tamilnadu.
5. To know the perceptions on the new FDI policy in retailing in Tamilnadu

International Conference on INDIA 2030
89 Manonmaniam Sundaranar University, Tirunelveli
Hypothesis
Ho1- There is no significant difference in opinion on growth of Supermarket among different
demographic variables of supermarket owners in Tamilnadu.
Ho2- There is no significant difference in marketing strategies adopted among different
demographic variables of supermarket owners in Tamilnadu.
Methodology of the Study
Proportionate Random Sampling method was used for the selection of sample units.
260 supermarkets were selected from ten districts on the basis of numbers available in each
District. Ten percentage (10%) among the ten selected districts Cuddalore, Erode, Madurai, Salem,
Tiruchirappalli, Tirunelveli, Tiruppur, Vellore, Chennai, Coimbatore were selected for data
collection.
Limitation of the Study
The following are the limitations of the study
1. The study covers only 260 samples units from select ten district Cuddalore, Erode, Madurai,
Salem, Tiruchirappalli, Tirunelveli, Tiruppur, Vellore, Chennai, Coimbatore hence the result
cannot be universalised.
2. I have not selected all District in Tamilnadu. Because constraints of money and time.
Analysis of Personal Variables
Sl. No
Personal Variables
No. of Respondents
Percentage Sl. No
Personal Variables
No. of Respondents
Percentage
Gender wise classification Nature of Ownership
1 Male 228 87.7 1 Proprietorship 220 84.6 2 Female 32 12.3 2 Partnership 40 15.4
Age wise classification Other Professional Experience
1 Below 25 years 6 2.3
1 Less than 3 years
19 7.3
2 26 - 35 years 63 24.2
2 3 < 6 years 35 13.5
3 36 - 45 years 91 35
3 6 < 9 years 57 21.9
4 46 - 55 years 61 23.5
4 Above 9 years 24 9.2
5 above 55 years 39 15
5 No experience 125 48.1
Annual income Reason for choose supermarket business
1 Below 5 Laksh
22 8.5 1 Hereditary 31 11.9
2 5 < 10 Laksh
71 27.3 2 Livelihood 59 22.7
3 10< 15 Laksh
94 36.2 3 Easy to Form 41 15.8
4 Above 15 Laksh
73 28.1 4 Personal Interest
129 49.6
Number of years running the supermarket Number of Supermarket Owned
1 Less than 3 years 11 4.2
1 Single 188 72.4
2 3 < 6 years 40 15.4 2 Two 49 18.8 3 6 < 9 years 67 25.8 3 Three 18 6.9
4 Above 9 years 142 54.6
4 More than Three 5 1.9

Vol. 5 Special Issue 3 August 2017 ISSN: 2320-4168
90 Shanlax International Journal of Commerce
Management of Supermarket Educational Qualification
1 Self 100 38.5 1 Illiterate 5 1.9 2 Family 49 18.8 2 Literate with no
formal education 57 21.9 3 Relatives 52 20 3 Primary/5th
Standard 40 15.4 4 Partner
40 15.4
4 High school / 10th Standard 31 11.9
5 Employee 19 7.3 5 Intermediate / 12th Standard
23 8.8
Any other professional experience other than supermarket retail business
6 Diploma
14 5.4
1 Yes 135 51.9 7 Graduate 54 20.8 2 No 125 48.1 8 Post Graduate 36 13.8
Opinion on Growth of Supermarket among Different Annual Income of Retailers – Anova
Opinion Annual Income Sum of
Squares df
Mean
Square F
p
Value
Raising incomes and improvements
in infrastructure
Between Groups 11.906 3 3.969 2.976 .032
Within Groups 341.398 256 1.334
Total 353.304 259
Liberalization of the Indian
economy
Between Groups 40.822 3 13.607 7.572 .000
Within Groups 460.024 256 1.797
Total 500.846 259
Increase in spending per capital
income
Between Groups 25.720 3 8.573 6.313 .000
Within Groups 347.645 256 1.358
Total 373.365 259
Advent of dual income families also
helps in the growth of supermarket
Between Groups 4.651 3 1.550 .793 .499
Within Groups 500.288 256 1.954
Total 504.938 259
Consumer preference for shopping
in new environment
Between Groups 3.452 3 1.151 .931 .426
Within Groups 316.409 256 1.236
Total 319.862 259
The billion plus population further
attracts foreign retailers
Between Groups 10.068 3 3.356 2.439 .065
Within Groups 352.178 256 1.376
Total 362.246 259
Raising employment opportunities
in supermarket
Between Groups .176 3 5.855E-02 .031 .993
Within Groups 487.559 256 1.905
Total 487.735 259
Source: Derived data.
Summary of Findings
Findings on Impact of FDI in Retail Sector
Among the most advantages of FDI in retail sector, all product in one place and quality product
are ranked to be important ones. Price and availability of branded items are the next most
advantages of FDI in retail sector.
Among the most disadvantages of FDI in retail sector, against of Swadeshi policy and discourage
of domestic products are ranked to be important ones. High penetration is possible and cultural
change are the next most disadvantages of FDI in retail sector.

International Conference on INDIA 2030
91 Manonmaniam Sundaranar University, Tirunelveli
It is observed that 52.3 per cent of the retailers aware about foreign direct investment and 47.7
per cent of the retailers not aware about foreign direct investment.
Majority of 33.1 per cent of the retailers know about foreign direct investment through TV, 26.5
per cent of the retailers know about foreign direct investment through internet, 20.8 per cent of
the retailers know about foreign direct investment through Newspaper/Magazines and 19.6 per
cent of the retailers know about foreign direct investment through discussion with others.
It is found that 82.7 per cent of the retailers have experienced impact on the current business
and 17.8 per cent of the retailers have not experienced any impact on the current business.
It is observed that majority of 65 per cent of the retailers said that FDI in retail will close
supermarket and the remaining 35 per cent of the retailers mentioned that FDI in retail will not
close supermarket.
Suggestion
Margin should be increased to the retailers in order to increase the sales.
Sales promotion schemes should be introduced to the retailers and customers at frequent
intervals.
More schemes are expected by the retailer’s like-displays and discounts.
Supermarkets should modernize their stores by introducing computerized billing system
whereby the customers may know the savings in their money when discounts offered.
Government should take steps to control the prices.
Major cosmetic companies like Unilever, Nestle, Coco cola, etc. may avoid supplying
commodities directly to such Supermarkets which helps them to get commodities at lesser
prices.
Conclusion
After analyzing retail Industry, it is concluded that the organized retail trading has
opportunities to grow up in spite of the Foreign Direct Investment because of the economic growth
of the country. Many retailers are facing financial, as well as non-financial problems. There is a
serious problem in respect of their financial resources. Majority of the retailers suffering from lack
of funds for investment. However Tamilnadu retail market has a bright future to spread out their
business in all corners by satisfying the needs of customers.

Vol. 5 Special Issue 3 August 2017 ISSN: 2320-4168
92 Shanlax International Journal of Commerce
THE EFFICIENT RAILWAY SIGNAL MANAGEMENT SYSTEM BASED ON
ZIGBEE WIRELESS COMMUNICATION
V.Vivek & D.Murugan
Department of Computer Science & Engineering, M.S University, Tirunelveli, India
Abstract This paper describes more efficient railway signal management system to provide easy handling and power consumption in railways. a method of intelligent railway signal controlling system based on ZigBee wireless communication technology is introduced in this paper, and the unique design scheme is also presented. base-station having a ZigBee hub to control and managing the in and out locomotives, the ZigBee hub has an unique code transmission function to educate the multiple locomotives by its own ZigBee based reception that is already developed. The system can normally achieve the railway signals with help of signal base-station control by the use of respective command like red, green. This system is more intelligent and humanized then the traditional railway signal controlling environment. Keywords: ZigBee, Intelligent communication, Command, Locomotive, Railway signal. Introduction
Now a days, to managing the movements of Trains in-between various stations in the railways
has become a crucial task by the involvement of both human and also data transfer
(Telecommunication). The signal and telecommunication (ST) department is the only responsible
for the installation and also maintenance of the entire signaling system for the safety and speedy
movements of trains. Realtime lifeline for the cheapest travelling in india is Railway transportation.
Due to the rapid growing of population, Indian Railway may need many actions to overcome the
issues that are associated in that. When the people go through the newspaper daily, they could find a
news on railway accidents on railroad railing. The accident ratio on a survey inbetween 1965 to
present is listed below
Table 1: Survey in Train Accidents upto now
Normally railroad based accidents are more
dangerous than any other accidents, therefore a
system is must be take more efforts to overcome
that problems. This present collision are classified
into some categories that are shown in the table 1.
Railway systems are having more crucial aspects
than the other transportation. As compare with the
Airplane traffic management system this railway
security system are not in an effective one. So automatically the security procedures are needed to
handle it for more safety and reliability. There are more uniformed communication on the railways
[1,8], the loco pilot is more cassias then the others. As a result of this both loco pilot and signal
engineers are place the vital in the entire railway transportation.
Telecommunication is the vital unit to manage the entire network for a railway division. In the
case of Indian Railway system are already having the in-house railway telecommunication network
for the management of trains operation and also the staff management among the passenger
amenities [1]. Normally Trains needs constant signals at each station. For the urban area the system
needs proper signal controlling. Where as in the case of suburban are the system will works
Accident Caused by Percentage (%)
Unmanned Level Crossing 40%
Collision 33%
Fire 5%
Misc 4%
Derailment 10%
Manned 9%

International Conference on INDIA 2030
93 Manonmaniam Sundaranar University, Tirunelveli
according to the flag masters commands, there the loco pilot are no need to consider the flag unless
the signal came up from the telecommunication department.
Figure 1 Traditional Signal Transmission Scene
Effective railway traffic control system requires dedicated point-to-point and point-to-
multipoint circuits for the communication over the larger value of signal points are spread along the
tracks. But for the recent days this signaling is most often become a crucial task in the train
management. When there is a delay occurring in the remote areas during the peak hours, leads to
time delay and also loss.as a result of this loss may leads to damage by the unreached services and
telecommunication systems. The traditional railway signaling may having this following features for
the both Signal and Telecommunication system. It has the following features
Multiple aspect Colour Light Signaling (MACL)
MACL signals are having better visibility and quick responsibility with low maintenance.
Route Relay Interlocking (RRI)
Entire Station are manipulated by the track circuits. Management of every circuits are based on
the Knobs (or) small yards.
Panel Interlocking System: Unlike RRI system points and signals are operated by the individuals.
Solid State Interlocking (SSI)
SSI systems are recently introduced in the railways. It works based on the response from the
microprocessor by the software programming.
LED signals for Colour Light Signalling (LED)
LED lights are introduced for the replacement of older version bulbs. It gives more life to the
signaling systems. It is also more reliable by reducing the signal lamp fusing.
Track Circuiting
Track Circuiting are mainly used to find the presence (or) absence of the train on the particular
track. Now a days this is the backbone for the railway signaling. It ensures the complete safety to
the train from the human failures.
Level Crossing
Unmanned gates are maintained by the manning systems based on the telephone facilities from
the nearest station are alert in-advance before the train approach the unmanned gates.

Vol. 5 Special Issue 3 August 2017 ISSN: 2320-4168
94 Shanlax International Journal of Commerce
So to avoid the involvement of human-being and to ensure the speedy access of the signaling,
this present work introduce the wireless based signaling environment, Along with the
implementation of ZigBee based unit railway signaling is gradual replacement of traditional
signaling system with higher power consumption [2]. Meanwhile, the traditional “Next Generation
ZigBee” based intelligent system is produced.Railway signal control system based on ZigBee
wireless network is a combination of ZigBee’s advantages in wireless network, long-range wireless
transmission and signal characteristics of high range base
station signal efficiency and low power, it is not only
providing security, easy and control. But also convenient
in handling signals without the involvement of usual
wired communications [3].
Figure2 shows the internal concepts of signal
transmission scene based on ZigBee wireless network.
Normally it has good applicability in the railway signal
control systems.
Figure2. Diagram of Proposed Signal Transmission Scene
Advantages
Traditional way of handling signal based on LED lamp is still an efficient system in India.
But managing more number of locomotives with more number of tracks is not possible by a single
signal engineer. Sometimes it may leads to and mistake, so that this present work having an
excellent functionalities as compare with traditional signal system.
The advantages of this work is as follows:
Unique Code/Command to the every locomotive whichever is present on a division. So that signal
engineer can access it in an easy manner without any failure.
It cannot be accessible/breakable by the hackers, if sometimes such things may happens the
receiver does not allow them to control it.
It will receive the respective signals/command with the reasonable distance about 800meters in-
advance for both the sides.
Mesh topological structure where formed for the future enhancement of additional locomotives.
System Hardware Design
ZigBee, IEEE 802.15.4 standard was finalized in 2003, is the low speed wireless Personal Area
Network (PAN) standard is determined by IEEE and satisfies Open System Interconnection (OSI)
reference model of the International Organization for Standardization (ISO). With the comparison of
other wireless network, IEEE 802.15.4 agreements have the outstanding advantages like: excellent
network capability, long range adaptation with high reliability and energy efficiency. ZigBee
technology protocol is based on the IEEE 802.15.4 and the architecture is as follows. PHY and MAC
layers protocol of ZigBee technology mainly uses IEEE 802.15.4 standardization on the ZigBee
alliance is responsible for network (NWK) and application layers development and for formulating
security agreements [6]. Usually MAC layers implements the functions required by IEEE 802.15.4
specification, and it is independent of processing for the incoming data requests. ZigBee Device
Object (ZDO) and application object defined by the Manufacturing [6,9]. APS layer mainly provides
interface of ZigBee end point. The application progress will use this layer to open or close the one or
more end points and get or send data, hardware arrangements are shown in the Figure 3, below.

International Conference on INDIA 2030
95 Manonmaniam Sundaranar University, Tirunelveli
Figure 3. ZigBee Transceiver
This present system consists of two
major parts, respectively for one sending
(Base/Signal Station) and two receiving
modules (Locomotive 1, Locomotive 2),
shown in Figure2.The part of the signal
station module includes main control
high performance EPROM CPU, ZigBee RF
(Radio Frequency) transmission system
and MAX 232 relay. Signal engineer can
send commands to the control chip by the
switch placed in respective to the locomotive, and the respective data will be transmitted by the RF
module. Each transmission can have a separate 4 digit code R1, G1, R2, G2….etc., for the particular
locomotive. In this part, the 4 digit data will be transformed into the corresponding ZigBee which is
already specified i.e.: R1-Red for Locomotive 1. Then the ZigBee may makes the respective LED
(Red) to produce presupported lighting effect. Figure.4 the hardware structure is shown below.
Methodologies to Concentrate
Level-crossing accident protection system.
Wireless Technology for the Railway signal Indicators.
Alternate train collision avoidance system.
Cost-Effective protective systems in all the stations.
Figure 4 Hardware structure of signal system
System Network Architecture
ZigBee Technology
ZigBee technology is IEEE 802.15.4 according to the contents of the ZigBee specification
agreements [5]. The specifications divided into 5 layers, ZigBee alliance establishes NWK layer and
security layers by itself, the application layer, irrespective to the user’s needs, can be adoptable by
the user. So automatically it provides a mobility and flexible way to build a network for the user
needs [4].According to the IEEE standard range of IEEE 802.15.4 agreement, operation of ZigBee

Vol. 5 Special Issue 3 August 2017 ISSN: 2320-4168
96 Shanlax International Journal of Commerce
can be divided into 3 frequency ranges likely 868 MHz, 915 MHz and 2.4 GHz [3]-[6].The 2.4 GHz
falls into 16 signal channels respectively, it is only compatible for industry, science and medical
applications [7], it uses DSSS and O-QPSK technology about a 250kbs data transfer rate with this
fixed bandwidth ratio.
Network Architecture
In this wireless signal transmission network, the functions of ZigBee nodes are different and
also divided into two categories like, sender and receiver. The major task for the sender is to start a
network, and also to allow the other equipment to join in the network. But the receiver also have
the specific responsibility to maintain the network structure. So in this process the system must be
having the specified node structure for all the corresponding nodes. Whenever the equipment is
joined to the network, the sender will allocate a 16bit 4digit data to it. This data is unique to the
every individual locomotives present in thenetwork/division [2]. And it can be used to identify and
sends the data in order to make the communication in-between both sender and receiver by the use
of MAX 232 communication port. And then automatically the system can scan the network topology
that presently available nearby. Figure. 5 shows the topological structure of the described mode.
Figure 5 Network Topology of ZigBee
Methodology
Evaluating the requirements in the safety management information system, In addition to the
information on train collision avoidance.
Review on the effective safety measures and the enhancement on railway security.
Assessment on level crossing and safety issues.
Examine the cost effective system for all environment.
Reviewing the technical attributes and technical attribute which is suitable for the network, like
Anti Collision Device (ACD).
System Software Architecture
According to the different function in the system, this proposed work must give corresponding
design to the both base station (Sender) and remote router (Receiver), after that only it can be
achieve the target for the system actually build for.

International Conference on INDIA 2030
97 Manonmaniam Sundaranar University, Tirunelveli
Table 2 Transmitter.C (Base Station)
Figure 6 Fireware process of the ZigBee hub to remote locomotive
Figure.6 shows the fireware process of the ZigBee hub to remote locomotive process to the
architecture. When the network is build, the sender chooses the controlled object first (Red) by
using a switch R1, as a result of that corresponding 4 digit code has been send to the receiver ZigBee
“oxoC” respectively, like
Table 3 Coordinator Function Figure 7 Coordinator function selection
Signal Base-Station
Sender (Base Station)
Receiver (Locomotive)
R1 Red - 0x0C Locomotive 1
G1 Green - 0x03 Locomotive 1
R2 Red - 0xC0 Locomotive 2
G2 Green - 0x30 Locomotive 2
if (UART1_Data_Ready() == 1) /// if data is received
{
UART1_Read_Text(output, "OK", 10); /// reads text until 'OK' is found
/*UART1_Write_Text(output); /// sends back text
UART1_Write(0x0d);
UART1_Write_Text("StOP");
UART1_Write(0x0d);*/
if(strcmp(output,"G1")==0)
{
PORTB=0x03;
}
else if(strcmp(output,"R1")==0)
{
PORTB=0x0C;
}
else if(strcmp(output,"COL")==0)
{
PORTB=0x30;
}
else if(strcmp(output,"R2")==0)
{
PORTB=0xC0;
} } } }

Vol. 5 Special Issue 3 August 2017 ISSN: 2320-4168
98 Shanlax International Journal of Commerce
On through the ZigBee network, receiver receives the respective command signal and execute
the respective function like, Figure7. Shown. When the signal base-station engineer enables R1, the
corresponding receiver will get the particular code to alert the locomotive 1. Once the receiver gets
its command, it can automatically warn the Loco Pilot through both Red LED indication as-well-as
APR voice command. Likewise all the other three commands will work accordingly to the key which
was enabled by the signal engineer from the base-station. The Actual functionality of the proposed
work shown in the Figure8. The workflow of the system must need a manual operation by human-
being. But once it was getting enabled by them, then it will react according to the command the
system already programmed in the microchip. The fully automated electronic system is not possible
in the Indian railway environment, why because of the rapid growth of the population the system
needs more no of locomotives to function. So that this proposed work can able to build/maintain a
work on the present modernized locomotives, but the older locomotives are not well structured
either in the functionality wise and also the system wise. So that this present work is carried out to
overcome these issues in an effective way. The present work does not need any other formal
architecture or structure. It is only require to place the particular unit to the respective locomotive,
as a result of that give a better solution in a low cost. Once the system has been established signal
engineer can automatically control the entire locomotives in an effective way.
Figure 8 System Architecture
In future, increasing levels of locomotive can be controlled by a GUI (Graphical User Interface)
instead of having more no of switch/relay. Signal engineer have to simply click on the respective
locomotive menu in the GUI panel.
Experimental Results
This efficient railway management system is tested with many aspects like closed hall hills and
then closed forest stations. Finally it has been given the good results at the end. Basically wireless
communication units lose its data/information on the above said regions due to the blocks that are
present in the railway path, based on these metrics alone this system is examined. When the signal
engineer enables the Switch R1, immediately the transceiver sent the respective 4-digit unique code
until the receiver receives it. So once the receiver receives the corresponding unique code it will
respond accordingly, accordingly all the other signals like G1, R2 and G2 will work. So that the
traditional way of having LED lamp based techniques has been replaced by this present system with

International Conference on INDIA 2030
99 Manonmaniam Sundaranar University, Tirunelveli
more efficient. The functional operation of ZigBee transmission scene using hyper terminal is
shown below, figure 9.
Figure 9 HyperTerminal out for R1 (Red-Locomotive 1)
Conclusion
This proposed work has many advantages due to the realization of functionalities that are
mentioned above. Instead of having older versions like LED lamp based signal indicator this ZigBee
based wireless transmission network is the best solution to handle the railway signals. And also by
the use of the switches may cause failure due to its own connectivity problem, so the graphical user
interface (GUI) based controller menu may replace the problem that are caused by switches. To sum
up, system can not only well improved one to maintain the railway signaling and modernized, but
also incorporate humanization and intelligent.
Advantages
Power Saving – With short working period, it consumes low power to communicate, and
standby mode also.
Reliability – With the Special type of time slot allocated system for the communications on a
fixed bandwidth conflict are avoided. The MAC layer is completely confirmed data transmission,
so that every data packets are sent and that should be wait for the conformation from the
receiver.
Low Cost – ZigBee is environmentally a cheapest unit for the effective wireless transmission.
Security – The data packets are more protective from the external interferences.
Acknowledgements
This work has been approved by the Department of Science & Technology-Science &
Engineering Research Board (DST-SERB), Government of India, New Delhi, India. Order No:
SERB/F/4603/2013-2014
References
1. Jinsoo Han, C.-S. I. (2011). More Efficient Home Energy Management System based on ZigBee
communication and infrared remote controls. IEEE, 85-89.
2. Lin Fang-jian, X. B.-g. (2009). Street Light Energy saving control system based on ZigBee
network. Control engineering of China, Vol 16,No. 3, 324-326.
3. Liu Peng, S. D. (2009). ZigBee wireless energy-saving lamps control system based on CC2480.
Communication Technology Vol.42,No. 01, 331-335.
4. Mao Xing-wu, Z. Y.-w.-j.-w. (2008). New generation of green light LED and applications. Beijing:
People's posts and Telecommnunication press.

Vol. 5 Special Issue 3 August 2017 ISSN: 2320-4168
100 Shanlax International Journal of Commerce
A STUDY ON PERFORMANCE AND EFFECTIVE FUNCTION
OF RUBBER BOARD IN KANYAKUMARI DISTRICT
B. Felix Francy
Asst. Prof. of Commerce, St. John’s College, Palayamkottai
Dr. B. Revathy
Prof. and Head of Commerce, M.S. University, Tirunelveli
Introduction
The Indian rubber board was constituted under the Rubber (Production and Marketing) Act
1947. This Act was passed on the recommendation of an adhoc committee appointed by the
Government of India in 1945 and it came into force on 19 April 1947. The Rubber production and
Marketing (Amendment) Act of 1954 made certain changes and renamed as “The Rubber Board”.
The Rubber Board helps the small growers get subsidy from the central government. The head
office of the rubber board is in Kottayam. These are so many branches related with Kottayam main
office; the branches are in Nagercoil, Marthandam, Manalodai in Kulasekharam area. The rubber
board was started about 50 years back. These offices were started for the benefit of small growers
this will enhance the production and marketing of rubber. The functions of rubber board are given
below:
Objectives of the Study
1. To study the NR growers satisfaction about the functions of Rubber Board.
2. To know the methods of cultivation and distribution of rubber supported by Rubber Board.
3. To offer findings and suggestions to development of functions by rubber board.
Sample Design
Rubber plantations are located in the northern part of the taluks namely Kalkulam, Vilavancode
and Thovalai. From the total sample of the study, 150 respondents are selected among the rubber
producers (cultivators) in Kanniyakumari district.
Importance of Rubber Board
Rubber board implemented two schemes, namely replanting subsidy scheme, and interest free
loans to small scale growers. The board also introduced several other new schemes to help the
small farmers to meet their various needs. Under these schemes assistance was given to farmers for
the maintenance of existing immature areas, manuring, control of abnormal leaf fall diseases,
demonstration and training in correct methods of planting, tapping, co-operative processing ,
marketing.
Functions of Rubber Board
The functions of the board as defined under the Act are:
To promote the development of the rubber industry.
Undertaking, assisting or encouraging scientific, technological or economic research.
Training students in the improved methods of planting, cultivation, manuring and spraying.
The supply of technical advice to rubber growers.
Improving the marketing of rubber.
The collection of statistics from owners of estates, dealers and manufacturers.

International Conference on INDIA 2030
101 Manonmaniam Sundaranar University, Tirunelveli
Securing better working conditions and the provision and improvement of amenities and
incentives to workers.
Duty of the Board
To advise the central Government. On all matters relating to the development of the rubber
industry including the import and export of rubber.
To advise the Central Government with regard to participation in any international conference.
To submit to the Central Government. and other such authorities as may be prescribed half
yearly reports on its activities and the working of this act and
To prepare and furnish such other reports relating to the rubber industry as may be required by
the central government from time to time.
Constitution
The rubber board functions under the Ministry of Commerce and Industry of the government of
India. The board has a chairman appointed by the central government. He is the principal executive
officer responsible for the proper functioning of the board and implementation of its decisions.
Rubber Production Department
The department headed by the Rubber Production Commissioner is responsible for planning,
formulation and implementation of schemes for improvement and expansion of rubber cultivation
and production. The following activities are undertaken by Rubber Production Department:
Rubber plantation department scheme
Production and distribution of improved planting materials
Advisory and extension services to growers
Demonstration of scientific planting and production
Supplies of equipment and materials requiring popularization.
Promotion of Self Help Groups among small growers.
Training of tappers.
Rubber processing and market development division
Implementing schemes for financial assistance to Rubber Processing Schemes, Co-operative
Societies and companies jointly promoted by Rubber Processing Schemes and the board
Organising training programmes and extension activities in the area of rubber processing for
growers, Rubber Processing Schemes processing companies and co-operatives societies for
quality up gradation.
Providing training in grading and grading support to others.
Market Intelligence Cell
Collection, compilation and dissemination of natural rubber prices. This includes the daily,
weekly, bi-weekly, monthly and yearly prices of various grades of natural rubber in the domestic as
well as in the international market. The price data are disseminated through print and visual media.
Assistance from the Rubber Board for Quality Improvement
The Rubber Board has introduced a financial assistance scheme for giving transportation
subsidy to the Rubber Producer’s Societies (RPSs) engaged in collection and transportation of latex
from plantations to the collection/processing centres’ with a view to reducing the border by way of
transportation. The assistance will be at the rate of 25 paisa per kilogram of dry rubber collected as
latex. The following table explains that the members in rubber board by the cultivators in
Kanniyakumari district.

Vol. 5 Special Issue 3 August 2017 ISSN: 2320-4168
102 Shanlax International Journal of Commerce
Table 1: Members in rubber board
Source: Computed from Primary data
Note: Figures in parentheses indicate the percentage to
total
From the above table, it is inferred that 66.6 per cent
(100) of the respondents are members in rubber board
and the remaining 33.4 per cent (50) are not members in
rubber board. It signifies that the majority of the
respondents are members in rubber board because they
are enjoy some privileges.
Co-efficient of regression, for Age and sources of Rubber Board
In order to find out the factors that determine the age of NR growers, and the selected nine
variables have been regressed on sources of Rubber Board of NR by the growers’ index.
The following regression equation has been framed to ascertain the impact of the variables on
awareness.
Age and Sources of Rubber Board
Sources of production Kalkulam taluk Vilavancode taluk Thovalaitaluk
t-value P value t-value P value t-value P value
Methods of cultivation .997 .321 -1.356 .178 2.978 .005
Type of fertilizers used 2.032 .044 .352 .726 1.663 .104
Training to tappers -2.381 .019 4.229 .000 2.429 .020
Subsidiary to re-planting .841 .402 3.191 .002 -1.741 .089
Loan for cultivation 4.502 .000 -1.484 .141 2.938 .005
Loan for sale of rubber sheets -3.690 .000 2.460 .018 3.610 .000
Type of vessels used -1.318 .190 2.446 .018 -1.778 .083
Loan for smoke house -3.217 .002 -2.208 .030 .355 .724
Others 2.451 .016 2.068 .009 .257 .798
ANOVAs 152.757 .000 222.164 .000 98.897 .000
Source: primary data 5% level of significance
The table reveals that, the ANOVA value is found to be significant at five per cent level. This
shows that the regression equation framed is a good fit. The ANOVA value of Kalkulam taluk
indicates that around 152.757, Vilavancode taluk indicates that the value is 222.164 and Thovalai
taluk indicates that the value is 98.897 of the variations in sources of the Rubber Board due to the
selected variables.
Findings of the Study
Rubber board promoted the formation of the Rubber Producer’s Societies at the grassroots’
level. RPS are voluntary organisations registered as charitable societies they are expected to render
economic as well as social benefits to their members. It is help to farmers to replace the old low
yielding uneconomic rubber plantations with high yielding hybrid varieties on scientific lines of
cultivation. Lack of processing facilities to produce goods quality sheets. Construction of efficient
smoke houses is costly. The small grower is forced to sell his produce as soon as it is processed due
to the lack of funds to meet the domestic requirements
Suggestions
The Government should encourage the involvement of female tappers through the Rubber
Board in order to earn more income for the family.
Taluk Members
Total Yes No
Kalkulam 45
(64.3) 25
(35.7) 70
(100)
Vilavancode 35
(68.2) 15
(31.8) 50
(100)
Thovalai 20
(70) 10
(30) 30
(100)
Total 100
(66.6) 50
(33.4) 150
(100)

International Conference on INDIA 2030
103 Manonmaniam Sundaranar University, Tirunelveli
The rubber tappers should adopt the latest scientific methods in rubber latex collection
recommended by the Rubber Board.
The Rubber Board may perform the functions of adviser to the Government by collecting the
statistics of production, consumption and stocks from estates, dealers and manufacturers and
make projections for future supply and requirements.
Active encouragement is given by the Rubber Board in the form of technical and financial
assistance for processing rubber into better quality sheet through a network of extension
offices.
Conclusion
Rubber market in 2016 continues to be driven by moves in other commodity prices and
fluctuation in currencies. NR producing countries are working on short to long measures to ensure
an orderly growth of rubber supply that matches emerging trends in the world demand. The board
will be position to recommend the most economic system of tapping. Surely, the researcher hopes
that rubber board help to the cultivators in future.
References
1. Rubber and its Cultivation, Kottayam Rubber Board publication
2. Rubber Board Commodity Note Rubber Kottayam Rubber Board publication 1990
3. Rubber Board , Rubber Board Bulletion Kottayam 2010
4. Rubber Board , Rubber news Kottayam Dec. 1990 and May 1999
5. Rubber Research Institute of India , National Rubber Agro Management and Crop processing,
Kottayam 2005.
6. Monthly Rubber Statistical News Vol.74.No.12. May 2016.

Vol. 5 Special Issue 3 August 2017 ISSN: 2320-4168
104 Shanlax International Journal of Commerce
A STUDY ON WOMEN OWNED MICRO ENTERPRISES AND PROBLEMS OF MICRO
WOMEN ENTREPRENEURS IN TIRUNELVELI DISTRICT
Dr. R. Santhi Salomi
Assistant Professor, Dept of Commerce, Nazareth Margoschis College, Nazareth
Abstract
Entrepreneurship is considered as one of the most important factors contributing to the economic
development of the society. Entrepreneurs have been considered instrumental in initiating and sustaining socio
economic development. Micro enterprise sector has received quite a lot of attention from politicians, professionals
and practitioners. The importance of promoting Micro Enterprises is an effective mean of combating poverty and
creating employment and income for large segment of population particularly for those segments affected by
structural adjustments and economic liberalization programme. The borrowers of micro enterprises face many
problems and difficulties from institutional sources with their complicated and lengthy procedures. So it is
necessary to assess the problems faced by micro entrepreneurs in Tirunelveli District. The study has been based
on both primary as well as secondary data. The primary data were collected directly from the women micro
entrepreneur in Tirunelveli District. The researcher collected the secondary data from the books, records and
reports to use them in appropriate places in the present study. The sample selection is purely based on the
judgment of the investigator or the researcher. The researcher has selected 200 respondents for the study. The
study is concluded with the words which emphasize the development of women entrepreneurs. Individually,
business ownership provides women with the independence they crave and with economic and social success they
need. Nationally, business ownership has great importance for future economic prosperity. Globally, women are
enhancing, directing, and changing the face of how business is done today. Ultimately, female business owners
must be recognized for who they are, what they do, and how significantly they impact the world’s global economy.
Keywords: Micro Enterprises, Women Entrepreneurs and Women Owned Business
Introduction
Entrepreneurship is considered as one of the most important factors contributing to the
economic development of the society. Entrepreneurs have been considered instrumental in
initiating and sustaining socio economic development. Micro enterprise sector has received quite a
lot of attention from politicians, professionals and practitioners. The importance of promoting
Micro Enterprises is an effective mean of combating poverty and creating employment and income
for large segment of population particularly for those segments affected by structural adjustments
and economic liberalization programme. Micro-enterprises not only enhance national productivity,
generate employment but also help to develop economic independence, personal and social
capabilities among rural entrepreneurs. In India, most of the women now show their preferences
towards the entrepreneurship rather than going into the fields of professional or other services.
Women choose both the traditional (toy making, pickle making, candle making, etc.) as well as the
non-traditional (running garment shops, beauty-parlours, computer-centres, etc.) activities and
they perform well. Generally, women opt for micro-enterprises because of certain unavoidable
factors and issues like, limited capacity, low level of confidence, little access to technical
information, poor local market conditions, less access to capital, etc
Scope of the Study The present study makes the researcher to have an insight about the problems faced by women
micro entrepreneurs in Tirunelveli district. This study is totally relevant to the present days

International Conference on INDIA 2030
105 Manonmaniam Sundaranar University, Tirunelveli
problem pertaining to the development of women entrepreneurship. An attempt has been made to
find out the various causes for the above problem. This study also helps to suggest necessary
remedial measures to reduce the problems available for the women entrepreneurs for starting -and
continuation of the entrepreneurship.
Need for the Study
The present study is an attempt to examine the peculiar problems of women micro
entrepreneurs in Tirunelveli district, while starting the unit and in running the units and to suggest
measures for improving the present position, based on the study. So far studies on these lines were
not conducted in Tirunelveli district and in the light of this research gap, the present study will be
useful to the government and other agencies as well.
Methodology
The study has been based on both primary as well as secondary data. The primary data were
collected directly from the women micro entrepreneur in Tirunelveli District. The researcher
collected the secondary data from the books, records and reports to use them in appropriate places
in the present study.
Sampling Design
The sample selection is purely based on the judgment of the investigator or the researcher. This
is because, the researcher lacks information regarding the population from which he has to collect
the sample. Population characteristics or qualities are not known, but sample has to be selected. In
such instance, Judgment sampling method is used. The investigator on the field decided to select
any item of his choice to constitute the sample. The researcher has selected 200 respondents for the
study.
Limitations of the Study
Every study has its own error and limitations. The current research work also suffers from the
following limitations.
1. Only a limited number of sample size were taken into consideration, because of time
constraints.
2. Due to lack of information about definite population, Judgment sampling (One of the method of
non-probability sampling method) method is applied.
3. Most of the responds are reluctant to furnish the data.
Analysis and Interpretation
Table 1: Age wise classification of micro entrepreneurs
Source: Primary data
The age wise distribution of sample
micro entrepreneurs explains that most of
them are relatively middle aged 44% of
them from the age group 26-35 years.
Entrepreneurs above the age of 51 are
very limited in number. Hence, it is
inferred that middle age group is more
interested. Of these two categories, middle aged category has been placed number one, because this
group is the productive age group which also determines the relative strength of the entrepreneur
and risk taking capacity.
Sl. No Age No. of Respondents Percentage
1. Below 25 15 7.5
2. 26-35 88 44.0
3. 36-45 47 23.5
4. 46-50 38 19.0
5. 51 and above 12 6.0
Total 200 100

Vol. 5 Special Issue 3 August 2017 ISSN: 2320-4168
106 Shanlax International Journal of Commerce
Table 2: Marital Status wise classification of micro entrepreneurs
Source: Primary Data
Out of the sample respondents, 84
per cent were married while 7.5 per cent
were unmarried. Among them, 6.7 per
cent were widows and 2.5 per cent
divorcee. Hence, it is inferred that
married people are much interested in
starting and running micro enterprises than the unmarried. This shows that they are coming into
the business world due to the family circumstances. And the predominant reason for unmarried
women not opting for entrepreneurship is the uncertainty of the place where they would be settling
after the marriage. In the male-dominated society, the women need to go with the husband and
hence the unmarried women do not dare to start entrepreneurial ventures, lest, they might be
forced to close their ventures if married to persons at a different place.
Table 3: Type of family of micro entrepreneurs
Source: Primary Data
From the table 3, it is found that
72.5% of the respondents live in the
nuclear setup. Man being the only
bread winner of the family, the
woman (wife) has to support the family with an additional family income. This family setup has
forced the respondents to indulge in entrepreneurial activities and the fact that 27.5% of the
respondents in joint families entered entrepreneurship because of their family elders are helping
them by looking after their children when they are doing business.
Table 4: Nature of Activities of the Respondents
Source: Primary Data
A look at the nature of activities
in which the respondents were
engaged makes it clear, those
women entrepreneurs in the sample
have broken myth to some extent
and are exploring new avenues of
economic participation. 26% of the
respondents engaged in production
process followed by 18.5% are undertaking grocery shop and another 18.5% are engaged in
product sales only very meagre (2.5%) are engaged in tailoring.
Table 5: Reason for the choice of the present activity
Source: Primary data
It could be seen from Table 5 that of the various reasons given by the sample entrepreneurs for selecting the entrepreneurialactivities in which they were found, as many as 24.5 per cent have opted ‘the previous experience in the same line
Sl. No Marital Status No. of Respondents Percentage
1. Married 168 84.0
2. Unmarried 15 7.5
3. Widow 12 6.0
4. Divorce 05 2.5
Total 200 100
Sl. No Family Structure No. of Respondents Percentage
1. Nuclear 145 72.5
2. Joint 55 27.5
Total 200 100
Sl. No Activities No. of Respondents Percentage 1. Production process 52 26.0 2. Food Processing 30 15.0 3. Tailoring 16 8.0 4. Grocery Shop 37 18.5 5. Beauty Parlor 23 11.5 6. Product Sales 37 18.5 7. Tailoring 05 2.5 Total 200 100
Sl. No Reasons No. of Respondents % 1. Training received 23 11.5 2. Family business 29 14.5 3. Previous experience 49 24.5 4. Constant Demand 14 7.0 5. Easy Marketability 28 14.0 6. High profit margin 20 10.0 7. To be self employed 26 13.0 8. Can be done as a household activity 11 5.5 Total 200 100
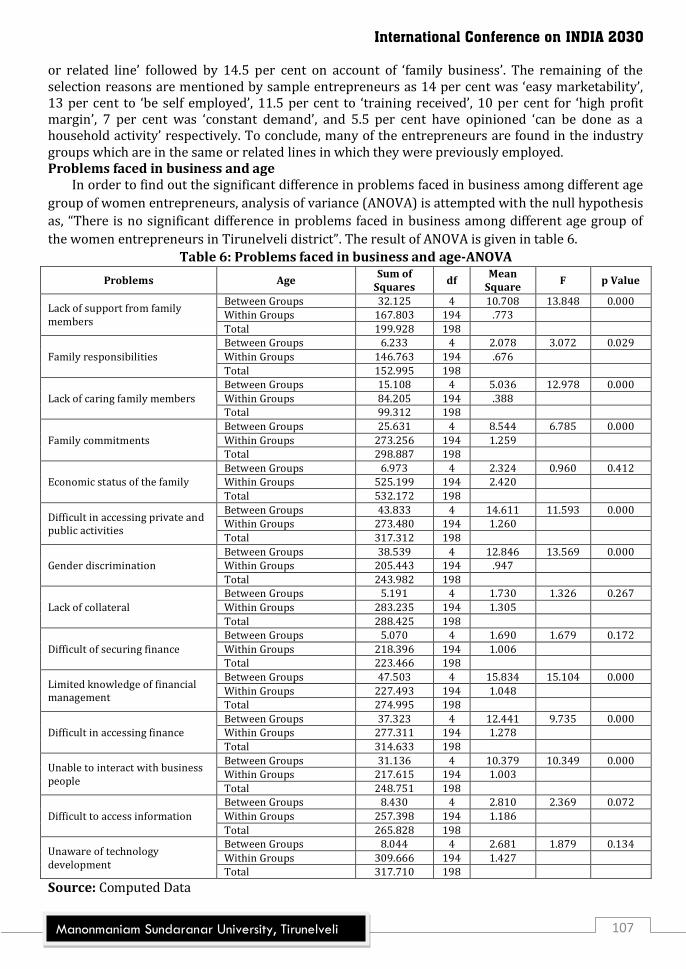
International Conference on INDIA 2030
107 Manonmaniam Sundaranar University, Tirunelveli
or related line’ followed by 14.5 per cent on account of ‘family business’. The remaining of the selection reasons are mentioned by sample entrepreneurs as 14 per cent was ‘easy marketability’, 13 per cent to ‘be self employed’, 11.5 per cent to ‘training received’, 10 per cent for ‘high profit margin’, 7 per cent was ‘constant demand’, and 5.5 per cent have opinioned ‘can be done as a household activity’ respectively. To conclude, many of the entrepreneurs are found in the industry groups which are in the same or related lines in which they were previously employed. Problems faced in business and age In order to find out the significant difference in problems faced in business among different age
group of women entrepreneurs, analysis of variance (ANOVA) is attempted with the null hypothesis
as, “There is no significant difference in problems faced in business among different age group of
the women entrepreneurs in Tirunelveli district”. The result of ANOVA is given in table 6.
Table 6: Problems faced in business and age-ANOVA
Problems Age Sum of
Squares df
Mean Square
F p Value
Lack of support from family members
Between Groups 32.125 4 10.708 13.848 0.000 Within Groups 167.803 194 .773
Total 199.928 198
Family responsibilities
Between Groups 6.233 4 2.078 3.072 0.029
Within Groups 146.763 194 .676
Total 152.995 198
Lack of caring family members
Between Groups 15.108 4 5.036 12.978 0.000
Within Groups 84.205 194 .388 Total 99.312 198
Family commitments
Between Groups 25.631 4 8.544 6.785 0.000
Within Groups 273.256 194 1.259 Total 298.887 198
Economic status of the family Between Groups 6.973 4 2.324 0.960 0.412 Within Groups 525.199 194 2.420
Total 532.172 198
Difficult in accessing private and public activities
Between Groups 43.833 4 14.611 11.593 0.000 Within Groups 273.480 194 1.260
Total 317.312 198
Gender discrimination Between Groups 38.539 4 12.846 13.569 0.000 Within Groups 205.443 194 .947
Total 243.982 198
Lack of collateral
Between Groups 5.191 4 1.730 1.326 0.267
Within Groups 283.235 194 1.305
Total 288.425 198
Difficult of securing finance
Between Groups 5.070 4 1.690 1.679 0.172
Within Groups 218.396 194 1.006 Total 223.466 198
Limited knowledge of financial management
Between Groups 47.503 4 15.834 15.104 0.000
Within Groups 227.493 194 1.048 Total 274.995 198
Difficult in accessing finance Between Groups 37.323 4 12.441 9.735 0.000 Within Groups 277.311 194 1.278
Total 314.633 198
Unable to interact with business people
Between Groups 31.136 4 10.379 10.349 0.000 Within Groups 217.615 194 1.003
Total 248.751 198
Difficult to access information
Between Groups 8.430 4 2.810 2.369 0.072
Within Groups 257.398 194 1.186
Total 265.828 198
Unaware of technology development
Between Groups 8.044 4 2.681 1.879 0.134
Within Groups 309.666 194 1.427 Total 317.710 198
Source: Computed Data

Vol. 5 Special Issue 3 August 2017 ISSN: 2320-4168
108 Shanlax International Journal of Commerce
The above table 6 showed the results of ANOVA based on problems faced in business among
different age group of women entrepreneurs. Since the respective ‘p’ value is less than 0.05 the null
hypothesis is rejected.
Problems faced in business and marital status
In order to find out the significant difference in problems faced in business among different
marital status of women entrepreneurs, analysis of variance (ANOVA) is attempted with the null
hypothesis as, “There is no significant difference in problems faced in business among different
marital status of the women entrepreneurs in Tirunelveli district”. The result of ANOVA is given in
table 7.
Table 7: Problems faced in business and marital status-ANOVA
Problems Marital status Sum of
Squares df
Mean Square
F p Value
Lack of support from family members
Between Groups 24.699 3 8.233 10.196 0.000 Within Groups 175.228 195 .808
Total 199.928 198
Family responsibilities
Between Groups 9.351 3 3.117 4.709 0.003
Within Groups 143.645 195 .662
Total 152.995 198
Lack of caring family members
Between Groups 8.750 3 2.917 6.989 0.000
Within Groups 90.562 195 .417 Total 99.312 198
Family commitments
Between Groups 26.459 3 8.820 7.025 0.000
Within Groups 272.428 195 1.255 Total 298.887 198
Economic status of the family Between Groups 67.448 3 22.483 10.498 0.000 Within Groups 464.723 195 2.142
Total 532.172 198
Difficult in accessing private and public activities
Between Groups 47.521 3 15.840 12.741 0.000 Within Groups 269.791 195 1.243
Total 317.312 198
Gender discrimination
Between Groups 30.390 3 10.130 10.292 0.000
Within Groups 213.592 195 .984
Total 243.982 198
Lack of collateral
Between Groups 33.798 3 11.266 9.601 0.000
Within Groups 254.628 195 1.173
Total 288.425 198
Difficult of securing finance
Between Groups 49.616 3 16.539 20.644 0.000
Within Groups 173.850 195 .801 Total 223.466 198
Limited knowledge of financial management
Between Groups 31.381 3 10.460 9.318 0.000
Within Groups 243.614 195 1.123 Total 274.995 198
Difficult in accessing finance Between Groups 12.171 3 4.057 2.911 0.035 Within Groups 302.462 195 1.394
Total 314.633 198
Unable to interact with business people
Between Groups 46.760 3 15.587 16.745 0.000 Within Groups 201.991 195 .931
Total 248.751 198
Difficult to access information
Between Groups 16.649 3 5.550 4.833 0.003
Within Groups 249.179 195 1.148
Total 265.828 198
Unaware of technology development
Between Groups 9.517 3 3.172 2.234 0.085
Within Groups 308.194 195 1.420 Total 317.710 198
Source: Computed Data

International Conference on INDIA 2030
109 Manonmaniam Sundaranar University, Tirunelveli
The above table 7 showed the results of ANOVA based on problems faced in business among
different marital status of women entrepreneurs. Since the respective ‘p’ value of problems faced in
business is less than 0.05 the null hypothesis is rejected
Suggestions
Low number of women entrepreneurs have recognized in the society, hence they have
frustration in running the business and they have no motivation for business. It is suggested
that people should recognize the women entrepreneurs’ hard work. The most critical factor
here is recognition in the society. The existence of the women entrepreneurs first of all need to
be recognized. Secondly, they need to be recognized as a group contributing towards the
economic growth and development of the country.
Only few women entrepreneurs have benefitted by past experience. Majority of the women
entrepreneurs are not benefitted by past experience hence the women entrepreneurs should
develop their knowledge regarding the business to strengthen.
Majority of the women entrepreneurs ignore the opportunities in business. Hence they face
many problems in business. It is suggested that the women entrepreneurs should utilize
whatever the opportunities arise in the business then only they can develop the business.
Women entrepreneurs cannot handle crisis well in the business. Hence it is suggested that
women entrepreneurs should take necessary steps to handle the crisis well in the business.
Women entrepreneurs have lack of in depth knowledge in the business. Hence they occurs loss
in the business. It is suggested that the women entrepreneurs should develop knowledge in the
business.
Women entrepreneurs feel that they have limited scope for future growth. Hence they are not
successfully run the business, so the women entrepreneurs should not expect future growth
they should concentrate on current growth.
Conclusion
India is a male dominated society and women are assumed to be economically as well as
socially dependent on male members. The absolute dependence seems to be diluted among the high
and middle class women as they become aware of personal needs and demand absolute equality.
It is believed that women have the potential and the determination to set up, uphold and supervise
their own enterprises in a very systematic manner. Appropriate encouragement from the society in
general and family members in particular is required to help these women scale new heights in
their business ventures. The right kind of assistance from family, society and Government can make
these women entrepreneurs a part of the mainstream of national economy and they can contribute
to the economic progress of India.
References
1. S.K.G.Sundram, “Women Entrepreneurship in Mumbai – Problems and Prospects”, National
Seminar on Current trends in Entrepreneurship Research, March 1998, pp.18-20.
2. R. Seenivasagalu, “A Comparative Study of Women Entrepreneurs and Women Executives in
Tamil Nadu”, Unpublished Ph.D Thesis, Madras University.

Vol. 5 Special Issue 3 August 2017 ISSN: 2320-4168
110 Shanlax International Journal of Commerce
IMPACT ON SOCIAL MEDIA MARKETING IN ADVERTISING
M. Nithya
Assistant Professor, Department of Commerce, Manonmaniam Sundaranar Univesity, Tirunelveli
Abstract Social media marketing refers to the process of gaining website traffic or attention through social media sites. Social media marketing programs usually center on efforts to create content that attracts attention and encourages readers to share it with their social networks. The resulting electronic word of mouth refers to any statement consumers share via the Internet (e.g., web sites, social networks, instant messages, news feeds) about an event, product, service, brand or company When the underlying message spreads from user to user and presumably resonates because it appears to come from a trusted, third-party source, as opposed to the brand or company itself this form of marketing results in ‘earned media’ rather than ‘paid media’. Keywords: face book, WOM, Twitter, websites, social network, instant message, news feeds.
Introduction
Social media marketing is the use of social media platforms and websites to promote a product
or service. [1] Although the terms e-marketing and digital marketing are still the dominant terms in
academia, social media marketing is becoming more popular both amongst practitioners and
researchers. [2] Most social media platforms have their own built-in data analytics tools, which
enable companies to track the progress, success, and engagement of ad campaigns. Companies
address a range of stakeholders through social media marketing including current and potential
customers, current and potential employees, journalists, bloggers, and the general public. On a
strategic level, social media marketing includes the management of the implementation of a
marketing campaign, governance, setting the scope (e.g. more active or passive use) and the
establishment of a firm's desired social media "culture" and "tone". To use social media effectively,
firms should learn to allow customers and Internet users to post user-generated content (e.g.,
online comments, product reviews, etc.), also known as "earned media", rather than use marketer-
prepared advertising copy While social media marketing is often associated with companies, as of
2016, a range of not-for-profit organizations and government organizations are engaging in social
media marketing of their programs or services.
Objectives of the Study
To know users perception of social media marketing.
To know the social media marketing strategies
To know the promotion of the product through social media.
Methodology of the Study
This study is conducted by both primary and secondary data. Research methodology is a way to
systematically solve the research problem. It understanding the structure of research. The research
design is the conceptual structure within which research is conducted it constitutes the blue print
for collection, measurement and analysis of data.
Sampling Design
Sampling is the process of selecting a few from a bigger group to become the basis for
estimating or outcome regarding the bigger group. Sampling design is to clearly define set of
objects, technically called the universe to be studied. This research has finite set of universe and the
sampling design used in the study is convenient sampling

International Conference on INDIA 2030
111 Manonmaniam Sundaranar University, Tirunelveli
Sample Unit/ Sample Size
The concern, which is considered for this study is, conducted in “Tirunelveli area” the total
sample size is115. This method adopted for selecting the sample was convenient sampling.
Table 1: Gender wise classification of respondents
Source: Primary data
The table is represents that 65.2% social media user
are male. And 34.78% females are using social media.
This revels that majority (65.2%) of the respondents are
male
Table 2: Classification of respondents’ purpose of using social network
Source: Primary data
This table represents 26.08% of the
respondents are using social media for
charting with friends. 17.39% of the
respondents are using social media for
online trading. Just 13.04% of the
respondents are using social media for
watching advertisements. And 43.47% of the respondents are using social media for entertainment.
This revels the majority (43.47%) of the respondents are using social media for entertainment.
Table 3: Types of social media
Source: Primary data
This table represent there are 60.86% of the
respondents are mostly using face book. Twitter social
network used by 17.39% of the respondents. 8.69% of
the respondents are using pinterest network. 8.69% of
the respondents are using linkedin. 4.34% respondents
are using Instgram. This revels majority (60.86%) of the
respondents are using face book.
Table 4: Classification of respondents of arising problem using of social media
Source: Primary data
This table represents there are 21.73% of the
respondents are affect the slow connectivity of
the internet. 52.17% of the respondents are
affect network problem. And 26.08% of the
respondents are affect no speed transaction. This
revels majority (52.17%) of the respondents are affected the network problem.
Table 5: classification of social media is done promotional activities for marketing
Source: primary data
This table represents facebook is doing 17.39% of the promotional activities for their marketing. Twitter are using 13.04% of the promotional activities. Instagram are using 8.69% of the promotional activities. And also pinterest, linkedin are using same 8.69% of the promotional activities. And You tube are using 43.47% of the promotional activities. This revels majority (43.47%) of you tube can doing promotional activities.
Particulars No of
Respondents Percentage
of respondents
Male 75 65.2 Female 40 34.78
Total 115 100
Particular No of
respondents Percentage of the
respondents Charting with friends 30 26.08
Online trading 20 17.39
Watching advertisements 15 13.04 Entertainment 50 43.47
Total 115 100
Particular No of
respondents
Percentage of
respondents
Face book 70 60.86
Twitter 20 17.39
Pinterest 10 8.69
LinkedIn 10 8.69
Instgram 5 4.34
Total 115 100
Particulars No of
respondents Percentage
of respondents
Slow connectivity 25 21.73 Network problem 60 52.17
No speed transaction 30 26.08 Total 115 100
Particular No of
respondents Percentage of respondents
Face book 20 17.39 Twitter 15 13.04 Instagram 10 8.69 Pinterest 10 8.69 You tube 50 43.47 LinkedIn 10 8.69 Total 115 100

Vol. 5 Special Issue 3 August 2017 ISSN: 2320-4168
112 Shanlax International Journal of Commerce
Findings
Gender : 65.2% of the male respondents using the social media for their purpose.
Age: 69.56% of the respondents are using social media age of below 30years.
Education: 30.43% of the respondents are undergraduate level. They are mostly using social
media.
Occupation: 30.04% of the respondents are students using social media for their purpose including
personal also.
Area: 45.45% of the respondents are living in urban area. Also most of the people using social
media in urban area.
Income: 56.52% of the respondents are income earning below10,000. And also they using mostly
social media for example students.
Marital status: 69.56% of the un married respondents are mostly using social media.
Uses of computer: 100% of the respondents are using computer or laptop or other devices for
their official work and personal work.
Uses of social media: 86.95% of the respondents are using social media. They are said yes for the
use of social media.
Purpose of using social media: 43.47% of the respondents are using computer and also social
media for their entertainment.
Interest of using social media: 82.60% of the respondents are having very interested in social
media marketing.
Advertisement likes social media: 30.43% of the respondents are like the mobile phone
advertisement in social media.
Product purchased through social media: 52.17% of the respondents are mostly like purchased
the mobile phones through social media marketing.
Mostly used the social media: 60.86% of the respondents are mostly using the social media of
facebook.
Social media problem: 52.17% of the respondents are affected the network problem while using
social media.
Companies mostly using the face book: 43.47% of the mobile companies are mostly using face
book for the marketing activities.
Companies mostly using the twitter: 39.13% of the car companies are using the twitter for their
marketing activities.
Promotional activities done by the social media: 43.47% of the you tube social media can take
lot of promotional activities for their marketing
Motivation of purchasing product through social media: 43.04% of the respondents are
motivated by discounts &offers and specification of the products for purchasing through social
media.
Trust of social media advertisements: 73.91% of the respondents are trust social media
advertisements. They said yes for the trust of the social media marketing.
Motivation factors for social media: 34.78% of the respondents are motivated by the
advertisements. Then only they are taking steps for using social media marketing.
Difficulties of social media marketing: 47.82% of the respondents are facing the difficulty of in
quality products. Because the products are can doing transaction only through social media. So the
respondents affected in quality of the products.

International Conference on INDIA 2030
113 Manonmaniam Sundaranar University, Tirunelveli
Suggestions
Now a days the social media marketing are popularly known to all. Everybody can use the social media marketing.
The social media users are should be educated then only they will able to manage the boon or bane of the social media marketing.
Many of the people are not aware of social media marketing so, the face book& twitter should
be create separate websites for easiest way to access the social media marketing.
While someone doing the social media marketing many of the interruption can arise like
network problem, un known request from unknown persons, this types of interruption can
irritate the person, so they can reduce like this activities.
Many of the duplicate companies can entered in social media market. They sell their products to
unknown persons. It should be avoid the follow strict rules and regulation, any specific trade
mark giving for their products, and specific symbol can follow the social media.
Also the social media can create awareness program while doing the social media marketing.
This awareness program like enter in the social media market , should be specific instructions
display in the home page website.
The advertising companies can create their brand name and image in every social media.
In the social media marketing the word of mouth advertising ranks in highest importance. But
all are not true. The different opinion among different users. So the users should realize the
word of mouth news.
Many of the companies will target their customers so they are provide many untrue offer
discounts. So the customers analyze after they can purchase the products.
Purchase the products through social media mostly un quality products will delivered to the
customers. But the customers can check and getting from the delivery man. The customers fully
check their product after that they can buy the products.
If the products buying from social media market is different from direct market. Because some tax, delivery charges added to this product. So the cost is high. The companies can reduce their cost of the products.
Most of the social media users are using the face book and twitter website for their marketing activities. And also many social media available in the marketing field, so the users can using other websites and their marketing strategies.
Conclusion
Several studies conducted that that social media marketing impact good and bad.
Communication of social media marketing. but this user perception towards online users impact of
social media marketing can represents the perception of users the marketing activities and
strategies are going in a right way. But somebody can use miss activities through social media
marketing. The marketing strategies are growing with the help of social media. In this side both
positive and negative thinks are available in the social media marketing. so the users and customers
can understand their strategies, statics, advertisements, etc. they do not believe the social media
advertisement s easily. And the social media can take some of the special activities doing for the
customers.
References
1. Felix, R., Rauschnabel, P.A.; Hinsch, C. (2016). "Elements of Strategic Social Media Marketing: A
Holistic Framework". Journal of Business Research.doi:10.1016/j.jbusres.2016.05.001.
2. Shaltoni, AM (2016-07-01). "E-marketing education in transition: An analysis of international
courses and programs". The International Journal of Management Education. 14 (2): 212–
218. ISSN 1472-8117. doi:10.1016/j.ijme.2016.04.004.

Vol. 5 Special Issue 3 August 2017 ISSN: 2320-4168
114 Shanlax International Journal of Commerce
ANALYSIS OF JOB SATISFACTION OF THE WORKER
OF SALT PAN IN TUTICORIN DISTRICT
S. Muthu Raj
Research Scholar, Department of Commerce, M.D.T Hindu College, Tirunelveli
Introduction
Salt is an important physiological necessity of life with an enormous and growing population,
the demand for salt is of vital importance. Actually there was a salt famine in certain parts of India
during the Second World War. Salt is used for several purposes. It is used for cooking as table salt
and as a preservative in the preparation of condiments, pickles and food stuffs. It is also used to a
limited extent in agriculture as an insecticide, wood killer and for stock feeding. It finds use in
curing fish, meat packing, dairying and other industries to prevent deterioration. It is used in
several industries such as glass, leather, soap, oil purification, dyestuffs, textiles, ceramics,
refrigeration etc. its largest use in the manufacture of sodium components viz. Soda ash, caustic
soda, sodium sulphate etc. In United States out of the total production of 9.3 million tones, the
demand for the manufacture of soda ash, caustic soda and sodium sulphate amounted to 5.32
million tones. In India since the outbreak of the Second World War the industrial uses of salt have
been growing up steadily. Out of the total production, about 60 per cent comes from the private
sector and the rest from the public sector. Small scale sector, co-operative and unlicensed sector
account for 30 per cent of the production. With the rapid industrial development, the demand for
salt is on the increase. The project demand for 2000AD is likely to be of the order of 15mt. Weather
plays an important role in this industry. A major portion of the production is concentrated on the;
west coast in Gujarat and Maharashtra and Rajasthan contributing 55 – 60 per cent. The Tuticorin
belt in Tamil Nadu accounts for 20 per cent out of this 35 per cent. The seasonal rains threaten the
industry in the East coast as a result of which salt become dearer to the consuming centers nearby
due to the problems in transportation.
As the industry handles bulk commodities, the pricing and profits depend on the end uses.
However, the industry was not given due importance as it was seasonal in nature. It lacks sufficient
infrastructural facilities and modernization. It is labour intensive. Salt has played a predominant
part in the development of man's activities. One reason for its overwhelming influence is that it is
the source of sodium and chlorine, two of the twelve dominant elements in the human body. These
two elements have important functions in the metabolism of the body. Lack of these elements leads
to decay and death. The other reason is that the science of chemistry has used this inexpensive and
abundantly available commodity as an important raw material in today's industry.
In the physiological system, salt functions as sodium iron and chloride ion. Sodium controls
muscular movement Salt has sodium and chloride which are the major Constituents of the human
body. These elements play a key role in the metabolism of the body of the heart muscles, the
peristaltic movement of the digestive tract and the transmission of impulses by nerve cells.
The chloride ion is used in the production of hydrochloric acid required for digestion. A principal
function of salt is to regulate pressure and the exchange of fluids between the intra cellular fluid and
the extra cellular fluid. For normal health, the salt concentration in the body can vary only within
narrow limits. Salt that goes out of the system has to be replaced. Salt is lost mainly through
sweating, It is also passed out through urine but the amount is so regulated by the kidneys that the

International Conference on INDIA 2030
115 Manonmaniam Sundaranar University, Tirunelveli
salt remaining in the system is maintained at the necessary level. A small quantity of salt is
used in the production of other chemicals such as metallic sodium, sodium sulphate, sodium nitrite
and nitrate, sodium chlorate, sodium cyanide and bisulphate. In food industries, salt is used for
canning; baking, processing of flour and other foods, meat preservation, fish curing, dairying and
food flavoring.
Methodology
Scope of the Study
In this study the researcher has analyzed the job satisfaction of workers of salt pan in Tuticorin
district.
Objectives of the Study
1. To study the socio-economic status of salt pan workers in Tuticorin district.
2. To study the working environment of salt pan workers in Tuticorin district.
3. To analyses the job satisfaction of workers of salt pan in Tuticorin district.
4. To offer suitable suggestions based on the findings of the study.
Collection of Data
The survey method was used to collect the required data for the study. The required
information and data were collected on various aspects from the sample respondents through
personal interview with the concerned with the aid of schedules conducting a pilot survey
Data Analysis & Interpretation
Age-Wise Classification of Sample Respondents
Age is one of the most important factor determining the job satisfaction of salt pan workers.
The present situation with the past experience components the workers to handle organization.
Because of the nature of work, organizations require young and energetic workers. Most of the
work requires some physical effort. So, the researcher has made an attempt to know the age-wise
classification of workers of salt pan. The age-wise classifications of sample respondents are
presented in Table 1.
Table 1: Age-Wise Classification of Sample Respondents
Source: Primary data
Table 1 clearly exposes the
age-wise distribution of salt pan
workers. All the saltpan workers
surveyed were in the age group of
35 to above 65 years.
Gender-Wise Classification of
Sample Respondents
In the competitive world both
the men and women are employing for their peaceful life. The gender is one of the important profile
variables of the respondents. Hence, the present study includes the gender as one of the important
socio-economic variables. Table 3.2 presents the details about the gender-wise classification of the
respondents.
Table 2: Gender-Wise Classification of Sample Respondents
Source: Primary data
Table 2 shows that most of the
workers are female and they constitute
about 59 per cent and the remaining 41
per cent of the workers are male.
Sl. No Age No. of Respondents Percentage
1. Below 35 years 70 14.0
2. 36-45 years 234 46.8
3. 46-55 years 138 27.6
4. 56-65 years 36 7.2
5. Above 65 years 22 4.4
Total 500 100
Sl. No Gender No. of Respondents Percentage
1. Male 205 41.0
2. Female 295 59.0
Total 500 100

Vol. 5 Special Issue 3 August 2017 ISSN: 2320-4168
116 Shanlax International Journal of Commerce
Marital Status-Wise Classification of Sample Respondents
The marital status can be taken as an important social characteristic of the salt pan workers. An
individual’s responsibilities increase after marriage. The marital status of the respondents decides
the savings and investment pattern.
Table 3: Marital Status-Wise Classification of Sample Respondents
Source: Primary data
It is apparent from Table 3 that out of 500
respondents, 430 respondents, constituting 86
per cent are married and the remaining 70 of
them (14%) are unmarried. It is understood
that the majority of the respondents (86%) are married employees in salt pan.
Occupation of Parents-Wise Classification of Sample Respondents
The act of occupying position where a person is employed or one habitual employment,
profession, craft or trade is known as occupation. Occupation of the salt pan workers parents plays
a vital role and significant past in taking a decision on a particular issue.
Table 4: Occupation of Parents-Wise Classification of Sample Respondents
Source: Primary data
The occupation of salt pan workers parents wise analysis shows that that the largest group of respondents parents is from salt work (54 per cent) followed by farmers (38 per cent) and other occupation (8 per cent).
Community-Wise Classification of Sample Respondents
In the present study it is observed that the occupations are not fully community based. But the
concentration of certain communities in certain occupations could be widely noticed. The following
table explains the distribution of respondents according to community.
Table 5: Community-Wise Classification of Sample Respondents Source: Primary data
It is known from Table that the SC (A) community dominates (72%) in the salt pan work. It is noted that the scheduled caste (A) constitute 72% of the total sample population. Table further shows that 11 per cent of the sample respondents belong to BC, 9 per cent of the sample respondents belong to MBC and 8 per cent of the sample respondents belong to OC. Daily Wages
Wages of salt pan workers differ depending upon the nature of work. The following table shows
the daily wages of salt pan workers in Tuticorin district.
Table 6: Daily Wages Source: Primary data
Table clearly shows that 39 per cent of 195 respondents are getting daily wages of above Rs.175, 29.4 per cent of 147 respondents are getting daily wages between Rs.150-175, 14.6 per cent of 73 respondents are getting daily wages between Ra.125-150, 12.4 per cent of 62 respondents are getting daily wages between
Rs.100-125 and 4.6 per cent of 23 respondents are getting wages between Rs.75-100
Sl. No Marital Status No. of Respondents % 1. Married 430 86.0 2. Unmarried 70 14.0 Total 500 100
Sl. No Occupation of
Parents No. of
Respondents %
1. Salt work 270 54.0 2. Farmers 190 38.0 3. Others 40 8.0 Total 500 100
Sl. No Community No. of
Respondents %
1. OC 40 8.0 2. BC 55 11.0 3. MBC 45 9.0 4. SC (A) 360 72.0 Total 500 100
Sl. No Daily Wages No. of Respondents % 1. Rs. 75-100 23 4.6 2. Rs. 100-125 62 12.4 3. Rs. 125-150 73 14.6 4. Rs. 150-175 147 29.4 5. Above Rs.175 195 39.0 Total 500 100

International Conference on INDIA 2030
117 Manonmaniam Sundaranar University, Tirunelveli
Frequency of Salary
Table 7: Frequency of Salary
Salt pan workers are getting salary at
regular intervals namely daily, weekly and
monthly. The following table shows the
frequency of salary of salt pan workers.
Conclusion
It is concluded from the study that the important job satisfaction among the salt pan workers
who are in the age group of below 35 years, 36-45 years, 46-55 years are work variety and behavior
of the owner and their respective mean scores are 3.6884. The important job satisfaction among the
salt pan workers who are in the age group of 56-65 years are present health care facility and work
variety and salt pan workers who are in the age group of above 65 years are relationship with co-
workers and task changes. The important job satisfaction among the male salt pan workers are
completeness of the work and work variety and among the female salt pan workers, relation with
co-workers and job security.
It is concluded from the study that the working conditions of the salt pan workers are very
poor. They are subject to long working hours-normally nine to twelve hours per day, with a short
break for lunch and other purposes. Comparative low wage and poor working conditions pull down
their status to a low level. Salt industry should develop strategies that strengthen the work
environment and increase the workers morale and satisfaction to enhance performance and
productivity, which ultimately results in high profits. A good work environment and good work
conditions can increase employee job satisfaction and the employees will try to give their best
which can increase the employee work performance.
Sl. No Frequency of
Salary No. of
Respondents Percentage
1. Daily 138 27.6 2. Weekly 227 45.4 3. Monthly 135 27.0 Total 500 100

Vol. 5 Special Issue 3 August 2017 ISSN: 2320-4168
118 Shanlax International Journal of Commerce
WOMEN STATUS IN RURAL INDIA WITH SWOT ANALYSIS
Dr. N. Suthendren
Assistant Professor of Commerce, M.S. University Constituent College, Kanyakumari
Introduction
‘You can tell the condition of a nation by looking at the status of its women”, is the emphatic
sentence of Jawarharlal Nehru one of our country’s premier leaders. The statement stresses the role
of women in our society. India is currently witnessing a revolution of sorts in economy and
technological sectors, yet, even after 70 years of independence the women’s liberation seems to be a
distant dream. In rural India, the Indian population is 48.1% women and 51.9% men and female
illiteracy is 62% whereas the male illiteracy rate is 34 percentage. The labour force participation
rate of women is 27% which is less than half of the men’s rate of 51.9% .In rural India, agriculture
and allied industrial sectors employ as much as 89.5% of the total female labour. Women have
extensive workloads with dual responsibility for farm and household production. Women have an
active role and extensive involvement in livestock production, forest resource use and fishery
processing. Women contribute considerably to household income through farm and nonfarm
activities as well as through work as landless agricultural labours.
Indian women are extensively involved in agricultural activities. The mode of female
participation in agricultural production varies with the land owing status of farm households. In
overall production, women’s average contribution is estimate at 55% to 66% of the total labour. In
rural areas, women make baskets, broom, rope making, silk cocoon rearing etc. Women contribute
51% of the total employment in forest based small scale enterprise. There are high degree of inter-
state variations in roles in agriculture, environments and rural production. Women in rural areas
avail health service in lesser degree a their counterparts in urban India. In rural India, condition of
women health is poor basically due to their lack of education and lack of health consciousness as
well as due to their malnutrition, poor economic condition, and lack of availability of medical
services, which finally leads to greater number of female death rate than that of the males in rural
areas. Female death rate is much more than that of the male in rural India as it is exhibited in
Table1.
Table 1: Gender Difference in Age Specific Death Rates in Rural India 1983 in Percentage
All
Ages 1-4 5-9 10-14 15-19 20-24 25-29 30-34 35-39 40-44 45-49
Male 13.1 40.5 3.4 1.7 2.1 2.8 2.9 3.8 4.8 6.2 9.4 Female 13.1 43.1 4.0 2.0 3.0 4.0 4.0 4.2 4.7 5.4 7.0
Sources: Registrar General of India, Sample Registration System, 1983, New Delhni 1986, p.72
Death rate of female population in rural and urban India is exhibited in table 2.
Table 2: Age Specific Death rate of female population in rural and urban India in Percentage All
Ages
1-4
5-9
10-14
15-19
20-24
25-29
30-34
35-39
40-44
45-49 Rural 13.1 43.1 4 2.0 3.0 4.0 4.0 4.2 4.7 5.4 7.0 Urban 7.6 21.7 1.8 1.2 2.0 2.4 2.4 2.1 3.0 3.7 5.6
Difference 5.5 21.4 2.2 .8 1.0 1.6 1.6 2.1 1.7 1.7 1.4
Source: Registrar General of India, Sample Registration System, 1983, New Delhi 1986, p.72

International Conference on INDIA 2030
119 Manonmaniam Sundaranar University, Tirunelveli
Statement of Problem
India with more than 70% of its population residing in rural areas is worthwhile to examine the
condition of women in our villages. Women are the pillars on which the family units stands but
rural women present a picture of abject poverty and exploitation both inside and outside the home.
A vicious circle of malnutrition, ill health and decreased productivity plagues them even today.
Health care is another sector that has failed to establish inroads and make a substantial difference
in the condition of rural women. Knowledge and awareness is low among rural women with just
about one third of the girls between ages of 5-14 years attending school. Hence, the present study is
an attempt to analyse the Strength, Weakness, Opportunity and Threads (SWOT) of status of women
in rural a areas.
Objectives of the Study
The specific objects of the present study are
1. To exhibit socio economic background of rural women.
2. To analyse the major strengths, weakness opportunities and threads of rural women in their
life.
3. To suggest the idea for the promoting the condition of rural women
Limitation of the Study The present study is based mainly on primary data. While collecting primary data, some of the
respondents are not willing to answer the questions in the interview schedule. Further the study is
confined to particular area. Thus the results and findings can be generalized only to a certain extent.
Methodology
In the present study the researcher evaluated the status of women in rural in SWOT analysis.
For this questionnaire was prepared to find out strength, weakness, opportunity and threats of
women in rural.
Sample
In order to analyse the status of rural women in India, the researcher randomly selected 50
rural women in Thengamputhoor Town Panchyath Union of Kanyakumari District in TamilNadu.
Review of Related Literature
In this section on attempt has been mode to discuss to review literature for the present study.
The Again Enigma-A Study conducted by the UNICEF states that the exceptionally high rate of
malnutrition so found among the daughters of the soil. These gender disparity begins even at
the age of five and sometime less than five in rural Indian family. It is manifested in neglecting
the girl child during her illness and partiality in the rationing of food for girls in the family.
Malnutrition has star reaching changes on the health of female children that when they become
younger ladies, they are physically weak to give a birth. Malnutrition leads to anemia and ill
health both of which are risk in pregnancy.
The statistics of a government survey show that a quarter death among rural women are
pregnancy related and on estimated two-thirds are preventable by early screening at a primary
health care facility.
The statistics of a government survey show that a quarter death among rural women are
pregnancy related and on estimated two-thirds are preventable by early screening at a primary
health care facility.
A village level study in Maharastra showed that around 92% of women were suffering from one
or more gynecological disorders. These numbers reflect how ignorance of their own health
under trying conditions snatches the care productive segment of the female population.

Vol. 5 Special Issue 3 August 2017 ISSN: 2320-4168
120 Shanlax International Journal of Commerce
A government funded village study revealed that at home girls assist their mothers in almost all
tasks and by the age of 10 they participate fully in agricultural work done by women. Boys on
the other hands, are usually sent to school and complete a primary education much before
lending a hand on fields. Women’s contribution to agricultural in terms of tasks done and time
spent in much greater than men.
A micro-study done in Himalayas showed how skewed the distribution of work hours was. On a
1 hectare farm a pair of bullocks worked for 1064 hours, an average man put in 1212 hours
while the average woman clocked a whooping 3485 hours, and all this on less nutrition and
amenities than.
A study of women in the SwayamSilkshanPrayog (SSP), based in 20 villages in four districts in
Maharastra state introduced in this way “the primary issue of all women in the SSP. The women
were struggling with every day survival. Insufficient incomes and the lack of employment were
reported to be their most pressing concerns. The most common problems were the lack of
employment was reported to be their most pressing concerns. The most common problems
were the lack of basic amenities such as food, water fuel, fodder and health facilities.
The Municipal Corporation of Delhi (MCD) on April 28, 2010, informed the Supreme Court
through affidavit, “About 49% of the total population of Delhi lives in slum areas, unauthorized
colonies and about 860 JJ clusters. They are also 20,000 juggles and according to a rough
estimate, about 5 person stay in each jhuggy besides a sizable population living in unplanned
areas having no paper system of collection, transportation and disposal of municipal solid
waste.
Strength of Rural Women
In course of living, the women in rural India would have come across or identified or used many
of the points of strength. These significant points were listed out and the women in rural were
asked to indicate the content of applicability in each case as strongly applicable, applicable, partly
applicable and not applicable these were given score 3,2,1 and 0 respectively and the weighted
score was calculated for each point of strength. The weighted score of each point of strength for all
the rural women divided by the number of respondents in Table 3. High at the average score for a
point of strength indicate good performer. The maximum average score that any strength could
receivedwas”3” and minimum “0”.
Table 3: Average score per rural women in respect of strength
Table 3 reveals that Rural Development
Programme to the rural women has been
ranked as major points of strength required
for the improvement of status of rural
women with an overall average score of
2.87.
Weakness of Rural women
The persistence of hunger and abject
poverty in India and other parts of the
world is due in large measure to the subjugation, marginalization and disempowerment of women.
Women suffer from hunger and poverty in greater numbers and to a great degree than men. At the
sametime, it is women who bear the primary responsibility for actions needed to end hunger,
education, nutrition, health and family income. Looking through the lens of hunger and poverty
there are seven major areas of crimination were tabulated in the table 4 against women in India.
Point of Strength Average Score Rank
Hardwork 2.12 3
Commitment and Dedication 2.63 2
Helping tendency 1.92 6
Rural Development programme 2.87 1
Joint Family 1.83 7
Willingness to work 1.98 5
Planned effort 2.03 4
Total 2.20

International Conference on INDIA 2030
121 Manonmaniam Sundaranar University, Tirunelveli
Table 4: Average score pen rural women in respect of weakness
Table 4 shows that work burden of the rural women
has been ranked as major point of weakness of rural
women with an overall average score of 2.08
Opportunities for Rural Women
The various opportunities that were available to
women were listed and rural women were asked to
rank the importance of the opportunity in their life by
assigning whether it was of great importance. The more the score the more importance was the
opportunity on the average for the rural women in their activity. The average score of all
respondents are presented in table.
Table 5: Average score pen rural women in respect of opportunity
Threat to Rural Women
Women everywhere face all the difficulties
which the men face, whether it is a natural or
man-made problem. The threats that were
normally associated with rural women were
listed out and rural women were asked to
indicate whether these threats were great threat,
average threat, less threat or no threats to them
or to their life. The average score of respondents are presented in table 6.
Table 6: Average score per Rural Women in respect of each Threat
Table 6 reveals that major threat rural women is
sexual harassment. This is ranked first with an average
score of 1.73
Finding of the Study
In Strength, Rural Development programme occupies, a
first rank. Other factors like commitment and
dedication, hard work, planned effort, wiliness to work
helping tendency and joint family system occupies the
successive rank. In weakness of rural women Work burden occupies a first rank and poor health
condition occupies the last rank. In opportunity concept, human right for women stands tall with
the first rank. In threat concept sexual harassment occupies the first rank.
Conclusion
Different rural women had different attitudes towards their life. On the basis of overwhelming
evidence, the researcher concludes that survival of the rural women depends on their attitude
towards life.
Suggestions
The following suggestions are given for the development of the status of women in rural area on
the basis of finding of the study. The Government to come forward to help rural women up by way
of creating awareness. The programmes of various rural women organizations and institutions are
to be reviewed and reinforced every now and then to suit the ever-changing scenario of rural
women development activities. Some of the suggested strategies include Rural Development
Point of Strength Average Score Rank Malnutrition 1.73 5 Poor Health 1.65 7 Lack of education 1.93 2 Burden of work 2.08 1 Unskilled 1.68 6 Mistreatment 1.81 4 Powerlessness 1.87 3 Total 1.82
Point of Strength Average Score Rank Human Rights for women 2.34 1 Women Health 1.92 6 Women NGO’s in India 1.82 7 Liberal view 2.17 3 Improving policy 1.98 5 Government policy 2.22 2 Qualitative work 2.06 4 Total 2.08
Point of Strength Average Score Rank Children marriage 0.93 7 Dowry System 1.50 2 Divorce 1.32 3 Sexual Harassment 1.73 1 Dinertuc violence 1.15 4 Infanticide 0.98 6 Institution 1.07 5 Total 1.24
Vol. 5 Special Issue 3 August 2017 ISSN: 2320-4168
122 Shanlax International Journal of Commerce
Programme, Women Health Awareness, Education to Rural Women. All those efforts are one for the
upliftment of the socio and economic status of rural women.
References
1. Dr.R.Horidoss and Dr.J.Frednck (2009), Women entrepreneurship in india, Vista International
Publishing house.
2. Dr.V.Ramanujam (2010) Strength, Weakness, Opportunity and Threat (SWOT) analysis of
women Entrepreneurship Prabanadhan Indian Journal of management vol 3 No 10 xtoben.
3. Ponnawigno Raja (1990) “Women poverty and Resources”, NewDehli: Sage publications.

International Conference on INDIA 2030
123 Manonmaniam Sundaranar University, Tirunelveli
STUDY OF RELATIONSHIP BETWEEN EMOTIONAL INTELLIGENCE AND
WORK ATTITUDE AMONG WOMEN EMPLOYEES IN PRIVATE SECTOR
Dr. C. Geetha
Assistant Professor, Department of Commerce, Sarah Tucker College, Tirunelveli
Emotional Intelligence
Emotional Intelligence is the ability to perceive, identify and manage emotions which provides
the basis for the kind of social and emotional competencies that are important for success in almost
any job. Emotional intelligence(EI) is a part of the genetic makeup of an individual but as with any
intelligence this too can be developed. E I improves individual and organizational performance. It
plays a significant role in the work of an employee, and the relationship he or she enjoys in the
organization. Emotional Intelligence describes the ability, capacity, skill or, a self perceived ability
to identify, assess, manage and control the emotions of one's self, of others, and of groups. EI is
considered to play a crucial role in the modern work life. Its principles help in evaluating employee
behavior, management styles, attitudes, interpersonal skills and potential. It also helps in
understanding one’s own conduct as well as relationship with others. Psychological studies have
shown that understanding and controlling emotions play significant role in gratifying one’s life and
work environment
Work Attitude
Work attitudes are the feelings we have toward different aspects of the work environment. Job
satisfaction and organizational commitment are two key attitudes that are the most relevant to
important outcomes. Attitudes create an intention to behave in a certain way and may predict
actual behavior under certain conditions. People develop positive attitude as a result of their
personality, fit with their environment , stress level they experience, relationship they develop,
perceived fairness of their pay, company policies , interpersonal treatment , whether their
psychological contract is violated, and the presence of policies addressing worklife conflict. When
people have positive attitude they may have the inclination to perform better, display citizens
behavior and be absent less often and for shorter periods of time , and they are less likely to quit
their jobs within a short period of time. When workplace attitudes are more positive , companies
benefit in the form of higher safety and customer service as well higher work performance.
Statement of the Problem
The workplace is an ideal environment for people to develop their social and emotional skills,
as individuals are motivated to develop those capabilities in pursuit of success and promotion.
Emotional intelligence competencies are critical for success in most jobs, many adults enter the
workforce without the competencies necessary to succeed at work, employers already have the
established means and motivation for providing emotional intelligence training, most adults spend
the majority of their waking hours at work. Work Attitude refer to the individual's way of feeling,
thinking or behaving in their work. Participants were 100 women professionals who were selected
randomly. The findings of the study show that there is a significant relation between emotional
intelligence and work attitude.

Vol. 5 Special Issue 3 August 2017 ISSN: 2320-4168
124 Shanlax International Journal of Commerce
Need for the Study
The purpose of this study was to investigate and describe the emotional intelligence and its
relationship and impact on the work attitude of the women employees in the private sector. This
study reports the findings through two questionnaires, one on dimensions of emotional intelligence
and the other on work attitude of 100 women employees of various private sectors A research was
carried out to find the relationship and impact of emotional intelligence on work attitude which
includes job satisfaction, job involvement, organizational commitment and work and family conflict
of the women professionals.
Objectives of the Study
To understand the concept of emotional intelligence and its dimensions To find the relationship between Emotional Intelligence and work attitude Research Methods The sample is 100 women employees of various private sectors. The participants of the survey
were the employees from different private sectors. Owing to the qualitative nature of the study a
large sample of people was completely out of consideration right at the onset of this research.
Hence a convenience sampling model is incorporated. The Data for this report has been collected
both by Primary and Secondary sources. Journals and research papers were used as secondary
source. And As a Primary source the survey was conducted with the help of a questionnaire.
The employees were given both the “Emotional Intelligence” and “Work Attitude” questionnaires
to fill.
Dimension of Emotional Intelligence (EI)
Self-regulations
Self regulation is the control we have over our thoughts, feelings and actions. Self regulated
learning includes: • setting goals for learning • concentrating on instructions • using effective
strategies to organise ideas • using resources effectively • monitoring performance • managing time
effectively • holding positive beliefs about your capabilities (Duckworth et al, 2009)
Self awareness
Self-awareness is having a clear and realistic perception of oneself. Self-awareness is not about
uncovering a deep dark secret about oneself, but understanding who you are, why you do what you
to, how you do it, and the impact this has on others. Self-awareness is directly related to both
emotional intelligence and success. It helps to create achievable goals because one could consider
his strengths, weaknesses, and what drives when goal-setting. It allows to guide the self in the right
path by choosing to pursue the opportunities that are the best fit for your skill-set, preferences and
tendencies. It makes identifying situations and people that hit our triggers and anticipating our own
reactions easier. It allows us to make positive behavioural changes that can lead to greater personal
and interpersonal success
Self-motivation
Goleman (1995) defined that emotional self-motivation involves the ability of controlling the
emotional tendencies that facilitate in other to reach one’s goals. Self-motivation also refers to the
abilities to set goals and create an arduous, and also to remain focused and positive by any setbacks
that may occur during setting goals. Self motivation is assurances would involve in every day action
which could also committed to any particular cause. Wolmrans & Martins, (2001) suggested that
one way that are founded on self-motivations is taking responsibility for a person successes and
failures.
Social skill (relationship management)
Social skills refer to a person's talent in managing relationship with others and building systems
also called people skills. The set of social skills includes respect for others, mutual regard,

International Conference on INDIA 2030
125 Manonmaniam Sundaranar University, Tirunelveli
commitment, openness, tolerance, empathy, negotiation, communication etc. (Schuetz, 2011). It
involves the ability of meeting each other’s needs, relating to each other over time and exchanging
information about one feeling, thought and ideas. Others qualities, social skills are effective in
leading change, persuading others, building and leading teams (Goleman 1995). Social interaction
also results in many advantages. It gives confidence and social acceptance.
Data Analysis
Table 1: Demographic profile of respondents
Table 2: Variables Variables Number
of items
Emotional
intelligence
Self-regulations 6
Self-awareness 8
Self-motivation 7
Social skills 7
Work attitude 7
Table 3: Correlation among variables Self-regulation Self-awareness Self-motivation Social Skill Work Attitude
Self-regulation 1 .247** .411** .282** .203** Self awareness .247** 1 .352** .423** .252** Self-Motivation .411** .352** 1 .581** .380**
Social Skill .282** .423** .581** 1 .546** Work Attitude .203** .252** .380** .546** 1
** Correlation is significant at the 0.01 level (2-tailed).
Table 4: Summary of hypothesis testing
Hypothesis Remarks There is a significant relationship between self-regulation and work attitude Accepted There is a significant relationship between self-awareness and work attitude Accepted There is a significant relationship between self-motivation and work attitude Accepted There is a significant relationship between social skills and work attitude Accepted Emotional Intelligence and Work Life Balance
It is generally considered that employees with higher emotional intelligence will have higher
work life balance. This is because the employees with higher emotional intelligence are able to cope
with consequences which may arise out of stress whereas those with less emotional intelligence
Characteristics Frequency Percentage
Age
21 to 30 19 19 31 to 40 34 34 41 to 50 33 33 51 above 14 14 100 100
Race
Private banks 5 5 Private schools 25 25 Companies 10 10 Others 50 50 100 100
Academic Qualification
Bachelor Degree 22 22 Master Degree 54 54 Diploma 8 8 Professional 16 16 100 100
Experience
Below 2 12 12 3 to 5 32 32 6 to 8 35 35 9 to 11 14 14 Above 12 7 7 100 100

Vol. 5 Special Issue 3 August 2017 ISSN: 2320-4168
126 Shanlax International Journal of Commerce
won’t be in a position to overcome the stress situations . The influence of emotional intelligence on
work life balance dimensions was observed to be weakly related but significant, while motivation &
expression of emotions in self and use of emotions to facilitate performance displayed larger
influence. Employees with higher emotional Intelligence were those who were fairly happy with
their salary and benefits and had a better work life balance
Summary of Findings
Demographic profile of respondent
Table 1 below presents the demographic of the respondents. Out of 100 respondents who
participated in the study, In terms of age, the highest percentage is from age between 31 to 40
(34%), and followed by 41 to 50 (33%). As for the race, the highest percentage is employess
working in other private sectors( like departmental stores textile shops and so on.) which is 50
(50%) followed by Private schools by 25 (25%). The highest academic qualification is a Master
Degree with 54 (54%) respondent followed by a Bachelor Degree with 22 respondents (22%).
Majority of respondent have been working for 6 to 8 years (35%) and 3 to 5 years (32%).
Variables Table 2 shows the number of items in the four dimensions of emotional intelligence and work
attitude.
Correlation among Variables
Table 3 and table 4 reveals that as for the correlation analysis, there was a strong, positive
relationship between the two variables, r=0. 477, n=212, p<0.05, with high level of emotional
intelligence associated with high level of work attitude of the respondents.
Conclusion
In conclusion, the research highlights the importance of emotional intelligence. It appears that
the four domains (self-awareness, self-regulation, self-motivation, empathy, and social skills) of
emotional intelligence have a greater impact on women employees work attitude. In order to
sustain high performance and competitive advantage, emotional intelligence should be developed
and improved through a systematic and consistent approach. Therefore, it is recommended that
organizations develop training programs in improving emotional competencies of their managers
and workers in the organization. Organizations should recognize the significant role of emotional
intelligence in developing human capital that leads to a high-performing workforce.
References
1. Duckworth, K., Akerman, R., MacGregor, A., Salter, E., & Vorhaus, J. (2009). Self regulated
learning: a literature review. London: Centre for Research on the Wider Benefits of Learning.
2. Goleman, D. 1998. The Emotionally Intelligent Workplace: An EI-Based Theory of Performance
(Chapter Three). Cherniss C. & Goleman D. (Ed). Consortium for Research on Emotional
Intelligence in Organizations.
3. Wolmarans, S. Martins, N. 2001. The 360 degree Emotional Competency Profiler. Unpublished
manual. Johannesburg: Organisational Diagnostics and Learning Link International

International Conference on INDIA 2030
127 Manonmaniam Sundaranar University, Tirunelveli
CORPORATE SOCIAL RESPONSIBILITY IN STRESS MANAGEMENT POLICY
IN ITC LIMITED-CHENNAI
R. Thanga Selvi
Ph. D Scholar in Commerce, Ambai Arts College, Ambasamudram
Introduction
There are very few business enterprises across the world, which at 100 years, are still firing on
a reach on even higher orbit of growth. ITC is one such enterprise. The ITC story is one of
transformation from a single product company to one of India’s largest corporate enterprises in the
private sector. Like all long and eventful journeys, ITC’s too had a small beginning, way back in 1910
when the I Imperial Tobacco Company set foot in Calcutta. India Tobacco Company Limited in 1970,
moving on to I.T.C. Limited finally to the current forms of ‘ITC Limited’ without full stops in 2001.
Key words: ITC - India Tobacco Company Limited
Human Resources
Every business is made up of people: its human resources. An organization is nothing without
human resources. Human resource management is about managing these people effectively. It is
aimed at achieving business objectives through the best use of an organization’s human resources.
Effective management of human resources is vital in all types and sizes of organizations.
International Scenario of Human Resource Management
Effective HRM benefits the individual, society, and the company. Companies use HRM activities
to manage their human resources. The efficiency with which any organization can be operated will
largely depend upon how effectively its human resources and managed and utilized. The history of
HRM can be traced to England, where masons, carpenters, leather workers, and other crafts people
organized themselves into guilds. They used their unity to improve their work conditions. These
guilds became the forerunners of trade unions. However, many key concepts of HRM come from the
USA.
The Indian Scenario of Human Resource Management
The history of evolution and growth of personnel management in India is not very old. The
Royal Commission on Labour in 1931 for the first time recommended for the abolition of Jobbers
System and appointment of labour officers to deal with the recruitment and to settle their
grievances. The Factories Act 1948, statutorily made it obligatory for the industries to appoint
Labour welfare officers. Today personnel management function in India encompasses all the
professional disciplines like welfare, industrial relations, personnel administration, HRD etc.
During the 1960s the scope of personnel function has expanded and “In this period, the human
relations movement of the west had also had its impact on Indian organisations”. The legalistic
preoccupations slowly gave way to harmonious industrial relations and good human resource
practices.
Objectives of the Study
The study has conducted with the following objectives.
1. To know the human resource management practices of ITC Ltd. 2. To examine the reasons for the employees joining in ITC Ltd. 3. To analyze the job stress among employees of ITC Ltd. 4. To offer suitable suggestions based on the findings of the study.

Vol. 5 Special Issue 3 August 2017 ISSN: 2320-4168
128 Shanlax International Journal of Commerce
Collection of Data
For the purpose of this study both primary and secondary data had been collected. This study is
dependent on primary data to a very great extent. The secondary data had been collected from
various books, journals, news papers and annual reports. For collecting the primary data the
questionnaire had been prepared for the employees of ITC Limited.
Sample Design
Having selected the study units, the next step was to decide on the sample size and the selection
of the respondents in a systematic manner. The sample size the result would approach near
accuracy situations when the generalizations are made. Hence, the researcher had decided to collect
the data from 30 per cent of the workers. A sample of 30 per cent that is one-third of the workers
populations was chosen as the sample size just to ensure the accuracy of the results to the
maximum extent possible.
Tools for Collecting Data
Primary data collected through questionnaire has been used for the preparation of this study.
The questionnaire had been finalized after conducting the pre-test.
Period of the Study: The primary data were collected during 2015 – 2016.
Framework of Analysis
The statistical methods are a mechanical process especially designed to facilitate the
condensation and analysis of quantitative data. The aim of statistical methods is to facilitate the
comparative study of the relationship between the two phenomena. There are different types of
statistical tools and techniques for analyzing the collected data. But the present study, the statistical
tools like ANOVA, ‘t’ test, Mann Whitney U test, Kruskal Wallis test, factor analysis, Garrett ranking
and Chi-square test were used for the analysis of data.
Gender of the Respondents
Both male and female groups have been working in ITC Ltd and they have been covered for the
study. Analysis of the respondents based on gender is conducted and the results are given in the
table.
Table: Gender of the Respondents
Source: Primary data
The Table exhibits that out of 300respondents,
165 respondents are male which constitutes 55 per
cent of the respondents, whereas, 135 respondents
are female constituting 45 per cent of the
respondents. It is observed that male employees are found to be flexible in working in the ITC Ltd
than the female.
Marital Status of the Respondents
Respondents of different marital status such as married and unmarried have been working in
ITC Ltd. The marital status of the sample respondents are presented in the following ways.
Table: Marital Status of the Respondents
Source: Primary data
Table reveals that 67 per cent of the
respondents were married and 33 per cent of
the respondents were unmarried. It is inferred
from the above table that the majority of the
respondents (67 per cent) were married.
Sl. No Gender No. of Respondents %
1. Male 165 55.0
2. Female 135 45.0
Total 300 100
Sl. No Marital Status No. of Respondents %
1. Married 201 67.0
2. Unmarried 99 33.0
Total 300 100

International Conference on INDIA 2030
129 Manonmaniam Sundaranar University, Tirunelveli
Education of the Respondents
The data collection was done among the employees who came from different educational
backgrounds. They were categorized into four groups on the basis of their qualifications and the
researcher came to know that most of the respondents have PG Degree. The classification of
employees details based on education are given in the Table
Table: Education of the Respondents
Source: Primary data
Table gives an account of the educational
qualification groups, the number of respondents
in each group and their percentage distribution.
The above table indicates that 47 per cent of the
respondents have completed PG degree,37 per
cent of the respondents have professional
qualification, 9 per cent of the respondents have completed UG degree and 7 per cent of the
respondents have completed other educational qualification namely ITI and diploma. It is clear that
47 per cent of the respondents are possessing PG degree which is the highest among various
qualifications and 7 per cent of the respondents are ITI and diploma qualified which is the least of
all. It is observed that PG degree and professional degree people are highly attracted by the ITC Ltd.
UG qualified persons who are selected through campus interview, set their minds to join in ITC Ltd
and continue to work immediately after UG qualification. They also keep themselves ready to
qualify further through other means like distance education.
Gender and Reasons for joining in ITC Ltd
An attempt was made to know the reasons for joining in ITC Ltd based on gender. To test the
reasons for joining in ITC Ltd based on gender, the following hypothesis was proposed.
Ho: There is no significant difference between mean rank for gender of the respondents and
reasons for joining in ITC Ltd.
The Mann-Whitney U test was used to analyze the reasons for joining in ITC Ltd based on
gender and test the proposed null hypothesis. The details of the result of Mann-Whitney U test is
reported in Table
Mann-Whitney U Test for Gender and Reasons for joining in ITC Ltd
Reasons U-value Z-value p-value Mean rank
Male Female Job security 10987.50 -0.211 0.833 151.41 149.39 Attractive salary 10728.00 -0.569 0.569 152.98 147.47 Better working conditions 10715.50 -0.632 0.528 153.06 147.37 Challenging job 10006.00 -1.655 0.098 157.36 142.12 Reputation of the company 10324.50 -1.210 0.226 155.43 144.48 Career growth 10196.00 -1.365 0.172 156.21 143.53 Performance linked salary structure 11024.50 -0.161 0.872 149.82 151.34 Retaining talents 10491.00 -0.915 0.360 154.42 145.71 Because I could not get in a better company. 10542.50 -0.822 0.411 146.89 154.91 Location of the company is easy for convenience 10150.00 -1.377 0.169 156.48 143.19
Source: Computed data
The Table lists out the result of the Mann-Whitney U test. Since the p-value is greater than 0.05,
the null hypothesis is accepted at 5 per cent level of significance. Hence, this means that all the
respondents have almost given similar rank to reasons for joining in ITC Ltd.
Sl. No Education No. of Respondents %
1. UG Degree 27 9.0
2. PG Degree 141 47.0
3. Professional 111 37.0
4. Others 21 7.0
Total 300 100

Vol. 5 Special Issue 3 August 2017 ISSN: 2320-4168
130 Shanlax International Journal of Commerce
It can be concluded that gender of the respondents does not affect the ranking given to reasons
for joining in ITC Ltd.
Factor Analysis for Job Stress
Factor analysis helps to reduce the innumerable variables into limited number of latent factors
having inter–correlation within themselves. Hence factor analysis is attempted to reduce the
numerous variables into limited number of factors. In order to apply factor analysis, the basic
assumption to be fulfilled is the factorability of the correlation matrix. KMO measures of sampling
adequacy and the Bartlett’s test of sphericity determine the factorability of the correlation matrix.
The results of the calculation are presented below.
KMO and Bartlett’s Test for Job Stress
Source: Computed Data
High value of Kaiser – Meyer –
Olkin (KMO) test of sample adequacy
(0.895) indicates the correlation
between the pairs of variables
explained by other variables and thus factor analysis is considered to be appropriate in this model.
The Bartlett’s test of sphericity chi-square indicates the population correlation matrix. It is an
intensity matrix. The test of statistics for sphericity is based on X2 test, which is significant. The
value is 4970.123. Findings of the KMO and Bartlett’s test reveals that the factor analysis can be
rightly employed in this context as evidenced through a higher KMO Measure (0.895) and a
significant Bartlett’s test result. Hence factor analysis is attempted. Analysis of job stress is made
through rotated factor matrix which reveals that there are five major factors of job stress. The
findings of the rotated factor analysis on the job stress are presented.
Rotated Factor Matrix for Job Stress
Sl. No
Factors F1 F2 F3 F4 F5 h2
1. I have unrealistic time pressures .867 .161 .142 .108 .016 .909 2. I have to work very fast .824 .315 .130 .030 .012 .546 3. I have severe or chronic lower back pain .725 .335 .175 .057 .036 .726 4. I get severe or chronic headaches .712 .218 .058 .263 .219 .542 5. I have no supportive supervisor .708 .109 .125 .363 .281 .656 6. Not provides high speed internet facilities .698 .351 .142 .241 .113 .597
7. I am not clear what my duties and responsibilities
.640 .370 .308 .016 .083 .549
8. Promotional activities are not satisfied .589 .118 .355 .222 .271 .650 9. I do not get timely recognition for my work .582 .002 .012 .504 .068 .598
10. Employee cabin are not very neat, clean and spacious
.511 .280 .410 .264 .263 .810
11. Not provides very good lighting facilities inside the office
.260 .717 .142 .198 .291 .797
12. Not provides high quality and adjustable seating facilities
.184 .703 -
.039 .037 .125 .673
13. I am not satisfied with my job .221 .620 .306 .352 .078 .740 14. Inadequate staffing .321 .609 .291 .197 .002 .675 15. Job descriptions is not clear .178 .577 .445 .409 .053 .702
Kaiser-Meyer-Olkin measure of Sampling Adequacy 0.895
Bartlett’s Test of Sphericity
Chi-Square 4970.123
Degrees of freedom 300
Significance 0.000

International Conference on INDIA 2030
131 Manonmaniam Sundaranar University, Tirunelveli
16. The present pay packet is inadequate .329 .568 .246 .197 .108 .610
17. Not provides air condition facilities .199 .325 .513 .213 .050 .585
18. Not installed latest configured systems for all employees
.052 .048 .757 .119 .004 .733
19. I have no enough job security .141 .236 .725 .296 .049 .625
20. If work gets difficult, my colleagues will not help me
.348 .141 .658 .041 .131 .692
21. I have no achievable deadlines .067 .265 .476 .811 .280 .663 22. My working time is not flexible .169 .174 .330 .741 .074 .554
23. The paid leaves are less .243 .113 .468 .260 .642 .722
24. Not provides individual cabin system for all employees
.241 .504 .062 .219 .609 .592
25. Not good working atmosphere .199 .123 .115 .069 .914 .593
Extraction Method: Principal Component Analysis
Rotation Method: Varimax with Kaiser Normalization
Source: Primary Data
The above table exhibits the rotated factor loading for the twenty five statements (variables) of
job stress. It is clear from table that all the twenty five statements have been extracted into five
factors.
Job Stress – Factor Wise Analysis
Sl. No Factors Eigen Value Percentage of
Variance Cumulative Percentage
of Variance 1. Time and unhealthy factor 7.359 20.327 20.327 2. Job dissatisfaction factor 5.448 15.049 35.376 3. Job insecurity factor 5.013 13.846 49.222 4. Inflexibility time factor 3.871 10.693 59.915 5. Poor atmosphere factor 2.331 6.439 66.355
Source: Computed Data
It is observed that five factors were extracted out of twenty five variables. These factors
accounts for 66.355 percentage variance in the data. Eigen value for the first factor is 7.359 which
indicates that the factor contains very high information than other factors.
Factor I (F1) – Time and Unhealthy Factor
Variables such as, ‘I have unrealistic time pressures’ (0.867), ‘I have to work very fast’ (0.824), ‘I
have severe or chronic lower back pain’ (0.725), ‘I get severe or chronic headaches’ (0.712), ‘I have
no supportive supervisor’ (0.708) ‘Not provides high speed internet facilities’ (0.698), ‘I am not
clear what my duties and responsibilities’ (0.640), ‘Promotional activities are not satisfied’ (0.589),
‘I do not get timely recognition for my work’ (0.582) and ‘Employee cabin are not very neat, clean
and spacious’ (0.511) had the highest significant positive loading and hence were included in the
first factor. These variables were directly associated with the time and health. Hence, Factor I, was
named as “Time and Unhealthy Factor”.
Factor II (F2) – Dissatisfaction Factor
In the second factor (F2) variables such as ‘Not provides very good lighting facilities inside the
office’ (0.717), ‘Not provides high quality and adjustable seating facilities’ (0.703), ‘I am not satisfied
with my job’ (0.620), ‘Inadequate staffing’ (0.609), ‘Job descriptions is not clear’ (0.577) and ‘The
present pay packet is inadequate’ (0.568) were found to have the highest significant positive
loading and hence they were grouped and included in Factor 2. Variables included in the second

Vol. 5 Special Issue 3 August 2017 ISSN: 2320-4168
132 Shanlax International Journal of Commerce
factor were closely associated with the dissatisfaction factor. So, the second factor was named as the
‘Dissatisfaction’ factor.
Factor III (F3) – Job Insecurity Factor
Variables such as, ‘Not provides air condition facilities’ (0.513), ‘Not installed latest configured
systems for all employees’ (0.757), ‘I have no enough job security’ (0.725) and ‘If work gets difficult,
my colleagues will not help me’ (0.658) were found to have the highest significant positive loading
and hence they were grouped and included in Factor 3. Hence, this factor III (F3) is called was
named as the ‘Job Insecurity’ factor.
IV (F4) – Inflexible Time Factor
‘I have no achievable deadlines’ (0.811) and ‘My working time is not flexible’ (0.741) were the
variables which were found to possess the highest significant positive loading and they had been
included in the Factor IV (F4). These variables were related to inflexible time factor. Hence, the
Factor IV (F4) had been named as the ‘Inflexible Time’ factor.
Factor V (F5) – Poor Atmosphere Factor
The variables ‘The paid leaves are less’ (0.642), ‘Not provides individual cabin system for all
employees’ (0.609) and ‘Not good working atmosphere’ (0.914) were found to possess the highest
significant positive loading and they had been included in the Factor V (F5). These variables were
related to poor atmosphere. Hence, the Factor V (F5) had been named as the ‘Poor Atmosphere’
factor.
Findings of Personal Profile of ITC Ltd employees
It is found that out of 300 respondents, 55 per cent of the respondents are male and female
constituting 45 per cent of the respondents. It is observed that male employees are found to be
flexible in working in the ITC Ltd than the female.
It is identified that 67 per cent of the respondents were married and 33 per cent of the
respondents were unmarried. It is observed that the majority of the respondents (67 per cent)
were married.
It is observed that the majority of the respondents are in the age group between 25 to 30 years
constituting 32 per cent of the respondents and next majority of 23 per cent of the respondents
belong to the age group of below 25 years. It is inferred that the ITC Ltd catch the attention of
employees in the age group of 25 to 30 years. There is the lowest percentage of the respondents
who continue to be the employees of the ITC Ltd who are in the age group of above 40 years.
It is found that 47 per cent of the respondents have completed PG degree, 37 per cent of the
respondents have professional qualification, 9 per cent of the respondents have completed UG
degree and 7 per cent of the respondents have completed other educational qualification
namely ITI and diploma. It is identified that 47 per cent of the respondents are possessing PG
degree which is the highest among various qualifications and 7 per cent of the respondents are
ITI and diploma qualified which is the least of all.
Findings of Factor Analysis for Job Stress
Among various factors of job stress, ‘Time and Unhealthy Factor’ consisting of the variables
such as unrealistic time pressures’, ‘ work very fast’, ‘ severe or chronic lower back pain’, ‘ severe or
chronic headaches’, ‘I have no supportive supervisor’, ‘Not provides high speed internet facilities’, ‘
not clear what my duties and responsibilities’, ‘Promotional activities are not satisfied’, ‘ do not get
timely recognition for my work’ and ‘Employee cabin are not very neat, clean and spacious’ is found
to be the most important factor of job stress. The next important factor of job stress is

International Conference on INDIA 2030
133 Manonmaniam Sundaranar University, Tirunelveli
‘Dissatisfaction’ factor which consists of the variables such as ‘Not provides very good lighting
facilities inside the office’, ‘Not provides high quality and adjustable seating facilities’, ‘I am not
satisfied with my job’, ‘Inadequate staffing’, ‘Job descriptions is not clear’ and ‘The present pay
packet is inadequate’.
Suggestions
The ITC Ltd should have systematic recruitment and selection policy for employing best
qualified persons. The recruitment and selection policy should be flexible and integrate
organizational and employee needs.
The ITC Ltd need to adopt a strategy that could improve the employee’s quality of work life to
satisfy both the organizational objectives and employee needs. Each employee should provide
with freedom and opportunity to utilize and develop their knowledge and skill to the maximum
extend.
The ITC Ltd may conduct orientation programme to the new entrants. The employees need to
be treated more humanely and in a friendly manner which could inculcate in them a sense of
responsibility and trust.
Job rotation should be done and appropriate job description should be given to the employees.
In addition to improve the work system, designing of programs which could ensure
development of employees skills, the reduction of occupational stress and the development of
more cooperative labour-management relations will be helpful in improving the quality of work
life and welfare measures.
Conclusion
It is concluded that the overall human resource practices in ITC Ltd are satisfactory, which is an
appreciable factor in ITC Ltd. This study shows positive and direct relationship between the extent
of firm's adoption of high performance human resource practices and firm's managerial
productivity. The conclusions of this research pave the way for several research areas and have the
potential of becoming a base for auxiliary research. Since the study is empirical in nature, the
conclusions have been drawn on the basis of personal views and perceptions of employees in ITC
Ltd. Human resource development is a process of total development of the work force and the
management of any organization must keep itself adamant with the development of their work
force in order to meet the edge of the competition.

Vol. 5 Special Issue 3 August 2017 ISSN: 2320-4168
134 Shanlax International Journal of Commerce
A STUDY OF FIRST GENERATION ENTREPRENEURS
IN SMALL SCALE INDUSTRY IN TIRUNELVELI DISTRICT
Dr. A. Arul Kamalraj
Assistant Professor of Commerce, M.S. University College, Govindaperi, Tirunelveli District
Abstract This study aims at investigating the role of the first generation entrepreneurs owning small-scale industrial units in Tirunelveli District. This study covers only the industrial units owned by the first generation entrepreneurs. The entrepreneurs those who all have involved in manufacturing goods and providing services in their business have been considered. The main aim of the study is to identify the personal profile first generation entrepreneurs in small scale industry and analyse the problems encountered by the first generation entrepreneurs in small scale industry in Tirunelveli District. The entrepreneurs merely involved in trading services also have been included for this study. This research is empirical research in nature. This type is useful when a problem cannot be studied in laboratory settings. In this type of research, empirical evidences can be analysed quantitatively as well as qualitatively. Empirical data have been collected through a well constructed questionnaire in order to achieve the objectives. Explicit hypotheses were also framed and tested depending on the research problem. In this study, the combination of purposive sampling and snowball sampling technique has been used. It is concluded that from the analysis, it is evident that there is a significant difference in problems such as fund management, lack of managerial skill, decision making problem, problem in selecting the line of business, lack of marketing skill, lack of technical knowledge, problems in planning, inadequate infrastructure, lack of support from family members, problems of dual responsibilities and dispute among the partners among different amount of capital invested by entrepreneurs. Keywords: First Generation Entrepreneurs, Small Scale Industry and Problems Introduction
Entrepreneurs found in small scale industries are of two types – entrepreneurs born and
entrepreneurs made. The first category of entrepreneurs inherits the business owned by their
parents and they get all encouragement from the members of the family since they have the
required business skills acquired through experience. But the entrepreneurs who are made are new
to the field and they are motivated to enter into industry due to their education, skills, experience
and job training. Entrepreneurship provides scope for self-development and expansion and
diversification and also provides opportunity to use initiative, self confidence, sagacity and hard
work. Small Scale Industry is considered to be a seedbed for the growth of entrepreneurship, since
the scale of operation is small. It does not involve complex and complicated managerial business
problems faced by large-scale industry. The first generation entrepreneurs who have essential
knowledge and skills and aptitude for managing business can easily venture into a Small Scale
Industry, based on their expertise.
Scope of the Study
This study aims at investigating the role of the first generation entrepreneurs owning small-
scale industrial units in Tirunelveli District. This study covers only the industrial units owned by the
first generation entrepreneurs. The entrepreneurs those who all have involved in manufacturing
goods and providing services in their business have been considered. The entrepreneurs merely
involved in trading services also have been included for this study. The small-scale industry has
been renamed as Micro, Small and Medium Enterprises (MSME) as per the recent amendment made
by the Ministry of Small Scale Industry of the Government of India. So here-in-afterwards wherever
the word small scale industry comes it means that the MSME as per the notification. The educational
institutions are coming up like a mushroom in all over the major cities. Tirunelveli District is also

International Conference on INDIA 2030
135 Manonmaniam Sundaranar University, Tirunelveli
not exempted in such development of numerous educational institutions. Hence, the scope is bright
to have a research study on the first generation entrepreneurs in small scale industry in Tirunelveli
District. The best alternative method of economic generation of a nation is making the educated
unemployed youths as entrepreneurs instead of providing a job. There is a need of paradigm shift
among the above set of group of people which will provide further employment opportunities to
others also instead of searching a job by them. The need of the hour is motivating a large number of
educated unemployed youths to be entrepreneurs for the welfare of a nation. Hence, the researcher
has made an attempt to study the first generation entrepreneurs in small scale industry in
Tirunelveli District.
Objectives of the Study
To identify the personal profile of first generation entrepreneurs in small scale industry in
Tirunelveli District.
To analyse the problems encountered by the first generation entrepreneurs in small scale
industry in Tirunelveli District.
Methodology
This research is empirical research in nature. This type is useful when a problem cannot be
studied in laboratory settings. In this type of research, empirical evidences can be analysed
quantitatively as well as qualitatively. Empirical data have been collected through a well
constructed questionnaire in order to achieve the objectives. Explicit hypotheses were also framed
and tested depending on the research problem.
Sampling Technique adopted
In this study, the combination of purposive sampling and snowball sampling technique has been
used. In purposive sampling, we sample with a purpose in mind. We usually would have one or
more specific predefined groups we are seeking. Purposive sampling can be very useful for
situations, where we need to reach a targeted sample quickly and where sampling for
proportionality is not the primary concern. With a purposive sample, we are likely to get the
opinions of target population and we can also identify subgroups in the population. In snowball
sampling, few respondents who fulfill the criteria for the study were identified. Then they were
asked to recommend others who they may know who also meet the criteria. Although this method
would hardly lead to representative samples, there are times when it may be the best method
available. Snowball sampling is especially useful when we are trying to reach populations that are
inaccessible or hard to find. In this study 360 respondents were selected for the study.
Limitations of the Study
The study is subject to some limitations. The study was conducted among the first generation
entrepreneurs those who are running small scale industries in Tirunelveli District. Tirunelveli
District is divided into 19 Blocks. The data were collected from the Small Scale Industries belongs to
Tirunelveli District only.
Data Analysis and Interpretation
Table 1: Gender-wise classification of entrepreneurs running the SSI
Source: Primary Data
Table 1 reveals that among the respondents who
run the industrial units in urban area, majority of
them are male respondents. Similarly, in the case of
SSI run in rural areas, all the entrepreneurs are male.
The gender-wise classifications of respondents who
run SSI in Tirunelveli district reveals that majority of
Sl. No.
Gender AREA
Total Urban Rural
1. Male 123
(72.8%) 191
(100.0%) 314
(87.2%)
2. Female 46
(27.2%) 0
(0.0%) 46
(12.8%)
Total 169
(100.0%) 191
(100.0%) 360
(100.0%)

Vol. 5 Special Issue 3 August 2017 ISSN: 2320-4168
136 Shanlax International Journal of Commerce
the (87.25%) respondents are male. It is inferred from the above study mostly entrepreneurs who
run SSI belong to male gender.
Table 2: Educational Status of SSI Entrepreneurs Source: Primary data
Table 2 shows the details of education
qualifications of the sample of
respondents. It is found that 39.4 percent
are Below Hr. Sec.; 29.7 percent are
graduates; 12.8 percent are diploma
holder, 9.7 percent are post-graduates, 6.7
percent are Hr. Sec. / PUC and 1.7 percent
are professional.
Table 3: Annual Earnings of the Business of SSI Entrepreneurs Source: Primary Data
Table 3 shows the details of
annual earnings of the business of
sample entrepreneurs in Tirunelveli
district. Table shows that 33.9
percent are in below Rs. 2,00,000, 25
percent are in Rs. 2,00,001–
4,00,000, 22.5 percent are in Rs.
4,00,001– 6,00,000, 12.5 percent are
in Rs. 6,00,001–8,00,000 and 6.1
percent are in more than
Rs.8,00,000.
Table 4: Type of the SSI Source: Primary Data Type of the SSI analysis reveals that the
majority (18.6%) of the respondents belong
to agro based industry followed by 18.3% of
the respondents belong to other industry,
17.2% of the respondents belong to
engineering and allied industry, 15.8% of the
respondents belong to electric/electronic
industry, 8.3% of the respondents belong to
textile industry, another 8.3% of the
respondents belong to forest based industry
and 6.7% of the respondents belong to
private limited concern.
Sl. No. Education status AREA
Total Urban Rural
1. Below Hr. Sec. 30 112 142
17.8% 58.7% 39.4%
2. Hr. Sec. 12 12 24
7.1% 6.3% 6.7%
3. Diploma Holder 34 12 46
20.1% 6.3% 12.8%
4. Graduate 52 55 107
30.8% 28.8% 29.7%
5. Post-graduate 35 0 35
20.7% .0% 9.7%
6. Professional 6 0 6
3.6% .0% 1.7%
Total 169 191 360
(100.0%) (100.0%) (100.0%)
Sl. No. Annual Earnings of the Business
AREA Total
Urban Rural 1. Below Rs.2,00,000 40 82 122
23.7% 42.9% 33.9% 2. Rs.2,00,001 – Rs.4,00,000 38 52 90
22.5% 27.2% 25.0%
3. Rs.4,00,001 – Rs.6,00,000 51 30 81 30.2% 15.7% 22.5%
4. Rs.6,00,001 – Rs. 8,00,000
25 20 45 14.8% 10.5% 12.5%
5. Above Rs.8,00,000 15 7 22
8.9% 3.7% 6.1%
Total 169 191 360
(100.0%) (100.0%) (100.0%)
Sl. No. Type of Industry AREA
Total Urban Rural
1. Agro-based 6 61 67
3.6% 31.9% 18.6%
2. Forest based 12 18 30
7.1% 9.4% 8.3%
3. Textile 6 24 30
3.6% 12.6% 8.3%
4. Food Processing 12 12 24
7.1% 6.3% 6.7%
5. Electric/Electronic 45 12 57
26.6% 6.3% 15.8%
6. Engineering and allied 46 16 62
27.2% 8.4% 17.2%
7. Private Limited concern 6 18 24
3.6% 9.4% 6.7%
8. Others 36 30 66
21.3% 15.7% 18.3%
Total 169 191 360
(100.0%) (100.0%) (100.0%)
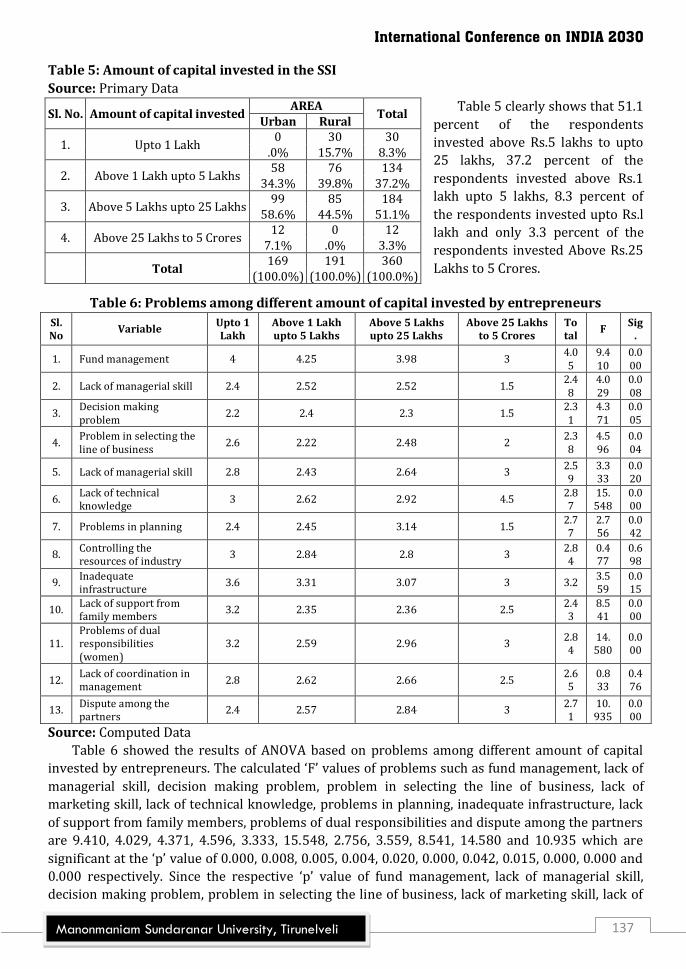
International Conference on INDIA 2030
137 Manonmaniam Sundaranar University, Tirunelveli
Table 5: Amount of capital invested in the SSI
Source: Primary Data
Table 5 clearly shows that 51.1
percent of the respondents
invested above Rs.5 lakhs to upto
25 lakhs, 37.2 percent of the
respondents invested above Rs.1
lakh upto 5 lakhs, 8.3 percent of
the respondents invested upto Rs.l
lakh and only 3.3 percent of the
respondents invested Above Rs.25
Lakhs to 5 Crores.
Table 6: Problems among different amount of capital invested by entrepreneurs
Sl. No
Variable Upto 1 Lakh
Above 1 Lakh upto 5 Lakhs
Above 5 Lakhs upto 25 Lakhs
Above 25 Lakhs to 5 Crores
Total
F Sig
.
1. Fund management 4 4.25 3.98 3 4.05
9.410
0.000
2. Lack of managerial skill 2.4 2.52 2.52 1.5 2.48
4.029
0.008
3. Decision making problem
2.2 2.4 2.3 1.5 2.31
4.371
0.005
4. Problem in selecting the line of business
2.6 2.22 2.48 2 2.38
4.596
0.004
5. Lack of managerial skill 2.8 2.43 2.64 3 2.59
3.333
0.020
6. Lack of technical knowledge
3 2.62 2.92 4.5 2.87
15.548
0.000
7. Problems in planning 2.4 2.45 3.14 1.5 2.77
2.756
0.042
8. Controlling the resources of industry
3 2.84 2.8 3 2.84
0.477
0.698
9. Inadequate infrastructure
3.6 3.31 3.07 3 3.2 3.559
0.015
10. Lack of support from family members
3.2 2.35 2.36 2.5 2.43
8.541
0.000
11. Problems of dual responsibilities (women)
3.2 2.59 2.96 3 2.84
14.580
0.000
12. Lack of coordination in management
2.8 2.62 2.66 2.5 2.65
0.833
0.476
13. Dispute among the partners
2.4 2.57 2.84 3 2.71
10.935
0.000
Source: Computed Data
Table 6 showed the results of ANOVA based on problems among different amount of capital
invested by entrepreneurs. The calculated ‘F’ values of problems such as fund management, lack of
managerial skill, decision making problem, problem in selecting the line of business, lack of
marketing skill, lack of technical knowledge, problems in planning, inadequate infrastructure, lack
of support from family members, problems of dual responsibilities and dispute among the partners
are 9.410, 4.029, 4.371, 4.596, 3.333, 15.548, 2.756, 3.559, 8.541, 14.580 and 10.935 which are
significant at the ‘p’ value of 0.000, 0.008, 0.005, 0.004, 0.020, 0.000, 0.042, 0.015, 0.000, 0.000 and
0.000 respectively. Since the respective ‘p’ value of fund management, lack of managerial skill,
decision making problem, problem in selecting the line of business, lack of marketing skill, lack of
Sl. No. Amount of capital invested AREA
Total Urban Rural
1. Upto 1 Lakh 0 30 30
.0% 15.7% 8.3%
2. Above 1 Lakh upto 5 Lakhs 58 76 134
34.3% 39.8% 37.2%
3. Above 5 Lakhs upto 25 Lakhs 99 85 184
58.6% 44.5% 51.1%
4. Above 25 Lakhs to 5 Crores 12 0 12
7.1% .0% 3.3%
Total 169 191 360
(100.0%) (100.0%) (100.0%)

Vol. 5 Special Issue 3 August 2017 ISSN: 2320-4168
138 Shanlax International Journal of Commerce
technical knowledge, problems in planning, inadequate infrastructure, lack of support from family
members, problems of dual responsibilities and dispute among the partners are less than 0.05 the
null hypothesis is rejected. Therefore it may be concluded that there is a significant difference in
problems such as fund management, lack of managerial skill, decision making problem, problem in
selecting the line of business, lack of marketing skill, lack of technical knowledge, problems in
planning, inadequate infrastructure, lack of support from family members, problems of dual
responsibilities and dispute among the partners among different amount of capital invested by
entrepreneurs.
Suggestions
Proper entrepreneurship education should be given at school level and the same concept is to
be included under common based syllabus in a compulsory way. Best young entrepreneurship
idea oriented students are to be identified at high school/higher secondary school level and
they should be under keen observation by the entrepreneurship incubators. Professional or
Technical course training on entrepreneurship should be given to all new/first generation
entrepreneurs and there is a need for a counseling center which comprises, business experts
and educationists with collaboration between educational institution and industry, to make the
entrepreneurs to get clarify their doubts in the walk of business. More support from the
Governments of State and as well as Central is to be extended and the District Industries Centre
should be modernized under the direct control of the District Collector to identify the right
project, right entrepreneurs at right time in order to avoid political interference, delayed/poor
services.
There is a need of war front actions from the government to watch out the organisations
established for entrepreneurship development, small industries development to take stringent
actions to have reality, practical applications of the rules and regulations and red tapism is to be
controlled and there is a need of rejuvenation for new/first generation entrepreneurs for those
who are encountered with problems. In government organisations, commercial banks and in
financial institutions, they just keep the records for document purpose with reference to
identification of entrepreneurs, loan sanction, awareness campaign and the like. They should be
advised to execute programmes like other organisations like MADITSSIA, CII, Chamber of
Commerce and the like.
Subsidies, tax concession, relaxation of norms, may be introduced to new/first generation
entrepreneurs. Financial assistances may be approved against the educational certificates to the
first generation/new entrepreneurs to motivate them by and large. In the name of first
generation entrepreneurs many existing entrepreneurs have availed benefits under the Prime
Minster’s Employment Guarantee Plan for record achievement (target) purpose by the
government officials and this situation is to be totally eradicated by replacing a totally new
system to monitor such organisations to execute their nurturing activity towards new/first
generation entrepreneurs not only for the welfare of the individuals but also for the welfare of
the nation. Institution and Industry tie-up is to be insisted more for all educational institutions
and industries to highlight the entrepreneurship culture for a better tomorrow.
Exclusive market for the products of the new/first generation entrepreneurs may be
synthesized if not the government can come forward to market the commodities of new/first
generation entrepreneurs.

International Conference on INDIA 2030
139 Manonmaniam Sundaranar University, Tirunelveli
Conclusion
The development of entrepreneurial culture in the targeted group involves various stages as
discussed above. Besides the imparting of such culture the entrepreneurs are still facing further
problems continuously. In small scale industries the entrepreneurs are already facing these
problems and hence the small scale industries are becoming sick. In this situation if the same
problems are encountered by the new entrepreneurs or first generation entrepreneurs they will be
gloomy out of their own activities. As a result of it, the possibility of directing more youngsters into
entrepreneurship arena will be affected. Hence, this endeavor has been made by the researcher to
strengthen the fresh / first generation entrepreneurs by extending the supporting hands from the
State and as well as Central Governments. Besides that the rapport action is also essential to watch
out units run by the first generation entrepreneurs to safeguard them from the evils of the problems
discussed earlier. With this solution the problem of first generation entrepreneurs will not come to
an end. It is a vibrant and hence an eternal follow-up actions according to the prevailing
environment is also to be taken or otherwise the present prevailing condition of the small scale
industries, operated by the first generation entrepreneurs will be an incessant one, not only in
Tirunelveli District but also everywhere in India.
References 1. Manohar V. Deshpande, “Entrepreneurship of Small-Scale Industries,” Deep and deep
Publications, New Delhi, p.1984.
2. Vasant Desai, “Small Scale Industries and Entrepreneurship” – Himalaya Publishing House,
1999.
3. Joseph V. “Rural Entrepreneurs in India”, Kissan World, January 2005.
4. Bhatia B.S. “New Industrial Entrepreneurs, their origins and problems”, Journal of General
Management, Vol.2, No.1, Autumn, 1974.
Vol. 5 Special Issue 3 August 2017 ISSN: 2320-4168
140 Shanlax International Journal of Commerce
SERVICE QUALITY OF BANKING INDUSTRY IN INDIA 2030
Dr.P.Jeyasri & M.Sorna Priya
Lecturer Department of Commerce, M.S.U College Sathankulam
Introduction
Service quality includes both the quality of core services and facilitating services. Which
enhances the value of core services to the customer? Facilitating services are also provided by
businesses that produce tangible goods. For example in banking services, a checking account is a
core services product where as additional services provided by banks. Such as automated teller
services and 24 hours telephone access to account information are facilitating services. Sometimes
facilitating services may be more valuable to the customers than the core services. For instance, the
fast food restaurant may produce tangible goods in the form of pizzas and french fries, which are
the restaurant’s core product. However, the restaurant’s distinctive feature may be its quick service
and friendliness of its service. Gronroos (1984) identified ‘technical’ and ‘functional’ quality as
being the two principle components of quality. Technical quality refers to the relatively quantifiable
aspects of a service which consumers receive in their interactions with a service firm. Because it can
easily be measured by both customer and supplier, it forms an important basis for judging service
quality. eg. Technical quality include the waiting time at a super market checkout and the reliability
of train services. This however, is not the only element that makes up perceived service quality.
Because services, involve direct consumer producer interaction. Consumers are also influenced by
how the technical quality is delivered to them. This is what Gronroos describes as functional quality
and cannot be measured as objectively as the elements at technical quality.
Statement of the Problem
Service Quality of the Banks refered as an obligation of all banks to fulfill the objectives and
needs of the customers. In General it is perused that, service quality in private sector banks is good
compare to public sector banks. The various issues are bank is not able to provide immediate
response to customers. Service time duration is more, long quee deposit the money, waiting for long
time, staff behavior is not good, especially public sector banks are not providing multitude services
like payment of bills, payment of tax, Bancassurance etc. And problem relating to banking service
such as bank statements, error in the statements are not provided immediate response to
customers. Parking facility in banks is very low compare to private sector banks. The biggest
challenge today for the bank is to establish customers intimacy without which all other efforts
towards operationed excellence are meaningless. The present need of banks is to have good
relationship with customers by providing quality services to retain the existing and generate or
acquire new customers. Thus, this study attempts to study the service quality in the bank in the
present scenario.
Objectives of the Study
To study various services provide by bank.
To find out determinants of service quality in banks.
To analysis level of service quality in banks.
Methodology of the Study
The study was carried out with both primary and secondary data. The primary data was
collected from 55 customers of banks located in Tirunelveli district. The analysis were carried out

International Conference on INDIA 2030
141 Manonmaniam Sundaranar University, Tirunelveli
with the responses of selected bank customers by adopting conveniences sampling through
questioner and presented in the form of tabulation. The tool for analysis like percentage analysis
mean score were used to verify association between opinions expressed by bank customers on
service quality of banking services.
Bank Customer Analysis
Most Priority of Banking Services Utilization
Table: 1:1. Most Priority of Banking Services Utilization
Source: Primary Data
From the above table 1.1. It is clear that
41.82 percentage of the respondents are
using ATM, 29.09 percentage of the
respondents are using A/c operation, 9.09
percentage of respondents are using debit
card. 5.45 percentage of respondents are
using internet banking,3.64 percentage of
respondents are using credit card. 3.64
percentage of respondents are using core
banking, 1.82 percentage of respondents are
using online trading and insurance and
remaining 1.82 percentage of respondents are
using mobile banking and safety lockers.
Majority of respondents are priotiry the
usage of ATM than others. Because using ATM
is easy way to access cash and to avoid going
to the bank for cash withdrawal.
The respondents shall thus save time
instead of wasting their precious time in
standing in a long queue in cash counter in
the bank to with draw money. Thus, online trading mobile banking these are the advanced
technology are not used most of the banks charge are high. And knowledge of the respondents on
that technolagy also low.
Tangibility Aspects of Quality of Banks Services
Table: 1.2. Tangibility Aspects of Quality of Banks Services
Tangiblity Excellent Good Moderate Bad Poor Mean score
Bank equipments 14 28 13 - - 4.02
Bank slips (forms) 17 24 10 1 3 3.93
Bank location 9 30 16 - - 3.87
Ventilation 11 23 21 - - 3.82
Seating facility 10 24 20 1 - 3.78
Location of ATM center 16 17 17 3 2 3.76 Parking Services 2 17 18 12 6 2.95
Source : Primary data
The above table 1.2 shows that out of total respondents, the perception on the quality of banking services with reference to bank equipments (4.02) is good perception on bank slips forms (3.93) bank location (3.87), ventilation (3.82), seating facility (3.78), and location of ATM center
Particulars Number of
Respondents Percentage of Respondents
A/c operation 16 29.09
Kissan card - -
Credit card 2 3.64
Online trading 1 1.82
Insurance 1 1.82
Tele Banking - -
Debit card 5 9.09
D’mat a/c - -
Mobile Banking 1 1.82
ATM 23 41.82
Safety Lockers 1 1.82
Core Banking 2 3.64
Internet Banking 3 5.45
Others( specify) - -
Total 55 100

Vol. 5 Special Issue 3 August 2017 ISSN: 2320-4168
142 Shanlax International Journal of Commerce
(3.76),are moderate. And the quality of parking services (2.95), is bad as per the respondents. Out of all the tangibility services of the bank the respondents self that the quality of bank equipments are good because the quality are good because the services is fast easy due to computerization. Assurance Aspects of Quality of Bank Services
Table: 1.3. Assurance Aspects of Quality of Bank Services
Source : Primary data
The perception of the quality of banking services with reference to safety Deposits (4.04) and safety transaction (4.02) are good. Perception on working hours (3.8), saving interest rate (3) are
moderate and the quality of loan Interest rate (2.96) is Bad as per the respondents. Out of all, Assurance service of the bank, the respondents felt that overall the banking services is provided as per assured. Reliability Aspects of Quality of Bank Services
Table : 1.4. Reliability aspects of quality of bank services: Reliability Excellent Good Moderate Bad Poor Mean Score
Employee reliability 16 18 18 2 1 3.84
ATM Services 19 17 12 4 3 3.82
Transaction accuracy 11 24 18 - 2 3.76
Mortgage facility 13 19 18 4 1 3.71 Speed transaction services 14 18 13 3 7 3.53 Loan facility 6 21 23 2 3 3.45
Services charges 7 18 23 3 4 3.38
Credit card services 9 19 16 5 6 3.36
Source : Primary data
Table 1.4 from the total respondents perception on the quality of banking services with reference to Employee reliability (3.84), ATM Services (3.82), Transaction accuracy (3.76), montage facility (3.71), speed transaction services (3.53), Loan facility (3.45), service charges (3.38) and credit card services (3.36), are moderate and even partially good. Reliability services of the bank, The respondents felt that they are providy moderate and good services. Responsiveness Aspect of Quality of Bank Services
Table : 1:5. Responsiveness aspect of quality of Bank services:
Responsiveness Excellent Good Moderate Bad Poor Mean Score
Solving the problem 15 18 18 3 1 3.78
Services promptness 10 26 15 3 1 3.75
Providing information 10 23 18 4 - 3.71
Good Relationship 12 21 16 4 2 3.67
Employee knowledge 6 25 23 1 - 3.65
Immediate responses 9 24 14 6 2 3.58
Multitude services (Bancassurance payment of tax payment of bill advisory services).
2 15 22 7 9 2.89
Source: Primary data
Assurance Excellent Good Moderate Bad Poor Mean
Safety & Deposits 16 25 4 - - 4.04
Safety Transaction 16 27 10 1 1 4.02
Working hours 12 26 11 2 3 3.8
Saving Interest rate 4 14 25 2 10 3
Loan Interest rate 7 7 25 9 7 2.96

International Conference on INDIA 2030
143 Manonmaniam Sundaranar University, Tirunelveli
The above table 1.5 shows that out of total respondents the perception on the quality of Bank
services with reference to solving the problem (3.78), services promptness (3.75). Providing
information (3.71), good relationship (3.67) Employee knowledge (3.65), immediate responses
(3.58), are good. And the quality of multitude services (2.89) is Bad as per the respondents. Out of
all the responsiveness to the service of the bank, the respondents felt that the quality of solving the
problem is good. Because banks are solving the problem is with high interest and overall it is
moderate and good.
Empathy aspect of Quality of Bank Services
Table : 1:6. Empathy aspect of quality of Bank Services Particulars Excellent Good Moderate Bad Poor Mean Score
Individual attention 16 21 14 4 - 3.89
Sincerity in problem solving 16 20 16 2 1 3.87
Need understating 11 23 18 3 - 3.76
Pro-activeness 8 24 20 1 2 3.64
Employees courtesy 6 22 25 2 - 3.58
Staff behaviours 11 18 22 1 3 3.60
Source : Primary Data
Table 1.6 shows that out of total respondents the respondents perception on the quality of
banking services with reference to Individual attention (3.89), Sincerity in problem solving (3.81),
need understanding (3.76), Pro.activeness (3.64) Employees courtesy (3.58), staff behaviour (3.6)
are Good. The respondents felt that the quality of individual attention and problem solving is at
satisfied level and in bank is empirical towards customers.
Table 1.7 Overall Stratification of Quality of Bank Service
Source: Primary data
The table 1.7 indicates that 45.45 percentage of the respondents rated good. 30.91 percentage of the respondents rated moderate, 21.82 percentage of the respondents rated excellent and 1.82 percentage of the respondents rated poor on the overall satisfaction of quality of Banks service, Thus, the customers are satisfied with the quality of service provided by the
banks in Tirunelveli district. Findings of the Study 1. Gender wise of respondents: Majority of the respondents (69.09) percent were male than female. Because male respondents are employed 2. Age wise of respondents: Majority of the respondents have been existing in the 21-40 years than others. 3. Educational Qualification of respondents: Majority of the respondents are (34.55) high school level than others. Thus most of the respondents are hading bank a/c are educated. 4. Occupation of the respondents: Majority of the respondents are (30.91) private employees than others. Private employees are earning is high. 5. Monthly income of the respondents: Majority of respondents are earning below 10000 than others. Thus, respondents earning below Rs. 10000 level is low. Employed is less income employment. 6. Place of living of the respondents: Majority of respondents are (49.09) living urban rural and semi urban. Urban then area are access to banking services. 7. Type of Banks: Majority of the respondents (61.82) percent public sector bank, (89.09) of the respondents’ private sector bank and remains were co – operative bank. Most of Govt. employees compulsory credited the bank.
Particulars Number of
Respondents Percentage of Respondents
Excellent 12 21.82 Good 25 45.45 Moderate 17 30.91 Bad 1 1.82 Poor - - Total 55 100
Vol. 5 Special Issue 3 August 2017 ISSN: 2320-4168
144 Shanlax International Journal of Commerce
8. Location of the Banks branch: Majority of the Bank location (63.64) Urban areas than semi – urban and rural Govt. Provides the more facility in urban areas. 9. Type of account of the respondents: Majority of respondents taken the savings a/c (89.09) than other salary of their employee’s are credited in their savings a/c. 10. Duration as account holders: Majority of the respondents (54.54) below 3 years than others. 11. Frequency of account access: Majority of the respondents access their bank a/c (54.55) monthly than weekly and remaining daily. Thus, majority of the respondents access their a./c every month. 12. Operation of the account: The respondents (76.36) operate their self a/c. Majority of the respondents self than jointly. 13. Most priority of Banking services utilization: The respondents (41.82) have access their ATM facility. It’s ATM are more convenience to customer. 14. Perception of quality of Bank services: Majority of the respondents are (4.02) Bank equipment. (4.04) safety deposits (4.02) safety transaction than others. 15. Tangibility aspects of quality of banks services: Majoirty respondents expressed that perception (4.02) Bank equipment than other services. Thus, overall respondents felt that Good. 16. Assurance aspects of quality of bank services: The respondents were expressed Good (4.04) safety deposits, (4.02) safety transaction then others. 17. Reliability aspects of quality of Bank services: The respondents were expressed as moderate as for the reliability of bank services. Employee reliability than other services. 18. Responsiveness aspects of quality of bank services: The respondents were expressed as good as for responsiveness of bank services. (3.78) solving the problem, (3.75) services promptness than others. 19. Empathy aspects of quality of bank services: The respondents were expressed as Good as empathies of banking services. (3.89) individual attention. (3.87) sincerity in problem solving, (3.76) need understanding than others. 20. Overall satisfaction of quality of banking services: The total respondents are over all stratified (45.45) is wood than others. Conclusion It is clear that the nationalized banks have almost all same policies regarding the customer dealing and financial transactions. The perception of the consumers on different banks amy differ due to the behavior of the individual employees or officers. Almost all the servies \were rated as good by the respondents. Except for loaning interest rate and mortgage facilities. The five dimensions of SERVQUAL were observed as an ideal in all the banks. The slight difference in the reliability of the employees was an exception. It may be due to transferable service nature of the employees. As the banks are also conducting quality measurement surveys on routine basis and accordingly improving their policies at par to the expectation of the consumers. In addition, management of banks will also need to focus on building awareness and edueates the various stakeholders on interpretation of information to assist in the better undertaking of the banks, its operations and performance. The Indian banking Industry has a significant role to play in the economy, and appropriate management of the challenges arising out of managing capital, growth risks and governance will be critical to success. Reference
1. Pmohnaty.r.and lakhe.r..(2006).”tqm in the service sector,JAICO publishing house.
2. Service marketing “(2003)”.himalaya publishing house Christopher services marketing,
people,technologystrategy
3. Donald j.bowersox,david j,closs(2000)”logistical management” tata mcgrahill publishing
limited.banttacharjw(2006)”service marketing published by anurag jain for excel books.

International Conference on INDIA 2030
145 Manonmaniam Sundaranar University, Tirunelveli
ENTREPRENEURIAL ABILITY AND TRAITS AMONG M.B.A GRADUATES
IN KANYAKUMARI DISTRICT – AN ANALYTICAL STUDY
Dr. R. Siva Sankar
Assistant Professor, P.G. Department of Commerce, Vivekananda College, Agasteeswaram
Introduction
The entrepreneur is in essence and institution which comprises all the people required to
perform various functions. Such people not only introduce innovations but implement the
necessary adjustments in production units when they expand on account of change in demand and
its market conditions. These persons also foresee the opportunities inherent in a given situation
and even make opportunities out of a given situation. The entrepreneurial personality is a
composite of the person, his skills, styles and motives. The entrepreneur is central to
entrepreneurship because without the key individual who makes things happen, there can be no
creative results. A complex and varying combination of financial, institutional, cultural and
personality factors determines the nature and degree of entrepreneurial activity at any time.
The personal backgrounds of the entrepreneurs are determined mainly by the environment in
which they are born and brought up and work. The entrepreneurs in turn create an impact on the
environment. Entrepreneurship is based on purposeful and systematic innovation. Systematic
innovation consists in the purposeful and organized search for changes and in the systematic
analysis of the opportunities such changes might offer economic or social innovation.
Literature Review
Tony Bailetti (2012) had suggested that better definition of technology entrepreneurship can
help improve its performance, increase its relevance, and establish it as a legitimate domain of
inquiry in its own right. This definition needs to identify and incorporate the various distinctive
aspects of technology entrepreneurship and its links to the existing domains of economics,
entrepreneurship and management. The definition, including the corresponding features and links,
requires particular attention from scholars and practitioners. Subbaiah Ilayaraja (2015) had
concluded that, today, a number of schools, colleges, science and technology institutions and
management schools have include entrepreneurship inputs in their curriculum. Thus
entrepreneurship education provides a mix of experiential learning, skill building and most
importantly, mindset, while developing attitude, behaviour and capacities at the individual level.
Changquing Lai, et.al., (2015) had observed scientific effect on theoretical development of social
network in entrepreneurship education. In fact, through courses and projects of entrepreneurship
education, mentors, monitors and students from their network. In this network, mentors, monitor
and projects affect students respectively. Those tutors who have structure advantage can invite
entrepreneurs and government officers, affecting students’ entrepreneurial abilities.
Roger R. Stough (2016) reveals that national and regional governance and institutions are
particularly critical components of regional entrepreneurship ecosystem performance. The last
major fact of the study is entrepreneurship support for special groups and some sub areas of
research that are emerging or have persisted.

Vol. 5 Special Issue 3 August 2017 ISSN: 2320-4168
146 Shanlax International Journal of Commerce
Statement of the Problem
The economic development of a country is largely depends on human, physical, and financial
resources. The entrepreneurs are a major part of developing the nation economy. The education
system in India motivates and cultivates the young minds for future growth of the nation. India’s
higher education system produces large number of graduates every year. But the entrepreneurial
ability and traits is vary from M.B.A graduates to other graduates. Generally, M.B.A graduates have
more knowledge about entrepreneurial aspiration and ability to innovate new ideas. To know the
entrepreneurial ability of M.B.A graduates, the study of entrepreneurial ability and traits among
M.B.A graduates in Kanyakumari District have been undertaken.
Objectives of the Study
1. To study the inspirational level of M.B.A graduates towards entrepreneurship.
2. To analyse the entrepreneurial ability of M.B.A graduates.
3. To analyse entrepreneurial traits of M.B.A graduates.
Scope of Study
The main scope of the study is to identify the entrepreneurial ability and traits among M.B.A
graduates and their reaction on entrepreneurship. The study is researcher limited to the M.B.A.
graduates of Kanyakumari District.
Methodology and Data Collection
The survey technique has been used as the main research method in this study. The study is
based on both primary and secondary data. The primary data has been collected by using a
structured questionnaire which was given to M.B.A graduates chosen at random at various places of
Kanyakumari District. The questionnaire was administered among a sample of 120 respondents
who were selected at random. The secondary data have been collected from various books, journal,
published Ph.D report and internet.
Sampling Procedure
This study applies stratified random sampling method was adopted. For the purpose of the
study the respondents are equally selected from Agasteeswaram taluk, Kalkulam taluk, Thovalai
taluk and Vilavancode taluk as non-proportional basis. The size of the sample is 120 M.B.A
graduates.
Statistical Techniques Used
Data in this study were analysed and processed with the help of statistical package for social
science. The t-test and standard deviation is used for entrepreneurial ability and triats possessed by
M.B.A graduates in the study area. The chi-square test is used for analyzing the level of
entrepreneurial ability possessed by M.B.A graduates.
Analysis and Interpretation:
Inspirational level of M.B.A graduates towards entrepreneurship
Table 1: Age Table 2: Gender
Sl. No Age Frequency %
1. Below 25 years 52 43
2. Above 25 years 68 57
Total 120 100
Sl. No Gender Frequency Percentage
1. Male 71 59
2. Female 49 41
Total 120 100

International Conference on INDIA 2030
147 Manonmaniam Sundaranar University, Tirunelveli
Table 3: Area of Residence Table 4: Occupation of the parents
Table 5: Parents Encouragement
Table 6: Role Model
Sl. No Factors Frequency %
1. Always 33 28
2. Sometime 35 29
3. Never 52 43
Total 120 100
Table 7: Academic Achievement Table 8: Entrepreneurial skills
Table 1 shows that 57 per cent of the respondents belongs to above 25 years and 43 per cent
are belongs below 25 years. The study reveals majority of the respondents from above 25 years.
Table 2 reveals that 59 per cent are male and 41 per cent are female. The survey reveals male
respondents are actively involved in entrepreneurship.
Table 3 observed that 65 per cent respondents from urban areas and 35 per cent are rural
areas. The study report that majority of the M.B.A. graduates from urban areas.
Table 4 inferred that 51 per cent of the respondents’ parents are salaried employee, 28 per cent
of the respondents’ parents are agricultural laborers, and 21 per cent of the respondents parents’
are undertaking the entrepreneurial activities. The study report that majority of the respondents’
parents are salaried employee.
Table 5 clearly shows that 43 per cent of the respondents’ parents are not encouraging their
children to become an entrepreneurs, 29 per cent are sometime encouraged their children and
28 per cent are encouraged their children to become an entrepreneurs. The study report that
majority of the respondents are not encouraged their children to become an entrepreneurs.
Table 6 noted that 58 per cent of the M.B.A graduates have role model in the field of business
and 42 per cent are not having any role model. The study report that majority of the respondents
have role model in the field of business.
Table 7 understood that 53 per cent of the M.B.A graduates are 60-70 marks in their studies, 28
per cent are 50-60 marks and 19 per cent are above 70 marks. The study reveals that majority of
the respondents have got first class marks in their studies.
Table 8 observed that 53 per cent of the M.B.A graduates have entrepreneurial skills and 47 per
cent are not having entrepreneurial skills. The study report that majority of the M.B.A graduates
have entrepreneurial skills.
Sl. No Area Frequency %
1. Rural 42 35
2. Urban 78 65
Total 120 100
Sl. No Occupation Frequency %
1. Salaried employee 61 51
2. Agriculture 33 28
3. Entrepreneurs 26 21
Total 120 100
Sl. No Factors Frequency %
1. Yes 69 58
2. No 51 42
Total 120 100
Sl. No Marks Frequency %
1. 50 – 60 34 28
2. 60 – 70 64 53
3. Above 70 22 19
Total 120 100
Sl. No Factors Frequency %
1. Yes 64 53
2. No 56 47
Total 120 100

Vol. 5 Special Issue 3 August 2017 ISSN: 2320-4168
148 Shanlax International Journal of Commerce
Entrepreneurial Ability Possessed by M.B.A graduates:
The entrepreneurial ability is differ from M.B.A. Graduates to other graduates. To know the
entrepreneurial ability possessed by the M.B.A graduates, ten statement have been undertaken by
the researcher. The opinion gathered from M.B.A graduates and their opinion are analysed with the
help of t-test. The results are shown in Table 9.
Table 9: Entrepreneurial Ability Possessed by M.B.A graduates
Sl. No Factors Mean Score Standard deviation t-test
1. Ability to work hard 4.27 1.0812 2.8621*
2. Ability to take risk 4.18 1.1713 4.6210*
3. Ability to mobilize the finance 3.96 1.8120 1.001
4. Ability to market the product 4.10 1.0923 1.820
5. Ability to mobilize raw materials 4.11 1.0612 3.960*
6. Ability to communicate to others 4.22 1.6621 2.982*
7. Ability to know all formalities 3.97 1.9261 1.1120
8. Ability to take managerial decision 4.23 0.8912 2.520*
9. Ability to have innovative skills 3.91 2.0180 0.899
10. Ability to form organization 3.98 1.9912 1.223
*Significant at five per cent level
From the above analysis clearly shows that ‘ability to work hard’ is an most important ability
possessed by M.B.A graduates followed by ‘ability to take managerial decisions’. The variables such
as ‘ability to work hard’, ‘ability to take risk’, ‘ability to mobilize raw materials’, ‘ability to
communicate to others’ and ability to take managerial decisions since their respective t-test is
significant at five per cent level. Hence these are important factor significantly impact the
entrepreneurial ability possessed by M.B.A graduates in the study areas.
Entrepreneurial Traits of M.B.A graduates:
The researchers have identified the most important entrepreneurial traits for a M.B.A graduates
to start the business. The respondents are given the opinion towards the traits according to their
priority. The opinion of M.B.A graduates are analysed with the help of t-test. The results are given in
Table 10.
Table 10: Entrepreneurial Traits of M.B.A graduates
Sl. No Traits Mean Score Standard deviation t-test
1. Hard work 4.20 1.001 3.962*
2. Self-confidence 4.29 1.021 3.821*
3. Imitative 4.01 1.071 2.993*
4. Commitment 3.96 1.812 1.621
5. High Achievement 3.87 1.713 1.123
6. Persistence 3.92 1.891 0.892
7. Independence 4.10 1.098 2.621*
8. Highly optimistic 3.99 1.992 1.921
9. Risk bearing 3.78 1.913 0.9820
10. Innovativeness 3.92 1.831 2.101*
*Significant at five per cent level
From the above analysis shows that ‘self-confidence’ is the most important traits, which is
needed to become an entrepreneur followed by ‘hard work’. The variables such as ‘self-confidence’,

International Conference on INDIA 2030
149 Manonmaniam Sundaranar University, Tirunelveli
‘hard work’, ‘Imitative’, ‘independence’ and ‘Innovativeness’ since their respective t-test is
significant at five per cent level. Hence these variables significantly impact the entrepreneurial
traits of M.B.A graduates in the study areas.
Level of Entrepreneurial ability:
The level of entrepreneurial ability are analysed with the help of chi-square test. For this
purpose the personal factors of M.B.A graduates are compared to the level of entrepreneurial
ability. The results are shown in Table 11.
Table 11: Level of Entrepreneurial Ability Sl. No Factors Calculated value of 2 Table value Results
1. Age and entrepreneurial ability 21.875 5.991 Association
2. Gender and entrepreneurial ability 19.625 5.991 Association
3. Area of residence and entrepreneurial ability 17.675 5.991 Association 4. Academic achievement and entrepreneurial ability 29.623 9.490 Association
5. parents encouragement and entrepreneurial ability 4.695 9.490 Not Association
It is clear from the above analysis that the major personal factor that impact the level of
entrepreneurial ability of M.B.A graduates is Age, Gender, Area of residence and Academic
achievement. These four variables significantly associating the level of entrepreneurial ability of
M.B.A graduates. Thus, the age, gender, area of residence and academic achievement are
significantly impact the level of entrepreneurial ability of M.B.A graduates in the study area.
Conclusion and Recommendation
Education plays essential for developing entrepreneurship. Education needs to address the
development of skills required to generate and entrepreneurial ability. The government and
non-government agencies could be encourage the M.B.A graduates through financial help and
provides subsidy for starting the enterprises. After starting the new enterprises they also help in
the area of marketing and raw material procurement. This allows the M.B.A graduates to becoming
an entrepreneur easily in the study areas. From the study most of the M.B.A graduates have not
encouraged by the parents. Hence the government can take necessary step to guidance given to the
parents in relation to development of entrepreneurship in the country. Every educational
institution can be established Entrepreneurs Guidence Cell and experts in the industries can be
invited to advise the students on taking up the business venture.
References
1. Desai, Vasant, “Dynamics of Entrepreneurial Development and management”, Himalaya
Publhsing House, Mumbai, 1992.
2. Gupta, C.S, and Srinivasan, N.P, “Entrepreneurial development”, Sultan chand & Songs, New Delhi,
2006.
3. Khanka, S.S, “Entrepreneurial development”, Sultan Chand & Company Ltd, New Delhi, 2001.

Vol. 5 Special Issue 3 August 2017 ISSN: 2320-4168
150 Shanlax International Journal of Commerce
A STUDY OF CONSUMER BEHAVIOUR RELATED TO QUIBELL AND OTHER BRANDS
Mr. E. Perumal, MBA, M.Phil., Assistant Professor of Business Administration, Manonmaniam Sundaranar University College, Cheranmahadevi, Tirunelveli
Mr. S. Sankar Gobinath, MBA Assistant Professor of Business Administration, Monomaniam Sundaranar University Constituent College, Kadayanallur, Tirunelveli
Abstract The research entitled on “A Study of Consumer Behaviour related to Quibell and Other Brands”. Packaged drinking water consumption has been steadily increasing in the world for the past 30 years. It is the most dynamic sector of all the food and beverage industry: bottled water consumption in the world increases by an average7% per year. Packaged drinking water is a product that is used by most of the individuals as well as organizations now days. There are various brands of packaged drinking water in the market, so the market is full of competition. So the knowledge of the customer taste, preferences, wants, shopping and buying behavior provides the clues for developing the new products, price, product changes, messages and other marketing mix elements. Consumer behaviour is a rapidly growing discipline of study. It means more than just how a person buys products. It is a complex and multidimensional process and reflects the totality of consumers’ decisions with respect to acquisition, consumption and disposal activities. We as consumers, exhibit very significant difference in our buying behavior and play an important role in local, national and international economic conditions. Organizations realize that their marketing effectiveness in satisfying consumer needs and wants at a profit depends on a deeper understanding of consumer behavior. In this research, we have analyzed the various aspects regarding the purchase of packaged drinking water by the consumers.
Introduction
Consumer behaviour is a rapidly growing discipline of study. It means more than just how a
person buys products. It is a complex and multidimensional process and reflects the totality of
consumers’ decisions with respect to acquisition, consumption and disposal activities. We as
consumers, exhibit very significant difference in our buying behavior and play an important role in
local, national and international economic conditions. Organizations realize that their marketing
effectiveness in satisfying consumer needs and wants at a profit depends on a deeper
understanding of consumer behavior. In this research we have analyzed the various aspects
regarding the purchase of packaged drinking water by the consumers.
Company Profile
Selvam Aqua Farms are the manufacturers of Quibell Packaged Drinking Water. Selvam Aqua
Farms was incorporated in Tuticorin in the year 2003. They are the leading retail & whole sale
packaged drinking water suppliers in the whole of southern Tamil Nadu including Tuticorin,
Tirunelveli and Nagerkovil. Their distribution network includes retailers, companies as well as
direct customers. Some of their potential customers are Sterlite Industries (India) Limited, Microtck
Shipping Agency, etc.
Selvam Aqua Farms deals in a wide range of products like:
Quibell packaged drinking water
Quibell evervess soda
Quibell softdrinks

International Conference on INDIA 2030
151 Manonmaniam Sundaranar University, Tirunelveli
Industry Profile
India is the tenth largest bottled water consumer in the world. In 2002, the industry had an
estimated turnover of Rs.10 billion (Rs.1, 000 crores). Today it is one of the fastest growing
industrial sectors. Between 1999 and 2004, the Indian bottled water market grew at a compound
annual growth rate (CAGR) of 25 percent – the highest in the world. With over a thousand bottled
water producers, the Indian bottled water industry is big by even international standards. There are
more than 200 brands, nearly 80 percent of which are local. Most of the small-scale producers sell
non-branded products and serve small markets.Despite the large number of small producers, this
industry is dominated by the big players - Parle Bisleri, Coca-Cola, PepsiCo, Parle Agro, Mohan
Meakins, SKN Breweries, and so on. Parle was the first major Indian company to enter the bottled
water market in the country when it introduced Bisleri in India 30 years ago.
Statement of the Study
To study the consumer buying behavior towards Quibell and other brands of packaged drinking
water to have a deep knowledge of consumer behavior regarding packaged drinking water.
Objectives of the Study
Primary Objective
To understand consumer behavior related to Quibell and other packaged drinking water.
Secondary Objectives To determine how much the various factors are influencing the consumer behavior. To make a comparative analysis between Quibell and other brands based on sales. To find about consumers’, dealers’ and retailers’ brand preference. To know about the consumer satisfaction level associated with the product.
Scope of the Study
The study is applicable only to the dealers, retailers and customers in the Tuticorin area.
This study throws light on the consumer behavior related to various brands of packaged
drinking water in that region.
Research Design
A research design is the arrangement of the condition for the collection and analysis of data.
Descriptive research method study has been followed to conduct this study as the major purpose of
descriptive research is description of the state of affairs as it exists at present.
Data Collection
a) Primary data: Primary data was collected through face to face interviews while filling up
interview schedules.
b) Secondary data: Secondary data was gathered from the previous surveys conducted in that
research area and from the company employees to know about the other brands of packaged
drinking water available in that area and this data was used to frame the interview schedules.
Sampling
Sample Size: The sample size chosen for the study was 100. The sample was split into two
categories – customers and dealers/retailers. I took 60 customers and 40 dealers/retailers as my
respondents.
Sampling Method: As the population size is unknown, non probability sampling technique was
chosen so that samples can be selected according to the researcher’s convenience. Convenience
sampling technique was used in the study.
Tools used in the study
Percentage analysis Weighted average analysis

Vol. 5 Special Issue 3 August 2017 ISSN: 2320-4168
152 Shanlax International Journal of Commerce
Chi-square analysis ANOVA analysis
Analysis
Consumers’ view about influence of various factors
Weights 6 3 1 Factors High
influence Low
influence No
influence Total Weighted
average Rank
Brand image 39 21 0 297 29.7 1 Availability 27 22 11 239 23.9 3
Advertisement 32 26 2 272 27.2 2 Ranges available 9 30 21 165 16.5 6
Price 12 26 22 172 17.2 5 Taste 20 18 22 196 19.6 4
ANOVA Analysis - Analysis of brands and factors influencing sales
Hypotheses
H0 : There is no significant difference between preference of brands of packaged drinking water.
H0 : There is no significant difference between factors influencing sales of packaged drinking water.
Brands and factors influencing sales
Factors Brands
Aquafina Quibell SDR Galaxy Robell Sabols Others Total Brand image 399 321 145 255 136 252 174 1682 Availability 321 336 202 182 176 262 199 1678 Advertisement 398 258 153 255 125 297 190 1676 Ranges Available
229 361 251 135 200 336 173 1685
Taste 387 312 142 274 149 256 160 1680 Total 1734 1588 893 1101 786 1403 896 8401
Anova Table
Source of
Variation Sum of Squares
Degree of
freedom Mean Square F - Ratio
Between Columns
(Brands) SSC = 168954.17 V1 = 6 MSC = 28159.03
FC = MSC / MSE
= 11.25
Between Rows
(Factors) SSR = 6.97 V2 = 4 MSR = 1.74
FR = MSR / MSE
= 0.0007
Residual SSE = 60051.83 V = 24 MSE = 2502.16
Inference
From the above analysis we can see that there is a significant difference between the
preferences of brands of packaged drinking water of customers. At the same time factors
influencing the sales of packaged drinking water are significantly indifferent.
Findings
From the above analysis it is clear that most of the respondents i.e. 46.67 % of the respondents
are in the age group of 25 – 40, 33.33 % in above 40 age group, 16.67 % in 12 – 25 age group
and remaining respondents are below the age of 12.

International Conference on INDIA 2030
153 Manonmaniam Sundaranar University, Tirunelveli
From the above analysis it is clear that most of the consumers i.e. 40 % of the consumers are
service persons, 28.33 % of the consumers are in business field, 16.67 % are in other
occupation and remaining 15 % are students.
From the above analysis it is clear that 40 % of the consumers are in the income range of above
Rs 20000, 28.33 % of the consumers are in the range of Rs 10000 - 20000 and remaining
consumers are below the monthly income range of Rs 10000.
From the above analysis it can be analyzed that 43.33 % of the respondents buy packaged
drinking water weekly, 21.67 % of the respondents buy packaged drinking water weekly, 18.33
% respondents are daily consumers and remaining buy at other frequencies.
From the above analysis it is clear that 58.33 % of the consumers are aware of only 4 – 6 brands
of packaged drinking water, 26.67 % of the consumers are aware of more than 6 brands and
remaining 15 % consumers are aware of less than 3 brands.
From the above analysis the most preferred package sizes are 1 Ltr and 20 Ltrs with a
percentage of 41.67 and 35 respectively. Packets are preferred by 18.33 % of consumers and 2
Ltrs package size is preferred by only 5% of consumers.
From the above analysis it can be analyzed that Aquafina is the most preferred brand which is
preferred by 36.67 % of respondents. Quibell is the next highest preferred brand with a
percentage of 28.33 %. Galaxy and Sabols are next in the row with percentages of 13.33 and
11.67 respectively. The remaining are the ones which are having percentage of less than 5 each.
From the above analysis it can be said that the influence of factors on the choice of brand are
nearly the same. But the most influencing factors are availability and brand image with
influence percentage of 28.33 and 26.67 % respectively. The percentage of influence of
reference is 20 % and advertisement is 16.67 %. Taste has an influence percentage of 6.67 %.
While others factors have only 1.67 %.
From the above analysis it can be analyzed that most of the consumers, i.e. 68.33 % of
consumers purchase packaged drinking water directly, 21.67 % order over phone and
remaining 10 % order during the visit of dealer / retailer.
From the above analysis it is clear that most of the consumers are satisfied with their preferred
brand of packaged drinking water. The percentage of satisfied consumers amounts to 71.67 %.
The percentage of highly satisfied consumers is 21.67 % and moderately satisfied consumers
are 6.67 %.
From the above analysis it can be analyzed that 76.67 % of consumers’ mode of payment is cash
basis and only 23.33 % of consumers pay on credit basis.
From the above analysis it can be analyzed that Aquafina is the most selling brand market share
of 35 %. Quibell is the next highest selling brand with a percentage of 27.5 %. Sabols is next in
the row with a selling percentage of 12.5. SDR, Galaxy and Others have equal share less 7.5 %
each and Robell with the least share of 2.5 %.
From the above analysis the most selling package size is 1 Ltr with a percentage of 57.5 %. The
next highest selling packet size with a percentage of 25 % share is 20 Ltrs. Packets are having a
selling percentage of 12.5 % and 2 Ltrs with the least share of 5 %.
From the above analysis it can be analyzed that the major consumers of packaged drinking
water are individuals with a net percentage of 77.5 %. The residence, companies and shops are
having percentages of 12.5 %, 5 % and 5 % respectively.
From the above analysis it can be analyzed that most of the orders, i.e. 77.5 % of the orders are
placed directly, 15 % orders over phone and remaining 7.5 % orders during the visit of dealer /
retailer.

Vol. 5 Special Issue 3 August 2017 ISSN: 2320-4168
154 Shanlax International Journal of Commerce
From the above analysis it is clear that 40 % of dealers / retailers place their orders weekly.
17.5 % place their orders daily and 10 % placer orders monthly. The remaining 40 % place
their orders at different frequencies.
Based on the above analysis it is clear that the factor which influences the sales of packaged
drinking water is brand image. The next important factor is the advertisement. Availability
comes next in the row with taste, price and ranges available succeeding it.
From the above analysis it can be said that brand image has the first rank in the dealers’ /
retailers’ point of view also. The next rank goes to availability and advertisement gets the third
rank. Taste and Ranges available share the fourth rank. While Price get the last rank of the all.
Based on the above analysis it can be said that there is no relationship between occupation and
brand awareness of consumers.
Based on the above analysis it is clear that there is significant relationship between age group
and brand awareness of consumers.
Based on the above analysis it can me said that there is no relationship between occupation and
brand awareness of consumers.
From the above analysis we can see that there is a significant difference between the
preferences of brands of packaged drinking water of customers. At the same time factors
influencing the sales of packaged drinking water are significantly indifferent.
Suggestions
The company may provide effective measures to increase sales by way of advertising and sales
promotion.
The company may conduct customer satisfaction survey in order to know the consumer
perception.
For promotional offers, company should go for free gifts rather than going for other ways.
Conclusion
A survey on the people has been conducted to know the consumer behaviour on Quibell and
other brands of packaged drinking water. The tremendous awareness among the people regarding
their health has resulted in a high growth of packaged drinking water throughout the world. It is
observed that overall people consume 1Ltr size of packaged drinking water more than other bottle
sizes. Also their buying decision is usually based on brand image, advertisement and availability
even though there is not much difference between the factors affecting the sales.
It can also be concluded that mostly people prefer Aquafina brand while Quibell comes next. Also
from the analysis it can be said that even though Quibell has high sales due to high availability but
its sales can be further improved by giving more advertisements.

International Conference on INDIA 2030
155 Manonmaniam Sundaranar University, Tirunelveli
DIGITAL INDIA OPPORTUNITIES AND CHALLENGES
Mrs.P.Suganya
Assistant Professor, Department of Commerce, Manonmaniam Sundaranar University, Tirunelveli
Abstract Digital India is the beginning of digital revolution. It is a dream which is created by the Government of India to ensure that government services are made available to citizens electronically, even in remote areas, by improving online infrastructure and by increasing Internet connectivity. The programmes have one mission and one target that is to take nation forward digitally and economically. The initiative will enable people to get engaged in the innovation process which is needed by the economy to move forward. But to implement this is a great challenge. There are many roadblocks in the way of its successful implementation like digital illiteracy ,poor infrastructure, low internet speed, lack of coordination among various departments, issue pertaining to taxation etc . These challenges need to be addressed in order to realize the full potential of this programme. It requires a lot of efforts and dedication from all departments of government as well as private sector. If implemented properly, it will open various new opportunities for the citizens of the country. Key Words- Digital, Infrastructure, Opportunities, Programmes,
Introduction
Digitalization is one of the most fundamental periods of transformation we have ever
witnessed. Digital India was a flagship programme launched by the Prime Minister of India
NarendraModi on 1 July 2015 - with an objective of connecting rural areas with high-speed internet
networks and improving digital literacy. The vision of this programme is to transform India into a
digitally empowered society and knowledge economy. The digital world that we live in today is that
where every civilian has a bright prospect to transform the lives in many ways that were hard to
envision just a couple of years ago. It is the outcome of several innovations and technology
advances. Today, every nation wants to be fully digitalized that will empower society in a better
manner. The 'Digital India' programme, an initiative of honourable Prime Minister Mr.
NarendraModi, will emerge new progressions in every sector and generates innovative endeavours
for genet. The motive behind the concept is to build participative, transparent and responsive
system. All educational institutions and government services will soon be able to provide I-ways
round the clock. Digital India will provide all services electronically and promote digital literacy.
Digital Technologies which includes the concept of cloud computing and mobile applications have
emerged as the catalysts for express economic growth and citizen empowerment. Companies all
over the world desire to invest in Digital India- the 21st century India, as a growth opportunity.
Hence, an attempt has been made in this paper to understand Digital India – as a campaign where
technologies and connectivity will come together to make an impact on all aspects of governance
and improve the quality of life of citizens. Global investors like SundarPichai, SatyaNadella, Elon
Musk have supported Modi's Digital India initiative.
Review of Literature
Rani Suman (2016) .Digital India: Unleashing Prosperity. Indian Journal of Applied Research,
volume-6, Issue 4, pp187-189
Midha Rahul (2016). Digital India: Barriers and Remedies. International Conference on Recent
Innovations in Sciences, Management, Education and Technology. Retrieved from http://
data.Conference world .in/ICISMET/P256-261.

Vol. 5 Special Issue 3 August 2017 ISSN: 2320-4168
156 Shanlax International Journal of Commerce
Gupta Neeru and AroraKirandeep (2015). Digital India: A Roadmap for the development of
Rural India. International Journal of Business Management ,vol(2)2, pp1333-1342. Digital India
Programme: Importance and Impact .
Prof. Singh began with the basic overview of what Digital India entails and led a discussion of
conceptual structure of the program and examined the impact of “Digital India” initiative on the
technological sector of India. He concluded that this initiative has to be supplemented with
amendments in labor laws of India to make it a successful campaign.
Objective of the Study
1. To study the concept of digital India programme.
2. To find out the importance of this programme.
3. To find opportunities of Digital India.
4. To find out the challenges faced in implementation of this programme.
5. To find out practical solutions and innovative ideas to accomplish the digital India
Methodology:
The present research work is of Digital India which is based on exploratory and descriptive
research design.
Sample Design
Universe: As the focus of the study revolves around the students of the Tirunelveli City, so the
Universe for the same would be students studying in the colleges (both government and private)
and universities in the City of Tirunelveli.
Sample Unit: The sample unit will be 2 colleges (both government and private) and
universities. The selection of these colleges/Universities is based on a pilot survey which revealed
that the colleges and Universities in the city would be appropriate for the study to be conducted.
Sample Size: This research study will be based on the views of 50 students studying in the
colleges (both government and private) and universities in the City of Tirunelveli.
Sampling Type: The sample for the research would be collected through non-probabilistic
sampling, precisely through convenient sampling method.
Data Collection: The data for the study would be collected from the following sources:
1. Primary Source: As it is known that primary data is the first hand information that is collected
in order to make the study complete. Thus, the primary data for this research study will be
collected through a Structured Questionnaire to be filled by the college/university students and
observation.
2. Secondary Source: It will be collected through books, Journals and articles.
Analytical and Statistical Tools: The data so collected with the help of the questionnaire will
be tested with the help of percentage, Chi-Square test Mean score and Standard deviation MS-Excel,
Averages, pie charts and graphs. Selection of the type of tests will depend on the type of data that
would be collected through the questionnaire.
Digital India
‘Digital India’ is a central programme to make India ready for a knowledge-based future Digital
India is an umbrella programme that covers multiple Government Ministries and Departments.
It weaves together a large number of ideas and thoughts into a single, comprehensive vision so that
each of them can be implemented as part of a larger goal. Each individual element stands on its own,
but is also part of the larger picture. Digital India is to be implemented by the entire Government
with overall coordination being done by the Department of Electronics and Information Technology

International Conference on INDIA 2030
157 Manonmaniam Sundaranar University, Tirunelveli
(DeitY). Digital India aims to provide the much needed thrust to the nine pillars of growth areas,
namely Broadband Highways, Universal Access to Mobile Connectivity, Public Internet Access
Programme, e-Governance: Reforming Government through Technology, e-Kranti - Electronic
Delivery of Services, Information for All, Electronics Manufacturing, IT for Jobs and Early Harvest
Programmes. Each of these areas is a complex programme in itself and cuts across multiple
Ministries and Departments.
Vision Areas of Digital India
The Digital India programme is centered on three key vision areas:
1. Digital Infrastructure as a Utility to Every Citizen: This includes To provide high speed Internet
connectivity as a core utility for delivery of services to citizens. To provide digital identity that is
unique, lifelong, online and authenticable to every citizen. Providing mobile phone and bank
account enabling citizen participation in digital and financial space.Easy access to a Common
Service Centre. Shareable private space on a public cloud for every citizen
2. Governance and Services on Demand Seamless integration across departments or jurisdictions
Ensuring availability of services in real-time from online & mobile platforms To make all citizen
entitlements portable and available on the cloud To digitally transformed services for
improving ease of doing business Leveraging Geospatial Information Systems (GIS) for decision
support systems & development
3. Digital Empowerment of Citizens to empower citizen through universal digital literacy. To
provide universal accessible digital resource.To make available digital resources / services in
Indian languages.To provide collaborative digital platforms for participative governance.
Citizens not required to physically submit Govt. documents / certificates.
Nine Pillars of Digital India Programme
Under Digital India programme,
9 key initiatives are in progress,
which are as follows 1.Broadband
Highways The aim is to cover
250000 village Panchayats under
National Optical Fibre Network
(NOFN) by December 2016.
Nationwide internet infrastructure
(NII) would integrate the network
and cloud infrastructure in the
country to provide high speed
connectivity and cloud platform to
various government departments
up to the panchayat level.
2. Universal Access to Mobile
Connectivity The aim is to increase
network penetration and to provide mobile connectivity to 44000 villages by 2018 with investment
of RS 16000.
3. Public Internet Access Programme One Common Service Centre(CSC) would be provided
to each gram panchayat and 150,000 Post Offices are proposed to be converted into multi service
centers.

Vol. 5 Special Issue 3 August 2017 ISSN: 2320-4168
158 Shanlax International Journal of Commerce
4. E-Governance IT would be used to make the delivery of government services more
effectively. There would be integration of services and platform-UIDAI, Payment Gateway, Mobile
Seva platform, Public redressal etc., through IT. All information would be available in electronic
form.
5. E-Kranti the aim is electronic delivery of services to people be it education, health, financial
inclusion or justice.
6. Information for AllMyGov.in is a website launched by the government to facilitate a 2-way
communication between citizens and the government. It is a medium to exchange ideas or
suggestion with government. The citizen would have open access to information through open data
platform.
7. Electronics manufacturing the government is focusing on zero imports of electronics
by2020 through local manufacturing of items such as smart energy meters, micro ATMs, mobile,
consumer and medical electronics. Government is also taking several 64 | P a g e steps to promote
manufacturing and investment in electronics sector by providing clarity on taxation, incentives skill
development etc.
8. IT for Jobs the aim is to train 10 million people in towns and villages for IT sector jobs in five
years. It also aims to provide training to three lakh service delivery agents as part of skill
development to run viable businesses delivering IT services. It also focuses on training of five lakh
Rural Workforce on Telecom and Telecom related services and setting up of BPOs in each North-
eastern state.
9. Early Harvesting Programmes Government plans to installed Wi-Fi facilities in all universities
across the country. All books will be converted into e books. Email will be made the primary mode
of communication within government . Biometric Attendance System will be installed in all central
government offices where recording of attendance will be made online.standardised government
Email design,public Wi-Fi hotspot, SMS based weather information, disaster alerts,National portal
for lost & found children.
Challenges of Digital India
Lack of co-ordinates among departments
It is very high project which including many departments. So a strong and timely support is
most important for the timely completion of the projects
High cost of implementation: A very high amount is required to implement the all project of Dl
plan.app Rs1.11 Trillion.
Infrastructure:
National project is planning to build a high speed broadband highway but still we need other
supportive infrastructure such as robust and large data centre for managing a large data of entire
country.
Time overrun
Projects have been delayed several times and suffering two years. It also delayed other projects.
Timely completion of the projects. Private company will play a crucial role its success.
Participation of private players:
So many regularities check long and delayed projects breaking entering private players in
digital India process .private companies will play a crucial role on its success.
Analysis and Interpretation of the Study
Demographic Profile of the Sample:
Survey was conducted in the city of Tirunelveli. Sample of 50 respondents was selected for survey. The questionnaire included students as a classification of their demographic factors such as

International Conference on INDIA 2030
159 Manonmaniam Sundaranar University, Tirunelveli
gender, age & education. During data collection phase, due care was taken in order to make sure that the given questionnaire is completely filled by the respondents.
Understand the reasons for increasing popularity
of digital India
Table 2- Seeking Information from various sources
Seek of Information
Number of
Respondents % Mean
Standard Deviation
Multiple Source 45 90%
1.0500
0.2185 Single Source 5 10%
TOTAL 50 100%
As seen in table no.2, Out of 50 respondents-45
(90%) respondents seeks information from multiple
sources using the digital India and rest 5 (10%)
respondents rely on one source using the digital India.
Sources of Information collect Table 3- Seeking Information from
various sources As seen in table no.3, Out of
50 respondents-15 (30%) respondents seeks
information from traditional sources of
information like Government office, and rest
35(70%) respondents rely on digital source
like online and E-Governance based information collected.
The Awareness about the various tools of Digital India
Table 4- Awareness about the various tools of digital India
As seen in the table above, it was been asked from the students that whether or not they know about the various tools of digital India and it was discovered that maximum students know about Universal access to mobile connectivity followed by Electronic manufacturer and Broadband Highways and so on.
Relationship between Opportunities and Challenges
Particular Opportunities Challenges
Chi-Square 12.000 50.440
df 3 3
Asymp. Sig. .007 .000
0 cells (.0%) have expected frequencies less than 5. The minimum expected cell frequency is 50.0.
Source: Primary Data
H0: there is no significant relationship between Challenges and program of Digital India.
Details Number of
respondents %
GENDER
MALE 20 40%
FEMALE 30 60%
EDUCATION
UNDERGRADUATI
ON
10 20%
POST-
GRADUATION
35 70%
M-PHIL 5 10%
AGE
18-20 35 70%
20-22 10 20%
22&ABOVE 5 10%
TOTAL 50 100%
Sources of
Information
Number of
Respondents % Mean
Standard
Deviation
Traditional 15 30%
1.3950
0.4901 Digital 35 70%
Total 50 100%
Tools Number of Respondents Mean
Score Yes No Can’t Say Total Frequency % Frequency % Frequency % Broadband Highways 37 74 13 26 0 0 50 1.542 Universal Access to Mobile Connectivity
45 90 3 6 2 4 50 1.678
IT for Jobs 33 66 10 20 7 14 50 1.478 Electronics Manufacturing 38 76 12 24 0 0 50 1.563 Information for AllMyGov.in 30 60 18 36 2 4 50 1.456 Early Harvesting Programmes 37 74 10 20 3 6 50 1.542

Vol. 5 Special Issue 3 August 2017 ISSN: 2320-4168
160 Shanlax International Journal of Commerce
H1: there is no significant relationship between Challenges andprogram of Digital India.
The above table shows output of chi-square value, degrees of freedom and significance. It is found
that p value(Asymp. sig) is less than 0.05, thus the null hypothesis is rejected thus it is concluded
that there is no significant relationship betweenChallenges and program of Digital India.
Suggestion
Digital India campaign can’t be successful on its own. Policy changes are needed to make digital
India a reality. Few of the suggestions are –
1. Digital literacy is first step in empowering citizens. People should know how to secure their
online data.
2. To make this programme successful, a massive awareness programme has to be conducted.
There is pressing need to educate and inform the citizens, especially in rural and remote areas,
about the benefits of internet services to increase the growth of internet usage.
3. Digital divide needs to be addressed.
4. Manufacturing content is not government’s strength. This mission needs content and service
partnerships with telecom companies and other firms.
1. 5 .PPP models must be explored for sustainable development of digital infrastructure.
5. Private sector should be encouraged for development of last mile infrastructure in rural and
remote areas. To encourage private sector, there must be favorable taxation policies ,quicker
clearance of projects.
6. The success of digital India project depends upon maximum connectivity with minimum cyber
security risks. For this we need a strong anti-cybercrime team which maintains the database
and protects it round the clock.
7. To improve skill in cyber security, we need to introduce cyber security course at graduate level
and encourage international certification bodies to introduce various skill based cyber security
courses.
8. There is need for effective participation of various departments and demanding commitment
and efforts. Various policies in different areas should support this goal.
9. For successful implementation, there must be amendments in various legislations that have for
long hindered the growth of technology in India.
Conclusion
The vision of digital India is grand. It is a huge step towards building a truly empowered nation.
If successful, it transforms citizen access to multimedia information, content and services. However
the goal is still far away since most of the nine pillars of digital India mission are facing serious
challenges in implementation. It is imperative that focused persistent attention must be given to
each and every pillar so that this programme does not end up in failure. In fact we all should be
mentally prepared for the change and be ready to face the challenges in implementing this policy,
only then it would be possible to make this vision a reality.There are two key enablers that make
the digital literacy mission an achievable one. The Common Service Centres (CSCs) set up in over
100,000 locations by the government may have reported only partial success, but enriching them
with a curriculum and methodology to give every interested citizen the skills to access and
disseminate information can be the first building block. With the planned doubling of the CSCs and
the opportunity to layer on skills programs in a host of sectors where qualification packs are
already being created in the framework outlined by the NSDC, the same digital infrastructure can
also be used to impart job skills.The second enabler is the availability of a few hundred crores from
the CSR funds that will be made available as companies scramble to meet the ‘2% of profits’

International Conference on INDIA 2030
161 Manonmaniam Sundaranar University, Tirunelveli
guideline embedded in the new companies act. Participating in a collaborative mission in both
urban and rural parts of India and setting up independent NDLM centers or enabling schools,
libraries, post offices, CSCs or village panchayats to be digitally enabled is a charter that all IT
companies would be well served in taking up as part of their CSR portfolio. With companies like
Cognizant, Cyient, Zensar and others already lining up to contribute and Nasscom Foundation
playing the lead, there is a lot we can do to make Digital India happen.
Reference
1. www.mygov.in
2. www.pmindia.gov.in
3. www.digitalindia.com
4. www.makeinindia.com
5. A report on power to empower by department of electronics& information technology (DeitY)
ministry of communication and information technology(GOI).

Vol. 5 Special Issue 3 August 2017 ISSN: 2320-4168
162 Shanlax International Journal of Commerce
AN ECONOMETRIC ANALYSIS OF IMPACT OF FOREIGN DIRECT INVESTMENT
AND FOREIGN INSTITUTIONAL INVESTMENT IN INDIAN ECONOMY
Dr. S. Henry Pandian
Associate Professor, Post-Graduate Department and Research Center in Economics,
Pope’s College (Autonomous), Sawyerpuram Thoothukudi District
V. Arockia Amuthan
Assistant Professor, Post-Graduate Department and Research Center in Economics,
Pope’s College (Autonomous), Sawyerpuram, Thoothukudi District
Abstract Recent development in the global market is indicative of the rapidly growing international business. The beginning of the 21st century has already marked a tremendous growth of international investments, trade and financial transactions alone with the integration and openness of international markets. This study chosen to objectives of to analyse country and sector wise Foreign Direct Investment flows in India; to examine trends of Foreign Direct Investment and Foreign Institutional Investment in India during 1991 to 2016; and to find out relationship between Gross Domestic Product, FDI, FII flows and Employment in India. This study makes use of secondary data relating to FDI and FII flows, Gross Domestic Product and Employment creations in India during 1991 to 2016 from Budgetary Documents of India, Handbook of Statistic on Indian Economy, Tamil Nadu Economic Appraisal and Economic Survey of India. Time-series were used to understand the divergence in various levels of growth of foreign investment in India. Trend analysis used to estimate to the simple and compound growth rate. Various functional forms of Linear Regression Model were used to estimate the cause and effect relationship between the dependent and independent variables. Primarily observed that the rate of growth of employment in India has been positively and significantly influenced by the FDI inflow. But the rate of change in employment is less in second generation period compare to the first generation period. FDI is unavoidable in the context of Indian economy. Keywords : Investment, Service Sector, Job Creation, Economy. Introduction
The wave of liberalization and globalization sweeping across the world has opened many
national markets for international business. Global private investment, in most part, is now made by
multinational corporations (MNCs) also referred to as Transnational Corporations (TNCs). Clearly,
these transnational organizations play a major role in world trade and investments because of their
demonstrated management skills, technology, financial resources and related advantages. Recent
development in the global market is indicative of the rapidly growing international business. The
beginning of the 21st century has already marked a tremendous growth of international
investments, trade and financial transactions alone with the integration and openness of
international markets. Foreign investment is a subject of topical interest. Countries of the world,
particularly developing economies, are vying with each other to attract foreign capital to boost their
domestic rates of investment and also to acquire new technology and managerial skills. Intense
competition is taking place among the fund-starved less developed countries to lure foreign
investors by offering repatriation facilities, tax concessions and other incentives. However, foreign
investment is not an unmixed blessing. Governments in developing countries have to be very
careful while deciding the magnitude, pattern and conditions of private foreign investment.
Performance of Foreign Direct Investment in India
India is the second most populous country and the largest democracy in the world. The far
reaching and sweeping economic reform undertaken since 1991 have unleashed the enormous
growth potential of the economy. There has been a rapid, yet calibrated, move towards deregulation

International Conference on INDIA 2030
163 Manonmaniam Sundaranar University, Tirunelveli
and liberalization, which has resulted in India becoming a favorite destination for foreign
investment. The mood is upbeat and the signals strong. Undoubtedly, India has emerged as one of
the most vibrant and dynamic is developing economies of the world.
India as an Investment Destination
FDI is seen as means to supplement domestic investment for achieving a higher level of
economic growth and development. FDI benefits domestic industry as well as the Indian consumers
by providing opportunities for technological upgradation, access to global managerial skills and
practices, optimal utilization of human and natural resources, opening up export markets, providing
backward and forward linkages and access to international quality goods and services. In view of
the foregoing advantages, the FDI policy has been constantly reviewed and necessary steps have
been taken to make India a most favorable destination for FDI.
FDI in Tamil Nadu
Chennai attracted 338 foreign investment projects creating 1,08,708 employments during
2012-2016. It concentrates on the automotive sector, especially in automobile and railway coach
manufacturing and design development and testing. Government of Tamil Nadu policies continues
to attract these investments.
Objectives of the Study
1. To analyse country and sector wise Foreign Direct Investment flows in India.
2. To examine trends of Foreign Direct Investment and Foreign Institutional Investment in India
during 1991 to 2016.
3. To find out relationship between Gross Domestic Product, FDI, FII flows and Employment in
India.
Sources of Data
This study makes use of secondary data relating to FDI and FII flows, Gross Domestic Product
and Employment creations in India during 1991 to 2016 from Budgetary Documents of India,
Handbook of Statistic on Indian Economy, Tamil Nadu Economic Appraisal and Economic Survey of
India.
Statistical tools used
Time-series were used to understand the divergence in various levels of growth of foreign
investment in India. Trend analysis used to estimate to the simple and compound growth rate.
Various functional forms of Linear Regression Model were used to estimate the cause and effect
relationship between the dependent and independent variables.
Foreign Investment Trends in India
India is a strategic location with access to a vast domestic and South Asian market, its share in
world’s total flow of direct investment hovers around 2 per cent. India might remain high in the
rankings as a favored economy for FDI by multinational corporations, but it has been bypassed in
favour of more attractive destinations like China and neighbouring countries in South East Asia.
China remains on top as an FDI destination attracting more than half of the total FDI flows to
developing Asian Economies.
Table – 1 Trends of foreign Investment Flows into India 1990-91 to 2015-16
Year
FDI FII Total (FDI+FII) Employ-ment (in
million) GDP (Rs. in
Billion) Rs. in Crore
US $ Million
Rs. in Crore
US $ Million
Rs. in Crore
US $ Million
1990-91 174 97 11 6 185 103 27.06 5318.13
1991-92 316 129 10 4 326 133 27.18 6135.28
1992-93 965 315 748 244 1713 559 27.38 7037.23
1993-94 1838 586 11188 3567 13025 4153 27.53 8179.61
1994-95 4126 1314 12007 3824 16133 5138 27.94 9553.85

Vol. 5 Special Issue 3 August 2017 ISSN: 2320-4168
164 Shanlax International Journal of Commerce
1995-96 7172 2144 9192 2748 16364 4892 28.25 11185.86
1996-97 10015 2821 11758 3312 21773 6133 28.17 13017.88
1997-98 13220 3557 6794 1828 20014 5385 28.11 14476.13
1998-99 10358 2462 -257 -61 10101 2401 27.96 16687.39
1999-00 9338 2155 13112 3026 22450 5181 27.79 18582.05
2000-01 18406 4029 12609 2760 31015 6789 27.20 20007.43
2001-02 29235 6130 9639 2021 38874 8151 27.00 21752.60
2002-03 24367 5035 4738 979 29105 6014 26.45 23438.64
2003-04 19860 4322 52279 11377 72139 15699 26.46 26258.19
2004-05 27188 6051 41854 9315 69042 15699 26.96 29714.64
2005-06 39674 8961 55307 12492 94981 21453 27.24 33905.03
2006-07 103367 22826 31713 7003 135080 29829 27.55 39532.76
2007-08 140180 34835 109741 27271 249921 62106 28.18 45820.86
2008-09 173741 37838 -63618 -13815 110123 23983 28.71 53035.67
2009-10 179059 37763 153516 32376 332575 70139 29.00 61089.03
2010-11 138462 30080 143435 31471 281897 61851 27.85 72669.66
2011-12 154816 32957 85126 17171 239942 50128 27.88 83534.95
2012-13 146582 26953 146559 26891 293141 53844 27.95 94610.13
2013-14 163846 28684 168448 27841 299897 54743 28.94 98671.28
2014-15 178569 29846 175248 27978 301874 55697 29.64 98987.39
2015-16 198745 28746 184258 28469 308947 56987 30.89 99845.53
Notes : negative (-) sign indicates outflow. Source:Handbook of statistics on Indian Economy –
2016.
The current scenario calls for further liberalization of norms for investment by present and
prospective foreign entrepreneurs. Attracting foreign capital requires and investor-friendly
environment. It underlines the need for efficient and adequate infrastructural facilities, availability
of skilled and semi-skilled labour force, business-friendly public administration and moderate rates
of taxation. The above table shows that the Foreign Direct Investment was just 97 US$ million in
1991 which has grown up to 2155 US$ million in 2000. It was more than ten times in the year of
2016 (28746 US$ million). Foreign Institutional Investment also correspondingly increases during
this period. It was only 6 US$ million in 1990 went up to 28469 US$ million in the year 2015-16.
The above table shows that most of the variables more in tandem.
Top Investing Countries
In terms of investing countries (table – 2), Mauritius continues to account for the large amount
of FDI inflows which is contributed US$ 63,653 million. Mauritius showed first in FDI investment in
India. Though it is a small country it allows the other countries to open companies in their soil and
these companies are interested to investment in India.
Table – 2: Share of Top 10 Investing Countries in FDI Equity Inflows from 2000-01 to 2015-16
Sl.No. Country Cumulative Inflows
Percentage of Total Inflows Rs. in Crore US $ Million
1 Mauritius 286,856.42 63,653.35 39.25 2 Singapore 76,646.31 16,965.41 10.46 3 Japan 57,332.26 12,209.99 7.53 4 USA 47,189.84 10,424.89 6.43 5 United Kingdom 41,957.55 9,397.08 4.27 6 Netherlands 31,367.51 6,919.11 4.27 7 Cyprus 28,872.79 6,241.24 3.85 8 Germany 20,460.62 4,547.70 2.80 9 France 13,138.98 2,879.40 1.78
10 UAE 10,252.68 2,229.16 1.37 Total FDI Inflows 7,33,707.39 1,62,184.71 100
Source : India FDI Facts Sheet – 2016, Ministry of Commerce and Industry, Government of India.

International Conference on INDIA 2030
165 Manonmaniam Sundaranar University, Tirunelveli
Singapore is at the second position with regard to FDI inflows followed by Japan, US, UK and
Netherlands. Foreign collaborations and FDI inflows received after the announcement of the New
Industrial Policy 1991 show that FDI inflows from Mauritius have raised substantially.
Sectors Attracting Highest FDI Inflows
Since the initiation of the economic liberalization process in 1991, the services sector and
sectors such as telecommunications, housing and real estate, automobiles, chemicals, food
processing, oil and natural gas, petro-chemicals and power have attracted considerable
investments. In the changed investment climate, India offers exciting business opportunities in
virtually every sector of the economy. Services sector and telecommunications are among the
leading sectors attraction FDI.
Table – 3: Sector-wise FDI Inflows from 2000-01 to 2015-16
Sl.No. Sector Cumulative Inflows
Percentage of Total Inflows Rs. in Crore US $ Million
1 Service Sector 1,44,972.77 32,193.42 19.85 2 Telecommunications 57,068.50 12,550.31 7.74 3 Construction Sector 50,867.24 11,157.31 6.88 4 Computer Software & Hardware 49,838.01 11,149.53 6.87 5 Drugs & Pharmaceuticals 42,761.31 9,173.50 5.66 6 Power 33,030.20 7262.01 4.48 7 Automobile Industry 30,129.26 6627.15 4.09 8 Petroleum & Natural Gas 14,611.84 3338.75 2.06 9 Hotel & Tourism 15,006.01 3277.37 2.02
10 Information & broadcasting 13,202.55 2864.81 1.77 11 Agriculture Services 6,912.52 1445.37 0.89
Total FDI Inflows 7,33,707.39 1,62,184.71 100
Source : India FDI Facts Sheet – 2016, Ministry of Commerce and Industry, Government of India.
Trend Analysis
This model is like any other linear regression model in that the parameters α and β are linear.
The only difference is that regressand is the logarithm of Y and the regressor is “time”, we can write
as: Ln Yt = α + βt + Ut
andthe simple growth rate can be estimated by SGR = 𝛽 × 100
and the compound growth rate is CGR= (anti Ln (𝛽 ) - 1) ×100
Table -4: Growth Rate First Decade
(1991 to 2000) Second Term (2001-2016)
Total (1991to 2016)
SGR CGR SGR CGR SGR CGR Foreign Direct Investment (US $ million) 39.9 49.0 21.1 23.4 24.7 28.0 Foreign Institutional Investment (US $ million) 44.4 55.89 17.5 19.12 25.2 28.6 Foreign Direct Investment & Foreign Institutional Investment (US $ million)
41.2 50.1 20.5 22.7 23.7 26.7
Gross Domestic Product _ Factor Cost (Rs. in Billion) 14.2 15.2 13.5 14.4 12.5 13.3
Note : SGR – Simple Growth Rate ; CGR – Compound Growth Rate
The estimated compound growth rate shows that the FDI in current price increased at the rate
of 49 per cent per annum during the first generation reform (1991-2000). But it has come down to
23.4 per cent per annum during the second generation reform period (2001-2016). At the same
time the Foreign Institutional Investment increased at the rate 56 per cent per annum during
1991-2000, which has also come down to 19.12 per cent per annum in the second generation
reform. The GDP of India in current prices has grown at the rate of 15 per cent per annum during
the period 1991-2000. It has come down to 14 per cent per annum in the second generation reform.

Vol. 5 Special Issue 3 August 2017 ISSN: 2320-4168
166 Shanlax International Journal of Commerce
Though FDI and FII had come down by around 25 to 30 per cent in terms of growth between First
and Second generation reform period, the GDP had come down by only one per cent per annum.
This result shows that Indian economy has a strong domestic economic base which may not be
affected much by foreign elements.
Relationship between FDI and Employment
There is argument that the FDI is not increasing the employment potential in India. To rest the
researcher fit the following model.
(Emp)t= β1 + β2 (GDP)t + β\3 (FDI)t + β4 (FII)t + β5 (D)t + β6 (FDI*D)t + β7 (FII*D)t +Ut
Emp. = Employment in the Public and Organised Private Sector (nos. in million)
GDP = Gross Domestic Product at Factor Cost (Rs. in Billion).
FDI = Foreign Direct Investment by Rs. in Crore, FII = Foreign Institutional Investment by Rs. in
Crore.
D = dummy.
FDI*D = Foreign Direct Investment (Rs. in Crore) x Dummy.
FII*D = Foreign Institutional Investment (Rs. in Crore) x Dummy.
Table – 5 Foreign Investment, GDP and Employment in India – Linear Regression Results
Model Unstandardized Coefficients
Standardized Coefficients T Sig R2 F
Β Std.Error Beta (constant) GDP FDI FII D FDI*D FII*D
27.304.151 -1.411E-5 7.476E-5 2.454E-5
-.519 -5.970E-5 -2.356E-5
26137.1 .000 .000 .000 .201 .000 .000
- -.563
7.541 2.093 -.405
-6.198 -2.067
184.29 -2.293 3.827 1.532
-2.585 -3.104 -1.467
.000
.036
.001
.145
.020
.007
.162
0.888 21.049
Dependent Variable:
Emp. = Employment in the Public and Organised Private Sector (nos. in million).
The above regression result shows that out of 6 variables 4 of them significantly influencing the
employment. FDI is positively and significantly influencing the employment but the FII has not been
significantly influencing the employment. The product dummy (FDI*D) shows that the rate of
change in employment due to change FDI in the first generation economic reform period is higher
than the second generation reform period.
Conclusion
The objective of this paper is to estimate the trend of variables related to foreign investment in
India. The results shows that the rate of growth of both FDI and FII has come down in the second
generation period (2001-2016) in compare to the first generation reform period. It is also observed
that the rate of growth of employment in India has been positively and significantly influenced by
the FDI inflow. But the rate of change in employment is less in second generation period compare to
the first generation period. FDI is unavoidable in the context of Indian economy. The expansion of
domestic industrial base and effective regulation helps the growth of Indian economy.
References
1. Damodar N Gujarathi (2014), Basic Econometrics, McGraw Hill Education (India) Pvt. Ltd., New
Delhi.
2. Government of India (2012), India FDI Facts Sheet,Ministry of Commerce and Industry, New
Delhi.
3. Government of India (2013), Handbook of Statistics on Indian Economy,Reserve Bank of India,
Mumbai.

International Conference on INDIA 2030
167 Manonmaniam Sundaranar University, Tirunelveli
AN ECONOMETRIC ANALYSIS OF VISIONS OF RURAL DEVELOPMENT SCHEMES IN INDIA
Dr. M. Dhinakaran
Assistant Professor, Post-Graduate Department and Research Center in Economics,
Pope’s College (Autonomous), Sawyerpuram, Thoothukudi District
V. Arockia Amuthan
Assistant Professor, Post-Graduate Department and Research Center in Economics,
Pope’s College (Autonomous), Sawyerpuram, Thoothukudi District
Abstract This research study background of the planning process lays great stress on addressing the problem of rural development in all its dimensions. The spectre of rural poverty, infrastructural gaps, unemployment, and provision of basic amenities, low asset base are issues that warrant appropriate interventions. Rural development must be viewed against the fact that more than half of the population in Tamil Nadu (56 per cent) still live in rural areas spreading over 12,618 village panchayats. Hence, this paper examine to relationship between budgetary allocation for rural development and total budgetary expenditure in Government of Tamil Nadu. Secondly, broad view of analyse to the functions of major central and state rural welfare development schemes in Tamil Nadu. This study makes use of secondary data relating to budgetary expenditure on Tamil Nadu, various development schemes related data in Tamil Nadu from Rural Development and Panchayat Raj Reports, Budgetary Documents, Tamil Nadu Development Report and Planning Commission Reports. This present study attempts to contextualize regression work in budgetary expenditure on rural development. The last section concludes the discussion. Keywords : Infrastructure, Budgetary Allocation, Regression, Employment. JEL Classification : C12, C35, H53, I38. Introduction
A district of dichotomy exists between rural and urban areas. The dichotomy finds expression in
terms of social dualism, technological dualism and financial dualism. The governments both at the
centre and the state have been initiating a number of schemes and programmes and redoubling
their efforts to make the rural sector more dynamic, vibrant and resilient. The efforts taken by the
Government paid much dividend in the field of education, health, water supply, rural connectivity,
tele-density, communication network, technology, distribution of banking services, poverty
reduction and employment generation. Although, the rural sector is being revitalized. The idea of
providing urban facilities in rural areas is gaining much currency and momentum. Provision of basic
amenities in rural areas occupies a centre stage in the planning of rural development.
Scope of the Study
The present study attempts to examine the socio-economic impact of the rural welfare schemes in
Tamil Nadu. It examines how far the programmes have helped in raising the income and levels of living
of the rural poor and in enabling them to overcome the poverty line. The study would provide a
framework for drawing suitable guidelines for the empowerment of rural people through various
welfare schemes in Tamil Nadu.
Objectives of the Study
1. To examine relationship between budgetary allocation for rural development and total
budgetary expenditure in Government of Tamil Nadu.
2. To analyse the functions of major central and state rural welfare development schemes in Tamil
Nadu.

Vol. 5 Special Issue 3 August 2017 ISSN: 2320-4168
168 Shanlax International Journal of Commerce
Sources of Data
This study makes use of secondary data relating to budgetary expenditure on Tamil Nadu,
various development schemes related data in Tamil Nadu from Rural Development and Panchayat
Raj Reports, Budgetary Documents, Tamil Nadu Development Report and Planning Commission
Reports.
Statistical tools Used
Frequency tables were used to understand the divergence in various levels of growth of
MGNREGA Scheme Self Help Groups Scheme. Various functional forms of Linear Regression Model
were used to estimate the cause and effect relationship between the dependent and independent
variables.
Infrastructure Development
The village panchayats are vested with powers to develop infrastructural facilities in the
villages to bridge the urban rural divide in respect of standard of living, availability of facilities like
education, health, basic amenities and housing. The target group being the rural poor, efforts is
taken up to get them out of the miasma of poverty by providing all their needs. To improve the
infrastructure development of the villages in the Stat as a whole, Government of India has framed
Central and State schemes such as Mahatma Gandhi National Rural Employment Guarantee Act,
Indira Awaas Youjana, like Swarna Jeyanth Gram Swarazgar Yojana (SGSY) and Anaithu Grama
Marumalarchi Thittam (AGMT), etc.
Public Expenditure on Rural Development
The endeavor of both state and central Governments has been to alleviate poverty and uplift the
poorest of the poor through various programmes o income generation, wage employment and asset
building. The strategies for providing self-employment generation income imparting technology
and skill upgradation constitute the core of the rural development programmes. The state is
providing substantial funds in addition to central allocation to rural areas to carry out rural
development activities.
Table – 1: Budgetary Expenditure on Rural Development (Rs. in lakhs)
Year Rural
Development Total
Expenditure Year
Rural Development
Total Expenditure
2001-02 60851 531890 2006-07 145327 1243926 2002-03 56381 584105 2008-09 178006 1627510 2003-04 84918 708832 2009-10 202935 1783350 2004-05 75091 828584 2010-11 359254 2046477 2005-06 117258 967585 2011-12 300620 2353502
Source : Annual Financial Statement (various reports), Government of Tamil Nadu.
The state budgetary expenditure for rural development for the year 2001-02 constituted Rs.
60,851 lakhs which accounted for 11.44 per cent of the total budgetary allocation. This trend
increased to for the year of 2011-12 in rural development expenditure Rs. 3,00,620 which
contribute for 12.7 per cent of the total budgetary allocation.
Table - 2: Budgetary and Rural Development Expenditure – Linear Regression Results
Model Unstandardized Coefficients Standardized Coefficients
T Sig R2 F Β Std.Error Beta
(constant) Butoexp
-33708.846 .151
26137.1 .019
- .945 -1.290 8.156
0.233 0.001
0.893 66.517
Dependent Variable: Budgetary Rural Development Expenditure (in Rs. Lakhs).
Independent Variable: Butoexp : Budgetary Total expenditure (in Rs. Lakhs).
Yi = β1 + β2 Xi + Ui
RuDe_Exp i = β1 + β2 (Butoexp) + ei

International Conference on INDIA 2030
169 Manonmaniam Sundaranar University, Tirunelveli
RuDe_Exp i = -33708.846 + 0.151(Butoexp) + ei
t (8.156) r2 = 0.89
sig (0.001) F = 66.57
First, let us interpret this regression. As expected, there are no perfect linear relationships
between total budgetary expenditure and rural development expenditure by Government of Tamil
Nadu. If total expenditure went up by additional rupees one lakh in total budgetary expenditure, the
estimated increase in the mean or average rural development expenditure amounts to Rs. 15,000. If
total budgetary expenditure were zero, the average rural development expenditure would be about
Rs. -33708.84 lakhs. Because of zero budgetary expenditure value is out of the range of values,
government are working with many development projects in rural area if budgetary expenditure
goes to zero the rural development works need to additional amount for Rs. 33,708.84 lakhs in
subsequent years. Of course, this mechanical interpretation of the intercept may not make much
economic sense. The value of r2 of 0.89 means that about 89 per cent of the variation in the rural
development expenditure and budgetary expenditure is highly positively correlated.
Review of Centrally Sponsored Schemes
Mahatma Gandhi National Rural Employment Guarantee Scheme
This is one of the flagship programmes of Government of India. The main objective of this
scheme is to enhance the livelihood security in rural areas by providing 100 days of guaranteed
wage employment in a financial year to any rural household whose adult members are willing to do
unskilled manual work. The MGNREGA was launched in Tamil Nadu in February 2nd 2005 as per
provisions of the National Rural Employment Guarantee Act 2005. The scheme had been
implemented in the State in phased manner covering all the 30 districts. The phase – I covers six
district in the state. The phase – II was introduced and implemented covering four districts from 1st
April 2008. In the phase – II, the remaining 20 districts were covered except in the Chennai in the
state.
Table – 3: MGNREGA Funds Released, Expenditure and Mandays Generated
Year Allocation
(Rs. in crores)
Expenditure
(Rs. in crores)
Number of Mandays % of
Achievement Target Achievement
2008-2009 1757.76 1005.15 2152.00 1203.60 55.90
2009-2010 2355.08 1676.37 2391.95 1963.00 82.10
2010-2011 2997.10 2354.56 2895.00 2685.63 92.80
Source: Department of Rural Development and Panchayat Raj (various reports), Chennai
The MGNREGA in Tamil Nadu which is a wage employment programme has been getting
a higher allocation year after year and the expenditure incurred for this scheme was also on
the increase. This scheme is intended to generate employment the target had been fully
achieved during 2012-23. As of March 2012, a total number of 77.47 lakh households were
cumulatively registered and job cards were issued by the village panchayat council’s
concerned. A total number of 49.69 lakh households had received wage employment under
this scheme. Nearly, a sizeable portion of 83 per cent of total employment generated under
MGNEGA was shared by women during 2010-11.
Indira Awas Yojana (IAY)
The IAY is a scheme for rural BPL families and has been in operation since May 1985.
Initially the IAY was under the Jawagar Rozgar Yojana (JAY) as a sub scheme and became
independent since 1997-98. The basic objective of the scheme is to help construction of new
dwelling units as well as conversion of unserviceable kutcha houses into pacca/semi pacca

Vol. 5 Special Issue 3 August 2017 ISSN: 2320-4168
170 Shanlax International Journal of Commerce
houses to the marginalized sections of the society who are living below the poverty line by
extending them grants-in-aid. The scheme is funded by the center and state in the ratio of
75:25. This unit cost each house is fixed by the Government of India Rs.33,750 and state
contribute Rs. 11,250. Besides, the Government of Tamil Nadu gives an addition amount of
Rs. 55,000 for cement concrete roofing of the house form 2010-11. Thus, the unit cost of the
house had been increased from Rs. 45,000 to Rs. 1,00,000 and also subsidy of Rs. 2,200 out of
the total sanitation funds provided to enable each beneficiary to construct a toilet in the IAY
house. This scheme had gone a long way in reducing the problem of acute housing shortage
in rural areas.
Swarna Jeyanthi Gram Swarozgar Yojana (SGSY)
This is implemented since April 1999 as a major anti-poverty and self-employment
scheme for the rural poor, by organizing them into Self Help Groups (SHGs), providing them
the skill development training and helping them to get credit linkage with financial
institutions, to make them self-employed and providing infrastructure and marketing
support for the products produced by them. The Government of India and State Government
share the cost in the ratio of 75:25.
The SGSY fund is used to provide subsidy for revolving fund assistance and economic loan
assistance to Self Help Groups. Part of the scheme component is also utilized for formation of
groups and conduct of training for capacity-building and skill upgradation. After the first
grading, the SHGs are provided with a revolving fund of Rs. 10,000 for first linkage, Rs.
1,00,000 for second linkage and Rs. 1,50,000 for third and subsequent linkages; after the
second grading, the successful SHGs are provided with economic loan assistance.
Table – 4: Year- wise Allotment under SGSY in Government of Tamil Nadu
Source: Rural Development & Panchayat Raj
Department Report, 2011.
In 2010-11, a sum of Rs. 148.04 cores was allocated
for the implementation of this scheme with a credit
target of Rs. 243.936 crores. A major portion of the
scheme component was utilized for the disbursement of
the subsidy component of revolving fund to the eligible
SHGs formed under Mahalir Thittam. Encouragement
was provided for the marketing of products produced
by SHGs. There were 5.35 lakh SHGs with 82.84 lakh members having a total savings of Rs. 3,225
crores in Tamil Nadu. They obtained Rs. 15,015 crores of assistance under Mahalir Thittam.
Pradham Mantri Garam Sadak Yojana (PMGSY) – Rural Road Connectivity
This was launched in 2000 to provide all weather access to unconnected habitations. PMGSY is
a centrally sponsored scheme. The objective programmes are to provide round the year
connectivity by all weather roads with necessary culverts and cross drainage structures. In the year
of 2001 to 2008 for 4,949 roads had been taken up for a length of 9,984.32 kilometer at a cost of Rs.
2,204 crores. Out of this 4801 works had been completed. The remaining works would compete
shortly in various villages around Tamil Nadu.
Year Financial
Allocation (Rs. in Crores)
2005-2006 62.56
2006-2007 69.39
2007-2008 105.87
2008-2009 125.16
2009-2010 128.14
2010-2011 148.04
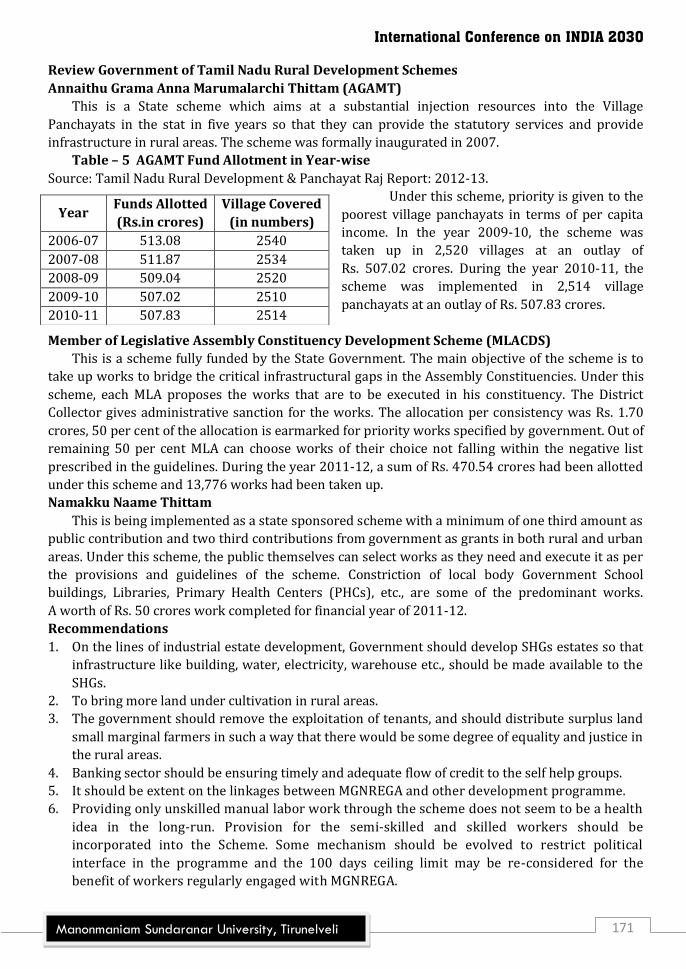
International Conference on INDIA 2030
171 Manonmaniam Sundaranar University, Tirunelveli
Review Government of Tamil Nadu Rural Development Schemes
Annaithu Grama Anna Marumalarchi Thittam (AGAMT)
This is a State scheme which aims at a substantial injection resources into the Village
Panchayats in the stat in five years so that they can provide the statutory services and provide
infrastructure in rural areas. The scheme was formally inaugurated in 2007.
Table – 5 AGAMT Fund Allotment in Year-wise
Source: Tamil Nadu Rural Development & Panchayat Raj Report: 2012-13.
Under this scheme, priority is given to the
poorest village panchayats in terms of per capita
income. In the year 2009-10, the scheme was
taken up in 2,520 villages at an outlay of
Rs. 507.02 crores. During the year 2010-11, the
scheme was implemented in 2,514 village
panchayats at an outlay of Rs. 507.83 crores.
Member of Legislative Assembly Constituency Development Scheme (MLACDS)
This is a scheme fully funded by the State Government. The main objective of the scheme is to
take up works to bridge the critical infrastructural gaps in the Assembly Constituencies. Under this
scheme, each MLA proposes the works that are to be executed in his constituency. The District
Collector gives administrative sanction for the works. The allocation per consistency was Rs. 1.70
crores, 50 per cent of the allocation is earmarked for priority works specified by government. Out of
remaining 50 per cent MLA can choose works of their choice not falling within the negative list
prescribed in the guidelines. During the year 2011-12, a sum of Rs. 470.54 crores had been allotted
under this scheme and 13,776 works had been taken up.
Namakku Naame Thittam
This is being implemented as a state sponsored scheme with a minimum of one third amount as
public contribution and two third contributions from government as grants in both rural and urban
areas. Under this scheme, the public themselves can select works as they need and execute it as per
the provisions and guidelines of the scheme. Constriction of local body Government School
buildings, Libraries, Primary Health Centers (PHCs), etc., are some of the predominant works.
A worth of Rs. 50 crores work completed for financial year of 2011-12.
Recommendations
1. On the lines of industrial estate development, Government should develop SHGs estates so that
infrastructure like building, water, electricity, warehouse etc., should be made available to the
SHGs.
2. To bring more land under cultivation in rural areas.
3. The government should remove the exploitation of tenants, and should distribute surplus land
small marginal farmers in such a way that there would be some degree of equality and justice in
the rural areas.
4. Banking sector should be ensuring timely and adequate flow of credit to the self help groups.
5. It should be extent on the linkages between MGNREGA and other development programme.
6. Providing only unskilled manual labor work through the scheme does not seem to be a health
idea in the long-run. Provision for the semi-skilled and skilled workers should be
incorporated into the Scheme. Some mechanism should be evolved to restrict political
interface in the programme and the 100 days ceiling limit may be re-considered for the
benefit of workers regularly engaged with MGNREGA.
Year Funds Allotted
(Rs.in crores)
Village Covered
(in numbers)
2006-07 513.08 2540
2007-08 511.87 2534
2008-09 509.04 2520
2009-10 507.02 2510
2010-11 507.83 2514

Vol. 5 Special Issue 3 August 2017 ISSN: 2320-4168
172 Shanlax International Journal of Commerce
Conclusion
The health of the whole economy depends on the rural and urban sectors. Going by the socio
economic indicators, urban sector is well placed as compared to rural sector. Proactive strategy
includes convergence and synergy in programme implementation through dovetailing of
programmes, pumping of sizeable resources into the rural sector by the Government, public private
sector partnership and involvement of the people in programme implementation, honouring of the
salient features of the 73rd constitutional amendment in letter and spirit, tackling of waste lands
which is heart of the ecosystem for productive farming, establishment of knowledge centers for the
villages and rural connectivity, building up of sound social and economic infrastructure, changing of
the negative mindset of the people, translation of the PURA into practice, etc., Every village has to
possess knowledge centre. This will ensure connectivity, the key to empowering rural India.
Horizontal connectivity is needed between villages to harness and share local resources and best
practices. Vertical connectivity is indispensable at the administrative level. Links are to be created
between villages and the information and communication technology is to be pervasive.
References
1. Abraham, Vinoj (2009), ‘Employment Growth in Rural India: Distress Driven?’, Economic and
Political Weekly, Vol. 44, No. 16.
2. Amartya Sen (1999), Development and Freedom, Oxford University Press, New York.
3. Arockia Amuthan, Muthusubramanian (2014), Women Empowerment through Self-help Groups
in Tamil Nadu, Dr. Jeyaseelan (Edited), ‘Women in Society’, APH Publishing Corporation, New
Delhi.

International Conference on INDIA 2030
173 Manonmaniam Sundaranar University, Tirunelveli
ROLE OF DISTRICT INDUSTRIES CENTRE IN ENTREPRENEURSHIP DEVELOPMENT
IN KANYAKUMARI DISTRICT
F.Eframe Sophia Selvam
Assistant Professor, Department of Commerce, St. John’s College of Arts and Science, Ammandivilai
Dr.T.M. Padmanabhan
Associate Professor, PG Department of Commerce, S.T. Hindu College, Nagercoil
Abstract The state government introduced District Industries Centre (DIC) in Kanyakumari District at Konam, Nagercoil from 1st August 1978, the DIC serves as nucleus for providing the support and assistance required by small scale, rural and cottage industries. Powers of the Directorate of Industries and Commerce have been delegated to District Industries Centre, Konam, Nagercoil and the field officers of the Department. In this paper the researcher has made an attempt to study the concept of DIC, Role of District Industries Centre in Entrepreneurship Development in Kanyakumari District and has given some suggestions. Introduction
The District Industries Centres (DIC) programme was started in 1978 with a view to providing
integrated administrative framework at the district level for promotion of small scale industries in
rural areas. The DIC are envisaged as a single window interacting agency at the district level
providing service and support to small entrepreneurs under a single roof. DIC are the implementing
arm of the central and state governments of the various schemes and programmes.
Objectives
The followings are the objectives of this paper
1. To study the concept of DIC.
2. To analyse the Role of DIC in Entrepreneurship Development in Kanyakumari District.
3. To give some suggestions.
Methodology
The present study needed both primary data and secondary data. Primary data means the data
collected originally, especially for the study. The researcher collected it through the questionnaire.
The secondary data is the data collected by someone else used for the study, Likewise the
researcher used secondary data collected from the reports, pamphlets of the DIC, Kanyakumari
district and also through different articles, journals, magazines and websites. The list of
entrepreneurs along with their basic profile was collected from District Industries centre, Nagercoil
and it was classified according to the year and type of organization. The total number of
entrepreneurs according to the details obtained from the District Industries centre was 4967. Out
of the total population of 4967 entrepreneurs from the year 2010 to 14, 3000 are
Industrial/Manufacturing entrepreneurs and 1967 are Trade and Service entrepreneurs. The total
of 497 entrepreneurs from Kanyakumari District is selected as a sample for the purpose of this
study. 300 respondents who are Industrial/Manufacturing entrepreneur and 197 respondents who
are Trade and Service entrepreneur were selected as the total respondent for the purpose of this
study, 10 per cent of the total beneficiaries from each sector were selected by applying simple
random sampling. This study employed a properly structured questionnaire, which was finalized
after a thorough scrutiny of various questions by various experts. The questionnaire used in the

Vol. 5 Special Issue 3 August 2017 ISSN: 2320-4168
174 Shanlax International Journal of Commerce
study includes multiple-choice questions that helped the researcher to obtain the required
qualitative data.
District Industries Centres
Structure of DIC in Kanyakumari District
At the district level, each DIC is headed by the general manager. In Kanyakumari District the
general manager is Mr. K. Marimuthu. He may conduct meetings, interviews, investigations and the
like. Under him there are 4 managers for project, credit, economic investigation and village
industries administration. The managers for village industries administration and projects are at
the rank of Assistant Directors. The managers for credit and economic investigation are at the rank
of Deputy Directors.
Functions of DIC
1. Identification of projects based on the material resources available in the district.
2. Identification of entrepreneurs by conducting motivation campaigns, seminars and awareness
camps.
3. Issue of SSI Registration Certificates both provisional / permanent.
4. Identification of rural artisans and issuing them cottage industry certificates and handicraft
certificates.
5. Assisting the entrepreneurs in getting clearance certificate from statutory bodies through single
window committee meetings.
6. Assisting them in getting the required financial assistance for their projects.
7. Rendering assistance to them in getting power connection quickly.
8. Assisting the new SSI units in getting State investment subsidy/ Special capital subsidy, power
tariff subsidy, generator subsidy etc.
9. Rendering assistance to SSI units in getting raw materials and machineries imported from
abroad.
10. Conduct of entrepreneurship development programme among women entrepreneurs.
11. Assisting the educated unemployed youth in getting the required loan from banks under PMRY
scheme for starting new SSI units, service oriented units and small business.
12. Assisting the sick SSI units for revival under sick SSI units rehabilitation programme.
13. Rendering assistance to the SSI units in getting scarce raw materials at reasonable prices.
14. Rendering assistance to the SSI units in promoting their export potentials.
Role of DIC
This paper mainly focuses on the role of DIC in entrepreneurship development. For this purpose
the following question is posed.
Is there a relationship between variables contributing to the role of DIC and the categorical
variables of the selected entrepreneurs in Kanyakumari district? In order to answer this
research question, 11 hypotheses were formulated.
H1.There is no significant difference in the opinion on the satisfaction with respect to the quality of
support of DICs in formation and instigation of entrepreneurship.
H2.There is no significant difference in the opinion on satisfaction with respect to the quality of
training provided by DICs.
H3.There is no significant difference in the opinion on satisfaction with respect to the quality of
marketing support provided by DICs.

International Conference on INDIA 2030
175 Manonmaniam Sundaranar University, Tirunelveli
H4.There is no significant difference in the opinion on satisfaction with respect to the support
provided by DICs in financing ventures.
H5.There is no significant difference in the opinion on satisfaction with respect to the adequacy of
financing.
H6.There is no significant difference in the opinion on satisfaction with respect to the appreciation
of efforts.
H7.There is no significant difference in the opinion on satisfaction with respect to the support in
fetching inputs and raw materials.
H8.There is no significant difference in the opinion on satisfaction with respect to the access to
information and services.
H9.There is no significant difference in the opinion on satisfaction with respect to the quality of
dealings of DIC officials.
H10.There is no significant difference in the opinion on satisfaction with respect to the quality of
dealings of bank officials.
H11.There is no significant difference in the opinion on satisfaction with respect to the rate of
interest charged on loans availed from banks.
Responses by Categorical Variables- An Analysis
Difference of opinion is usually checked to affirm the generalizability of the inferences.
The responses are categorized and analysed with respect to gender, region, age, education level and
marital status of beneficiaries. The overall mean score is 3.95 which show that there is a positive
opinion on the quality of support of DIC in the formation and Instigation of entrepreneurships.
Support of DIC through Training [V2]
While majority (70.22 percent) quote a positive note, a minority (14.29 percent) pose a
negative remark. Meanwhile, 15.49 percent of respondents remained neutral in their opinion.
The Chi Square test produced a p value is less than 0.01 at 4 degrees of freedom. Hence, the Null
Hypothesis [H0] is rejected at 1 percent level of significance and H1 is accepted. It could be inferred
that there is a significant difference among the opinion of the beneficiaries with respect to the
support provided through training. It could also be found that there is no significant difference in
the opinion of beneficiaries.
Responses by Categorical Variables- An Analysis
Difference of opinion is usually checked to affirm the generalisability of the inferences.
The responses are categorised and analysed with respect to gender, region, age, education level and
marital status of beneficiaries. The overall mean score is 3.87 which show that there is a positive
opinion on the quality of training provided by DICs.
Support of DIC in Marketing [V3]
While 45.27 percent quote a positive note, another 26.16 percent pose a negative remark.
Meanwhile, 28.57percent of respondents remained neutral in their opinion. The Pearson Chi Square
test produced a p value is less than 0.01 at 4 degrees of freedom. Hence, the Null Hypothesis [H0] is
rejected at 1 percent level of significance and H1 is accepted. It could be inferred that there is a
significant difference in the opinion on the quality of marketing support among beneficiaries. It
could also be found that there is a significant difference in the opinion of beneficiaries.
Responses by Categorical Variables- An Analysis
Difference of opinion is usually checked to affirm the generalisability of the inferences. The
responses regarding the opinion on the quality of marketing support provided by the DIC are
categorised and analysed with respect to gender, region, age, education level and marital status of

Vol. 5 Special Issue 3 August 2017 ISSN: 2320-4168
176 Shanlax International Journal of Commerce
beneficiaries. The overall mean score is 3.41 which show that there is a positive opinion on the
quality of marketing support provided by DICs.
Support of DIC in Financing the Ventures [V4]
While 69.21 percent quote a positive note, only 9.86 percent pose a negative remark.
Meanwhile, 20.93percent of respondents remained neutral in their opinion. The Pearson Chi Square
test produced a p value is less than 0.01 at 4 degrees of freedom. Hence, the Null Hypothesis [H0] is
rejected at 1 percent level of significance and H1 is accepted. It could be inferred that there is a
significant difference in the opinion on the quality of support in financing of ventures among the
beneficiaries. It could also be found that there is no significant difference in the opinion of
beneficiaries.
Responses by Categorical Variables- An Analysis
Difference of opinion is usually checked to affirm the generalisability of the inferences.
The responses regarding the opinion on the quality of support provided by the DIC in financing
ventures are categorised and analysed with respect to gender, region, age, education level and
marital status of beneficiaries. The overall mean score is 4.38 which show that there is a very high
positive opinion on the quality of support provided by DICs in financing the ventures.
Opinion on Adequacy of Financing [V5]
While 45.27 percent quote a positive note, 34.40 percent pose a negative remark. Meanwhile,
20.33percent of respondents remained neutral in their opinion. The Pearson Chi Square test
produced a p value is less than 0.01 at 4 degrees of freedom. Hence, the Null Hypothesis [H0] is
rejected at 1 percent level of significance and H1 is accepted. It could be inferred that there is a
significant difference in the opinion on the adequacy of financing of ventures among the
beneficiaries. It could also be found that there is a significant difference in the opinion of
beneficiaries.
Responses by Categorical Variables- An Analysis
Difference of opinion is usually checked to affirm the generalisability of the inferences. The
responses regarding the opinion on the adequacy of financing the ventures are categorised and
analysed with respect to gender, region, age, education level and marital status of beneficiaries. The
overall mean score is 3.09 which show that there is a low but positive opinion on the adequacy of
financing the ventures.
Support through Appreciation of Efforts [V6]
While 71.43 percent quote a positive note, only 4.83 percent pose a negative remark.
Meanwhile, 23.74percent of respondents remained neutral in their opinion. The Pearson Chi Square
test produced a p value is less than 0.01 at 4 degrees of freedom. Hence, the Null Hypothesis [H0] is
rejected at 1 percent level of significance and H1 is accepted. It could be inferred that there is a
significant difference in the opinion on the appreciation of efforts among the beneficiaries. It could
also be found that there is a significant difference in the opinion of beneficiaries.
Responses by Categorical Variables- An analysis
Difference of opinion is usually checked to affirm the generalisability of the inferences. The
responses regarding the opinion on the appreciation of efforts are categorised and analysed with
respect to gender, region, age, education level and marital status of beneficiaries. The overall mean
score is 4.01 which show that there is high positive opinion on the appreciation of efforts.
Support in Fetching Inputs and Raw Materials [V7]
While 53.73percent quote a positive note, only 20.72 percent pose a negative remark.
Meanwhile, 25.55 percent of respondents remained neutral in their opinion. The Pearson Chi
Square test produced a p value is less than 0.01 at 4 degrees of freedom. Hence, the Null Hypothesis

International Conference on INDIA 2030
177 Manonmaniam Sundaranar University, Tirunelveli
[H0] is rejected at 1 percent level of significance and H1 is accepted. It could be inferred that there is
a significant difference in the opinion on the support of DICs in fetching inputs and raw materials.
It could also be found that there is a significant difference in the opinion of beneficiaries.
Responses by Categorical Variables- An Analysis
Difference of opinion is usually checked to affirm the generalisability of the inferences.
The responses regarding the opinion on the support of DICs in fetching inputs and raw materials
are categorised and analysed with respect to gender, region, age, education level and marital status
of beneficiaries. The overall mean score is 3.50 which show that there is positive opinion on the
support of DICs in fetching inputs and raw materials.
Support through Access to Information and Services [V8]
While 75.45 percent quote a positive note, only 4.23 percent pose a negative remark.
Meanwhile, 20.32 percent of respondents remained neutral in their opinion. The Pearson Chi
Square test produced a p value is less than 0.01 at 4 degrees of freedom. Hence, the Null Hypothesis
[H0] is rejected at 1 percent level of significance and H1 is accepted. It could be inferred that there is
a significant difference in the opinion on the support of DICs in the access to information and
services. It could also be found that there is a significant difference in the opinion of beneficiaries.
Responses by Categorical Variables- An Analysis
Difference of opinion is usually checked to affirm the generalisability of the inferences.
The responses regarding the opinion on the access to information and services are categorised and
analysed with respect to gender, region, age, education level and marital status of beneficiaries.
The overall mean score is 3.68 which show that there is positive opinion on the support through
access to information and services.
Support through the Dealings of DICs Officials [V9]
While majority (65.39 percent) quote a positive note, a minority (15.09 percent) pose a
negative remark. Meanwhile, 19.52 percent of respondents remained neutral in their opinion.
Pearson’s Chi-Square test produced a p value is less than 0.01 at 4 degrees of freedom. Hence, the
Null Hypothesis [H0] is rejected and H1 is accepted. It could be inferred that there is a significant
difference in the beneficiaries’ opinion on the quality of dealings of DIC officials. It could further be
assessed that there is a significant difference in the opinion of beneficiaries of different NGOs.
Responses by Categorical Variables- An Analysis
Difference of opinion is usually checked to affirm the generalisability of the inferences.
The responses regarding the opinion on the quality of dealings of DIC officials are categorised and
analysed with respect to gender, region, age, education level and marital status of beneficiaries.
The mean score is 3.86 which show that there is a positive opinion on the quality of dealings of DIC
officials.
Support through the Dealings of Bank Officials [V10]
While majority (58.75 percent) quote a positive note, a minority (14.89 percent) pose a
negative remark. Meanwhile, 26.36 percent of respondents remained neutral in their opinion. The
Pearson Chi Square test produced a p value is less than 0.01 at 4 degrees of freedom. Hence, the Null
Hypothesis [H0] is rejected at 1 percent level of significance and H1 is accepted. It could be inferred
that there is a significant difference in the opinion on the quality of dealings of bank officials.
It could further be assessed that there is a significant difference in the opinion of beneficiaries.
Responses by Categorical Variables- an Analysis
Difference of opinion is usually checked to affirm the generalisability of the inferences. The
responses regarding the opinion on the quality of dealings of bank officials are categorised and
analysed with respect to gender, region, age, education level and marital status of beneficiaries. The

Vol. 5 Special Issue 3 August 2017 ISSN: 2320-4168
178 Shanlax International Journal of Commerce
overall mean score is 3.67 which show that there is a positive opinion on the quality of dealings of
bank officials.
Opinion on Percentage of Interest on Loans from Banks through DIC [V11]
While a vast majority (64.79 percent) quote positive note, a minority (10.67 percent) pose a
negative remark. Meanwhile, 24.54 percent of respondents remained neutral in their opinion.
The Chi Square test produced a p value less than 0.01 at 4 degrees of freedom. Hence, the Null
Hypothesis [H0] is rejected at 1 percent level of significance and H1 is accepted. It could be inferred
that there is significant difference in the opinion of the beneficiaries. But comparing the responses
within the samples, it could also be inferred that there is no significant difference among the
opinion of the beneficiaries regarding the rate of interest charged on loans availed from
entrepreneurships.
Responses by Categorical Variables- An Analysis
Difference of opinion is usually checked to affirm the generalisability of the inferences.
The responses regarding the opinions on the rate of interest are categorised and analysed with
respect to gender, region, age, education level and marital status of beneficiaries. The overall mean
score is 3.98 which show that there is a positive opinion on the rate of interest charged on loans
availed from banks through DICs.
Factor Analysis
An attempt has been made to extract specific factors and define the variables which constitute
each factor based on the strength and direction of the factor loading in the role of DIC through
rotated factor analysis. The analysis of 11 roles of DIC through factor analysis revealed that the
identified method falls under four heads. The influence of each role has been analysed through
rotation factor matrix. The suitability of the data for factor analysis was analysed through Kaiser -
Meyer – Olkin(KMO) measure of sampling adequacy and Bartlett’s test of Sphericity. The test
showed the following results. The test resulted in a high value (0.600), which indicates that factor
analysis is considered appropriate for the model.
Bartlett’s test of Sphericity indicates whether the correlation matrix is an identity matrix. Since
the resulting significance level is less than 0.05, it can be calculated that there is significant
relationship among the variables identified and the factor analysis can be suitably employed in the
study. The factor loading of the eleven variables influencing the role of DIC which has greater
impact on Entrepreneurs as analysed through rotated factor matrix.
Rotated Factor Matrix for the Role of DIC
Sl.No Variables Factors
F1 F2 F3 F4 1. Support of DIC’s formation of entrepreneurships .948 .011 .133 -.016 2. Support of DIC’s through training .947 .008 .084 -.004 3. Support of DIC’s in marketing .931 .051 .042 -.007 4. Support of DIC’s in financing the ventures .535 .194 .495 -.040 5. Opinion on adequacy of financing .057 .944 .022 -.090 6. Support through Appreciation of Efforts .048 .867 .034 -.031 7. Support in fetching inputs and raw materials -.148 .798 .255 .064 8. Support through access to information and services .411 .722 -.317 .032 9. Support through the dealings of DICs officials .164 .020 .886 .013 10. Support through the dealings of bank officials .039 -.018 -.217 .795 11. Opinion on percentage of interest on loans from banks through DIC. -.064 .040 .214 .772
Extraction Method: Principal Component Matrix
Rotation Method: Varimax with Kaiser Normalisation a Rotation converged in 4 iterations.

International Conference on INDIA 2030
179 Manonmaniam Sundaranar University, Tirunelveli
The table exhibits the rotated factor loading for the eleven roles of DIC (variables) employed in
the development of entrepreneurship in the study area. It is clear that the eleven variables have
been extracted into four factors. The factors are presented in the following table.
Source: Calculated data.
It is observed from the table that four factors were extracted out of eleven variables. These
factors account for 77.931 percent variation in the data. The “factors during initial stages of
entrepreneurship” includes the variable namely Support of DIC in formation of entrepreneurship,
Support of DIC through training, Support of DIC in marketing and Support of DIC in financing
the ventures. The factor explains higher variation of 32.581 percent in the total variable set which
indicates the factors during initial stages of entrepreneurship has high influence in the role of DIC.
Suggestions
Based on the findings of the study and the personal conceptions the researcher has given the
following suggestions. It provides Suggestions to DIC and the entrepreneurs.
To the DIC
The various formalities and documents to be produced are the great problems regarding
Government institutions. DIC is not an exception to this. All these rules may be little bit
liberalized.
Many entrepreneurs find it very difficult to get bank for the loans. The banks do not easily
accept the guarantee provided by them. Hence the DIC should provide the guarantee for them.
DIC should insist the banks which provides loan to entrepreneurs to allow reasonable
moratorium period.
To the Entrepreneurs
The entrepreneurs should also consider certain points which the DIC officials felt as constraints
against them.
The people of Kanyakumari District are used to feel comfort with a regular monthly income that
too from a government job and they do not prefer to take the risk of starting and continuing a
business. This traditional mind set up is to be changed to improve the interest in
entrepreneurships. Hence the awareness regarding this should be created among the young
generation.
The fruit of self –earning and its sweetness should be kindled in the younger minds.
The entrepreneurs, after getting the loans, must realize their responsibility of repayment. They
must confirm, they remit the installments correctly taking as their unwritten duty.
Sl.No Factor Variables Factor
Loading Communalities
Eigen Values
Percent Variation
Cumulative Percent
Variation
1. Factors during initial stages of entrepreneurship
V1 0.948 0.792
3.584 32.581 32.581 2. V2 0.947 0.904
3. V3 0.931 0.871
4. V4 0.535 0.918 5. Factor during ongoing
process of Entrepreneurship
V5 0.944 0.570
2.553 23.210 55.791 6. V6 0.867 0.895
7. V7 0.798 0.728 8. V8 0.722 0.756
9. Dealings of DIC officials V9 0.886 0.680 1.232 11.196 66.988 10. Dealings of bank officials
and Percentage on Interest loan
V10 0.795 0.648 1.204 10.943 77.931 11. V11 0.772 0.812

Vol. 5 Special Issue 3 August 2017 ISSN: 2320-4168
180 Shanlax International Journal of Commerce
Conclusion
It is concluded that the DIC plays a major role in developing entrepreneurs in Kanyakumari
District. DIC plays a great role in not only starting up new ventures but also it acts as a major
trainer, assistant in all activities of an Entrepreneurship and helps them to sustain as an successful
entrepreneur. Moreover DIC has taken many efforts to convert the mind set up of the district people
from the government job to the entrepreneurship. DIC tries its level best to give more assistance to
the entrepreneurs those who like to start up any business of product or service. One thing is to be
done by the DIC is to give much more publicity to the general public and the legal procedures can be
liberalized. The researcher is damp sure that if the suggestions are followed by the entrepreneurs
and implemented by the DIC, a better improvement of entrepreneurship will be enhanced in the
district in future.
References
1. F.Eframe,T.M.Padmanabhan,”Problems of District Industries Centre (DIC) – Beneficiaries in
Kanyakumari District” Journal of B-Research, Vol.18, P.40-51 Dec 2016.
2. Reddy T.S & P.N Reddy (1980), “SEDME”, Vol. XII, No. 3. September. l980, P.229-235.

International Conference on INDIA 2030
181 Manonmaniam Sundaranar University, Tirunelveli
LEVERAGING VIA CONSUMERS – AN EMERGING TREND TOWARDS INDIA 2030
Dr. J. Mahil Kamalam, MCom., M.B.A., Phd., MPhil., B.Ed., P.G.D.C.P
Department of Commerce, Women’s Christian College, Nagrcoil.
Introduction
The advent of Digital Marketing through E-Commerce in the Global Marketing Scenario has
brought about the necessity for the voice of the consumers to be trumpeted through social
networking. Consumer Sovereignty the buzz word of the day is the sole cause for such a revolution
in Marketing with various emerging trends among which leveraging through consumers is a vital
part. These pixels render the services of retailers and serve as a channel or as an intermediary in
Commerce that is trade and aids to trade.. Giving a practical example: a company specialized in
computer accessories could, instead of simply advertising its products, create a community using
some agency to gather computer users and share tips and best practices. With this, the brand would
be able to oversee the community and send tailored messages to its users based on their interests
and discussions. To be a successful website, there should be some important features and they are
enumerated.
Need for the Study
The present world is a n ever advancing area where marketing emerges through various trends
which are also ever emerging. With the advent of many products and services the trends in
marketing are also ever emerging. The essentials of inducing a consumer to buy a product is very
much essential to pick up a market for a product or service so this can be better done with the voice
of the consumers themselves being Highlighted through various digital tools like webinars, social
networking and other aspects.
Objectives of the Study
1. To delve into the causes of leveraging through consumers in 2030
2. To analyse the various skills of leveraging through consumers in 2030 too.
Tool of Analysis
Percentages and Likert’s Scale are used to analyze the essentials of ”Leveraging through
consumers”.
Essentials of Leveraging Through Consumers
The following are the essentials of Leveraging through the voice of the Consumers themselves
as it instigates the need for substantiating the use of the product or service through the statements
of the consumers themselves specifying the most popular products, sales, and special offers, Calls to
action to push people to purchase, and Displaying all the specials. The various problems faced by
consumers have brought about this need. The Problems such as unfair trade practices, defective
goods or deficiency in services, High prices, False advertising, Duplicate products, Adulterated
goods, harmful goods and services, hoarding and black marketing and non eco – friendly products
and services.
The following table depicts the fact that the factor ‘ to boost sales’ gets the first rank. ‘Ensure
enjoyment through shopping’ gets the second rank. The third rank is obtained by the factor ‘To

Vol. 5 Special Issue 3 August 2017 ISSN: 2320-4168
182 Shanlax International Journal of Commerce
voice the Experience of the consumers’, while the fourth rank is given to the factor ‘To develop
Trust among the consumers’, the fifth rank is received by the factor ‘Ensure satisfaction in the
product or service’ the second last rank or the sixth rank is given to the factor ‘To learn from the
users of the product’ and the last rank is gained by the factor ‘Assurance in Disguise’. The factors
are ranked on the basis of Likert’s scale by giving ranks for the statements as Highly agree (HA)
with five points, Agree (A) with four points, No Comment (NC) with three points, Disagree (DA with
two points and finally Highly Disagree (HGA) with one point
Table 1 Essentials for Liveraging through Consumer Voices in India 2030
Particulars H A A NC DA HDA TOTAL LIKERT
SCALE RANK
To develop Trust among the
consumers
35 46 26 8 5 120
175 184 78 16 5 458 3.82 IV
To voice the Experience of the
consumers
34 57 13 8 8 120 3.84
270 228 39 16 8 461 III
To learn from the users of the
product
32 39 36 5 8 120
160 156 108 10 8 442 3.683 VI
To boost sales 52 37 17 12 2 120
260 148 51 24 2 485 4.04 I
Ensure satisfaction in the product
or service
43 27 32 17 1 120
235 108 96 34 1 485 3.78 V
Ensure Enjoyment Through
Sharing
48 34 28 9 4 120
240 136 75 18 4 473 3.94 II
Assurance In Disguise 39 34 19 21 7 120
195 136 57 42 7 437 3.64 vii
Analyzing advertisement programmes using skill factors assumed to be in2030
Table 2 KMO and bartlett's test
The test of Kaiser Meyer Olkin
shows a measure of .514 and hence
shows a sampling adequacy for the
application of factor analysis.
The results of Principal Component Analysis to extract the number of variables are given in Table 3.
Table 3 Analysis of advertisements via audience using skills in India in 2030
Source: Field Survey
Factors in 2030 Components ADVERTISEMENTS F1 F2 F3 F4 F5 F6 F7 F8
Expenditure is from customer .834 .212 .190 .037 -.078 .058 .023 .180 Political Advertisement too till 2030 .817 .147 .160 .215 .102 .139 .086 .113 Advertisement communicates intended value of message
.789 .071 -.072 .108 -.034 -.182 .086 -.088
Rhetoric statement .743 .369 .347 .081 .099 .108 -.073 -.049 Women is portrayed as a well rounded personality
.676 .151 -.094 .227 .340 .055 -.135 -.191
Kaiser-Meyer-Olkin Measure of Sampling Adequacy. .514
Bartlett's Test of Sphericity
Approx. Chi-Square 763.302
df 561
Sig. .000

International Conference on INDIA 2030
183 Manonmaniam Sundaranar University, Tirunelveli
Understand advertisement bias .655 .044 .068 .131 .205 .165 -.031 .215 Persuasive technique .649 -.012 .366 -.119 -.300 .171 -.129 .166 Coupons provided promotional activity .639 .087 .382 .112 -.050 -.114 -.058 .122 Opinion about product .637 .006 .234 -.052 .528 -.064 .214 -.177 Surrogate advertisement promote injurious health product
.636 .175 .152 .007 .318 .316 -.140 .092
Awareness of national scheme by Government .621 .246 .477 .124 .174 .172 -.062 .040 Put up exaggerated way to buy products .561 -.066 -.054 .187 .203 -.023 .022 -.450 Analyzing the feeling .143 .705 -.107 -.111 .162 -.037 .202 -.151 Feeling toward brand .237 .686 -.160 .113 -.243 .161 -.062 .303 Celebrities endorsement .451 .629 .065 .078 .105 .193 -.084 -.096 Idealized images leads low self esteem -.061 .595 .160 .291 .039 -.023 -.285 -.120 Fear appeal to health and beauty advertisement
.522 .541 .032 .118 .084 .140 -.185 -.091
Children and pet create emotional appeal .452 .507 -.040 .193 -.071 -.160 .342 .201 Meaning of colour .107 .073 .728 .128 .038 .013 .013 -.079 Colour passes right message .384 -.033 .716 -.005 .308 -.073 -.069 -.075 Knowing types of light .203 -.306 .563 -.005 -.074 -.095 .478 .007 Technique of high light -.026 -.141 .453 .050 .343 .264 .122 -.114 Jingle for remembrance .204 .017 .153 .713 -.061 .047 .243 -.141 Cartoon and good feelings .009 .225 .038 .691 -.096 .450 -.025 .231 Statistics and figures for popularity .294 .408 .024 .557 .318 .312 .203 -.016 Knowing camera shot .112 .239 .344 .554 .305 -.134 -.175 -.010 Aesthetic elements and our sense .263 -.044 -.253 .522 .365 .000 -.236 .134 Consumers’ testimony is always right .022 .361 .188 .122 .671 -.043 .133 .048 Commercial religiously accepted principle .342 -.288 .152 .125 .567 .334 .046 .030 Lack of responsibility .235 .156 .191 .156 .060 .726 .027 .003 Commercial exploit society .018 -.001 -.193 -.017 .130 .695 .051 .171 Promote unsafe behaviour among children .037 .000 .145 .083 -.304 .536 .006 -.391 Banned controversial products .061 .077 -.059 -.033 .147 .153 .886 .009 Fear appeal on alcohol and tobacco -.328 -.176 .206 .380 .048 -.088 .591 .009 Buying beyond capacity -.068 .109 .241 -.064 .008 .013 -.029 .656 Unethical ways of material desire .285 -.122 .492 .146 -.085 .155 .009 .532 Goods really not needed .245 .138 .336 -.172 .365 .216 .016 .504
From the table clearly shows that in the first column the variables namely, ‘Expenditure is from
customer’, ‘Political Advertisement’, ‘Advertisement communicate intended value of massage’,
‘Rhetoric Statement’, ‘Women’s portrayal as a well rounded personality’, ‘Understand advertisement
bias’, Persuasive technique’, ‘Coupons provided promotional activity’, ‘Opinion about product’,
‘Surrogate advertisement promote injurious health product’, ‘Awareness of national scheme by
Government’ and ‘Put up exaggerated way to buy products’ have higher loadings of 0.834, 0.817,
0.789, 0.743, 0.676, 0.655, 0.649, 0.639, 0.637, 0.636, 0.621, and 0.561 respectively and it can be
suggested that factor one is the combination of these twelve factors and have the variance of 20.090
per cent and it can be named as ‘Cognitive skills’.
From the second column it can be seen that the variables of ‘Analyzing the feeling’ 0.705, ‘Feeling
toward brand’ 0.686, ‘Celebrities endorsement’ 0.629, ‘Idealized images leads low self esteem’ 0.595,
‘Fear appeal to health and beauty advertisement’ 0.541 and ‘Children and pet create emotional appeal’

Vol. 5 Special Issue 3 August 2017 ISSN: 2320-4168
184 Shanlax International Journal of Commerce
0.507, have higher loadings with a variance of 8.732 and it can be combined and called as ‘Emotional
skills’.
The third column shows that the factors ‘Meaning of colour’ 0.728, ‘Colour pass right message’
0.716, ‘Knowing types of light’ 0.563, have high loadings with a variance of 8.538 and are summated
and named as ‘colour and light appeals’.
The fourth factor namely ‘Jingle for remembrance’ 0.713, ‘Cartoon and good feelings’ 0.691,
‘Statistics and figures for popularity’ 0.557, ‘Knowing camera shot’ 0.554 and ‘Aesthetic elements and
our sense’ 0.522 have high loadings with a variance of 6.779 are combined together to be called as
‘Aesthetic elements’.
From the fifth column it can be seen that the variables of ‘Consumer testimony always right’ 0.671
and ‘Commercial religiously accepted principle’ 0.567 have higher loadings with a variance of 6.441
and it can be combined and called as ‘Ethical appeals’.
The sixth column shows that the factors ‘Lack of responsibility’ 0.726, ‘Commercial exploit society’
0.695, ‘Promote unsafe behaviour among children’ 0.536 have high loadings with a variance of 6.126
and are summated and named as ‘Exploiting aspects’.
In the seventh column only two variables such as ‘Banned controversial products’ 0.886, ‘Fear
appeal on alcohol and tobacco’ 0.591, which have higher loading are included with variance of 5.394
and named as ‘Abandonment’.
In the last column only three variable ‘Buying beyond capacity’ 0.656, ‘Unethical ways of material
desire’ 0.532 and ‘Goods really not needed’ 0.504 with variance of 4.982 are named as ‘Blind
materialism’.
Thus 28 factors are reduced into eight variables and are given different names by using factor
analysis as ‘cognitive skills’, ‘emotional skills’, ‘colour and light appeals’, ‘Aesthetic elements’,
‘Ethical appeal’, ‘Exploiting aspect’, ‘Abandonment’ and ‘Blind materialism’. Thus have been
identified and plays a good role in analyzing advertisement using the skill factors.
Conclusions
From the above study the researcher infers that leveraging through consumers is a modern
term at present and in the opinion of the consumers it seems to be a substantial identity and an
evidence provided by the consumers themselves. This is ‘each for all” and “all for each’ principle
which induces the consumers to buy the product. It is a method of advertisement and testimony by
the consumers. The chances of dodging or cheating or fraudulent or misleading advertisements are
remote and hence it is a bonafide advertisement. It has a positive influence which will have its
influence forever and 2030 is no exception.
References
1. http://tech.co/build-brand-social-community-memeni-2016-02
2. https://www.google.co.in/webhp?sourceid=chrome-instant&ion=1&espv=2&ie=UTF-
8#q=essentials%20of%20a%20good%20ecommerce%20website
3. E – Commerce, Concepts – Models – Strategies C.S.V Murthy , Himalaya Publishing House
4. http://www.statisticssolutions.com/factor-analysis-sem-factor-analysis/
5. http://diymarketers.com/leverage-social-media-audience-build-business-brand/
6. http://www.hongkiat.com/blog/70-creative-advertisements-that-makes-you-look-twice/
7. http://www.getspokal.com/how-leveraging-emotional-marketing-can-increase-your-audience-
interaction/

International Conference on INDIA 2030
185 Manonmaniam Sundaranar University, Tirunelveli
A COMPARATIVE STUDY ON WOMEN ENTREPRENEURSHIP ATTITUDE AMONG URBAN
AND RURAL IN KOVILPATTI
Dr.P.K.Ajit
Assistant Professor, PG &Research Department of Commerce, Kamarajar Government Arts College,
Surandai, Tirunelveli District
Abstract Entrepreneurship has gained greater significance at global level under changing economic scenario. Global
economy in general and Indian economy in particular is poised for accelerated growth driven by
entrepreneurship. An entrepreneur is a person who is able to look at the environment, identify opportunities to
improve the environmental resources and implement action to maximize those opportunities. Women have
broken down the glass ceiling of the traditional thought long prevailing in world and have emerged as successful
entrepreneurs. Many factors like urbanization, technical progress, women education, etc., have profoundly
changed these traditional conditions even in a developing country like, India. The data required for the study
were collected from both the primary and secondary sources. The primary data has been collected directly from
the women by using interview schedule method. The 120 samples’ were selected by purposive sampling
techniques from rural and urban area in Kovilpatti. In purposive sampling, the researcher to identify the
respondent based judgment 60 women from rural and remaining 60 women from urban. A pilot study was made
before carrying out actual study. The data collected were processed further with the help of the Statistical
Product and Service Solution (SPSS) to analyse and interpret the data in the study. Women entrepreneurial
development is one of the important areas. It is well ascertained by policy makers across the countries that
strategic development of an economy required equal participation and equal opportunities to all sections and
gender.
Keywords: Entrepreneurship, Environmental, Indian Economy and Urbanization
Introduction
Traditionally, entrepreneurship has been a male-dominated chase however several of today's
most impressive and rousing entrepreneurs are women. Women have broken down the glass ceiling
of the traditional thought long prevailing in world and have emerged as successful entrepreneurs.
Many factors like urbanization, technical progress, women education, etc., have profoundly changed
these traditional conditions even in a developing country like, India. These days India has been the
depiction of women in the top echelons of banking and financial services and many more sectors
and even has emerged as powerful entrepreneurs. Women in India have already started to follow
the direction that the women of the western world took more than eighty years ago. Women are
increasingly becoming conscious of their existence, their rights & their work situations. Women
entrepreneurs are defined by Government of India as an enterprise owned and controlled by a
woman having a minimum financial interest of 51% of the capital and giving at least 51% of
employment generated in the enterprise to women. An estimation made by a daily newspaper
revealed the fact that women entrepreneurs presently comprise about 10% of the total number of
entrepreneurs in India, with the percentage increasing every year. If the current trends persist, it is
possible that in another five years, women will comprise 20% of the entrepreneurial force. Women
Entrepreneur is a person who accepts challenging role to meet her personal needs and become
economically independent. A strong desire to do something positive is an inbuilt quality of
entrepreneurial women, who is capable of contributing values in both family and social life. With

Vol. 5 Special Issue 3 August 2017 ISSN: 2320-4168
186 Shanlax International Journal of Commerce
the advent of media, women are aware of their own traits, rights and also the work situations. The
challenges and opportunities provided to the women of digital era are growing rapidly that the job
seekers are turning into job creators. They are flourishing as designers, interior decorators,
exporters, publishers, garment manufacturers and still exploring new avenues of economic
participation. In India, although women constitute the majority of the total population, the
entrepreneurial world is still a male dominated one.
Significance of the Study
The glass ceilings are shattered and women are found indulged in every line of business. The
entry of women into business in India is traced out as an extension of their kitchen activities, mainly
3P‘s, Pickle, Powder and Pappad. But with the spread of education and passage of time women
started shifting from 3P‘s to modern 3E‘s i.e., Energy, Electronics and Engineering. Skill, knowledge
and adaptability in business are the main reasons for women to emerge into business ventures.
Women Entrepreneur is a person who accepts challenging role to meet her personal needs and
become economically independent.
Objectives of the Study
To know the women entrepreneurship attitude in urban and rural.
To study the motivating factor influencing the women's Entrepreneurship.
To study the entrepreneurs attitude among rural women's.
To examine the entrepreneurial skills among the rural women.
To assess the problems faced by women entrepreneurs.
To find out the government role in women entrepreneurship.
Methodology
Sources of the Study
The data required for the study were collected from both the primary and secondary sources.
The primary data has been collected directly from the women by using interview schedule method.
The secondary data has been collected from the published journal, books, magazines and websites.
Size of Sampling
The 120 samples were selected from rural and urban area in Kovilpatti by using purposive
sampling techniques. In purposive sampling, the researcher to identify the respondent based on his
or her judgment 60 women from rural and remaining 60 women from urban.
Pilot Study
A pilot study was made before carrying out actual study. The interview schedules are used in
the pilot study among twenty women each from urban and rural area. From the pilot study
necessary changes were carried out in the interview schedules for the final administration.
Tools for Analysis
The data collected were processed further with the help of the Statistical Product and Service
Solution (SPSS) to analyse and interpret the data in the study. The following statistical tools namely
mean score analysis and weighted average methods have been used for analysis to interpret the
valuable solutions.
Result and Discussion Age wise Classification
Source: Primary Data
Particulars Urban Rural Total
Number of Respondent
% Number of
Respondent %
Number of Respondent
%
Below 20 years 24 40 14 23 38 32
20 – 40 years 32 53 44 73 76 63 Above 40 years 04 07 02 04 06 05
Total 60 100 60 100 120 100

International Conference on INDIA 2030
187 Manonmaniam Sundaranar University, Tirunelveli
The general observation relating to age reveals that out of 120 women respondent 63 per cent
are belonging to age group of 20-40 years, 32 per cent are belonging to age group of below 20 years
and the remaining 05 per cent are belonging to age group of above 40 years.
Marital Status wise Classification
Source: Primary Data
Particulars
Urban Rural Total
Number of
Respondent %
Number of
Respondent %
Number of
Respondent %
Married 21 35 24 40 45 38
Unmarried 39 65 36 60 75 62
Total 60 100 60 100 120 100
The overall observation relating to the study provides information that out of the 120
respondents 62 per cent are unmarried and remaining 38 per cent are married.
Education wise Classification
Source: Primary Data
Particulars
Urban Rural Total
Number of
Respondent %
Number of
Respondent %
Number of
Respondent %
No formal education 05 08 07 12 12 10
Below High School level 08 13 05 08 13 11
HSS 07 12 12 20 19 16
Graduate 12 20 10 17 22 18
Post graduate 10 17 06 10 16 13
Professional 06 10 05 08 11 09
Diploma 05 08 07 12 12 10
ITI 07 12 08 13 15 13
Total 60 100 60 100 120 100
The overall observation relating to the study provides information that out of 120 respondent
18 per cent studied graduate, 16 per cent studied high secondary school, 13 per cent studied post
graduate and ITI, 11 per cent studied below high school, 10 per cent studied diploma and no formal
education and the remaining 09 per cent have professional courses.
Nature of Family wise Classification
Source: Primary Data
Particulars Urban Rural Total
Number of Respondent
% Number of
Respondent %
Number of Respondent
%
Nuclear Family 44 73 24 40 68 57 Joint Family 16 27 36 60 52 43
Total 60 100 60 100 120 100
From overall observation relating to the study provides information that out of the 120
respondents 57 per cent are living in nuclear family and 43 per cent are living in joint family.

Vol. 5 Special Issue 3 August 2017 ISSN: 2320-4168
188 Shanlax International Journal of Commerce
Rank in the Family wise Classification
Source: Primary Data
Particulars Urban Rural Total
Number of Respondent
% Number of
Respondent %
Number of Respondent
%
Younger 31 52 42 70 73 61 Elder 29 48 18 30 47 39
Total 60 100 60 100 120 100
Overall observation relating to the study provides information that out of the 120 respondents
61 per cent of the respondent are younger in the family and 39 per cent of the respondent are elder
in the family.
Annual Income wise Classification
Source: Primary Data
Particulars Urban Rural Total
Number of Respondent
% Number of
Respondent %
Number of Respondent
%
Below Rs.50000 32 53 23 38 55 46 Rs.50000- Rs.100000 19 32 26 43 45 37 Above Rs.100000 09 15 11 19 20 17
Total 60 100 60 100 120 100
The overall observation relating to the study provides information that out of the 120
respondents 46 per cent of the respondent family income is below Rs.50000, 37 per cent of the
respondent family income is Rs.50000- Rs.100000 and remaining 17 per cent of the respondent
family income is above Rs.100000.
Motivated Person
Source: Primary Data
Particulars Urban Rural Total
Number of Respondent
% Number of
Respondent %
Number of Respondent
%
Family member 15 25 08 13 23 20 Neighbors 08 13 05 08 13 11 Friends and Relatives 05 08 15 25 20 17 Popular business man 06 10 07 12 13 11 Education 07 12 06 10 13 11 Government 10 17 09 15 19 15 Private Agency 09 15 10 17 19 15
Total 60 100 60 100 120 100 The overall observation relating to the study provides information that out of the 120
respondents 20 per cent of the respondent motivated by family members, 17 per cent of the
respondent motivated by friends and relatives, 15 per cent of the respondent motivated by
government and private agency, 11 per cent of the respondent motivated by neighbors, popular
business man and through education.

International Conference on INDIA 2030
189 Manonmaniam Sundaranar University, Tirunelveli
Type of Entrepreneurship wise Classification
Source: Primary Data
Particulars
Urban Rural Total
Number of
Respondent %
Number of
Respondent %
Number of
Respondent %
Business 24 40 18 30 42 35
Trading 08 13 07 12 15 13
Industrial 10 17 11 18 21 17
Corporate 06 10 14 23 20 17
Agriculture 12 20 10 17 22 18
Total 60 100 60 100 120 100
The overall observation relating to the study provides information that out of the 120 respondents 35 per cent of the respondent type of entrepreneurship is business, 18 per cent of the respondent type of entrepreneurship is agriculture, 17 per cent of the respondent type of entrepreneurship is industrial & corporate and 13 per cent of the respondent type of entrepreneurship is trading. Amount Invest to start entrepreneurship
Source: Primary Data
Particulars
Urban Rural Total
Number of
Respondent %
Number of
Respondent %
Number of
Respondent %
Below Rs.50000 23 38 19 32 42 35
Rs.50000-Rs100000 22 37 25 42 47 39
Rs.100000-Rs.150000 09 15 05 08 14 12
Rs.150000-Rs.200000 02 03 03 05 05 04
Above Rs. 200000 04 07 08 13 12 10
Total 60 100 60 100 120 100
The overall observation relating to the study provides information that out of the 120
respondents 39 per cent of the respondent are required investment Rs.50000- Rs.100000, 35 per
cent of the respondent are required investment below Rs.50000, 12 per cent of the respondent are
required investment Rs.100000- Rs.150000, 10 per cent of the respondent are required investment
above Rs.200000 and remaining 04 per cent of the respondent are required investment Rs.150000-
Rs.200000.
Source of Fund
Source: Primary Data
Particulars
Urban Rural Total
Number of
Respondent %
Number of
Respondent %
Number of
Respondent %
Own fund 20 33 08 14 28 23
Friends and relatives 14 23 06 10 20 17
Money lenders 12 20 22 37 34 28
Banks 06 10 14 23 20 17
Institutions agency 08 14 10 16 18 15
Total 60 100 60 100 120 100

Vol. 5 Special Issue 3 August 2017 ISSN: 2320-4168
190 Shanlax International Journal of Commerce
The overall observation relating to the study provides information that out of the
120 respondents 28 per cent of the respondent collect fund from money lenders, 23 per cent of the
respondent use own fund, 17 per cent of the respondent collect fund from banks and friends &
relatives and remaining 15 per cent of the respondent collect fund from institutions agency.
Government Assistance
Source: Primary Data
Particulars
Urban Rural Total
Number of
Respondent %
Number of
Respondent %
Number of
Respondent %
Yes 32 53 43 72 75 62
No 28 47 17 28 45 38
Total 60 100 60 100 120 100
The overall observation relating to the study provides information that out of the 120
respondents, 62 per cent of the respondents are known about the government assistance and
remaining 38 per cent of the respondents are unknown about the government assistance.
Entrepreneurship Training
Source: Primary Data
Particulars
Urban Rural Total
Number of
Respondent %
Number of
Respondent %
Number of
Respondent %
Yes 40 67 27 45 67 56
No 20 33 33 55 53 44
Total 60 100 60 100 120 100
The overall observation relating to the study provides information that out of the 120
respondents, 56 per cent of the respondents are known about the entrepreneurship training and
remaining 44 per cent of the respondents are unknown about the entrepreneurship training.
Motivating Factor Influencing an Entrepreneurship
Source: Primary Data
Factors High Medium Low Total
Mean
Mean
Score
Earn money 198 82 13 293 2.441
Economic independence 135 128 11 274 2.283
Social status 180 102 09 291 2.425
Self identity 222 20 06 248 2.067
Family necessity 150 90 25 265 2.208
Role model 159 98 18 275 2.292
Employment 177 76 23 276 2.300
Challenge seeking 153 116 11 280 2.333
Financial assistance 123 112 23 258 2.150
Entrepreneurial experience 156 82 27 265 2.208
Traditional / Hereditary 144 92 26 262 2.183
Urge to achieve 171 98 14 283 2.358
Revival of sick unit 96 112 32 240 2.000
Market potential 135 116 17 268 2.233
More dependents in family 138 102 23 263 2.192

International Conference on INDIA 2030
191 Manonmaniam Sundaranar University, Tirunelveli
Aspiration about children 111 120 23 254 2.117
Technical knowledge 156 78 29 263 2.192
Use of idle funds 129 116 19 264 2.200
Organizational skills 168 86 21 275 2.292
Encouragement of family members 180 96 12 288 2.400
Out of the 120 women respondent, the respondent high on social status (2.425), earn money
(2.441), encouragement of family members (2.400), challenge seeking (2.333), employment (2.300)
than economic independence, self identity, family necessity, role model, financial assistance,
entrepreneurial experience, traditional / hereditary, urge to achieve, revival of sick unit, market
potential, more dependents in family, aspiration about children, technical knowledge, use of idle
funds and organizational skills.
Entrepreneurship Attitudes
Source: Primary Data
Attitude SA A NO DA SDA Total Mean
Mean Score
My business is the most important
activity in my life. 340 116 30 14 06 506 4.217
I will do whatever it takes to make my
business a success. 185 212 54 14 05 470 3.917
I plan to eventually sell my business 135 144 111 20 10 420 3.500
I would like to make a significant
contribution to the community by
developing a successful business.
210 140 72 26 06 454 3.783
I would rather own my own business
than earn a higher salary working for
someone else.
180 176 60 20 20 446 3.717
Owning my own business is more
important than having more time to
spend with my family.
175 160 54 42 06 437 3.642
I would rather own my own business
than pursue another promising career. 150 144 105 26 06 431 3.591
It is important for an entrepreneur to
understand and accept risk in order to
start and operate a successful.
150 172 75 30 07 434 3.617
I would be willing to have conflict with
my family in order to operate my own
business.
125 140 78 44 12 399 3.325
I would mortgage my house to provide
capital for my business. 125 136 75 34 19 389 3.242
Strongly Agree, Agree, No Opinion, Disagree and Strongly Disagree
The 120 women respondent, the respondents strongly agree on my business is the most
important activity in my life (4.217) than I will do whatever it takes to make my business a success,
I plan to eventually sell my business, I would like to make a significant contribution to the
community by developing a successful business, I would rather own my own business than earn a
higher salary working for someone else, Owning my own business is more important than having

Vol. 5 Special Issue 3 August 2017 ISSN: 2320-4168
192 Shanlax International Journal of Commerce
more time to spend with my family, I would rather own my own business than pursue another
promising career, It is important for an entrepreneur to understand and accept risk in order to start
and operate a successful, I would be willing to have conflict with my family in order to operate my
own business and I would mortgage my house to provide capital for my business.
Level of Entrepreneurial Skills
Source: Primary Data
Skills SA A NO DA SDA Total Mean
Mean Score
Group Skills 300 140 42 10 06 498 4.150 Technical Skills 150 228 36 30 06 450 3.750 Fund Raising Skills 185 180 72 14 07 458 3.817 Managerial Skills 235 248 63 18 06 570 4.750 Personal Entrepreneurial Skills 200 176 60 16 08 460 3.833 Enterprise Skills 205 172 48 26 07 458 3.817 Behavioral Skills 265 160 39 14 07 485 4.042 Communication Skills 220 156 48 28 07 459 3.825 Listening Skills 255 140 57 20 05 477 3.975 Soft Skills 205 172 60 20 06 463 3.858 Strongly agree (SA), Agree (A), No opinion (NO), Disagree (DA), Strongly Disagree (SDA)
Out of the 120 women respondent, strongly agree on managerial skills (4.750), group skills
(4.150) and behavioral skill (4.042) then technical skills, fund raising skills, managerial skills,
personal entrepreneurial skills, enterprise skills, communication skills, listening skills and soft
skills.
Level of Problems
Source: Primary Data
Problems High Medium Low Total Mean
Mean Score
Entrepreneurial Problem Lack of risk orientation 183 90 14 287 2.392 Lack of knowledge on program 84 146 19 249 2.075 Lack of work responsibility 138 84 32 254 2.117 Lack of self confidence 117 98 32 254 2.117 Lack of imitativeness 114 106 29 249 2.075 Lack of sociability 99 120 27 246 2.050 Lack of inner drive 96 130 23 249 2.075 Lack of analytical skill 114 112 26 252 2.100 Knowledge Problem Lack of diversification 120 104 28 252 2.100 Lack of learning Interest 120 104 28 252 2.100 Lack of Exposure 123 106 26 241 2.125 Lack of working capital 102 106 33 237 2.008 Lack of idea on Marketing 114 82 41 225 1.975 Lack of idea on Modernization 87 94 44 242 1.875 Lack of idea on Government assistance 102 108 32 229 2.017 Lack of idea on Innovation 96 90 43 269 1.908 Economic Problem Lack of investment 165 78 26 269 2.242 High interest rate 129 112 21 262 2.183

International Conference on INDIA 2030
193 Manonmaniam Sundaranar University, Tirunelveli
Lack of idea on cost benefit analysis 129 104 25 258 2.105 Lack of working capital 126 112 22 260 2.167 Lack of credit facilities 102 114 29 245 2.042 Constant need of finance 96 120 28 244 2.033 Social Problem Family problem 147 88 27 262 2.183 Multi responsibility 114 100 32 246 2.050 Lack of family support 108 116 26 250 2.083 No social recognition 96 118 29 243 2.025 Lack of social contracts 81 118 34 233 1.842 No appreciation of independent decision 108 102 33 243 2.025 Non-co-operation of others 117 104 29 250 2.083 High credit seeking behavior of consumers 111 116 25 252 2.100 Psychological Problem Lack of resource sharing ability 141 88 29 258 2.150 Lack of communication skills 96 115 31 244 2.033 Lack of networks 108 88 40 236 1.967 Fear on future 105 108 31 244 2.033 Lack of self motivation 99 106 34 239 1.990 Unbelievable attitude on others 90 70 34 194 1.617 No faith on personal skills 90 70 35 195 1.625 General Problem Lack of leisure time 132 114 19 265 2.208 Lack of systematic planning 108 112 28 248 2.067 Lack of credit orientation 99 88 43 230 1.917 Excessive tension 195 70 20 285 2.375 Poor forecasting effort 102 120 26 248 2.067 Health problem 111 92 37 240 2.000 Excess of work burden 114 120 22 256 2.133 Lack of emotional stability 87 120 31 238 1.983 Lack of managerial skills 90 102 39 231 1.925 This table analysis that entrepreneurial problem, out of the 120 women respondent, high on
lack of risk orientation(2.392) than lack of knowledge on program, lack of work responsibility, lack
of self confidence, lack of imitativeness, lack of sociability, lack of inner drive and lack of analytical
skill. In knowledge problem, out of the 120 women respondent high on lack of diversification
(2.125), lack of exposure (2.100), lack of learning interest (2.100), lack of idea on government
assistance (2.017) than lack of idea on modernization, lack of idea on marketing, lack of idea on
innovation and lack of working capital. As for as economic problem, out of the 120 women
respondent high on lack of investment (2.242), high interest rate (2.183) and lack of working
capital (2.167) than lack of idea on cost benefit analysis, lack of credit facilities and constant need of
finance. In social problem, out of the 120 women respondent high on family problem (2.183) and
high credit seeking behavior of consumers (2.100) than multi responsibility, lack of family support,
no social recognition, lack of social contracts, no appreciation of independent decision and non-co-
operation of others. In psychological problem, out of the 120 women respondent high on lack of
resource sharing ability (2.150) than lack of communication skills, lack of networks, fear on future,
lack of self motivation, unbelievable attitude on others and no faith on personal skills. As far as
general problem, out of the 120 women respondent high on excessive tension (2.375), excess of
work burden (2.133) and lack of leisure time (2.208) than lack of systematic planning, lack of credit

Vol. 5 Special Issue 3 August 2017 ISSN: 2320-4168
194 Shanlax International Journal of Commerce
orientation, poor forecasting effort, health problem, lack of emotional stability and lack of
managerial skills.
Suggestions Government has to conduct special training programs, entrepreneurial development
programmes, and improvement programs to Women Entrepreneurs as well as their employees to enhance their productivity
Women entrepreneurs and women employees have to play dual roles as a family organizer and manager of the women enterprise. So that government has to preview the extension of labor laws women
Cultivate Entrepreneurial Culture and provide Effective Training to potential Entrepreneurs.
Government must refine the Institutional support redefine the function of district industries centers
Redefine the functions of District Industries Centers Financial institution must provide the cheap financial assistance access to cheap financial
assistance. Government must set up District Women Entrepreneurship Promotion Cell and start training
centers in every district. Must provide better educational facilities and schemes to women Education institution. Training Programmed on management skill should be provided to women community. Counseling through the aid of committed NGOS, Psychologists, managerial experts & technical
personnel should be provided. A women entrepreneur’s guidance cell set up to handle the various problems of women
entrepreneurs all over the state. Training entrepreneurial attitudes should be given at the High School level through well
designed course. Government must establish rural entrepreneurship development policies and rules. Conclusion
Entrepreneurship amongst women has been a recent concern. Women have become aware of
their existence their rights and their work situation. However, women of the middle class are not
too eager to alter their role in fear of social backlash. The progress is more visible among upper
class families in urban cities. Women constitute almost half of the total population in India but they
are not enjoying their freedoms, equalities, privileges, on par with their male counterparts. Since
implementation of planning in India, several policies and approaches were made to reduce
inequalities between women and men. Women entrepreneurial development is one of the
important areas. It is well ascertained by policy makers across the countries that strategic
development of an economy required equal participation and equal opportunities to all sections and
gender.
Reference 1. Agarwal C.M (1993). Dimensions of Indian Women hood, Shri Almora Book Depot, U.P Hills
India. 2. Botton Bill and Thompson John (2008): Entrepreneurship –Talent, Temperament, Technique.
Elsevier, a division of reed Elsevier India private limited, Sri Pratap Udyog, 274, Capt, Gaur Marg Srinivasprui, New Delhi.

International Conference on INDIA 2030
195 Manonmaniam Sundaranar University, Tirunelveli
A STUDY OF THE IMPACT OF BANK LENDING TO WEAKER SECTIONS OF THE SOCIETY AT
UDANGUDI BLOCK IN THOOTHUKKUDI DISTRICT – AN EMPIRICAL STUDY
Dr. J. Leelavathy Packiathai
Assistant Professor, Department of Commerce,Nazareth Margosehis college , Nazareth, Thoothukudi
Introduction
Traditionally, Indian banking systems operated primarily in the private sector. From very
ancient days, indigenous banking as different from the modern western banking had been
organized in the form of family or individual business. The basic inability of the Indian banking
sector is to develop the economy and serve the society to a desired level, led to a demand for
restructuring of the banking system. But it was only in 1931 that the Central Banking Enquiry
Committee asked for linking the prevalent banking business with RBI. In this way, traditional Indian
banking system operated primarily in private sector. Until nationalization, the banking system had
more or less confined its activities to specific classes of people and thus, helped only big borrowers.
The Imperial Bank of India was nationalized and its undertaking was taken over by the State
Bank of India (SBI) in 1955.It was done for the purpose of imposing social control with a view to
remedy the basic weaknesses of the Indian banking system and to ensure that banks would cater to
the needs of the hitherto neglected and weaker sections of community instead of big business and
those connected with them. On July 19, 1969, 14 major banks and on April15, 1980, six banks were
nationalized. The object of this nationalization was to render the largest good to the largest number
of people. The present scheduled banking structure has been depicted in Figure1.1. From the figure,
it becomes clear that there are 27 public sector banks operating in India, apart from 32 private
sector banks, 42foreign banks and 196 RRBs. In addition to these there are 57scheduled urban
cooperative banks and 16 scheduled state cooperative banks. Out of the 27 public sector banks,
there are 19nationalized banks and others are SBI and its associates
Objectives of the Study
The following objectives are framed for the purpose of the present study:
To study the respondents’ duration of bank transaction in Udangudi blocks in Thoothukudi
district.
To examine the respondents level of saving in banks and their purpose
To analysis the respondent’s extent of availed bank credit and their repayment status in the study
area.
To study the respondent’s bank credit utilization behavior in the study area.
To examine the respondent’s realization on the impact of bank credit on their livelihood.
To study the respondent’s level of satisfaction with banking services in the study area.
To examine the respondent’s realization of problems of getting bank credit and suggestions to
improve the banking services in the study area.
Hypothesis of the Study
The following hypotheses are formulated on the basis of the content of the framed objectives
and appropriate statistical tools are applied to test them:

Vol. 5 Special Issue 3 August 2017 ISSN: 2320-4168
196 Shanlax International Journal of Commerce
There is an association between caste and educational status and respondents’ duration of bank
transaction.
The level of saving in banks and the purpose of savings in banks depends on caste and
educational status of the respondents.
There is a significant variation with respect to respondents’ extent of availed bank credit and
their repayment status in the study area.
The respondent’s differ significantly in their bank credit utilization behavior in the study area.
There is a significant variation with respect to respondent’s realization of impact of bank credit
on their livelihood.
There is a significant variation with respect to respondent’s satisfaction with banking services
in the study area.
There is a significant variation with respect to respondent’s realization of problems of getting
bank credit and suggestions to improve the banking services in the study area.
Methodology
This study aims at analyzing the impact of bank lending on weaker sections of the society in
Udangudi block in Thoothukudi district. This study deals with the beneficiaries of bank credit,
particularly of commercial banks, cooperative banks, regional rural banks and private banks.
The impact has been assessed from the point of views of borrowers of the above cited banks. The
study examines the bank transaction practice, saving practice, credit availed and utilization, impact
of bank credit on their livelihood, satisfaction with banking services, problems in getting bank
credit and suggestions to improve the performance of banking services.
Sampling Frame Work
The researcher has selected Udangudi block in Thoothukudi district for the purpose of the
study.
Data Analysis
The collected data were
classified and tabulated with the
help of computer programming.
Cross tabulation was made on the
basis of relating socio-economic
variables to the dependent
variables. Chi-square test was
applied to test the hypothesis;
particularly it is applied to study the
respondents’ duration of having
bank account, source of borrowing banks and reasons for non-repayment of bank credit in the right
time. ANOVA tests, have been used to examine the variation with respect to the impact of bank
credit on the livelihood of the respondents’, respondents satisfaction with bank credit, respondents’
problems of getting bank credit and respondents’ suggestions to improve the performance of
banking service. The calculated values of F are compared with the table values. If the calculated
value of F is greater than the table value at pre-assigned level of significance, the null hypothesis is
rejected; otherwise it is accepted. The general data analysis has been done with the help of
percentage and average analysis.
Village Panchayat
Number of Bank
Credit Availed Persons
Number of Sample
%
VeerapandianPatnam 168 50 29.76 KulasekaranPattinam 145 50 34.48 Manapadu 126 50 39.68 Udangudi 141 50 35.46 Meingnapuram 156 50 32.02 ParamanKurichi 108 50 46.79
Total 844 300 35.54

International Conference on INDIA 2030
197 Manonmaniam Sundaranar University, Tirunelveli
Limitations of the Study
The findings of the study are applicable only to the impact of bank credit on weaker sections of
the society. It is not applicable to other categories of the people. The study covers only Udangudi
block in Thoothukudi district, because studying all the blocks in Thoothukudi district is not possible
by an individual researcher due to constraints imposed by money, time, energy and efforts.
Education wise respondents’ extent of repayment of micro credit
Education Upto`20,000 `20,000 -40,000
`40,000 - 60,000
`60,000 - 80,000
`80,000 -1,00,000
Total
Primary 39 28 21 5 5 98
(39.80) (28.57) (21.43) (5.10) (5.10) (100.00)
Secondary 9 13 15 19 33 89
(10.11) (14.61) (16.85) (21.35) (37.08) (100.00)
Higher Secondary 8 9 14 26 5 62
(12.90) (14.52) (22.58) (41.94) (8.06) (100.00)
Degree 5 6 7 12 21 51
(9.80) (11.76) (13.73) (23.53) (41.18) (100.00)
Total 61 56 57 62 64 300
(20.33) (18.67) (19.00) (20.67) (21.33) (100.00)
Chi-square Summary Result
Chi square Calculated value Degrees of freedom Chi square table value at 5%
99.04 12 21.0
Data presented in above Table indicate the education wise respondents’ extent of bank credit
repayment. Majority of the degree level educated respondents (41.18%) have repaid their bank
credit in the range of `80,000-1,00,000. Majority of the higher secondary level educated
respondents (41.94%) have repaid their bank credit in the range of `60,000-80,000. More than one
third of the primary level educated respondents (39.80%) have repaid their bank credit up to
`20,000. The Chi square test is applied for further discussion. The computed chi square value 99.04
is greater than its tabulated value at 5 per cent level significance. Hence there is a significant
difference between respondents of different educational groups and their extent of repayment of
micro credit. It could be seen clearly from the above discussion that degree level educated
respondents have high repayment capacity of bank credit. The primary level educated respondents
have low bank credit repayment capacity.
Village panchayat wise respondents’ reasons for not proper repayment of bank loan
Village panchayat wise
Low income and low assets
creation
Low business performance
and low productivity
Increase in cost of
production and low
demand of the product
Crop failure and lack of
proper coping mechanism
Un avoidable social
expenditure
Total
VeerapandianPatnam 7 8 9 12 14
50 (14.00) (16.00) (18.00) (24.00) (28.00)
KulasekaranPattinam 12 13 14 6 5
50 (24.00) (26.00) (28.00) (12.00) (10.00)
Manapadu 9 23 5 7 6
50 (18.00) (46.00) (10.00) (14.00) (12.00)
Udangudi 7 8 7 23 5
50 (14.00) (16.00) (14.00) (46.00) (10.00)
Meingnapuram 15 5 14 9 7
50 (30.00) (10.00) (28.00) (18.00) (14.00)
ParamanKurichi 6 7 8 11 18
50 (12.00) (14.00) (16.00) (22.00) (36.00)
Total 56 64 57 68 55
300 (18.67) (21.33) (19.00) (22.67) (18.33)

Vol. 5 Special Issue 3 August 2017 ISSN: 2320-4168
198 Shanlax International Journal of Commerce
Chi-square Summary Result
Chi square Calculated value Degrees of freedom Chi square table value at 5%
67.42 20 31.4
The chi square test is applied for further discussion. The computed chi square value 67.42 is
greater than its tabulated value at 5 per cent level significance. Hence there is a significant
difference between village status and respondents’ cited reasons for non repayment of bank credit
in the right time.
Results of hypothesis testing
The formulated first hypothesis that there is an association between caste and educational
status and respondents’ duration of bank transaction practice is valid as per the results of chi
square test.
The formulated second hypothesis that the level of saving in banks and the purpose of savings
in banks depend on caste and educational status of the respondents is valid as per the results of
anova two way test.
The formulated third hypothesis that there is a significant variation with respect to
respondents’ extent of availed bank credit and their repayment status in the study area is valid
as per the results of anova two way test.
The formulated fourth hypothesis that the respondents differ significantly in their bank credit
utilization behavior in the study area is valid as per the results of chi square test.
The formulated fifth hypothesis that there is a significant variation with respect to respondents’
realization on impact of bank credit on their livelihood is valid as per the results of ANOVA two
way test.
The formulated sixth hypothesis that there is a significant variation with respect to
respondents’ satisfaction on banking services in the study area is valid as per the results of
ANOVA two way test.
Suggestions
Bankers should consider factors such as family income, landholding and consumption
expenditure while disbursing the credit, because high consumption expenditure and
landholding made the borrowers to be willful defaulters. Thus, the pre-lending appraisal, post-
lending supervision and approaching the borrower in the right time for repayment by the
institutional lending agencies may avoid the misutilization of loan and may lead to better
recovery performance. On the issue of loan default by weaker section, the banks should carefully
select and screen their big and small clients: character referencing and repeat and group lending
arrangements are capable of offsetting default risk of potential borrowers. Besides, banks
should accept joint liability among weaker section as collateral. However, on loan diversion, banks
should encourage the establishment of a monitoring unit in their branch and staff of that
department should be encouraged with incentives, so as to discourage them from being corrupt.
This is necessary because bribe can increase the cost of lending which will make the loan
unrepayable.
The macro-economic environment is the most important determinant of agricultural investment
and output. For this reason, the Reserve Bank of India should find solutions to the over-valued
exchange rates and high real interest rates which have been a stumbling block to the commercial
bank credit extension to agricultural sector.
If commercial banks need to operate efficiently in order to facilitate better performance of the
economy and its growth through the adequate credits to agricultural sector, then, the bank

International Conference on INDIA 2030
199 Manonmaniam Sundaranar University, Tirunelveli
interest rate should never be subsidized i.e. it should not be less than the market interest rate,
even if the credit is targeted. Otherwise, the powerful and more efficient Indian weaker section
would divert the credit to other sources. Such market rates would encourage commercial banks
to increase their credits to the agricultural sector.
Conclusion
A review of performance credit in commercial banks in the study area reveals that though the
overall flow of institutional credit has increased over the years, there are several gaps in the system
like inadequate provision of credit to small and marginal weaker section, paucity of small and long-
term lending and limited deposit mobilization and heavy dependence on borrowed funds by major
agricultural credit purveyors. These have major applications for agricultural development as also
the well being of the farming community.
References
1. Alamelu and Devamohan (2010), “Efficiency of Commercial Banks in India”, Professional
Banker,(Jan.) ICFAI University Press, Hyderabad.
2. Babu Ram P., (1991) “Repayment Patterns of Agriculture Finance - A study of Andra Bank in
Guntur District”, M.Sc. (Agri) Dissertation, Andra Pradesh Agricultural University, Hyderabad,.

Vol. 5 Special Issue 3 August 2017 ISSN: 2320-4168
200 Shanlax International Journal of Commerce
BROILER RABBIT FARMING – A PROFITABLE ENTERPRISE FOR IMPROVING THE
LIVELIHOOD OF RURAL FARMERS
Pasupathi, Karu Purushothaman, M.R & H. Gopi
Assistant Professor, Department of Animal Nutrition
Madras Veterinary College, Vepery, Chennai
Abstract Broiler rabbit farming is gaining importance among farmers because of the higher prolificacy, low initial
investment, shorter generation interval, less space required for farming and manages even with locally available
vegetable waste. Commercial rabbitry are scanty and feeding their rabbit with leguminous fodder like
Desmanthus virgatus to obtain market weight of 2 kg at an early age. Various feeding research trials have been
conducted to assess the performance of broiler rabbits under Tamil Nadu Climatic condition. The results revealed
the performance vary within Tamil Nadu agroclimatic conditions. Rabbit can be adoptable and maintained with
any condition viz., concentrate and cultivated fodders, concentrate with tree fodders or only on vegetable waste.
But rabbit farming could be an emerging alternate meat with more protein and providing livelihood security to
rural unemployed youths, landless farmers and women.
Key Words: Broiler Rabbits, alternate meat source, profitable enterprise
Introduction
Rabbit farming now-a-days popularizing among farmers and unemployed rural youth as an
promising enterprise to start with because of their less floor space required for rearing, low initial
investment, easy maintenance and obtaining return within a short period. In India most of the
rabbit farmers are landless labourers rearing rabbits as backyard venture to meet their family
protein demand. They are offering only vegetable waste available throughout the year at
free/cheaper cost. Commercial rabbitry are scanty and feeding their rabbit with leguminous fodder
like Desmanthus virgatus to obtain market weight of 2 kg at an early age. The rabbits are efficient
converter of forage in to valuable animal protein compare to all other animals (Anugwa et al.,
1982.). Research trials on feeding management to improve the productivity and also to reduce the
cost of production were conducted for the benefit of farming community.
Materials and Methods
The New Zealand White breed of rabbits used for the study were taken from Rabbit Breeding
Unit of Post Graduate Research Institute in Animal Sciences, Kattupakkam, Tamilnadu. The trials
conducted to assess the performance of rabbits and also to improve the productivity as furnished
below:
1. Feeding trial with concentrate (16 % CP and 2500 kcal DE) and Desmanthus virgatus
2. Feeding trial with concentrate (16 % CP and 2500 kcal DE) and Desmanthus virgatus replaced at
various levels (25,50,75 & 100 %) with cabbage waste
3. Feeding trial with concentrate and Desmanthus virgatus replaced at various levels with tree
fodders as extruder feed
The quantity of feed offered will be based on the body weight. Rabbits normally consume 7 per
cent of their body weight. In that, 50 per cent will be offered through concentrate and 50 per cent
through green fodder/ tree leaves. Since the protein content is varying for different tree leaves,
different concentrate feed are prepared with different protein content (11%, 16% and 26%
Protein) in order to make the diet iso-nitrogenous in trial 3. Clean portable water was supplied for

International Conference on INDIA 2030
201 Manonmaniam Sundaranar University, Tirunelveli
drinking and the water availability was ensured all the time. The data collected on various
parameters were statistically analysed as per the method of Snedecor and Cochran (1989) and
Duncan (1955).
Results and Discussion
In the feeding experiment - 1, the proximate principles of Desmanthus virgatus analysed
revealed 31.16 % dry matter, 20.28 % crude protein, 7.39 % ether extract, 20.92 % crude fibre,
6.72 % total ash and 44.69 % nitrogen free extract and on feeding the growth performance of rabbit
observed at fourth month of age was 1698±10 g.
In feeding experiment – 2, the proximate principles of cabbage waste analysed were 11.52 %
dry matter, 12.55 % crude protein, 6.04 % ether extract, 26.53 % crude fibre, 16.54 % total ash and
38.34 % nitrogen free extract upon replacement of Desmanthus virgatus on 25, 50, 75 and 100 %
level the weight gain observes was 1548±14, 1506±14, 1423±15 and 1412±13 g, respectively. This
study also revealed that the presence of glucosinolates does not affect the performance of rabbits
since the level is very meager. In feeding experiment – 3, the proximate principles analysed showed,
Erythrina indica leaves having higher crude protein content (26.24 %) compared to Leucaena
leucocephala (21.40 %) and Artocarpus heterophyllus (7.43 %). The tree fodder inclusions as green
for rabbit have no deleterious effect on productive performances. The body weight at 4 month of
age in rabbits in concentrate with subabul, concentrate with Kalyana murungai and concentrate
with jack fruit leaves were 1560±18, 1810±19 and 1680±17 g, respectively. The performance of
rabbits on Erythrina indica found to be better than the commercial rabbit farmers traditionally
feeding Desmanthus virgatus.
Conclusions
It can be concluded from this study that
1. Rabbit farming could be adopted in backyard venture with cabbage waste alone
2. Commercial farming profitably made using Desmanthus virgatus as green fodder
3. Tree fodder as green reduce the cost of production and thereby increase the net farm return.
Hence, rabbit farming is suitable for our Tamilnadu climatic condition to increase the income
generation to rural unemployed youth, women and landless farmers.
References
1. Anugwa F.O.I., Okorie, A.U. and Esomonu, A.F.M. 1982. Feed utilization and growth of rabbits fed
three levels of protein and energy in the tropics. Nigerian Journal of Nutrition, 3: 109-114.
2. Snedecor, G. W. and W. G. Cochran, 1989. Statistical Methods. 8th edn, Iowa state University
Press, Ames, USA. Iowa – 50010

Vol. 5 Special Issue 3 August 2017 ISSN: 2320-4168
202 Shanlax International Journal of Commerce
A STUDY ON OPPORTUNITIES AND CHALLENGES OF WOMEN ENTREPRENUERS
IN TIRUNELVELI AREA
V. Sree Mahalakshmi, M.Com
Ph.D Research Scholar, The MDT Hindu College Pettai Tirunelveli
Introduction
Entrepreneurship has become the recent monument of the modern and independent India.
Entrepreneur is regarded as the most critical factor in the economic development of every nation.
Entrepreneurs occupy a strategic position in the Indian economy. The existing entrepreneurship
and entrepreneurs have basically emerged out of the national growth of entrepreneurial talent,
skill, competancy and flair of certain communities and regions. In recent years, a number of women
who are involved in businesses have increased. It is now argued that increasing the number of
women entrepreneurs inolved in starting new business is critical for a country’s long-term
economic growth. Futher, self-employment represents one of the most important job for women.
Self-employment represents an important job alternative for many women and perhaps especially
for women in developing economy.
Statement of the Problem
Development of an economy is possible through entrepreneurship. This development should be
share by both male and female entrepreneurs, irrespective of the differences. It is popularly held
that women have been physically and psychologically inferior to their counterparts. This low status
of women is further internsified through social and religious sigmas. Generally women need to
come across lot of struggles, challenges and obstacles in their personal life. When they turn into
business they have to face many problems for every success. Despite effort is made by them they
must be recognized positively and they faith to withstand by themselves. There are some other
problems for womens. They are
Lack of confidence – In general, women lack confidence in their strength and competence. The family members and the society are reluctant to stand beside their entrepreneurial growth. To a certain extent, this situation is changing among Indian women and yet to face a tremendous change to increase the rate of growth in entrepreneurship. Socio-cultural barriers – Women’s family and personal obligations are sometimes a great barrier for succeeding in business career. Only few women are able to manage both home and business efficiently, devoting enough time to perform all their responsibilities in priority. Market-oriented risks – Stiff competition in the market and lack of mobility of women make the dependence of women entrepreneurs on middleman indispensable. Many business women find it difficult to capture the market and make their products popular. They are not fully aware of the changing market conditions and hence can effectively utilize the services of media and internet. Motivational factors – Self motivation can be realized through a mind set for a successful business, attitude to take up risk and behavior towards the business society by shouldering the social responsibilities. Other factors are family support, Government policies, financial assistance from public and private institutions and also the environment suitable for women to establish business units.

International Conference on INDIA 2030
203 Manonmaniam Sundaranar University, Tirunelveli
Objectives of the Study
The present study has been acrried out with the following objectives.
1. To study the socio-economic background of the women entrepreneurs in Tirunelveli District.
2. To analyze the motivational factors and other factors that influence women to become
entrepreneurs.
3. To analyze the problems faced by the women entrepreneurs in business and economic
development.
4. To offer some suggestions to improve the satisfaction of women entrepreneurs and the
environmental opportunities.
5. To study the impact of status of women after being an entrepreneur.
Scope of the study
The study focuses on the women entrpreneurs in selected Tirunelveli Area, depends on
industrial growth has been phenomenal. The selected area with its good infrastructural facility,
offers sound prospecs for industrial developments. The scope of the study encompasses women
entrpreneurs in Tirunelveli Area and the problems faced by women entrepreneurs who are
engaged in new enterprise. The study is limited only to the women entrepreneurs of selected
groups in Tirunelveli Area.
Sampling Design
Women entrepreneurs who are the main source of primary data are collected from the women
entrepreneurs through a well structured questionnaire. As the area of study is limited to Tirunelveli
Area, the researcher has proposed the sampling techniques for the selection of respondents. To
identify the right respondents which are also very essential for the collection of primary data the
following process has been adopted scientifically. Finally 45 respondents were selected and
included the study from various taluks of Tirunelveli districts who have engaged to start an
enterprises and running sucessfully.
Tools of analysis
Personal interview is the major of data collection. Interview technique is to be made at women
entrepreneurs. The Secondary data are also proposed to collect from various books, articles,
internet google etc. All these data are to be arranged in various form of tables and proposed to
critically analyze with the help of a number of statistical tools. Percentage Analysis, Average,
Weightage Score and Chi-square Test are the various statistical tools applied.
Analysis and Interpretation
This study aims the problems and prospects of women entrepreneurs in Tirunelveli area. For
this purpose of the study conducted for 45 respondents of the women entrepreneurs. An attempt
has been made in this section to analyze the collected data with refernce to activities of the women
entrepreneurs a detailed analysis are given below.
The table 1.1 shows that Socio-Economic Background of the Respondents
Socio-Economic Background
The personnel characteristics of the selected respondents like age, educational status, marital
status, family income, business type, size of the business, financial sources and spend expenses are
discussed in this section.

Vol. 5 Special Issue 3 August 2017 ISSN: 2320-4168
204 Shanlax International Journal of Commerce
Table 1.1 Socio-Economic Background of the Respondents
Source : Primary data
Factors Category No. of
Respondents
Percentage
(%)
Age
Below – 30 10 22.22
30- 40 16 35.56
40-50 13 28.89
50 & above 6 13.33
Marital Status Unmarried 15 34.44
Married 30 65.56
Educational Qualification
Illiterate / Primary 7 15.56
Secondary 8 17.78
Higher Secondary 21 46.67
Graduate Level 9 20
Annual Income
Below 10000 8 16.67
10000 - 20000 16 35.56
20001 – 30000 10 23.33
30001 – 40000 7 15.56
40001 & above 4 8.89
Business Type
Trading 12 26.67
Manufacturing 19 42.22
Service 8 17.78
Combination 5 11.11
Others 1 2.22
Size of Business
Below 1 lakh 21 46.67
1 lakh – 5 lakhs 11 24.44
5 lakhs – 10 lakhs 8 18.89
10 lakhs & above 5 10
Source of Financing
Spouse Income 16 35.56
Personal Saving 14 30
Loan from banks 11 25.56
Other Sources 4 8.89
Spend the business income
to
Family Expenses 18 41.11
Personal Savings 15 32.22
Reinvestment in their
business 12 26.67
Chi-square Analysis
The opinion of the respondents and socio-economic characters relationship is applied for chi
square test. The selected variables only to applied in this model. Table 1.2 reveals that the factors
are Age and Education are signifacan at 1% level. Marital status, business type and sources of
finance are significant at 5% level of significance. The remaining factors are not significant at 5%
level.

International Conference on INDIA 2030
205 Manonmaniam Sundaranar University, Tirunelveli
Table 1.2 The Summary of Opinion of the Women Entrepreneurs
S.
No. Factors
Chi-Square
Value
Degree of
Freedom Table Value Result
1 Age 8.63 3 8.41 Significant **
2 Marital Status 7.49 2 6.64 Significant **
3 Educational Qualification 6.28 1 2.96 Significant *
4 Annual Income 1.83 3 6.30 Not Significant
5 Business Type 5.77 2 4.75 Significant *
6 Size of Business 3.62 2 4.75 Not Significant
7 Source of Financing 6.84 3 6.30 Significant *
8 Spend the business income
to
3.63 2 6.64 Not Significant
Source: Primary Data
Note: * - Significant at 5% level: ** - Significant at 1% level
Findings of the Study
1. 35.56% of the respondents are belonging to 30-40 years age group of the entrepreneurs.
28.89% of the respondents are between the age of 40-50 year. The 22.22% of the respondents
are below 20 years of age group and rest of the respondents are above 50 years of age
2. 46.67% of the respondents are belonging to higher secondary level of the entrepreneurs. 20%
of the respondents are graduates and 17.78% of the respondents are secondary level of
education and the rest of the respondents are of primary and illeterate respondents.
3. 35.56% of the respondents are belonging to Rs. 10000 to 20000 incomes of families. 23.33% of
the respondents are Rs. 20001 to 30000 income group and only 8% of ther respondents are of
their fancome of above Rs. 40000.
4. 42.22% of the respondents are deals with manufacturing types of business. 26.67% of the
respondents who are engaged in trading type of business. Only 16% of the respondents are
combined of all type of business.
5. 65.56% of the respondents are married and the rest of the respondents are unmarried. So,
marital status is important factor to determine the entrepreneurs.
6. 46.67 % of the respondents are invested below 1 lakh in their business. 24.44% of the
respondents are in between 1 lakh to 5 lakhs category.
7. 35% of the finance sources from spouse’s income. 30% of the respondents financed from
personal savings and 25.56% are taken loan from banks as well as 8% respondents financial
sources are from other sources.
8. 41.11% of the respondents opinion are to meet family expenses. 32.22% of the respondents
opinion are personal savings and 26.67% of the respondents opinion are reinvestment in their
businesses.
Suggestions of the study
1. Most of the Women Entrepreneurs are of the opinion that because of lack of training, they are
not able to survive in the market. Hence, the government should conduct frequent training
programmes with regard to new production techniques, sales techniques, etc: this training
should be made compulsory for women entrepreneurs.

Vol. 5 Special Issue 3 August 2017 ISSN: 2320-4168
206 Shanlax International Journal of Commerce
2. Finance is the first major problem for women entrepreneurs. Hence, the government can
reduction of rate of interse, exclusive loan scheme, reduction of processing time, loan without
security are recommended for the development of women entrepreneurs.
3. The Government semi-government and non-government organizations should create awareness
among the most productive age group of rural women.
4. For motivation of rural women entrepreneurs the use of farm visits, short film shows, puppet
shows, group meetings etc., will help in motivating the potential group.
5. Marketing product is one of the main problems for women entrepreneurs. Here, women co-
operative societies can be started to procure the products from women entrepreneurs. They will
help them in selling their products at a reasonable price.
Opportunities of Women Entrepreneur
Women entrepreneurs believe good enough to contribute for the society well being in order to
tap the opportunities in entrepreneurship. They have many responsibilities towards society
betterment. In recent days women entrepreneurs are performing extremely fantastic.
Eco-friendly technology
• Bio-technology
• IT enabled enterprises
• Event Management
• Tourism industry
• Telecommunication
• Plastic materials
• Vermiculture
• Mineral water
• Sericulture
• Floriculture
• Herbal & health care
• Food, fruits & vegetable processing
Conclusion
IT is evident from the study that women are ready to face the cahllenges associated with setting
up of business. Women are into business not only to survival but to satsfy their inner urge of
creativity and to prove their capabilities. The challenges and opportunities provided to the women
in this digital era are growing rapidly fantastic rather job seekers. They are flourishing as designers,
interior decorators, exporters, publishers, garment manufacturers and still exploring new avenues
of economic participation. Women entrepreneurs can contribute largely to the wealth of the society
in a most efficient manner. But they need to perceive fully the role and significance of
entrepreneurship. So the forthcoming days are definitely meaningful and decisiveness to the Indian
women entrepreneurs.
It is worthwhile to conclude by quoting the words of Pandit Jawaharlal Nehru,
“When woman moves forward, the family moves, the village moves and the country moves”

International Conference on INDIA 2030
207 Manonmaniam Sundaranar University, Tirunelveli
A STUDY ON EMPOWERMENT OF WOMEN THROUGH MAHATMA GANDHI NATIONAL
RURAL EMPLOYMENT GUARANTEE PROGRAMME (MGNREGA)
B.G.Kohila
Ph.D. scholar, Department of PG Commerce
Nesamony Memorial Christian College, Marthandam
Dr. R. Mabel Sulochana
Associate professor, Department of PG Commerce Nesamony Memorial Christian College, Marthandam
Introduction
India is a country of villages and its development is synonymous with the development of the
people living in rural areas. India is a vast and second most popular country of the world. But a big
part of this population has been leading an uncertain economic life due to non-synchronization of
employment opportunities in agriculture sector because of the fast growing population. "India's
labour law that guarantees 100 days of wage employment to rural households considers villages
and their hamlets as distinct entities, and hence its tally of administrative units goes up to more
than a million,. MGNREGA, the central government is trying hard to bring a bill in the monsoon
session (2013) to provide guarantee for food to the poor people although it has already issued an
ordinance in this regard.
Women's empowerment Women's economic empowerment refers to the ability for women to enjoy their rights to control
and benefit from resources, assets, income and their own time, as well as the ability to manage
risk and improve their economic status and wellbeing. While often interchangeably used, the more
comprehensive concept of gender empowerment refers to people of any gender, stressing
the distinction between biological sex and gender as a role. It thereby also refers to other
marginalized genders in a particular political or social context.
Statement of the Problem
The coverage of NREGA is an ambitious one as it talks about two things; one to create local
employment opportunities for the rural poor and second to invest on building rural sustainable
assets through variants of works such as water conservation, irrigation facilities, rural connectivity,
land improvement on land owned by STs/SCs, etc. The NREGA is unique in the sense that it is
sensitive to working conditions of workers, especially women as it advocates for providing
accessible worksite (within five kilometer of the workers residence), crèches etc for women with
children below six, at least one third of work opportunities must go to women and gender parity of
wages, etc. Besides this, there are strong provisions to pre-empt corruption, regular and
transparent maintenance of all NREGA documents especially muster rolls, job cards, utilization
certificate etc., and their display at the respective Panchayat Offices. The Act further requires the
maintenance of employment and wage details in the workers’ job cards, to enable workers to
monitor and verify their employment records themselves.

Vol. 5 Special Issue 3 August 2017 ISSN: 2320-4168
208 Shanlax International Journal of Commerce
Objectives of the study
1. To study the socio - economic conditions of women through MGNREGA .
2. To analyse the Empowerment of women through MGNREGA.
Methodology
The investigator has collected both primary as well as secondary data. The primary data are
collected with the help of a carefully prepared interview schedule . Some secondary data is also
collected from books, journal, newspaper, magazine and internet. The researcher personally went
to the field to interview the respondents. The researcher had conducted an informal investigation in
order to get proper information about the various factors.For the purpose of collecting data 100
samples were choosen according to Simple random sampling techniqueThe collected data were
analyzed with the help of Mann Whitely U - test.
Table 1 Income Before and after Joining Mgnrega Source: Primary Data
Hypothesis: There is no significant difference between income of the respondents before and after
joining MGNREGA.
Table 2 Computation of Rank for monthly Income before and after Joining MGNREGA Z = U –(E) U
σ= 15 – 17.5= -0.39
6.32
For 5 % level of
significance the value is
1.96 and the calculated
value is (-0.39). Which
is less than the table value
the hypothesis is accepted.
Table 3 Expenditure before and after Joining Mgnrega Source: Primary Data
Sl.No. Before Joining MGNREGA No. of respondents Sl No. After Joining
MGNREGA No. of respondents
1 Below 2000 14 1 Below 3000 23
2 2001 – 4000 15 2 3001 - 5000 24
3 4001 -6000 10 3 5001 - 7000 32
4 6001 – 8000 21 4 7001 - 9000 11
5 8001 -10000 22 5 9000 - 11000 4
6 Above 10000 18 6 Above 11000 6
Total 100 100
Sl.No. Before Joining MGNREGA No. of respondents Sl No. After Joining MGNREGA No. of respondents 1 Below 2000 20 1 Below 3000 21
2 2001 – 4000 17 2 3001 - 5000 9 3 4001 -6000 13 3 5001 - 7000 30
4 6001 – 8000 22 4 7001 - 9000 10
5 8001 -10000 14 5 9000 - 11000 20 6 Above 10000 14 6 Above 11000 10
Total 100 100
Score Ascending Rank Rank (before joining) Rank (after joining) 30 1 - 1 22 2 2 - 21 3 3 20 4.5 20 4.5 4.5 4.5 17 6 6 - 14 7.5 14 7.5 7.5 7.5 13 9 9 - 10 10.5 - - 10 10.5 10.5 10.5 9 12 - 12 𝑅1= 29 𝑅2= 48

International Conference on INDIA 2030
209 Manonmaniam Sundaranar University, Tirunelveli
Hypothesis : There is no significant difference between expenditure of the respondents before and
after joining MGNREGA.
Table 4 Computation of Rank for monthly expenditure before and Joining MGNREGA
Z = U –(E) U
Σ = 12 –1 8 = -0.96
6.24
For 5 % level of
significance the value
is 1.96 and the
calculated value is
(-0.96). Which is less
than the table value
the hypothesis is
rejected.
Table 5 Savings before and after Joining Mgnrega
Source: Primary Data
Sl.No. Before Joining
MGNREGA
No. of respondents
Sl No. After Joining
MGNREGA No. of
respondents
1 Below - 500 31 1 Below – 600 32 2 501 -1000 20 2 601 - 1200 22 3 1001 - 1500 21 3 1201 – 1800 16 4 1501 - 2000 18 4 7001 – 9000 19 5 Above 2000 10 5 9000 – 11000 11
Total 100 100 Hypothesis : There is no significant difference between savings of the respondents before and after
joining MGNREGA.
Table 6 Computation of Rank for monthly savings before and Joining MGNREGA
Z = U –(E) U
σ = 12 - 12.5 = 0.10
4.78
For 5 % level of
significance the value
is 1.96 and the
calculated value is
(0.10). Which is less
than the table value
the hypothesis is
accepted.
Score Ascending Rank Rank (before joining) Rank (after joining) 32 1 - 1 24 2 2 - 23 3 - 3 22 4 4 - 21 5 5 - 18 6 6 - 15 7 7 - 14 8 8 - 11 9 - 9 10 10 10 - 6 11 - 11 4 12 - 12
𝑅1= 40 𝑅2= 38
Score Ascending Rank Rank (before joining) Rank (after joining)
32 1 - 1
31 2 2 -
22 3 - 3
21 4 4 -
20 5 5 -
19 6 - 6
18 7 7 -
16 8 - 8
11 9 - 9
10 10 10 -
𝑅1= 28
𝑅2 = 27

Vol. 5 Special Issue 3 August 2017 ISSN: 2320-4168
210 Shanlax International Journal of Commerce
Findings
At 5 % level of significance the table value is (1.96) and calculated value is (-0.39). Since the
computed value is less than the table value the hypothesis is accepted.
At 5 % level of significance the table value is (1.96) and calculated value is (-0.96). Since the
computed value is less than the table value the hypothesis is accepted.
At 5 % level of significance the table value is (1.96) and calculated value is (0.10). Since the
computed value is less than the table value the hypothesis is accepted.
Suggestions
The success of the programme depends upon its proper implementation. Much of the pitfalls of
MGNREGA implementation can be overcome if proper processes and procedures are put in place.
Thus, there should be continuous efforts towards creating adequate awareness on different
provisions of MGNREGS amongst the people. Creating awareness is necessary not only to motivate
the people to work under the scheme but also to encourage them to participate in its planning and
implementation. Efficient utilization of resources under the scheme requires bringing in
transparency and accountability. Provision for social audit at the panchayat level on a regular basis
can play a significant role in this regard. The leadership style should be democratic in nature. This
will facilitate greater community participation, information sharing, expression of opinion by the
rural mass, and development of social networks. There is also the important role of the Government
in implementation of MGNREGS.
Conclusion
MGNREGA is landmark legislation in the history of social security legislation in India after
independence. Enacted after a successful struggle for a comprehensive employment guarantee law,
this legislation is a partial victory towards a full-fledged right to employment. Though MGNREGA is
a well thought-out legislation, a powerful tool in the hands of the common people to get their basic
livelihood, but its poor execution, deprives the rural poor from their basic rights. The study reveals
that despite numerous problems, MGNREGA is a program that has begun to make a difference in the
lives of women. For example, women have started asserting their voices in the family matters and
nature of spending money. Though, awareness still continues to be a stiff challenge, women in study
area have become pro-active learners and participants in the schemes. Furthermore, it is popular
among the workers, who routinely ask if more work could be made available to them under the
MGNERGA, they would like to do.
References
1. Babu, V. S., and K. H. Rao (2010). Impact of MGNREGS on Scheduled Castes and Scheduled
Tribes: Studies Conducted in Eight States, National Institute of Rural Development, Hyderabad.
2. Bagehi,K.K, Abhijeet, (2011). Mahatma Gandhi National Rural Employment Guarantee Act
(MGNREGA) As Right to Employment Assessment of Impact and Effectiveness, xii, 308p.

International Conference on INDIA 2030
211 Manonmaniam Sundaranar University, Tirunelveli
SOCIO-ECONOMIC STATUS OF DAIRY FARMERS IN THE INDUSTRIAL AREAS OF VELLORE
DISTRICT –TAMIL NADU, INDIA
A. Yasotha, T. Sivakumar, Thanga Tamil Vanan, M. Sundara Vinayaki & S.Saraswathi
Department of Livestock Production Management, Madras Veterinary College,
Chennai, Tamil Nadu. India
Abstract
The field survey was conducted to highlight the condition of dairying in industrial areas of Vellore districts,
Tamil Nadu, India. A total of 32 farmers were selected randomly in two industrial areas of Vellore district, which
covered around 270 dairy animals. Majority (71.88 %) of the farmers had dairying as the primary occupation
only (3%) farmers had agriculture as the primary occupation. Based on the land holdings 56.25, 37.50 and 6.25
per cent farmers were marginal, landless agricultural labourer and large, respectively. The average wet land
holding was 1.18 acres and no farmers had dry land holding. The average herd size was 6.79 cross bred cows and
1.67 buffaloes. The red loamy soil (75 %) was predominant in Vellore district. Literate farmers were 56.25 per
cent and 75 per cent of the farmers were income generator.
Keywords: Dairy farmer- dairying-occupation-status
Introduction
Dairying is an important occupation in the rural households of India and has emerged as an
employment generator. It plays a major role not only to improve the economic status of the dairy
farmer and also to improve the economy of the country. In Tamil Nadu, dairy farming is an integral
part of the livelihood of the people and it is facing major challenges due to shortage of feed and
fodder [1] including environmental pollution. Though dairying in India has made rapid strides, but
animal productivity remained low due to the above said factors. One of the problem that Vellore
district faces is polluted ground water which is not potable due to the chemicals released by the
leather industries percolate into the water bodies which affects the productive and reproductive
performance of the dairy animals especially quality of the milk. Hence, the present study was
undertaken to find out the status of dairying in Vellore districts of Tamil Nadu with the objectives to
study the social status of the dairy farmers in the study areas.
Materials and Methods
Location of the Study
The present study was carried out in Ranipet area of Walajah taluk and Mathanur village in
Ambur taluk of Vellore district.
Methodology
The interview schedule was developed to assess the demographic status of the farming
communities on the existing dairy cattle production system with reference to amplitude of the
industrialisation in the study area during August 2012 to February 2013. The pretested interview
schedule was filled on the spot with observation and an interview with dairy farmers. In Vellore
district 32 farmers were surveyed based on the questionnaire. The farms selected were based on
the following criteria. Farms should be in the vicinity of industry within 3 km radius and farm born
cow or the cow had to be reared in the same farm for a minimum period of 1-2 years.
Statistical analysis
Frequency and percentage was used for the statistical assessment of data as per the responses
recorded from the dairy farmers.

Vol. 5 Special Issue 3 August 2017 ISSN: 2320-4168
212 Shanlax International Journal of Commerce
Results and Discussion
Status of dairy farmers
The average family size of the surveyed households was four members per household and did
not vary significantly. The occupational pattern of the farmers revealed that majority of the
household (71.88%) had dairying as the primary occupation. Only few farmers had agriculture as
the primary occupation and 18.75 % farmers had others (service or business) as main occupation
apart from dairying. Similar occupational trend was observed by the earlier workers [2] in East
Java.
The number of marginal farmers was highest (56.25 %) followed by landless agricultural labourer
(37.50 %) and large (6.25 %). Small farmers were not found in the study areas. [3] observed that
majority of the livestock keepers (50.31%) were marginal in terms of land holding (1-2 ha) in 24
linkage villages of Bareilly district of Uttar Pradesh. H o w e v e r , l a r g e l a n d h o l d i n g farmers
(>5.0 acres) did not prefer to keep more dairy animals, which might be due to their first priority for
their agricultural or horticultural activities. This is in agreement with the findings of [4] in Goa. The
average wet land holding was 1.18 acres whereas none of the farmers in Vellore district had dry
land holding. The present findings almost coincide with reports of [5] in Pithoragarh district of
Uttarakhand. Among the soil type, about 75 per cent of the land area was red loamy soil and 25 per
cent was black soil in Vellore district.
Table 1 Demographic status of dairy farmers in the study area of Vellore district
Agro-Climatic Zones North Eastern Zone
District Vellore
No of sample dairy farmers surveyed
32
(100)
Average no of family members 4.0
Primary occupation
Agriculture 3 (09.37)
Dairying 23 (71.88)
Others 6 (18.75)
Type of farmer
Landless Agricultural Labourer (LAL) 12 (37.50)
Marginal Farmer (MF) 18 (56.25)
Small Farmer (SF) 0
Large Farmer (LF) 2 (06.25)
Average land holding (acres)
Wet 1.18
Dry 0
Total Holding 1.18
Soil type
Laterite 0
Red loamy 24 (75.00)
Black 8 (25.00)
Aluvial 0
Literacy level
Iliterate 14 (43.75)
Primary 8 (25.00)

International Conference on INDIA 2030
213 Manonmaniam Sundaranar University, Tirunelveli
Secondary 4 (12.50)
Collegiate 6 (18.75)
Economic status
Earner 24 (75.00)
Dependant 8 (25.00)
Average family income (Rs/Annum) 98687.50
Figures in the parenthesis indicate per cent to the total. MF-Marginal Farmer (≤ 2.5 acres); SF –
Small Farmer (2.6 to 5.0 acres) LF - Large Farmer > (5.0 acres)
Literate farmers were 56.25 per cent in the study areas. The literacy levels were categorized as
primary, secondary and collegiate, constituted about 25.00, 12.50 and 18.75 per cent, respectively.
Comparatively similar findings were mentioned by [6] with dairy farmers of Chennai districts,
Tamil Nadu and [7] with Khillari cattle owners of Satara and Sangli districts of Maharastra. About
one-third of the farmers in the study areas of Vellore district were earner with the average annual
income of Rupees. 98687.50 per family and one-fourth were dependent. It showed that majority of
the farmers are income generators.
Status of dairy animals
The number of indigenous cows as percentage of total cows was very low as compared to
thecrossbred population (Table 2), which indicated that there is awareness among the dairy
farmers to keep optimum number of good cows instead of more number of low producing non-
descript animals. Very few dairy farmers were opted for female buffaloes, which might be
attributed to the more number of marginal dairy farmers of the state [8] but in contrast to the increase
in buffalo population at national level [9]. The majority of the animals were farm born since the
surveyed house hold in the study areas had animal husbandry as their traditional occupation.
Hence, they produce the animal in the farm itself instead of purchasing outside. The selected
households had fairly long experience in dairy farming and majority of the farmers had more than
two decades of experience in milk production activity, which shows that many farmers in rural
areas have been integrating their crop and milk production activities. More than half (56.25 %) of
the farmers provided semi pucca house to the animals since number of holdings were high and
around three-fourth of the farmers in Vellore district considered animal husbandry as their primary
occupation and one-fourth (25 %) of the farmers provided kutcha house and only 18.75 per cent
provided pucca house. Majority of the cattle (93.75 %) were provided with own housing. The
system of rearing followed by most of the farmers was semi intensive system of rearing. This is in
accordance with the findings of [5] in Pithoragarh district of Uttarakhand. In Vellore district,
particularly in Ranipet block all the animals were sent for grazing nearer to Ranipet Lake since
many households were Landless Agricultural Labourer in this region might be the possible reason
for rearing the animal under semi intensive system of management. Farmers in Vellore (50 %)
district reported that the quality of milk and shelf life were mostly affected. This might be due to
contamination of water from the seepage of industrial effluent mixing with ground water and other
water sources.
Table 2: Husbandry practices followed in the study area District Vellore No of sample dairy farmers 32 (100) Average herd size Cross bred 6.79 Non-Descript 0.7 Buffalo 1.67

Vol. 5 Special Issue 3 August 2017 ISSN: 2320-4168
214 Shanlax International Journal of Commerce
Conclusion
The farmers in the study areas are moving
towards rearing of crossbred animals. Dairying
was the primary occupation by the majority of
the household (71.88%) particularly marginal
farmers with more than 50% of literacy level.
Industrial pollution reflected in dairying and
affected the quality of the milk. Overall
development of farming community based on
dairy animal population, determines the
sustainability and socio-economic status of the
farmers.
Acknowledgement
The author is grateful to Tamil Nadu
Veterinary and animal Sciences University for
the facilities provided during the study and
permitting me to pursue Ph.D. programme on
part-time basis. The author is thankful to Dr
Saraswathy, Assistant Professor, Vellore who
helped in identifying the farmer and collection
of field data.
References
1. Naik PK, Swain BK, Chakurkar EB et al. Assessment of potential animal and poultry feed
resources in Goa. Anim Nutr Feed Techn. 2012; 12: 127–133p.
2. Widodo MW, Jong DR, Udo HMJ. Small scale dairying in three farming systems in East Java I.
Farmers income and household characteristics, Asian Australas. J. Anim. Sci.1994; 7(1): 19-29p.
3. Singh BP, Sharma MC, Rupsi,T. Feeding resources and management among poor livestock
keeper: A field study in linkage villages, Indian J Anim Sci.2009; 79: 1263–1264p.
4. Naik PK, Dhuri RB, Swain B K, et al. Analysis of existing dairy farming in Goa. Indian J Anim Sci.
2013; 83: 299-303p.
5. Pundir RK, Singh PK, Sharma D, et al. Hill cattle of Pithoragarh district of Uttarakhand. Indian J
Anim Sci. 2012; 82(12): 1591-1593p.
Milch animal details Total no of animals in the survey farms 270 (100) Farm born 220 (81.48) Purchased 50 (18.52) Experience in dairy farming Traditional 20 (62.50) <10 yrs 12 (37.50 Animal housing Own 30 (93.75) Lease 2 (06.25) Type of housing Pucca 6 (18.75) Semi pucca 18 (56.25) Kutcha 8 (25.00) System of rearing Intensive 6(18.75) Semi intensive 22 (68.75) Extensive 4 (12.50) Constraints perceived by the dairy farmers Milk quality & shelf-life 16 (50.00) Repeat breeder 4 (12.50) Nervous signs 1 (3.13) Digestive disorder 11(34.37) Figures in the parenthesis indicate per cent to the total

International Conference on INDIA 2030
215 Manonmaniam Sundaranar University, Tirunelveli
A STUDY ON CREDIT APPRAISAL SYSTEM OF SAKTHI FINANCE LIMITED, COIMBATORE
WITH SPECIAL REFERENCE TO COMMERCIAL VEHICLES
Mr. S. Sivakumar, MBA, UGC-SET
Assistant Professor of Business Administration, Manonmaniam Sundaranar University College,
Cheranmahadevi, Tirunelveli District
Mrs. R. Soniya, MBA
Assistant Professor of Business Administration, Manonmaniam Sundaranar University College,
Cheranmahadevi, Tirunelveli District
Abstract
The company is a Non-banking Financial Company (NBFC) engaged in providing finance to commercial vehicles, trucks and equipments. It accepts time deposits/ non cumulative deposits from the public and also avail loans from banks. The money raised from various sources is lent to the customers. As a financial intermediation business, the ability of any company to select a right borrower is the critical success factor. If money is lend to sticky customer, the company may end up with higher non performing asset (NPAs). As the company is engaged in retail loans, it cannot totally avoid bad debts. The bad debit has to restrict to optimum tolerable level. Hence selecting a credit worthy customer or avoiding sticky advances is an important factor for successful running of a finance company. The research entitled “A Study on Credit Appraisal System of Sakthi Finance Ltd., Coimbatore”. With primary objective to analyze the various factors involved in appraising the credit proposals of the customers. The credit proposals are given by many type of customers with various background and capabilities. The quality of a customer has t be assessed based on his intentions to pay and “capacity to pay”. Various factors will have to be assessed and finally a decision has been taken. The study based on the secondary data obtained from customers files from the operations department. It is might be that overall lending functions of the company is in satisfactory level. The weightage that will be obtained through the statistical analysis could be used for taking lending decision. The study focuses on 250 customers belonging to commercial vehicles segment who were not found regular in their payment of their equated monthly installments. The 28 major factors under consideration to assess the credit worthiness of the customer are listed in page number. These factors differ from one customer to another customer. Even though various factors are being analyzed for each and every proposal, the relevance of each of these factors and the degree of weightage to be given to each factor has not been studied and used by the company. Hence an attempt will be made to understand the influence of various factors on the quality of the accounts and also given weightage to factors which are closely related to repayment behavior of the customers. Primarily chi- square test was used to find the significance of relationship between number of dues and other factors, from which about 6 insignificant factors were eliminated and remaining 22 factors were considered for correlation analysis. From the correlation analysis among 22 highly significant factors, 15 factors which are highly and moderately correlated which were considered for regression analysis to find their weightage. The weightage of these 15 factors shows the proportion of contribution of those factors over the repayment behavior.
Introduction
The Indian Economy is growing through a period of rapid "Financialiation". Today a wide range
of financial institutions, through plethora of customer with friendly financial products, is conducting
the "intermediation". Repeated evaluation of the role of NBFCs by study group set up periodically
but the Government has confirmed, "That NBFCs usefully supplement the activities of banks in the
fields of both deposit mobilization and leading. NBFCs are capable of playing a dynamic role in the
economy. Finance is regarded as the life blood of the business enterprise. This is because in the
modern money oriented economy, finance is one of the basic foundations of any kind of economic
activity. It is the master key, which provides access to all sources for being employed in

Vol. 5 Special Issue 3 August 2017 ISSN: 2320-4168
216 Shanlax International Journal of Commerce
manufacturing and merchandising activities. It has been rightly said that business needs money to
make more money.
An Overview of Non – Banking Finance Companies
The role of NBFCs is not different from that of Bank mobilizing money from people with the
promise of repaying with interest. No wonder that nearly 40000 NBFCs set up establishments to
mobilized money with a promise of high interest, unfortunately, many of them fly – by night
operators. The Indian Economy is growing through a period of rapid "Financialiation". Today a wide
range of financial institutions, through plethora customer friendly financial products, is conducting
the "intermediation". Repeated evaluation of the role of NBFCs by study group set up periodically
the Government has confirmed, "That NBFCs usefully supplement the activities of banks in the fields
of both deposit mobilization and leading. NBFCs are capable of playing a dynamic role in the
economy.
Meaning Of an Non Banking Finance Company
An Non-Banking Finance Company (NBFC) is a company under the Companies Act, 1956 and is
engaged in the business of loans and advances, acquisition of shares / stock / debentures /
securities issued by Government or local authority or other securities of like marketable nature,
leasing, hire – purchase, insurance business, and chit business. But it does not include any
instruction whose principal business is that of agriculture activity, sale / purchase / construction of
immovable property. A non-banking institution which is a company and which has its principal
business of receiving deposits under any scheme or arrangement or any other manner, or lending in
any manner is also a non – banking financial company.
Profile of Sakthi Finance Limited
Sakthi Finance Limited was incorporated on 30th March 1955 under the Company's Act in the
name of "Pollachi Credit Society" as Private limited company for in-house financing arm for TELCO
dealership. The company made its first public issue in 1984. Sakthi Finance Limited is One of
India's oldest NBFCs, Founded in the year 1965.
1. Part of the Rs 1200 crore Sakthi Conglomerate which was founded in the year 1935.
2. The Sakthi Group has a leading presence in Finance Agro foods, Dairy, and Transport.
3. A deep understanding of the transport industry has made Sakthi one of the most trusted names
in financing for commercial vehicles.
4. A wide variety of loans for cars, commercial vehicles, plant machinery and equipment are
available.
5. One of the first companies to introduce used vehicle financing.
6. Sakthi Finance Ltd., has 20 branches spread all over India.
Objectives of the Study
Primary Objective
The primary objective of the study is to analyze the credit appraisal procedure of the Sakthi
Finance Ltd and identify the closely related factors involved in credit appraisal process of
commercial vehicle loans. On identification of major factors of credit worthiness of a borrower,
assess the weight for each of the factors.
Secondary Objective
1. To study about Credit Appraisal Processes (CAP) of the company.
2. To suggest any additional relevant factors to strengthen the credit appraisal process of the
company.
3. To provide inputs to build software for automatic generation of credit appraisal decisions.

International Conference on INDIA 2030
217 Manonmaniam Sundaranar University, Tirunelveli
Statement of the Problem
There are different type of factors are involved in the credit appraisal process of commercial
vehicle loans .The company want to identify the important factors in this process. The factors are
being analyzed for their influence. An attempt is made to understand the degree of influence of
various factors on the quality of the borrowal accounts. 250 arrear borrowers were selected for the
study. They are grouped into 5 categories as under:
1. One arrear set
2. 2 to 3 installment arrear set
3. 4 to 6 installment arrear set
4. 7 to 12 installment arrear set
5. Above 12 installment arrear set
Through application of statistical tools the relationship between the number of arrears and the
factors considered for the sanction of the loan analyzed. Based on such analysis, appropriate
weightage will be suggested for each factor that are considered for sanction of the proposal.
Type of Study
The study is based on descriptive analysis of data furnished in the proposal records that were
submitted to the company for sanction of loan. The research design used in the study is descriptive
research design. A descriptive study is undertaken in order to ascertain and able to describe the
characteristics of the variables of interest in the situation. Descriptive studies that present data in a
meaningful form thus help to
1. To understand the characteristics of a group in a given situation.
2. To think systematically about aspects in a given situation.
3. To offer idea for further probe and research and
4. To help to make certain simple decisions.
Method of Data Collection
Data collection instruments
The instrument used to collect data for this study was structured questionnaire. The data
required for the study has been collected from the secondary source. The relevant data are taken
from the records of various customer proposals. The data is to be collected through a suitable
questionnaire and then to be converted into conventional way for the purpose of the research. The
data collection tool is “Questionnaire”.
Tools of analysis
1. Percentage analysis,Chi- square analysis,Correlation analysis &Multiple regression.
Chi-Square Analysis
Chi – square analysis was carried out to find whether number of arrears that is caused by the
customers is influenced by the following factors
1. Age of the borrower,Income range,Marketing officer ratings,Branch officer ratings,Customer
ratings (New & exiting),Vehicle model,Track record company,Track record of customer,Old loan
clearing period,Guarantor rating (New & Exiting),Immovable asset (Customer &
Guarantor),Similar Line Guarantor,Track record of Guarantor,EMI commitment,Total
Expenditure of customer,Purpose of loan,Loan amount,EMI,Quantum percentage,Funding
Quantum,Net Income EMI Ratio,Other income EMI Ratio,Insurance Cover Average bank
balance,& Second line supporter
Inference from Chi – Square Tests
From the above chi-square analysis it can be inferred that among the 28 factors considered the
following 15 factors were found to be influencing the repayment behavior of the borrower.

Vol. 5 Special Issue 3 August 2017 ISSN: 2320-4168
218 Shanlax International Journal of Commerce
1. Income range
2. Marketing officer ratings
3. Branch officer ratings
4. New Customer ratings
5. Existing customer ratings
6. Vehicle model
7. Track record of customer
8. Old loan cleared
9. New Guarantor rating
10. Existing Guarantor rating
11. Customer Immovable asset
12. Guarantor Immovable asset
13. Track record of Guarantor
14. EMI commitment
15. Total Expenditure of customer
Of the above 15 factors, it is derived to measure degree of influence on the repayment behavior
by borrower. Correlation coefficient analysis is used for this purpose.
Inference from Correlation Coefficient Analysis
From the correlation coefficient analysis the under mentioned factors with high degree of
correlation coefficient 0.25 and above (positive or negative) are considered for multiple regression
analysis to find their strength of relationship with number of arrears.
1. Income range (-0.759)
2. Marketing officer ratings (0.754)
3. Branch officer ratings (0.486)
4. Customer ratings (0.731)
5. Vehicle model (0.525)
6. Track record (0.926)
7. Old loan cleared (0.317)
8. Emi commitment (0.837)
9. Immovable asset (0.470)
10. Loan amount (0.896)
11. EMI (0.784)
12. Quantum percentage (0.517)
13. Net Income EMI ratio (-0.694)
14. Other income EMI ratio (-0.367)
Findings from Percentage Analysis
The customers within age group of 25-35 years and 36-45 years were interested in availing
more number of loans (36.8 %) followed by 16% in 46-55 age group ,8.4% in <25 years and 2%
above 55 years.
The customers with income group of above 2 to 4 lakhs were interested in availing more
number of loans (41.6%) followed by 23.2 % above 4 to 6 lakhs, 18.4 % above 6 lakhs and 16.8
% between 1 to 2 lakhs.
The AAA Branch officers dispersed more loan to of customers (50.4%) followed by AA for
29.2%customers, A for 20.4% customers.
The AAA marketing officer were found to have appraised loan to more number of customers
(50.8%) followed by 29.6 % in AA and 19.6 % in A .

International Conference on INDIA 2030
219 Manonmaniam Sundaranar University, Tirunelveli
The AAA customers avail more number of loans (54.8 %) followed by AA customers (24.8%),
new customers (14.4%), A customers (6%).
The new customers are denoted by BBB, BB and B. The BBB rated group of new customers
were interested in availing more number of loans (9.6%) followed by BB rated group customers
(7.2%), B rated group (3.2%).
The vehicles are rated as positive, low and negative based on its market value. The positively
rated vehicles are purchased by more number of people who are interested in getting loans
(58%) followed by low rated vehicles 36 % and negativey rated vehicles (6.8%).
The group of people with good track record from a reputed company were interested in getting
loans (80.8 %) followed by other private / limited companies (16.8%), The people without
track record discouraged to avail loans.
It can be inferred from the percentage analysis that young and medium income people are more
interested in availing more loans. The AAA rated branch officers, market officer, customers; new
customers (BBB) are interested in availing more loans. Mostly positively rated vehicle owners are
availing loan in more numbers.
Findings from Regression Analsysis
The regression analysis that was used to find the weightage of 15 most influencing factors
obtained through chi-square and correlation analysis contributed about 86.2 % which were
grouped as under,
From the above table it
can be inferred that loan
features and earning capacity
of borrower influences the
maximum (42 %) in
repayment behavior. Rating
and customer profile
influences 17 % each. While
the ownership of the asset
has the minimum influences
of 10 %.
Suggestions
Credit rating should be based on the weights as obtained from the analysis for each customer.
The weightage of his credit rating could be obtained based on the data furnished by him. The range
of the rating and the credit rate are suggested below
To encourage high repayment by creditor a differential
interest rate can be administered. The difference can be 0.1
% from A to A++. Those at grade D should be dealt with
caution in appraising their loan proposal.
Conclusion
Efficient management of every business enterprise is closely linked with efficient management of its finance. In the present scenario, the Non-Banking Finance Companies (NBFCs) have a quite significant role to play with RBI has already placed substantial important to further development of the NBFC sector along with the prudent lines. Sakthi Finance Limited is one among the leading Non-Banking Finance Companies.
Group of Factors Individual factors % Group
Weightage %
Ratings
Market officer Rating 8
17 Branch officer rating 3
Customer Rating 6
Customer Profile
Vehicle model 4
17 Track Record 11.2 Old loan cleared 1.8
Asset & Liability of customer
EMI Commitment 8.4 10.3
Value of Immovable asset 1.9
Loan Features
Loan Amount 10.4
21.9 EMI 8.2 Quantum Percentage 3.3
Earning Capacity
Earning from business 7.2
20 Income EMI ratio 6.3
Other income EMI ratio 1.4
Average bank deposit 5.1 Total 86.2
Range of weight Credit Rate
Above 75 % A++
60 – 75 % A+
50- 60 % A
Below 50 % D

Vol. 5 Special Issue 3 August 2017 ISSN: 2320-4168
220 Shanlax International Journal of Commerce
A STUDY ON CONSUMER BEHAVIOURS TOWARDS JEWELS BUYERS
IN KANYAKUMARI DISTRICT
G. Baby Alex
Research scholar, Department of Commerce, Manonmaniam Sundaranar University
Dr. B. Revathy
Professor & Head, Department of Commerce, Manonmaniam Sundaranar University
Introduction
Ancient India culture shows the relationship between art and gold. The word jewellery is
derived from the word “Jewel” which was anglicised from the old French ‘Jovel’ in around in 13th
century. Gold was just a safe investment for small town people. They used to buy heavyjewellery
during the marriage season. But now they also look for genuine, trend\ and designer jewellery. This
is evident in their offerings, collection and merchandising campaigns. The Indian jewellery market
is undergoing a gradual change from traditional to branded formats. Consumers are more quality
conscious than ever before. In India the major market is jewellery market. The significance of
jewellery in the country is evident from the fact that on many auspicious occasions, jewellery forms
a part of gifts. Gold is one of most valuable and attractive metal referred by Indian consumers
especially women. Increase of the gold price is a big problem faced by the women consumers of
gold. In the market there are largely fragmented and unbranded jewellery shops. In spite of product
quality and services, people are still buying gold jewels form local retailers. The income level of the
buyers has important contact on the type of jewellery purchased by them. The choice of jeweler has
significant relation with the geographical site of buyer. The knowledge about the branded jewelers
is due to the advertisements floating on air or there are other sources of information, this study to
will be helpful to understand the attitude of consumers especially women towards gold jewellery.
Consumer Satisfaction
Every human being is a consumer of different product. If there is no consumer there is no
business. Therefore consumer satisfaction is very importantto every business person.
The consumer satisfaction after purchase depends on the product performance in relation to
his/her expectations. Philip Kilter(2008) observed that satisfaction is a person’s feeling of pressure
or disappointment resulting from perceived performance (outcome) to his or her expectations.
Consumer’s satisfaction is the level of a person’s felt state resulting from comparing a products
perceived performances (outcome) is relation to the person s expectations. This satisfaction level is
a function of difference between perceived performance and expectations.If the product
performance exceeds expectations, the customer is highly satisfied or delighted, if the performance
matches the expectation, the customer is satisfied. If the product performance falls short of
expectations the customer is dissatisfied. Consumer satisfaction or dissatisfaction is the feeling
derived by the consumer when he compares the products actual performance with the performance
that he expects out of it. Consumer makes their expectations from the service quality, delivery,
services. Communications, past experience and references. These all are to be judged correctly by
the management expectations. If any of these factors are wrongly interpreted then the expected
level of’ consumer satisfaction cannot he reached.

International Conference on INDIA 2030
221 Manonmaniam Sundaranar University, Tirunelveli
Statement of the problem
The current rate of inflation,inflation volatility, world income, the dollars external value a US
depreciation of the effective dollar exchange rate will tend topush up the US dollarprice of gold. Real
interest rate, Gold’s Beta, Political risk, and Official s sector activity are the factors influencing the
price of jewel. Gold is a highly cherished and valued commodity. Even in jewellery products
branding exists. Many factors may be influencing the consumers towards branded jewellery
products. What makes the consumers to purchase branded jewellery products forms part of the
present study. In the market there are largely fragmented and unbranded jewellery shops. In spite
of product quality and services, people are still buying gold jewels form local retailers. The income
level of the buyers has important contact on the type of jewellery purchased by them. The choice of
jeweler has significant relation with the geographical site of buyer. The knowledge about the
branded jewelers is due to the advertisements floating on air or there are other sources of
information also. Jewellery has been an integral part of the Indian culture and civilization since
ancient history. They were in demand and fashion since ancient civilization as Harappa and
Mohanjadora. In India gold jewellery is not only used as an adornment, but it is also used as an
investment which acts as a security in times of contingency. Gold jewellery is the second preferred
investment next to bank deposits. Gold jewellery can be purchased either from goldsmiths or from
jewellery marts. Goldsmiths make ornaments, especially traditional jewellery.
Objective of study
To analyse the factors which are motivate to buy the jewels.
To analysis the level of satisfactory of the jewels.
To study the shopping behaviour of women towards gold jewellery in Kanyakumari district
Sampling buyers
The researcher collected data from 50 respondents from Kanyakumari district on the basis of
random sampling method.
Collection of the data
The required information has been: collected through primary data. Primary data were
collected from the respondents by way of interview schedules, the researcher personally interacted
women respondents to understand theirbuying behaviour.
Factor Analysis
Factor analysis is a procedure that takes a largest number of variables or objects and searches
to see whether they have a small number of factors in common which account for their inter
correction (ex) we might attribute the high association between grades in business administration
courses to the factors of intelligence or the association between certain intelligence or the
association between certain chemical attribution of coffee to the factor of activity.
Factor analysis is used to analyse the factors affecting purchase of jewellery. The method is
being applied mostly by using standard variables,
Zy = j
xjxi 2)(
The multivariate statistical technique which is applied to find out the interdependence of the
variables, which are in internal scale is called as factor analysis. It is very familiar to narrate the
various variables involved in the particular context into meaningful factors. In the present study the
factor analysis had been used to narrate the variables related to the sources of inspiration to start
the enterprising and various expectations to improve their efficiency in enterprising.
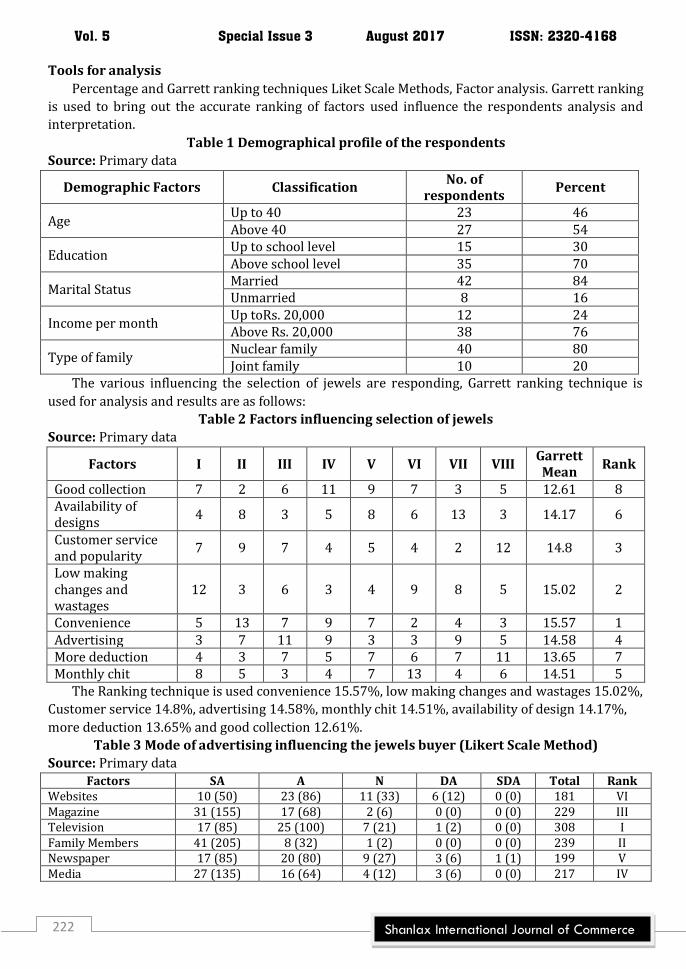
Vol. 5 Special Issue 3 August 2017 ISSN: 2320-4168
222 Shanlax International Journal of Commerce
Tools for analysis
Percentage and Garrett ranking techniques Liket Scale Methods, Factor analysis. Garrett ranking
is used to bring out the accurate ranking of factors used influence the respondents analysis and
interpretation.
Table 1 Demographical profile of the respondents
Source: Primary data
Demographic Factors Classification No. of
respondents Percent
Age Up to 40 23 46 Above 40 27 54
Education Up to school level 15 30 Above school level 35 70
Marital Status Married 42 84 Unmarried 8 16
Income per month Up toRs. 20,000 12 24 Above Rs. 20,000 38 76
Type of family Nuclear family 40 80 Joint family 10 20
The various influencing the selection of jewels are responding, Garrett ranking technique is
used for analysis and results are as follows:
Table 2 Factors influencing selection of jewels
Source: Primary data
Factors I II III IV V VI VII VIII Garrett Mean
Rank
Good collection 7 2 6 11 9 7 3 5 12.61 8 Availability of designs
4 8 3 5 8 6 13 3 14.17 6
Customer service and popularity
7 9 7 4 5 4 2 12 14.8 3
Low making changes and wastages
12 3 6 3 4 9 8 5 15.02 2
Convenience 5 13 7 9 7 2 4 3 15.57 1 Advertising 3 7 11 9 3 3 9 5 14.58 4 More deduction 4 3 7 5 7 6 7 11 13.65 7 Monthly chit 8 5 3 4 7 13 4 6 14.51 5
The Ranking technique is used convenience 15.57%, low making changes and wastages 15.02%,
Customer service 14.8%, advertising 14.58%, monthly chit 14.51%, availability of design 14.17%,
more deduction 13.65% and good collection 12.61%.
Table 3 Mode of advertising influencing the jewels buyer (Likert Scale Method)
Source: Primary data
Factors SA A N DA SDA Total Rank Websites 10 (50) 23 (86) 11 (33) 6 (12) 0 (0) 181 VI Magazine 31 (155) 17 (68) 2 (6) 0 (0) 0 (0) 229 III Television 17 (85) 25 (100) 7 (21) 1 (2) 0 (0) 308 I Family Members 41 (205) 8 (32) 1 (2) 0 (0) 0 (0) 239 II Newspaper 17 (85) 20 (80) 9 (27) 3 (6) 1 (1) 199 V Media 27 (135) 16 (64) 4 (12) 3 (6) 0 (0) 217 IV

International Conference on INDIA 2030
223 Manonmaniam Sundaranar University, Tirunelveli
Advertising in websites VI, Magazine III, Television I, Family members II, Newspaper I and
Media IV
Findings and Suggestions
Kadum denotes the purity of gold. KDM has habitually used in Joining of gold jewellery for its
good properties of liquidity and meting at lower temperature. Purity of gold represents the
percentageof gold in the metal. KDM has a logo and certificate with KDM mark. The real gold mark is
hallmarked logo. Government of India has identified BIS a sole agency in India to operate this
scheme is voluntary in nature and operating under BIS Act, Rules and regulations. The BIS
hallmarking scheme has been aligned with international criteria on hallmarking (Vienna convention
1972) as per this scheme. The BIS certified jewelers can get their jewellery hallmarked many of the
BIS recognized Assaying and hail marking centre.
1. The above table show that respondents to working percentage with age, education, income per
month material status, type of the family.
2. Majority of respondents do not prefer to participate in gold saving schemes. The retailers
should motivate respondents and popularize the scheme to attract their customer.
3. The majority customer to gold price and models and few to advertising in television, family
members, magazine, etc.
Conclusion
The study reflects the attitude of buyer behaviour towards gold jewels. As there is high
potential for gold jewels from the buying point of view, the gold jewellery should effect the above
Suggestions and make use of the potential market.

Vol. 5 Special Issue 3 August 2017 ISSN: 2320-4168
224 Shanlax International Journal of Commerce
WORK- LIFE BALANCE AMONG TEXTILE RETAIL EMPLOYEES IN TIRUNELVELI DISTRICT,
TAMIL NADU
Dr.P.Jegatheeswari
Research Supervisor & Associate Professor, Bhaktavatsalam Memorial College for Women, Korattur, Chennai
Ms.M.Padma
Research Scholar, M.S.University, Tirunelveli
Abstract
In the last few decades, there has been a dramatic increase in the amount of research devoted to
understanding the linkages between work and family and/or personal life. The term ‘Work-life Balance’ was first
coined in 1986 in reaction to the unhealthy choices that many Americans were making in favour of the work
place, as they opted to neglect family, friends and leisure activities in the pursuit of work goals. A balanced life is
one where we spread our energy and effort - emotional, intellectual, imaginative, spiritual and physical – between
key areas of importance. The neglect of one or more areas, or anchor points, may threaten the vitality of the
whole.
Keywords: Family and work satisfaction , family – work conflict , work – family conflict and work life balance
flexibility.
Introduction
Employees with work-life balance feel their lives are fulfilled both inside and outside of work
(Byrne, 2005), and they experience minimal conflict between work and non-work roles. Those who
achieve this balance tend to have higher levels of satisfaction with their jobs and life in general, as
well as lower levels of stress and depression. From an employer’s viewpoint, encouraging work-life
balance may attract new hires, help re-duce turnover and absenteeism, and increase the chances of
employees voluntarily engaging in “pro-social” behaviors that rise above and beyond their job
requirements. Nevertheless, findings are mixed with respect to effects of employee work-life
balance on the company’s bottom line. For example, having family-friendly work policies, when a
firm uses good management practices overall, does not detract from profitability, but may not
always increase profits. In sum, evidence suggests a work strategy of “running yourself ragged” has
costs both for meeting performance goals and enjoyinglife; the employee and the organization
benefit most when workers experience greater balance between what they do on and off the clock.
Objectives
1. To know the demographic profile of retail textile employees in Tirunelveli district.
2. To study the factors & sources that influence stress among the retail textile employees.
3. To find out the problems faced by women employees and their level of work life balance in
retail textile industry.
4. To suggest / recommend the effective mitigating mechanism to balance their work - life and
reduce the stress level to the employees of retail textile industry.\
Research methodology
Pilot Study and Pre-Testing
A preliminary investigation was undertaken by contacting 50 employees working in textile
retail shops in Tirunelveli district to identify the important variables regarding stress and the

International Conference on INDIA 2030
225 Manonmaniam Sundaranar University, Tirunelveli
factors influencing stress. The responses are obtained from the employees on organizational
facilities, their level of work life balance and management styles followed in the organisations and
its direct impact on individual and organisational efficiency. The purpose of the pilot study is to test
quality of the items in the interview schedule and to confirm the feasibility of the study. This
preliminary investigation is conducted in all levels of the employees. The convenience sampling
method, Cronbach alpha methods are applied.
Main Study
The primary data were collected for the research by serving a well structuredinterview
schedule with 6 sections.section 1 for the interview schedule is framed to obtain the general
information about the employees and shops, section II deals with different types of organizational
facilities and their level of quality. The section–III of the interview schedule is designed in Likert’s 5-
point scale, ranging from 5-strongly agree, 4-agree, 3-neutral, 2-disagree, and 1-strongly disagree
for evaluating the employees level of work life balance . The Section-IV describes and measures the
stress level of employ.es both seasonal and non-seasonal. The section–V of the interview schedule is
designed in Likert’s 5-point scale, ranging from 5-strongly agree, 4-agree, 3-neutral, 2-disagree, and
1-strongly disagree to identify the management style of Tirunelveli textile retail shops. Section VI
measures consequences of stress especially in productivity, section VII contains the physical
problems due to stress and finally section VIII is having healthy ways followed by employees to
reduce stress as well as their expectation from management to reduce their stress level.
Sample Selection
The non probability sampling method is applied to collect the primary data. From that
convenience sampling method is adopted to obtain the responses from the employees by the
researcher.
Sample Size
A sample size of 750 respondents was selected on convenience sampling method. Out of 750
respondents chosen for the study, 710 of them were found usable. The samples of this study
encompass all types of employees and it works out to 710.
Data Analysis
The study has been done on the basis of both primary as well as secondary sources of data. The
data collected among the employees through survey constitute primary and information gathered
through books, journals, magazines, reports, dailies consisting of secondary data. The data collected
from both the sources were scrutinized, edited and tabulated. Further, the processed data were
analysed using statistical package for social sciences (SPSS 20.) and other computer packages. The
following statistical tools were used in the study to deduce the results about data variables:
1. Descriptive analysis
a. Percentile
b. Mean
c. Standard deviation
2. Independent t test
3. Paired t test
4. ANOVA
5. Exploratory Factor analysis
6. Weighted ranking method
Factor Analysis
Eighteen items were taken for exploratory factor analysis. Before attempting the factor analysis
to assess the individual fitness level of the variables, Measure of Sampling adequacy (MSA) statistics

Vol. 5 Special Issue 3 August 2017 ISSN: 2320-4168
226 Shanlax International Journal of Commerce
was obtained. In SPSS, MSA levels are printed on the diagonal of the anti-image correlation matrix.
Variables which were having MSA levels less than .6 were eliminated in iterations.
Kaiser-Meyer-Olkin Measure of Sampling Adequacy was employed to examine the
appropriateness of the data for factor analysis. High values (between 0.5 and 1)indicate that the
factor analysis is appropriate. Further, Bartlett’s Test of Sphericity is a test statistics used to
examine the hypothesis that the variables are uncorrelated in the population. From table No 1 it is
clear that the data used for the study is conducive for performance of factor analysis. It is also
evident from the table that the variables are significantly related to the population. SPSS v20.0 was
used to conduct a Principal Component Analysis with varimax rotation for independent variables
and the results are shown in table 1 wherein four factors emerged with good construct loadings
above 0.5. The table also indicates the variance explained by each of the factors in the construct and
the eigen values are all above 1.00.finally, the four factors are created from 18 variables.
The four factors are family and work satisfaction , family – work conflict , work – family conflict
and work life balance flexibility. For these four factors, researcher conducts the reliability test with
the help of cronbach Alpha method and ensure the cronbach Alpha values are greater than 0.60 for
each factor.
Table 1
KMO and Bartlett's Test
Kaiser-Meyer-Olkin Measure of Sampling Adequacy. .872
Bartlett's Test of Sphericity Approx. Chi-Square 5811.676
Df 153
Sig. 0.000
Table 1 Result of Factor analysis
Factor 1 : Family and work satisfaction Q.No Items Loadings 1 In most ways my family-life is close to my ideal .740 2 The conditions of my family-life are excellent .721 3 I am satisfied with my family life .709 4 Generally speaking, I am very happy with my work .703 5 I never think of leaving this job .504 6 I am generally satisfied with the kind of work I do in my job .503 Variance explained (%) Eigen value Cronbach Alpha value
24.755 8.417 7.91
Factor 2 : Family – work conflict
Q.No Items Loadings 7 The demands of my family or spouse/ partner interfere with work-related
activities .790
8 I have to put off doing things at work because of demands on my time at home .769 9 Things I want to do at work don't get done because of the demands of my family
or spouse/partner .732
10 Family-related strain interferes with my ability to perform job-related duties .730 Variance explained (%) Eigen value Cronbach Alpha value
13.581 4.618 7.32

International Conference on INDIA 2030
227 Manonmaniam Sundaranar University, Tirunelveli
Factor 3 : Work - family conflict Q.No Items Loadings 11 The demands of my work interfere with my home and family life .835 12 The amount of time my job takes up makes it difficult to fulfil my family
responsibilities .714
13 Things I want to do at home do not get done because of the demands my job puts on me
.687
14 My job produces strain that makes it difficult to fulfil family duties .538 15 Due to work-related duties, I have to make changes to my plans for family
activities .515
16 unable to enjoy the normal day-to-day activities .501 Variance explained (%) Eigen value Cronbach Alpha value
11.128 3.784 6.77
Factor 4 : Work-life balance flexibility
Q.No Items Loadings 17 child/ Elder care - e.g. the company provides financial support for
child/elder care .831
18 Flexible time - e.g. part-time work, rostered hours, shifts .823 Variance explained (%) Eigen value Cronbach Alpha value
9.239 3.141 6.26
T-Test
The t test is used to know the presence of mean variations between two groups. Normally, this
test is applied to know existence of the differences between mean of two groups.
Null Hypothesis
HO - “There is no mean difference between the gender of respondents and the ability level of
work- life balance of textile retail employees in Tirunelveli District”.
To test the null hypothesis, the t test was applied and the results shown in the following table
Table 2 Relationship between the gender of respondents and the ability level of work- life
balance of textile retail employees in Tirunelveli District
Source: Computed Primary Data
SL. NO. Work – Life balance factors Male Female T-value
1 Family and work satisfaction 2.69 2.59 1.36NS
2 Family – work conflict 2.99 2.91 0.934NS
3 Work - family conflict 2.85 2.96 1.92NS
4 Work-life balance flexibility 3.5 3.17 3.57**
Note:
** denotes significant level at 1%
* denotes significant level at 5% NS denotes not significant.
It is evident from the table, ** since p value is less than 0.01, the null hypothesis is rejected at
1% level with regards to Work-life balance flexibility of textile retail employees in Tirunelveli
District. Hence there is significant mean difference between genders of respondents with regards to
Work-life balance flexibility of textile retail employees. The mean scores of male respondents (3.5)

Vol. 5 Special Issue 3 August 2017 ISSN: 2320-4168
228 Shanlax International Journal of Commerce
and female respondents (3.17) reveal that male respondents have better work-life balance
flexibility than female respondents. NS Since p value is greater than 0.05, the null hypothesis is accepted. Hence there is no
significant mean difference between gender of the respondents with regards to family & work
satisfaction, family-work conflict and work-life conflict.
T-Test
The t test is used to know the presence of mean variations between two groups. Normally, this
test is applied to know existence of the differences between mean of two groups.
Null Hypothesis:
HO - “There is no mean difference between the living area of respondents and the ability level of
work- life balance of textile retail employees in Tirunelveli District”.
To test the null hypothesis, the t test was applied and the results shown in the following table
Table 3 Relationship between the Living Area of respondents and the ability level of work-
life balance of textile retail employees in Tirunelveli District
SL. NO. Area of respondents Urban Rural t-value
1 Family and work satisfaction 2.34 2.76 3.098**
2 Family – work conflict 2.86 3.07 2.364*
3 Work - family conflict 2.87 2.90 0.444NS
4 Work-life balance flexibility 3.40 3.23 1.814NS
Source: Computed Primary Data
Note:
** denotes significant level at 1%
* denotes significant level at 5% NS denotes not significant
It is evident from the table, ** since p value is less than 0.01, the null hypothesis is rejected at
1% level with regards to family and work satisfaction of textile retail employees in Tirunelveli
District. Hence there is significant mean difference between living areas of respondents with
regards to family and work satisfaction of textile retail employees. The mean scores of rural
respondents (2.76) and urban respondents (2.34) reveal that rural respondents have better family
and work satisfaction than urban respondents. * since p value is less than 0.05, the null hypothesis
is rejected at 5% level with regards to family - work conflict of textile retail employees in Tirunelveli
District. Hence there is significant mean difference between living areas of respondents with
regards to family - work conflict of textile retail employees. The mean scores of rural respondents
(3.07) and urban respondents (2.86) reveal that rural respondents have better ability level of
balancing their family – work conflict than urban respondents. NS Since p value is greater than 0.05, the null hypothesis is accepted. Hence there is no
significant mean difference between living areas of the respondents with regards to work - family
conflict and work – life balance flexibility.
Summary of Findings, Suggestions and Conclusion
Findings
Work – Life balance
Four factors areconstructed through factor analysis. They are F1 is family and work
satisfaction, F2 is family – work conflict , F3 is work – family conflict and F4 is work life balance
flexibility.

International Conference on INDIA 2030
229 Manonmaniam Sundaranar University, Tirunelveli
Although, all the four factors of mean scores are around 3.00. The respondents have provided
highest mean score (3.3) for work – life balance flexibility and lowest score (2.64) for family and
work satisfaction. The result of t test confines that, the mean scores of male respondents (3.5) and
female respondents (3.17) reveal that male respondents have better work-life balance flexibility
than female respondents. The result of t test confines that, the mean scores of rural respondents
(2.76) and urban respondents (2.34) reveal that rural respondents have better family and work
satisfaction than urban respondents. Likewise, the mean scores of rural respondents (3.07) and
urban respondents (2.86) reveal that rural respondents have better ability level of balancing their
family – work conflict than urban respondents.
Conclusion
The researcher brings the problems of the employees to light such as poor relation among
colleagues, poor work-life balance for women employees, inflexibility of the working time women
employees. They face utmost difficulty in playing dual role i.e. work at home and industry. Women
employees have a lot of responsibilities than that of men employees. The burden of taking care of
the family falls on women.
Refernces
1. Anil Verma,”Realising the Korean dream for work-family balance, employer policies for
sustainable societies”, NHRD network Journal,2009,pp.29-52.
2. AnupKumar Singh and RichaAwasthy,”Work-Life Balance: causes, consequences and
interventions”,NHRD Network Journal,2009,pp.59-67.
3. Aryasri.A.R, Somanbabu.,”Impact of flexi-time as a work-life balance practice on employee
retention”, NHRD network Journal, July 2009, Pp.68-75.
4. Bachmann,k., “work life balance. Are employees listening? Ottawa: ConferenceBoard of Canada”,
2000.
5. Chen.Q.,” Research on work/family conflict of knowledge worker and its intervention strategies”,
unpublished masters dissertations, changing universities, China, 2006.
6. Cooke.F.L., ”Husband’s career first”, Renegotiating career and family commitment among
migrant Chinese academic couples in Britain work, Employment and society 21,1, 2007,
pp.47- 65.

Vol. 5 Special Issue 3 August 2017 ISSN: 2320-4168
230 Shanlax International Journal of Commerce
INFLUENC OF GREEN MARKETING MIX ON GREEN PRODUCTS PURCHASE INTENTION
OF CONSUMER: A MEDIATION EFFECT OF CONSUMERS’ ENVIRONMENTAL
CONCERN ATTITUDE
S.Shahul Hameed
Asst. professor, Dept. of Business Administration, Sadakathullah Appa College- Tirunelveli
M.Veeralakshmi
Research scholar of Commerce, M.S University – Tirunelveli
Abstract
Green marketing is a recent concept which has been adopted by consumers, organizations government all
over the world to save the natural resources & to protect the environment for the sustainable development of the
resources. The research purpose here is to find the mediation effect of environmental concern attitude of
consumers between companies green marketing mix strategies and its influence on consumer purchase intention
of green products. From literature review three factors were adopted for primary research such as green
marketing mix strategies, consumers’ environmental concern attitude and purchase intention of green products.
The factor of green marketing mix strategies of company were measured using four variables, likewise the factor
of environmental concern attitude of consumers were measured using our variables and also the factor of
purchase intention of consumers were measured using five variables, The primary research was done using
survey questionnaire using random sampling of 300 respondent in Tirunelveli city. The research reveals that
consumers with more environmental concern attitudes are more willing to purchase green products. The study
reveals that company managers & government should focus on increasing awareness & knowledge among the
consumers to accept the environment friendly products.
Keywords: Green product, purchase intention, mediator, consumer and environmental concern .
Introduction
Green marketing has come into effect as a result of environmental degradation caused by the
abundance of natural resources. Even though green marketing is not a completely new
phenomenon, the emergence of green consumerism and socially conscious consumers are strong
indicators of the green movement (Menon, Chowdhury and Jankovich, 1999; Sivadas, 1997).
Likewise, companies are slowly introducing green marketing into their business practices by
reducing the impact of production, manufacture and energy usage on the environment (Grant,
2008). Moreover, companies are using green marketing as a means for creating a competitive
advantage (Han, Hsu, and Sheu, 2010).
Green Marketing
Green marketing concept came in prominence in late 1980s & early 1990s, which incorporates
many activities like product modification, change in production process, change in packaging,
advertisement changes, etc. (Polonsky, 1994). According to Soonthonsmai (2007), green marketing
is defined as activities performed by environment concerned firms to deliver the environmentally
sound goods/services to provide satisfaction to consumers. A green marketing strategy for firms
was proposed by Harrison (1993) to influence the purchase decisions of consumers by positioning
green product benefits in minds of consumers. Green marketing is a management process to
identify, anticipate & satisfy the requirements of consumers/ society in more profitable &
sustainable way (Peatitie, 1995; Welford, 2000).

International Conference on INDIA 2030
231 Manonmaniam Sundaranar University, Tirunelveli
Green Consumers & Green Products
According to Ottman (1993), Green consumers actively seek & support the products which
satisfy their needs and have less impact on environment. Macdonald (2006) said that all consumers
are potentially green consumers. He added that when a consumer has option to buy two similar
kinds of products, he will tend to buy the environment friendly product among these two. Mainieri
(1997) suggests that women are more environmentally conscious to purchase green products.
Pickett (2008) found that market segments followed by demographic characteristics like age,
income, education are positively related to consumer attitude for environment. Green product is an
ecological or environment-friendly product. According to Shamdasami et al., (1993), green product
will not pollute earth, or deplore scarce resources, they will be recycled or conserved. Now a days,
being conscious for environment is not only an activist’s ideology but it is also a matter of
competition in market (McCloskey & Maddock, 1994). D’Souza (2004) mentioned that the green
vision being a reality needs to be functionally understood by the marketer to serve green
customer’s need.
Statement of the problem
Awareness about environmental issues is growing day by day. Product choice and buying
behaviour of products are changing every day. With regard to product attributes, environmental
consideration is the key factor influencing buying decision of green products among consumers.
The purchase decision is based on direct involvement in consumption of the products, whereas
knowledge and attitude are at the other end in the consumption of products. Hence, the study
focuses on examining the level of acceptability and reach of green products among consumers in the
market.
Objectives of the study
1. To measure the total effect on consumer’s purchase intention in relation with the green
marketing mix strategies.
2. To measure the direct and indirect effect of green marketing mix strategies on Green product
purchase intention through consumers’ environmental concern attitude.
Result Analysis & Managerial Implication
Reliability & Validity of Measure
First, Cronbach’s alpha coefficients were used to measure the internal consistency of each
identified dimension of construct, and items with adequate Cronbach’s alphas were retained for the
scales. The general criteria for the cronbach coefficient alpha should be greater than 0.6. below
table gives the details of constructs of the model & the number of items representing each
construct along with the alpha value. As all the constructs have alpha value satisfying the criteria, all
of the constructs were acceptable and a total of 13 items were retained for the three constructs in
the study.
Table 1 Cronbach Alpha of Constructs
Table-2 represents the convergent validity of
all the constructs using Composite Reliability.
Individual item’s reliability will be checked
using Cronbach Alpha, while to test the
reliability of construct or latent variables
composite reliability is used. The composite
reliability varied from 0.61 to 0.80, satisfying
the criteria of 0.6.
Constructs Number
of items
Cronbac
h’s
Alpha
Green Marketing mix
strategies
4 0.73
Attitude towards
environmental concern
4 0.69
Purchase Intention 5 0.67

Vol. 5 Special Issue 3 August 2017 ISSN: 2320-4168
232 Shanlax International Journal of Commerce
Table 2 Convergent Validity of Constructs with Composite Reliability
Convergent Validity of
Construct
Green Marketing
mix strategies
Purchase
Intention
Attitude towards
Environmental concern
Green Marketing mix
strategies 0.73
Purchase Intention 0.66 0.69
Attitude towards
environmental concern 0.67 0.61 0.67
Next, a confirmative factor analysis (CFA) with Amos 20.0 Graphics software (SEM package) for
the measurement model with six constructs was performed. All factor loadings were significant at
0.05 level, except PI2 which will be eliminated from model, satisfying the convergent validity
criteria as per Table-3. The goodness-of-fit statistics indicated that most criteria met the
recommended values in the measurement model
Items of individual constructs:
Construct 1 : Green Marketing mix strategies
MM1 - Green product: Products attributes such as energy saving, organic etc. that leads to reduction
in resource consumption and pollution.
MM2- Green price: Most consumers will pay additional value if there is a perception of extra
product value.
MM3 - Green place: Aiming to reduce carbon footprint by way of managing logistics to cut down
transport emanations.
MM4- Green promotion: To address the relationship between a product and the environmental, to
promote green life style, and to present a corporate image of environmental responsibility
Construct 1 : Attitude towards environmental concern
EC1- To save energy, I drive my car as little as possible
EC2- I try to buy energy efficient household appliances
EC3- I have purchased light bulbs that were more expensive but saved energy
EC4 - I switch off lights/fans when I leave office/class/public buildings
Construct 1 : Purchase Intention
PI1- I would like to purchase those products which are costlier but causing less environmental
pollution
PI2- I would like to purchase those products which are inferior in quality but causing less
environmental pollution
PI3- I have switched products for ecological reasons
PI4- I have convinced members of my family or friends not to buy some products which are harmful
to the environment
PI5- When I buy products, I try to consider how my use of them will affect the environment and
other consumers
H01 - There is no significant effect between green marketing mix and purchase intention of green
product.

International Conference on INDIA 2030
233 Manonmaniam Sundaranar University, Tirunelveli
Fig 1 Standardized estimates of total effect on consumer’s purchase intention in relation with
the green marketing mix strategies.
From the above figure, it is
inferred that, green marketing
mix strategies of company has a
positive effect on green product
purchase intention. i.e marketing
mix strategies is increased by 1
standard deviation, purchase
intention on green products
increase by 0.22 (0.004**).
Total effect of green
marketing mix strategies on purchase intention of green products is 0.22. H02 - There is no
significant indirect effect of green marketing mix on purchase intention of green products through
environmental concern attitude of consumers.
Fig 2 - Standardized estimates of the direct and indirect effect of green marketing mix
strategies on Green product purchase intention through consumers’ environmental
concern attitude
The mediation analysis shows the direct
and indirect effect on dependent variables,
while environmental concern attitude of a
consumers acts as a mediator.
All of the fit measures indicated that the
structural model was moderately acceptable
df =3.44 at p=0.00; GFI=0.89; AGFI=0.86;
CFI=0.79; RMR=0.6, and RMSEA=0.136).
Along with the model’s general fit for the
data, its parameters were tested to decide
whether to accept the proposed
relationships between exogenous and
endogamous constructs (Hair et al., 1998).
The result shows the direct effect of green marketing mix strategies of company has a positive
effect on green product purchase intention. i.e marketing mix strategies is increased by 1 standard
deviation, purchase intention on green products increase by 0.12 (p=0.013*).
Modifications in the influence on purchase intention while environmental concern attitude act
as mediator. The result shows the indirect effect of green marketing mix strategies of company has
a positive effect on green product purchase intention through environmental concern attitude of
consumer. i.e marketing mix strategies is increased by 1 standard deviation, purchase intention on
green products increase by 0.102 (0.19 *0.54) (p=0.003**). The mediator could account for roughly
half of the total effect, PM = .47. (47%) . so role of the mediator is effective.
Suggestions and conclusion
In the world of globalization, consumer products abound in the market. With products from
India and abroad throng consumers, they are, as it goes without saying, at sixes and sevens in
choosing the right one. Despite the high competition within products, there are certain strategies
that the companies follow to persuade their consumers directly or indirectly to make them buy

Vol. 5 Special Issue 3 August 2017 ISSN: 2320-4168
234 Shanlax International Journal of Commerce
their products. One of the various strategies that the companies follow is Green Marketing Mix
Strategy that influences consumer's purchase intention of eco friendly or green products. A
consumer is made to buy products in terms of its price, product, place and promotion.
When a consumer had concern over the environment, it indirectly influences in promoting the
eco friendly or green products. Infact, this so called mediator supersedes a company's direct
advertising of its green products. This reveals that the mediator plays an important role in urging
the purchase intention of consumers. It's very important in the world, which is fast warming, to buy
and use eco friendly products. Eco friendly products will prolong the life on Earth and life of Earth.
So it's vital to create awareness among the consumers and the lay man. Conducting awareness
programs, campaigning and society related organisations should be focused on periodically or at
regular intervals. Such programs will change the mindset of the people towards buying green
products.
Therefore, in order to promote green products and to save the world from global warming, it's
of vital importance to make people understand the grave of the situation and buy green or eco
friendly products.
References
1. Baker, J. P. & Ozaki, R. (2008). Pro-environmental products: Marketing influence on consumer
purchase decision, Journal of ConsumerMarketing, 25(5): 281-293.
2. Bartels, J. & Hoogendam, K. (2011). The role of social identity and attitudes toward sustainability
brands in buying behaviours for organic products. Journal of Brand Management, 18(9): 697-
708.
3. Bloch, P. H., Sherrell, D. L. & Ridgway, N. M. (1986). Consumer Search: An Extended Framework.
Journal of Consumer Research,13(1): 119-126.
4. Borchers, A. M., Duke, J. M. & Parsons, G. R. (2007). Does willingness to pay for green energy
differ by source? Energy Policy, 35:3327–3334.
5. Bush, A. J., Martin, C. A. & Clark, P. W. (2001). The Effect of Role Model Influence on Adolescents'
Materialism and Marketplace Knowledge. Journal of Marketing Theory and Practice, 9(4): 27-36.
6. Byron, E. (2005). New Penny Chain Goes For ‘Missing Middle’. The Wall Street Journal,
(February): 68-97.

International Conference on INDIA 2030
235 Manonmaniam Sundaranar University, Tirunelveli
A STUDY ON RURAL WOMEN EMPOWERMENT THROUGH SELF HELP GROUPS WITH
SPECIAL REFERENCE TO SUTHAMALLI AREA IN TIRUNELVELI DISTRICT
Dr. K. Viswa Sarojini Devi Assistant Professor, Department of Commerce, The M.D.T Hindu college, Tirunelveli
Abstract Women population constitutes around 50% of the world population. A large number of women around the world are unemployed. The world economy suffers a lot because of the unequal opportunity for women at workplaces. Women are as talented as men. Previously, women were not allowed higher education like men and hence their talents were wasted. But nowadays, they are also allowed to go for higher studies and it encourages women to show their talents which will not only benefit her individually but to the whole world at large. Women Empowerment refers to the creation of an environment for women where they can make decisions of their own for their personal benefits as well as for the society. Women Empowerment refers to increasing and improving the social, economic, political and legal strength of the women, to ensure equal-right to women, and to make them confident enough to claim their rights. It also leads to more economic benefits not to the individuals but to the society as well. Introduction
In most of the developing countries today more and more emphasis is laid on the need for the
development of women and their active participation in the main stream of development process.
It is also widely recognized that, apart from managing households bearing children, rural women
bring income with productive activities ranging from traditional work in the field to working in
factories or running small and petty businesses. They have also proven that they can be better
entrepreneurs and development managers in any kind of human development activities. Therefore
it is important and utmost necessary to make rural women empowered in taking decision to enable
them to be in the central part of any human development process. The empowerment of women is
also considered as an active process in enabling women to realize their full identity and power in all
spheres of life. It is also true that the women need special attention to ensure their development
and participation in the decision making process at home, in the community and government,
against the patriarchal system prevalent in the society. For women to become a successful
entrepreneur, she needs access to capital, technical and managerial known-how and market. The
essence in empowerment of rural women lies in catalyzing appropriate economic activities at the
grass root level and creating new opportunities for them to earn higher income in order to improve
their standard of living.
Self-Help Groups
One of the powerful approaches to women empowerment and rural entrepreneurship is the
formation of self help groups (SHGs) especially among women. The concept of formation of self-
help groups is the brainchild of Grameen Bank of Bangladesh, which was founded by Mohammed
Yunus in the year 1975. This strategy had fetched noticeable results not only in India and
Bangladesh but world over. A self help group is an association, generally may consist of 15 to 20
people, belonging to similar socio-economic characteristics residing in the some locality.It is
homogeneous small economic affinity group of poor people whom voluntary come together to say
small amount of saving, called thrift regularly extend micro loans among themselves to meet their
emergent needs. According to National Bank for Agriculture and Rural Development (NABARD)

Vol. 5 Special Issue 3 August 2017 ISSN: 2320-4168
236 Shanlax International Journal of Commerce
report, the highest number of Self Help group is found in the southern states. On an average
southern states constitute 53% Self Help Group eastern 18% central 11% northern 6% north
eastern 3% and western 9% at the rational scene.
Significance of the Study
Men and women are equal before of constitution of India. Besides, women are considered as a
privileged class by means of several central state legislation. In principle, all the political parties of
India have agreed to give one-third exclusive reservation for women in political participation, one-
third reservation in admission in educational institutions and job opportunities. The Tamilnadu
State Government has passed an Act to give co-parcenery right in properties to women. Women are
also a privileged class in obtaining financial assistance for starting industries with one percent
concessional rate of interest. As such, a social movement, by name, Women Self Help Groups are
promoted with the objective of empowering women in the economic, managerial and social field.
Women Self Help Groups are a few years old and hence it may be considered significant means to
conduct a separate study to examine the empowerment of women through Women Self Help Groups
quantitatively and qualitatively by means of field-survey research, analysis and interpretation.
Objectives of the Study
To examine the rationale of women empowerment
To review the role of government for uplift of women
To examine the role of Women Self Help Groups for the empowerment on principle and
To examine empirically the empowerment of women managerially, financially, and socially by
having joined the Women Self Help Groups.
Mehthodology
Preparing a completed project report for a “A Study On Rural Women Empowerment Through
Self Help Groups With Special Reference To Suthamalli Area In Tirunelveli District” is the assigned
task. The nature of the project work is exploratory. Both primary and secondary data were used
for this project work.
Collection of Data
This study is based on the primary and secondary data. Primary data was collected directly
from the members of Women Self Help Groups by conducting direct interview and through schedule
method. Secondary data was collected from the journals, magazines, books and women group
guides from Women Developing Corporation limited.
Sample Size
There are 30 women Self Help Groups functioning at suthamalli area. Among the top 30 groups,
4 members from each group were selected for the purpose of the study. Therefore 120 respondents
were taken as sample size.
Samplin Design
Due to short period, Convenience sampling method was followed to take samples from the Self
Help Groups.
Tools Analysis
For the analysis purpose, statistical tools namely sampling, percentages with total score
analysis and scoring techniques were used. Tables and charts are also made in support for analysis
and interpretation.
Area of the study
The area of study in this project work is the village of Suthamalli in Tirunelveli district.

International Conference on INDIA 2030
237 Manonmaniam Sundaranar University, Tirunelveli
Analysis of Women Empowerment through Self Help Groups
1. Age of Member
The following table explains the Age-wise distribution of the sample respondent.
Table 1: Age-wise classification of the members
Source: Field survey Inference
The above table-1 Exhibits that 18
(15%) of the respondents are 20-25 age
group, 22(18%) of the respondents 25-30
age group, 38 (32%) of the respondent are
30-35 age group and 42 (35%) of the
respondent 35-40 age group.
2. Qualifications of the members
The following table explains the qualification wise distribution of the sample respondent.
Table-2: Classification According In Qualification
Source: Field Survey Inference
The above table-2 exhibits that at 76 (63%) of the respondent are school education, 5 (4%) of the respondent are graduate, 24 (20%) of the respondent are illiterate, 15(13%) of the respondent are other such as ITI, Diploma holders.
3. Occupation
The following table explains the occupation wise distribution of the sample respondents.
Table-3: Occupation Wise Classification of the Members
Source: Field Survey
Inference
The above table-3 reveals that
upto 70 (50%) of the respondent are
employed, 50 (42%) of the respondent
are unemployed.
4. Level of Income: The following table explains in the income wise distributions of the sample
respondents.
Table-4: Income wise classification of the respondents
Source: Field Survey
Inference From the above table-4 it is clear that 24 (20%) of the respondent income level is below Rs.3000, 50 (42%) of the respondents belong to the category of Rs.3000-Rs.6000 income level, 46 (38%) of the respondents’ income level is above Rs.6000.
Age No of Respondents Percentages of total
20-25 18 15
25-30 22 18
30-35 38 32
35-40 42 35
Total 120 100
Nature of Education No of respondent Percentages
of total School education 76 63
Graduate 5 4
Illiterate 24 20
Other (specify) 15 13
Total 120 120
Occupation No of respondent Percentages of total
Employed 70 58
Unemployed 50 42
Total 120 100
Income level No of respondent %
Below Rs. 3000 24 26
Rs.3000-Rs.6000 50 42
Above Rs.6000 46 38
Total 120 100

Vol. 5 Special Issue 3 August 2017 ISSN: 2320-4168
238 Shanlax International Journal of Commerce
5. Types of Self Help Groups
The following table explants the types of self help groups.
Table-5: Type of Self Help Groups
Source: Field Survey Inference
From the above table-5 it is evident
that the 108 (98%) of the respondent are
under the type of government self-help
group, 12 (10%) of the respondent under
the non-government self-help group.
6. Membership years
The following table explains the year of membership of SHG.
Table-6: Membership Years
Source: Field Survey Inference
From the above table 6 it is clear that
47 (39%) of the respondent are having 3-
5 years of membership, 18 (15%) of the
respondents are having 6 to 8years of
membership, 15 (13%) of the
respondents are having membership
above 8years
7. Motivators
The following table explains the motivators who influence to join a member in SHG.
Table-7: Motivators
Source: Field Survey
Inference
The above table-7 exhibits that 20 (70%)
of the respondent are motivated by relatives,
10 (8%) of the respondent are motivated by
neighbour, 80 (67%) of the respondent are
motivated by SHG members, 10 (8%) of the
respondent are motivated by others.
8. Standard of living
The following table explains whethert the SHG is helpful to improve the standard of living or not..
Table-8: Standard of Living
Source: Field Survey Inference
From the above table-8, it can be inferred
that 90 (75%) of the respondents feel that the
SHGs is helpful to improve their standard of
living, 30 (25%) of the respondents feel that the
SGHs is not helpful to improve their standard of
living.
Type of SHG No of respondent Percentages
of total
Government 108 90
Non-government 12 10
Total 120 100
Year of membership No of
respondent
Percentages of
total
Below 2 yrs 47 39
3-5yrs 40 33
5-6yrs 18 15
Above 8yrs 15 13
Total 120 100
Particular No of
respondents Percentages
Of total Relatives 20 17 Neighbour 10 8 SHG member 80 67 Any other (specify) 10 8 Total 120 100
Particular No of respondent Percentages
Yes 90 75
No 30 25
Total 120 100

International Conference on INDIA 2030
239 Manonmaniam Sundaranar University, Tirunelveli
9. Economic Position
The following table explains whether the economic position of the respondents have changed
before and after joining SHGs.
Table-9: Economic Position
Source: Field Survey Inference From the above table-9 it is clear that 18 (15%) of the respondents significantly agreed that the economic position has been changed. 46 (38%) of the respondents have marginally agreed that the economic position has been changed. 48 (40%) of the respondents agreed a little that their economic position has been changed. 2 (2%) of the respondents showed their ineptness to assess the change in their economic position. 6 (5%) of the respondents inferred that there is no difference in their economic position.
Findings: The following are the main findings of this study
Most of the respondents in SHGs belong to the age group of 35-40.
Most of the Self Help Group members have completed their school education.
Self Help Group members are mostly employed
Majority of the respondents have income level Rs.3000-Rs.6000 in SHG.
The most prominent type of Self Help Groups are of government SGHs.
The year of membership of the respondent is mostly below 2years.
Majority of the respondents are motivated by Self Help Group members.
Most of the respondents are satisfied with the SGH in helping to improve their standard of
living.
The majority of the respondents, say 48 (40%), agree a little that their economic position has
been changed.
Suggestions
I. Suggestions to the Self Help Groups members
Innovative marketing techniques and product needs to be appreciated from time to time.
Two or more educated women member should participle in every group.
The member of the Women Self Help Group may be encouraged to do business using the skill
developed through Women Self Help Groups.
II. Suggestions to the government
Government should conduct periodical trainings and workshops for self help group members.
Government should give adequate credit at a subsidized rate of interest.
The government should conduct exhibitions to market the product of the self help groups
during festive seasons.
Conclusion
The researcher feels a sense of satisfaction after completing the study of socio-economic
analysis of women self help groups. There is good effort on the part of women to earn income and
the unity among the members have improved. Really, it is a good start for the development of
women. If the government provides the necessary help to the Self Help Groups in Suthamalli area,
they can perform better..
Economic Position No of
respondent
Percentages
Of total
Significant 18 15
Marginal 46 38
A little 48 40
Ineptness 2 2
No difference 6 5
Total 120 100

Vol. 5 Special Issue 3 August 2017 ISSN: 2320-4168
240 Shanlax International Journal of Commerce
Refferences
1. Books
1. Karmakar K.G., 1999, “Rural Credit and Self Help Groups: Micro Finance needs and concepts in
India”, Saga Publications, New Delhi.
2. Gariyali, C.K and vetrived, S.K, “Women’s Own”. The Self Help Movement of Tamilnadu, Vetri
publishers, New Delhi-2004.
3. Lalitha, N., “Rural Women Empowerment and Devleopment Banking”, Kanisha publishers, New
Delhi.
2. Journals
1. J.Arulral Danied. V.M.Selvaraj and E.Raja Justus, Financial Status of Women Self Help Groups; An
analysis southern Economist, june1 2011.
2. B.Venkatappa and G. Sivaiah, Self Help Groups, Through DWCRA in Andhra Pradesh, southern
Economic May 1, 2011.

International Conference on INDIA 2030
241 Manonmaniam Sundaranar University, Tirunelveli
A STUDY ON THE PROBLEMS AND PROSPECTS OF WOMEN ENTREPRENEURS
IN THE PERUMBAVOOR MUNICIPALITY OF ERNAKULAM DISTRICT
Ancy Jose
Assistant Professor, SCMS, Cochin
Mary Trazy Karen
Assistant Professor on Contract, St.Xavier’s College, Aluva
Abstract The status of women has changed from time to time; position of the women in society is the index to the standard of social organization. Women position in the modern Indian society is equal to that of new socially, economically, politically, legally. New women has the right to review education, own properties, participate in public life of the nation. She can seek employment anywhere and remains not a domestic slave. As Dr. APJ Abdul Kalam rightly remarked “empowerment of women, their thoughts and their value systems leads to the development of a good family, good society and ultimately of good nation”. Entrepreneurship is a multi-dimensional task and the entrepreneur should be a good creator, innovator, organizer, risk bearer and leader. And it is same, as in the case of a women entrepreneur. Though development policies and good performance have created a positive impact in women position in the society, still the growth of women entrepreneurial field is haunted by a number of difficulties and problems. The study is conducted in order to understand the problems and prospects of women entrepreneurs in the Perumbavoor municipality of Ernakulam district. Study reveals cooperation, support and motivation from the part of the family members. Most of them acquired a socio economic status through entrepreneurship and ultimately sustainability for a better tomorrow.
Introduction
Women entrepreneurs may be defined as women or the group of women who initiate, organize
and operates business enterprise. According to Schumpeter an entrepreneur is an innovating
individual who is introducing something new in to the economy. Government of India has given a
broader definition of women entrepreneur as “an enterprise owned and controlled by women
having a minimum financial interest of 51% of the capital and giving at least 51% of the
employment generated in the enterprise to women”.
Emergence of women entrepreneurs in the economy is an indicator of women’s economic
independence and their improved social status. Throughout the world, women’s participation in
economic activities is increasing. A women as entrepreneur is economically more powerful than a
male worker. Women’s active participation in economic activities leads to their economic
development . Participation of women in entrepreneurship will provide a change to utilize their free
time, rather than being employed outside their homes in some other job. Emergence of women
entrepreneurs in the economy is an indicator of women’s economic independence and their social
status. The study is conducted in order to understand the problems and prospects of women
entrepreneurs in the Perumbavoor municipality of Ernakulam district.
Scope of the Study
The key area in the empowerment of women is the economic area. Emergence of women
entrepreneurs in the economy is an indicator of women’s economic independence. In the present
days, women’s are getting with high credit than men in education and in professional studies.
Women entrepreneurship needs to be studied for number of reasons. The main reason is that
women entrepreneurship has been recognized during the last decades as an important source of

Vol. 5 Special Issue 3 August 2017 ISSN: 2320-4168
242 Shanlax International Journal of Commerce
economic growth. They create new jobs for themselves and others and also being different.
They also provide the society with different solution to management, organization and exploitation
of entrepreneurial opportunities. Study was conducted in the Perumbavoor locality. It is
predominantly agricultural town and Asia’s largest plywood industries. Moreover that large
percentage of women entrepreneurs engaging in the field of textiles, restaurants Gymnasiums,
super markets, herbal parlors, small retail shops in the respective area. These are provided various
benefits to themselves. But there are a number of problems which will hinder the growth and
expansion of these business units. The objective is to analyze these problems and prospect of
women entrepreneurs in this area of business.
Objectives
1. To understand the socio economic background of women entrepreneurs.
2. To study the major benefits enjoyed by women entrepreneur.
3. To examine the problems faced by the women entrepreneurs.
4. To assess the earning capacity as a women entrepreneur.
Methodology The study was undertaken in Perumbavoor locality .Data for the present study have
been collected both from the Primary data and secondary data.
Primary Data: The primary data required for the study were collected from the selected
sample of women entrepreneurs in the Perumbavoor municipality. Samples of 50 respondents were
selected by convenience sampling method. The respondents were interviewed with the help of
scheduled questionnaires. Additional information was collected from books, journals, articles, and
reports from newspapers, magazines and websites.
Tools and Techniques
For the analysis of data, percentage method is used. Along with this, tables and diagrams are
also used to make the analysis more clear.
Data Analysis and Interpretation
Table 4.1 Socio Economic Profile of Women Entrepreneurs (Source: Primary data)
Sl. No
Category Details Number of
Respondents Per cent
1 Age
20-30 8 16
30-40 28 56
40-50 12 24 Above 50 2 4
2 Religion Hindu 18 36 Christian 8 16
Muslim 24 48
3 Marital Status Single 6 12
Married Widow
42 84
2 4
4 Family Background Nuclear
46 92
4 8
3 6
5 Educational Qualification
3 6
Post-Graduation 5 10 Graduation 22 44
Higher Secondary/ degree
20 40
6 Annual Income
Less than 2,50,000 15 30
2,50,000-5,00,000 25 50 More than 5,00,000 10 20
7 Source of Initial Capital
Owned 13 26
Borrowed 37 74 8 Nature of Business Sole proprietorship 38 76

International Conference on INDIA 2030
243 Manonmaniam Sundaranar University, Tirunelveli
Table 4.2 Type of Business
(Source: Primary data) From the table 4.2, it is understood that almost 36 per cent of the respondents are engaged in running tailoring units and boutiques and 30 per cent of them are running beauty parlors. 12& 8 per cent of women entrepreneurs are engaged in manufacturing of candles and food products.14 per cent are having service units like binding, printing and DTP centers
Table 4.3 Traditional Restrictions (Traditional restrictions like travelling alone, working
after normal hours and interaction with men)
Table 4.5 reveals that 80 per cent of the
respondents do not face any traditional restriction
in their business field and 20 per cent complained
the indifferent attitude of the society as a problem.
Table 4.4 Support from Family
(Source: Primary data)
The table shows the nature of support
from family to the women entrepreneurs.
72% get good support and 22% are satisfied
with the support from family.6% of
respondents opined that their family support
is very poor.
Table 4.5 Reason for Starting the Business
(Source: Primary data)
Profit making is the most attractive element that
catches the attention of 44 Per cent of women
entrepreneurs.36% have an aim in attaining daily
income by entering in to entrepreneurship ventures.
Experience in the field(8%) , high level of
opportunities (12%) are considered as other
reasons for starting business by women.
Table 4.6 Benefits enjoyed by Women Entrepreneur
(Source: Primary data)
From the table it is evident that
44% of women entrepreneurs are
able to earn more profit as an
individual since they are undertaking
their own business ventures. 34 Per
cent have opined that
entrepreneurship has a great role in
overall development of abilities and
skills of women. Social status and
Number of
Respondents %
Boutiques & Tailoring unit 18 36
Binding, Printing &DTP 7 14
Beauty Parlors 15 30
Food Production Units 6 12
Candle Units 4 8
Total 50 100
Basis Number of Respondents Per cent
Yes 10 20
No 40 80
Total 50 100
Basis Number of Respondents Per cent
Good 36 72
Satisfactory 11 22
Poor 3 6
Total 50 100
Basis Number of
Respondents %
Experience in field 4 8
High level of opportunity 6 12
Profit making 22 44
Daily income 18 36
Total 50 100
Basis Number of Respondents %
Skill empowerment 16 32
Freedom to choose work 4 8
and time
Social status 5 10
Self-dependence 3 6
Earnmore profit as 22 44
individual
Total 50 100

Vol. 5 Special Issue 3 August 2017 ISSN: 2320-4168
244 Shanlax International Journal of Commerce
freedom to choose work and time are the other major benefits enjoyed by the women
entrepreneurs.
Table 4.7 Nature of Competition
(Source: Primary data)
Table shows the competition faced by women
entrepreneurs in their business field. 78% face high level
of competition from the similar business in their field in
their field. 14 % of women entrepreneurs are facing low
competition .8% of the respondents are not considering
competition as a problem.
Table 4.8 Labour Problems
Source: Primary data)
Labour problem affect to a great extend
in the existence of industries According to
the survey 24% of the women
entrepreneurs are having labour problems
and the details are given in the table 4.11.
As per table, 66% of respondents
reported absenteeism as their prominent
difficulty. Labour turnover is a common labour problem among 14% respondents. This is mainly
due to marriage, domestic troubles and duel duties of women workers. Another 17 % reported non
availability of skilled labours.
Table 4.9 Raw Material Problems
(Source: Primary data)
Women entrepreneurs find it
difficult to procure raw materials and
other necessary inputs.66 per cent of
the women entrepreneurs
participated in the study are facing
problems related to raw materials. Of
that 46 % Complained of high
transportation cost, 30%of
respondents are facing the problem of lack of availability of raw materials and 24% opined that the
prices of raw materials are very high.
Table 4.10 Financial Problems
(Source: Primary data)
Majority (84%) of the
respondents faces financial
problems in some way or
other. According to table no
4.12, 26% of women
entrepreneurs find it difficult
to pay salary for their
workers. Another 26 per
cent of them are facing
Basis Number of
Respondents %
High 39 78 Low 7 14 No Competition 4 8
Total 50 100
Basis Number of
Respondents Per cent
Labour Turnover 2 17
Absenteeism 8 66
Lack of unskilled labours 2 17
Total 12 100
Basis Number of
Respondents Per cent
High transportation cost 15 46
High prices 8 24
Lack of availability of raw materials
10 30
Total 33 100
Basis Number of
Respondents Per cent
High interest rate 4 10
Inadequate credit facility 11 26
Inability to provide collateral security 7 17
Unfavorable repayment schedule 3 7 Salary to workers 11 26
Miscellaneous expenditures 6 14 Total 50 100

International Conference on INDIA 2030
245 Manonmaniam Sundaranar University, Tirunelveli
inadequate credit facilities.17% of the respondents stated that inability to provide collateral
securities as a major problem. High interest rate (10%), Unfavorable repayment schedule (7%) &
miscellaneous expenditure (14%) are other problems faced by women entrepreneurs.
Table 4.11 Production Problems
(Source: Primary data)
All type of production
problems restricts the
development of women
entrepreneurs. As evident
from the table 4.14, 80% of
the women entrepreneurs
participated in the study
are not facing any
problems related to production. 50% of respondents face the problem of inadequate technical
support. This is mainly due to high cost of technology acquisition or due to the lack of knowledge of
recent developments.30% of the women is of in the opinion that cost of production is very high and
20% of sample respondents hinted at the inadequate availability of working area.
Table 4.12 Marketing Problems
The problems and constrains faced by the respondents relating to the market are given in the
following table. 30 per cent of women entrepreneurs specially complained about competition by big
industries.
(Source: Primary data)
In addition to that 28% of the
respondents pointed out that attitude of
the customers are always changing.23% of
the respondents cited problems in
irregular payments &7% pointed out that
lack of advertisement is also an another
problem .Maintaining customer
relationship is another problem among
12% of respondents.
Table 4.13 Earnings before the business
(Source: Primary data) Above table shows that 88% of women entrepreneurs do not have any earnings before starting up of this venture.
Table 4.14 Monthly Earnings
(Source: Primary data)
Table 4.16 depicts 46% of total respondents earns an
average monthly income in the range of 20,000-
30,000.26% of them earns in the range of 10,000-20,000.
24% earns more than 30,000 as average monthly income.
It is understood that most of the respondents stay with
the business for earning a monthly income less than
30,000.
Basis Number of
Respondents %
Inadequate technical support 25 50
Absence of information 0 0
High cost of production 15 30
Inadequate availability of working area 10 20
Total 50 100
Basis Number of
Respondents %
Competition 13 30
Irregular payments 10 23
Change in the attitude of customers
12 28
Lack of advertisement 3 7 Customer relationship 5 12
Total 50 100
Basis Number of Respondents Per cent
Yes 6 12
No 44 88
Total 50 100
Basis Number of
Respondents Per cent
Up to 10,000 2 4
10,000-20,000 13 26
20,000-30,000 23 46
Above 30,000 12 24
Total 50 100

Vol. 5 Special Issue 3 August 2017 ISSN: 2320-4168
246 Shanlax International Journal of Commerce
Table 4.15 Effect of entrepreneurship in
Income generation
(Source: Primary data)
All the respondents agreed that their income
increased after starting an entrepreneurship business and
it results in good earnings prospects of women lives.
Table 4.16 Support from Government
(Source: Primary data)
Table 4.18 shows that 92% of total
respondents are availed assistance and
support from the Government departments
where as 8% do not availed any support as
they are not aware of it
Table 4.17 Types of support from Government
(Source: Primary data)
Government of India had made special
provisions for development of women
entrepreneurs through financial support,
promotional assistance and training. Sixty one per
cent have availed financial support provided by
government and 30% of them are benefited
through a series of training activities. Promotional activities of the Government were also helpful to
9% of total respondents.
Table 4.18 Status of Present Functioning
(Source: Primary data)
This table clearly depicts the overall performance of
business governed by the women entrepreneurs. Out of the
respondents 64 % are satisfied with the progress of the
business and 20 % of entrepreneurs view is that present
functioning of their business is good. Only 16% of
respondents are opined as their status is poor.
Findings
Findings of the study arising from the analysis are the following:
1. Fifty six per cent of women entrepreneurs belong to the age group of 30-40 years.
2. Majority of respondents are married .Unmarried and widows are also entering in to the
business but on less population.
3. Educational status depicts that all the entrepreneurs are well educated. 10% of them have
higher secondary education were as 60% of them are Graduates. It is quite appreciable that
18%of them have started their business ventures after post-graduation and 12% of them
started the business with professional qualification.
Basis Number of
Respondents %
Increased 50 50
Reduced 0 0
Total 50 100
Basis Number of
Respondents %
Yes 46 92
No 4 8
Total 50 100
Basis Number of
Respondents %
Training 14 30
Promotional activities 4 9 Financial support 28 61
Total 46 100
Basis Number of
Respondents %
Good 10 20
Satisfactory 32 64 Poor 8 16
Total 50 100

International Conference on INDIA 2030
247 Manonmaniam Sundaranar University, Tirunelveli
4. Income wise classification of women entrepreneurs shows that 50% of them belongs to
2,50,000-5,00,000 category.
5. 74% of women entrepreneurs bring finance for the business through borrowings.
6. 76% of the respondents carrying on business activities are sole proprietorship enterprises.
7. Most of the women entrepreneurs are engaged in running boutique and beauty parlors.
8. Most of the respondents are satisfied with the present function of the business.
9. Majority of the respondents starts the business with previous experience in their field.
10. 72% of women entrepreneurs get support from their family members.
11. Only few number of women entrepreneurs faces traditional restriction in their field.
12. Profit making is the factor that leads women entrepreneurs to start the business.
13. As a women entrepreneur 44% of them achieve more profit as an individual.
14. Only 12% of women entrepreneurs are facing labour problems. Labour turnover, absenteeism,
lack of skilled labour is the problems faced by them. Inadequate credit facilities and inability to
make payment to workers are the major financial problems.
15. Thirty four per cent of the respondents do not face any raw materials problems. Remaining
portions facing high price, irregular supply, and high transportation cost as the problem.
16. 50% of the respondents face inadequate technical support as a production problem.
17. Competition is an important marketing problem as among 30 per cent of respondents. It also
constitutes irregular payments, lack of advertising and indifferent attitude of customers.
18. Majority of women entrepreneurs do not have any earnings before starting up of this venture.
Study also reveals that there is a considerable improvement in their income
19. Majority of the women entrepreneurs get good support from the Government of that financial
assistance is the main supporting factor provided by the government.
20. Most of the respondents are satisfied with the present functioning of the business.
Suggestions
1. Government should take initiatives to conduct awareness programmes about EDP provided by
the government. More government schemes and subsidy plans should be started for the up
liftment of women entrepreneurs.
2. Banks and other financial institutions should come forward to give loans to women
entrepreneurs at reduced rate of interest without obtaining security from them.
3. Adequate training programmes may enhance the skills and talents of women entrepreneurs to
face the competition.
4. Due to the lack of technical education, women are unaware of technological development and
marketing knowledge. Technology acquisition at subsidized charges should be made available
to them.
5. Government should take more initiatives to promote the women product or enterprises from
severe competition.
Conclusion
From the study it is found that women entrepreneurs have sufficient knowledge about their
field and they have maximum 10 year experience in their field. Difficulties in obtaining finance
encourages them to depend on banks for their initial investment. Women entrepreneurs have
determination and courage to stand independent. In order to overcome competitions in their field
they improve quality and adapt new changes in their field. Study reveals cooperation, support and
motivation from the part of the family members. Most of them acquired a socio economic status
through entrepreneurship and ultimately sustainability for a better tomorrow.
Vol. 5 Special Issue 3 August 2017 ISSN: 2320-4168
248 Shanlax International Journal of Commerce
PRODUCTION AND MARKETING OF LEMON IN TIRUNELVELI DISTRICT
OF TAMILNADU STATE
Dr.G. Chithiraikani
Assistant Professor Department of Business Administration KamarajGovt Arts College, Surandai, Tirunelveli
Abstract India is the second largest producer of Lemon in the world with an annual production of around 94 million tones. It has the distinction of producing almost all tropical and exotic fruits because of varied climatic conditions. Due to the short self life of these crops, as much as 30-35% of fruits and vegetables during harvest, storage grading, transport, packaging and distribution. Only 2% of these crops are processed into value-added products. Hence, there is a need for maximum commercial utilization of lemon fruits and to adapt production and marketing activities to the requirements of the world market and to cater to domestic demand which, over the past few years, has been increasing because of various socio-economic factors. If the nutritive value-added food industry. Lemon is grown in almost all the states of India. The total area covered is over 67,650 hectors, of which Madhya Pradesh. Tamilnadu and Maharashtra have the largest share. Lemon tress are grown in almost all kinds of soils, varying from heavy black soils to shallow open soils. Some of the varities of Lemon seem to adapt themselves to soil conditions better than others. Key words: Lemon Farmers, Marketing, Agricultural Department Introduction
India has the second largest area under lemon cultivation, next only to USA. However, it falls
behind to the fourth place in term s of production due to comparatively low yields. Yields remain
lower largely on account of dependence on dry land farming. During the early secenties shortages
of lemon products led to substantial increase in the prices. Severe intra-year and intra seasonal
flucations in the prices are common feature of the lemon products economy. Lemon prices have
siginificantly contributed to the national inflation levels during the recent years. Price movement in
lemon products was perceived as a consequence of demand-supply gaps. Addressing these issues
several policy options have been adopted in the last one and a half decade. Despite, the production
remained stagnant until 1987-88. Lemons are produced all around the world. They contain healthy
nutrition content that works wonders for the day. Lemon act as a fabulous source of vitamin C and
a wide range of essential nutrient required by the body. India only represents a mere 4% of global
Lemon fruit production. But now-a-days, there is a rise in its cultivation. This rise in Lemon
production is mainly due to the increase in cultivation areas & the change in consumer preferences
towards more health & convenience food consumption & the rising incomes. This study on Lemon
provides relevant information on most Lemon crops, the basics of circulture& production, pre&post
harvest management, picking storage etc.
Climate
Lemon requires sun tropical climate. It flourishes conditions. It cantoleratefrost better than
lime. It is grown up to 1200m elevation it yields prolific crops both under irrigated and rainfed
conditions. Lemon are more hardy than kagzi lime.
Soil
Lemon is adaptable to a variety to soils. However it requires well drained shallow soils to a
depth of not less than one matre. The area on which lemon is planted should be protected from
strong winds by means of suitable windbreaks.

International Conference on INDIA 2030
249 Manonmaniam Sundaranar University, Tirunelveli
Vrieties
Lemons There are several Varieties of Tami lnadu given below Lucknow Seedless, Kagikalam,
C.pseudolemomon Tanaka, Meyer Lemon, Pat Lemon
Propagation
Lemon is mainly propagated by deeds. The seeds are extracted from healthy fruits.
Freshly extracted seeds are mixed with ash and dried in the shade. It is advisable to sow the seeds
soon after extraction within three daus otherwise viability of the seeds is reduced. Propagation of
Lemon by seed is not preferred nor it is advisable to follow due to variabilities. Lemon may be
propagated by budding, layering, marcotting and stem cuttings. Among them budding is preferred
as resultant trees raised from budgraft are precocious produce more uniform crop and root and
trunk diseases can be avoided by using suitable rootstock. Commonly adaptable rootstock are
jatiKhtti(citrus jambheri) and KarnaKhatta (Citrus Karna).
Planting
For planting of lemon the pits are dug well in advance to planting operation. They are dug at
the size of60-75 cm3 or so depending upon cultivar type of soil and topography of the land.The pits
are filles with a mixture of top soil and 10-15 kg of well rotten farmyard manure or compost land..
The pits are dug t the distance of 6 X km. Italian limes are planted at a distance of 8 X 8m because
they put on more growth and develop into large canoply. The time of planting lemons is in the
onset of monsoon. However lemon can also be transplanted in the month of September-October of
February-March. If assured irrigation facilities are available. Planting is follow by staking and or
light irrigation for better survival and establishment of lemon seedling/grafts and putting on
further growth.
Irrigation
Just after transplanting light irrigation is given. Subsequent irrigations are givern as per need of
the crop. During the hot summer months irrigation should be given at 8 to 10 days omterval
flowing and fruiting stages.
Mannure and Fertilizers
Lemon responds well to manure and fertilizer application. The does of fertilizers very with the
climatic condition soil type and age of the tree. The below are the doses of manure (kg/tree) and
fertilizers (g/tree) are being applied in states like Andhra Pradesh, Arunachala Pradesh, Assam,
Karnataka and Rajasthan. Generally fertilizers are applied thrice in a year i.e. in December-January,
June, July and September, October, Farmyard manure is applied in June July or September to
October.
Importance of the Study
The farmers those who are interested in cultivating the Lemon find difficult to sellout their
product with good profit as many farmers depend the middlemen to market the product, and for the
financial help they depend on private moneylenders, Some farmers who obtain financial assistance
from moneylenders. The are unable to repay promptly and at one stage they are mortgaging or
selling out their land due to the financial crises. At this stage the poor farmer shound be given good
awareness through the agriculture department about the latest techonology of Lemon fruits
cultivation and provided with the adequate information regarding various source of funding public
sector banks an d cooperative banks. In Lemon marketing various intermediaries are involved and
they transfer the Lemon from producers to ultimate consumers. So, the farmer should identify right
time and right place to market their produce. In spite of these difficulties, farmers prefer to ngrow
this crop because of its short duration, fair returns and ready cash income it fetches, suitable for
rain fed conditions, besides fitting well in the crop sequence as a commercial crop. The study of

Vol. 5 Special Issue 3 August 2017 ISSN: 2320-4168
250 Shanlax International Journal of Commerce
various marketing practices in Lemon fruits marketing is useful to understand about the various
intermediaries involved in marketing of Lemon fruits. It is used to find out the various
intermediates share in the consumers rupee. It will be helpful to suggest the farmers how to get
more share in the consumers rupee.
Statement of the Problem
Thirunelveli District is very famous for Lemon cultivation comparing to other Districts. The
people living in Tirunelveli district are hard working be nature and introducing novel techniques to
get high yield. The land lords are big farmers and marginal farmers slash the market price of lemon
fruits in general which indirectly affects the small farmers and marginal farmers. The government
department is also not considering the small land marginal farmers and whenever approaching
these officials, they never respond properly and fail to convey the latest technique of Lemon
cultivation. Similarly the bank officials also practice unwanted delay in sanctioning the agriculture
loan whenever the farmers approach the bank for finance crises. Even if sanctioned loan stringent
actions are initiate against the defaulters or delay in payment. Whereas the nig farmers could be
able to avail a sizable amount of loan very easily and not at all repay the loan. All or a sudden the
government announces waiving policy (loan right off), where the big farmers are enjoying these
facilities in lakhs and lakhs or rupees. Due to poor literacy, they are very weak in marketing their
products. Some farmers having little awareness hire the trucks and lorries and bring their products
to neighbouring town and earns good money through proper selling. But, majority of lemon
growers depend only on intermediaries to sell out their products. These intermediaries swallow a
line share of profit. Even in the regulated market these intermediaries confuse the farmers by using
various tricks at the time of bidding.
Objectives of the Study
• To ascertain the sales performance of Lemon fruits in Tirunelveli District
• To identify the pattern of marketing of lemon fruits by the farmers and to the extent of
utilization of the regulated markets.
• To study the common problems faced by the framers by the farmers in marketing of Lemon
fruits.
Methodlogy
For the present study Tirunelveli district was purposively selected due to their aggressive
involvement in agricultural activities. There are Tentaluks in Tirunelveli district and among them
all taluks are selected based on the productivity of lemon. Farmers are selected by using stratified
random sampling method from the selected taluk.
Table I Geographical representation of sample respondents
Data Collection
The validity of any research is based on
the systematic method of data collection and
analysis. In the present study both primay
and secondary data is used. A set of
questionnaires were prepared, for enquiry at
the level of marketing. The primay data was
collected from the farmers who were are all
cultivating and marketing the lemon fruits in
all taluks of Tirunelveli Districts. The
information’s were gathered through personal
interview method. From the selected prices,
S.NO Name of the Taluk No. of Respondents 1 Sivagiri 50 2 Sankarankovil 50 3 Shencottai 50 4 Tenkasi 50 5 V.K.Pudur 50 6 Alankulam 50 7 Ampasamuthram 50 8 Palayankotai 50 9 Nanguneri 50
10 Radhapuram 50 Total 500
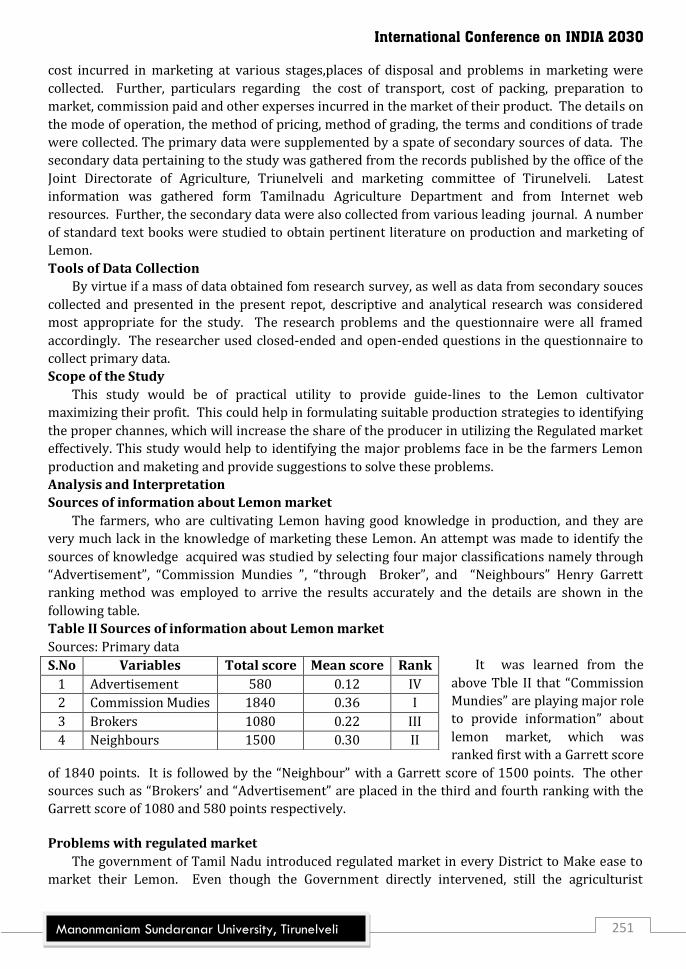
International Conference on INDIA 2030
251 Manonmaniam Sundaranar University, Tirunelveli
cost incurred in marketing at various stages,places of disposal and problems in marketing were
collected. Further, particulars regarding the cost of transport, cost of packing, preparation to
market, commission paid and other experses incurred in the market of their product. The details on
the mode of operation, the method of pricing, method of grading, the terms and conditions of trade
were collected. The primary data were supplemented by a spate of secondary sources of data. The
secondary data pertaining to the study was gathered from the records published by the office of the
Joint Directorate of Agriculture, Triunelveli and marketing committee of Tirunelveli. Latest
information was gathered form Tamilnadu Agriculture Department and from Internet web
resources. Further, the secondary data were also collected from various leading journal. A number
of standard text books were studied to obtain pertinent literature on production and marketing of
Lemon.
Tools of Data Collection
By virtue if a mass of data obtained fom research survey, as well as data from secondary souces
collected and presented in the present repot, descriptive and analytical research was considered
most appropriate for the study. The research problems and the questionnaire were all framed
accordingly. The researcher used closed-ended and open-ended questions in the questionnaire to
collect primary data.
Scope of the Study
This study would be of practical utility to provide guide-lines to the Lemon cultivator
maximizing their profit. This could help in formulating suitable production strategies to identifying
the proper channes, which will increase the share of the producer in utilizing the Regulated market
effectively. This study would help to identifying the major problems face in be the farmers Lemon
production and maketing and provide suggestions to solve these problems.
Analysis and Interpretation
Sources of information about Lemon market
The farmers, who are cultivating Lemon having good knowledge in production, and they are
very much lack in the knowledge of marketing these Lemon. An attempt was made to identify the
sources of knowledge acquired was studied by selecting four major classifications namely through
“Advertisement”, “Commission Mundies ”, “through Broker”, and “Neighbours” Henry Garrett
ranking method was employed to arrive the results accurately and the details are shown in the
following table.
Table II Sources of information about Lemon market
Sources: Primary data
It was learned from the
above Tble II that “Commission
Mundies” are playing major role
to provide information” about
lemon market, which was
ranked first with a Garrett score
of 1840 points. It is followed by the “Neighbour” with a Garrett score of 1500 points. The other
sources such as “Brokers’ and “Advertisement” are placed in the third and fourth ranking with the
Garrett score of 1080 and 580 points respectively.
Problems with regulated market
The government of Tamil Nadu introduced regulated market in every District to Make ease to
market their Lemon. Even though the Government directly intervened, still the agriculturist
S.No Variables Total score Mean score Rank
1 Advertisement 580 0.12 IV
2 Commission Mudies 1840 0.36 I
3 Brokers 1080 0.22 III
4 Neighbours 1500 0.30 II

Vol. 5 Special Issue 3 August 2017 ISSN: 2320-4168
252 Shanlax International Journal of Commerce
suffering with various types of problems in different angels. The common problem faced by the
farmers with regulated market are studied by selecting the four major issues such as “waste of
time”, “trick among the buyers to fix the price through mutual understanding”, “storage cost” and
“delay in payment”. These problems were studied with the help of Heary Garrett ranking method
and the details are shown in the following table.
Table III Problems with regulated market
Sources: Primaydata
It was learned from the above
table III that officials in the
regulated market taking more
time unnecessarily at the time of
marketing their lemon, which was
ranked first with a Garrett score of
1890 points. It is followed by the “tactics played by the buyers in fixing the price through the
mutual understanding” was represented with a Garrett score of 1490 points. The problems such as
“delay in payment and storage cost score of 850 and 770 points respectively.
Methods of selling Lemon
The farmers cultivating lemons are find difficulty to sell their agriculture produced. In this
study an attempt was made to identify the methods of selling the lemon. The common methods are
pre-harvest contract, using regulated market, selling through commission agents and direct sales to
lemons. The details are Analyzed with the help of percentage analysis and furnished in the
following table.
Table IV Methods of selling Lemon by the respondents
Sources: Primary data
It is examined from the above table
IV that 28% of the respondents using
“Regulated Market” and to sell their
Lemon 27% of the respondents are
using both “Commission agents” and
directly selling the Lemon to company
to sell their agricultural product. On the
other hand 18% of the respondents underwent “pre-harvest” with the private brokers.
Methods practiced to sell Lemon during volatility market
The Lemon market often fluctuates and the farmers find difficult when they are finding no
standardized market. In this study an attempt was made to identify the various methods practiced
by the sellers to sell the lemon during volatility in the market.
Table v Methods practiced to sell theLemon when market is volatile
Sources: Primary data
It could be seen fron
the above Table V that
62% of the represents
Selling the lemon
immediately after
harvesting, 24% of the
respondents storing the
S.No Variables Total Score Mean Score Rank
1 Waste of Time 1890 0.38 I
2 Trick of Time 1490 0.29 II
3 Storage Cost 770 0.15 IV
4 Delay in payment 850 0.17 III
S.No Variables Respondents %
1 Pre harvest Contractors 90 18%
2 Regulated Market 140 28%
3 Commission Agents 136 27%
4 Direct sales to Company 134 27%
Total 500 100%
S.No Variables Respondents %
1 Aggressive Selling during peak market 70 14%
2 Store the lemon in the go downs
during inflation
120 24%
3 Selling the lemon immediately after
harvesting
310 62%
Total 500 100%

International Conference on INDIA 2030
253 Manonmaniam Sundaranar University, Tirunelveli
lemon in their Go downs during inflation period and 14% of the respondents using Aggressive
selling during peak market.
Method of pricing the Lemon
Normally pricing methods are studied as penetrating pricing strategy, skimming pricing
strategy, market based pricing and actions. In this study, the style of pricing practiced by the lemon
growers was studied with the help of percentage Analysis and details are shown in the following
table.
Table VI Pricing method of lemon practiced by the respondents market practiced
Sources: Primary data
It could be observed
from the above TableVI that
36% of the respondents
using price made in the
regulated market , 32% if
the respondents selling
their Lemon according to
the Market prices, 17% of
the respondents using
penetrating pricing strategies and 15% of the respondents using skimming pricing strategies.
Respondents opinion of grading on the lemon
In the era of competitive business, customers preferred a good standard of products in general
and in particular to lemon. The respondents opinion on grading the lemon in the market were
gathered and analyzed with the help of percentage method. The detailed opinions are furnished in
the following table.
Table VII Respondents opinion on lemon grading in the Market
Sources: Primary data
It is witnessed from
the above table VII that
57% of the respondents
opined that they were
assessed based on the
size,26% of them assessed
based on weight. On the
other hand 15% of the respondents measuring juice content level with the help of equipments.
From the analysis, it is found that 57% of them assessed based of size on lemon.
Summary of Findings and Suggestions
The study is aimed at measuring the benefits enjoyed be the farmers and the problems faced by
them during production and marketing of lemon in the study area. Field survey technique was
employed to collect the first hand information from the sample respondents. Interview schedule
was the main tool employed to collect the pertinent data. The data thus collect were arranged in
simple tabular forms and appropriate statistical tools were used data analysis. Based on this
analysis, Interpretations were made systematically. An attempt was made to recapitulate the key
findings and conclusion. Based on these findings, a few suggestions have also been made.
S.No Variable Respondents %
1 Auction price made in the regulated
market
180 36%
2 Selling of lemon according to
market price
158 32%
3 Penetrating pricing strategies 85 17%
4 Skimming priceing strategies 77 15%
Total 500 100%
S.No Variable Respondents %
1 Assessed based on size 285 57%
2 Assessed based on weight 138 28%
3 Measuring juice content level with
the help of equipments
77 15%
Total 500 100%

Vol. 5 Special Issue 3 August 2017 ISSN: 2320-4168
254 Shanlax International Journal of Commerce
Finding
• It was learned from the study that “Commission mundies” are playing the major role to provide
information “about lemon market, which was ranked first with a Garrett score of 1840 points.
• It was learned from the study that officials in the regulated market taking more time
unnecessarily at the time of marketing their lemon, which was tanked first with a Garrett score
of 1890 points.
• It is examined from the study that 28% of the respondents using “regulated market” and to sell
their Lemon.
• It could be seen from the study that 62% of the respondents Selling the lemon immediately
after harvesting.
• It could be observed from study that 36% of the respondent using auction price made in the
regulated market.
• It is witnessed from the study that 57% of the respondents opined that they were assessed
based on the size.
Suggesstions
The following suggestions are recommended for strengthening the marketing of Lemon:
• Strengthening cooperative marketing institutions and introduction of forward marketing and
contract farming, which will also help the farmer to g3et a better price for his produce.
• Better enforcement of regulated markets, so that more farmers feel attracted to use them (at
present less than half), getting the benefit of higher prices and for correct quality and quantity.
• Promoting market integration, which will also get a better price for the farmers.
• Price incentives for Lemon storage in the lean season.
• Reducing the cost of storage by introducing bulk storage facilies.
• Alleviating the over-regulation of markets and introduction of future markets and hedging
practices. Rewarding better quality produce with better price.
• Streamlining the six statutory regulation regarding quality.
Conclusions
Lemon and Lemon products played an important role in the Indian economy for a long time
India produces a large variety of Eureke, LisbonLemon, Villagraca, LucknowSeedless, NepaliOblong,
Baramasi, Kagikalam, HillLemon. (Galgal)C. pseudolemonTanala, MayerLemon, PatLemon, Italian
Lemon, Rajamundary Lemon, European Lemon, Ponderosa Lemon, or Japanese Lemon, Malta
Lemon that eran the country a huge share of foreign exchange while analyzing the world level
Lemon productivity, demand. The production, consumption and exports of these selected Lemons
have witness a significant Transformation in the last 14 years. Further it is advised that the farmers
are suffering more to lack of adequate working capital. A separate Co-operative Marketing society
exclusively for Lemon growers may be established and it should help the farmers who are in the
need of adequate working capital.