edison international 2005_eix_annual_7596
TRANSCRIPT

Building the Future
05Edison International
2005 ANNUAL REPORT


E d i s o n I n t e r n a t i o n a l
1
Mountainview operates today because three years ago state and federal officials encouraged
our regulated utility Southern California Edison (SCE) to take over the abandoned project
when others, in the wake of the California power crisis, would not. To secure a novel regulatory
framework and then turn permits and plans into an operating power plant, SCE brought together
from across the company a team of talented employees experienced in the many facets of power
plant development. The project was completed on budget and ahead of schedule, providing an
important new source of electricity and enhancing reliability.
Achieving the Goals in our Strategic Plan
I begin my report to you this year with the story of Mountainview because it provides a
compelling example of effective teamwork, creative problem-solving, strong operational
performance and the ability to call on a diverse base of talent experienced in all aspects of the
electricity business. These are the same qualities necessary to make a reality of the five-year
Strategic Plan we announced in October 2004.
I described our Strategic Plan, titled Building the Future, in last year’s annual report. It sets
ambitious goals for growth in earnings and value, built principally on capturing the potential
inherent in our existing businesses. Edison International entered 2005 with a clear objective:
achieve the targets set out in the Plan for its first full year. Simply put, the job was to execute
well across the entire company. I’m proud to say that our people did that, and more.
Dear Fellow Shareholders: In the early morning hours of December 10, 2005, the Mountainview power plantbegan commercial operation, supplying much-needed electricity to customers in the fast-growing region of Southern California known as the Inland Empire.
E d i s o n I n t e r n a t i o n a l
2
Edison International earned a record $1.1 bil-
lion in 2005, or $3.47 per share. That repre-
sents an increase of 23 percent over 2004
earnings. On the strength of this performance,
we were able to raise your dividend by 8 per-
cent going into 2006. Your total 2005 return
on Edison International stock, including
dividends, was 39.6 percent.
A standout feature of 2005 for our company
was investors’ recognition of substantial value
in our unregulated businesses at Edison
Mission Group (EMG). Going into the year,
we believed that relatively little of the value
we saw there was reflected in the company’s
market valuation. That changed with out-
standing performance. Our EMG team
significantly reduced operating costs, deployed
its substantial cash reserves effectively, gener-
ated additional cash flows, paid down debt,
and achieved record earnings of $441 million.
Strong Performance at EMG Merchant Plants
and in Power Markets
In addition to a substantial infrastructure
investment and lease portfolio, EMG operates
more than 9,000 megawatts of power genera-
tion, the majority of which is our large fleet of
coal-fired merchant generating assets operating
in the Midwest. In the merchant power busi-
ness, both our revenues (sales of electricity)
and our largest costs (coal, rail transportation,
emissions credits) are subject to market volatil-
ity. We manage this volatility through the use
of forward contracting and hedging to enhance
margins and reduce risk.
In 2005, our merchant plants benefited
significantly from a dramatic increase in
wholesale electricity prices, while our hedging
largely insulated us from rising fuel and
emission credit costs. Our improved financial
strength also allowed us to increase our
forward contracting in 2006 and 2007,
enhancing revenue and cost predictability
for future years.
The EMG energy trading group in Boston
also had an exceptional year, built not on
physical assets but on market insights. Our
talented and experienced team identified
opportunities for earnings from disciplined,
risk-controlled trading that is confined to the
electricity and electricity-related markets we
know. Not every year will offer the same level
of opportunities, and we will not chase trading
profits by taking on substantially higher risk.
Two EMG accomplishments were notable
more for their potential than for their
contribution to earnings in 2005.
E d i s o n I n t e r n a t i o n a l
3
First, our renewable energy business at EMG
during 2005 invested $184 million in three
new wind energy projects. More significantly,
our employees laid a foundation for future
growth by developing a rich pipeline of
new wind project opportunities, several of
which we expect to bring on line during
2006 and 2007.
Second, an opportunity for EMG may exist in
our home state of California. We are advancing
development on two sites with potential to
help meet the state’s need for new generation.
A third initiative to address California power
needs, announced in early 2006, is a joint
venture with BP to explore the design and
construction of a first-of-its-kind power plant
fueled by hydrogen extracted from petroleum
coke, a refinery byproduct. If the project is
successful, the plant would generate 500
megawatts of clean electricity with minimal
carbon dioxide emissions.
In 2006, environmental issues surrounding
the use of coal as a fuel in power production
will be a particular area of focus. Coal is critical
to the nation’s energy mix, but the industry
must take additional steps to reduce the
environmental impacts of coal-fired plants.
Over the past six years, we have invested
more than $450 million in pollution controls
for these facilities since purchasing them. Our
plan is to invest further to control emissions
but exactly what investment will be required
and at what cost to continuing operations is
uncertain. What we do know is that this will
be a very important challenge for us.
Hitting Plan Targets for SCE
The largest single component of our
Building the Future Strategic Plan is the
planned investment of slightly more than
$9 billion over five years in SCE’s wires net-
work. Much of our utility infrastructure is
aging. Meanwhile, our service territory is
experiencing robust economic and customer
growth. With sound regulatory support, we
are making large investments to expand and
strengthen Southern California’s electric system.
Meeting our ambitious goals creates a signifi-
cant operational challenge. Our planned wires
investment from 2005 to 2009 will roughly
double the expenditures of the previous
five-year period, while our field work force
is expected to remain relatively flat.
In 2005, our utility team – transmission and
distribution employees, and the many others
from across SCE who support them – hit all of
our targets for infrastructure investment. They
also achieved key milestones on major planned

E d i s o n I n t e r n a t i o n a l
4
transmission projects. They innovated, worked
in effective teams across traditional organiza-
tional boundaries, found means of improving
productivity and worked very hard.
In 2006, our infrastructure investment targets
are even higher. The Strategic Plan is only as
good as its execution. The old ways of doing
business will not be good enough to ensure
meeting our goals. We have to continue to
improve.
Also critical will be obtaining support for
our wires investments from regulators. The
California Public Utilities Commission
(CPUC) endorsed the expanded infrastructure
investment plan in SCE’s last general rate case,
decided in 2004. This year, teams of SCE
employees presented an equally compelling
2006-2008 rate case. Approximately 83 per-
cent of our utility operations and maintenance
(O&M) and 75 percent of our ongoing capital
expenditures are governed by this proceeding.
The Commission’s decision, expected this
spring, will determine whether we have the
regulatory support to continue our infrastruc-
ture investments at the planned levels.
Previous annual reports have described the
difficult issues pertaining to coal and water
rights that surround our Mohave plant. In
December, the plant closed in accordance with
an environmental consent decree reached six
years ago. To their great credit, Mohave
employees achieved one of the best perfor-
mance records in plant history in 2005. The
loss of Mohave potentially creates a gap in the
reliable, fuel-diversified power generation
portfolio available to serve Southern California
over the next several years. We are intensely
exploring means to continue operating the
plant, but time for a decision is short and many
hurdles remain.
Better news came in the case of our San Onofre
nuclear plant. Our request for authorization to
proceed with replacement of the plant’s steam
generators was approved by the CPUC. The
decision clears the way for the largest power
plant in Southern California to continue pro-
viding our customers with predictable, reliable
generation long into the future.
No discussion of SCE’s performance is com-
plete without mentioning renewable energy.
At EMG, renewable energy is a growth oppor-
tunity. At SCE, it is a leadership commitment.
In 2005, we reached an agreement with
Stirling Energy Systems that could one day
create the world’s largest solar facility and help
bring down the cost of solar energy. SCE
already purchases on behalf of its customers

E d i s o n I n t e r n a t i o n a l
5
92 percent of all the solar power produced
in the United States, and one-sixth of all the
country’s renewable energy. Public policy in
California strongly supports renewable energy.
Our challenge is to support that objective
while at the same time driving hard to find
least-cost means to meet state goals.
Concluding Thoughts
Finally, two additional corporate goals are
critical to our continued pursuit of excellence.
The first is the continued enhancement of our
ethics and compliance programs and perfor-
mance. Simply put, there is no such thing as
acceptable performance at Edison International
that does not include compliance with laws
and regulations, and integrity in everything
we do. This effort never stops.
The second can be summarized as advancing
our leadership and talent development pro-
grams. To take full advantage of the depth and
breadth of our corporate experience across both
regulated and unregulated businesses, we need
to produce leaders who are grounded in the
public spirit and customer service ethic of SCE,
and skilled in the rapid decision-making and
competitive edge of EMG.
Thank you for the investments you have made
in us. We are proud to have rewarded your
support with strong returns, whether you are
a long-term shareholder who has stayed with
us through the last five or more years, or a
more recent investor. Our Building the FutureStrategic Plan is sound. I believe our team can
continue to execute it well. That should mean
future growth and value.
Sincerely,
John E. Bryson
Chairman of the Board,
President and Chief Executive Officer
February 28, 2006

E d i s o n I n t e r n a t i o n a l
6
Plant Operations
Strong Competitive Businesses
Edison International in 2005:

E d i s o n I n t e r n a t i o n a l
7
Renewable Leadership
Infrastructure Investments

E d i s o n I n t e r n a t i o n a l
8
Edison International Building the Future
Edison International, through its subsidiaries, is a generator and distributor of electric power and aninvestor in infrastructure and energy assets, including renewable energy. Headquartered in Rosemead,California, Edison International is the parent company of Southern California Edison – a regulated electricutility – and Edison Mission Group, a competitive power generation business and parent company toEdison Mission Energy and Edison Capital.
The People of Edison International:� Hold integrity as our paramount value� Commit to excellence� Respect each other and the people with whom we deal
These personal values we hold and the customer value we deliver are essential to create shareholder value.
Table of Contents1 Management’s Discussion and Analysis
of Financial Condition and Results of Operations
83 Management’s Responsibility for Financial Reporting
83 Management’s Report on Internal Control over Financial Reporting
83 Disclosure Controls and Procedures
84 Report of Independent Registered Public Accounting Firm
86 Consolidated Statements of Income
87 Consolidated Statements of Comprehensive Income
88 Consolidated Balance Sheets
90 Consolidated Statements of Cash Flows
92 Consolidated Statements of Changes inCommon Shareholders’ Equity
94 Notes to Consolidated Financial Statements
148 Quarterly Financial Data
149 Selected Financial and Operating Data: 2001 – 2005
153 Board of Directors and Management Team
IBC Shareholder Information
1
____________________________________________________________________________________ Management’s Discussion and Analysis of Financial Condition and Results of Operations
INTRODUCTION This Management’s Discussion and Analysis of Financial Condition and Results of Operation (MD&A) contains “forward-looking statements” within the meaning of the Private Securities Litigation Reform Act of 1995. Forward-looking statements reflect Edison International’s current expectations and projections about future events based on Edison International’s knowledge of present facts and circumstances and assumptions about future events and include any statement that does not directly relate to a historical or current fact. Other information distributed by Edison International that is incorporated in this report, or that refers to or incorporates this report, may also contain forward-looking statements. In this report and elsewhere, the words “expects,” “believes,” “anticipates,” “estimates,” “projects,” “intends,” “plans,” “probable,” “may,” “will,” “could,” “would,” “should,” and variations of such words and similar expressions, or discussions of strategy or of plans, are intended to identify forward-looking statements. Such statements necessarily involve risks and uncertainties that could cause actual results to differ materially from those anticipated. Some of the risks, uncertainties and other important factors that could cause results to differ, or that otherwise could impact Edison International or its subsidiaries, include, but are not limited to:
• the ability of Edison International to meet its financial obligations and to pay dividends on its common stock if its subsidiaries are unable to pay dividends;
• the ability of Southern California Edison Company (SCE) to recover its costs in a timely manner from its customers through regulated rates;
• decisions and other actions by the California Public Utilities Commission (CPUC) and other regulatory authorities and delays in regulatory actions;
• market risks affecting SCE’s energy procurement activities;
• access to capital markets and the cost of capital;
• changes in interest rates, rates of inflation and foreign exchange rates;
• governmental, statutory, regulatory or administrative changes or initiatives affecting the electricity industry, including the market structure rules applicable to each market and environmental regulations that could require additional expenditures or otherwise affect the cost and manner of doing business;
• risks associated with operating nuclear and other power generating facilities, including operating risks, nuclear fuel storage, equipment failure, availability, heat rate and output;
• the availability of labor, equipment and materials;
• the ability to obtain sufficient insurance, including insurance relating to SCE’s nuclear facilities;
• effects of legal proceedings, changes in or interpretations of tax laws, rates or policies, and changes in accounting standards;
• supply and demand for electric capacity and energy, and the resulting prices and dispatch volumes, in the wholesale markets to which Mission Energy Holding Company’s (MEHC) generating units have access;
• the cost and availability of coal, natural gas, and fuel oil, nuclear fuel, and associated transportation;
• the cost and availability of emission credits or allowances for emission credits;
• transmission congestion in and to each market area and the resulting differences in prices between delivery points;
2
____________________________________________________________________________________ Management’s Discussion and Analysis of Financial Condition and Results of Operations
• the ability to provide sufficient collateral in support of hedging activities and purchased power and fuel;
• the extent of additional supplies of capacity, energy and ancillary services from current competitors or new market entrants, including the development of new generation facilities and technologies;
• general political, economic and business conditions;
• weather conditions, natural disasters and other unforeseen events; and
• changes in the fair value of investments and other assets accounted for using fair value accounting. Additional information about risks and uncertainties, including more detail about the factors described above, are discussed throughout this MD&A and the “Risk Factors” section included in Part I, Item IA of Edison International’s annual report on Form 10-K. Readers are urged to read this entire annual report, including the information incorporated by reference, and carefully consider the risks, uncertainties and other factors that affect Edison International’s business. Forward-looking statements speak only as of the date they are made and Edison International is not obligated to publicly update or revise forward-looking statements. Readers should review future reports filed by Edison International with the Securities and Exchange Commission. Edison International is engaged in the business of holding, for investment, the common stock of its subsidiaries. Edison International’s principal operating subsidiaries are SCE, Edison Mission Energy (EME) and Edison Capital. MEHC (parent), a subsidiary of Edison International, is the holding company for its wholly owned subsidiary EME. Since the second quarter of 2004, MEHC (parent) and EME are presented as one business segment on a consolidated basis. In this MD&A, except when stated to the contrary, references to each of Edison International, SCE, MEHC, EME or Edison Capital mean each such company with its subsidiaries on a consolidated basis. References to Edison International (parent) or parent company and MEHC (parent) mean Edison International or MEHC on a stand-alone basis, not consolidated with its subsidiaries. This MD&A is presented in 14 major sections. The company-by-company discussion of SCE, MEHC, Edison Capital, and Edison International (parent) includes discussions of liquidity, market risk exposures, and other matters (as relevant to each principal business segment). The remaining sections discuss Edison International on a consolidated basis. The consolidated sections should be read in conjunction with the discussion of each company’s section.
Page Edison International: Management Overview 3 Southern California Edison Company 5 Mission Energy Holding Company 22 Edison Capital 43 Edison International (Parent) 45 Results of Operations and Historical Cash Flow Analysis 47 Discontinued Operations 60 Acquisitions and Dispositions 61 Critical Accounting Estimates 62 New Accounting Pronouncements 67 Proposed Accounting Pronouncements 67 Commitments, Guarantees and Indemnities 68 Off-Balance Sheet Transactions 72 Other Developments 76
3
____________________________________________________________________________________ Edison International
EDISON INTERNATIONAL
EDISON INTERNATIONAL: MANAGEMENT OVERVIEW In 2005, Edison International’s focus was on effective execution of its strategic plan. That plan, announced in October of 2004, set forth a balanced approach for growth, dividends and balance sheet strength. In 2005, Edison met and in some cases exceeded what was set out in its strategic plan. Principal objectives achieved in 2005 are summarized below:
• Strong operating performance – Reported earnings in 2005 were $1.1 billion, or $3.47 per share, a 24% increase over 2004. MEHC yielded excellent results in 2005, driven primarily by increased margin from wholesale electricity prices, as well as controlling operating and input costs, stabilizing revenue through contracts and hedges, solid operations at the power plants and disciplined trading in the wholesale markets where MEHC sells the power plant output. At SCE, improved operating performance more than offset a decrease in the CPUC-authorized rate of return. In addition, the favorable resolution of some outstanding tax and regulatory issues contributed to higher earnings results.
• Managed growth – In 2005, SCE met all transmission and distribution investment targets, as well as key milestones on future transmission projects. In addition, SCE continued to focus on ensuring adequate generation resources to support customer demand and completed construction of its 1,054 megawatt (MW) Mountainview project and obtained a CPUC decision authorizing the San Onofre Nuclear Generating Station (San Onofre) steam generator replacement project. At MEHC new investments in renewable energy projects and wind turbines of approximately $243 million were funded in 2005.
• Balance sheet strength – Edison International significantly strengthened its balance sheet in 2005, primarily through repayment of debt at MEHC and Edison Capital and the rebalancing of the capital structure at SCE. Liquidity was also enhanced through strong cash flow generation at all operating companies, with the non-regulated entities ending the year with a combined cash and short-term investments (reflected in “Other current assets” on the consolidated balance sheets) of almost $1.9 billion. In addition, credit ratings for Edison International, SCE and MEHC improved and credit facilities to support hedging and liquidity needs were expanded.
• Dividends – Strong financial performance in 2005 supported an 8% increase in the shareholder dividend.
In addition to the objectives related to the strategic plan, Edison International also took significant steps to strengthen the ethics and compliance programs at all of the Edison International companies, building a high-priority program to uphold its commitment to integrity and compliance with all regulatory requirements. In 2006, Edison International will continue implementation of its strategic plan, with its primary focus including: • Implementation of SCE’s capital investment plan to ensure system reliability. SCE plans to undertake
new projects to expand its transmission and distribution systems, increase maintenance activities on its electric grid, and begin implementation of a comprehensive, integrated software system to support the majority of its critical business processes. The proposed decision in SCE’s 2006 General Rate Case (GRC) would authorize $4.9 billion of capital expenditures for 2006 – 2008, including $2.2 billion in 2006. See “SCE: Liquidity—Capital Expenditures” for further discussion of SCE’s capital expenditures.

4
____________________________________________________________________________________ Management’s Discussion and Analysis of Financial Condition and Results of Operations • Execution of MEHC’s plans for growth of its generation development business. MEHC expects to make
significant investments in wind projects during the next several years. In January 2006, EME completed the purchase and development rights for the 161 MW Wildorado project, located in Texas. Project completion is scheduled for April 2007, with total construction costs estimated to be $270 million. In 2005, EME purchased 105 wind turbines and entered into option agreements to acquire an additional 100 turbines. These turbines will support various projects in EME’s 2006 and 2007 development pipeline. MEHC also expects to make investments in thermal projects during the next several years. As part of this development effort, MEHC is in the process of obtaining permits for two sites in Southern California for peaker plants and formed a partnership with British Petroleum to jointly explore the design and construction of a power plant fueled by hydrogen extracted from petroleum coke, a refining byproduct. See “MEHC: Liquidity—EME’s Liquidity—Business Development Plans” for further discussion.
• Optimization of the value of MEHC’s generation portfolio. The majority of MEHC’s power plants sell power under contracts into PJM Interconnection, LLC (PJM). These power plants are known as merchant power plants. MEHC’s revenue and results of operations of its merchant power plants depend upon prevailing market prices for capacity, energy, ancillary services, emission allowances or credits, fuel oil, coal, natural gas and associated transportation costs in the market areas where MEHC’s merchant plants are located. As a result, MEHC will utilize hedging and other activities to continue to optimize performance of these merchant operations.
• Progression toward a set of market rules that permit SCE to procure power efficiently ensuring adequate resources are available and avoiding undue upward pressure on customer rates. Beginning in 2006, SCE was required to procure sufficient resources to meet its expected customer needs with a 15–17% reserve margin. SCE expects to meet this resource adequacy requirement in 2006, but access to long-term power resources is needed. In order to provide reliable service SCE continues to focus on securing reasonable long-term procurement rules (see “SCE: Regulatory Matters—Current Regulatory Developments”), finding a path to continue to operate the Mohave Generating Station (Mohave) on acceptable financial and commercial terms (see “SCE: Regulatory Matters—Current Regulatory Developments—Mohave Generating Station and Related Proceedings”), and achieving the milestones for the San Onofre steam generator replacement (see “SCE: Regulatory Matters—Current Regulatory Developments—San Onofre Nuclear Generating Station Steam Generators”).
In addition, Edison International will continue to enhance the effectiveness of Edison International’s ethics and compliance programs and will advance company-wide leadership and talent development programs to support its strategic plan objectives.
5
____________________________________________________________________________________ Edison International
SOUTHERN CALIFORNIA EDISON COMPANY
SCE: LIQUIDITY Overview As of December 31, 2005, SCE had cash and equivalents of $143 million ($120 million of which was held by SCE’s consolidated Variable Interest Entities (VIEs)). As of December 31, 2005, long-term debt, including current maturities of long-term debt, was $5.3 billion. In December 2005, SCE replaced its $1.25 billion credit facility with a $1.7 billion senior secured 5-year revolving credit facility. The security pledged (first and refunding mortgage bonds) for the new facility can be removed at SCE’s discretion. If SCE chooses to remove the security, the credit facility’s rating and pricing will change to an unsecured basis per the terms of the credit facility agreement. As of December 31, 2005, SCE’s credit facility supported $180 million in letters of credit, leaving $1.52 billion available under the credit facility. SCE’s 2006 estimated cash outflows consist of: • Debt maturities of approximately $596 million, including approximately $246 million of rate
reduction notes that have a separate nonbypassable recovery mechanism approved by state legislation and CPUC decisions;
• Projected capital expenditures of $2.2 billion primarily to replace and expand distribution and transmission infrastructure and construct and replace generation assets, as discussed below;
• Dividend payments to SCE’s parent company. On March 1, 2006, the Board of Directors of SCE declared a $60 million dividend to be paid to Edison International;
• Fuel and procurement-related costs (see “SCE: Regulatory Matters—Current Regulatory Developments—Energy Resource Recovery Account Proceedings”); and
• General operating expenses. SCE expects to meet its continuing obligations, including cash outflows for power-procurement undercollections (if incurred), through cash and equivalents on hand, operating cash flows and short-term borrowings, when necessary. Projected capital expenditures are expected to be financed through operating cash flows and the issuance of long-term debt and preferred equity. In January 2006, SCE issued two million shares of 6.0% Series C preference stock (non-cumulative, $100 liquidation value) and received net proceeds of $197 million. In addition, SCE issued $500 million of first and refunding mortgage bonds. The issuance included $350 million of 5.625% bonds due in 2036 and $150 million of variable rate bonds due in 2009. The proceeds from the January 2006 issuances of preference stock and bonds will be used for general corporate purposes, including capital expenditures and debt maturities. SCE’s liquidity may be affected by, among other things, matters described in “SCE: Regulatory Matters.”
Capital Expenditures SCE is experiencing significant growth in actual and planned capital expenditures to replace and expand its distribution and transmission infrastructure, and to construct and replace generation assets. In April 2005, the Finance Committee of SCE’s Board of Directors approved a $10.1 billion capital budget and forecast for the period 2005–2009. Pursuant to the approved capital budget and forecast, SCE expects its capital expenditures to be $2.2 billion in 2006 and $2.1 billion in both 2007 and 2008,

6
____________________________________________________________________________________ Management’s Discussion and Analysis of Financial Condition and Results of Operations including projected environmental capital expenditures of $482 million, $485 million and $500 million in 2006, 2007 and 2006, respectively (see “Other Developments—Environmental Matters”). Significant investments in 2006 are expected to include: • $1.5 billion related to transmission and distribution projects; • $300 million related to generation projects; • $200 million related to information technology projects, including the implementation of a
comprehensive integrated software system to support a majority of SCE’s critical business processes; and
• $200 million related to other customer service and shared services projects. Credit Ratings At December 31, 2005, SCE’s credit and long-term senior secured issuer ratings from Standard & Poor’s and Moody’s Investors Service were BBB+ and A3, respectively. At December 31, 2005, SCE’s short-term (commercial paper) credit ratings from Standard & Poor’s and Moody’s Investors Service were A-2 and P-2, respectively. Dividend Restrictions and Debt Covenants The CPUC regulates SCE’s capital structure and limits the dividends it may pay Edison International (see “Edison International (Parent): Liquidity” for further discussion). In SCE’s most recent cost of capital proceeding, the CPUC set an authorized capital structure for SCE which included a common equity component of 48%. SCE determines compliance with this capital structure based on a 13-month weighted-average calculation. At December 31, 2005, SCE’s 13-month weighted-average common equity component of total capitalization was 50%. At December 31, 2005, SCE had the capacity to pay $197 million in additional dividends based on the 13-month weighted-average method. Based on recorded December 31, 2005 balances, SCE’s common equity to total capitalization ratio, for rate-making purposes, was 50.2%. SCE had the capacity to pay $212 million of additional dividends to Edison International based on December 31, 2005 recorded balances. SCE has a debt covenant that requires a debt to total capitalization ratio of less than or equal to 0.65 to 1 to be met. At December 31, 2005, SCE’s debt to total capitalization ratio was 0.46 to 1. Margin and Collateral Deposits In connection with entering into power-purchase agreements to support SCE’s procurement plan approved by the CPUC and enter into transactions for imbalance energy with the California Independent System Operator (ISO), SCE has entered into margining agreements for power and gas trading activities to support its risk of nonperformance. SCE’s margin deposit requirements can vary depending upon the level of unsecured credit extended by counterparties and brokers, the ISO credit requirements, changes in market prices relative to contractual commitments, and other factors. At December 31, 2005, SCE had a net deposit of $6 million ($158 million recorded in “Margin and collateral deposits” on the balance sheet and $152 million in unrealized gains recorded in “Counterparty collateral” on the balance sheet) with a broker in support of gas trading activities. In addition SCE deposited $200 million (comprised of $20 million in cash and $180 million in letters of credit) with counterparties. Cash deposits with counterparties and brokers earn interest at various rates. Margin and collateral deposits in support of power purchase agreements and gas trading activities fluctuate with changes in market prices. As of February 28, 2006, SCE had a net deposit of $242 million ($109 million recorded in “Margin and collateral deposits” on the balance sheet and $133 million in unrealized losses recorded in “Counterparty collateral” on the balance sheet) with a broker. In addition,

7
____________________________________________________________________________________ Edison International
SCE has posted $199 million (comprised of $20 million in cash and $179 million in letters of credit) with counterparties. Future margin and collateral requirements may be higher or lower than the margin collateral requirements as of December 31, 2005 and February 28, 2006, based on future market prices and volumes of trading activity. In addition, as discussed in “SCE: Regulatory Matters—Overview of Ratemaking Mechanisms—CDWR-Related Rates,” the CDWR entered into contracts to purchase power for the sale at cost directly to SCE’s retail customers during the California energy crisis. These CDWR procurement contracts contain provisions that would allow the contracts to be assigned to SCE if certain conditions are satisfied, including having an unsecured credit rating of BBB/Baa2 or higher. However, because the value of power from these CDWR contracts is subject to market rates, such an assignment to SCE, if actually undertaken, could require SCE to post significant amounts of collateral with the contract counterparties, which would strain SCE’s liquidity. In addition, the requirement to take responsibility for these ongoing fixed charges, which the credit rating agencies view as debt equivalents, could adversely affect SCE’s credit rating. SCE opposes any attempt to assign the CDWR contracts. However, it is possible that attempts may be made to order SCE to take assignment of these contracts, and that such orders might withstand legal challenges. Rate Reduction Notes In December 1997, $2.5 billion of rate reduction notes were issued on behalf of SCE by SCE Funding LLC, a special purpose entity. These notes were issued to finance the 10% rate reduction mandated by state law beginning in 1998. The proceeds of the rate reduction notes were used by SCE Funding LLC to purchase from SCE an enforceable right known as transition property. Transition property is a current property right created by the restructuring legislation and a financing order of the CPUC and consists generally of the right to be paid a specified amount from nonbypassable rates charged to residential and small commercial customers. The rate reduction notes are being repaid over 10 years through these nonbypassable residential and small commercial customer rates, which constitute the transition property purchased by SCE Funding LLC. The notes are collateralized by the transition property and are not collateralized by, or payable from, assets of SCE or Edison International. SCE used the proceeds from the sale of the transition property to retire debt and equity securities. Although, as required by accounting principles generally accepted in the United States, SCE Funding LLC is consolidated with SCE and the rate reduction notes are shown as long-term debt in the consolidated financial statements, SCE Funding LLC is legally separate from SCE. The assets of SCE Funding LLC are not available to creditors of SCE or Edison International and the transition property is legally not an asset of SCE or Edison International. SCE: REGULATORY MATTERS Overview of Ratemaking Mechanisms SCE is an investor-owned utility company providing electricity to retail customers in central, coastal and southern California. SCE is regulated by the CPUC and the Federal Energy Regulatory Commission (FERC). SCE bills its customers for the sale of electricity at rates authorized by these two commissions. These rates are categorized into three groups: base rates, cost-recovery rates, and CDWR-related rates. Base Rates Revenue arising from base rates is designed to provide SCE a reasonable opportunity to recover its costs and earn an authorized return on SCE’s net investment in generation, transmission and distribution plant (or rate base). Base rates provide for recovery of operations and maintenance costs, capital-related carrying costs (depreciation, taxes and interest) and a return or profit, on a forecast basis.

8
____________________________________________________________________________________ Management’s Discussion and Analysis of Financial Condition and Results of Operations Base rates related to SCE’s generation and distribution functions are authorized by the CPUC through a GRC. In a GRC proceeding, SCE files an application with the CPUC to update its authorized annual revenue requirement. After a review process and hearings, the CPUC sets an annual revenue requirement by multiplying an authorized rate of return, determined in annual cost of capital proceedings (as discussed below), by rate base, then adding to this amount the adopted operation and maintenance costs and capital-related carrying costs. Adjustments to the revenue requirement for the remaining years of a typical three-year GRC cycle are requested from the CPUC based on criteria established in a GRC proceeding for escalation in operation and maintenance costs, changes in capital-related costs and the expected number of nuclear refueling outages. See “—Current Regulatory Developments—2006 General Rate Case Proceeding” for SCE’s current annual revenue requirement. Variations in generation and distribution revenue arising from the difference between forecast and actual electricity sales are recorded in balancing accounts for future recovery or refund, and do not impact SCE’s operating profit, while differences between forecast and actual operating costs, other than cost-recovery costs (see below), do impact profitability. Base rate revenue related to SCE’s transmission function is authorized by the FERC in periodic proceedings that are similar to the CPUC’s GRC proceeding, except that requested rate changes are generally implemented when the application is filed, and revenue collected prior to a final FERC decision is subject to refund. SCE’s capital structure, including the authorized rate of return, is regulated by the CPUC and is determined in an annual cost of capital proceeding. The rate of return is a weighted average of the return on common equity and cost of long-term debt and preferred equity. In 2005, SCE’s rate-making capital structure was 48% common equity, 43% long-term debt and 9% preferred equity. SCE’s authorized cost of long-term debt was 6.96%, its authorized cost of preferred equity was 6.73% and its authorized return on common equity was 11.40%. If actual costs of long-term debt or preferred equity are higher or lower than authorized, SCE’s earnings are impacted in the current year and the differences are not subject to refund or recovery in rates. See “—Current Regulatory Developments—2006 Cost of Capital Proceeding” for discussion of SCE’s 2006 cost of capital proceeding. SCE is eligible under its CPUC-approved performance-based ratemaking (PBR) mechanism to earn rewards or penalties based on its performance in comparison to CPUC-approved standards of reliability and employee safety. Cost-Recovery Rates Revenue requirements to recover SCE’s costs of fuel, purchased power, demand-side management programs, nuclear decommissioning, rate reduction debt requirements, and public purpose programs are authorized in various CPUC proceedings on a cost-recovery basis, with no markup for return or profit. Approximately 52% of SCE’s annual revenue relates to the recovery of these costs. Although the CPUC authorizes balancing account mechanisms to refund or recover any differences between estimated and actual costs, under- or over-collections in these balancing accounts can build rapidly due to fluctuating prices (particularly for purchased power) and can greatly impact cash flows. SCE may request adjustments to recover or refund any under- or over-collections. The majority of costs eligible for recovery are subject to CPUC reasonableness reviews, and thus could negatively impact earnings and cash flows if found to be unreasonable and disallowed. CDWR-Related Rates As a result of the California energy crisis, in 2001 the CDWR entered into contracts to purchase power for sale at cost directly to SCE’s retail customers and issued bonds to finance those power purchases. The

9
____________________________________________________________________________________ Edison International
CDWR’s total statewide power charge and bond charge revenue requirements are allocated by the CPUC among the customers of SCE, Pacific Gas and Electric (PG&E) and San Diego Gas & Electric (SDG&E) (collectively, the investor-owned utilities). SCE bills and collects from its customers the costs of power purchased and sold by the CDWR, CDWR bond-related charges and direct access exit fees. The CDWR-related charges and a portion of direct access exit fees (approximately $1.9 billion was collected in 2005) are remitted directly to the CDWR and are not recognized as revenue by SCE and therefore have no impact on SCE’s earnings; however they do impact customer rates. Impact of Regulatory Matters on Customer Rates SCE is concerned about high customer rates, which were a contributing factor that led to the deregulation of the electric services industry during the mid-1990s. At January 1, 2005, SCE’s system average rate for bundled customers was 12.2¢-per-kilowatt-hour. As of December 31, 2005, the system average rate was 12.6¢-per-kilowatt-hour. On January 1, 2006, SCE implemented a rate change that resulted in a system average rate of 13.7¢-per-kilowatt-hour. Of the 1.1¢ rate increase, 1¢ was due to the implementation of the CDWR’s 2006 revenue requirement approved by the CPUC on December 1, 2005. SCE implemented a rate change on February 4, 2006. As a result, SCE’s current system average rate is 14.3¢-per-kilowatt-hour. The rate increase was due to a 1.2¢ increase resulting from the implementation of SCE’s 2006 Energy Resource Recovery Account (ERRA) forecast discussed below, partially offset by a decrease of 0.7¢ due to spreading of the revenue requirement over a larger customer base resulting from forecast sales growth. In addition, the rate change includes authorized increases in funding for demand-side management programs. Current Regulatory Developments This section of the MD&A describes significant regulatory issues that may impact SCE’s financial condition or results of operation. 2006 General Rate Case Proceeding SCE’s 2006 GRC application requested a revised 2006 base rate revenue requirement of $3.96 billion, an increase of $325 million over SCE’s 2005 base rate revenue. The requested increase is primarily driven by capital expenditures needed to accommodate infrastructure replacement and customer and load growth, and by higher operating and maintenance expenses, particularly in SCE’s transmission and distribution business unit. SCE also requested the CPUC continue SCE’s existing post-test year rate-making mechanism, which would result in further revised base rate revenue increases of $108 million in 2007 and $113 million in 2008. On January 17, 2006, the assigned administrative law judge issued his proposed decision, which would result in a 2006 base rate revenue requirement of $3.70 billion, an increase of $61 million over SCE’s 2005 base rate revenue. The proposed draft decision contained an error understating the revised 2006 increase. When corrected, the 2006 revenue requirement increase would be $85 million. The proposed decision would reject approximately $121 million of O&M expenses and $143 million of the capital-related revenue requirement that SCE requested. The proposed decision would also reject SCE’s post-test year rate-making method and instead escalate 2006 gross additions to 2007 and 2008. The proposed decision’s changes would result in base rate revenue increases of $68 million in 2007 and $105 million in 2008. A final CPUC decision is expected by the end of April 2006. SCE cannot predict with certainty the final outcome of SCE’s GRC application. On January 12, 2006, the CPUC approved SCE’s request for a GRC memorandum account, which makes the revenue requirement ultimately adopted by the CPUC effective as of that date.

10
____________________________________________________________________________________ Management’s Discussion and Analysis of Financial Condition and Results of Operations 2006 Cost of Capital Proceeding On December 15, 2005, the CPUC granted SCE’s requested rate-making capital structure of 43% long-term debt, 9% preferred equity and 48% common equity for 2006. The CPUC also authorized SCE’s 2006 cost of long-term debt of 6.17%, cost of preferred equity of 6.09% and a return on common equity of 11.60%. The CPUC decision resulted in a $23 million decrease in SCE’s annual revenue requirement due to lower interest costs partially offset by an increase in return on common equity. 2006 FERC Rate Case SCE’s electric transmission revenue and wholesale and retail transmission rates are subject to authorization by the FERC. On November 10, 2005, SCE filed proposed revisions to the 2006 base transmission rates, which would increase SCE’s revenue requirement by $65 million, or 23%, over current base transmission rates, effective on January 10, 2006. On January 9, 2006, FERC accepted the filing, but delayed the rate changes to become effective June 10, 2006, subject to refund. On February 8, 2006, SCE filed a petition for rehearing of the order seeking, among other things, reversal of the FERC’s effective date. SCE is unable to predict the revenue requirement that the FERC will ultimately authorize and when the rate changes will become effective. Energy Resource Recovery Account Proceedings In 2002, the CPUC established the ERRA as the balancing account mechanism to track and recover SCE’s: (1) fuel costs related to its generating stations; (2) purchased-power costs related to cogeneration and renewable contracts; (3) purchased-power costs related to existing interutility and bilateral contracts that were entered into before January 17, 2001; and (4) procurement-related costs incurred on or after January 1, 2003 (the date on which the CPUC transferred back to SCE the responsibility for procuring energy resources for its customers). As described above, SCE recovers these costs on a cost-recovery basis, with no markup for return or profit. SCE files annual forecasts of the above-described costs that it expects to incur during the following year. If the forecast is approved, as these costs are subsequently incurred they are tracked and recovered in customer rates through the ERRA, but are subject to a reasonableness review in a separate annual ERRA application. If the ERRA overcollection or undercollection exceeds 5% of SCE’s prior year’s generation revenue, the CPUC has established a “trigger” mechanism, whereby SCE can request an emergency rate adjustment. As of December 31, 2005, the ERRA was undercollected by $42 million, which was 1.28% of SCE’s prior year’s generation revenue. ERRA Forecast On January 26, 2006, the CPUC approved SCE’s 2006 ERRA forecast application, in which it forecasted a power procurement-related revenue requirement for the 2006 calendar year of $4.3 billion, an increase of $961 million over SCE’s approved 2005 power procurement-related revenue requirement. The increase was mainly attributable to the substantial increase in natural gas and power prices, load growth and resource adequacy requirements (see the discussion under “—Resource Adequacy Requirements”), the unavailability of Mohave after December 31, 2005, and its replacement with higher-cost natural gas generation (see “—Mohave Generating Station and Related Proceedings”). The increase was implemented in customer rates beginning February 4, 2006. ERRA Reasonableness Review From September 1, 2001 through December 31, 2004, the CPUC found all costs recorded in SCE’s ERRA account reasonable and prudent, except for minor amounts in 2001.
11
____________________________________________________________________________________ Edison International
In addition, from September 1, 2001 through June 30, 2003, the CPUC authorized recovery of amounts paid to Peabody Coal Company for costs associated with the Mohave mine closing, as well as transmission costs related to serving municipal utilities, and also resolved outstanding issues from 2000 and 2001 related to CDWR costs. As a result of this decision, SCE recorded a benefit of $118 million in 2004. Resource Adequacy Requirements Under the CPUC’s resource adequacy framework, all load-serving entities in California have an obligation to procure sufficient resources to meet their expected customers’ needs with a 15–17% reserve level. Effective February 16, 2006, SCE was required to demonstrate that it had procured sufficient resources to meet 90% of its June–September 2006 resource adequacy requirement. SCE believes that it has met this requirement. Effective in May 2006, SCE will be required to demonstrate that it has met 100% of its resource adequacy requirement one month in advance of expected need. A month-ahead showing demonstrating that SCE has procured 100% of its resource adequacy requirement will be required every month thereafter. The resource adequacy framework provides for penalties of 150% of the cost of new monthly capacity for failing to meet the resource adequacy requirements in 2006, and a 300% penalty in 2007 and beyond. SCE believes it has procured sufficient resources to meet its expected resource adequacy requirements for 2006. In December 2005, the CPUC opened a new resource adequacy rulemaking to address resource adequacy implementation issues, the implementation of local resource adequacy requirements, and other issues related to resource adequacy. A decision on local resource adequacy requirements is expected in June 2006. Procurement of Renewable Resources California law requires SCE to increase its procurement of renewable resources by at least 1% of its annual retail electricity sales per year so that 20% of its annual electricity sales are procured from renewable resources by no later than December 31, 2017. The Joint Energy Action Plan adopted in 2003 by the CPUC and the California Energy Commission (CEC) accelerated the deadline to 2010. SCE entered into a contract with Calpine Energy Services, L.P. (Calpine) to purchase the output of certain existing geothermal facilities in northern California. On January 30, 2003, the CPUC issued a resolution approving the contract. SCE interpreted the resolution as authorizing SCE to count all of the output of the geothermal facilities towards the obligation to increase SCE’s procurement from renewable resources and counted the entire output of the facilities toward its 1% obligation in 2003, 2004 and 2005. On July 21, 2005, the CPUC issued a decision stating that SCE can only count procurement pursuant to the Calpine contract towards its 1% annual renewable procurement requirement if it is certified as “incremental” by the CEC. On February 1, 2006, the CEC certified approximately 25% and 17% of SCE’s 2003 and 2004 procurement, respectively, from the Calpine geothermal facilities as “incremental.” A similar outcome is anticipated with respect to the CEC’s certification review for 2005. On August 26, 2005, SCE filed an application for rehearing and a petition for modification of the CPUC’s July 21, 2005 decision. On January 26, 2006, the CPUC denied SCE’s application for rehearing of the decision. The CPUC has not yet ruled on SCE’s petition for modification. The petition for modification seeks a clarification that SCE will not be subjected to penalties for relying on the CPUC’s 2003 resolution in submitting compliance reports to the CPUC and planning its subsequent renewable procurement activities. The petition for modification also seeks an express finding that the decision will be applied prospectively only; i.e., that no past procurement deficits will accrue for any prior period based on the decision.

12
____________________________________________________________________________________ Management’s Discussion and Analysis of Financial Condition and Results of Operations If SCE is not successful in its attempt to modify the July 21, 2005 CPUC decision and can only count the output deemed “incremental” by the CEC, SCE could have deficits in meeting its renewable procurement obligations for 2003 and 2004. However, based on the CPUC’s rules for compliance with renewable procurement targets, SCE believes that it will have until 2007 to make up these deficits before becoming subject to penalties for those years. The CEC’s and the CPUC’s treatment of the output from the geothermal facilities could also result in SCE being deemed to be out of compliance in 2005 and 2006. Under current CPUC decisions, potential penalties for SCE’s failure to achieve its renewable procurement obligations for any year will be considered by the CPUC in SCE’s annual compliance filing. On December 20, 2005, Calpine and certain of its affiliates initiated Chapter 11 bankruptcy proceedings in the United States Bankruptcy Court for the Southern District of New York. As part of those proceedings, Calpine sought to reject its contract with SCE as of the petition filing date. On January 27, 2006, after the matter had been withdrawn from the Bankruptcy Court’s jurisdiction, the United States District Court for the Southern District of New York denied Calpine’s motion to reject the contract and ruled that the FERC has exclusive jurisdiction to alter the terms of the contract with SCE. Calpine has appealed the District Court’s ruling to the United States Court of Appeals for the Second Circuit. Calpine may also file a petition with the FERC seeking authorization to reject the contract. The CPUC may take the position that any authorized rejection of the contract would cause SCE to be out of compliance with its renewable procurement obligations during any period in which renewable electricity deliveries are reduced or eliminated as a result of the rejection. Further, in December 2005, SCE made filings advising the CPUC that the need for transmission upgrades to interconnect new renewable projects and the time it will take under the current process to license and construct such transmission upgrades may prevent SCE from meeting its statutory renewables procurement obligations through 2010 and potentially beyond 2010 depending in part on the results of a pending solicitation for new renewable resources. SCE has requested that the CPUC take several actions in order to expedite the licensing process for transmission upgrades. The CPUC may take the position that SCE’s failure to meet the 20% goal by 2010 due to transmission constraints would cause SCE to be out of compliance with its renewable procurement obligations. Under the CPUC’s current rules, the maximum penalty for failing to achieve renewables procurement targets is $25 million per year. SCE cannot predict with certainty whether it will be assessed penalties. Mohave Generating Station and Related Proceedings Mohave obtained all of its coal supply from the Black Mesa Mine in northeast Arizona, located on lands of the Navajo Nation and Hopi Tribe (the Tribes). This coal was delivered from the mine to Mohave by means of a coal slurry pipeline, which requires water from wells located on lands belonging to the Tribes in the mine vicinity. Uncertainty over a post-2005 coal and water supply has prevented SCE and other Mohave co-owners from making approximately $1.1 billion in Mohave-related investments (SCE’s share is $605 million), including the installation of enhanced pollution-control equipment that must be put in place in order for Mohave to continue to operate beyond 2005, pursuant to a 1999 consent decree concerning air quality. Negotiations, water studies, and other efforts have continued among the relevant parties in an attempt to resolve Mohave’s post-2005 coal and water supply issues. Although progress has been made with respect to certain issues, no complete resolution has been reached to date, and efforts to resolve these issues continue. The plant ceased operations, as scheduled, on December 31, 2005, consistent with the provisions of the 1999 consent decree. SCE remains committed to the environmental objectives underlying that decree. SCE is also committed to pursuing all reasonable options to return Mohave to service pursuant to the existing consent decree provisions or, if interim operation is permitted pending installation of controls, pursuant to additional legal provisions which provide appropriate protection of
13
____________________________________________________________________________________ Edison International
the environment. However, at this time, SCE does not know the length of the shutdown period, and a permanent shutdown remains possible. The outcome of the efforts to resolve the post-2005 coal and water supply issues did not impact Mohave’s operation through 2005, but the presence or absence of Mohave as an available resource beyond 2005 will impact SCE’s long-term resource plan. SCE’s 2006 ERRA forecast application assumes Mohave is an unavailable resource for power for 2006 (see “—Energy Resource Recovery Account Proceedings—ERRA Forecast” for further discussion). SCE expects to recover Mohave shut-down costs in customer rates. In light of the issues discussed above, in 2002 SCE concluded that it was probable Mohave would be shut down at the end of 2005. Because the expected undiscounted cash flows from the plant during the years 2003–2005 were less than the $88 million carrying value of the plant as of December 31, 2002, SCE incurred an impairment charge of $61 million in 2002. However, in accordance with accounting standards for rate-regulated enterprises, this incurred charge was deferred and recorded in regulatory assets as a long-term receivable based on SCE’s expectation that the unrecovered book value at the end of 2005 would be recovered in future rates (together with a reasonable return) through a balancing account mechanism. Subsequent charges related to capital additions were also deferred and recorded in regulatory assets. As of December 31, 2005 the regulatory balance related to the Mohave impairment was $81 million. For additional matters related to Mohave, see “SCE: Other Developments—Navajo Nation Litigation.” San Onofre Nuclear Generating Station Steam Generators On December 15, 2005, the CPUC issued a final decision on SCE’s application for replacement of SCE’s San Onofre Units 2 and 3 steam generators. In that decision, the CPUC found that: (1) steam generator replacement is cost-effective; (2) SCE’s estimate of the total cost of steam generator replacement of $680 million ($569 million for replacement steam generator installation and $111 million for removal and disposal of the original steam generators) is reasonable; (3) SCE will be able to recover all of its incurred costs and the CPUC does not intend to conduct an after-the-fact reasonableness review if the project is completed at a cost that does not exceed $680 million as adjusted for inflation and allowance for funds used during construction; (4) a reasonableness review will be required if the project is completed at a cost between $680 million and $782 million or the CPUC later finds that it had reason to believe the costs may be unreasonable regardless of the amount; (5) if the cost of the project exceeds $782 million, no rate recovery will be allowed for costs above $782 million as adjusted for inflation and allowance for funds used during construction; (6) traditional cost-of-service ratemaking should govern recovery of future operating and maintenance and capital expenditures for plant operation; (7) SCE’s actions in relation to the issue of potential claims against the manufacturer of the steam generators or its successors were reasonable; and (8) SDG&E must file an application with the CPUC concerning the transfer of its ownership share of San Onofre Units 2 and 3 to SCE by April 14, 2006. SCE must provide written notice of its acceptance of the conditions set forth in the decision within 85 days. On January 18, 2006, the Utility Reform Network and California Earth Corps filed an application for rehearing challenging, among other things, the cost benefit analysis, rejection of future spending caps, the timing for initiation of the analysis, and the portion of the final decision finding that SCE acted reasonably in pursuing claims against the manufacturer of the steam generators. SCE’s share of the total estimated cost of the steam generator replacement project based on its current ownership percentage of 75.05% is $510 million. SCE and the city of Anaheim have agreed to an early transfer of Anaheim’s 3.16% share of San Onofre, which would increase SCE’s share of the total estimated costs to $532 million. By April 14, 2006, SDG&E is expected to apply to the CPUC to transfer all or a portion of its 20% share of San Onofre to SCE. If SDG&E’s entire 20% share is transferred to SCE, it would increase SCE’s share of the total estimated costs to $668 million. Any transfer of

14
____________________________________________________________________________________ Management’s Discussion and Analysis of Financial Condition and Results of Operations SDG&E’s ownership in San Onofre would require the approval of the CPUC and the FERC. Any transfer of Anaheim’s share in San Onofre would require CPUC approval of ratemaking for SCE’s acquired share and approval by the FERC. Palo Verde Steam Generating Station Steam Generators SCE owns a 15.8% interest in the Palo Verde Nuclear Generating Station (Palo Verde). During 2003, the Palo Verde Unit 2 steam generators were replaced. During 2005, the Palo Verde Unit 1 steam generators were replaced. In addition, the Palo Verde owners have approved the manufacture and installation of steam generators in Unit 3. SCE expects that replacement steam generators will be installed in Unit 3 in 2008. SCE’s share of the costs of manufacturing and installing all the replacement steam generators at Palo Verde is estimated to be approximately $115 million. The CPUC approved the replacement costs for Unit 2 in the 2003 GRC. The proposed decision in the 2006 GRC proceeding would allow SCE to recover the replacement costs for Units 1 and 3. ISO Disputed Charges On April 20, 2004, the FERC issued an order concerning a dispute between the ISO and the Cities of Anaheim, Azusa, Banning, Colton and Riverside, California over the proper allocation and characterization of certain charges. The order reversed an arbitrator’s award that had affirmed the ISO’s characterization in May 2000 of the charges as Intra-Zonal Congestion costs and allocation of those charges to scheduling coordinators (SCs) in the affected zone within the ISO transmission grid. The April 20, 2004 order directed the ISO to shift the costs from SCs in the affected zone to the responsible participating transmission owner, SCE. The potential cost to SCE, net of amounts SCE expects to receive through the California Power Exchange (PX), SCE’s SC at the time, is estimated to be approximately $20 million to $25 million, including interest. On April 20, 2005, the FERC stayed its April 20, 2004 order during the pendency of SCE’s appeal filed with the Court of Appeals for the D.C. Circuit. On February 7, 2006, the FERC advised SCE that the FERC will move the Court of Appeals for a voluntary remand so that the FERC may amend the order on appeal. A decision is expected in late 2006. The FERC may require SCE to pay these costs, but SCE does not believe this outcome is probable. If SCE is required to pay these costs, SCE may seek recovery in its reliability service rates. Transmission Proceeding In August and November 2002, the FERC issued opinions affirming a September 1999 administrative law judge decision to disallow, among other things, recovery by SCE and the other California public utilities of costs reflected in network transmission rates associated with ancillary services and losses incurred by the utilities in administering existing wholesale transmission contracts after implementation of the restructured California electric industry. SCE has incurred approximately $80 million of these unrecovered costs since 1998. In addition, SCE has accrued interest on these unrecovered costs. The three California utilities appealed the decisions to the Court of Appeals for the D.C. Circuit. On July 12, 2005, the Court of Appeals for the D.C. Circuit vacated the FERC’s August and November 2002 orders, and remanded the case to the FERC for further proceedings. On December 20, 2005, the FERC authorized SCE and the other California public utilities to recover the costs through their existing FERC tariffs. As a result, SCE recorded a benefit of approximately $93 million (including $23 million related to interest which is reflected in the consolidated statements of income caption “Interest expense – net of amounts capitalized”). FERC Refund Proceedings In 2000, the FERC initiated an investigation into the justness and reasonableness of rates charged by sellers of electricity in the PX and ISO markets. On March 26, 2003, the FERC staff issued a report concluding that there had been pervasive gaming and market manipulation of both the electric and natural

15
____________________________________________________________________________________ Edison International
gas markets in California and on the West Coast during 2000–2001 and describing many of the techniques and effects of that market manipulation. SCE is participating in several related proceedings seeking recovery of refunds from sellers of electricity and natural gas who manipulated the electric and natural gas markets. SCE is required to refund to customers 90% of any refunds actually realized by SCE net of litigation costs, except for the El Paso Natural Gas Company settlement agreement discussed below, and 10% will be retained by SCE as a shareholder incentive. A brief summary of the various settlements is below: • In June 2004, SCE received its first settlement payment of $76 million resulting from a settlement
agreement with El Paso Natural Gas Company. Approximately $66 million of this amount was credited to purchased-power expense, and was refunded to SCE’s ratepayers through the ERRA mechanism over the following twelve months, and the remaining $10 million was used to offset SCE’s incurred legal costs. In May 2005, SCE received its final settlement payment of $66 million, which was also refunded to ratepayers through the ERRA mechanism.
• In August 2004, SCE received its $37 million share of settlement proceeds resulting from a FERC approved settlement agreement with The Williams Cos. and Williams Power Company.
• In November 2004, SCE received its $42 million share of settlement proceeds resulting from a FERC-approved settlement agreement with West Coast Power, LLC and its owners, Dynegy Inc. and NRG Energy, Inc.
• In January 2005, SCE received its $45 million share of settlement proceeds resulting from a FERC-approved settlement agreement with Duke Energy Corporation and a number of its affiliates.
• In April 2005, the FERC approved a settlement agreement among SCE, PG&E, SDG&E and several governmental entities, and Mirant Corporation and a number of its affiliates (collectively Mirant), all of whom are debtors in Chapter 11 bankruptcy proceedings pending in Texas. In April and May 2005, SCE received its $68 million share of the cash portion of the settlement proceeds. SCE also received a $33 million share of an allowed, unsecured claim in the bankruptcy of one of the Mirant parties which was sold for $35 million in December 2005.
• In November 2005, the FERC approved a settlement agreement among SCE, PG&E, SDG&E and several governmental entities, and Enron Corporation and a number of its affiliates (collectively Enron), most of which are debtors in Chapter 11 bankruptcy proceedings pending in New York. In January 2006, SCE received cash settlement proceeds of $4 million for legal fees and anticipates receiving approximately $5 million in additional cash proceeds assuming certain contingencies are satisfied. SCE also received an allowed, unsecured claim against one of the Enron debtors in the amount of $241 million. In February 2006, SCE received a partial distribution of $10 million of its allowed claim. The remaining amount of the allowed claim that will actually be realized will depend on events in Enron’s bankruptcy that impact the value of the relevant debtor estate.
• In December 2005, the FERC approved a settlement agreement among SCE, PG&E, SDG&E, several governmental entities and certain other parties, and Reliant Energy, Inc. and a number of its affiliates (collectively Reliant). In January 2006, SCE received $65 million of the settlement proceeds. SCE expects to receive an additional $66 million in 2006.
During 2005, SCE recognized $23 million in shareholder incentives related to the FERC refunds described above which is reflected in the consolidated statements of income caption “Other nonoperating income.” Holding Company Order Instituting Rulemaking On October 27, 2005, the CPUC issued an order instituting rulemaking (OIR) to allow the CPUC to re-examine the relationships of the major California energy utilities with their parent holding companies

16
____________________________________________________________________________________ Management’s Discussion and Analysis of Financial Condition and Results of Operations and non-regulated affiliates. The OIR was issued in part in response to the recent repeal of the Public Utility Holding Company Act of 1935. By means of the OIR, the CPUC will consider whether additional rules to supplement existing rules and requirements governing relationships between the public utilities and their holding companies and non-regulated affiliates should be adopted. Any additional rules will focus on whether (1) the public utilities retain enough capital or access to capital to meet their customers’ infrastructure needs and (2) mitigation of potential conflicts between ratepayer interests and the interests of holding companies and affiliates that could undermine the public utilities’ ability to meet their public service obligations at the lowest cost. Demand-Side Management and Energy Efficiency Performance Incentive Mechanisms Under a variety of incentive mechanisms adopted by the CPUC in the past, SCE was entitled to certain shareholder incentives for its performance achievements in delivering demand-side management and energy efficiency programs. On June 10, 2005, SCE and the CPUC’s Division of Ratepayer Advocates executed a settlement agreement for SCE’s outstanding issues concerning SCE shareholder incentives and performance achievements resulting from the demand-side management, energy efficiency, and low-income energy efficiency programs from program years 1994–2004. In addition, the settlement addresses shareholder incentives anticipated but not yet claimed for performance achievements in program years 1994–1998. The settling parties agreed that it is reasonable for SCE to recover approximately $42 million of these claims plus interest in the near future as full recovery of all of SCE’s outstanding claims as well as future claims related to SCE’s pre-1998 energy efficiency programs. On October 27, 2005, the CPUC approved the settlement agreement. As a result of the decision, SCE recognized a $45 million benefit in 2005 for the claims settled and other related items, reflected in the consolidated statements of income caption “Other nonoperating income.” Investigations Regarding Performance Incentives Rewards SCE is eligible under its CPUC-approved PBR mechanism to earn rewards or penalties based on its performance in comparison to CPUC-approved standards of customer satisfaction, employee injury and illness reporting, and system reliability. SCE has been conducting investigations into its performance under these PBR mechanisms and has reported to the CPUC certain findings of misconduct and misreporting as further discussed below. As a result of the reported events, the CPUC could institute its own proceedings to determine whether and in what amounts to order refunds or disallowances of past and potential PBR rewards for customer satisfaction, injury and illness reporting, and system reliability portions of PBR. The CPUC also may consider whether to impose additional penalties on SCE. SCE cannot predict with certainty the outcome of these matters or estimate the potential amount of refunds, disallowances, and penalties that may be required. Customer Satisfaction SCE received two letters in 2003 from one or more anonymous employees alleging that personnel in the service planning group of SCE’s transmission and distribution business unit altered or omitted data in attempts to influence the outcome of customer satisfaction surveys conducted by an independent survey organization. The results of these surveys are used, along with other factors, to determine the amounts of any incentive rewards or penalties to SCE under the PBR provisions for customer satisfaction. SCE recorded aggregate customer satisfaction rewards of $28 million for the years 1998, 1999 and 2000. Potential customer satisfaction rewards aggregating $10 million for the years 2001 and 2002 are pending
17
____________________________________________________________________________________ Edison International
before the CPUC and have not been recognized in income by SCE. SCE also anticipated that it could be eligible for customer satisfaction rewards of approximately $10 million for 2003. Following its internal investigation, SCE proposed to refund to ratepayers $7 million of the PBR rewards previously received and forgo an additional $5 million of the PBR rewards pending that are both attributable to the design organization’s portion of the customer satisfaction rewards for the entire PBR period (1997–2003). In addition, SCE also proposed to refund all of the approximately $2 million of customer satisfaction rewards associated with meter reading. As a result of these findings, SCE accrued a $9 million charge in the caption “Other nonoperating deductions” on the income statement in 2004 for the potential refunds of rewards that have been received. SCE has taken remedial action as to the customer satisfaction survey misconduct by severing the employment of several supervisory personnel, updating system process and related documentation for survey reporting, and implementing additional supervisory controls over data collection and processing. Performance incentive rewards for customer satisfaction expired in 2003 pursuant to the 2003 GRC. The CPUC has not yet opened a formal investigation into this matter. However, it has submitted several data requests to SCE and has requested an opportunity to interview a number of SCE employees in the design organization. SCE has responded to these requests and the CPUC has conducted interviews of approximately 20 employees who were disciplined for misconduct and four senior managers and executives of the transmission and distribution business unit. Employee Injury and Illness Reporting In light of the problems uncovered with the customer satisfaction surveys, SCE conducted an investigation into the accuracy of SCE’s employee injury and illness reporting. The yearly results of employee injury and illness reporting to the CPUC are used to determine the amount of the incentive reward or penalty to SCE under the PBR mechanism. Since the inception of PBR in 1997, SCE has received $20 million in employee safety incentives for 1997 through 2000 and, based on SCE’s records, may be entitled to an additional $15 million for 2001 through 2003. On October 21, 2004, SCE reported to the CPUC and other appropriate regulatory agencies certain findings concerning SCE’s performance under the PBR incentive mechanism for injury and illness reporting. SCE disclosed in the investigative findings to the CPUC that SCE failed to implement an effective recordkeeping system sufficient to capture all required data for first aid incidents. As a result of these findings, SCE proposed to the CPUC that it not collect any reward under the mechanism for any year before 2005, and it return to ratepayers the $20 million it has already received. Therefore, SCE accrued a $20 million charge in the caption “Other nonoperating deductions” on the income statement in 2004 for the potential refund of these rewards. SCE has also proposed to withdraw the pending rewards for the 2001–2003 time frames. SCE has taken other remedial action to address the issues identified, including revising its organizational structure and overall program for environmental, health and safety compliance and disciplining employees who committed wrongdoing. SCE submitted a report on the results of its investigation to the CPUC on December 3, 2004. As with the customer satisfaction matter, the CPUC has not yet opened a formal investigation into this matter.

18
____________________________________________________________________________________ Management’s Discussion and Analysis of Financial Condition and Results of Operations System Reliability In light of the problems uncovered with the PBR mechanisms discussed above, SCE conducted an investigation into the third PBR metric, system reliability. On February 28, 2005, SCE provided its final investigatory report to the CPUC concluding that the reliability reporting system is working as intended. SCE: OTHER DEVELOPMENTS Navajo Nation Litigation In June 1999, the Navajo Nation filed a complaint in the United States District Court for the District of Columbia (D.C. District Court) against Peabody Holding Company (Peabody) and certain of its affiliates, Salt River Project Agricultural Improvement and Power District, and SCE arising out of the coal supply agreement for Mohave. The complaint asserts claims for, among other things, violations of the federal Racketeer Influenced and Corrupt Organizations statute, interference with fiduciary duties and contractual relations, fraudulent misrepresentation by nondisclosure, and various contract-related claims. The complaint claims that the defendants’ actions prevented the Navajo Nation from obtaining the full value in royalty rates for the coal supplied to Mohave. The complaint seeks damages of not less than $600 million, trebling of that amount, and punitive damages of not less than $1 billion, as well as a declaration that Peabody’s lease and contract rights to mine coal on Navajo Nation lands should be terminated. SCE joined Peabody’s motion to strike the Navajo Nation’s complaint. In addition, SCE and other defendants filed motions to dismiss. The D.C. District Court denied these motions for dismissal, except for Salt River Project Agricultural Improvement and Power District’s motion for its separate dismissal from the lawsuit. Certain issues related to this case were addressed by the United States Supreme Court in a separate legal proceeding filed by the Navajo Nation in the United States Court of Federal Claims against the United States Department of Interior. In that action, the Navajo Nation claimed that the Government breached its fiduciary duty concerning negotiations relating to the coal lease involved in the Navajo Nation’s lawsuit against SCE and Peabody. On March 4, 2003, the Supreme Court concluded, by majority decision, that there was no breach of a fiduciary duty and that the Navajo Nation did not have a right to relief against the Government. Based on the Supreme Court’s conclusion, SCE and Peabody brought motions to dismiss or for summary judgment in the D.C. District Court action but the D.C. District Court denied the motions on April 13, 2004. The Court of Appeals for the Federal Circuit, acting on a suggestion filed by the Navajo Nation on remand from the Supreme Court’s March 4, 2003 decision held, in an October 24, 2003 decision that the Supreme Court’s decision was focused on three specific statutes or regulations and therefore did not address the question of whether a network of other statutes, treaties and regulations imposed judicially enforceable fiduciary duties on the United States during the time period in question. On March 16, 2004, the Federal Circuit issued an order remanding the case against the Government to the Court of Federal Claims, which considered (1) whether the Navajo Nation previously waived its “network of other laws” argument and, (2) if not, whether the Navajo Nation can establish that the Government breached any fiduciary duties pursuant to such “network.” On December 20, 2005, the Court of Federal Claims issued its ruling and found that although there was no waiver, the Navajo Nation did not establish that a “network of other laws” created a judicially enforceable trust obligation. The Navajo Nation filed a notice of appeal from this ruling on February 14, 2006. Pursuant to a joint request of the parties, the D.C. District Court granted a stay of the action in that court to allow the parties to attempt to resolve, through facilitated negotiations, all issues associated with Mohave. Negotiations are ongoing and the stay has been continued until further order of the court.

19
____________________________________________________________________________________ Edison International
SCE cannot predict with certainty the outcome of the 1999 Navajo Nation’s complaint against SCE, the impact on the complaint of the Supreme Court’s decision and the recent Court of Federal Claims ruling in the Navajo Nation’s suit against the Government, or the impact of the complaint on the possibility of resumed operation of Mohave following the cessation of operation on December 31, 2005. SCE: MARKET RISK EXPOSURES SCE’s primary market risks include fluctuations in interest rates, commodity prices and volumes, and counterparty credit. Fluctuations in interest rates can affect earnings and cash flows. Fluctuations in commodity prices and volumes and counterparty credit losses however may temporarily affect cash flows, but are not expected to affect earnings due to expected recovery through regulatory mechanisms. SCE uses derivative financial instruments, as appropriate, to manage its market risks. Interest Rate Risk SCE is exposed to changes in interest rates primarily as a result of its borrowing and investing activities used for liquidity purposes, to fund business operations, and to finance capital expenditures. The nature and amount of SCE’s long-term and short-term debt can be expected to vary as a result of future business requirements, market conditions and other factors. In addition, SCE’s authorized return on common equity (11.4% for 2005 and 11.6% for 2006), which is established in SCE’s annual cost of capital proceeding, is set on the basis of forecasts of interest rates and other factors. At December 31, 2005, SCE did not believe that its short-term debt and current portion of long-term debt was subject to interest rate risk, due to the fair market value being approximately equal to the carrying value. At December 31, 2005, the fair market value of SCE’s long-term debt was $4.8 billion. A 10% increase in market interest rates would have resulted in a $233 million decrease in the fair market value of SCE’s long-term debt. A 10% decrease in market interest rates would have resulted in a $256 million increase in the fair market value of SCE’s long-term debt. Commodity Price Risk SCE forecasts that it will have a net-long position (generation supply exceeds expected load requirements) in the majority of hours during 2006. SCE’s net-long position arises primarily from resource adequacy requirements set by the CPUC which require SCE to acquire and demonstrate enough generating capacity in its portfolio for a planning reserve margin of 15–17% above its peak load as forecast for an average year (see “SCE: Regulatory Matters—Current Regulatory Developments—Resource Adequacy Requirements”). SCE has incorporated a 2005 price and volume forecast from expected sales of net-long power in its 2006 revenue forecast used for setting rates. If actual prices or volumes vary from forecast, SCE’s cash flow could be temporarily impacted due to regulatory recovery delays, but such variations are not expected to affect earnings. For 2006, SCE forecasts that at certain times it will have a net-short position (expected load requirements exceed generation supply). SCE’s forecast net-short position is expected to increase each year, assuming no new generation supply is added, existing contracts expire, SCE generating plants retire, and load grows. The establishment of a sufficient planning reserve margin mitigates, to some extent, several conditions that could increase SCE’s net-short position, including lower utility generation due to expected or unexpected outages or plant closures, lower deliveries under third-party power contracts, or higher than anticipated demand for electricity. However, SCE’s planning reserve margin may not be sufficient to supply the needs of all returning direct access customers (customers who choose to purchase power directly from an electric service provider other than SCE but then decide to return to utility service). Increased procurement costs

20
____________________________________________________________________________________ Management’s Discussion and Analysis of Financial Condition and Results of Operations resulting from the return of direct access customers could lead to temporary undercollections and the need to adjust rates. SCE anticipates purchasing additional capacity and/or ancillary services to meet its peak-energy requirements in 2006 and beyond if its net-short position is significantly higher than SCE’s current forecast. As of December 31, 2005, SCE entered into energy options and tolling arrangements and forward physical contracts to mitigate its exposure to energy prices in the spot market. The fair market value of the energy options and tolling arrangements as of December 31, 2005, was a net asset of $25 million. A 10% increase in energy prices would have resulted in a $208 million increase in the fair market value. A 10% decrease in energy prices would have resulted in a $143 million decrease in the fair market value. The fair market value of the forward physical contracts as of December 31, 2005, was a net liability of $49 million. A 10% increase in energy prices would have resulted in a $52 million increase in the fair market value. A 10% decrease in energy prices would have resulted in a $53 million decrease in the fair market value. SCE is also exposed to increases in natural gas prices related to its qualifying facilities (QF) contracts, fuel tolling arrangements, and owned gas-fired generation, including the Mountainview project. SCE purchases power from QFs under CPUC-mandated contracts. Contract energy prices for most nonrenewable QFs are based in large part on the monthly southern California border price of natural gas. In addition to the QF contracts, SCE has power contracts in which SCE has agreed to provide the natural gas needed for generation under those power contracts, which are known as fuel tolling arrangements. SCE has an active gas fuel hedging program in place to minimize ratepayer exposure to spot market price spikes. However, movements in gas prices over time will impact SCE’s gas costs and the cost of QF power which is related to natural gas prices. As of December 31, 2005, SCE entered into gas forward transactions including options, swaps and futures, and fixed price contracts to mitigate its exposure related to the QF contracts and fuel tolling arrangements. The fair market value of the forward transactions as of December 31, 2005, was a net asset of $105 million. A 10% increase in gas prices would have resulted in a $105 million increase in the fair market value. A 10% decrease in gas prices would have resulted in a $104 million decrease in the fair market value. SCE cannot predict with certainty whether in the future it will be able to hedge customer risk for other commodities on favorable terms or that the cost of such hedges will be fully recovered in rates. SCE’s purchased-power costs, as well as its gas expenses and gas hedging costs, are recovered through ERRA. To the extent SCE conducts its power and gas procurement activities in accordance with its CPUC-authorized procurement plan, California statute (Assembly Bill 57) establishes that SCE is entitled to full cost recovery. As a result of these regulatory mechanisms, changes in energy prices may impact SCE’s cash flows but are not expected to affect earnings. Certain SCE activities, such as contract administration, SCE’s duties as the CDWR’s limited agent for allocated CDWR contracts, and portfolio dispatch, are reviewed annually by the CPUC for reasonableness. The CPUC has currently established a maximum disallowance cap of $37 million for these activities. In accordance with CPUC decisions, SCE, as the CDWR’s limited agent, performs certain services for CDWR contracts allocated to SCE by the CPUC, including arranging for natural gas supply. Financial and legal responsibility for the allocated contracts remains with the CDWR. The CDWR, through coordination with SCE, has hedged a portion of its expected natural gas requirements for the gas tolling contracts allocated to SCE. Increases in gas prices over time, however, will increase the CDWR’s gas costs. California state law permits the CDWR to recover its actual costs through rates established by the CPUC. This would affect rates charged to SCE’s customers, but would not affect SCE’s earnings or cash flows.

21
____________________________________________________________________________________ Edison International
Quoted market prices, if available, are used for determining the fair value of contracts, as discussed above. If quoted market prices are not available, internally maintained standardized or industry accepted models are used to determine the fair value. The models are updated with spot prices, forward prices, volatilities and interest rates from regularly published and widely distributed independent sources. Credit Risk Credit risk arises primarily due to the chance that a counterparty under various purchase and sale contracts will not perform as agreed or pay SCE for energy products delivered. SCE uses a variety of strategies to mitigate its exposure to credit risk. SCE’s risk management committee regularly reviews procurement credit exposure and approves credit limits for transacting with counterparties. Some counterparties are required to post collateral depending on the creditworthiness of the counterparty and the risk associated with the transaction. SCE follows the credit limits established in its CPUC-approved procurement plan, and accordingly believes that any losses which may occur should be fully recoverable from customers, and therefore are not expected to affect earnings.

22
____________________________________________________________________________________ Management’s Discussion and Analysis of Financial Condition and Results of Operations
MISSION ENERGY HOLDING COMPANY MEHC: LIQUIDITY Introduction MEHC’s liquidity discussion is organized in the following sections: • MEHC (parent)’s Liquidity • EME’s Liquidity • Midwest Generation Financing • Capital Expenditures • Credit Ratings • Margin, Collateral Deposits and Other Credit Support for Energy Contracts • EME’s Liquidity as a Holding Company • Dividend Restrictions in Major Financings MEHC (parent)’s Liquidity MEHC has a 100% ownership interest in EME, which itself operates through its subsidiaries and affiliates. MEHC has no business activities other than through its ownership interest in EME and has outstanding approximately $800 million of 13.50% senior secured notes due in 2008. MEHC’s ability to honor its obligations under the senior secured notes is substantially dependent upon the receipt of dividends from EME and the receipt of tax-allocation payments from MEHC’s parent, Edison Mission Group, and ultimately Edison International. See “—EME’s Liquidity as a Holding Company—Intercompany Tax-Allocation Agreement.” Dividends to MEHC from EME are limited based on EME’s earnings and cash flow, terms of restrictions contained in EME’s corporate credit facility, business and tax considerations and restrictions imposed by applicable law.
At December 31, 2005, MEHC had cash and cash equivalents of $43 million (excluding amounts held by EME and its subsidiaries). On April 5, 2004, the lenders under MEHC’s $385 million term loan exercised their right to require MEHC to repurchase $100 million of principal amount at par on July 2, 2004. The $100 million principal, plus interest, was paid on July 2, 2004. The remaining $285 million of principal, plus interest, was paid on January 3, 2005.
Dividends to MEHC (parent) In January 2005, EME made total dividend payments of $360 million to MEHC. A portion of these payments was used to repay the remaining $285 million of the term loan plus interest, as discussed above. In 2004, EME made dividend payments totaling $74 million to MEHC. These payments were used together with cash on hand to repurchase $100 million of the principal amount of the term loan, as discussed above. Dividend Restriction in EME’s Corporate Credit Agreement EME’s corporate credit agreement restricts EME’s ability to make distributions if an event of default were to occur and be continuing after giving effect to the distribution. As of December 31, 2005, EME had no borrowings outstanding under this credit agreement.
23
____________________________________________________________________________________ Edison International
EME’s Liquidity At December 31, 2005, EME and its subsidiaries had cash and cash equivalents and short-term investments of $1.3 billion, and EME had available the full amount of borrowing capacity under its $98 million corporate credit facility. EME’s consolidated debt at December 31, 2005 was $3.4 billion. In addition, EME’s subsidiaries had $4.6 billion of long-term lease obligations related to the sale-leaseback transactions that are due over periods ranging up to 29 years. Business Development Plans Wind Business Development EME expects to make significant investments in wind projects during the next several years. Historically, wind projects have received federal subsidies in the form of production tax credits. In August 2005, production tax credits were made available for new wind projects placed in service by December 31, 2007 under EPAct 2005. EME has undertaken a number of key activities with respect to wind projects, including the following: • During 2005, EME entered into agreements to purchase 105 turbines for an aggregate amount of
$236 million and options to acquire an additional 100 turbines. • In December 2005, EME completed the acquisition of the San Juan Mesa wind project. EME expects
to sell 25% of its ownership interest in the San Juan Mesa wind project to a third party in March 2006.
• In January 2006, EME completed the purchase of development rights for the Wildorado project. This project has substantially completed site selection, permitting, and negotiations of power purchase and turbine supply agreements, and has started construction contracting. Project completion is scheduled for April 2007, with total construction costs estimated to be $270 million.
• EME expects to receive, as a capital contribution from its parent, a 196 MW portfolio of wind projects located in Iowa and Minnesota during the first half of 2006. These projects are owned by EME’s affiliate, Edison Capital.
Thermal Business Development EME also expects to make investments in thermal projects during the next several years. As part of this development effort, EME has begun the process of obtaining permits for two sites in Southern California for peaker plants and has responded to several requests for proposals to build or acquire generation. It is expected that the thermal projects in which EME invests will sell electricity under long-term power purchase contracts. EME is also working in partnership with a subsidiary of BP to assess the feasibility of constructing and operating an integrated gasification combined cycle facility which would burn hydrogen gas derived from petroleum coke at BP’s refinery in Carson, California. Midwest Generation Financing On December 15, 2005, Midwest Generation completed a refinancing of indebtedness. The refinancing was effected through the amendment and restatement of Midwest Generation’s existing credit facility, previously amended and restated on April 18, 2005. The credit facility, as previously amended and restated, provided for approximately $343 million of first priority secured institutional term loans due in 2011 and $500 million of first priority secured revolving credit, working capital facilities, $200 million due in 2009 and $300 million due in 2011, with a lender option to require prepayment in 2010.

24
____________________________________________________________________________________ Management’s Discussion and Analysis of Financial Condition and Results of Operations The refinancing consisted of, among other things, a reduction in the interest rate applicable to the term loan and the working capital facilities, and a modification of financial covenants. After giving effect to the refinancing, all the facilities carry a lower interest rate of LIBOR + 1.75%. The maturity date of the repriced term loan remains 2011. The previously existing working capital facilities were combined into one $500 million facility, maturing in 2011, with a lender option to require prepayment in 2010. Also, as part of the refinancing, Midwest Generation’s financial covenants were modified, with its consolidated interest coverage ratio for the immediately preceding four consecutive fiscal quarters required to be at least 1.40 to 1 (increased from 1.25 to 1), and its secured leverage ratio for the 12-month period ended on the last day of the immediately preceding fiscal quarter required to be no greater than 7.25 to 1 (reduced from 8.75 to 1).
As of December 31, 2005, Midwest Generation had $333 million outstanding under its term loan and a $500 million working capital facility available for working capital requirements, including credit support for hedging activities. As of December 31, 2005, approximately $175 million was utilized under the working capital facility.
Capital Expenditures The estimated capital and construction expenditures of EME’s subsidiaries are $390 million, $175 million and $28 million for 2006, 2007 and 2008, respectively. The non-environmental portion of these expenditures relates to the construction of the Wildorado project, purchases of turbines, upgrades to dust collection/mitigation systems and the coal handling system, ash removal improvements and various other projects. EME plans to finance these expenditures with existing subsidiary credit agreements, cash on hand or cash generated from operations. Included in the estimated expenditures are environmental expenditures of $8 million for 2006, $6 million for 2007 and $6 million for 2008. The environmental expenditures relate to environmental projects such as selective catalytic reduction system improvements at the Homer City facilities and projects at the Illinois plants. In addition, EME’s subsidiaries may also make substantial additional capital expenditures as described in “Other Developments—Environmental Matters.” Credit Ratings Overview The credit ratings for MEHC and its subsidiaries, EME, Midwest Generation and EMMT, are as follows:
Moody’s Rating S&P Rating
MEHC B2 CCC+ EME B1 B+ Midwest Generation: First priority senior secured rating Ba3 BB- Second priority senior secured rating B1 B EMMT Not Rated B+
MEHC cannot provide assurance that its current credit ratings or the credit ratings of its subsidiaries will remain in effect for any given period of time or that one or more of these ratings will not be lowered. MEHC notes that these credit ratings are not recommendations to buy, sell or hold its securities and may be revised at any time by a rating agency.

25
____________________________________________________________________________________ Edison International
MEHC does not have any “rating triggers” contained in subsidiary financings that would result in it or EME being required to make equity contributions or provide additional financial support to its subsidiaries.
Credit Rating of EMMT The Homer City sale-leaseback documents restrict EME Homer City’s ability to enter into trading activities, as defined in the documents, with EMMT to sell forward the output of the Homer City facilities if EMMT does not have an investment grade credit rating from Standard & Poor’s or Moody’s or, in the absence of those ratings, if it is not rated as investment grade pursuant to EME’s internal credit scoring procedures. These documents include a requirement that the counterparty to such transactions, and EME Homer City, if acting as seller to an unaffiliated third party, be investment grade. EME currently sells all the output from the Homer City facilities through EMMT, which has a below investment grade credit rating, and EME Homer City is not rated. Therefore, in order for EME to continue to sell forward the output of the Homer City facilities, either: (1) EME must obtain consent from the sale-leaseback owner participant to permit EME Homer City to sell directly into the market or through EMMT; or (2) EMMT must provide assurances of performance consistent with the requirements of the sale-leaseback documents. EME has obtained a consent from the sale-leaseback owner participant that will allow EME Homer City to enter into such sales, under specified conditions, through December 31, 2006. EME Homer City continues to be in compliance with the terms of the consent; however, the consent is revocable by the sale-leaseback owner participant at any time. The sale-leaseback owner participant has not indicated that it intends to revoke the consent; however, there can be no assurance that it will not do so in the future. Revocation of the consent would not affect trades between EMMT and EME Homer City that had been entered into while the consent was still in effect. EME is permitted to sell the output of the Homer City facilities into the spot market at any time. See “MEHC: Market Risk Exposures—Commodity Price Risk—Energy Price Risk Affecting Sales from the Homer City Facilities.” Margin, Collateral Deposits and Other Credit Support for Energy Contracts In connection with entering into contracts in support of EME’s price risk management and energy trading activities (including forward contracts, transmission contracts and futures contracts), EME’s subsidiary, EMMT, has entered into agreements to mitigate the risk of nonperformance. Because the credit ratings of EMMT and EME are below investment grade, EME has historically provided collateral in the form of cash and letters of credit for the benefit of counterparties related to accounts payable and unrealized losses in connection with these price risk management and trading activities. At December 31, 2005, EMMT had deposited $543 million in cash with brokers in margin accounts in support of futures contracts and had deposited $155 million with counterparties in support of forward energy and transmission contracts. In addition, EME had issued letters of credit of $12 million in support of commodity contracts at December 31, 2005. Margin and collateral deposits increased substantially in 2005 due to higher wholesale energy prices and increased megawatt hours hedged under contracts requiring margin and collateral. Future cash collateral requirements may be higher than the margin and collateral requirements at December 31, 2005, if wholesale energy prices increase further or the amount hedged increases. EME estimates that margin and collateral requirements for energy contracts outstanding as of December 31, 2005, could increase during 2006 by approximately $180 million using a 95% confidence level. Midwest Generation has a $500 million working capital facility to support margin requirements specifically related to contracts entered into by EMMT related to the Illinois plants. At December 31, 2005, Midwest Generation had borrowed $170 million under this credit facility to finance margin advances to EMMT of $328 million. The balance of the margining advances by Midwest

26
____________________________________________________________________________________ Management’s Discussion and Analysis of Financial Condition and Results of Operations Generation was provided through cash on hand. In addition, EME has cash on hand and a $98 million working capital facility to provide credit support to subsidiaries. See “—EME’s Liquidity as a Holding Company” for further discussion. EME’s Liquidity as a Holding Company Overview At December 31, 2005, EME had corporate cash and cash equivalents and short-term investments of $1.1 billion to meet liquidity needs. See “—EME’s Liquidity.” Cash distributions from EME’s subsidiaries and partnership investments, and unused capacity under its corporate credit facility represent EME’s major sources of liquidity to meet its cash requirements. The timing and amount of distributions from EME’s subsidiaries may be affected by many factors beyond its control. See “—Dividend Restrictions in Major Financings.”
As security for its obligations under EME’s corporate credit facility, EME has pledged its ownership interests in the holding companies through which it owns its interests in the Illinois plants, the Homer City facilities, the Westside projects and the Sunrise project. EME also granted a security interest in an account into which all distributions received by it from the Big 4 projects are deposited. EME is free to use these distributions unless and until an event of default occurs under its corporate credit facility.
At December 31, 2005, EME also had available $74 million under Midwest Generation EME, LLC’s $100 million letter of credit facility with Citibank, N.A., as Issuing Bank, that expires in December 2006. Under the terms of this letter of credit facility, Midwest Generation EME is required to deposit cash in a bank account in order to cash collateralize any letters of credit that may be outstanding under the facility. The bank account is pledged to the Issuing Bank. Midwest Generation EME owns 100% of Edison Mission Midwest Holdings, which in turn owns 100% of Midwest Generation, LLC.

27
____________________________________________________________________________________ Edison International
Historical Domestic Distributions Received By EME The following table is presented as an aid in understanding the cash flow of EME’s continuing operations and its various subsidiary holding companies which depend on distributions from subsidiaries and affiliates to fund general and administrative costs and debt service costs of recourse debt.
Years Ended December 31, In millions 2005 2004 2003
Distributions from Consolidated Operating Projects: Edison Mission Midwest Holdings (Illinois plants) $ 330 (1) $ 88 $ ⎯ EME Homer City Generation L.P. (Homer City facilities) 86 61 128 (2) Holding companies of other consolidated generating projects 1 1 1 Distributions from Unconsolidated Operating Projects: Edison Mission Energy Funding Corp. (Big 4 Projects)(3) 122 108 98 Four Star Oil & Gas Company ⎯ ⎯ 21 Sunrise Power Company 20 19 69 (4) Holding company for Doga project 17 15 — Holding companies for Westside projects 17 18 25 Holding companies of other unconsolidated operating projects 5 3 7
Total Distributions $ 598 $ 313 $ 349 _________ (1) In April 2005, EME made a capital contribution of $300 million which was used to repay debt. Subsequent to
December 31, 2005, Edison Mission Midwest Holdings made an additional distribution of $185 million. (2) Excludes $34 million distributed by EME Homer City from additional cash on hand due to accelerated payments received
from EMMT. (3) The Big 4 projects are comprised of investments in the Kern River project, Midway-Sunset project, Sycamore project and
Watson project. Distributions reflect the amount received by EME after debt service payments by Edison Mission Energy Funding Corp.
(4) Includes $59 million of the $151 million proceeds from the Sunrise project financing. EME has classified the remaining $92 million as a return of capital.
Intercompany Tax-Allocation Agreement MEHC (parent) and EME are included in the consolidated federal and combined state income tax returns of Edison International and are eligible to participate in tax-allocation payments with other subsidiaries of Edison International in circumstances where domestic tax losses are incurred. The right of MEHC (parent) and EME to receive and the amount of and timing of tax-allocation payments are dependent on the inclusion of MEHC (parent) and EME, respectively, in the consolidated income tax returns of Edison International and its subsidiaries and other factors, including the consolidated taxable income of Edison International and its subsidiaries, the amount of net operating losses and other tax items of MEHC (parent), EME, its subsidiaries, and other subsidiaries of Edison International and specific procedures regarding allocation of state taxes. MEHC (parent) and EME receive tax-allocation payments for tax losses when and to the extent that the consolidated Edison International group generates sufficient taxable income in order to be able to utilize MEHC (parent)’s tax losses or the tax losses of EME in the consolidated income tax returns for Edison International and its subsidiaries. Based on the application of the factors cited above, MEHC (parent) and EME are obligated during periods they generate taxable income to make payments under the tax-allocation agreements. MEHC received $93 million and $22 million in tax-allocation payments from Edison International during 2005 and 2004, respectively. EME paid tax-allocation payments to Edison International of $129 million and $7 million in 2005 and 2004, respectively.
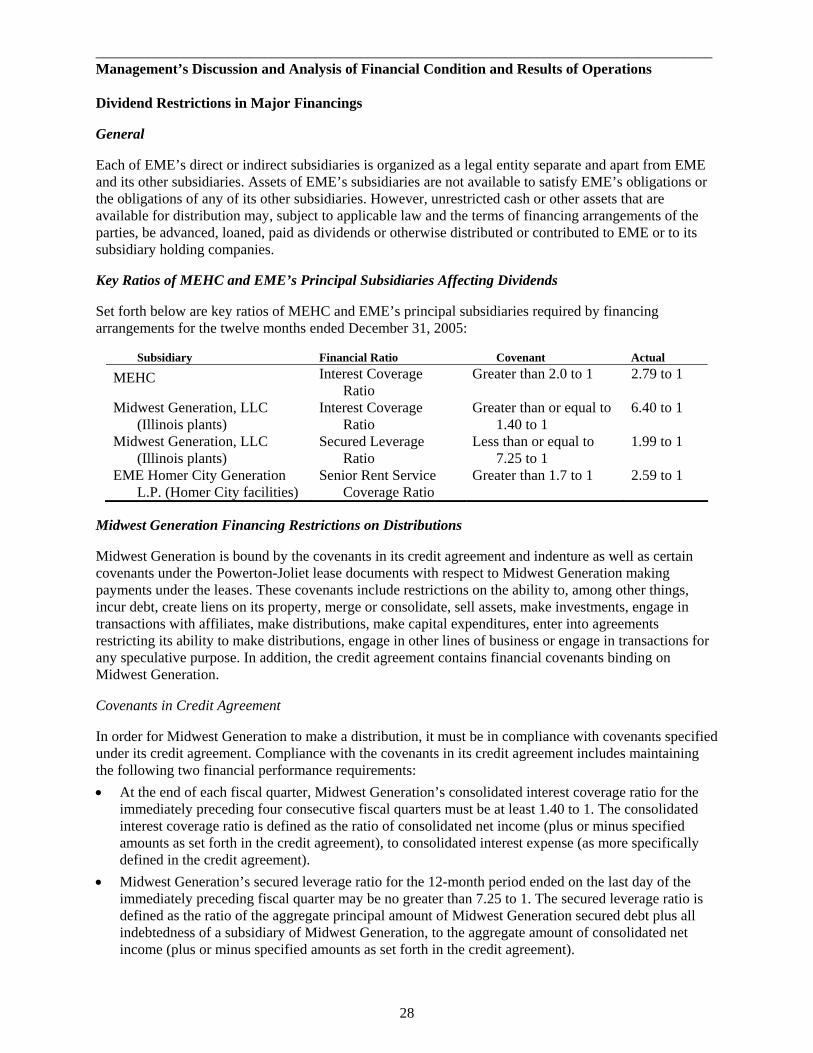
28
____________________________________________________________________________________ Management’s Discussion and Analysis of Financial Condition and Results of Operations Dividend Restrictions in Major Financings General Each of EME’s direct or indirect subsidiaries is organized as a legal entity separate and apart from EME and its other subsidiaries. Assets of EME’s subsidiaries are not available to satisfy EME’s obligations or the obligations of any of its other subsidiaries. However, unrestricted cash or other assets that are available for distribution may, subject to applicable law and the terms of financing arrangements of the parties, be advanced, loaned, paid as dividends or otherwise distributed or contributed to EME or to its subsidiary holding companies. Key Ratios of MEHC and EME’s Principal Subsidiaries Affecting Dividends Set forth below are key ratios of MEHC and EME’s principal subsidiaries required by financing arrangements for the twelve months ended December 31, 2005:
Subsidiary Financial Ratio Covenant Actual
MEHC Interest Coverage Ratio
Greater than 2.0 to 1 2.79 to 1
Midwest Generation, LLC (Illinois plants)
Interest Coverage Ratio
Greater than or equal to 1.40 to 1
6.40 to 1
Midwest Generation, LLC (Illinois plants)
Secured Leverage Ratio
Less than or equal to 7.25 to 1
1.99 to 1
EME Homer City Generation L.P. (Homer City facilities)
Senior Rent Service Coverage Ratio
Greater than 1.7 to 1 2.59 to 1
Midwest Generation Financing Restrictions on Distributions Midwest Generation is bound by the covenants in its credit agreement and indenture as well as certain covenants under the Powerton-Joliet lease documents with respect to Midwest Generation making payments under the leases. These covenants include restrictions on the ability to, among other things, incur debt, create liens on its property, merge or consolidate, sell assets, make investments, engage in transactions with affiliates, make distributions, make capital expenditures, enter into agreements restricting its ability to make distributions, engage in other lines of business or engage in transactions for any speculative purpose. In addition, the credit agreement contains financial covenants binding on Midwest Generation. Covenants in Credit Agreement In order for Midwest Generation to make a distribution, it must be in compliance with covenants specified under its credit agreement. Compliance with the covenants in its credit agreement includes maintaining the following two financial performance requirements: • At the end of each fiscal quarter, Midwest Generation’s consolidated interest coverage ratio for the
immediately preceding four consecutive fiscal quarters must be at least 1.40 to 1. The consolidated interest coverage ratio is defined as the ratio of consolidated net income (plus or minus specified amounts as set forth in the credit agreement), to consolidated interest expense (as more specifically defined in the credit agreement).
• Midwest Generation’s secured leverage ratio for the 12-month period ended on the last day of the immediately preceding fiscal quarter may be no greater than 7.25 to 1. The secured leverage ratio is defined as the ratio of the aggregate principal amount of Midwest Generation secured debt plus all indebtedness of a subsidiary of Midwest Generation, to the aggregate amount of consolidated net income (plus or minus specified amounts as set forth in the credit agreement).

29
____________________________________________________________________________________ Edison International
In addition, Midwest Generation’s distributions are limited in amount. Under the terms of Midwest Generation’s credit agreement, Midwest Generation is permitted to distribute 75% of its excess cash flow (as defined in the credit agreement). In addition, if equity is contributed to Midwest Generation, Midwest Generation is permitted to distribute 100% of excess cash flow until the aggregate portion of distributions that Midwest Generation attributed to the equity contribution equals the amount of the equity contribution. Because EME made a $300 million equity contribution to Midwest Generation on April 19, 2005, Midwest Generation is permitted to distribute 100% of excess cash flow until the aggregate portion of such distributions attributed to that equity contribution equals $300 million. After taking into account Midwest Generation’s most recent distribution in January 2006, $177 million of the equity contribution is still available for this purpose. To the extent Midwest Generation makes a distribution which is not fully attributed to an equity contribution, Midwest Generation is required to make concurrently with such distribution an offer to repay debt in an amount equal to the excess, if any, of one-third of such distribution over the amount attributed to the equity contribution.
In January 2005, Midwest Generation made a distribution of $61 million and, as required under its credit agreement, Midwest Generation offered to prepay $20 million of the term loan, of which $5 million was accepted by certain lenders and repaid on January 24, 2005. Midwest Generation subsequently made a voluntary prepayment, as provided under the credit agreement, of $15 million on January 28, 2005. In April 2005 and October 2005, Midwest Generation made additional distributions of $109 million and $160 million, respectively.
Covenants in Indenture Midwest Generation’s indenture contains restrictions on its ability to make a distribution substantially similar to those in the credit agreement. Failure to achieve the conditions required for distributions will not result in a default under the indenture, nor does the indenture contain any other financial performance requirements.
EME Homer City (Homer City facilities) EME Homer City completed a sale-leaseback of the Homer City facilities in December 2001. In order to make a distribution, EME Homer City must be in compliance with the covenants specified in the lease agreements, including the following financial performance requirements measured on the date of distribution:
• At the end of each quarter, the senior rent service coverage ratio for the prior twelve-month period (taken as a whole) must be greater than 1.7 to 1. The senior rent service coverage ratio is defined as all income and receipts of EME Homer City less amounts paid for operating expenses, required capital expenditures, taxes and financing fees divided by the aggregate amount of the debt portion of the rent, plus fees, expenses and indemnities due and payable with respect to the lessor’s debt service reserve letter of credit.
At the end of each quarter, the equity and debt portions of rent then due and payable must have been paid. The senior rent service coverage ratio (discussed above) projected for each of the prospective two twelve-month periods must be greater than 1.7 to 1. No more than two rent default events may have occurred, whether or not cured. A rent default event is defined as the failure to pay the equity portion of the rent within five business days of when it is due.
30
____________________________________________________________________________________ Management’s Discussion and Analysis of Financial Condition and Results of Operations EME Corporate Credit Facility Restrictions on Distributions from Subsidiaries EME’s corporate credit facility contains covenants that restrict its ability, and the ability of several of its subsidiaries, to make distributions. This restriction binds the subsidiaries through which EME owns the Westside projects, the Sunrise project, the Illinois plants, the Homer City facilities and the Big 4 projects. These subsidiaries would not be able to make a distribution to EME if an event of default were to occur and be continuing under EME’s corporate credit facility after giving effect to the distribution.
In addition, EME granted a security interest in an account into which all distributions received by it from the Big 4 projects are deposited. EME is free to use these distributions unless and until an event of default occurs under its corporate credit facility.
As of December 31, 2005, EME had no borrowings outstanding under this credit facility. MEHC: MARKET RISK EXPOSURES Introduction EME’s primary market risk exposures are associated with the sale of electricity and capacity from and the procurement of fuel for its merchant power plants. These market risks arise from fluctuations in electricity, capacity and fuel prices, emission allowances, and transmission rights. Additionally, EME’s financial results can be affected by fluctuations in interest rates. EME manages these risks in part by using derivative financial instruments in accordance with established policies and procedures. This section discusses these market risk exposures under the following headings:
• Commodity Price Risk • Credit Risk • Interest Rate Risk • Fair Value of Financial Instruments Commodity Price Risk General Overview EME’s revenue and results of operations of its merchant power plants will depend upon prevailing market prices for capacity, energy, ancillary services, emission allowances or credits, coal, natural gas and fuel oil, and associated transportation costs in the market areas where EME’s merchant plants are located. Among the factors that influence the price of energy, capacity and ancillary services in these markets are: • prevailing market prices for coal, natural gas and fuel oil, and associated transportation; • the extent of additional supplies of capacity, energy and ancillary services from current competitors
or new market entrants, including the development of new generation facilities and/or technologies that may be able to produce electricity at a lower cost than EME’s generating facilities and/or increased access by competitors to EME’s markets as a result of transmission upgrades;
• transmission congestion in and to each market area and the resulting differences in prices between delivery points;
• the market structure rules established for each market area and regulatory developments affecting the market areas, including any price limitations and other mechanisms adopted to address volatility or illiquidity in these markets or the physical stability of the system;

31
____________________________________________________________________________________ Edison International
• the cost and availability of emission credits or allowances; • the availability, reliability and operation of competing power generation facilities, including nuclear
generating plants, where applicable, and the extended operation of such facilities beyond their presently expected dates of decommissioning;
• weather conditions prevailing in surrounding areas from time to time; and • changes in the demand for electricity or in patterns of electricity usage as a result of factors such as
regional economic conditions and the implementation of conservation programs.
A discussion of commodity price risk for the Illinois plants and the Homer City facilities is set forth below.
Introduction EME’s merchant operations expose it to commodity price risk, which represents the potential loss that can be caused by a change in the market value of a particular commodity. Commodity price risks are actively monitored by a risk management committee to ensure compliance with EME’s risk management policies. Policies are in place which define risk management processes, and procedures exist which allow for monitoring of all commitments and positions with regular reviews by EME’s risk management committee. Despite this, there can be no assurance that all risks have been accurately identified, measured and/or mitigated.
In addition to prevailing market prices, EME’s ability to derive profits from the sale of electricity will be affected by the cost of production, including costs incurred to comply with environmental regulations. The costs of production of the units vary and, accordingly, depending on market conditions, the amount of generation that will be sold from the units is expected to vary from unit to unit.
EME uses “value at risk” to identify, measure, monitor and control its overall market risk exposure in respect of its Illinois plants, its Homer City facilities, and its trading positions. The use of value at risk allows management to aggregate overall commodity risk, compare risk on a consistent basis and identify the risk factors. Value at risk measures the possible loss over a given time interval, under normal market conditions, at a given confidence level. Given the inherent limitations of value at risk and relying on a single risk measurement tool, EME supplements this approach with the use of stress testing and worst-case scenario analysis for key risk factors, as well as stop loss limits and counterparty credit exposure limits. Hedging Strategy To reduce its exposure to market risk, EME hedges a portion of its merchant portfolio risk through EMMT, an EME subsidiary engaged in the power marketing and trading business. To the extent that EME does not hedge its merchant portfolio, the unhedged portion will be subject to the risks and benefits of spot market price movements. Hedge transactions are primarily implemented through the use of contracts cleared on the Intercontinental Trading Exchange and the New York Mercantile Exchange. Hedge transactions are also entered into as forward sales to utilities and power marketing companies.
The extent to which EME hedges its market price risk depends on several factors. First, EME evaluates over-the-counter market prices to determine whether sales at forward market prices are sufficiently attractive compared to assuming the risk associated with fluctuating spot market sales. Second, EME’s ability to enter into hedging transactions depends upon its, Midwest Generation’s and EMMT’s credit capacity and upon the forward sales markets having sufficient liquidity to enable EME to identify appropriate counterparties for hedging transactions.

32
____________________________________________________________________________________ Management’s Discussion and Analysis of Financial Condition and Results of Operations In the case of hedging transactions related to the generation and capacity of the Illinois plants, Midwest Generation is permitted to use its working capital facility and cash on hand to provide credit support for these hedging transactions entered into by EMMT under an energy services agreement between Midwest Generation and EMMT. Utilization of this credit facility in support of hedging transactions provides additional liquidity support for implementation of EME’s contracting strategy for the Illinois plants. In the case of hedging transactions related to the generation and capacity of the Homer City facilities, credit support is provided by EME pursuant to intercompany arrangements between it and EMMT. See “—Credit Risk” below.
Energy Price Risk Affecting Sales from the Illinois Plants All the energy and capacity from the Illinois plants is sold under terms, including price and quantity, negotiated by EMMT with customers through a combination of bilateral agreements, forward energy sales and spot market sales. As discussed further below, power generated at the Illinois plants has generally been sold into the PJM market. Capacity prices for merchant energy sales within PJM are, and are expected in the near term to remain, substantially lower than those Midwest Generation received under the power purchase agreements with Exelon Generation.
Prior to May 1, 2004, the primary markets available to Midwest Generation for wholesale sales of electricity from the Illinois plants were direct “wholesale customers” and broker arranged “over-the-counter customers.” Effective May 1, 2004, the transmission system of Commonwealth Edison was placed under the control of PJM as the Northern Illinois control area, and on October 1, 2004, the transmission system of AEP was integrated into PJM, linking eastern PJM and the Northern Illinois control areas of the PJM system and allowing the Illinois plants to be dispatched into the broader PJM market. Further, on April 1, 2005, the MISO commenced operation, linking the portions of Illinois, Wisconsin, Indiana, Michigan, and Ohio, as well as other states in the region, in the MISO, where there is a bilateral market and day-ahead and real-time markets based on locational marginal pricing similar to that of PJM.
Midwest Generation sells its power into PJM at spot prices based upon locational marginal pricing and is no longer required to arrange and pay separately for transmission when making sales to wholesale buyers within the PJM system. Hedging transactions related to the generation of the Illinois units are entered into at the Northern Illinois Hub in PJM, the AEP/Dayton Hub in PJM and, with the advent of MISO, at the Cinergy Hub in MISO. Because of proximity, the Illinois plants are primarily hedged with transactions at the Northern Illinois Hub, but from time to time may be hedged in limited amounts at the AEP/Dayton Hub and the Cinergy Hub. These trading hubs have been the most liquid locations for these hedging purposes. However, hedging transactions which settle at points other than the Northern Illinois Hub are subject to the possibility of basis risk. See “—Basis Risk” below for further discussion.
The PJM pool has a short-term market, which establishes an hourly clearing price. The Illinois plants are situated in the western PJM control area and are physically connected to high-voltage transmission lines serving this market.

33
____________________________________________________________________________________ Edison International
The following table depicts the average historical market prices for energy per megawatt-hour during 2005 and 2004.
2005(1) 2004 January $ 38.36 $ 27.88 (2) February 34.92 29.98 (2) March 45.75 30.66 (2) April 38.98 27.88 (2) May 33.60 34.05 (1) June 42.45 28.58 (1) July 50.87 30.92 (1) August 60.09 26.31 (1) September 53.30 27.98 (1) October 49.39 30.93 (1) November 44.03 29.15 (1) December 64.99 29.90 (1) Yearly Average $ 46.39 $ 29.52
__________ (1) Represents average historical market prices for energy as quoted for sales into the Northern Illinois Hub.
Energy prices were calculated at the Northern Illinois Hub delivery point using hourly real-time prices as published by PJM.
(2) Represents average historical market prices for energy “Into ComEd.” Energy prices were determined by obtaining broker quotes and other public price sources for “Into ComEd” delivery points.
Forward market prices at the Northern Illinois Hub fluctuate as a result of a number of factors, including natural gas prices, transmission congestion, changes in market rules, electricity demand (which in turn is affected by weather, economic growth, and other factors), plant outages in the region, and the amount of existing and planned power plant capacity. The actual spot prices for electricity delivered by the Illinois plants into these markets may vary materially from the forward market prices set forth in the table below.
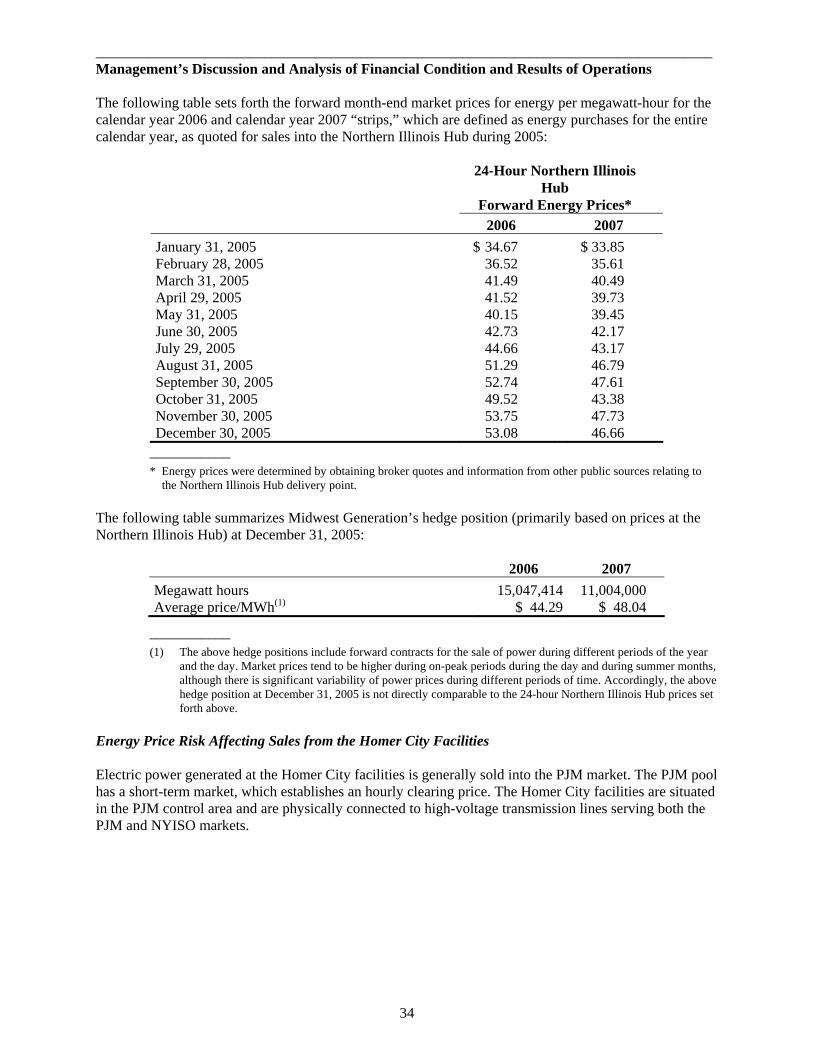
34
____________________________________________________________________________________ Management’s Discussion and Analysis of Financial Condition and Results of Operations The following table sets forth the forward month-end market prices for energy per megawatt-hour for the calendar year 2006 and calendar year 2007 “strips,” which are defined as energy purchases for the entire calendar year, as quoted for sales into the Northern Illinois Hub during 2005:
24-Hour Northern Illinois Hub
Forward Energy Prices* 2006 2007 January 31, 2005 $ 34.67 $ 33.85 February 28, 2005 36.52 35.61 March 31, 2005 41.49 40.49 April 29, 2005 41.52 39.73 May 31, 2005 40.15 39.45 June 30, 2005 42.73 42.17 July 29, 2005 44.66 43.17 August 31, 2005 51.29 46.79 September 30, 2005 52.74 47.61 October 31, 2005 49.52 43.38 November 30, 2005 53.75 47.73 December 30, 2005 53.08 46.66
___________ * Energy prices were determined by obtaining broker quotes and information from other public sources relating to
the Northern Illinois Hub delivery point.
The following table summarizes Midwest Generation’s hedge position (primarily based on prices at the Northern Illinois Hub) at December 31, 2005:
2006 2007
Megawatt hours 15,047,414 11,004,000 Average price/MWh(1) $ 44.29 $ 48.04
___________ (1) The above hedge positions include forward contracts for the sale of power during different periods of the year
and the day. Market prices tend to be higher during on-peak periods during the day and during summer months, although there is significant variability of power prices during different periods of time. Accordingly, the above hedge position at December 31, 2005 is not directly comparable to the 24-hour Northern Illinois Hub prices set forth above.
Energy Price Risk Affecting Sales from the Homer City Facilities Electric power generated at the Homer City facilities is generally sold into the PJM market. The PJM pool has a short-term market, which establishes an hourly clearing price. The Homer City facilities are situated in the PJM control area and are physically connected to high-voltage transmission lines serving both the PJM and NYISO markets.

35
____________________________________________________________________________________ Edison International
The following table depicts the average historical market prices for energy per megawatt-hour in PJM during the past three years:
24-Hour PJM
Historical Energy Prices* Homer City West Hub 2005 2004 2003 2005 2004 2003
January $ 45.82 $ 51.12 $ 36.56 $ 49.53 $ 55.01 $ 43.62 February 39.40 47.19 46.13 42.05 44.22 48.31 March 47.42 39.54 46.85 49.97 39.21 54.85 April 44.27 43.01 35.35 44.55 42.82 35.93 May 43.67 44.68 32.29 43.64 48.04 32.10 June 46.63 36.72 27.26 53.72 38.05 29.10 July 54.63 40.09 36.55 66.34 43.64 40.88 August 66.39 34.76 39.27 82.83 38.59 39.74 September 66.67 40.62 28.71 76.82 41.96 29.51 October 67.93 37.37 26.96 77.56 37.78 27.47 November 59.78 35.79 29.17 62.01 36.91 29.30 December 75.03 38.59 35.89 81.97 41.83 35.92
Yearly Average $ 54.80 $ 40.79 $ 35.08 $ 60.92 $ 42.34 $ 37.23
___________ * Energy prices were calculated at the Homer City busbar (delivery point) and PJM West Hub using historical hourly real-
time prices provided on the PJM-ISO web-site.
Forward market prices at the PJM West Hub fluctuate as a result of a number of factors, including natural gas prices, transmission congestion, changes in market rules, electricity demand (which in turn is affected by weather, economic growth and other factors), plant outages in the region, and the amount of existing and planned power plant capacity. The actual spot prices for electricity delivered by the Homer City facilities into these markets may vary materially from the forward market prices set forth in the table below.

36
____________________________________________________________________________________ Management’s Discussion and Analysis of Financial Condition and Results of Operations
The following table sets forth the forward month-end market prices for energy per megawatt-hour for the calendar 2006 and 2007 “strips,” which are defined as energy purchases for the entire calendar year, as quoted for sales into the PJM West Hub during 2005:
24-Hour PJM West Hub Forward Energy Prices*
2006 2007 January 31, 2005 $ 46.11 $ 44.48 February 28, 2005 48.17 46.84 March 31, 2005 53.07 50.80 April 29, 2005 50.26 49.16 May 31, 2005 50.05 49.56 June 30, 2005 53.66 52.71 July 29, 2005 55.88 54.35 August 31, 2005 65.31 59.81 September 30, 2005 72.01 62.18 October 31, 2005 69.26 60.86 November 30, 2005 75.58 66.16 December 30, 2005 73.74 68.62
___________ * Energy prices were determined by obtaining broker quotes and information from other public sources
relating to the PJM West Hub delivery point. Forward prices at PJM West Hub are generally higher than the prices at the Homer City busbar.
The following table summarizes Homer City’s hedge position at December 31, 2005:
2006 2007
Megawatt hours 8,526,000 5,280,000 Average price/MWh(1) $ 53.42 $ 67.30
___________ (1) The above hedge positions include forward contracts for the sale of power during different periods of the year
and the day. Market prices tend to be higher during on-peak periods during the day and during summer months, although there is significant variability of power prices during different periods of time. Accordingly, the above hedge position at December 31, 2005 is not directly comparable to the 24-hour PJM West Hub prices set forth above.
The average price/MWh for Homer City’s hedge position is based on PJM West Hub. Energy prices at the Homer City busbar have been lower than energy prices at the PJM West Hub. See “⎯Basis Risk” below for a discussion of the difference.
Basis Risk Sales made from the Illinois plants and the Homer City facilities in the real-time or day-ahead market receive the actual spot prices at the busbars (delivery points) of the individual plants. In order to mitigate price risk from changes in spot prices at the individual plant busbars, EME may enter into cash settled futures contracts as well as forward contracts with counterparties for energy to be delivered in future periods. Currently, a liquid market for entering into these contracts at the individual plant busbars does not exist. A liquid market does exist for a settlement point known as the PJM West Hub in the case of the Homer City facilities and for a settlement point known as the Northern Illinois Hub in the case of the Illinois plants. EME’s price risk management activities use these settlement points (and, to a lesser

37
____________________________________________________________________________________ Edison International
extent, other similar trading hubs) to enter into hedging contracts. EME’s revenue with respect to such forward contracts include:
• sales of actual generation in the amounts covered by the forward contracts with reference to PJM spot prices at the busbar of the plant involved, plus,
• sales to third parties at the price under such hedging contracts at designated settlement points (generally the PJM West Hub for the Homer City facilities and the Northern Illinois Hub for the Illinois plants) less the cost of power at spot prices at the same designated settlement points.
Under the PJM market design, locational marginal pricing, which establishes hourly prices at specific locations throughout PJM by considering factors including generator bids, load requirements, transmission congestion and losses, can cause the price of a specific delivery point to be higher or lower relative to other locations depending on how the point is affected by transmission constraints. To the extent that, on the settlement date of a hedge contract, spot prices at the relevant busbar are lower than spot prices at the settlement point, the proceeds actually realized from the related hedge contract are effectively reduced by the difference. This is referred to by EME as “basis risk.” During 2005, transmission congestion in PJM has resulted in prices at the Homer City busbar being lower than those at the PJM West Hub (EME’s Homer City’s primary trading hub) by an average of 10%, compared to 4% during 2004. The monthly average during 2005 ranged from zero to 20%, which occurred in August 2005. In contrast to the Homer City facilities, during 2005, the prices at the Northern Illinois Hub were substantially the same as those at the individual busbars of the Illinois plants.
By entering into cash settled future contracts and forward contracts using the PJM West Hub and the Northern Illinois Hub (or other similar trading hubs) as the settlement points, EME is exposed to basis risk as described above. In order to mitigate basis risk, EME has participated in purchasing financial transmission rights in PJM, and may continue to do so in the future. A financial transmission right is a financial instrument that entitles the holder to receive actual spot prices at one point of delivery and pay prices at another point of delivery that are pegged to prices at the first point of delivery, plus or minus a fixed amount. Accordingly, EME’s price risk management activities include using financial transmission rights alone or in combination with forward contracts to manage basis risk. Coal Price and Transportation Risk The Illinois plants use approximately 18 million to 20 million tons of coal annually, primarily obtained from the Southern Powder River Basin of Wyoming. In addition, the Homer City facilities use approximately 5 million to 6 million tons of coal annually, obtained from mines located near the facilities in Pennsylvania. Coal purchases are made under a variety of supply agreements with terms ranging from one year to eight years. The following table summarizes the percent of expected coal requirements for the next five years that were under contract at December 31, 2005:
Percent of Coal Requirements
Under Contract 2006 2007 2008 2009 2010
Illinois plants 100% 91% 32% 32% 33% Homer City facilities 101% 94% 39% 15% 0%
EME is subject to price risk for purchases of coal that are not under contract. Prices of Northern Appalachian (NAPP) coal, which is purchased for the Homer City facilities, have increased considerably during 2004 and 2005. In January 2004, prices of NAPP coal (with 13,000 British Thermal units (Btu)

38
____________________________________________________________________________________ Management’s Discussion and Analysis of Financial Condition and Results of Operations per pound heat content and <3.0 pounds of SO2 per MMBtu sulfur content) were below $40 per ton and increased to more than $60 per ton during 2004. The price of NAPP coal fluctuated between $44 per ton and $57 per ton during 2005, with a price of $45 per ton at December 30, 2005, as reported by the Energy Information Administration. The overall increase in the NAPP coal price has been largely attributed to greater demand from domestic power producers and increased international shipments of coal to Asia. Prices of Powder River Basin (PRB) coal (with 8,800 Btu per pound heat content and 0.8 pounds of SO2 per MMBtu sulfur content), which is purchased for the Illinois plants, significantly increased in 2005 due to the curtailment of coal shipments during 2005 due to increased PRB coal demand from the other regions (east), rail constraints (discussed below), higher oil and natural gas prices and higher prices for SO2 allowances. On December 30, 2005, the Energy Information Administration reported the price of coal to be $18.48 per ton, which compares to 2004 prices generally below $7 per ton.
During 2005, the rail lines that bring coal from the PRB to EME’s Illinois plants were damaged from derailments caused by heavy rains. The railroads are in the process of making repairs to these rail lines. During 2005, Midwest Generation received sufficient quantities to meet generation requirements. Rail line maintenance is expected to continue in 2006. Based on communication with the transportation provider, EME expects to continue receiving a sufficient amount of coal to generate power at historical levels while these repairs are being completed.
Emission Allowances Price Risk The federal Acid Rain Program requires electric generating stations to hold SO2 allowances and Illinois and Pennsylvania regulations implemented the federal NOx SIP Call requirement. Under these programs, EME purchases (or sells) emission allowances based on the amounts required for actual generation in excess of (or less than) the amounts allocated under these programs. As part of the acquisition of the Illinois plants and the Homer City facilities, EME obtained the rights to the emission allowances that have been or are allocated to these plants.
The price of emission allowances, particularly SO2 allowances issued through the federal Acid Rain Program, increased substantially during 2005 and 2004. The average price of purchased SO2 allowances increased from $204 per ton during 2003 to $435 per ton during 2004 to $1,219 per ton during 2005. The increase in the price of SO2 allowances has been attributed to reduced numbers of both allowance sellers and prior year allowances.
Based on EME’s anticipated SO2 emission allowances requirements for 2006, EME expects that a 10% change in the price of SO2 emission allowances at December 31, 2005 would increase or decrease pre-tax income in 2006 by approximately $7 million. Energy Trading Activities EME seeks to generate profit by utilizing the commercial platform of its subsidiary, EMMT, to engage in trading activities in those markets where its merchant power plants are located. EMMT trades power, fuel and transmission primarily in the eastern power grid using financial products available over the counter, through exchanges and from independent system operators. EME’s earnings from trading activities were $195 million during 2005. Volatile market conditions during 2005, driven by increased prices for natural gas and oil and warmer summer temperatures, have created favorable conditions for EMMT’s trading strategies in 2005 compared to 2004. This trading activity is limited by the risk management policies of EME, including a limit on value at risk. During 2005, EME’s maximum value at risk associated with trading of over-the-counter products and exchange-traded products was $1.9 million, using a 95% confidence interval and assuming a one-day holding period. As of December 31, 2005, margin and collateral posted to support trading activities of EMMT was approximately $75 million. This amount includes collateral posted with independent system operators as well as initial and mark-to-
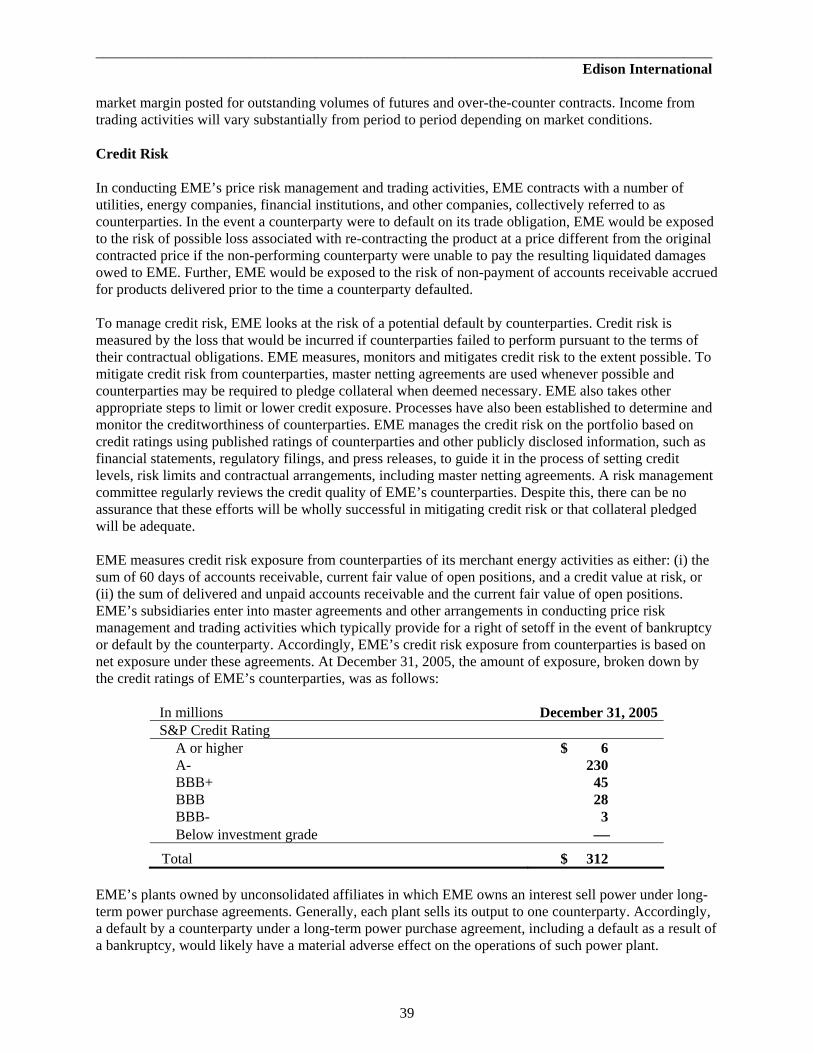
39
____________________________________________________________________________________ Edison International
market margin posted for outstanding volumes of futures and over-the-counter contracts. Income from trading activities will vary substantially from period to period depending on market conditions. Credit Risk In conducting EME’s price risk management and trading activities, EME contracts with a number of utilities, energy companies, financial institutions, and other companies, collectively referred to as counterparties. In the event a counterparty were to default on its trade obligation, EME would be exposed to the risk of possible loss associated with re-contracting the product at a price different from the original contracted price if the non-performing counterparty were unable to pay the resulting liquidated damages owed to EME. Further, EME would be exposed to the risk of non-payment of accounts receivable accrued for products delivered prior to the time a counterparty defaulted.
To manage credit risk, EME looks at the risk of a potential default by counterparties. Credit risk is measured by the loss that would be incurred if counterparties failed to perform pursuant to the terms of their contractual obligations. EME measures, monitors and mitigates credit risk to the extent possible. To mitigate credit risk from counterparties, master netting agreements are used whenever possible and counterparties may be required to pledge collateral when deemed necessary. EME also takes other appropriate steps to limit or lower credit exposure. Processes have also been established to determine and monitor the creditworthiness of counterparties. EME manages the credit risk on the portfolio based on credit ratings using published ratings of counterparties and other publicly disclosed information, such as financial statements, regulatory filings, and press releases, to guide it in the process of setting credit levels, risk limits and contractual arrangements, including master netting agreements. A risk management committee regularly reviews the credit quality of EME’s counterparties. Despite this, there can be no assurance that these efforts will be wholly successful in mitigating credit risk or that collateral pledged will be adequate.
EME measures credit risk exposure from counterparties of its merchant energy activities as either: (i) the sum of 60 days of accounts receivable, current fair value of open positions, and a credit value at risk, or (ii) the sum of delivered and unpaid accounts receivable and the current fair value of open positions. EME’s subsidiaries enter into master agreements and other arrangements in conducting price risk management and trading activities which typically provide for a right of setoff in the event of bankruptcy or default by the counterparty. Accordingly, EME’s credit risk exposure from counterparties is based on net exposure under these agreements. At December 31, 2005, the amount of exposure, broken down by the credit ratings of EME’s counterparties, was as follows:
In millions December 31, 2005S&P Credit Rating
A or higher $ 6 A- 230 BBB+ 45 BBB 28 BBB- 3 Below investment grade ⎯
Total $ 312
EME’s plants owned by unconsolidated affiliates in which EME owns an interest sell power under long-term power purchase agreements. Generally, each plant sells its output to one counterparty. Accordingly, a default by a counterparty under a long-term power purchase agreement, including a default as a result of a bankruptcy, would likely have a material adverse effect on the operations of such power plant.

40
____________________________________________________________________________________ Management’s Discussion and Analysis of Financial Condition and Results of Operations In addition, coal for the Illinois plants and the Homer City facilities is purchased from suppliers under contracts which may be for multiple years. A number of the coal suppliers to the Illinois plants and the Homer City facilities do not currently have an investment grade credit rating and, accordingly, EME may have limited recourse to collect damages in the event of default by a supplier. EME seeks to mitigate this risk through diversification of its coal suppliers and through guarantees and other collateral arrangements when available. Despite this, there can be no assurance that these efforts will be successful in mitigating credit risk from coal suppliers.
EME’s merchant plants sell electric power generally into the PJM market by participating in PJM’s capacity markets or transact capacity on a bilateral basis. Sales into the PJM pool accounted for approximately 70% of EME’s consolidated operating revenue for the year ended December 31, 2005. Moody’s Investor Service rates PJM’s senior unsecured debt Aa3. PJM, an independent system operator with over 300 member companies, maintains its own credit risk policies and does not extend unsecured credit to non-investment grade companies. Any losses due to a PJM member default is shared by all members based upon a predetermined formula. At December 31, 2005, EME’s account receivable due from PJM was $223 million. Interest Rate Risk The fair market value of MEHC’s parent only total long-term obligations was $1.0 billion at December 31, 2005, compared to the carrying value of $792 million. A 10% increase or decrease in market interest rates at December 31, 2005 would result in a decrease or increase in the fair value of total long-term obligations by approximately $13 million.
Interest rate changes affect the cost of capital needed to operate EME’s projects. EME mitigates the risk of interest rate fluctuations by arranging for fixed rate financing or variable rate financing with interest rate swaps, interest rate options or other hedging mechanisms for a number of its project financings. Based on the amount of variable rate long-term debt for which EME has not entered into interest rate hedge agreements at December 31, 2005, a 100-basis-point change in interest rates at December 31, 2005 would increase or decrease 2006 income before taxes by approximately $5 million. The fair market values of long-term fixed interest rate obligations are subject to interest rate risk. The fair market value of MEHC’s total long-term obligations (including current portion) was $4.7 billion at December 31, 2005, compared to the carrying value of $4.1 billion. A 10% increase in market interest rates at December 31, 2005 would result in a decrease in the fair value of MEHC’s total long-term obligations by approximately $138 million. A 10% decrease in market interest rates at December 31, 2005 would result in an increase in the fair value of MEHC’s total long-term obligations by approximately $154 million. Fair Value of Financial Instruments Non-Trading Derivative Financial Instruments The following table summarizes the fair values for outstanding derivative financial instruments used in EME’s continuing operations for purposes other than trading, by risk category:
December 31, In millions 2005 2004
Commodity price: Electricity $ (434) $ 10
In assessing the fair value of EME’s non-trading derivative financial instruments, EME uses a variety of methods and assumptions based on the market conditions and associated risks existing at each balance sheet date. The fair value of commodity price contracts takes into account quoted market prices, time

41
____________________________________________________________________________________ Edison International
value of money, volatility of the underlying commodities and other factors. A 10% change in the market price at December 31, 2005 would increase or decrease the fair value of outstanding derivative commodity price contracts by approximately $250 million. The following table summarizes the maturities and the related fair value, based on actively traded prices, of EME’s commodity price risk management assets and liabilities as of December 31, 2005:
In millions
Total Fair
Value
MaturityLess
than 1 year
Maturity1 to 3 years
Maturity 4 to 5 years
MaturityGreater than 5 years
Prices actively quoted $ (434) $ (354) $ (80) $ ⎯ $ ⎯
Energy Trading Derivative Financial Instruments The fair value of the commodity financial instruments related to energy trading activities as of December 31, 2005 and 2004, are set forth below:
December 31, 2005 2004
In millions Assets Liabilities Assets Liabilities Electricity $ 127 $ 27 $ 125 $ 36 Other 1 — — — Total $ 128 $ 27 $ 125 $ 36
The change in the fair value of trading contracts for the year ended December 31, 2005, was as follows:
In millions Fair value of trading contracts at January 1, 2005 $ 89 Net gains from energy trading activities 202 Amount realized from energy trading activities (203) Other changes in fair value 13 Fair value of trading contracts at December 31, 2005 $101
A 10% change in the market price at December 31, 2005 would increase or decrease the fair value of trading contracts by approximately $6 million.

42
____________________________________________________________________________________ Management’s Discussion and Analysis of Financial Condition and Results of Operations
Quoted market prices are used to determine the fair value of the financial instruments related to energy trading activities, except for a power sales agreement with an unaffiliated electric utility that EME’s subsidiary purchased and restructured and a long-term power supply agreement with another unaffiliated party. EME’s subsidiary recorded these agreements at fair value based upon a discounting of future electricity prices derived from a proprietary model using a discount rate equal to the cost of borrowing the non-recourse debt incurred to finance the purchase of the power supply agreement. The following table summarizes the maturities, the valuation method and the related fair value of energy trading assets and liabilities as of December 31, 2005:
In millions
Total Fair
Value
MaturityLess
than 1 year
Maturity1 to 3 years
Maturity 4 to 5 years
MaturityGreater than 5 years
Prices actively quoted $ 12 $ 12 $ ⎯ $ ⎯ $ ⎯ Prices based on models and other
valuation methods 89 2 9 15 63 Total $ 101 $ 14 $ 9 $ 15 $ 63
RECENT DEVELOPMENT On January 29, 2006, the main power transformer on Unit 3 of the Homer City facilities failed resulting in a suspension of operations at this unit. No fire occurred and there were no injuries as a result of the equipment failure. EME Homer City has secured a replacement transformer and currently expects remedial and replacement activities to be completed in a manner which will permit Unit 3 to return to service in April 2006. EME Homer City plans to adjust its previously planned outage schedules for Unit 3 and the other Homer City units in order to minimize overall outage activities over the next fifteen months. Although the unplanned outage will reduce generation and hence revenue and net income during the first quarter of 2006, because of the change in outage schedules, generation for the year as a whole should not be significantly affected. In order to mitigate the effects of the outage on EME Homer City’s cash flow for the first quarter of 2006, EME and EMMT have arranged with EME Homer City to advance to EME Homer City such funds, if any, as may be necessary to enable EME Homer City to meet its ongoing operating obligations during the period affected by the outage. It is anticipated that these funds, if any, will be recovered by EME and EMMT during the balance of the year.

43
____________________________________________________________________________________ Edison International
EDISON CAPITAL
EDISON CAPITAL: LIQUIDITY Overview Edison Capital’s main sources of liquidity are tax-allocation payments from Edison International, distributions from its global infrastructure fund investments and lease rents. During 2005, Edison Capital received $281 million in tax-allocation payments, $149 million in global infrastructure fund distributions and $19 million in lease rent payments. As of December 31, 2005, Edison Capital had unrestricted cash and cash equivalents of $487 million and long-term debt, including current maturities, of $348 million (including intercompany-related debt). Credit Ratings At December 31, 2005, Edison Capital’s long-term debt had credit ratings of Ba1 and BB+ from Moody’s Investors Service and Standard & Poor’s, respectively. Dividend Restrictions and Debt Covenants Edison Capital’s ability to make dividend payments to Edison International (parent) is restricted by debt covenants (see “Edison International (Parent): Liquidity” for further discussion). In 2005, Edison Capital complied with its debt covenants. Intercompany Tax-Allocation Payments Edison Capital is included in the consolidated federal and combined state income tax returns of Edison International and is eligible to participate in tax-allocation payments with Edison International and other subsidiaries of Edison International. See “MEHC: Liquidity—EME’s Liquidity as a Holding Company—Intercompany Tax-Allocation Agreement” for additional information regarding these arrangements. The amount received is net of payments made to Edison International. (See “Other Developments—Federal Income Taxes” for further discussion of tax-related issues regarding Edison Capital’s leveraged leases). EDISON CAPITAL: MARKET RISK EXPOSURES Edison Capital is exposed to interest rate risk, foreign currency exchange rate risk and credit and performance risk that could adversely affect its results of operations or financial position. Interest Rate Risk The fair market value of Edison Capital’s total long-term debt (including intercompany-related debt) was $358 million at December 31, 2005, compared to a carrying value of $348 million. A 10% increase in market interest rates would have resulted in a $6 million decrease in the fair market value of Edison Capital’s long-term debt. A 10% decrease in market interest rates would have resulted in a $7 million increase in the fair market value of Edison Capital’s long-term debt.

44
____________________________________________________________________________________ Management’s Discussion and Analysis of Financial Condition and Results of Operations Credit and Performance Risk Edison Capital’s investments may be affected by the financial condition of other parties, the performance of the asset, economic conditions and other business and legal factors. Edison Capital generally does not control operations or management of the projects in which it invests and must rely on the skill, experience and performance of third party project operators or managers. These third parties may experience financial difficulties or otherwise become unable or unwilling to perform their obligations. Edison Capital’s investments generally depend upon the operating results of a project with a single asset. These results may be affected by general market conditions, equipment or process failures, disruptions in important fuel supplies or prices, or another party’s failure to perform material contract obligations, and regulatory actions affecting utilities purchasing power from the leased assets. Edison Capital has taken steps to mitigate these risks in the structure of each project through contract requirements, warranties, insurance, collateral rights and default remedies, but such measures may not be adequate to assure full performance. In the event of default, lenders with a security interest in the asset may exercise remedies that could lead to a loss of some or all of Edison Capital’s investment in that asset. Edison Capital has a net leveraged lease investment, before deferred taxes, of $58 million in three aircraft leased to American Airlines. American Airlines has reported net losses since 2000. A default in the leveraged lease by American Airlines could result in a loss of some or all of Edison Capital’s lease investment. At December 31, 2005, American Airlines was current in its lease payments to Edison Capital. Edison Capital also has a net leveraged lease investment, before deferred taxes, of $43 million in a large natural gas-fired cogeneration plant leased to Midland Cogeneration Venture. During 2005, Midland Cogeneration Venture wrote down the book value of the power plant as a result of a substantial increase in long-term natural gas prices. A default of the lease could result in a loss of some or all of Edison Capital’s lease investment. At December 31, 2005, Midland Cogeneration Venture was current in its payments under the lease. Foreign Exchange Rate Risk Edison Capital holds a minority interest as a limited partner in three separate funds that invest in infrastructure assets in Latin America, Asia and countries in Europe with emerging economies. Additionally, Edison Capital has invested in two companies, a cable television enterprise in Mexico and a natural gas pipeline company in Bolivia. As of December 31, 2005, Edison Capital had investments in Latin America, Asia and Emerging Europe of $62 million, $23 million and $43 million, respectively. Edison Capital, through these investments, is exposed to foreign exchange risk in the currency of the ultimate investment. Exposure in Emerging Europe is generally concentrated in the Euro. Investments in Asia are centered in China and South Korea. Investments made in Latin America are distributed among a number of South American countries, including Brazil, Mexico and Bolivia. Edison Capital’s cross-border leases are denominated in U.S. dollars and, therefore, are not exposed to foreign current rate risk. EDISON CAPITAL: OTHER DEVELOPMENT Federal Income Taxes Edison International received Revenue Agent Reports from the Internal Revenue Service (IRS) in August 2002 and in January 2005 asserting deficiencies in federal corporate income taxes with respect to audits of its 1994 to 1996 and 1997 to 1999 tax years, respectively. Among the issues raised were items related to Edison Capital. See “Other Developments—Federal Income Taxes” for further discussion of these matters.

45
____________________________________________________________________________________ Edison International
EDISON INTERNATIONAL (PARENT)
EDISON INTERNATIONAL (PARENT): LIQUIDITY The parent company’s liquidity and its ability to pay interest, debt principal, operating expenses and dividends to common shareholders are affected by dividends and other distributions from subsidiaries, tax-allocation payments under its tax-allocation agreements with its subsidiaries, and access to capital markets or external financings. As of December 31, 2005, Edison International had no debt outstanding. Edison International (parent)’s 2006 cash requirements primarily consist of:
• Dividends to common shareholders. The Board of Directors of Edison International declared a $0.27 per share quarterly common stock dividend on December 15, 2005 and March 1, 2006. The $88 million quarterly common stock dividend declared in December 2005 was paid in January 2006; the quarterly common stock dividend declared in March will be paid on April 30, 2006; and
• General and administrative expenses. Edison International (parent) expects to meet its continuing obligations through cash and cash equivalents on hand, short-term borrowings, when necessary, and dividends from its subsidiaries. At December 31, 2005, Edison International (parent) had approximately $53 million of cash and cash equivalents on hand. In December 2005, Edison International (parent) replaced its $750 million credit facility with a $1 billion senior unsecured five-year revolving credit facility. As of December 31, 2005, the entire $1 billion was available under its credit facility. The ability of subsidiaries to make dividend payments to Edison International is dependent on various factors as described below. The CPUC regulates SCE’s capital structure by requiring that SCE maintain prescribed percentages of common equity, preferred equity and long-term debt in the utility’s capital structure. SCE may not make any distributions to Edison International that would reduce the common equity component of SCE’s capital structure below the prescribed level on a 13-month weighted average basis. The CPUC also requires that SCE establish its dividend policy as though it were a comparable stand-alone utility company and give first priority to the capital requirements of the utility as necessary to meet its obligation to serve its customers. Other factors at SCE that affect the amount and timing of dividend payments by SCE to Edison International include, among other things, SCE’s cash requirements, SCE’s access to capital markets, dividends on SCE’s preferred and preference stock, and actions by the CPUC. SCE made dividend payments of $71 million to Edison International on each of April 28, 2005, July 28, 2005, and September 30, 2005, and January 17, 2006. On March 1, 2006, the Board of Directors of SCE declared a $60 million dividend to be paid to Edison International. MEHC may not pay dividends unless it has an interest coverage ratio of at least 2.0 to 1. At December 31, 2005, its interest coverage ratio was 2.79 to 1. See “MEHC: Liquidity—Dividend Restrictions in Major Financings—Key Ratios of MEHC and EME’s Principal Subsidiaries Affecting Dividends.” In addition, MEHC’s certificate of incorporation and senior secured note indenture contain restrictions on MEHC’s ability to declare or pay dividends or distributions (other than dividends payable solely in MEHC’s common stock). These restrictions require the unanimous approval of MEHC’s Board of Directors, including its independent director, before it can declare or pay dividends or distributions, as long as any indebtedness is outstanding under the indenture. MEHC’s ability to pay dividends is dependent on EME’s ability to pay dividends to MEHC (parent). MEHC has not declared or made dividend payments to Edison International in 2005. EME and its subsidiaries have certain dividend restrictions as discussed in the “MEHC: Liquidity—Dividend Restrictions in Major Financings” section. Edison Capital’s ability to make dividend payments is currently restricted by covenants in its financial instruments, which require Edison Capital, through a wholly owned subsidiary, to maintain a specified

46
____________________________________________________________________________________ Management’s Discussion and Analysis of Financial Condition and Results of Operations minimum net worth of $200 million. Edison Capital satisfied this minimum net worth requirement as of December 31, 2005. Edison Capital did not declare or make dividend payments to Edison International in 2005. However, Edison Capital did loan $75 million to Edison International in 2005. EDISON INTERNATIONAL (PARENT): OTHER DEVELOPMENTS Holding Company Order Instituting Rulemaking Edison International is a party to a CPUC holding company order instituting rulemaking. See “SCE: Regulatory Matters—Current Regulatory Developments—Holding Company Order Instituting Rulemaking” for a discussion of this matter. Federal Income Taxes Edison International received Revenue Agent Reports from the IRS in August 2002 and in January 2005 asserting deficiencies in federal corporate income taxes with respect to audits of its 1994 to 1996 and 1997 to 1999 tax years, respectively. See “Other Developments—Federal Income Taxes” for further discussion of these matters.

47
____________________________________________________________________________________ Edison International
EDISON INTERNATIONAL (CONSOLIDATED)
The following sections of the MD&A are on a consolidated basis and should be read in conjunction with individual subsidiary discussion. RESULTS OF OPERATIONS AND HISTORICAL CASH FLOW ANALYSIS The following subsections of “Results of Operations and Historical Cash Flow Analysis” provide a discussion on the changes in various line items presented on the Consolidated Statements of Income as well as a discussion of the changes on the Consolidated Statements of Cash Flows. Results of Operations The table below presents Edison International’s earnings and earnings per common share for the years ended December 31, 2005, 2004 and 2003, and the relative contributions by its subsidiaries. In millions, except per share amounts Earnings (Loss) Earnings (Loss) per Share
Year Ended December 31, 2005 2004 2003 2005 2004 2003 Earnings (Loss) from Continuing Operations: SCE $ 725 $ 915 $ 872 $ 2.22 $ 2.81 $ 2.68 MEHC 322 (666) (194) 0.98 (2.05) (0.60) Edison Capital 91 60 57 0.28 0.18 0.17 Edison International (parent) and other (30) (83) (80) (0.10) (0.25) (0.24)
Edison International Consolidated Earnings from Continuing Operations 1,108 226 655 3.38 0.69 2.01
Earnings from Discontinued Operations 30 690 175 0.09 2.12 0.54
Cumulative Effect of Accounting Change (1) — (9) — — (0.03)
Edison International Consolidated $ 1,137 $ 916 $ 821 $ 3.47 $ 2.81 $ 2.52
Earnings (Loss) from Continuing Operations Edison International’s 2005 earnings from continuing operations were $1.1 billion, or $3.38 per share, compared with earnings of $226 million, or $0.69 per share, in 2004 and earnings of $655 million, or $2.01 per share, in 2003. 2005 vs. 2004 SCE’s earnings from continuing operations were $725 million in 2005, compared with $915 million in 2004. SCE’s 2005 earnings included positive items of $61 million related to a favorable tax settlement (see “Other Developments—Federal Income Taxes”), $55 million from a favorable FERC decision on a SCE transmission proceeding (see “SCE: Regulatory Matters—Current Regulatory Developments—Transmission Proceeding”) and a $14 million incentive benefit from generator refunds related to the California energy crisis period (see “SCE: Regulatory Matters—Current Regulatory Developments—FERC Refund Proceedings”). SCE’s 2004 earnings included $329 million of positive regulatory and tax items, primarily from implementation of the 2003 GRC decision that was received in July 2004. Excluding these positive items, earnings were up $9 million due to higher net revenue, including tax benefits, and lower financing costs, partially offset by the impact of a lower CPUC-authorized rate of return in 2005.

48
____________________________________________________________________________________ Management’s Discussion and Analysis of Financial Condition and Results of Operations MEHC’s income from continuing operations was $322 million in 2005 compared to a loss of $666 million in 2004. MEHC’s 2005 results include an impairment charge of $34 million related to the March Point project and a $15 million charge related to early debt retirements. MEHC’s 2004 results included a charge of $590 million for the termination of the Collins Station lease, a net gain of $27 million on the sale of its interest in Four Star Oil and Gas and the Brooklyn Navy Yard projects and a charge of $18 million related to a peaker impairment. Excluding these charges, MEHC’s earnings increased by $456 million over 2004 to $371 million. This increase was primarily due to higher wholesale energy margins mainly driven by higher prices, higher energy trading income and lower net interest expense. Earnings in 2005 for Edison Capital were $91 million, compared to $60 million in the same period last year. The increase primarily reflects higher income from Edison Capital’s investment in the Emerging Europe Infrastructure Fund. Excluding the 2004 charge related to the early debt retirements of $14 million, the loss for “Edison International (parent) and other” decreased by $39 million primarily due to lower net interest expense. 2004 vs. 2003 SCE’s earnings from continuing operations for the year ended December 31, 2004 increased by $43 million, compared to the same period last year mainly due to the resolution of regulatory proceedings and prior year tax issues which increased earnings by $86 million over 2003. The 2004 proceedings included the 2003 GRC that was resolved in July 2004 and the 2003 ERRA proceeding addressing power procurement reasonableness that was resolved in the fourth quarter of 2004. Also, in the fourth quarter of 2004, SCE favorably resolved prior year tax issues. Excluding these items, earnings decreased $43 million, primarily from the expiration at year-end 2003 of the incremental cost incentive pricing mechanism at San Onofre, partially offset by the increase in revenue authorized by the 2003 GRC decision. Post-test-year revenue increases for 2004 and 2005, to compensate for customer growth and increased capital expenditures were authorized in the 2003 GRC decision. MEHC had a loss from continuing operations of $666 million during 2004 compared to a loss of $194 million during 2003. MEHC’s 2004 loss from continuing operations increased by $472 million from 2003 primarily due to $608 million of charges for both terminating EME’s Collins lease and impairment of MEHC’s Illinois small-peaking plants during 2004. This decrease in earnings was partially offset by $186 million of impairment charges in 2003 primarily related to MEHC’s Illinois small-peaking plants and EME’s investment in the Brooklyn Navy Yard project. MEHC’s 2004 results were favorably impacted by a gain on the sale of MEHC’s interest in Four Star Oil & Gas which mostly offset the earnings recorded from the project during 2003. During the fourth quarter of 2004, MEHC’s subsidiary, Midwest Generation, recorded a charge of $34 million related to a contract indemnity for asbestos claims from activities at MEHC’s Illinois plants prior to their acquisition in 1999. In addition, the earnings from MEHC’s Homer City facilities were lower in 2004 from 2003 due to unplanned outages and higher fuel costs related to emission allowances. The earnings from MEHC’s Illinois plants, excluding the above asbestos charge, improved in 2004 over 2003 from higher generation and energy prices, which more than offset the lower capacity revenue under the power purchase agreement with Exelon. Edison Capital’s earnings for the year ended December 31, 2004 were $60 million, compared with $57 million in 2003. This increase is primarily due to higher income from Edison Capital’s global infrastructure investment funds. The increase was partially offset by Edison Capital’s maturing lease and housing portfolios which produce lower income. The loss for Edison International (parent) and other increased $3 million over last year with the write-off of unamortized debt costs from the early payment of the Edison International quarterly income debt securities and other expenses being virtually offset by lower net interest expense.

49
____________________________________________________________________________________ Edison International
Operating Revenue SCE’s retail sales represented approximately 82%, 85%, and 91% of electric utility revenue for the years ended December 31, 2005, 2004, and 2003, respectively. Due to warmer weather during the summer months, electric utility revenue during the third quarter of each year is generally significantly higher than other quarters. The following table sets forth the major changes in electric utility revenue:
In millions Year ended December 31, 2005 vs. 2004 2004 vs. 2003
Electric utility revenue Rate changes (including unbilled) $ 517 $ (677) Sales volume changes (including unbilled) 410 (159) Deferred revenue (324) (30) Sales for resale 256 164 SCE’s variable interest entities 177 285 Other (including intercompany transactions) 16 12
Total $ 1,052 $ (405)
Total electric utility revenue increased by $1.1 billion in 2005 (as shown in the table above). The variance in electric utility revenue from rate changes reflects the implementation of the 2003 GRC, effective in August 2004. As a result, generation and distribution rates increased revenue by approximately $166 million and $351 million, respectively. The increase in electric utility revenue resulting from sales volume changes was mainly due to an increase in kilowatt-hour (kWh) sold and SCE providing a greater amount of energy to its customers from its own sources in 2005, compared to 2004. The change in deferred revenue reflects the deferral of approximately $93 million of revenue in 2005, resulting from balancing account overcollections, compared to the recognition of approximately $231 million in 2004. Electric utility revenue from sales for resale represents the sale of excess energy. As a result of the CDWR contracts allocated to SCE, excess energy from SCE sources may exist at certain times, which then is resold in the energy markets. Revenue from sales for resale is refunded to customers through the ERRA rate-making mechanism and does not impact earnings. SCE’s variable interest entities revenue represents the recognition of revenue resulting from the consolidation of SCE’s variable interest entities on March 31, 2004. Total electric utility revenue decreased by $405 million in 2004 (as shown in the table above). The reduction in electric utility revenue due to rate changes resulted from the implementation of a CPUC-approved customer rate reduction plan effective August 1, 2003, additional rate changes effective in 2004 resulting from implementation of the 2003 GRC (an increase in distribution rates and a further decrease in generation rates), and an allocation adjustment for the CDWR energy purchases recorded in 2003. The decrease in electric revenue resulting from sales volume changes was mainly due to the CDWR providing a greater amount of energy to SCE’s customers in 2004, as compared to 2003, partially offset by an increase in kWh sold. Sales for resale increased due to a greater amount of excess energy in 2004, as compared to 2003. As a result of the CDWR contracts allocated to SCE, excess energy from SCE sources may exist at certain times, which then is resold in the energy markets. SCE’s variable interest entities revenue represents the recognition of revenue resulting from the consolidation of SCE’s variable interest entities beginning March 31, 2004. Amounts SCE bills and collects from its customers for electric power purchased and sold by the CDWR to SCE’s customers (beginning January 17, 2001), CDWR bond-related costs (beginning November 15, 2002) and a portion of direct access exit fees (beginning January 1, 2003) are remitted to the CDWR and

50
____________________________________________________________________________________ Management’s Discussion and Analysis of Financial Condition and Results of Operations are not recognized as revenue by SCE. These amounts were $1.9 billion, $2.5 billion, and $1.7 billion for the years ended December 31, 2005, 2004, and 2003, respectively. Nonutility power generation revenue increased $609 million in 2005, mainly due to higher energy revenue and higher net gains from price risk management and trading activities, partially offset by a decrease in capacity revenue. Energy revenue at MEHC’s Illinois plants and Homer City facilities increased by approximately $685 million and $145 million, respectively, due to higher average energy prices in 2005, as compared to 2004. Net gains from price risk management and energy trading increased by approximately $80 million, as compared to the same period in 2004, primarily due to an increase in energy trading income of approximately $170 million in 2005, partially offset by increased losses from price risk management activities of approximately $50 million at MEHC’s Illinois plants and approximately $40 million at MEHC’s Homer City facilities in 2005. Volatile market conditions in 2005, driven by increased prices for natural gas and oil and warmer summer temperatures, have created favorable conditions for EMMT’s trading strategies in 2005 compared to 2004 and 2003. Capacity revenue at MEHC’s Illinois plants decreased by approximately $260 million resulting from the expiration of the power purchase agreement with Exelon Generation. Nonutility power generation revenue decreased $139 million in 2004, mainly due to the deconsolidation of MEHC’s Doga project at March 31, 2004, in accordance with accounting standards. Revenue from MEHC’s Doga project was $29 million (representing the first quarter of 2004) in 2004 and $124 million in 2003. The decrease was also due to a $39 million decrease resulting from lower net gains from MEHC’s price risk management and energy trading activities and lower capacity payments of $91 million received at MEHC’s Illinois plants under the power purchase agreements with Exelon Generation. MEHC’s Homer City facilities had lower energy revenue due to lower generation and availability, which was mostly offset by increased average energy prices. Lower generation in 2004 was caused by temporary interruption of coal deliveries under contracts with four fuel suppliers to MEHC’s Homer City. As a result of these interruptions, Homer City reduced generation during off-peak periods when power prices were lower and purchased coal from alternative suppliers at spot prices which were substantially higher than the contract prices from these four fuel suppliers. In addition, Homer City had an unplanned outage at Unit 1 in February 2004. Due to higher electric demand resulting from warmer weather during the summer months, nonutility power generation revenue generated from MEHC’s Illinois plants and Homer City facilities are generally higher during the third quarter of each year. However, as a result of recent increases in market prices for power, driven in part by higher natural gas and oil prices, this historical trend may not be applicable to quarterly revenue in the future. Operating Expenses Fuel Expense
In millions Year ended December 31, 2005 2004 2003
SCE $ 1,193 $ 810 $ 235 MEHC 617 619 670
Edison International Consolidated $ 1,810 $ 1,429 $ 905 SCE’s fuel expense increased $383 million in 2005 and $575 million in 2004 primarily due to the consolidation of SCE’s variable interest entities on March 31, 2004 resulting in the recognition of fuel expense of $924 million in 2005 and $578 million in 2004.

51
____________________________________________________________________________________ Edison International
MEHC’s fuel expense decreased $2 million in 2005 and decreased $51 million in 2004. The 2005 decrease was mainly due to higher fuel expenses in 2004 during the period MEHC’s Collins Station operated (operations ceased effective September 30, 2004), and the deconsolidation of MEHC’s Doga project effective March 31, 2004). The decrease was almost entirely offset by an increase in fuel costs at MEHC’s Illinois plants and Homer City facilities. The increase in fuel expense at MEHC’s Illinois plants was primarily due to price escalation under coal and transportation agreements and the increase in fuel expense at MEHC’s Homer City facilities was attributable to higher coal prices and higher priced SO2 emission allowances. The 2004 decrease was primarily due to the deconsolidation of EME’s Doga project, resulting in a decrease of $67 million. The decrease was partially offset by higher cost of emission allowances at MEHC’s Homer City facilities. Purchased-Power Expense Purchased-power expense increased $290 million in 2005 and decreased $454 million in 2004. The 2005 increase was mainly due to higher firm energy and QF-related purchases, partially offset by net realized and unrealized gains on economic hedging transactions and an increase in energy settlement refunds in 2005, as compared to 2004. Firm energy purchases increased by approximately $670 million resulting from an increase in the number of bilateral contracts in 2005, as compared to 2004, and QF-related purchases increased by approximately $170 million in 2005, as compared to 2004 (as discussed below). Net realized and unrealized gains related to economic hedging transactions reduced purchased-power expense by approximately $205 million in 2005, as compared to net realized and unrealized losses of approximately $25 million which increased purchased-power expense in 2004. Energy settlement refunds received in 2005 and 2004 were approximately $285 million and $190 million, respectively, further decreasing purchased-power expense in these periods (see “SCE: Regulatory Matters—Current Regulatory Developments—FERC Refund Proceedings”). The consolidation of SCE’s variable interest entities effective March 31, 2004 resulted in a $935 million and $669 million reduction in purchased-power expense in 2005 and 2004, respectively. The 2004 decrease was mainly due to the consolidation of SCE’s variable interest entities and energy settlement refunds received (both discussed above), partially offset by higher expenses of approximately $150 million related to power purchased by SCE from QFs (as discussed below), higher expenses of approximately $100 million resulting from an increase in the number of gas bilateral contracts in 2004, as compared to 2003, and higher expenses of approximately $130 million related to ISO purchases. Also included in purchased-power expense in 2005 is a $25 million charge related to amounts billed to the Los Angeles Department of Water & Power (DWP) for scheduling coordinator charges incurred by SCE on the DWP’s behalf. The scheduling coordinator charges are billed to DWP under a FERC tariff that remains subject to dispute. DWP has paid the amounts billed under protest but requested the FERC declare that SCE was obligated to serve as the DWP’s scheduling coordinator without charge. The FERC accepted SCE’s tariff for filing, but held that the rates charged to DWP have not been shown to be just and reasonable and thus made them subject to refund and further review at the FERC. As a result, SCE could be required to refund all or part of the amounts collected from DWP under the tariff. If the FERC ultimately rules that SCE may not collect the scheduling coordinator charges from DWP and requires the amounts collected to be refunded to DWP, SCE would attempt to recover the scheduling coordinator charges from all transmission grid customers through another regulatory mechanism. However, the availability of other recovery mechanisms is uncertain, and ultimate recovery of the scheduling coordinator charges cannot be assured. Federal law and CPUC orders required SCE to enter into contracts to purchase power from QFs at CPUC-mandated prices. Energy payments to gas-fired QFs are generally tied to spot natural gas prices. Effective May 2002, energy payments for most renewable QFs were converted to a fixed price of 5.37¢-per-kWh. Average spot natural gas prices were higher during 2005 as compared to 2004. The higher expenses related to power purchased from QFs were mainly due to higher average spot natural gas prices, partially offset by lower kWh purchases.

52
____________________________________________________________________________________ Management’s Discussion and Analysis of Financial Condition and Results of Operations Provisions for Regulatory Adjustment Clauses – Net Provisions for regulatory adjustment clauses – net increased $636 million in 2005 and decreased $1.3 billion in 2004. The 2005 increases mainly result from regulatory adjustments recorded in 2004, net overcollections related to balancing accounts, higher net unrealized gains on economic hedging transactions and lower CEMA-related costs. The net regulatory adjustments of $345 million recorded in 2004 related to the implementation of SCE’s 2003 GRC decision and the implementation of an ERRA-related CPUC decision (see “SCE: Regulatory Matters—Current Regulatory Developments—Energy Resource Recovery Account Proceedings”). In addition to these net regulatory adjustments, the increase reflects higher net overcollections of purchased power, fuel, and operating and maintenance expenses of approximately $65 million which were deferred in balancing accounts for future recovery, higher net unrealized gains of approximately $95 million related to economic hedging transactions (mentioned above in purchased-power expense) that, if realized, would be refunded to ratepayers, and lower costs incurred and deferred of approximately $95 million associated with CEMA-related costs (primarily bark beetle infestation related costs). The 2003 GRC regulatory adjustments primarily related to recognition of revenue from the rate recovery of pension contributions during the time period that the pension plan was fully funded, resolution over the allocation of costs between transmission and distribution for 1998 through 2000, partially offset by the deferral of revenue previously collected during the incremental cost incentive pricing mechanism for dry cask storage, as well as pre-tax gains related to the 1997–1998 generation-related capital additions. The 2004 decrease was mainly due to the collection of the Procurement-Related Obligations Account (PROACT) balance in 2003 and the implementation of the CPUC-authorized rate-reduction plan in the summer of 2003, resulting in decreases of approximately $700 million. The decrease also reflects a net effect of regulatory adjustments discussed above and the deferral of costs for future recovery in the amount of approximately $100 million associated with the bark beetle infestation. The 2004 decrease was partially offset by approximately $190 million in settlement agreement payments received and refunded to ratepayers and shareholder incentives (see “SCE: Regulatory Matters—Current Regulatory Developments—FERC Refund Proceedings”), the favorable resolution of certain regulatory cases recorded in the third quarter of 2003, and an allocation adjustment of approximately $110 million for CDWR energy purchases recorded in 2003. Other Operation and Maintenance Expense
In millions Year ended December 31, 2005 2004 2003
SCE $ 2,521 $ 2,455 $ 2,072 MEHC 800 812 783 Other 85 75 55
Edison International Consolidated $ 3,406 $ 3,342 $ 2,910 SCE’s other operating and maintenance expense increased $66 million in 2005 and $383 million in 2004. The 2005 increase was mainly due to an increase in reliability costs, demand-side management and energy efficiency costs, and benefit-related costs, partially offset by lower CEMA-related costs and generation-related costs. Reliability costs increased approximately $80 million, as compared to 2004, due to an increase in must-run units to improve the reliability of the California ISO systems operations (which are recovered through regulatory mechanisms approved by the FERC). Demand-side management and energy efficiency costs increased approximately $90 million (which are recovered through regulatory mechanisms approved by the CPUC). Benefit-related costs increased approximately $50 million in 2005, resulting from an increase in heath care costs and value of performance shares. The 2005 increase was partially offset by lower CEMA-related costs (primarily bark beetle infestation related costs) of approximately $95 million and a decrease in generation-related expenses of approximately $90 million, resulting from lower outage and refueling costs (in 2004, there was a scheduled major overhaul at SCE’s Four Corners coal facility, as well

53
____________________________________________________________________________________ Edison International
as a refueling outage at SCE’s San Onofre Unit 2). The 2005 variance also reflects an increase of approximately $35 million resulting from the consolidation of SCE’s variable interest entities effective March 31, 2004. The 2004 increase was mainly due to approximately $130 million of costs incurred in 2004 related to the removal of trees and vegetation associated with the bark beetle infestation, higher operation and maintenance costs of approximately $60 million related to the San Onofre refueling outages in 2004, operating and maintenance expense of $66 million related to the consolidation of SCE’s variable interest entities, higher operation and maintenance costs related to a scheduled major overhaul at SCE’s Four Corners coal facility and additional costs for 2003 incentive compensation due to upward revisions in the computation in 2004. These increases were partially offset by a decrease in postretirement benefits other than pensions expense, including the effects of adopting the Medicare Prescription Drug, Improvement and Modernization Act of 2003 in the third quarter of 2004 and lower worker’s compensation claims in 2004. MEHC’s other operation and maintenance expense decreased in 2005 and increased in 2004. The 2005 decrease was mainly due to lower plant operating lease costs due to the termination of MEHC’s Collins Station lease in April 2004, and a $56 million charge recorded in 2004 related to an estimate of possible future payments under a contract indemnity agreement related to asbestos claims with respect to activities at MEHC’s Illinois plants prior to their acquisition in 1999 (see “Commitments, Guarantees and Indemnities—Guarantees and Indemnities—Indemnities Provided as Part of the Acquisition of the Illinois Plants” for further discussion). The 2005 decrease was partially offset by higher plant operation costs at MEHC’s Illinois plants resulting from higher planned maintenance, and higher planned equipment maintenance costs in 2005 compared to 2004 and incurred costs in 2005 related to the replacement of the catalyst for the pollution-control equipment at MEHC’s Homer City facilities. The 2004 increase was mainly due to the $56 million charge (discussed above), partially offset by lower plant operating lease costs due to the termination of MEHC’s Collins Station lease. Asset Impairment and Loss on Lease Termination Asset impairment and loss on lease termination in 2004 consist of a $961 million loss recorded in 2004 related to the termination of MEHC’s Collins Station lease and the return of ownership of the Collins Station to MEHC and the impairment of plant assets and related inventory reserves, and a $29 million charge related to the impairment of small peaking units in Illinois. Asset impairment and loss on lease termination in 2003 consisted of $245 million related to the impairment of small peaking units in Illinois, and $59 million loss related to the write-down of EME’s investment in the Brooklyn Navy Yard and Gordonsville projects due to their planned dispositions. These projects have since been sold. Depreciation, Decommissioning and Amortization Expense
In millions Year ended December 31, 2005 2004 2003
SCE $ 915 $ 860 $ 882 MEHC 123 143 154 Other 23 19 11
Edison International Consolidated $ 1,061 $ 1,022 $ 1,047 SCE’s depreciation, decommissioning and amortization increased $55 million in 2005 and decreased $22 million in 2004. The increase in 2005 is mainly due to a change in the Palo Verde rate-making mechanisms resulting from the implementation of the 2003 GRC and an increase in depreciation expense resulting from additions to transmission and distribution assets. The 2004 decrease was mainly due to a change in the Palo Verde and San Onofre rate-making mechanisms in 2003 and 2004, partially offset by an increase in SCE’s depreciation associated with additions to transmission and distribution assets, the consolidation of SCE’s variable interest entities, and an increase in nuclear decommissioning expense.
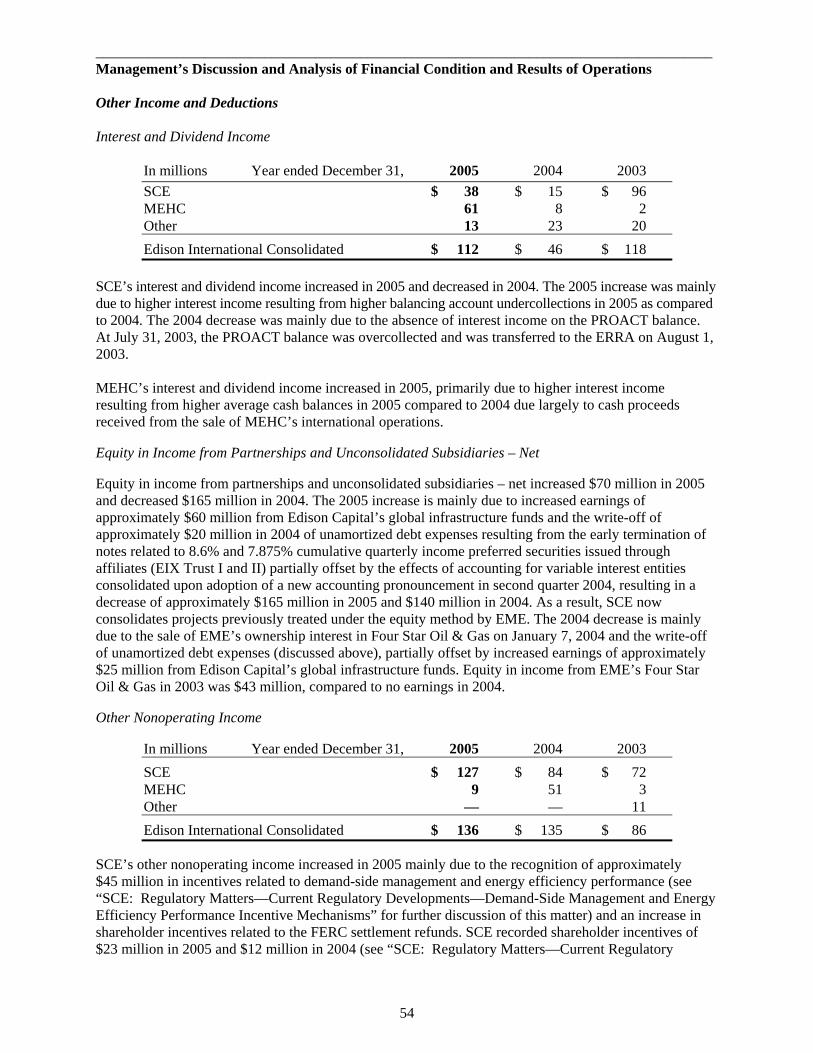
54
____________________________________________________________________________________ Management’s Discussion and Analysis of Financial Condition and Results of Operations Other Income and Deductions Interest and Dividend Income
In millions Year ended December 31, 2005 2004 2003
SCE $ 38 $ 15 $ 96 MEHC 61 8 2 Other 13 23 20
Edison International Consolidated $ 112 $ 46 $ 118 SCE’s interest and dividend income increased in 2005 and decreased in 2004. The 2005 increase was mainly due to higher interest income resulting from higher balancing account undercollections in 2005 as compared to 2004. The 2004 decrease was mainly due to the absence of interest income on the PROACT balance. At July 31, 2003, the PROACT balance was overcollected and was transferred to the ERRA on August 1, 2003. MEHC’s interest and dividend income increased in 2005, primarily due to higher interest income resulting from higher average cash balances in 2005 compared to 2004 due largely to cash proceeds received from the sale of MEHC’s international operations. Equity in Income from Partnerships and Unconsolidated Subsidiaries – Net Equity in income from partnerships and unconsolidated subsidiaries – net increased $70 million in 2005 and decreased $165 million in 2004. The 2005 increase is mainly due to increased earnings of approximately $60 million from Edison Capital’s global infrastructure funds and the write-off of approximately $20 million in 2004 of unamortized debt expenses resulting from the early termination of notes related to 8.6% and 7.875% cumulative quarterly income preferred securities issued through affiliates (EIX Trust I and II) partially offset by the effects of accounting for variable interest entities consolidated upon adoption of a new accounting pronouncement in second quarter 2004, resulting in a decrease of approximately $165 million in 2005 and $140 million in 2004. As a result, SCE now consolidates projects previously treated under the equity method by EME. The 2004 decrease is mainly due to the sale of EME’s ownership interest in Four Star Oil & Gas on January 7, 2004 and the write-off of unamortized debt expenses (discussed above), partially offset by increased earnings of approximately $25 million from Edison Capital’s global infrastructure funds. Equity in income from EME’s Four Star Oil & Gas in 2003 was $43 million, compared to no earnings in 2004. Other Nonoperating Income
In millions Year ended December 31, 2005 2004 2003
SCE $ 127 $ 84 $ 72 MEHC 9 51 3 Other — — 11
Edison International Consolidated $ 136 $ 135 $ 86 SCE’s other nonoperating income increased in 2005 mainly due to the recognition of approximately $45 million in incentives related to demand-side management and energy efficiency performance (see “SCE: Regulatory Matters—Current Regulatory Developments—Demand-Side Management and Energy Efficiency Performance Incentive Mechanisms” for further discussion of this matter) and an increase in shareholder incentives related to the FERC settlement refunds. SCE recorded shareholder incentives of $23 million in 2005 and $12 million in 2004 (see “SCE: Regulatory Matters—Current Regulatory

55
____________________________________________________________________________________ Edison International
Developments—FERC Refund Proceedings” for further discussion). In addition, other nonoperating income includes rewards approved by the CPUC for the efficient operation of Palo Verde of $10 million in 2005 and $19 million in 2004. MEHC’s other nonoperating income in 2004 consisted of a pre-tax gain of $47 million on the sale of MEHC’s interest in Four Star Oil & Gas on January 7, 2004. Interest Expense – Net of Amounts Capitalized
In millions Year ended December 31, 2005 2004 2003
SCE $ (360) $ (409) $ (457) MEHC (407) (449) (451) Other (27) (127) (112)
Edison International Consolidated $ (794) $ (985) $(1,020) Effective July 1, 2003, dividend payments on preferred securities subject to mandatory redemption are included as interest expense based on the adoption of a new accounting standard. The new standard did not allow for prior period restatements, therefore dividends on preferred securities subject to mandatory redemption for the first six months of 2003 are not included in interest expense – net of amounts capitalized in the consolidated statements of income. In addition to the discussion above, SCE’s interest expense – net of amounts capitalized decreased in both 2005 and 2004. The 2005 and 2004 decreases were mainly due to lower interest expense on long-term debt resulting from the redemption of high interest rate debt by issuing new debt with lower interest rates. The 2005 decrease also reflects the reversal of approximately $25 million of accrued interest expense as a result of a FERC decision allowing recovery of transmission-related costs (see “SCE: Regulatory Matters—Current Regulatory Developments—Transmission Proceeding”), partially offset by interest expense on balancing account overcollections. MEHC’s interest expense – net of amounts capitalized decreased in 2005, mainly due to the repayment of MEHC (parent)’s $385 million term loan ($100 million of the term loan was repaid in July 2004 and the remaining $285 million of the term loan was repaid in January 2005), partially offset by higher interest expense at MEHC’s Illinois plants, primarily attributable to a full year of interest expense in 2005 versus approximately eight months of interest expense in 2004 related to debt issued in April 2004 by Midwest Generation, which owns or leases the Illinois plants. The decrease in interest expense – net of amounts capitalized related to Other in 2005 was due to the elimination of Edison International (parent)’s debt. Edison International (parent) has had no debt outstanding since the fourth quarter of 2004. Other Nonoperating Deductions
In millions Year ended December 31, 2005 2004 2003
SCE $ (65) $ (69) $ (23) Other (2) (11) (9)
Edison International Consolidated $ (67) $ (80) $ (32) SCE’s other nonoperating deductions in 2005 includes an accrual of $22 million for system reliability penalties under a performance incentive mechanism. Based on recorded data through December 2005, SCE expects it will incur a penalty of $22 million under the reliability performance mechanism for 2005.
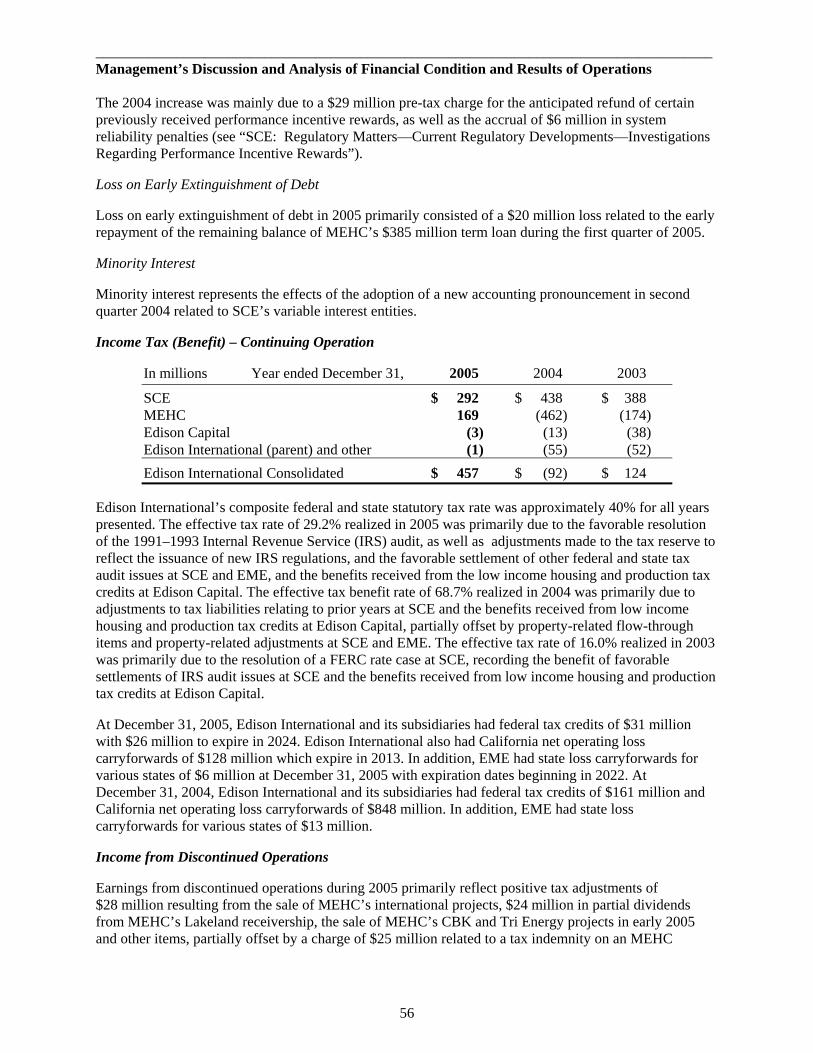
56
____________________________________________________________________________________ Management’s Discussion and Analysis of Financial Condition and Results of Operations The 2004 increase was mainly due to a $29 million pre-tax charge for the anticipated refund of certain previously received performance incentive rewards, as well as the accrual of $6 million in system reliability penalties (see “SCE: Regulatory Matters—Current Regulatory Developments—Investigations Regarding Performance Incentive Rewards”). Loss on Early Extinguishment of Debt Loss on early extinguishment of debt in 2005 primarily consisted of a $20 million loss related to the early repayment of the remaining balance of MEHC’s $385 million term loan during the first quarter of 2005. Minority Interest Minority interest represents the effects of the adoption of a new accounting pronouncement in second quarter 2004 related to SCE’s variable interest entities. Income Tax (Benefit) – Continuing Operation
In millions Year ended December 31, 2005 2004 2003
SCE $ 292 $ 438 $ 388 MEHC 169 (462) (174) Edison Capital (3) (13) (38) Edison International (parent) and other (1) (55) (52)
Edison International Consolidated $ 457 $ (92) $ 124 Edison International’s composite federal and state statutory tax rate was approximately 40% for all years presented. The effective tax rate of 29.2% realized in 2005 was primarily due to the favorable resolution of the 1991–1993 Internal Revenue Service (IRS) audit, as well as adjustments made to the tax reserve to reflect the issuance of new IRS regulations, and the favorable settlement of other federal and state tax audit issues at SCE and EME, and the benefits received from the low income housing and production tax credits at Edison Capital. The effective tax benefit rate of 68.7% realized in 2004 was primarily due to adjustments to tax liabilities relating to prior years at SCE and the benefits received from low income housing and production tax credits at Edison Capital, partially offset by property-related flow-through items and property-related adjustments at SCE and EME. The effective tax rate of 16.0% realized in 2003 was primarily due to the resolution of a FERC rate case at SCE, recording the benefit of favorable settlements of IRS audit issues at SCE and the benefits received from low income housing and production tax credits at Edison Capital. At December 31, 2005, Edison International and its subsidiaries had federal tax credits of $31 million with $26 million to expire in 2024. Edison International also had California net operating loss carryforwards of $128 million which expire in 2013. In addition, EME had state loss carryforwards for various states of $6 million at December 31, 2005 with expiration dates beginning in 2022. At December 31, 2004, Edison International and its subsidiaries had federal tax credits of $161 million and California net operating loss carryforwards of $848 million. In addition, EME had state loss carryforwards for various states of $13 million. Income from Discontinued Operations Earnings from discontinued operations during 2005 primarily reflect positive tax adjustments of $28 million resulting from the sale of MEHC’s international projects, $24 million in partial dividends from MEHC’s Lakeland receivership, the sale of MEHC’s CBK and Tri Energy projects in early 2005 and other items, partially offset by a charge of $25 million related to a tax indemnity on an MEHC

57
____________________________________________________________________________________ Edison International
international project sold in 2004. Earnings from discontinued operations during 2004 include gains of $533 million related to both the sale of MEHC’s interests in Contact Energy and the sale of 11 of MEHC’s 14 international projects and recognition of a tax benefit. Earnings from discontinued operations during 2003 include a gain on sale and operating results totaling $50 million from SCE’s pipeline business which was sold in the third quarter of 2003 and income from discontinued operations of $124 million at MEHC. Cumulative Effect of Accounting Change – Net of Tax Edison International’s results for 2004 include a charge for the cumulative effect of a change in accounting principle reflecting the impact of Edison Capital’s implementation of an accounting standard that requires the consolidation of certain variable interest entities. Edison International’s results for 2003 include a charge at EME for the cumulative effect of an accounting change related to the accounting standard for recording asset retirement obligations (ARO). Because SCE follows accounting principles for rate-regulated enterprises and receives recovery of these costs through rates, implementation of this new standard did not affect earnings. Historical Cash Flow Analysis The “Historical Cash Flow Analysis” section of this MD&A discusses consolidated cash flows from operating, financing and investing activities. Cash Flows from Operating Activities Net cash provided by operating activities:
In millions Year ended December 31, 2005 2004 2003
Continuing operations $ 2,191 $ 1,600 $ 3,061 Discontinued operations 22 (481) 191 $ 2,213 $ 1,119 $ 3,252
The 2005 change in cash provided by operating activities from continuing operations was mainly due to an increase in income from continuing operations, and the results from the timing of cash receipts and disbursements related to working capital items. The 2004 decrease in cash provided by operating activities from continuing operations was mainly due to SCE’s implementation of a CPUC-approved customer rate reduction plan effective August 1, 2003 and EME’s 2004 lease termination payment of $960 million related to its Collins Station lease. Cash used in operating activities from discontinued operations in 2004 primarily reflects settlement of working capital items from the sale of MEHC’s international operations. Cash provided by operating activities from discontinued operations in 2003 primarily reflects operating income and distributions from international projects.

58
____________________________________________________________________________________ Management’s Discussion and Analysis of Financial Condition and Results of Operations Cash Flows from Financing Activities Net cash used by financing activities:
In millions Year ended December 31, 2005 2004 2003 Continuing operations $ (1,234) $ (1,258) $ (2,113) Discontinued operations — (144) 153 $ (1,234) $ (1,402) $ (1,960)
Cash used by financing activities from continuing operations mainly consisted of long-term and short-term debt payments at SCE and EME. Financing activities in 2005 included activities relating to the rebalancing of SCE’s capital structure and the reduction of debt at MEHC. SCE’s first quarter 2005 financing activity included the issuance of $650 million of first and refunding mortgage bonds. The issuance included $400 million of 5% bonds due in 2016 and $250 million of 5.55% bonds due in 2036. The proceeds were used to redeem the remaining $50,000 of its 8% first and refunding mortgage bonds due February 2007 (Series 2003A) and $650 million of the $966 million 8% first and refunding mortgage bonds due February 2007 (Series 2003B). SCE’s second quarter financing activity included the issuance of $350 million of its 5.35% first and refunding mortgage bond due in 2035 (Series 2005E). A portion of the proceeds was used to redeem $316 million of its 8% first and refunding mortgage bonds due in 2007 (Series 2003B). In addition, in April 2005, SCE issued four million shares of Series A preference stock (non-cumulative, $100 liquidation value) and received net proceeds of approximately $394 million. Approximately $81 million of the proceeds was used to redeem all the outstanding shares of its $100 cumulative preferred stock, 7.23% Series, and approximately $64 million of the proceeds was used to redeem all the outstanding shares of its $100 cumulative preferred stock, 6.05% Series. SCE’s third quarter 2005 financing activity included the issuance of two million shares of Series B preference stock (non-cumulative, $100 liquidation value) and received net proceeds of approximately $197 million. MEHC’s first quarter financing activity included the repayment of the remaining $285 million of the term loan, the repayment of the junior subordinated debentures of $150 million and a $302 million repayment in April 2005 related to Midwest Generation’s existing term loan. Financing activities in 2005 also include dividend payments of $326 million paid by Edison International to its shareholders. In 2004, Edison International (parent) repaid its $618 million 6-7/8% notes due September 2004 and $825 million of notes related to 8.6% and 7.875% cumulative quarterly income preferred securities issued through affiliates (EIX Trust I and II). SCE financing activities in 2004 include the issuance of $300 million of 5% bonds due in 2014, $525 million of 6% bonds due in 2034 and $150 million of floating rate bonds due in 2006 all issued during the first quarter of 2004. The proceeds from these issuances were used to call at par $300 million of 7.25% first and refunding mortgage bonds due March 2026, $225 million of 7.125% first and refunding mortgage bonds due July 2025, $200 million of 6.9% first and refunding mortgage bonds due October 2018, and $100 million of junior subordinated deferrable interest debentures due June 2044. In addition, during the first quarter of 2004, SCE paid the $200 million outstanding balance of its credit facility, as well as remarketed approximately $550 million of pollution-control bonds with varying maturity dates ranging from 2008 to 2040. Approximately $354 million of these pollution-control bonds had been held by SCE since 2001 and the remaining $196 million were purchased and reoffered in 2004. In March 2004, SCE issued $300 million of 4.65% first and refunding mortgage bonds due in 2015 and $350 million of 5.75% first and refunding mortgage bonds due in 2035. A portion of the proceeds from the March 2004 first and refunding mortgage bond issuances were used to fund the acquisition and construction of the Mountainview project. During the third quarter, SCE paid $125 million of 5.875% bonds due in September 2004. During the fourth quarter, SCE issued $150 million of floating rate first and refunding mortgage bonds due in 2007. MEHC’s

59
____________________________________________________________________________________ Edison International
financing activities included the $1 billion secured notes and $700 million term loan facility received by Midwest Generation in April 2004, the repayment of the $800 million secured loan at EME’s subsidiary, Mission Energy Holdings International, Inc., $693 million related to Edison Mission Midwest Holdings’ credit facility, $28 million related to the EME’s Coal and Capex facility in April 2004, and $100 million related to MEHC’s $385 million term loan in July 2004. Edison Capital’s financing activities included net payments of $119 million on long-term debt. Financing activities in 2004 also included dividend payments of $261 million paid by Edison International to its shareholders. During the first quarter of 2003, Edison International (parent) repurchased approximately $132 million of the outstanding $750 million of its 6-7/8% notes due September 2004. No repurchases were made during the remainder of 2003. SCE’s financing activities during 2003 included an exchange offer of $966 million of 8.95% variable rate notes due November 2003 for $966 million of new series first and refunding mortgage bonds due February 2007. In addition, during 2003, SCE repaid $125 million of its 6.25% bonds, the outstanding balance of $300 million of a $600 million one-year term loan due March 3, 2003, $300 million on its revolving line of credit, and $700 million of a term loan due March 2005. The $700 million term loan was retired with a cash payment of $500 million and $200 million drawn on a $700 million credit facility that expires in 2006. MEHC’s financing activity during 2003 includes an $800 million secured loan received by EME’s subsidiary, Mission Energy Holdings International, Inc., debt service payments of $911 million related to Tranche A and $116 million related to Tranche B of Edison Mission Energy Holdings’ credit facility, repayment of $167 million on the Coal and Capex facility guaranteed by EME, and debt service payments of $118 million related to three of EME’s subsidiaries. Cash used in financing activities from discontinued operations in 2004 primarily reflects repayment of debt and dividends to minority shareholders. Cash provided by financing activities from discontinued operations in 2003 primarily reflects borrowings by Contact Energy to finance an acquisition of a power station, partially offset by repayment of debt. Cash Flows from Investing Activities Net cash provided (used) by investing activities:
In millions Year ended December 31, 2005 2004 2003
Continuing operations $ (1,780) $ 640 $ (1,173) Discontinued operations 5 58 (413) $ (1,775) $ 698 $ (1,586)
Cash flows from investing activities are affected by capital expenditures, EME’s sales of assets and SCE’s funding of nuclear decommissioning trusts. Investing activities in 2005 reflect $1.8 billion in capital expenditures at SCE, primarily for transmission and distribution assets, including approximately $59 million for nuclear fuel acquisitions and approximately $166 million related to the Mountainview project, and $57 million in capital expenditures at MEHC. Investing activities also include $124 million in proceeds received in 2005 from the sale of EME’s 25% investment in the Tri Energy project and EME’s 50% investment in the CBK project, and $154 million paid towards the purchase price for EME’s San Juan Mesa project in December 2005. Investing activities in 2004 reflect $1.7 billion in capital expenditures at SCE, primarily for transmission and distribution assets, including approximately $70 million for nuclear fuel acquisitions, and $55 million in capital expenditures at EME. In addition, investing activities include $285 million of acquisition costs related to the Mountainview project at SCE, $118 million in proceeds received in 2004
60
____________________________________________________________________________________ Management’s Discussion and Analysis of Financial Condition and Results of Operations at EME from the sale of 100% of EME’s stock of Edison Mission Energy Oil & Gas and the sale of EME’s 50% partnership interest in the Brooklyn Navy Yard project, and $2.7 billion in proceeds received in 2004 at EME from the sale of its international projects. SCE’s capital expenditures during 2003 were approximately $1.2 billion, primarily for transmission and distribution assets. EME’s capital expenditures in 2003 were $81 million primarily for new plant and equipment related to MEHC’s Illinois plants and its Homer City facilities. Cash used in investing activities from discontinued operations in 2003 primarily reflects $275 million paid in 2003 by Contact Energy for an acquisition of a power station and investments in new plant and equipment. DISCONTINUED OPERATIONS On February 3, 2005, EME sold its 25% equity interest in the Tri Energy project, pursuant to a purchase agreement dated December 15, 2004, to a consortium comprised of International Power plc (70%) and Mitsui & Co., Ltd. (30%), referred to as IPM, for approximately $20 million. On January 10, 2005, EME sold its 50% equity interest in the Caliraya-Botocan-Kalayaan project to Corporacion IMPSA S.A., pursuant to a purchase agreement dated November 5, 2004. Proceeds from the sale were approximately $104 million. On December 16, 2004, EME sold the stock and related assets of MEC International B.V. (MECIBV) to IPM, pursuant to a purchase agreement dated July 29, 2004. The purchase agreement was entered into following a competitive bidding process. The sale of MECIBV included the sale of MEHC’s interests in ten electric power generating projects or companies located in Europe, Asia, Australia, and Puerto Rico. Consideration from the sale of MECIBV and related assets was $2.0 billion. On September 30, 2004, EME sold its 51% interest in Contact Energy to Origin Energy New Zealand Limited pursuant to a purchase agreement dated July 20, 2004. The purchase agreement was entered into following a competitive bidding process. Consideration for the sale was NZ$1.6 billion (approximately $1.1 billion) which includes NZ$535 million of debt assumed by the purchaser. EME previously owned a 220 MW power plant located in the United Kingdom, referred to as the Lakeland project. An administrative receiver was appointed in 2002 as a result of a default by its counterparty, a subsidiary of TXU Europe Group plc. Following a claim for termination of the power sales agreement, the Lakeland project received a settlement of £116 million (approximately $217 million). EME is entitled to receive the remaining amount of the settlement after payment of creditor claims. Payments received to date include £13 million (approximately $24 million) in March 2005 and £18 million (approximately $31 million) in February 2006. Beginning in 2002, EME reported the Lakeland project as discontinued operations and accounts for its ownership of Lakeland Power on the cost method (earnings are recognized as cash is distributed from the project). For all years presented, the results of EME’s international projects, discussed above have been accounted for as discontinued operations in the consolidated financial statements in accordance with an accounting standard related to the impairment and disposal of long-lived assets. In July 2003, SCE sold its oil storage and pipeline facilities to Pacific Terminals LLC for $158 million. As a result, in third quarter 2003, SCE recorded a $44 million after-tax gain to shareholders. In 2003, the results of SCE’s oil storage and pipeline facilities unit have been accounted for as a discontinued operation in accordance with an accounting standard related to the impairment and disposal of long-lived assets.

61
____________________________________________________________________________________ Edison International
There was no revenue from discontinued operations in 2005. Revenue from discontinued operations was $1.3 billion in 2004 and $1.5 billion in 2003. The pre-tax earnings (loss) from discontinued operations was $(20) million in 2005, $737 million in 2004 and $296 million in 2003. The pre-tax loss from discontinued operations in 2005 included a $9 million gain on sale before taxes. The pre-tax earnings from discontinued operations in 2004 included a $532 million gain on sale before taxes related to EME’s international power generation portfolio. During the third quarter of 2005, EME recorded tax benefit adjustments of $28 million, which resulted from the completion of the 2004 federal and California income tax returns and quarterly review of tax accruals. The majority of the tax adjustments were related to the sale of the international projects in December 2004. These adjustments (benefits) are included in income from discontinued operations – net of tax on the consolidated statements of income. During the fourth quarter of 2005, EME recorded an after-tax charge of $25 million related to a tax indemnity for a project sold to IPM in December 2004. This charge related to an adverse tax court ruling in Spain, which the local company plans to appeal. ACQUISITIONS AND DISPOSITIONS Acquisitions On December 27, 2005, EME completed a transaction with Padoma Project Holdings, LLC to acquire a 100% interest in the San Juan Mesa Wind Project, which owns a 120 MW wind power generation facility located in New Mexico, referred to as the San Juan Mesa wind project. The total purchase price was approximately $157 million. The acquisition was funded with cash. The acquisition was accounted for utilizing the purchase method. The fair value of the San Juan Mesa wind project was equal to the purchase price and as a result, the entire purchase price was allocated to nonutility property in Edison International’s consolidated balance sheet. Edison International’s consolidated statement of income will reflect the operations of the San Juan Mesa project beginning January 1, 2006. In March 2004, SCE acquired Mountainview Power Company LLC, which consisted of a power plant in the early stages of construction in Redlands, California. The Mountainview generating facility is now operating, providing southern California with additional generating capacity of 1,054 MW. As a result, customers will receive over the life of the asset, a $58 million net present value benefit from “bonus” tax depreciation. On January 10, 2006, the FERC accepted the use of the 2005 CPUC-approved rate of return to be applied to the Mountainview power-purchase agreement. Dispositions See “Discontinued Operations” for a discussion of dispositions accounted for as discontinued operations. On March 31, 2004, EME completed the sale of its 50% partnership interest in Brooklyn Navy Yard Cogeneration Partners L.P. for a sales price of approximately $42 million. EME recorded an impairment charge of $53 million during the fourth quarter of 2003 related to the planned disposition of this investment and a pre-tax loss of approximately $4 million during the first quarter of 2004 due to changes in the terms of the sale. On January 7, 2004, EME completed the sale of 100% of its stock of Edison Mission Energy Oil & Gas, which in turn held minority interests in Four Star Oil & Gas. Proceeds from the sale were approximately $100 million. EME recorded a pre-tax gain on the sale of approximately $47 million during the first quarter of 2004.

62
____________________________________________________________________________________ Management’s Discussion and Analysis of Financial Condition and Results of Operations In fourth quarter 2003, Gordonsville Energy Limited Partnership, in which EME owns a 50% interest, completed the sale of the Gordonsville cogeneration facility. Proceeds from the sale, including distribution of a debt service reserve fund, were $36 million. In second quarter 2003, EME recorded an impairment charge of $6 million related to the planned disposition of this investment. CRITICAL ACCOUNTING ESTIMATES The accounting policies described below are viewed by management as critical because their application is the most relevant and material to Edison International’s results of operations and financial position and these policies require the use of material judgments and estimates. Many of the critical accounting estimates discussed below generally do not impact SCE’s earnings since SCE applies accounting principles for rate-regulated enterprises. However these critical accounting estimates may impact amounts reported on the consolidated balance sheets. Rate Regulated Enterprises SCE applies accounting principles for rate-regulated enterprises to the portion of its operations, in which regulators set rates at levels intended to recover the estimated costs of providing service, plus a return on capital. Due to timing and other differences in the collection of revenue, these principles allow an incurred cost that would otherwise be charged to expense by a nonregulated entity to be capitalized as a regulatory asset if it is probable that the cost is recoverable through future rates and conversely allow creation of a regulatory liability for probable future costs collected through rates in advance. SCE’s management continually assesses whether the regulatory assets are probable of future recovery by considering factors such as the current regulatory environment, the issuance of rate orders on recovery of the specific incurred cost or a similar incurred cost to SCE or other rate-regulated entities in California, and assurances from the regulator (as well as its primary intervenor groups) that the incurred cost will be treated as an allowable cost (and not challenged) for rate-making purposes. Because current rates include the recovery of existing regulatory assets and settlement of regulatory liabilities, and rates in effect are expected to allow SCE to earn a reasonable rate of return, management believes that existing regulatory assets and liabilities are probable of recovery. This determination reflects the current political and regulatory climate in California and is subject to change in the future. If future recovery of costs ceases to be probable, all or part of the regulatory assets and liabilities would have to be written off against current period earnings. At December 31, 2005, the consolidated balance sheets included regulatory assets of $3.5 billion and regulatory liabilities of $3.6 billion. Management continually evaluates the anticipated recovery of regulatory assets, liabilities, and revenue subject to refund and provides for allowances and/or reserves as appropriate. Derivative Financial Instruments and Hedging Activities Edison International follows the accounting standard for derivative instruments and hedging activities, which requires derivative financial instruments to be recorded at their fair value unless an exception applies. The accounting standard also requires that changes in a derivative’s fair value be recognized currently in earnings unless specific hedge accounting criteria are met. For derivatives that qualify for hedge accounting, depending on the nature of the hedge, changes in fair value are either offset by changes in the fair value of the hedged assets, liabilities or firm commitments through earnings, or recognized in other comprehensive income until the hedged item is recognized in earnings. The ineffective portion of a derivative’s change in fair value is immediately recognized in earnings. Derivative assets and liabilities are shown at gross amounts on the balance sheet, except that net presentation is used when Edison International has the legal right of setoff, such as multiple contracts executed with the same counterparty under master netting arrangements.
63
____________________________________________________________________________________ Edison International
SCE enters into contracts for power and gas options, as well as swaps, futures and forward contracts in order to mitigate its exposure to increases in natural gas and electricity pricing. These transactions are pre-approved by the CPUC or executed in compliance with CPUC-approved procurement plans. Hedge accounting is not used for these transactions. Any fair value changes for recorded derivatives are offset through a regulatory mechanism; therefore, fair value changes do not affect earnings. Unit-specific contracts (signed or modified after June 30, 2003) in which SCE takes virtually all of the output of a facility are generally considered to be leases under accounting rules. Leases are not derivatives and are not recorded on the balance sheet unless they are classified as capital leases. Most of SCE’s QF contracts are not required to be recorded on its balance sheet. However, SCE purchases power from certain QFs in which the contract pricing is based on a natural gas index, but the power is not generated with natural gas. The portion of these contracts that is not eligible for the normal purchases and sales exception under accounting rules is recorded on the balance sheet at fair value, based on financial models. EME uses derivative financial instruments for price risk management activities and trading purposes. Derivative financial instruments are mainly utilized to manage exposure from changes in electricity and fuel prices, and interest rates. Management’s judgment is required to determine if a transaction meets the definition of a derivative and, if it does, whether the normal sales and purchases exception applies or whether individual transactions qualify for hedge accounting treatment. The majority of EME’s long-term power sales and fuel supply agreements related to its generation activities either: (1) do not meet the definition of a derivative because they are not readily convertible to cash, or (2) qualify as normal purchases and sales and are, therefore, recorded on an accrual basis. Derivative financial instruments used for trading purposes include forwards, futures, options, swaps and other financial instruments with third parties. EME records derivative financial instruments used for trading at fair value. The majority of EME’s derivative financial instruments with a short-term duration (less than one year) are valued using quoted market prices. In the absence of quoted market prices, derivative financial instruments are valued considering the time value of money, volatility of the underlying commodity, and other factors as determined by EME. Resulting gains and losses are recognized in nonutility power generation revenue in the accompanying consolidated income statements in the period of change. Assets from price risk management and energy trading activities include open financial positions related to derivative financial instruments recorded at fair value, including cash flow hedges, that are “in-the-money” and the present value of net amounts receivable from structured transactions. Liabilities from price risk management and energy trading activities include open financial positions related to derivative financial instruments, including cash flow hedges, that are “out-of-the-money.” Determining the fair value of Edison International’s derivatives under this accounting standard is a critical accounting estimate because the fair value of a derivative is susceptible to significant change resulting from a number of factors, including volatility of energy prices, credits risks, market liquidity and discount rates. See “SCE: Market Risk Exposures” and “MEHC: Market Risk Exposures” for a description of risk management activities and sensitivities to change in market prices. Income Taxes Edison International’s eligible subsidiaries are included in Edison International’s consolidated federal income tax and combined state franchise tax returns. Edison International has tax-allocation and payment agreements with certain of its subsidiaries. For subsidiaries other than SCE, the right of a participating

64
____________________________________________________________________________________ Management’s Discussion and Analysis of Financial Condition and Results of Operations subsidiary to receive or make a payment and the amount and timing of tax-allocation payments are dependent on the inclusion of the subsidiary in the consolidated income tax returns of Edison International and other factors including the consolidated taxable income of Edison International and its includible subsidiaries, the amount of taxable income or net operating losses and other tax items of the participating subsidiary, as well as the other subsidiaries of Edison International. There are specific procedures regarding allocations of state taxes. Each subsidiary is eligible to receive tax-allocation payments for its tax losses or credits only at such time as Edison International and its subsidiaries generate sufficient taxable income to be able to utilize the participating subsidiary’s losses in the consolidated tax return of Edison International. Under an income tax-allocation agreement approved by the CPUC, SCE’s tax liability is computed as if it filed a separate return. The accounting standard for income taxes requires the asset and liability approach for financial accounting and reporting for deferred income taxes. Edison International uses the asset and liability method of accounting for deferred income taxes and provides deferred income taxes for all significant income tax temporary differences. As part of the process of preparing its consolidated financial statements, Edison International is required to estimate its income taxes in each jurisdiction in which it operates. This process involves estimating actual current tax expense together with assessing temporary differences resulting from differing treatment of items, such as depreciation, for tax and accounting purposes. These differences result in deferred tax assets and liabilities, which are included within Edison International’s consolidated balance sheet. Edison International takes certain tax positions it believes are applied in accordance with tax laws. The application of these positions is subject to interpretation and audit by the IRS. As further described in “Other Developments—Federal Income Taxes,” the IRS has raised issues in the audit of Edison International’s tax returns with respect to certain leveraged leases at Edison Capital. Management continually evaluates its income tax exposures and provides for allowances and/or reserves as appropriate. Off-Balance Sheet Financing EME has entered into sale-leaseback transactions related to the Powerton and Joliet plants in Illinois and the Homer City facilities in Pennsylvania. (See “Off-Balance Sheet Transactions—EME’s Off-Balance Sheet Transactions—Sale-Leaseback Transactions.”) Each of these transactions was completed and accounted for by EME as an operating lease in its consolidated financial statements in accordance with the accounting standard for sale-leaseback transactions involving real estate, which requires, among other things, that all the risk and rewards of ownership of assets be transferred to a new owner without continuing involvement in the assets by the former owner other than as normal for a lessee. The sale-leaseback transactions of these power plants were complex matters that involved management judgment to determine compliance with accounting standards, including the transfer of all the risk and rewards of ownership of the power plants to the new owner without EME’s continuing involvement other than as normal for a lessee. These transactions were entered into to provide a source of capital either to fund the original acquisition of the assets or to repay indebtedness previously incurred for the acquisition. Each of these leases uses special purpose entities. Based on existing accounting guidance, EME does not record these lease obligations in its consolidated balance sheet. If these transactions were required to be consolidated as a result of future changes in accounting guidance, it would: (1) increase property, plant and equipment and long-term obligations in the consolidated financial position, and (2) impact the pattern of expense recognition related to these obligations because EME would likely change from its current straight-line recognition of rental expense to an annual recognition of the straight-line depreciation on the leased assets as well as the interest component of the financings which is weighted more heavily toward the early years of the obligations.
65
____________________________________________________________________________________ Edison International
The difference in expense recognition would not affect EME’s cash flows under these transactions. See “Off-Balance Sheet Transactions.” Edison Capital has entered into lease transactions, as lessor, related to various power generation, electric transmission and distribution, transportation and telecommunications assets. All of the debt under Edison Capital’s leveraged leases is nonrecourse and is not recorded on Edison International’s balance sheet in accordance with the applicable accounting standards. Partnership investments, in which Edison International owns a percentage interest and does not have operational control or significant voting rights, are accounted for under the equity method as required by accounting standards. As such, the project assets and liabilities are not consolidated on the balance sheet. Rather, the financial statements reflect only the proportionate ownership share of net income or loss. See “Off-Balance Sheet Transactions.” Asset Impairment Edison International evaluates long-lived assets whenever indicators of potential impairment exist. Accounting standards require that if the undiscounted expected future cash flow from a company’s assets or group of assets (without interest charges) is less than its carrying value, an asset impairment must be recognized in the financial statements. The amount of impairment is determined by the difference between the carrying amount and fair value of the asset. The assessment of impairment is a critical accounting estimate because significant management judgment is required to determine: (1) if an indicator of impairment has occurred, (2) how assets should be grouped, (3) the forecast of undiscounted expected future cash flow over the asset’s estimated useful life to determine if an impairment exists, and (4) if an impairment exists, the fair value of the asset or asset group. Factors that Edison International considers important, which could trigger an impairment, include operating losses from a project, projected future operating losses, the financial condition of counterparties, or significant negative industry or economic trends. During 2005, 2004 and 2003, MEHC recorded impairment charges of $55 million, $35 million and $304 million, respectively, related to specific assets included in continuing operations. See “Results of Operations and Historical Cash Flow Analysis—Results of Operations” and “—Asset Impairment and Loss on Lease Termination.” Nuclear Decommissioning Edison International’s legal AROs related to the decommissioning of SCE’s nuclear power facilities are recorded at fair value. The fair value of decommissioning SCE’s nuclear power facilities are based on site-specific studies performed in 2005 for SCE’s San Onofre and Palo Verde nuclear facilities. Changes in the estimated costs, timing of decommissioning, or the assumptions underlying these estimates could cause material revisions to the estimated total cost to decommission these facilities. SCE estimates that it will spend approximately $11.4 billion through 2049 to decommission its active nuclear facilities. This estimate is based on SCE’s decommissioning cost methodology used for rate-making purposes, escalated at rates ranging from 1.7% to 7.5% (depending on the cost element) annually. Nuclear decommissioning costs are recovered in utility rates. These costs are expected to be funded from independent decommissioning trusts that currently receive contributions of approximately $32 million per year. As of December 31, 2005, the decommissioning trust balance was $2.9 billion. Contributions to the decommissioning trusts are reviewed every three years by the CPUC. The contributions are determined from an analysis of estimated decommissioning costs, the current value of trust assets and long-term forecasts of cost escalation and after-tax return on trust investments. Favorable or unfavorable

66
____________________________________________________________________________________ Management’s Discussion and Analysis of Financial Condition and Results of Operations investment performance in a period will not change the amount of contributions for that period. However, trust performance for the three years leading up to a CPUC review proceeding will provide input into future contributions. The CPUC has set certain restrictions related to the investments of these trusts. If additional funds are needed for decommissioning, it is probable that the additional funds will be recoverable through customer rates. Trust funds are recorded on the balance sheet at market value. Decommissioning of San Onofre Unit 1 is underway. All of SCE’s San Onofre Unit 1 decommissioning costs will be paid from its nuclear decommissioning trust funds, subject to CPUC review. The estimated remaining cost to decommission San Onofre Unit 1 of $186 million at of December 31, 2005 is recorded as an ARO liability. Pensions and Postretirement Benefits Other than Pensions Pension and other postretirement obligations and the related effects on results of operations are calculated using actuarial models. Two critical assumptions, discount rate and expected return on assets, are important elements of plan expense and liability measurement. Additionally, health care cost trend rates are critical assumptions for postretirement health care plans. These critical assumptions are evaluated at least annually. Other assumptions, such as retirement, mortality and turnover, are evaluated periodically and updated to reflect actual experience. The discount rate enables Edison International to state expected future cash flows at a present value on the measurement date. Edison International selects its discount rate by performing a yield curve analysis. This analysis determines the equivalent discount rate on projected cash flows, matching the timing and amount of expected benefit payments. Three yield curves were considered: two corporate yield curves (Citigroup and AON) and a curve based on treasury rates (plus 90 basis points). Edison International also compared the yield curve analysis against the Moody’s AA Corporate bond rate. At the December 31, 2005 measurement date, Edison International used a discount rate of 5.5% for both pensions and postretirement benefits other than pensions (PBOP). To determine the expected long-term rate of return on pension plan assets, current and expected asset allocations are considered, as well as historical and expected returns on plan assets. The expected rate of return on plan assets was 7.5% for pensions and 7.1% for PBOP. A portion of PBOP trusts asset returns are subject to taxation, so the 7.1% figure above is determined on an after-tax basis. Actual time-weighted, annualized returns on the pension plan assets were 11.0%, 6.0% and 10.9% for the one-year, five-year and ten-year periods ended December 31, 2005, respectively. Actual time-weighted, annualized returns on the PBOP plan assets were 6.3%, 3.3% and 8.3% over these same periods. Accounting principles provide that differences between expected and actual returns are recognized over the average future service of employees. SCE accounts for about 94% of Edison International’s total pension obligation, and 97% of its assets held in trusts, at December 31, 2005. SCE records pension expense equal to the amount funded to the trusts, as calculated using an actuarial method required for rate-making purposes, in which the impact of market volatility on plan assets is recognized in earnings on a more gradual basis. Any difference between pension expense calculated in accordance with rate-making methods and pension expense calculated in accordance with accounting standards is accumulated as a regulatory asset or liability, and will, over time, be recovered from or returned to customers. As of December 31, 2005, this cumulative difference amounted to a regulatory liability of $88 million, meaning that the rate-making method has recognized $88 million more in expense than the accounting method since implementation of the pension accounting standard in 1987. Under accounting standards, if the accumulated benefit obligation exceeds the market value of plan assets at the measurement date, the difference may result in a reduction to shareholders’ equity through a

67
____________________________________________________________________________________ Edison International
charge to other comprehensive income, but would not affect current net income. The reduction to other comprehensive income would be restored through shareholders’ equity in future periods to the extent the market value of trust assets exceeded the accumulated benefit obligation. This assessment is performed annually. Edison International’s pension and PBOP plans are subject to the limits established for federal tax deductibility. SCE funds its pension and PBOP plans in accordance with amounts allowed by the CPUC. Executive pension plans and nonutility PBOP plans have no plan assets. At December 31, 2005, Edison International’s PBOP plans had a $2.4 billion benefit obligation. Total expense for these plans was $85 million for 2005. The health care cost trend rate is 10.25% for 2006, gradually declining to 5% for 2011 and beyond. Increasing the health care cost trend rate by one percentage point would increase the accumulated obligation as of December 31, 2005 by $286 million and annual aggregate service and interest costs by $20 million. Decreasing the health care cost trend rate by one percentage point would decrease the accumulated obligation as of December 31, 2005 by $254 million and annual aggregate service and interest costs by $18 million. NEW ACCOUNTING PRONOUNCEMENTS In March 2005, the Financial Accounting Standards Board (FASB) issued an interpretation related to accounting for conditional ARO. This interpretation clarifies that an entity is required to recognize a liability for the fair value of a conditional ARO if the fair value can be reasonably estimated even though uncertainty exists about the timing and/or method of settlement. This interpretation was effective as of December 31, 2005. Edison International identified conditional AROs related to: treated wood poles, hazardous materials such as mercury and polychlorinated biphenyls-containing equipment; and asbestos removal costs at buildings, operating stations and retired units. Since SCE follows accounting principles for rate-regulated enterprises and receives recovery of these costs through rates, implementation of this interpretation increased SCE’s ARO by $14 million, but did not affect Edison International’s earnings. EME recorded a $1 million (after tax) charge as a cumulative effect adjustment for asbestos removal and disposal activities associated with retired Powerton structures that are currently scheduled for demolition in 2007. A new accounting standard requires companies to use the fair value accounting method for stock-based compensation. Edison International is required to implement the new standard in the first quarter of 2006 and will apply the modified prospective transition method. Under the modified prospective method, the new accounting standard will be applied effective January 1, 2006 to the unvested portion of awards previously granted and will be applied to all prospective awards. Prior financial statements will not be restated under this method. The new accounting standard will result in the recognition of expense for all stock-based compensation awards; previously, Edison International used the intrinsic value method of accounting, at times resulting in no recognition of expense for stock-based compensation. PROPOSED ACCOUNTING PRONOUNCEMENTS In July 2005, the FASB published an exposure draft of a proposed interpretation that seeks to clarify the accounting for uncertain tax positions. An enterprise would be required to recognize, in its financial statements, the best estimate of the impact of a tax position by determining if the weight of the available evidence indicates it is more likely than not, based solely on the technical merits, that the position will be sustained on audit. The proposed effective date is January 1, 2007. The FASB is expected to issue a final interpretation in the first quarter of 2006. Edison International is currently assessing the potential impact of the proposed interpretation on its results of operations and financial condition.
68
____________________________________________________________________________________ Management’s Discussion and Analysis of Financial Condition and Results of Operations COMMITMENTS, GUARANTEES AND INDEMNITIES Edison International’s commitments as of December 31, 2005, for the years 2006 through 2010 and thereafter are estimated below: In millions 2006 2007 2008 2009 2010 Thereafter Long-term debt maturities and sinking-fund requirements(1) $ 1,364 $ 1,091 $ 2,170 $ 1,032 $ 684 $ 9,658 Fuel supply contract payments 493 404 211 134 111 272 Gas and coal transportation payments 234 224 93 84 85 60 Purchased-power capacity payments 842 775 528 417 393 2,681 Operating lease obligations 554 661 628 566 548 2,988 Capital lease obligations 3 4 4 4 4 — Turbine commitments 114 78 — — — — Other commitments 17 16 16 16 19 36 Employee benefit plans contributions(2) 145 — — — — — ______________ (1) Amount includes scheduled principal payments for debt outstanding as of December 31, 2005, assuming long-
term debt is held to maturity, except for EME’s Midwest Generation senior secured notes which are assumed to be held until 2014, and related forecast interest payments over the applicable period of the debt.
(2) Amount includes estimated contributions to the pension plans and postretirement benefits other than pensions. The estimated contributions for MEHC and SCE are not available beyond 2006.
Fuel Supply Contracts SCE and EME have fuel supply contracts which require payment only if the fuel is made available for purchase. SCE has a coal fuel contract that requires payment of certain fixed charges whether or not coal is delivered. At December 31, 2005, EME’s subsidiaries had contractual commitments to purchase coal. The remaining contracts’ lengths range from one year to seven years. The minimum commitments are based on the contract provisions, which consist of fixed prices, subject to adjustment clauses. Gas and Coal Transportation At December 31, 2005, EME had a contractual commitment to transport natural gas. EME is committed to pay its share of fixed monthly capacity charges under its gas transportation agreement, which has a remaining contract length of 12 years.
At December 31, 2005, EME’s subsidiaries had contractual commitments for the transport of coal to their respective facilities, with remaining contract lengths that range from one year to six years. Midwest Generation’s primary contract is with Union Pacific Railroad (and various delivering carriers) which extends through 2011. Midwest Generation commitments under this agreement are based on actual coal purchases from the Powder River Basin. Accordingly, Midwest Generation’s contractual obligations for transportation are based on coal volumes set forth in their fuel supply contracts. EME Homer City commitments under its agreements are based on the contract provisions, which consist of fixed prices, subject to adjustment clauses. Only a portion of total coal shipments to the Homer City facilities are shipped by rail. Trucking remains the predominant mode of transportation for coal shipments to the Homer City facilities.

69
____________________________________________________________________________________ Edison International
Power-Purchase Contracts SCE has power-purchase contracts with certain QFs (cogenerators and small power producers) and other power producers. These contracts provide for capacity payments if a facility meets certain performance obligations and energy payments based on actual power supplied to SCE (the energy payments are not included in the table above). There are no requirements to make debt-service payments. In an effort to replace higher-cost contract payments with lower-cost replacement power, SCE has entered into purchased-power settlements to end its contract obligations with certain QFs. The settlements are reported as power-purchase contracts on the consolidated balance sheets. Operating and Capital Leases Edison International has operating leases for office space, vehicles, property and other equipment (with varying terms, provisions and expiration dates). Unit-specific contracts (signed or modified after June 30, 2003) in which SCE takes virtually all of the output of a facility are generally considered to be leases under accounting rules. At December 31, 2005, SCE had six power contracts that were classified as operating leases and one power contract that was classified as a capital lease (executed in late 2005). At December 31, 2005, minimum operating lease payments were primarily related to long-term leases for the Powerton and Joliet Stations and the Homer City facilities. During 2000, EME entered into sale-leaseback transactions for two power facilities, the Powerton and Joliet coal-fired stations located in Illinois, with third-party lessors. During the fourth quarter of 2001, EME entered into a sale-leaseback transaction for the Homer City coal-fired facilities located in Pennsylvania, with third-party lessors. Total minimum lease payments during the next five years are $337 million in 2006, $336 million in 2007, $337 million in 2008, $336 million in 2009, $325 million in 2010, and the minimum lease payments due after 2010 are $2.9 billion. For further discussion, see “Off-Balance Sheet Transactions—EME’s Off-Balance Sheet Transactions—Sale-Leaseback Transactions.” Turbine Commitments At December 31, 2005, in connection with wind projects in development, EME has entered into agreements with two turbine vendors securing 105 turbines. In addition, EME has options to acquire an additional 100 turbines for deliveries in 2007. See “MEHC: Liquidity—EME’s Liquidity—Business Development Plans” for further discussion. Other Commitments SCE has an unconditional purchase obligation for firm transmission service from another utility. Minimum payments are based, in part, on the debt-service requirements of the transmission service provider, whether or not the transmission line is operable. The contract requires minimum payments of $62 million through 2016 (approximately $6 million per year). At December 31, 2005, Midwest Generation was party to a long-term power purchase contract with Calumet Energy Team LLC entered into as part of the settlement agreement with Commonwealth Edison, which terminated Midwest Generation’s obligation to build additional gas-fired generation in the Chicago area. The contract requires Midwest Generation to pay a monthly capacity payment and gives Midwest Generation an option to purchase energy from Calumet Energy Team at prices based primarily on operations and maintenance and fuel costs (estimated to be $4 million for each of the next five years).

70
____________________________________________________________________________________ Management’s Discussion and Analysis of Financial Condition and Results of Operations
Commercial Commitments As of December 31, 2005, EME and its subsidiaries had standby letters of credit aggregated to $33 million and were scheduled to expire as follows: 2006⎯$28 million and 2007⎯$5 million. Guarantees and Indemnities Edison International’s subsidiaries have various financial and performance guarantees and indemnifications which are issued in the normal course of business. As discussed below, these contracts include performance guarantees, guarantees of debt and indemnifications. Tax Indemnity Agreements In connection with the sale-leaseback transactions that EME has entered into related to the Powerton and Joliet Stations in Illinois, the Collins Station in Illinois, and the Homer City facilities in Pennsylvania, EME and several of its subsidiaries entered into tax indemnity agreements. Under these tax indemnity agreements, these entities agreed to indemnify the lessors in the sale-leaseback transactions for specified adverse tax consequences that could result in certain situations set forth in each tax indemnity agreement, including specified defaults under the respective leases. The potential indemnity obligations under these tax indemnity agreements could be significant. Due to the nature of these potential obligations, EME cannot determine a maximum potential liability which would be triggered by a valid claim from the lessors. EME has not recorded a liability related to these indemnities. In connection with the termination of the Collins Station lease in April 2004, Midwest Generation will continue to have obligations under the tax indemnity agreement with the former lease equity investor. Indemnities Provided as Part of the Acquisition of the Illinois Plants In connection with the acquisition of the Illinois plants, EME agreed to indemnify Commonwealth Edison with respect to specified environmental liabilities before and after December 15, 1999, the date of sale. The indemnification claims are reduced by any insurance proceeds and tax benefits related to such claims and are subject to a requirement that Commonwealth Edison takes all reasonable steps to mitigate losses related to any such indemnification claim. Due to the nature of the obligation under this indemnity, a maximum potential liability cannot be determined. This indemnification for environmental liabilities is not limited in term and would be triggered by a valid claim from Commonwealth Edison. Except as discussed below, EME has not recorded a liability related to this indemnity. Midwest Generation entered into a supplemental agreement with Commonwealth Edison and Exelon Generation Company on February 20, 2003 to resolve a dispute regarding interpretation of its reimbursement obligation for asbestos claims under the environmental indemnities set forth in the Asset Sale Agreement. Under this supplemental agreement, Midwest Generation agreed to reimburse Commonwealth Edison and Exelon Generation for 50% of specific existing asbestos claims and expenses less recovery of insurance costs, and agreed to a sharing arrangement for liabilities and expenses associated with future asbestos-related claims as specified in the agreement. As a general matter, Commonwealth Edison and Midwest Generation apportion responsibility for future asbestos-related claims based upon the number of exposure sites that are Commonwealth Edison locations or Midwest Generation locations. The obligations under this agreement are not subject to a maximum liability. The supplemental agreement has a five-year term with an automatic renewal provision (subject to the right of either party to terminate). Payments are made under this indemnity upon tender by Commonwealth Edison of appropriate proof of liability for an asbestos-related settlement, judgment, verdict, or expense. There were between 185 and 195 cases for which Midwest Generation was potentially liable and that had not been settled and dismissed at December 31, 2005. Midwest Generation had recorded a $67 million liability at December 31, 2005 related to this matter.

71
____________________________________________________________________________________ Edison International
The amounts recorded by Midwest Generation for the asbestos-related liability are based upon a number of assumptions. Future events, such as the number of new claims to be filed each year, the average cost of disposing of claims, as well as the numerous uncertainties surrounding asbestos litigation in the United States, could cause the actual costs to be higher or lower than projected. Indemnity Provided as Part of the Acquisition of the Homer City Facilities In connection with the acquisition of the Homer City facilities, EME Homer City agreed to indemnify the sellers with respect to specific environmental liabilities before and after the date of sale. EME guaranteed the obligations of EME Homer City. Due to the nature of the obligation under this indemnity provision, it is not subject to a maximum potential liability and does not have an expiration date. Payments would be triggered under this indemnity by a claim from the sellers. EME has not recorded a liability related to this indemnity. Indemnities Provided under Asset Sale Agreements The asset sale agreements for the sale of EME’s international assets contain indemnities from EME to the purchasers, including indemnification for taxes imposed with respect to operations of the assets prior to the sale and for pre-closing environmental liabilities. EME also provided an indemnity to IPM for matters arising out of the exercise by one of its project partners of a purported right of first refusal. The right of first refusal matter has been submitted to arbitration, with hearings having been conducted during February 2006. It is expected that a decision of the arbitration panel will be rendered in the coming months. Not all indemnities under the asset sale agreements have specific expiration dates. Payments would be triggered under these indemnities by valid claims from the sellers or purchasers, as the case may be. At December 31, 2005, EME had recorded a liability of $122 million related to these matters. In connection with the sale of various domestic assets, EME has from time to time provided indemnities to the purchasers for taxes imposed with respect to operations of the asset prior to the sale. EME has also provided indemnities to purchasers for items specified in each agreement (for example, specific pre-existing litigation matters and/or environmental conditions). Due to the nature of the obligations under these indemnity agreements, a maximum potential liability cannot be determined. Not all indemnities under the asset sale agreements have specific expiration dates. Payments would be triggered under these indemnities by valid claims from the sellers or purchasers, as the case may be. EME has not recorded a liability related to these indemnities. Capacity Indemnification Agreements EME has guaranteed, jointly and severally with Texaco Inc., the obligations of March Point Cogeneration Company under its project power sales agreements to repay capacity payments to the project’s power purchaser in the event that the power sales agreements terminate, March Point Cogeneration Company abandons the project, or the project fails to return to normal operations within a reasonable time after a complete or partial shutdown, during the term of the power sales agreements. In addition, a subsidiary of EME has guaranteed the obligations of Sycamore Cogeneration Company under its project power sales agreement to repay capacity payments to the project’s power purchaser in the event that the project unilaterally terminates its performance or reduces its electric power producing capability during the term of the power sales agreement. The obligations under the indemnification agreements as of December 31, 2005, if payment were required, would be $124 million. EME has not recorded a liability related to these indemnities.

72
____________________________________________________________________________________ Management’s Discussion and Analysis of Financial Condition and Results of Operations Indemnity Provided as Part of the Acquisition of Mountainview In connection with the acquisition of Mountainview, SCE agreed to indemnify the seller with respect to specific environmental claims related to SCE’s previously owned San Bernardino Generating Station, divested by SCE in 1998 and reacquired as part of the Mountainview acquisition. The generating station has not operated since early 2001, and SCE retained certain responsibilities with respect to environmental claims as part of the original divestiture of the station. The aggregate liability for either party to the purchase agreement for damages and other amounts is a maximum of $60 million. This indemnification for environmental liabilities expires on or before March 12, 2033. SCE has not recorded a liability related to this indemnity. Other SCE Indemnities SCE provides other indemnifications through contracts entered into in the normal course of business. These are primarily indemnifications against adverse litigation outcomes in connection with underwriting agreements, and specified environmental indemnities and income taxes with respect to assets sold. SCE’s obligations under these agreements may be limited in terms of time and/or amount, and in some instances SCE may have recourse against third parties for certain indemnities. The obligated amounts of these indemnifications often are not explicitly stated, and the overall maximum amount of the obligation under these indemnifications cannot be reasonably estimated. SCE has not recorded a liability related to these indemnities. OFF-BALANCE SHEET TRANSACTIONS This section of the MD&A discusses off-balance sheet transactions at EME and Edison Capital. SCE does not have off-balance sheet transactions. Included are discussions of investments accounted for under the equity method for both subsidiaries, as well as sale-leaseback transactions at EME, EME’s obligations to one of its subsidiaries, and leveraged leases at Edison Capital. EME’s Off-Balance Sheet Transactions EME has off-balance sheet transactions in two principal areas: investments in projects accounted for under the equity method and operating leases resulting from sale-leaseback transactions.
Investments Accounted for under the Equity Method EME has a number of investments in power projects that are accounted for under the equity method. Under the equity method, the project assets and related liabilities are not consolidated in EME’s consolidated balance sheet. Rather, EME’s financial statements reflect its investment in each entity and it records only its proportionate ownership share of net income or loss. These investments are of three principal categories.
Historically, EME has invested in QFs, those which produce electrical energy and steam, or other forms of energy, and which meet the requirements set forth in the Public Utility Regulatory Policies Act. Prior to the passage of the Energy Policy Act of 2005, these regulations limited EME’s ownership interest in QFs to no more than 50% due to EME’s affiliation with SCE, a public utility. For this reason, EME owns a number of domestic energy projects through partnerships in which it has a 50% or less ownership interest.
Entities formed to own these projects are generally structured with a management committee or board of directors in which EME exercises significant influence but cannot exercise unilateral control over the operating, funding or construction activities of the project entity. EME’s energy projects have generally

73
____________________________________________________________________________________ Edison International
secured long-term debt to finance the assets constructed and/or acquired by them. These financings generally are secured by a pledge of the assets of the project entity, but do not provide for any recourse to EME. Accordingly, a default on a long-term financing of a project could result in foreclosure on the assets of the project entity resulting in a loss of some or all of EME’s project investment, but would generally not require EME to contribute additional capital. At December 31, 2005, entities which EME has accounted for under the equity method had indebtedness of $601 million, of which $287 million is proportionate to EME’s ownership interest in these projects.
Sale-Leaseback Transactions EME has entered into sale-leaseback transactions related to the Powerton and Joliet Stations in Illinois and the Homer City facilities in Pennsylvania. See “Commitments, Guarantees and Indemnities—Leases—Operating Lease Obligations.” Each of these transactions was completed and accounted for according to an accounting standard, which requires, among other things, that all the risk and rewards of ownership of assets be transferred to a new owner without continuing involvement in the assets by the former owner other than as normal for a lessee. These transactions were entered into to provide a source of capital either to fund the original acquisition of the assets or to repay indebtedness previously incurred for the acquisition. In each of these transactions, the assets were sold to and then leased from owner/lessors owned by independent equity investors. In addition to the equity invested in them, these owner/lessors incurred or assumed long-term debt, referred to as lessor debt, to finance the purchase of the assets. The lessor debt takes the form generally referred to as secured lease obligation bonds.
EME’s subsidiaries account for these leases as financings in their separate financial statements due to specific guarantees provided by EME or another one of its subsidiaries as part of the sale-leaseback transactions. These guarantees do not preclude EME from recording these transactions as operating leases in its consolidated financial statements, but constitute continuing involvement under the accounting standard that precludes EME’s subsidiaries from utilizing this accounting treatment in their separate subsidiary financial statements. Instead, each subsidiary continues to record the power plants as assets in a similar manner to a capital lease and records the obligations under the leases as lease financings. EME’s subsidiaries, therefore, record depreciation expense from the power plants and interest expense from the lease financing in lieu of an operating lease expense which EME uses in preparing its consolidated financial statements. The treatment of these leases as an operating lease in its consolidated financial statements in lieu of a lease financing, which is recorded by EME’s subsidiaries, resulted in an increase in consolidated net income by $72 million, $73 million and $81 million in 2005, 2004 and 2003, respectively.

74
____________________________________________________________________________________ Management’s Discussion and Analysis of Financial Condition and Results of Operations
The lessor equity and lessor debt associated with the sale-leaseback transactions for the Powerton, Joliet and Homer City assets are summarized in the following table:
In millions Acquisition
Price Equity
Investor
Original Equity
Investment in Owner/Lessor
Amount of Lessor Debt at
December 31, 2005
Maturity Date of Lessor Debt
Power Station(s) Powerton/ Joliet
$1,367 PSEG/ Citigroup, Inc.
$ 238 $ 333.5 Series A 2009
$ 769.7 Series B 2016
Homer City $1,591
GECC/ Metropolitan Life Insurance Company(1) $ 798 $ 282.0 Series A 2019
$ 524.3 Series B 2026
___________ PSEG - PSEG Resources, Inc. GECC - General Electric Capital Corporation (1) On September 29, 2005, GECC sold 10% of its investment to Metropolitan Life Insurance Company.
The operating lease payments to be made by each of EME’s subsidiary lessees are structured to service the lessor debt and provide a return to the owner/lessor’s equity investors. Neither the value of the leased assets nor the lessor debt is reflected in Edison International’s consolidated balance sheet. In accordance with generally accepted accounting principles, EME records rent expense on a levelized basis over the terms of the respective leases. To the extent that EME’s cash rent payments exceed the amount levelized over the term of each lease, EME records prepaid rent. At December 31, 2005 and 2004, prepaid rent on these leases was $395 million and $277 million, respectively. To the extent that EME’s cash rent payments are less than the amount levelized, EME reduces the amount of prepaid rent.
In the event of a default under the leases, each lessor can exercise all its rights under the applicable lease, including repossessing the power plant and seeking monetary damages. Each lease sets forth a termination value payable upon termination for default and in certain other circumstances, which generally declines over time and in the case of default may be reduced by the proceeds arising from the sale of the repossessed power plant. A default under the terms of the Powerton and Joliet or Homer City leases could result in a loss of EME’s ability to use such power plant and would trigger obligations under EME’s guarantee of the Powerton and Joliet leases. These events could have a material adverse effect on EME’s results of operations and financial position.
EME’s minimum lease obligations under its power related leases are set forth under “Commitments, Guarantees and Indemnities—Leases—Operating Lease Obligations.”
EME’s Obligations to Midwest Generation The proceeds, in the aggregate amount of approximately $1.4 billion, received by Midwest Generation from the sale of the Powerton and Joliet plants, described above under “—Sale-Leaseback Transactions,” were loaned to EME. EME used the proceeds from this loan to repay corporate indebtedness. Although interest and principal payments made by EME to Midwest Generation under this intercompany loan assist in the payment of the lease rental payments owing by Midwest Generation, the intercompany obligation does not appear on Edison International’s consolidated balance sheet. This obligation was

75
____________________________________________________________________________________ Edison International
disclosed to the credit rating agencies at the time of the transaction and has been included by them in assessing EME’s credit ratings. The following table summarizes principal payments due under this intercompany loan:
In millions Years Ending December 31, Principal Amount
Interest Amount Total
2006 $ 3 $ 113 $ 116 2007 3 113 116 2008 4 112 116 2009 4 112 116 2010 5 112 117 Thereafter 1,343 512 1,855
Total $ 1,362 $ 1,074 $ 2,436
EME funds the interest and principal payments due under this intercompany loan from distributions from EME’s subsidiaries, including Midwest Generation, cash on hand, and amounts available under corporate lines of credit. A default by EME in the payment of this intercompany loan could result in a shortfall of cash available for Midwest Generation to meet its lease and debt obligations. A default by Midwest Generation in meeting its obligations could in turn have a material adverse effect on EME.
Edison Capital’s Off-Balance Sheet Transactions Edison Capital has entered into off-balance sheet transactions for investments in projects, which, in accordance with generally accepted accounting principles, do not appear on Edison International’s balance sheet. Investments Accounted for under the Equity Method Partnership investments, in which Edison Capital does not have operational control or significant voting rights, are accounted for under the equity method as required by accounting standards. As such, the project assets and liabilities are not consolidated on the balance sheet; rather, the financial statements reflect the carrying amount of the investment and the proportionate ownership share of net income or loss. Edison Capital has invested in affordable housing projects utilizing partnership or limited liability companies in which Edison Capital is a limited partner or limited liability member. In these entities, Edison Capital usually owns a 99% interest. With a few exceptions, an unrelated general partner or managing member exercises operating control; voting rights of Edison Capital are limited by agreement to certain significant organizational matters. Edison Capital has subsequently sold a majority of these interests to unrelated third party investors through syndication partnerships in which Edison Capital has retained an interest, with one exception, of less than 20%. The debt of those partnerships and limited liability companies is secured by real property and is nonrecourse to Edison Capital, except in limited cases where Edison Capital has guaranteed the debt. At December 31, 2005, Edison Capital had made guarantees to lenders in the amount of $2 million. Edison Capital has also invested in three limited partnership funds which make investments in infrastructure and infrastructure-related projects. Those funds follow special investment company accounting which requires the fund to account for its investments at fair value. Although Edison Capital would not follow special investment company accounting if it held the funds’ investment directly, Edison Capital records its proportionate share of the funds’ results as required by the equity method.

76
____________________________________________________________________________________ Management’s Discussion and Analysis of Financial Condition and Results of Operations At December 31, 2005, entities that Edison Capital has accounted for under the equity method had indebtedness of approximately $1.7 billion, of which approximately $581 million is proportionate to Edison Capital’s ownership interest in these projects. Substantially all of this debt is nonrecourse to Edison Capital. Leveraged Leases Edison Capital is the lessor in various power generation, electric transmission and distribution, transportation and telecommunications leases. The debt in these leveraged leases is nonrecourse to Edison Capital and is not recorded on Edison International’s balance sheet in accordance with the applicable accounting standards. At December 31, 2005, Edison Capital had net investments, before deferred taxes, of $2.5 billion in its leveraged leases, with nonrecourse debt in the amount of $4.8 billion. OTHER DEVELOPMENTS Environmental Matters Edison International is subject to numerous federal and state environmental laws and regulations, which require it to incur substantial costs to operate existing facilities, construct and operate new facilities, and mitigate or remove the effect of past operations on the environment. Edison International believes that it is in substantial compliance with existing environmental regulatory requirements. Edison International’s domestic power plants, in particular its coal-fired plants, may be affected by recent developments in federal and state environmental laws and regulations. These laws and regulations, including those relating to sulfur dioxide (S02) and nitrogen oxide (NOx) emissions, mercury emissions, ozone and fine particulate matter emissions, regional haze, water quality, and climate change, may require significant capital expenditures at its facilities. The developments in certain of these laws and regulations are discussed in more detail below. These developments will continue to be monitored to assess what implications, if any, they will have on the operation of domestic power plants owned or operated by SCE, EME, or their subsidiaries, or the impact on Edison International’s results of operations or financial position. Edison International’s projected environmental capital expenditures over the next three years are: 2006 – $490 million; 2007 – $491 million; and 2008 – $506 million. The projected environmental capital expenditures are mainly for undergrounding certain transmission and distribution lines at SCE and upgrading environmental controls at EME (excluding the $350 million to $400 million estimated cost of the Homer City environmental control technology referred to below). Federal Air Quality Standards In 1998, several environmental groups filed suit against the co-owners of the Mohave plant regarding alleged violations of emissions limits. In order to resolve the lawsuit and accelerate resolution of key environmental issues regarding the plant, the parties entered into a consent decree, which was approved by the Nevada federal district court in December 1999. The consent decree required the installation of certain air pollution control equipment prior to December 31, 2005 if the plant was to operate beyond that date. In addition, operation beyond 2005 required that agreements be reached with the Navajo Nation and the Hopi Tribe (Tribes) regarding post-2005 water and coal supply needs.

77
____________________________________________________________________________________ Edison International
SCE’s share of the costs of complying with the consent decree and taking other actions to allow operation of the Mohave plant beyond 2005 is estimated to be approximately $605 million. Agreement with the Tribes on water and coal supplies for Mohave was not reached by December 31, 2005, and it is not currently known whether such an agreement will be reached. No agreement was reached to amend the terms of the federal court consent decree. As a result, Mohave shutdown operation on December 31, 2005. For the Mohave plant to restart operation, it will be necessary for agreements to be reached with the Navajo Nation and the Hopi Tribe on the water and coal supply issues, and for the terms of the consent decree to be met or modified. See “SCE: Regulatory Matters—Current Regulatory Developments—Mohave Generating Station and Related Proceedings” for further discussion of the Mohave issues.
EMEs’ facilities are subject to the Clean Air Interstate Rule (CAIR), which requires reductions in NOx and SO2 emissions. EME expects that compliance with the CAIR and the regulations and revised state implementation plans developed as a consequence of the CAIR will result in increased capital expenditures and operating expenses. Given the uncertainty of the requirements that will need to be implemented and the options available to meet the NOx and SO2 reductions fleetwide, EME at this time cannot accurately estimate the cost to meet these obligations. EME’s approach to meeting these obligations will consist of a blending of capital expenditure and emission allowance purchases that will be based on an ongoing assessment of the dynamics of its market conditions.
EME’s facilities are subject to the Clean Air Mercury Rule (CAMR), which is intended to reduce emissions of mercury from power plants. If Illinois and Pennsylvania implement the CAMR by adopting a cap-and-trade program for achieving reductions in mercury emissions, EME may have the option to purchase mercury emission allowances, to install pollution control equipment, to otherwise alter its operations to reduce mercury emissions, or to implement some combination thereof. If EME were to implement environmental control technology at its Homer City facilities instead of purchasing allowances to comply with the CAMR and other Clean Air Act requirements, it currently estimates capital expenditures for such improvements to be approximately $350 million to $400 million in the 2006–2010 timeframe. However, because the mercury state implementation plans are not due until the fourth quarter of 2006 and such plans may not adopt the CAMR’s cap-and-trade program, and because EME cannot predict the outcome of a legal challenge to the CAMR and the US EPA’s decision not to regulate mercury emissions pursuant to Section 112 of the federal Clean Air Act, the full impact of this rule currently cannot be assessed. Additional capital costs, particularly for the Illinois coal units, related to the CAMR could be required in the future and they could be material. EME’s approach to meeting these obligations will continue to be based upon an ongoing assessment of applicable legal requirements and market conditions.
State Air Quality Standards
Beginning with the 2003 ozone season (May 1 through September 30), EME has been required to comply with an average NOx emission rate of 0.25 lb NOx/mmBtu of heat input. Each of EME’s Illinois plants complied with this standard in 2004. Beginning with the 2004 ozone season, the Illinois plants became subject to the federally mandated “NOx SIP Call” regulation that provided ozone-season NOx emission allowances to a 19-state region east of the Mississippi. This program provides for NOx allowance trading similar to the SO2 (acid rain) trading program already in effect.
During 2004, the Illinois plants stayed within their NOx allocations by augmenting their allocation with early reduction credits generated within the fleet. In 2005, the Illinois plants used banked allowances, along with some purchased allowances, to stay within their NOx allocations. After 2005, EME plans to continue to purchase allowances while evaluating the costs and benefits of various technologies to determine whether any additional pollution controls should be installed at the Illinois facilities.
On January 5, 2006, Illinois Governor Rod Blagojevich announced that he was directing the Illinois Environmental Protection Agency to draft rules that would impose state limits on mercury emissions

78
____________________________________________________________________________________ Management’s Discussion and Analysis of Financial Condition and Results of Operations from coal-fired power plants which would be more stringent than the US EPA’s CAMR issued in May 2005. Illinois is required to submit a state implementation plan (SIP) for CAMR to the US EPA by November 17, 2006. The Governor or his spokespersons have said that rules to be submitted to the Illinois Pollution Control Board will require a 90% reduction in mercury emissions averaged across company-owned Illinois generators and a minimum reduction of 75% for individual generating units by June 30, 2009. A 90% reduction at each generating unit would be required by 2013. Buying or selling of emissions allowances under the CAMR federal cap and trade program would be prohibited. The Pollution Control Board must act on proposed rules submitted by the Illinois EPA after evidentiary hearings, including the presentation and cross-examination of expert testimony. After the Pollution Control Board adopts rules, they must be submitted to the General Assembly’s Joint Committee on Administrative Rules for notice, hearing, and adoption, rejection or modification. Rules adopted through such state proceedings are also subject to court appeal. EME is not able at this time to predict the final form of these rules or provide an estimate of their financial impact.
During 2006, the Illinois EPA is expected to begin the process of developing a SIP to implement the federal CAIR which requires reductions in NOx and SO2. This SIP is to be submitted to the US EPA by September 11, 2006. The Illinois EPA has also begun to develop SIPs to meet National Ambient Air Quality Standards for 8-hour ozone and fine particulates. These SIPs will be developed with the intent of bringing non-attainment areas, such as Chicago, into attainment. They are expected to deal with all emission sources, not just power generators, and to address emissions of NOx, SO2, and Volatile Organic Carbon. These SIPs are to be submitted to the US EPA by June 15, 2007 for 8-hour ozone, and by April 5, 2008 for fine particulates. EME is not able at this time to predict the final form of the SIPs or to estimate their financial impact. During 2006, the Pennsylvania Department of Environmental Protection (PADEP) is expected to begin the process of developing a SIP to implement the federal CAIR which requires reductions in NOx and SO2. This SIP is to be submitted to the US EPA by September 11, 2006. The Ozone Transport Commission, of which Pennsylvania is a member, is developing a model rule that would continue to allow SO2 and NOx emissions trading, but would impose more stringent limits on SO2 and NOx emissions and would phase in these reductions more quickly than is required by CAIR. EME does not know whether the northeast states will ultimately agree to this model rule or whether Pennsylvania will implement such a rule. Pennsylvania is also required to develop a SIP to implement the federal CAMR, which SIP is to be submitted to the US EPA by November 17, 2006. With respect to mercury, the PADEP has recently announced that it plans to issue a proposed rule that would require coal-fired power plants to reduce mercury emissions by 80% by 2010 and 90% by 2015. The proposed rule would not allow the use of emissions trading to achieve compliance. However, the proposal would apparently allow facilities to comply with the mercury regulation by installing specific pollution control technology for sulfur dioxide and nitrogen oxides and by burning 100% bituminous coal. EME is not able at this time to predict the final form of the SIPs or to estimate their financial impact. State Water Quality Standards The Illinois EPA is reviewing the water quality standards for the Des Plaines River adjacent to the Joliet Station and immediately downstream of the Will County Station to determine if the use classification should be upgraded. An upgraded use classification could result in more stringent limits being applied to wastewater discharges to the river from these plants. If the existing use classification is changed, the limits on the temperature of the discharges from the Joliet and Will County plants may be made more stringent. The Illinois EPA has also begun a review of the water quality standards for the Chicago River and Chicago Sanitary and Ship Canal which are adjacent to the Fisk and Crawford Stations. Proposed changes to the existing standards are still being developed. Accordingly, EME is not able to estimate the financial impact of potential changes to the water quality standards. However, the cost of additional cooling water treatment, if required, could be substantial.
79
____________________________________________________________________________________ Edison International
The discharge from the treatment plant receiving the wastewater stream from EME’s Unit 3 flue gas desulphurization system at the Homer City facilities has exceeded the stringent, water-quality based limits for selenium in the station’s National Pollutant Discharge Elimination System (NPDES) permit. As a result, EME was notified in April 2002 by PADEP that it was included in the Quarterly Noncompliance Report submitted to the US EPA. EME investigated a number of technical alternatives for maximizing the level of selenium removal in the discharge and performed various pilot studies. While some of the pilot studies improved the performance of the treatment system, the discharge still was not able to consistently meet the selenium effluent limits. EME identified additional options for achieving the selenium limits, and, with PADEP’s approval, has undertaken a pilot program utilizing biological treatment. EME prepared a draft of a consent order and agreement addressing the selenium issue and presented it to PADEP for consideration in connection with the renewal of the station’s NPDES permit. PADEP has included civil penalties in consent agreements related to other facilities with selenium treatment issues, but the amount of civil penalties that may be assessed against EME cannot be estimated at this time. Climate Change On December 20, 2005, seven northeastern states entered into a Memorandum of Understanding to create a regional initiative to establish a cap and trade greenhouse gas program for electric generators, referred to as the Regional Greenhouse Gas Initiative, or RGGI. The model RGGI rule is scheduled to be announced within the next few months. The current proposal is to commence the program in 2009 by setting a cap (for the 2009 to 2015 period) on allowances based on carbon dioxide emissions from 2000 to 2004 and reducing emissions by 10% between 2015 and 2020. The Memorandum of Understanding provides that at least 25% of the state allowance allocations be set aside for public purposes, suggesting that from the commencement of the program, generators subject to the RGGI may receive allowances that are materially less than their carbon dioxide emissions. Illinois and Pennsylvania are not signatories to the RGGI, although Pennsylvania has participated as an observer of the process. If Pennsylvania were to join the RGGI, this could have a material impact on EME’s Homer City facility.
In California, Governor Schwarzenegger issued an executive order on June 1, 2005, setting forth targets for greenhouse gas reductions. The targets call for a reduction of greenhouse gas emissions to 2000 levels by 2010; a reduction of greenhouse gas emissions to 1990 levels by 2020; and a reduction of greenhouse gas emissions to 80% below 1990 levels by 2050. The CPUC is addressing climate change related issues in various regulatory proceedings. The ultimate outcome of the climate change debate could have a significant economic effect on Edison International. Any legal obligation that would require Edison International to reduce substantially its emissions of carbon dioxide would likely require extensive mitigation efforts and would raise considerable uncertainty about the future viability of fossil fuels, particularly coal, as an energy source for new and existing electric generating facilities. Environmental Remediation Edison International records its environmental remediation liabilities when site assessments and/or remedial actions are probable and a range of reasonably likely cleanup costs can be estimated. Edison International reviews its sites and measures the liability quarterly, by assessing a range of reasonably likely costs for each identified site using currently available information, including existing technology, presently enacted laws and regulations, experience gained at similar sites, and the probable level of involvement and financial condition of other potentially responsible parties. These estimates include costs for site investigations, remediation, operations and maintenance, monitoring and site closure.

80
____________________________________________________________________________________ Management’s Discussion and Analysis of Financial Condition and Results of Operations Unless there is a probable amount, Edison International records the lower end of this reasonably likely range of costs (classified as other long-term liabilities) at undiscounted amounts. Edison International’s recorded estimated minimum liability to remediate its 34 identified sites at SCE (24 sites) and EME (10 sites related to Midwest Generation) is $84 million, $82 million of which is related to SCE. Edison International’s other subsidiaries have no identified remediation sites. The ultimate costs to clean up Edison International’s identified sites may vary from its recorded liability due to numerous uncertainties inherent in the estimation process, such as: the extent and nature of contamination; the scarcity of reliable data for identified sites; the varying costs of alternative cleanup methods; developments resulting from investigatory studies; the possibility of identifying additional sites; and the time periods over which site remediation is expected to occur. Edison International believes that, due to these uncertainties, it is reasonably possible that cleanup costs could exceed its recorded liability by up to $115 million, all of which is related to SCE. The upper limit of this range of costs was estimated using assumptions least favorable to Edison International among a range of reasonably possible outcomes. In addition to its identified sites (sites in which the upper end of the range of costs is at least $1 million), SCE also has 31 immaterial sites whose total liability ranges from $4 million (the recorded minimum liability) to $9 million. The CPUC allows SCE to recover environmental remediation costs at certain sites, representing $30 million of its recorded liability, through an incentive mechanism (SCE may request to include additional sites). Under this mechanism, SCE will recover 90% of cleanup costs through customer rates; shareholders fund the remaining 10%, with the opportunity to recover these costs from insurance carriers and other third parties. SCE has successfully settled insurance claims with all responsible carriers. SCE expects to recover costs incurred at its remaining sites through customer rates. SCE has recorded a regulatory asset of $56 million for its estimated minimum environmental-cleanup costs expected to be recovered through customer rates. Edison International’s identified sites include several sites for which there is a lack of currently available information, including the nature and magnitude of contamination, and the extent, if any, that Edison International may be held responsible for contributing to any costs incurred for remediating these sites. Thus, no reasonable estimate of cleanup costs can be made for these sites. Edison International expects to clean up its identified sites over a period of up to 30 years. Remediation costs in each of the next several years are expected to range from $11 million to $25 million. Recorded costs for 2005 were $13 million. Based on currently available information, Edison International believes it is unlikely that it will incur amounts in excess of the upper limit of the estimated range for its identified sites and, based upon the CPUC’s regulatory treatment of environmental remediation costs incurred at SCE, Edison International believes that costs ultimately recorded will not materially affect its results of operations or financial position. There can be no assurance, however, that future developments, including additional information about existing sites or the identification of new sites, will not require material revisions to such estimates. Federal Income Taxes Edison International has reached a settlement with the IRS on tax issues and pending affirmative claims relating to its 1991–1993 tax years. This settlement, which was signed by Edison International in March 2005 and approved by the United States Congress Joint Committee on Taxation on July 27, 2005, resulted in a third quarter 2005 net earnings benefit for Edison International of approximately $65 million, including interest, most of which relates to SCE. This benefit was reflected in caption “Income tax (benefit)” on the consolidated statements of income.

81
____________________________________________________________________________________ Edison International
Edison International received Revenue Agent Reports from the IRS in August 2002 and in January 2005 asserting deficiencies in federal corporate income taxes with respect to audits of its 1994–1996 and 1997–1999 tax years, respectively. Many of the asserted tax deficiencies are timing differences and, therefore, amounts ultimately paid (exclusive of penalties), if any, would be deductible on future tax returns of Edison International. As part of a nationwide challenge of certain types of lease transactions, the IRS has raised issues about the deferral of income taxes associated with Edison Capital’s cross-border, leveraged leases. The IRS is challenging Edison Capital’s foreign power plant and electric locomotive sale/leaseback transactions entered into in 1993 and 1994 (Replacement Leases, which the IRS refers to as a sale-in/lease-out or SILO). The IRS is also challenging Edison Capital’s foreign power plant and electric transmission system lease/leaseback transactions entered into in 1997 and 1998 (Lease/Leaseback, which the IRS refers to as a lease-in/lease-out or LILO). Edison Capital also entered into a lease/service contract transaction in 1999 involving a foreign telecommunication system (Service Contract, which the IRS also refers to as a SILO). The IRS did not yet assert an adjustment for the Service Contract but is expected to challenge the Service Contract in subsequent audit cycles. The following table summarizes estimated federal and state income taxes deferred from these leases. Repayment of these deferred taxes would be accelerated if the IRS prevails:
In millions
Tax Years Under Appeal 1994 – 1999
Unaudited Tax Years 2000 – 2005
Total
Replacement Leases (SILO) $ 44 $ 36 $ 80 Lease/Leaseback (LILO) 558 570 1,128 Service Contract (SILO) — 272 272 $ 602 $ 878 $ 1,480
Edison International believes it properly reported these transactions based on applicable statutes, regulations and case law in effect at the time the transactions were entered into, and it is vigorously defending its tax treatment of these leases. Written protests were filed to appeal the audit adjustments for the tax years under appeal asserting that the IRS’s position misstates material facts, misapplies the law and is incorrect. This matter is now being considered by the Administrative Appeals branch of the IRS. If Edison International is not successful in its defense of the tax treatment for these lease transactions, the payment of taxes, exclusive of any interest or penalties, would not affect results of operations under current accounting standards; however, the imposition of interest and any penalties at 20% of any tax adjustment sustained by the IRS would have a material impact on earnings. As of December 31, 2005, the interest on the proposed tax adjustments (excluding penalties) is estimated to be $323 million. Moreover, the FASB is currently considering changes to the accounting for leveraged leases which, if adopted, will be applicable to those leases where the tax treatment or the timing of the realization of tax benefits associated with them is altered. Under the proposed accounting rule, a change in the timing of expected cash flows related to these lease, including the realization of the tax benefits, would require the recalculation of the income allocated over the life of the lease, with the cumulative effect of the change recognized immediately. This could result in a material charge against earnings, although future income would be expected to increase over the remaining terms of the affected leases. In addition, the payment of taxes, interest and penalties could have a significant impact on cash flow. In connection with litigation of this matter, Edison International may pay a portion of the taxes plus interest

82
____________________________________________________________________________________ Management’s Discussion and Analysis of Financial Condition and Results of Operations and penalties and then seek a refund that accrues interest to the extent it prevails. At this time, Edison International is unable to predict the impact of the ultimate resolution of these matters. The IRS Revenue Agent Report for the 1997–1999 audit also asserted deficiencies with respect to a transaction entered into by an SCE subsidiary which may be considered substantially similar to a listed transaction described by the IRS as a contingent liability company. While Edison International intends to defend its tax return position with respect to this transaction, the tax benefits relating to the capital loss deductions will not be claimed for financial accounting and reporting purposes until and unless these tax losses are sustained. In April 2004, Edison International filed California Franchise Tax amended returns for tax years 1997 through 2002 to abate the possible imposition of new California penalty provisions on transactions that may be considered as listed or substantially similar to listed transactions described in an IRS notice that was published in 2001. These transactions include certain Edison Capital leveraged lease transactions and the SCE subsidiary contingent liability company transaction described above. Edison International filed these amended returns under protest retaining its appeal rights.

83
____________________________________________________________________________________ Management’s Responsibility for Financial Reporting Edison International The management of Edison International is responsible for the integrity and objectivity of the accompanying financial statements and related information. The statements have been prepared in accordance with accounting principles generally accepted in the United States and are based, in part, on management estimates and judgment. Management believes that the financial statements fairly reflect Edison International’s financial position and results of operations. As a further measure to assure the ongoing objectivity and integrity of financial information, the Audit Committee of the Board of Directors, which is composed of outside directors, meets periodically, both jointly and separately, with management, the independent auditors and internal auditors, who have unrestricted access to the committee. The Committee annually appoints a firm of independent auditors to conduct an audit of Edison International’s financial statements and internal control over financial reporting; reviews accounting, internal control, auditing and financial reporting issues; and is advised of management’s actions regarding financial reporting and internal control matters. Edison International and its subsidiaries maintain high standards in selecting, training and developing personnel to assure that its operations are conducted in conformity with applicable laws and are committed to maintaining the highest standards of personal and corporate conduct. Management maintains programs to encourage and assess compliance with these standards. Edison International’s independent registered public accounting firm, PricewaterhouseCoopers LLP, are engaged to audit the financial statements included in this Annual Report in accordance with the standards of the Public Company Accounting Oversight Board (United States) and to express an opinion on whether those consolidated financial statements fairly present, in all material respects, Edison International’s results of operations, cash flows and financial position. Management’s Report on Internal Control over Financial Reporting Edison International’s management is responsible for establishing and maintaining adequate internal control over financial reporting (as that term is defined in Rule 13a-15(f) under the Exchange Act). Under the supervision and with the participation of its Chief Executive Officer and Chief Financial Officer, Edison International’s management conducted an evaluation of the effectiveness of internal control over financial reporting based on the framework set forth in Internal Control – Integrated Framework issued by the Committee of Sponsoring Organizations of the Treadway Commission (COSO). Based on its evaluation under the COSO framework, Edison International’s management concluded that internal control over financial reporting was effective as of December 31, 2005. Management’s assessment of the effectiveness of Edison International’s internal control over financial reporting as of December 31, 2005 has been audited by PricewaterhouseCoopers LLP, an independent registered public accounting firm, as stated in their report on the financial statements in Edison International’s 2005 Annual Report to shareholders, which is incorporated herein by this reference. Disclosure Controls and Procedures The certifications of the Chief Executive Officer and Chief Financial Officer that are required by Section 302 of the Sarbanes-Oxley Act of 2002 are included as exhibits to Edison International’s annual report on Form 10-K. In addition, in 2005, Edison International’s Chief Executive Officer provided to the New York Stock Exchange (NYSE) the Annual CEO Certification regarding Edison International’s compliance with the NYSE’s corporate governance standards.

84
____________________________________________________________________________________ Report of Independent Registered Public Accounting Firm To the Board of Directors and Shareholders of Edison International We have completed integrated audits of Edison International’s 2005 and 2004 consolidated financial statements and of its internal control over financial reporting as of December 31, 2005, and an audit of its 2003 consolidated financial statements in accordance with the standards of the Public Company Accounting Oversight Board (United States). Our opinions, based on our audits, are presented below. Consolidated financial statements In our opinion, the accompanying consolidated balance sheets and the related consolidated statements of income, comprehensive income, cash flows and common shareholders’ equity present fairly, in all material respects, the financial position of Edison International and its subsidiaries at December 31, 2005 and 2004, and the results of their operations and their cash flows for each of the three years in the period ended December 31, 2005 in conformity with accounting principles generally accepted in the United States of America. These financial statements are the responsibility of the Company’s management. Our responsibility is to express an opinion on these financial statements based on our audits. We conducted our audits of these statements in accordance with the standards of the Public Company Accounting Oversight Board (United States). Those standards require that we plan and perform the audit to obtain reasonable assurance about whether the financial statements are free of material misstatement. An audit of financial statements includes examining, on a test basis, evidence supporting the amounts and disclosures in the financial statements, assessing the accounting principles used and significant estimates made by management, and evaluating the overall financial statement presentation. We believe that our audits provide a reasonable basis for our opinion. As discussed in Note 1 to the consolidated financial statements, Edison International changed the manner in which it accounts for asset retirement costs as of January 1, 2003 and December 31, 2005, financial instruments with characteristics of both debt and equity as of July 1, 2003, and variable interest entities as of December 31, 2003 and March 31, 2004. Internal control over financial reporting Also, in our opinion, management’s assessment, included in the accompanying Management’s Report on Internal Control Over Financial Reporting, that the Company maintained effective internal control over financial reporting as of December 31, 2005 based on criteria established in Internal Control – Integrated Framework issued by the Committee of Sponsoring Organizations of the Treadway Commission (COSO), is fairly stated, in all material respects, based on those criteria. Furthermore, in our opinion, the Company maintained, in all material respects, effective internal control over financial reporting as of December 31, 2005, based on criteria established in Internal Control – Integrated Framework issued by the COSO. The Company’s management is responsible for maintaining effective internal control over financial reporting and for its assessment of the effectiveness of internal control over financial reporting. Our responsibility is to express opinions on management’s assessment and on the effectiveness of the Company’s internal control over financial reporting based on our audit. We conducted our audit of internal control over financial reporting in accordance with the standards of the Public Company Accounting Oversight Board (United States). Those standards require that we plan and perform the audit to obtain reasonable assurance about whether effective internal control over financial reporting was maintained in all material respects. An audit of internal control over financial reporting includes obtaining an understanding of internal control over financial reporting, evaluating management’s assessment, testing and evaluating the design and operating effectiveness of internal

85
____________________________________________________________________________________Edison International
control, and performing such other procedures as we consider necessary in the circumstances. We believe that our audit provides a reasonable basis for our opinions. A company’s internal control over financial reporting is a process designed to provide reasonable assurance regarding the reliability of financial reporting and the preparation of financial statements for external purposes in accordance with generally accepted accounting principles. A company’s internal control over financial reporting includes those policies and procedures that (i) pertain to the maintenance of records that, in reasonable detail, accurately and fairly reflect the transactions and dispositions of the assets of the company; (ii) provide reasonable assurance that transactions are recorded as necessary to permit preparation of financial statements in accordance with generally accepted accounting principles, and that receipts and expenditures of the company are being made only in accordance with authorizations of management and directors of the company; and (iii) provide reasonable assurance regarding prevention or timely detection of unauthorized acquisition, use, or disposition of the company’s assets that could have a material effect on the financial statements. Because of its inherent limitations, internal control over financial reporting may not prevent or detect misstatements. Also, projections of any evaluation of effectiveness to future periods are subject to the risk that controls may become inadequate because of changes in conditions, or that the degree of compliance with the policies or procedures may deteriorate. PricewaterhouseCoopers LLP Los Angeles, California March 6, 2006

86
Consolidated Statements of Income Edison International In millions, except per-share amounts Year ended December 31, 2005 2004 2003
Electric utility $ 9,500 $ 8,448 $ 8,853 Nonutility power generation 2,248 1,639 1,778 Financial services and other 104 112 101
Total operating revenue 11,852 10,199 10,732
Fuel 1,810 1,429 905 Purchased power 2,622 2,332 2,786 Provisions for regulatory adjustment clauses – net 435 (201) 1,138 Other operation and maintenance 3,406 3,342 2,910 Asset impairment and loss on lease termination 12 989 304 Depreciation, decommissioning and amortization 1,061 1,022 1,047 Property and other taxes 203 186 192 Net gain on sale of utility property and plant (10) — (5)
Total operating expenses 9,539 9,099 9,277
Operating income 2,313 1,100 1,455 Interest and dividend income 112 46 118 Equity in income from partnerships and unconsolidated subsidiaries – net 136 66 231 Other nonoperating income 136 135 86 Interest expense – net of amounts capitalized (794) (985) (1,020) Impairment loss on equity method investment (55) — — Other nonoperating deductions (67) (80) (32) Loss on early extinguishment of debt (25) — — Dividends on preferred securities subject to mandatory redemption — — (52)
Income from continuing operations before tax and minority interest 1,756 282 786 Income tax (benefit) 457 (92) 124 Dividends on utility preferred and preference stock not subject to mandatory redemption 24 6 5 Minority interest 167 142 2
Income from continuing operations 1,108 226 655 Income from discontinued operations (including gain on disposal of $533 in 2004 and $44 in 2003) – net of tax 30 690 175
Income before accounting change 1,138 916 830 Cumulative effect of accounting change – net of tax (1) — (9)
Net income $ 1,137 $ 916 $ 821
Weighted-average shares of common stock outstanding 326 326 326 Basic earnings (loss) per share: Continuing operations $ 3.38 $ 0.69 $ 2.01 Discontinued operations 0.09 2.12 0.54 Cumulative effect of accounting change — — (0.03)
Total $ 3.47 $ 2.81 $ 2.52
Weighted-average shares, including effect of dilutive securities 332 331 329 Diluted earnings (loss) per share: Continuing operations $ 3.34 $ 0.68 $ 1.99 Discontinued operations 0.09 2.09 0.54 Cumulative effect of accounting change — — (0.03)
Total $ 3.43 $ 2.77 $ 2.50
Dividends declared per common share $ 1.02 $ 0.85 $ 0.20
The accompanying notes are an integral part of these financial statements.
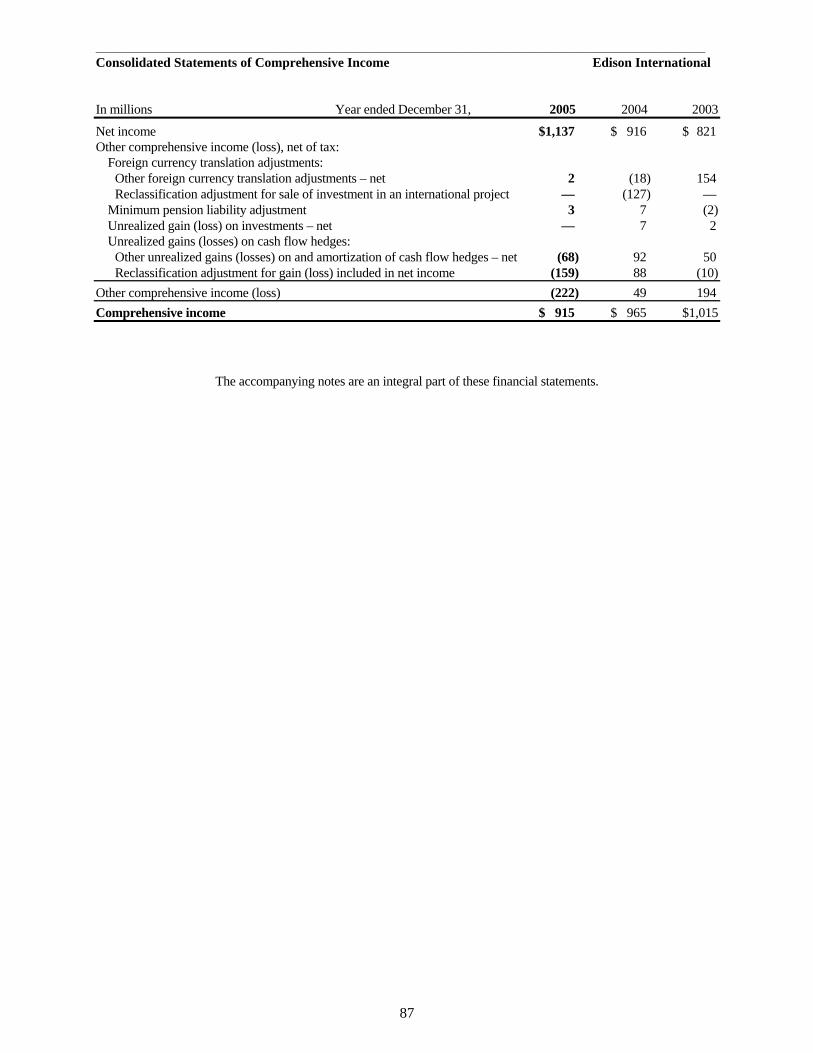
87
__________________________________________________________________________________________________________________ Consolidated Statements of Comprehensive Income Edison International In millions Year ended December 31, 2005 2004 2003
Net income $1,137 $ 916 $ 821 Other comprehensive income (loss), net of tax: Foreign currency translation adjustments: Other foreign currency translation adjustments – net 2 (18) 154 Reclassification adjustment for sale of investment in an international project — (127) — Minimum pension liability adjustment 3 7 (2) Unrealized gain (loss) on investments – net — 7 2 Unrealized gains (losses) on cash flow hedges: Other unrealized gains (losses) on and amortization of cash flow hedges – net (68) 92 50 Reclassification adjustment for gain (loss) included in net income (159) 88 (10)
Other comprehensive income (loss) (222) 49 194
Comprehensive income $ 915 $ 965 $1,015
The accompanying notes are an integral part of these financial statements.
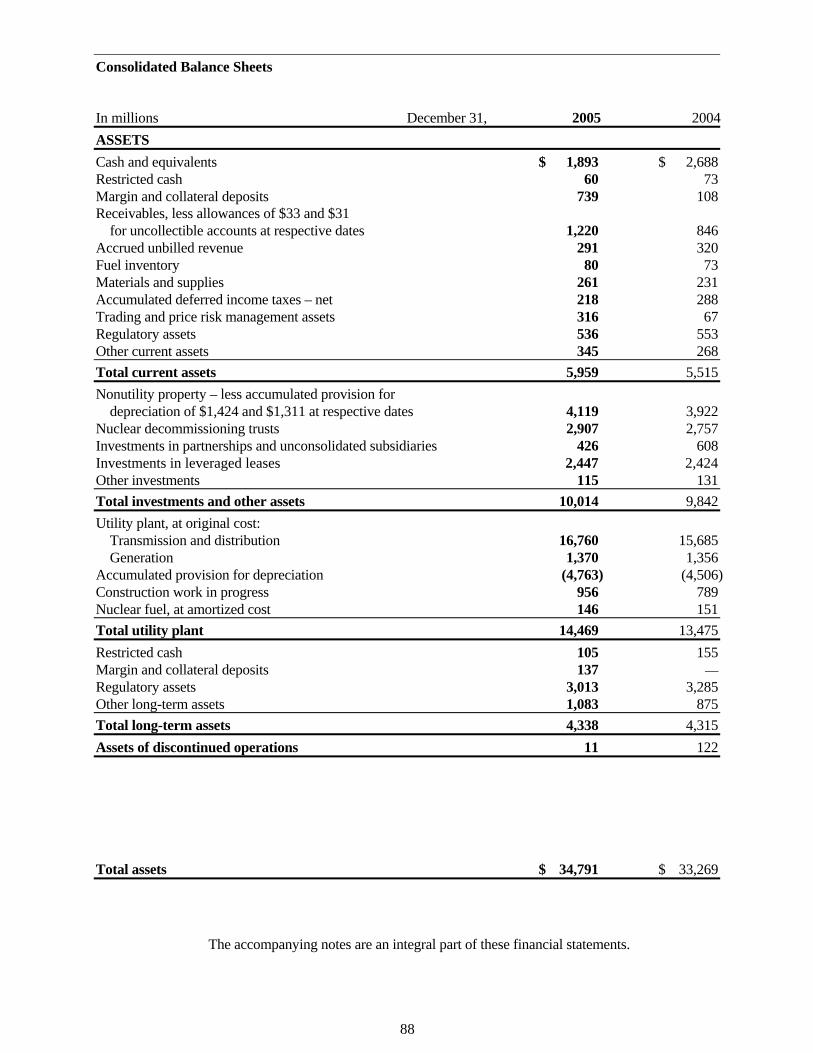
88
Consolidated Balance Sheets In millions December 31, 2005 2004
ASSETS
Cash and equivalents $ 1,893 $ 2,688 Restricted cash 60 73 Margin and collateral deposits 739 108 Receivables, less allowances of $33 and $31 for uncollectible accounts at respective dates 1,220 846 Accrued unbilled revenue 291 320 Fuel inventory 80 73 Materials and supplies 261 231 Accumulated deferred income taxes – net 218 288 Trading and price risk management assets 316 67 Regulatory assets 536 553 Other current assets 345 268
Total current assets 5,959 5,515
Nonutility property – less accumulated provision for depreciation of $1,424 and $1,311 at respective dates 4,119 3,922 Nuclear decommissioning trusts 2,907 2,757 Investments in partnerships and unconsolidated subsidiaries 426 608 Investments in leveraged leases 2,447 2,424 Other investments 115 131
Total investments and other assets 10,014 9,842
Utility plant, at original cost: Transmission and distribution 16,760 15,685 Generation 1,370 1,356 Accumulated provision for depreciation (4,763) (4,506) Construction work in progress 956 789 Nuclear fuel, at amortized cost 146 151
Total utility plant 14,469 13,475
Restricted cash 105 155 Margin and collateral deposits 137 — Regulatory assets 3,013 3,285 Other long-term assets 1,083 875
Total long-term assets 4,338 4,315
Assets of discontinued operations 11 122 Total assets $ 34,791 $ 33,269
The accompanying notes are an integral part of these financial statements.

89
Edison International In millions, except share amounts December 31, 2005 2004
LIABILITIES AND SHAREHOLDERS’ EQUITY
Short-term debt $ — $ 88 Long-term debt due within one year 745 809 Preferred stock to be redeemed within one year — 9 Accounts payable 961 749 Accrued taxes 262 226 Accrued interest 212 233 Counterparty collateral 183 — Customer deposits 183 168 Book overdrafts 257 232 Trading and price risk management liabilities 418 31 Regulatory liabilities 681 490 Other current liabilities 1,057 1,002
Total current liabilities 4,959 4,037
Long-term debt 8,833 9,678
Accumulated deferred income taxes – net 5,256 5,233 Accumulated deferred investment tax credits 130 138 Customer advances and other deferred credits 1,179 1,109 Power-purchase contracts 165 130 Preferred stock subject to mandatory redemption — 139 Accumulated provision for pensions and benefits 745 523 Asset retirement obligations 2,628 2,188 Regulatory liabilities 2,962 3,356 Other long-term liabilities 285 232
Total deferred credits and other liabilities 13,350 13,048
Liabilities of discontinued operations 14 15
Total liabilities 27,156 26,778
Commitments and contingencies (Notes 8 and 9)
Minority interest 301 313
Preferred and preference stock of utility not subject to mandatory redemption 719 129
Common stock, no par value (325,811,206 shares outstanding at each date) 2,043 1,975 Accumulated other comprehensive loss (226) (4) Retained earnings 4,798 4,078
Total common shareholders’ equity 6,615 6,049 Total liabilities and shareholders’ equity $ 34,791 $ 33,269
The accompanying notes are an integral part of these financial statements.

90
Consolidated Statements of Cash Flows Edison International
2004 2003
In millions Year ended December 31, 2005 Revised(1) Revised(1)
Cash flows from operating activities: Net income $ 1,137 $ 916 $ 821 Less: income from discontinued operations (30) (690) (175) 0
Income from continuing operations 1,107 226 646
Adjustments to reconcile to net cash provided by operating activities: Cumulative effect of accounting change – net of tax 1 — 9 Depreciation, decommissioning and amortization 1,061 1,022 1,047 Other amortization 107 98 108 Minority interest 167 142 2 Deferred income taxes and investment tax credits 160 557 106 Equity in income from partnerships and unconsolidated subsidiaries (136) (67) (231) Income from leveraged leases (71) (81) (82) Regulatory assets – long-term 387 442 535 Regulatory liabilities – long-term (168) (69) (48) Loss on early extinguishment of debt 25 — — Impairment losses 67 35 304 Levelized rent expense (117) (59) (96) Other assets 33 (35) 128 Other liabilities 143 66 (333) Margin and collateral deposits – net of collateral received (586) (75) 5 Receivables and accrued unbilled revenue (321) 47 (33) Trading and price risk management assets (233) (27) 199 Inventory, prepayments and other current assets (71) 42 (40) Regulatory assets – short-term 17 (254) 13,268 Regulatory liabilities – short-term 192 (169) (12,486) Accrued interest and taxes 36 (273) (211) Accounts payable and other current liabilities 333 (52) (111) Distributions from unconsolidated entities 58 84 375 Operating cash flows from discontinued operations 22 (481) 191
Net cash provided by operating activities 2,213 1,119 3,252
Cash flows from financing activities: Long-term debt issued and issuance costs 1,300 3,508 766 Long-term debt repaid (2,071) (4,331) (2,656) Bonds remarketed – net — 350 — Issuance of preference stock 591 — — Redemption of preferred securities (148) (2) (6) Rate reduction notes repaid (246) (246) (246) Change in book overdrafts 25 43 65 Short-term debt financing – net (88) (112) (17) Shares purchased for stock-based compensation (182) (109) (24) Proceeds from stock option exercises 85 48 5 Dividends to minority shareholders (174) (146) — Dividends paid (326) (261) — Financing cash flows from discontinued operations — (144) 153
Net cash used by financing activities $ (1,234) $ (1,402) $ (1,960) (1) See “Revisions” in Note 1 for further explanation.
The accompanying notes are an integral part of these financial statements.
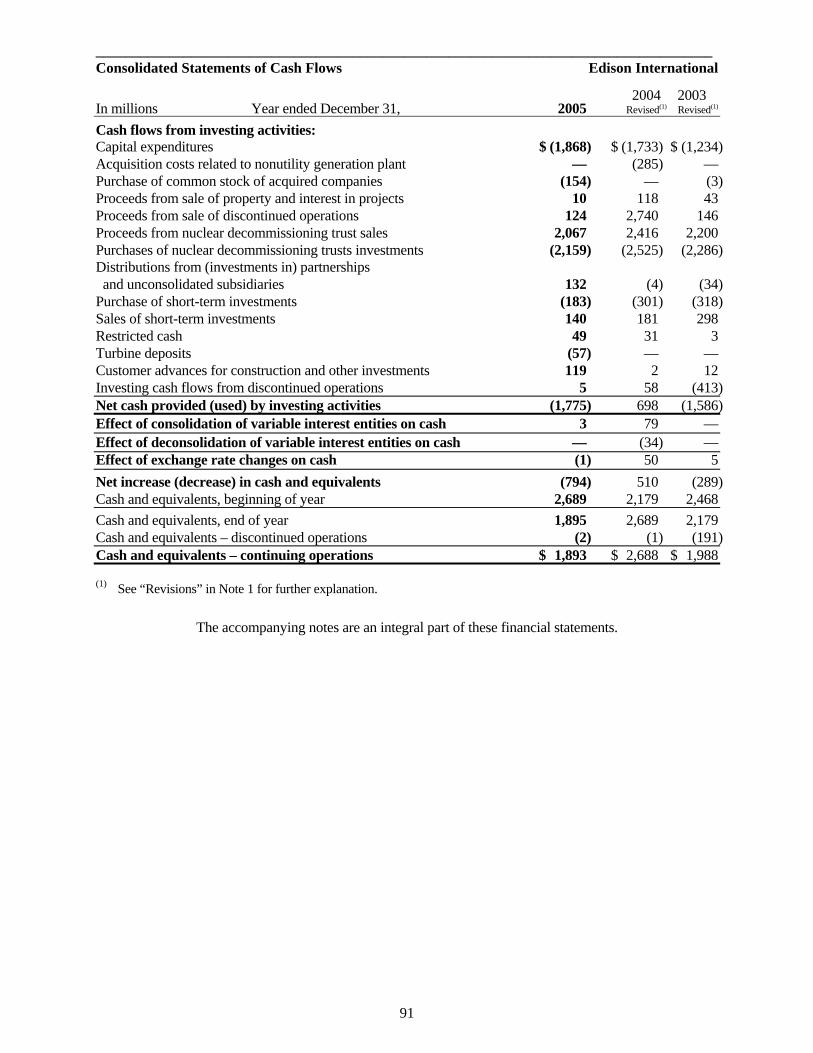
91
____________________________________________________________________________________ Consolidated Statements of Cash Flows Edison International 2004 2003 In millions Year ended December 31, 2005 Revised(1) Revised(1)
Cash flows from investing activities: Capital expenditures $ (1,868) $ (1,733) $ (1,234) Acquisition costs related to nonutility generation plant — (285) — Purchase of common stock of acquired companies (154) — (3) Proceeds from sale of property and interest in projects 10 118 43 Proceeds from sale of discontinued operations 124 2,740 146 Proceeds from nuclear decommissioning trust sales 2,067 2,416 2,200 Purchases of nuclear decommissioning trusts investments (2,159) (2,525) (2,286) Distributions from (investments in) partnerships and unconsolidated subsidiaries 132 (4) (34) Purchase of short-term investments (183) (301) (318) Sales of short-term investments 140 181 298 Restricted cash 49 31 3 Turbine deposits (57) — — Customer advances for construction and other investments 119 2 12 Investing cash flows from discontinued operations 5 58 (413)
Net cash provided (used) by investing activities (1,775) 698 (1,586)
Effect of consolidation of variable interest entities on cash 3 79 —
1
Effect of deconsolidation of variable interest entities on cash — (34) —
Effect of exchange rate changes on cash (1) 50 5
Net increase (decrease) in cash and equivalents (794) 510 (289) Cash and equivalents, beginning of year 2,689 2,179 2,468
Cash and equivalents, end of year 1,895 2,689 2,179 Cash and equivalents – discontinued operations (2) (1) (191)
Cash and equivalents – continuing operations $ 1,893 $ 2,688 $ 1,988
(1) See “Revisions” in Note 1 for further explanation.
The accompanying notes are an integral part of these financial statements.

92
Consolidated Statements of Changes in Common Shareholders’ Equity Edison International Accumulated Total Other Common Common Comprehensive Retained Shareholders’ In millions Stock Income (Loss) Earnings Equity
Balance at December 31, 2002 $ 1,973 $ (247) $ 2,711 $ 4,437
Net income 821 821 Foreign currency translation adjustments 159 159 Tax effect (5) (5) Minimum pension liability adjustment (3) (3) Tax effect 1 1 Unrealized gain on investment 3 3 Tax effect (1) (1) Other unrealized gain on cash flow hedges 54 54 Tax effect (4) (4) Reclassification adjustment for loss on Derivatives included in net income (9) (9) Tax effect (1) (1) Common stock dividend declared ($0.80 per share) (65) (65) Shares purchased for stock-based compensation (18) (6) (24) Proceeds from stock option exercises 5 5 Non-cash stock-based compensation 14 14 Capital stock expense and other 1 1
Balance at December 31, 2003 $ 1,970 $ (53) $ 3,466 $ 5,383
Net income 916 916 Foreign currency translation adjustments (14) (14) Tax effect (4) (4) Reclassification adjustment for sale of investment in foreign subsidiary (127) (127) Minimum pension liability adjustment 6 6 Tax effect 1 1 Unrealized gain on investment 11 11 Tax effect (4) (4) Other unrealized gain on cash flow hedges 98 98 Tax effect (6) (6) Reclassification adjustment for loss on derivatives included in net income 152 152 Tax effect (64) (64) Common stock dividend declared ($0.85 per share) (277) (277) Shares purchased for stock-based compensation (34) (75) (109) Proceeds from stock option exercises 48 48 Non-cash stock-based compensation 39 39
Balance at December 31, 2004 $ 1,975 $ (4) $ 4,078 $ 6,049
The accompanying notes are an integral part of these financial statements.

93
Consolidated Statements of Changes in Common Shareholders’ Equity Edison International Accumulated Total Other Common Common Comprehensive Retained Shareholders’ In millions Stock Income (Loss) Earnings Equity
Balance at December 31, 2004 $ 1,975 $ (4) $ 4,078 $ 6,049
Net income 1,137 1,137 Foreign currency translation adjustments 4 4 Tax effect (2) (2) Minimum pension liability adjustment 6 6 Tax effect (3) (3) Other unrealized gain on cash flow hedges (12) (12) Tax effect (56) (56) Reclassification adjustment for loss on derivatives included in net income (266) (266) Tax effect 107 107 Common stock dividend declared ($1.02 per share) (332) (332) Shares purchased for stock-based compensation (20) (162) (182) Proceeds from stock option exercises 85 85 Non-cash stock-based compensation 35 35 Tax benefit related to stock-based awards 52 52 Capital stock expense and other 1 (8) (7)
Balance at December 31, 2005 $ 2,043 $ (226) $ 4,798 $ 6,615 Authorized common stock is 800 million shares. Outstanding common stock is 325,811,206 shares for all years presented.
The accompanying notes are an integral part of these financial statements.
94
Notes to Consolidated Financial Statements Significant accounting policies are discussed in Note 1, unless discussed in the respective Notes for specific topics. Note 1. Summary of Significant Accounting Policies Edison International’s principal wholly owned subsidiaries include: Southern California Edison Company (SCE), a rate-regulated electric utility that supplies electric energy to a 50,000 square-mile area of central, coastal and southern California; Mission Energy Holding Company (MEHC), a holding company for Edison Mission Energy (EME), which is engaged in the business of developing, acquiring, owning or leasing, operating and selling energy and capacity from independent power production facilities; and Edison Capital, a provider of capital and financial services. Through a subsidiary of EME, MEHC also conducts price risk management and energy trading activities in power markets open to competition. EME has domestic projects and one foreign project in Turkey; Edison Capital has domestic projects and foreign projects, primarily in Europe, Australia and Africa. Basis of Presentation The consolidated financial statements include Edison International and its wholly owned subsidiaries. Edison International’s subsidiaries consolidate their subsidiaries in which they have a controlling interest and variable interest entities (VIEs) in which they are the primary beneficiary. In addition, Edison International’s subsidiaries generally use the equity method to account for significant interests in (1) partnerships and subsidiaries in which they own a significant or less than controlling interest and (2) VIEs in which they are not the primary beneficiary. Intercompany transactions have been eliminated, except EME’s profits from energy sales to SCE, which are allowed in utility rates. SCE’s accounting policies conform to accounting principles generally accepted in the United States, including the accounting principles for rate-regulated enterprises, which reflect the rate-making policies of the California Public Utilities Commission (CPUC) and the Federal Energy Regulatory Commission (FERC). Certain prior-year amounts were reclassified to conform to the December 31, 2005 financial statement presentation. Except as indicated, amounts presented in the Notes to the Consolidated Financial Statements relate to continuing operations. Financial statements prepared in compliance with accounting principles generally accepted in the United States require management to make estimates and assumptions that affect the amounts reported in the financial statements and Notes. Actual results could differ from those estimates. Certain significant estimates related to financial instruments, income taxes, pensions and postretirement benefits other than pensions, decommissioning, and regulatory and other contingencies are further discussed in Notes 2, 5, 6, 8, and 9 to the Consolidated Financial Statements, respectively. Cash Equivalents Cash equivalents include time deposits ($489 million at December 31, 2005 and $203 million at December 31, 2004) and other investments ($1.2 billion at December 31, 2005 and $2.2 billion at December 31, 2004) with original maturities of three months or less. Additionally, cash and equivalents of $120 million at December 31, 2005 and $90 million at December 31, 2004 are included for four projects that Edison International is consolidating under an accounting interpretation for VIEs. For a discussion of restricted cash, see “Restricted Cash.”

95
____________________________________________________________________________________ Edison International Debt and Equity Investments Edison International’s debt and equity investments are composed of nuclear decommissioning trust funds at SCE and short-term investments at EME. Edison International’s investments are classified as available-for-sale at both December 31, 2005 and 2004, except for EME’s short-term investments at December 31, 2005, which are classified as held-to-maturity. EME’s short-term investments are reflected in other current assets on the consolidated balance sheets. A change in the portfolio mix of EME’s short-term investments caused the change in classification from available-for-sale at December 31, 2004 to held-to-maturity at December 31, 2005. Net unrealized gains (losses) on equity investments are recorded as a separate component of shareholders’ equity under the caption “Accumulated other comprehensive income.” Unrealized gains and losses on decommissioning trust funds increase or decrease the related regulatory asset or liability. See Note 8 for further information regarding SCE’s nuclear decommissioning trusts. At December 31, 2005, EME’s short-term investments of $183 million were carried at amortized cost plus accrued interest which approximated their fair value. At December 31, 2005 all held-to-maturity securities mature within one year and consisted of $99 million of commercial paper, $50 million in time deposits and $34 million in certificates of deposit.
At December 31, 2004, EME’s short-term investments of $140 million were carried at fair market value of the securities and consisted of auction rate securities rated AAA or Aaa by S&P or Moody’s, respectively, with interest rate reset dates of less than thirty days. Sales of auction rate securities were $140 million in 2005. Purchases and sales of auction rate securities were $301 million and $181 million in 2004, respectively. Unrealized gains and losses from investments in theses securities were not material. Dividend Restriction The CPUC regulates SCE’s capital structure and limits the dividends it may pay Edison International. SCE’s authorized capital structure includes a common equity component of 48%. SCE determines compliance with this capital structure based on a 13-month weighted-average calculation. At December 31, 2005, SCE’s 13-month weighted-average common equity component of total capitalization was 50%. At December 31, 2005, SCE had the capacity to pay $197 million in additional dividends based on the 13-month weighted-average method. Based on recorded December 31, 2005 balances, SCE’s common equity to total capitalization ratio was 50.2% for rate-making purposes. SCE had the capacity to pay $212 million of additional dividends to Edison International based on December 31, 2005 recorded balances. Earnings (Loss) Per Share (EPS) In March 2004, the Financial Accounting Standards Board (FASB) issued new accounting guidance for the effect of participating securities on EPS calculations and the use of the two-class method. The new guidance, which was effective in second quarter 2004, requires the use of the two-class method of computing EPS for companies with participating securities. The two-class method is an earnings allocations formula that determines EPS for each class of common stock and participating security. Edison International has participating securities (vested stock options that earn dividend equivalents on an equal basis with common shares), but determined that the effect on 2004 EPS was immaterial. Basic EPS is computed by dividing net income available for common stock by the weighted-average number of common shares outstanding. Net income (loss) available for common stock was
96
____________________________________________________________________________________ Notes to Consolidated Financial Statements $1.130 billion, $916 million and $821 million in 2005, 2004 and 2003, respectively. In arriving at net income, dividends on preferred securities and preferred stock have been deducted. For the diluted EPS calculation, dilutive securities (stock-based compensation awards exercisable) are added to the weighted-average shares. However, in periods of net loss, dilutive securities are not added to the weighted-average shares due to their antidilutive effect. Inventory Inventory is stated at the lower of cost or market, cost being determined by the first-in, first-out method for SCE’s fuel, the weighted-average cost method for EME’s fuel, and the average cost method for materials and supplies. Margin and Collateral Deposits Margin and collateral deposits include margin requirements and cash deposited with counterparties and brokers as credit support under energy contracts. The amount of margin and collateral deposits generally varies based on changes in the value of the contracts. Some of these deposits with counterparties and brokers earn interest at various rates. New Accounting Pronouncements In March 2005, the FASB issued an interpretation related to accounting for conditional asset retirement obligations (ARO). This interpretation clarifies that an entity is required to recognize a liability for the fair value of a conditional ARO if the fair value can be reasonably estimated even though uncertainty exists about the timing and/or method of settlement. This interpretation was effective as of December 31, 2005. Edison International identified conditional AROs related to: treated wood poles, hazardous materials such as mercury and polychlorinated biphenyls-containing equipment; and asbestos removal costs at buildings, operating stations and retired units. Since SCE follows accounting principles for rate-regulated enterprises and receives recovery of these costs through rates, implementation of this interpretation at SCE did not affect Edison International’s earnings. EME recorded a $1 million (after tax) charge as a cumulative effect adjustment for asbestos removal and disposal activities associated with retired Powerton structures that are currently scheduled for demolition in 2007. A new accounting standard requires companies to use the fair value accounting method for stock-based compensation. Edison International is required to implement the new standard in the first quarter of 2006 and will apply the modified prospective transition method. Under the modified prospective method, the new accounting standard will be applied effective January 1, 2006 to the unvested portion of awards previously granted and will be applied to all prospective awards. Prior financial statements will not be restated under this method. The new accounting standard will result in the recognition of expense for all stock-based compensation awards. Edison International used the intrinsic value method of accounting, at times resulting in no recognition of expense for stock-based compensation.

97
____________________________________________________________________________________ Edison International
Other Nonoperating Income and Deductions Other nonoperating income and deductions are as follows:
In millions Year ended December 31, 2005 2004 2003
Allowance for funds used during construction $ 25 $ 35 $ 27 Performance-based incentive awards 33 31 21 Demand-side management and energy efficiency performance incentives 45 — — Other 24 18 24
Total utility nonoperating income 127 84 72 Nonutility nonoperating income 9 51 14
Total other nonoperating income $ 136 $ 135 $ 86
Various penalties $ 27 $ 35 $ — Other 38 34 23
Total utility nonoperating deductions 65 69 23 Nonutility nonoperating deductions 2 11 9
Total other nonoperating deductions $ 67 $ 80 $ 32
In 2004, nonutility nonoperating income reflects EME’s pre-tax gain of $47 million on the sale of its interest in Four Star Oil & Gas. Planned Major Maintenance Certain plant facilities require major maintenance on a periodic basis. All such costs are expensed as incurred. Project Development Costs Edison International capitalizes direct costs incurred in developing new projects upon attainment of principal activities needed to commence procurement and construction. These costs consist of professional fees, salaries, permits, and other directly related development costs incurred by EME. The capitalized costs are amortized over the life of operational permits or charged to expense if Edison International determines the costs to be unrecoverable. Property and Plant Utility Plant Utility plant additions, including replacements and betterments, are capitalized. Such costs include direct material and labor, construction overhead, a portion of administrative and general costs capitalized at a rate authorized by the CPUC, and an allowance for funds used during construction (AFUDC). AFUDC represents the estimated cost of debt and equity funds that finance utility-plant construction. Currently, AFUDC debt and equity is capitalized during plant construction and reported in interest expense and other nonoperating income, respectively. AFUDC is recovered in rates through depreciation expense over the useful life of the related asset. AFUDC – equity was $25 million in 2005, $23 million in

98
____________________________________________________________________________________ Notes to Consolidated Financial Statements 2004 and $21 million in 2003. AFUDC – debt was $14 million in 2005, $12 million in 2004 and $6 million in 2003. Depreciation of utility plant is computed on a straight-line, remaining-life basis. Depreciation expense stated as a percent of average original cost of depreciable utility plant was 3.9% for 2005, 3.9% for 2004 and 4.3% for 2003. Replaced or retired property costs are charged to the accumulated provision for depreciation. Cash payments for removal costs less salvage reduce the liability for asset retirement obligations. Effective January 1, 2004, San Onofre Nuclear Generating Station (San Onofre) Units 2 and 3 returned to traditional cost-of-service ratemaking. The July 8, 2004 CPUC decision on SCE’s 2003 general rate case returned Palo Verde Nuclear Generating Station (Palo Verde) to traditional cost-of-service ratemaking retroactive to May 22, 2003 (the date a final CPUC decision was originally scheduled to be issued). As authorized by the CPUC, SCE had been recovering its investments in San Onofre and Palo Verde on an accelerated basis; these units also had incentive rate-making plans. SCE’s nuclear plant investments made prior to the return to cost-of-service ratemaking are recorded as regulatory assets on its consolidated balance sheets. Since the return to cost-of-service ratemaking, capital additions are recorded in utility plant. These classifications do not affect the rate-making treatment for these assets. Nuclear fuel is recorded as utility plant in accordance with CPUC rate-making procedures. Estimated useful lives of SCE’s utility plant, as authorized by the CPUC, are as follows:
Generation plant 38 years to 81 years Distribution plant 24 years to 53 years Transmission plant 40 years to 60 years Other plant 5 years to 40 years
Nonutility Property Nonutility property, including leasehold improvements and construction in progress, is capitalized at cost. Interest incurred on borrowed funds that finance construction and project development costs are also capitalized. Capitalized interest was $16 million in 2005, $9 million in 2004 and $7 million in 2003. SCE’s Mountainview power plant is included in nonutility property in accordance with the rate-making treatment. Depreciation and amortization is primarily computed on a straight-line basis over the estimated useful lives of nonutility properties and over the lease term for leasehold improvements. Depreciation expense stated as a percent of average original cost of depreciable nonutility property was, on a composite basis, 4.0% for 2005, 4.1% for 2004 and 4.2% for 2003. Emission allowances were acquired by EME as part of its Illinois plants and Homer City facilities acquisitions. Although these emission allowances are freely transferable, EME intends to use substantially all the emission allowances in the normal course of its business to generate electricity. Accordingly, Edison International has classified emission allowances expected to be used by EME to generate power as part of nonutility property. These acquired emission allowances will be amortized over the estimated lives of the plants on a straight-line basis.

99
____________________________________________________________________________________ Edison International
Nonutility property included on the consolidated balance sheets is composed of:
In millions December 31, 2005 2004
Furniture and equipment $ 102 $ 117 Building, plant and equipment 3,663 3,154 Land (including easements) 78 74 Emission allowances 1,305 1,305 Leasehold improvements 90 81 Construction in progress 305 502
5,543 5,233 Accumulated provision for depreciation (1,424) (1,311)
Nonutility property – net $ 4,119 $ 3,922
Estimated useful lives for nonutility property are as follows:
Furniture and equipment 3 years to 20 years Building, plant and equipment 3 years to 40 years Emission allowances 25 years to 35 years Land easements 60 years Leasehold improvements Life of lease
Asset Retirement Obligations As a result of an accounting standard adopted in 2003, Edison International recorded the fair value of its liability for legal AROs, which was primarily related to the decommissioning of SCE’s nuclear power facilities. In addition, SCE capitalized the initial costs of the ARO into a nuclear-related ARO regulatory asset, and also recorded an ARO regulatory liability as a result of timing differences between the recognition of costs recorded in accordance with the standard and the recovery of the related asset retirement costs through the rate-making process. SCE has collected in rates amounts for the future costs of removal of its nuclear assets, and has placed those amounts in independent trusts. A reconciliation of the changes in the ARO liability is as follows:
In millions
ARO liability as of December 31, 2003 $ 2,089 Accretion expense 132 Liabilities settled (33)
ARO liability as of December 31, 2004 2,188 Revisions 117 Liabilities added 16 Accretion expense 366 Liabilities settled (59)
ARO liability as of December 31, 2005 $ 2,628
Fair value of nuclear decommissioning trusts $ 2,907

100
____________________________________________________________________________________ Notes to Consolidated Financial Statements Due to the adoption of the new accounting standard related to AROs in 2003, Edison International recorded a cumulative effect adjustment that decreased net income by approximately $9 million, net of tax. Due to the adoption of an interpretation related to accounting for conditional AROs in 2005, Edison International recorded a cumulative effect adjustment that decreased net income by approximately $1 million, net of tax. The cumulative effect adjustments in 2005 and 2003 were the result of EME’s adoption of the new standard and subsequent interpretation. SCE follows accounting principles for rate-regulated enterprises and receives recovery of these costs through rates; therefore, SCE’s implementation of this new standard and the subsequent interpretation did not affect Edison International’s earnings. See “New Accounting Pronouncements” above. Pro forma disclosures related to adoption of the interpretation related to accounting for conditional AROs are not shown due to their immaterial impact on Edison International. Purchased Power From January 17, 2001 to December 31, 2002, the California Department of Water Resources (CDWR) purchased power on behalf of SCE’s customers for SCE’s residual net short power position (the amount of energy needed to serve SCE’s customers in excess of SCE’s own generation and purchased power contracts). Additionally, the CDWR signed long-term contracts that provide power for SCE’s customers. Effective January 1, 2003, SCE resumed power procurement responsibilities for its residual net short position. SCE acts as a billing agent for the CDWR power, and any power purchased by the CDWR for delivery to SCE’s customers is not considered a cost to SCE. Receivables SCE records an allowance for uncollectible accounts, as determined by the average percentage of amounts written-off in prior accounting periods. SCE assesses its customers a late fee of 0.9% per month, beginning 19 days after the bill is prepared. Inactive accounts are written off after 180 days. Regulatory Assets and Liabilities In accordance with accounting principles for rate-regulated enterprises, SCE records regulatory assets, which represent probable future recovery of certain costs from customers through the rate-making process, and regulatory liabilities, which represent probable future credits to customers through the rate-making process. Included in these regulatory assets and liabilities are SCE’s regulatory balancing accounts. Sales balancing accounts accumulate differences between recorded revenue and revenue SCE is authorized to collect through rates. Cost balancing accounts accumulate differences between recorded costs and costs SCE is authorized to recover through rates. Undercollections are recorded as regulatory balancing account assets. Overcollections are recorded as regulatory balancing account liabilities. SCE’s regulatory balancing accounts accumulate balances until they are refunded to or received from SCE’s customers through authorized rate adjustments. Primarily all of SCE’s balancing accounts can be classified as one of the following types: generation-revenue related, distribution-revenue related, generation-cost related, distribution-cost related, transmission-cost related or public purpose and other cost related. Balancing account undercollections and overcollections accrue interest based on a three-month commercial paper rate published by the Federal Reserve. Income tax effects on all balancing account changes are deferred.

101
____________________________________________________________________________________ Edison International
Amounts included in regulatory assets and liabilities are generally recorded with corresponding offsets to the applicable income statement accounts, except for regulatory balancing accounts, which are offset through the provisions for regulatory adjustments clauses. Regulatory Assets Regulatory assets included on the consolidated balance sheets are:
In millions December 31, 2005 2004
Current: Regulatory balancing accounts $ 355 $ 371 Direct access procurement charges 113 109 Purchased-power settlements 53 62 Other 15 11
536 553
Long-term: Flow-through taxes – net 1,066 1,018 Rate reduction notes – transition cost deferral 465 739 Unamortized nuclear investment – net 487 526 Nuclear-related ARO investment – net 292 272 Unamortized coal plant investment – net 97 78 Unamortized loss on reacquired debt 323 250 Direct access procurement charges 40 141 Environmental remediation 56 55 Purchased-power settlements 39 91 Other 148 115
3,013 3,285
Total Regulatory Assets $ 3,549 $ 3,838
SCE’s regulatory assets related to direct access procurement charges are for amounts direct access customers owe bundled service customers for the period May 1, 2000 through August 31, 2001, and are offset by corresponding regulatory liabilities to the bundled service customers. These amounts will be collected by mid-2007. SCE’s regulatory assets related to purchased-power settlements will be recovered through 2008. Based on current regulatory ratemaking and income tax laws, SCE expects to recover its net regulatory assets related to flow-through taxes over the life of the assets that give rise to the accumulated deferred income taxes. SCE’s regulatory asset related to the rate reduction bonds is amortized simultaneously with the amortization of the rate reduction bonds liability, and is expected to be recovered by the end of 2007. SCE’s nuclear-related regulatory assets are expected to be recovered by the end of the remaining useful lives of the nuclear facilities. SCE has requested a four-year recovery period for the net regulatory asset related to its unamortized coal plant investment. CPUC approval is pending. SCE’s regulatory asset related to its unamortized loss on reacquired debt will be recovered over the remaining original amortization period of the reacquired debt over periods ranging from one year to 30 years. SCE’s regulatory asset related to environmental remediation represents the portion of SCE’s environmental liability recognized at the end of the period in excess of the amount that has been recovered through rates charged to customers. This amount will be recovered in future rates as expenditures are made.

102
____________________________________________________________________________________ Notes to Consolidated Financial Statements SCE earns a return on three of the regulatory assets listed above: unamortized nuclear investment – net, unamortized coal plant investment – net and unamortized loss on reacquired debt. Regulatory Liabilities Regulatory liabilities included on the consolidated balance sheets are:
In millions December 31, 2005 2004
Current: Regulatory balancing accounts $ 370 $ 357 Direct access procurement charges 113 109 Energy derivatives 136 — Other 62 24
681 490
Long-term: ARO 584 819 Costs of removal 2,110 2,112 Direct access procurement charges 39 141 Employee benefits plans 229 200 Other — 84
2,962 3,356
Total Regulatory Liabilities $ 3,643 $ 3,846
SCE’s regulatory liability related to the ARO represents timing differences between the recognition of AROs in accordance with generally accepted accounting principles and the amounts recognized for rate-making purposes. SCE’s regulatory liabilities related to costs of removal represent revenue collected for asset removal costs that SCE expects to incur in the future. SCE’s regulatory liabilities related to direct access procurement charges are a liability to its bundled service customers and are offset by regulatory assets from direct access customers. SCE’s regulatory liabilities related to energy derivatives are an offset to unrealized gains on recorded derivatives. SCE’s regulatory liabilities related to employee benefit plan expenses represent pension and postretirement benefits other than pensions costs recovered through rates charged to customers in excess of the amounts recognized as expense. These balances will be returned to ratepayers in some future rate-making proceeding, be charged against expense to the extent that future expenses exceed amounts recoverable through the rate-making process, or be applied as otherwise directed by the CPUC. Related Party Transactions Four EME subsidiaries have 49% to 50% ownership in partnerships that sell electricity generated by their project facilities to SCE under long-term power purchase agreements with terms and pricing approved by the CPUC. Beginning March 31, 2004, Edison International consolidates these projects (see “Variable Interest Entities”). An indirect wholly owned affiliate of EME has entered into operation and maintenance agreements with partnerships in which EME has a 50% or less ownership interest. EME recorded revenue under these agreements of $24 million for each year in 2005, 2004 and 2003. EME’s accounts receivable with this affiliate totaled $7 million at December 31, 2005 and $6 million at December 31, 2004.

103
____________________________________________________________________________________ Edison International
Restricted Cash Edison International had total restricted cash of $165 million at December 31, 2005 and $228 million at December 31, 2004. The restricted amounts included in current assets are primarily used to make scheduled payments on the current maturities of rate reduction notes issued on behalf of SCE by a special purpose entity, as well as to serve as collateral at Edison Capital for outstanding letters of credit. The restricted amounts included in other long-term assets are primarily to pay amounts required for debt payments and letter of credit expenses at EME. Revenue Electric utility revenue is recognized as electricity is delivered and includes amounts for services rendered but unbilled at the end of each year. Amounts charged for services rendered are based on CPUC-authorized rates and FERC-approved rates. Revenue related to SCE’s transmission function is authorized by the FERC in periodic proceedings that are similar to the CPUC’s proceedings, except that requested rate changes are generally implemented when the application is filed, and revenue collected prior to a final FERC decision is subject to refund. Rates include amounts for current period costs, plus the recovery of certain previously incurred costs. However, in accordance with accounting standards for rate-regulated enterprises, amounts currently authorized in rates for recovery of costs to be incurred in the future are not recognized as revenue until the associated costs are incurred. Instead, these amounts are recorded as regulatory liabilities. For costs recovered through CPUC-authorized general rate case rates, costs incurred in excess of revenue billed are deferred in a balancing account, and recovered in future rates. Since January 17, 2001, power purchased by the CDWR or through the California Independent System Operator (ISO) for SCE’s customers is not considered a cost to SCE, because SCE is acting as an agent for these transactions. Further, amounts billed to ($1.9 billion in 2005, $2.5 billion in 2004 and $1.7 billion in 2003) and collected from SCE’s customers for these power purchases, CDWR bond-related costs (effective November 15, 2002) and a portion of direct access exit fees (effective January 1, 2003) are being remitted to the CDWR and are not recognized as revenue by SCE. Generally, nonutility power generation revenue is recorded as electricity is generated or services are provided. In addition, EME’s subsidiaries enter into power and fuel hedging, optimization transactions and energy trading contracts, all subject to market conditions. One of EME’s subsidiaries executes these transactions primarily through the use of physical forward commodity purchases and sales and financial commodity swaps and options. With respect to its physical forward contracts, EME’s subsidiaries generally act as the principal, take title to the commodities, and assume the risks and rewards of ownership. Therefore, EME’s subsidiaries record settlement of non-trading physical forward contracts on a gross basis. Consistent with accounting rules for derivatives, EME nets the cost of purchased power against related third party sales in markets that use locational marginal pricing, currently PJM. Financial swap and option transactions are settled net and, accordingly, EME’s subsidiaries do not take title to the underlying commodity. Therefore, gains and losses from settlement of financial swaps and options are recorded net. Managed risks typically include commodity price risk associated with fuel purchases and power sales. Financial services and other revenue is generally derived from two sources; leveraged leases and renewable energy. Revenue from leveraged leases is recorded by recognizing income over the term of the lease so as to produce a constant rate of return based on the investment leased. Revenue from renewable energy is earned under long-term power sales contracts. The amounts recognized are the lesser of amounts billable under the contract or the amount determined by the kilowatt-hours (kWhs) made

104
____________________________________________________________________________________ Notes to Consolidated Financial Statements available during the period multiplied by the estimated average revenue per kWh over the term of the contract. Ordinary gains and losses from sale of assets are recognized at the time of the transaction. Revisions Edison International revised its consolidated statements of cash flows for the years ended December 31, 2004 and 2003 to separately disclose the operating, financing and investing portions of the cash flows attributable to discontinued operations. Edison International had previously reported these amounts on a combined basis. Stock-Based Compensation Edison International has stock-based compensation plans, which are described more fully in Note 6. Edison International accounts for those plans using the intrinsic value method. Upon grant, no stock-based compensation cost is reflected in net income, as all options granted under those plans had an exercise price equal to the market value of the underlying common stock on the date of grant. The following table illustrates the effect on net income and EPS if Edison International had used the fair-value accounting method.
In millions Year ended December 31, 2005 2004 2003
Net income, as reported $ 1,137 $ 916 $ 821 Add: stock-based compensation expense using the intrinsic value accounting method – net of tax 48 51 7 Less: stock-based compensation expense using the fair-value accounting method – net of tax 42 57 9
Pro forma net income $ 1,143 $ 910 $ 819
Basic EPS: As reported $ 3.47 $ 2.81 $ 2.52 Pro forma 3.49 2.79 2.51 Diluted EPS: As reported $ 3.43 $ 2.77 $ 2.50 Pro forma 3.45 2.75 2.49
Supplemental Accumulated Other Comprehensive Loss Information Supplemental information regarding Edison International’s accumulated other comprehensive loss, including discontinued operations, is:
In millions December 31, 2005 2004
Foreign currency translation adjustments – net of tax $ 2 $ — Minimum pension liability – net of tax (12) (15) Unrealized gains (losses) on cash flow hedges – net of tax (216) 11
Accumulated other comprehensive loss $ (226) $ (4)
The minimum pension liability is discussed in Note 6, Compensation and Benefit Plans.
105
____________________________________________________________________________________ Edison International
Included in Edison International’s accumulated other comprehensive loss at December 31, 2005, was a $210 million loss related to EME’s unrealized losses on cash flow hedges and a $5 million loss related to SCE’s interest rate swap (see discussion below). Included in EME’s unrealized losses on cash flow hedges included unrealized losses on commodity hedges primarily related to EME’s Homer City and Midwest Generation futures and forward electricity contracts that qualify for hedge accounting. These losses arise because current forecasts of future electricity prices in these markets are greater than the contract prices. The increase in the unrealized losses during 2005 resulted from a combination of new hedges for 2006 and 2007 and an increase in market prices for power driven largely from higher natural gas and oil prices. In addition, EME reclassified a $9 million (after tax) unrealized gain from other comprehensive income to earnings due to the impairment of its equity investment in the March Point project in 2005. As EME’s hedged positions for continuing operations are realized, approximately $178 million (after tax) of the net unrealized losses on cash flow hedges at December 31, 2005 are expected to be reclassified into earnings during 2006. EME expects that reclassification of net unrealized losses will offset energy revenue recognized at market prices. Actual amounts ultimately reclassified into earnings over the next 12 months could vary materially from this estimated amount as a result of changes in market conditions. The maximum period over which an EME cash flow hedge is designated is through December 31, 2007. Unrealized losses on cash flow hedges also included those related to SCE’s interest rate swap (the swap terminated on January 5, 2001, but the related debt matures in 2008). The unamortized loss of $5 million (as of December 31, 2005, net of tax) on the interest rate swap will be amortized over a period ending in 2008. Approximately $2 million, after tax, of the unamortized loss on this swap will be reclassified into earnings during 2006.

106
____________________________________________________________________________________ Notes to Consolidated Financial Statements Supplemental Cash Flow Information Edison International supplemental cash flows information is:
In millions Year ended December 31, 2005 2004 2003
Cash payments for interest and taxes:
Interest – net of amounts capitalized $ 776 $ 878 $ 1,280 Tax payments (receipts) 185 (33) 230
Non-cash investing and financing activities:
Details of debt exchange: Pollution-control bonds redeemed $ (452) — — Pollution-control bonds issued 452 — —
Dividends declared but not paid $ 88 $ 81 $ 65
Details of assets acquired: Fair value of assets acquired $ 154 — $ 3 Cash paid for acquisition (154) — (3)
Liabilities assumed $ — — $ —
Details of capital lease obligation: Capital lease purchased $ (15) — — Capital lease obligation issued 15 — — Details of consolidation of variable interest entities: Assets $ 37 $ 625 — Liabilities (27) (704) —
Details of deconsolidation of variable interest entities: Assets — $ (220) — Liabilities — 254 —
Reoffering of pollution-control bonds — $ 196 —
Details of pollution-control bond redemption: Release of funds held in trust — $ 20 — Pollution-control bonds redeemed — (20) —
Details of long-term debt exchange offer: Variable rate notes redeemed — — $ (966) First and refunding mortgage bonds issued — — 966
Details of debt exchange: Retirement of senior secured credit facility — — $ (700) Short-term credit facility — — 200
Cash paid — — $ (500)
Obligation to fund investment in acquisition — — $ 8

107
____________________________________________________________________________________
Edison International Variable Interest Entities Entities Consolidated SCE has variable interests in contracts with certain qualifying facilities (QFs) that contain variable contract pricing provisions based on the price of natural gas. Four of these contracts are with entities that are partnerships owned in part by a related party, EME. These four contracts had 20-year terms at inception. The QFs sell electricity to SCE and steam to nonrelated parties. Under a new accounting standard, Edison International and SCE consolidated these four projects effective March 31, 2004. Prior periods have not been restated. The book value of the projects’ plant assets at December 31, 2005 is $345 million and is recorded in nonutility property.
Project Capacity Termination Date EME Ownership
Kern River 300 MW August 2010 50% Midway-Sunset 225 MW May 2009 50% Sycamore 300 MW December 2007 50% Watson 385 MW December 2007 49%
SCE has no investment in, nor obligation to provide support to, these entities other than its requirement to make contract payments. Any liabilities of these projects are nonrecourse to SCE. Effective April 1, 2004, the variable interest entities’ operating costs, are shown in Edison International’s consolidated statements of income. Prior to that date, purchases under these QF contracts were reported as purchased-power expense. Further, Edison International’s electric utility revenue includes revenue from the sale of steam by these four projects, beginning April 1, 2004. Edison Capital has investments in affordable housing and wind projects that are variable interests. Effective March 31, 2004, Edison Capital consolidated two affordable housing partnerships and three wind projects. These projects are funded with nonrecourse debt totaling $27 million at December 31, 2005. Properties serving as collateral for these loans had a carrying value of $50 million and are classified as nonutility property on the December 31, 2005 consolidated balance sheet. The creditors to these projects do not have recourse to the general credit of Edison Capital. Wildorado Wind, L.P. is a special purpose entity formed to develop the Wildorado project, a planned 161 MW wind power generating facility to be located in Texas. A subsidiary of EME entered into a loan agreement with Wildorado Wind to fund turbine payments for the Wildorado project. In accordance with an accounting interpretation related to the consolidation of VIEs, EME determined that it was the primary beneficiary and accordingly, consolidated Wildorado Wind at December 31, 2005. Entities Deconsolidated Upon Implementation of New Accounting Standard EME deconsolidated the Doga and Kwinana projects effective March 31, 2004. The Kwinana project was sold on December 16, 2004, as part of EME’s sale of its international operations and, accordingly, is included in discontinued operations. Significant Variable Interests in Entities Not Consolidated EME has a significant variable interest in the Sunrise project, which is a gas-fired facility located in California. As of December 31, 2005, EME had a 50% ownership interest in the project and its investment was $107 million. EME’s maximum exposure to loss is generally limited to its investment in this entity.

108
____________________________________________________________________________ Notes to Consolidated Financial Statements Edison Capital’s maximum exposure to loss from affordable housing investments in this category is generally limited to its net investment balance of $40 million and recapture of tax credits. Entities with Unavailable Financial Information SCE has eight nonrelated-party contracts with QFs that contain variable pricing provisions based on the price of natural gas and are potential VIEs. SCE might be considered to be the consolidating entity under the new accounting standard. However, these entities are not legally obligated to provide the financial information to SCE that is necessary to determine whether SCE must consolidate these entities. These eight entities have declined to provide SCE with the necessary financial information. SCE is continuing to attempt to obtain information for these projects in order to determine whether they should be consolidated by SCE. The aggregate capacity dedicated to SCE for these projects is 267 MW. SCE paid $198 million in 2005, $166 million in 2004 and $147 million in 2003 to these projects. These amounts are recoverable in utility customer rates. SCE has no exposure to loss as a result of its involvement with these projects. Note 2. Derivative Instruments and Hedging Activities Edison International uses derivative financial instruments to manage financial exposure on its investments and fluctuations in commodity prices, interest rates, foreign currency exchange rates, and emission and transmission rights. Edison International manages these risks in part by entering into interest rate swap, cap and lock agreements, and forward commodity transactions, including options, swaps and futures. Edison International has a power marketing and trading subsidiary that markets the energy and capacity of EME’s merchant generating fleet and, in addition, trades electric power and energy and related commodity and financial products. Edison International is exposed to credit loss in the event of nonperformance by counterparties. To mitigate credit risk from counterparties, master netting agreements are used whenever possible and counterparties may be required to pledge collateral depending on the creditworthiness of each counterparty and the risk associated with the transaction. Edison International records its derivative instruments on its consolidated balance sheets at fair value unless they meet the definition of a normal purchase or sale. The normal purchases and sales exception requires, among other things, physical delivery in quantities expected to be used or sold over a reasonable period in the normal course of business. Gains or losses from changes in the fair value of a recognized asset or liability or a firm commitment are reflected in earnings for the ineffective portion of a designated hedge. For a designated hedge of the cash flows of a forecasted transaction or a foreign currency exposure, the effective portion of the gain or loss is initially recorded as a separate component of shareholders’ equity under the caption “accumulated other comprehensive income,” and subsequently reclassified into earnings when the forecasted transaction affects earnings. The ineffective portion of the hedge is reflected in earnings immediately. Hedge accounting requires Edison International to formally document, designate, and assess the effectiveness of hedge transactions. EME recorded net gains (losses) of approximately $(65) million, $(13) million and $11 million in 2005, 2004 and 2003, respectively, representing the amount of cash flow hedges’ ineffectiveness for continuing operations; these amounts are reflected in nonutility power generation revenue on the consolidated statements of income. Fair value changes for EME’s trading operations are reflected in earnings. SCE’s transactions are pre-approved by the CPUC or executed in compliance with CPUC-approved procurement plans. Hedge accounting is not used for these transactions. Any fair value changes for these recorded derivatives are recorded in purchased-power expense and offset through the provision for regulatory adjustment clauses; therefore, fair value changes do not affect earnings.
109
____________________________________________________________________________________ Edison International
Unit-specific contracts (signed or modified after June 30, 2003) in which SCE takes virtually all of the output of a facility are generally considered to be leases under accounting rules. Leases are not derivatives and are not recorded on the consolidated balance sheets unless they are classified as capital leases. Most of SCE’s QF contracts are not required to be recorded on the consolidated balance sheets. For further discussion see “Variable Interest Entities” in Note 1. However, SCE purchases power from certain QF’s in which the contract pricing is based on a natural gas index, but the power is not generated with natural gas. The portion of these contracts that is not eligible for the normal purchases and sales exception is recorded on the consolidated balance sheets at fair value. EME’s risk management and trading operations are conducted by a subsidiary. As a result of a number of industry and credit-related factors, the subsidiary has minimized its price risk management and trading activities not related to EME’s power plants or investments in energy projects. To the extent it engages in trading activities, EME’s trading subsidiary seeks to manage price risk and to create stability of future income by selling electricity in the forward markets and, to a lesser degree, to generate profit from price volatility of electricity and fuels by buying and selling these commodities in wholesale markets. EME generally balances forward sales and purchase contracts and manages its exposure through a value at risk analysis. Assets from price risk management and energy trading activities include the fair value of open financial positions related to trading activities and the present value of net amounts receivable from structures transactions. Liabilities from price risk management and energy trading activities include the fair value of open financial positions related to trading activities and the present value of net amounts payable from structured transactions. EME recorded net gains of approximately $202 million, $29 million and $40 million in 2005, 2004 and 2003, respectively, arising from energy trading activities reflected in nonutility power generation revenue on the consolidated statements of income. EME netted 3.9 million MWh and 2.9 million MWh of sales and purchases of physically settled, gross purchases and sales during 2005 and 2004, respectively. Derivative assets and liabilities are shown at gross amounts on the consolidated balance sheets, except that net presentation is used when Edison International has the legal right of setoff, such as multiple contracts executed with the same counterparty under master netting arrangements.

110
____________________________________________________________________________________ Notes to Consolidated Financial Statements The carrying amounts and fair values of financial instruments are:
December 31, 2005 2004 Carrying Fair Carrying Fair In millions Amount Value Amount Value
Derivatives: Interest rate hedges $ (12) $ (12) $ 3 $ 3 Commodity price assets 239 239 24 24 Commodity price liabilities (521) (521) (12) (12) Other: Decommissioning trusts 2,907 2,907 2,757 2,757 DOE decommissioning and decontamination fees (7) (7) (13) (13) QF power contracts assets 23 23 — — QF power contracts liabilities (94) (94) (12) (12) Long-term debt (8,833) (9,511) (9,678) (10,718) Long-term debt due within one year (745) (763) (809) (815) Preferred stock to be redeemed within one year — — (9) (9) Preferred stock subject to mandatory redemption — — (139) (140) Trading Activities: Assets 128 128 125 125 Liabilities (27) (27) (36) (36)
Fair values are based on: brokers’ quotes for interest rate hedges, long-term debt and preferred stock; financial models for commodity price derivatives and QF power contracts; quoted market prices for decommissioning trusts; and discounted future cash flows for United States Department of Energy (DOE) decommissioning and decontamination fees. Quoted market prices are used to determine the fair value of the financial instruments related to energy trading activities, except for the power sales agreement with an unaffiliated electric utility that EME’s subsidiary purchased and restructured and a long-term power supply agreement with another unaffiliated party. EME’s subsidiary recorded these agreements at fair value based upon a discounting of future electricity prices derived from a proprietary model using a discount rate equal to the cost of borrowing the non-recourse debt incurred to finance the purchase of the power supply agreement. Due to their short maturities, amounts reported for cash equivalents approximate fair value. Note 3. Liabilities and Lines of Credit Long-Term Debt Almost all SCE properties are subject to a trust indenture lien. SCE has pledged first and refunding mortgage bonds as security for borrowed funds obtained from pollution-control bonds issued by government agencies. SCE used these proceeds to finance construction of pollution-control facilities. SCE has a debt covenant that requires a debt to total capitalization ratio be met. At December 31, 2005, SCE was in compliance with this debt covenant. Bondholders have limited discretion in redeeming certain pollution-control bonds, and SCE has arranged with securities dealers to remarket or purchase them if necessary. MEHC used the common stock of EME as security for MEHC’s senior secured notes. MEHC’s senior secured notes are nonrecourse to Edison International and EME, and accordingly, Edison International and EME have no obligations under these senior secured notes. These senior secured notes contain

111
____________________________________________________________________________________ Edison International
restrictions on MEHC’s ability to pay dividends unless it has an interest coverage ratio of at least 2.0 to 1.0 as defined in the indenture. At December 31, 2005, MEHC’s interest coverage ratio was 2.79 to 1.0. In connection with Midwest Generation’s financing activities, EME has given first and second priority security interests in substantially all the coal-fired generating plants owned by Midwest Generation and the assets relating to those plants and receivables of EME’s power marketing and trading subsidiary directly related to Midwest Generation’s hedging activities. The amount of assets pledged or mortgaged totaled approximately $2.9 billion at December 31, 2005. In addition to these assets, Midwest Generation’s membership interests and the capital stock of Edison Mission Midwest Holdings were pledged. Emission allowances have not been pledged. Debt premium, discount and issuance expenses are deferred and amortized (on a straight-line basis for SCE and on a basis which approximates the effective interest rate method over the term of the related debt for MEHC) through interest expense over the life of each issue. Under CPUC rate-making procedures, debt reacquisition expenses are amortized over the remaining life of the reacquired debt or, if refinanced, the life of the new debt. California law prohibits SCE from incurring or guaranteeing debt for its nonutility affiliates. In December 1997, $2.5 billion of rate reduction notes were issued on behalf of SCE by SCE Funding LLC, a special purpose entity. These notes were issued to finance the 10% rate reduction mandated by state law. The proceeds of the rate reduction notes were used by SCE Funding LLC to purchase from SCE an enforceable right known as transition property. Transition property is a current property right created by the restructuring legislation and a financing order of the CPUC and consists generally of the right to be paid a specified amount from nonbypassable rates charged to residential and small commercial customers. The rate reduction notes are being repaid over 10 years through these nonbypassable residential and small commercial customer rates, which constitute the transition property purchased by SCE Funding LLC. The notes are collateralized by the transition property and are not collateralized by, or payable from, assets of SCE or Edison International. SCE used the proceeds from the sale of the transition property to retire debt and equity securities. Although, as required by accounting principles generally accepted in the United States, SCE Funding LLC is consolidated with SCE and the rate reduction notes are shown as long-term debt on the consolidated financial statements, SCE Funding LLC is legally separate from SCE. The assets of SCE Funding LLC are not available to creditors of SCE or Edison International and the transition property is legally not an asset of SCE or Edison International.

112
____________________________________________________________________________________ Notes to Consolidated Financial Statements Long-term debt is:
In millions December 31, 2005 2004
First and refunding mortgage bonds: 2006 – 2036 (4.65% to 6.00% and variable) $ 2,775 $ 2,741
Rate reduction notes: 2006 – 2007 (6.38% to 6.42%) 493 739 Pollution-control bonds: 2008 – 2035 (2.00% to 5.55% and variable) 1,196 1,196 Debentures and notes: 2006 – 2053 (non-interest bearing to 13.5% and variable) 5,133 5,690 Subordinated debentures — 154 Long-term debt due within one year (745) (809) Unamortized debt discount – net (19) (33)
Total $ 8,833 $ 9,678
Note: Rates and terms as of December 31, 2005.
Long-term debt maturities and sinking-fund requirements for the next five years are: 2006 – $745 million; 2007 – $480 million; 2008 – $1.6 billion; 2009 – $610 million; and 2010 – $261 million. Long-term debt due within one year includes $11 million and $10 million of debt related to Edison Capital’s Storm Lake project that is not due until 2011 and 2017, respectively. This debt has been classified as long-term debt due within one year as a result of an agreement with the lenders to reduce the project loan balances subject to recovering damages in Enron’s bankruptcy. In January 2006, SCE issued $500 million of first and refunding mortgage bonds. The issuance included $350 million of 5.625% bonds due in 2036 and $150 million of variable rate bonds due in 2009. Short-Term Debt Short-term debt is used to finance fuel inventories, balancing account undercollections and general cash requirements, including power purchase payments. At December 31, 2005, Edison International had no outstanding short-term debt. Edison International’s outstanding amount and weighted-average interest rate, respectively, for short-term debt was $88 million at 2.48% at December 31, 2004. Lines of Credit At December 31, 2005, Edison International and its subsidiaries had $2.7 billion of borrowing capacity available under lines of credit totaling $2.9 billion. SCE had a $1.7 billion line of credit with $1.5 billion available. EME had lines of credit of $198 million with $172 million available. Edison International (parent) had a $1.0 billion line of credit available. These credits lines have various expiration dates, and when available, can be drawn down at negotiated or bank index rates. At December 31, 2004, Edison International’s subsidiaries had lines of credit totaling $1.1 billion, with various expiration dates, and when available, can be drawn down at negotiated or bank index rates. EME had total lines of credit of $398 million, with $382 million available to finance general cash requirements. SCE had drawn $98 million on a $700 million line of credit.
113
____________________________________________________________________________________ Edison International
Preferred Stock Subject to Mandatory Redemption SCE has 12 million authorized shares of preferred stock. These shares can be issued with or without mandatory redemption requirements – see Note 4. Shares of SCE’s preferred stock have liquidation and dividend preferences over shares of SCE’s common stock and preference stock. Mandatorily redeemable preferred stock is subject to sinking-fund provisions. When preferred shares are redeemed, the premiums paid, if any, are charged to expense. At December 31, 2005, SCE had no preferred stock subject to mandatory redemption. At December 31, 2004, SCE’s $100 par value cumulative preferred stock subject to mandatory redemption consisted of: $58 million (net of $9 million of preferred stock to be redeemed within one year) of preferred stock for Series 6.05% and $81 million for Series 7.23%. The 6.05% Series preferred stock had mandatory sinking-funds, requiring SCE to redeem at least 37,500 shares per year from 2003 through 2007, and 562,500 shares in 2008. SCE was allowed to credit previously repurchased shares against the mandatory sinking-fund provisions. In 2005, SCE redeemed 673,800 shares of 6.05% Series cumulative preferred stock, which included 36,300 shares redeemed to satisfy the mandatory sinking-fund requirement. In 2004, SCE repurchased 20,000 shares of 6.05% Series preferred stock. In 2003, SCE repurchased 56,200 shares of 6.05% Series preferred stock. At December 31, 2004, SCE had 1,200 previously repurchased, but not retired, shares available to credit against the mandatory sinking-fund provisions. The 7.23% Series preferred stock also had mandatory sinking-funds, requiring SCE to redeem at least 50,000 shares per year from 2002 through 2006, and 750,000 shares in 2007. However, SCE was allowed to credit previously repurchased shares against the mandatory sinking-fund provisions. In 2005, SCE redeemed the remaining 807,000 shares of 7.23% Series cumulative preferred stock. Since SCE had previously repurchased 193,000 shares of this series, no shares were redeemed in 2004 or 2003. At December 31, 2004, SCE had 43,000 previously repurchased, but not retired, shares available to credit against the mandatory sinking-fund provisions. Note 4. Preferred and Preference Stock of Utility Not Subject to Mandatory Redemption SCE’s authorized shares are: $100 cumulative preferred – 12 million, $25 cumulative preferred – 24 million and preference – 50 million. There are no dividends in arrears for the preferred stock or preference shares. Shares of SCE’s preferred stock have liquidation and dividend preferences over shares of SCE’s common stock and preference stock. All cumulative preferred stock is redeemable. When preferred shares are redeemed, the premiums paid, if any, are charged to common equity. No preferred stock not subject to mandatory redemption was issued or redeemed in the last three years. There is no sinking-fund for the redemption or repurchase of the preferred stock. Shares of SCE’s preference stock rank junior to all of the preferred stock and senior to all common stock. Shares of SCE’s preference stock are not convertible into shares of any other class or series of SCE’s capital stock or any other security. The preference shares are non-cumulative and have a $100 liquidation value. There is no sinking-fund for the redemption or repurchase of the preference stock.

114
____________________________________________________________________________________ Notes to Consolidated Financial Statements SCE’s preferred and preference stock not subject to mandatory redemption is:
Dollars in millions, except per-share amounts December 31, 2005 2004 December 31, 2005 Shares Redemption Outstanding Price Cumulative preferred stock $25 par value: 4.08% Series 1,000,000 $25.50 $ 25 $ 25 4.24 1,200,000 25.80 30 30 4.32 1,653,429 28.75 41 41 4.78 1,296,769 25.80 33 33 Preference stock No par value: 5.349% Series A 4,000,000 100.00 400 — 6.125% Series B 2,000,000 100.00 200 —
729 129 Less issuance costs (10) —
Total $719 $129
The Series A preference stock may not be redeemed prior to April 30, 2010. After April 30, 2010, SCE may, at its option, redeem the shares in whole or in part and the dividend rate may be adjusted. The Series B preference stock may not be redeemed prior to September 30, 2010. After September 30, 2010, SCE may, at its option, redeem the shares in whole or in part. In January 2006, SCE issued two million shares of 6.0% Series C preference stock (non-cumulative, $100 liquidation value). The Series C preference stock may not be redeemed prior to January 31, 2011. After January 31, 2011, SCE may, at its option, redeem the shares in whole or in part. The Series C preference stock has the same general characteristics as the Series A and B preference stock mentioned above. Note 5. Income Taxes Edison International’s eligible subsidiaries are included in Edison International’s consolidated federal income tax and combined state franchise tax returns. Edison International has tax-allocation and payment agreements with certain of its subsidiaries. For subsidiaries other than SCE, the right of a participating subsidiary to receive or make a payment and the amount and timing of tax-allocation payments are dependent on the inclusion of the subsidiary in the consolidated income tax returns of Edison International and other factors including the consolidated taxable income of Edison International and its includible subsidiaries, the amount of taxable income or net operating losses and other tax items of the participating subsidiary, as well as the other subsidiaries of Edison International. There are specific procedures regarding allocations of state taxes. Each subsidiary is eligible to receive tax-allocation payments for its tax losses or credits only at such time as Edison International and its subsidiaries generate sufficient taxable income to be able to utilize the participating subsidiary’s losses in the consolidated tax return of Edison International. Under an income tax-allocation agreement approved by the CPUC, SCE’s tax liability is computed as if it filed a separate return.

115
____________________________________________________________________________________ Edison International
As part of the process of preparing its consolidated financial statements, Edison International is required to estimate its income taxes in each of the jurisdictions in which it operates. This process involves estimating actual current tax exposure together with assessing temporary differences resulting from differing treatment of items, such as depreciation, for tax and accounting purposes. These differences result in deferred tax assets and liabilities, which are included within Edison International’s consolidated balance sheet. Income tax expense includes the current tax liability from operations and the change in deferred income taxes during the year. Investment tax credits are deferred and amortized over the lives of the related properties. The sources of income (loss) before income taxes are:
In millions Year ended December 31, 2005 2004 2003
Domestic $ 1,557 $ 128 $ 767 Foreign 8 6 12 Total continuing operations 1,565 134 779 Discontinued operations (11) 737 298 Accounting change (2) — (13) Total $ 1,552 $ 871 $ 1,064
The components of income tax expense (benefit) by location of taxing jurisdiction are:
In millions Year ended December 31, 2005 2004 2003
Current: Federal $ 400 $ (560) $ 186 State 103 (36) 100 Foreign (1) — 6 502 (596) 292
Deferred: Federal 16 458 (103) State (61) 46 (67) Foreign — — 2
(45) 504 (168)
Total continuing operations 457 (92) 124
Discontinued operations (40) 47 123 Accounting change (1) — (4)
Total $ 416 $ (45) $ 243

116
____________________________________________________________________________________ Notes to Consolidated Financial Statements The components of the net accumulated deferred income tax liability are:
In millions December 31, 2005 2004
Deferred tax assets: Property-related $ 424 $ 260 Unrealized gains and losses 321 392 Regulatory balancing accounts 301 321 Decommissioning 163 84 Accrued charges 254 278 Loss and credit carryforwards 79 217 Pension and postretirement benefits other than pensions 182 125 Price risk management 162 — Other 447 148
Subtotal 2,333 1,825
Valuation allowance — 3 Total $ 2,333 $ 1,822 Deferred tax liabilities: Property-related $ 3,480 $ 3,161 Leveraged leases 2,215 2,142 Capitalized software costs 173 164 Regulatory balancing accounts 607 710 Unrealized gains and losses 321 298 Other 575 292
Total $ 7,371 $ 6,767
Accumulated deferred income taxes – net $ 5,038 $ 4,945
Classification of accumulated deferred income taxes: Included in deferred credits $ 5,256 $ 5,233 Included in current assets $ 218 $ 288
The federal statutory income tax rate is reconciled to the effective tax rate from continuing operations as follows:
Year ended December 31, 2005 2004 2003
Federal statutory rate 35.0% 35.0% 35.0% Tax reserve adjustments (2.1) (73.9) (4.5) Resolution of 1991–1993 audit cycle (3.9) — — Resolution of FERC rate case — — (9.6) Housing and production credits (2.0) (22.9) (4.3) Property-related 0.2 10.4 1.1 Amortization of ITC credits (0.5) (6.7) (1.0) State tax – net of federal deduction 3.3 3.0 5.3 ESOP dividend payment (0.7) (6.2) — Other (0.1) (7.4) (6.0)
Effective tax rate 29.2% (68.7)% 16.0% Edison International’s composite federal and state statutory tax rate was approximately 40% for all years presented. The effective tax rate of 29.2% realized in 2005 was primarily due to the favorable resolution of the 1991–1993 Internal Revenue Service (IRS) audit, as well as adjustments made to the tax reserve to

117
____________________________________________________________________________________ Edison International
reflect the issuance of new IRS regulations, and the favorable settlement of other federal and state tax audit issues at SCE and EME, and the benefits received from the low income housing and production tax credits at Edison Capital. The effective tax benefit rate of 68.7% realized in 2004 was primarily due to adjustments to tax liabilities relating to prior years at SCE and the benefits received from low income housing and production tax credits at Edison Capital, partially offset by property-related flow-through items and property-related adjustments at SCE. The effective tax rate of 16.0% realized in 2003 was primarily due to the resolution of a FERC rate case at SCE, recording the benefit of favorable settlements of IRS audit issues at SCE and the benefits received from low income housing and production tax credits at Edison Capital. At December 31, 2005, Edison International and its subsidiaries had federal tax credits of $31 million with $26 million to expire in 2024. Edison International also had California net operating loss carryforwards of $128 million which expire in 2013. In addition, EME had state loss carryforwards for various states of $6 million at December 31, 2005 with expiration dates beginning in 2022. At December 31, 2004, Edison International and its subsidiaries had federal tax credits of $161 million and California net operating loss carryforwards of $848 million. In addition, EME had state loss carryforwards for various states of $13 million. As a matter of course, Edison International is regularly audited by federal, state and foreign taxing authorities. For further discussion of this matter, see “Federal Income Taxes” in Note 9. Note 6. Compensation and Benefit Plans Employee Savings Plan Edison International has a 401(k) defined contribution savings plan designed to supplement employees’ retirement income. The plan received employer contributions of $64 million in 2005, $50 million in 2004 and $43 million in 2003. Pension Plans and Postretirement Benefits Other Than Pensions Pension Plans Defined benefit pension plans (some with cash balance features) cover United States employees meeting minimum service and other requirements. SCE recognizes pension expense for its nonexecutive plan as calculated by the actuarial method used for ratemaking. At December 31, 2005 and December 31, 2004, the accumulated benefit obligations of the executive pension plans exceeded the related plan assets at the measurement dates. In accordance with accounting standards, Edison International’s consolidated balance sheets include an additional minimum liability, with corresponding charges to intangible assets and shareholders’ equity (through a charge to accumulated other comprehensive income). The charge to accumulated other comprehensive income would be restored through shareholders’ equity in future periods to the extent the fair value of the plan assets exceed the accumulated benefit obligation. The expected contributions (all by the employer) for United States plans are approximately $66 million for the year ended December 31, 2006. This amount is subject to change based on, among other things, the limits established for federal tax deductibility. Edison International’s expenses for its foreign plans are included in discontinued operations.

118
____________________________________________________________________________________ Notes to Consolidated Financial Statements Edison International uses a December 31 measurement date for all of its plans. The fair value of the plan assets is determined by market value. Information on plan assets and benefit obligations for United States plans is shown below: In millions Year ended December 31, 2005 2004
Change in projected benefit obligation Projected benefit obligation at beginning of year $ 3,231 $ 2,959 Service cost 117 103 Interest cost 175 171 Amendments 2 22 Actuarial loss 83 125 Benefits paid (190) (149)
Projected benefit obligation at end of year $ 3,418 $ 3,231
Accumulated benefit obligation at end of year $ 2,953 $ 2,790
Change in plan assets Fair value of plan assets at beginning of year $ 3,062 $ 2,835 Actual return on plan assets 307 323 Employer contributions 20 53 Benefits paid (190) (149)
Fair value of plan assets at end of year $ 3,199 $ 3,062
Funded status $ (219) $ (169) Unrecognized net loss 137 148 Unrecognized transition obligation — 1 Unrecognized prior service cost 78 93
Recorded asset (liability) $ (4) $ 73
Additional detail of amounts recognized in balance sheets: Intangible asset $ 3 $ 4 Accumulated other comprehensive income (24) (28) Pension plans with an accumulated benefit obligation in excess of plan assets: Projected benefit obligation $ 227 $ 211 Accumulated benefit obligation 183 164 Fair value of plan assets 59 45 Weighted-average assumptions at end of year: Discount rate 5.5% 5.5% Rate of compensation increase 5.0% 5.0%
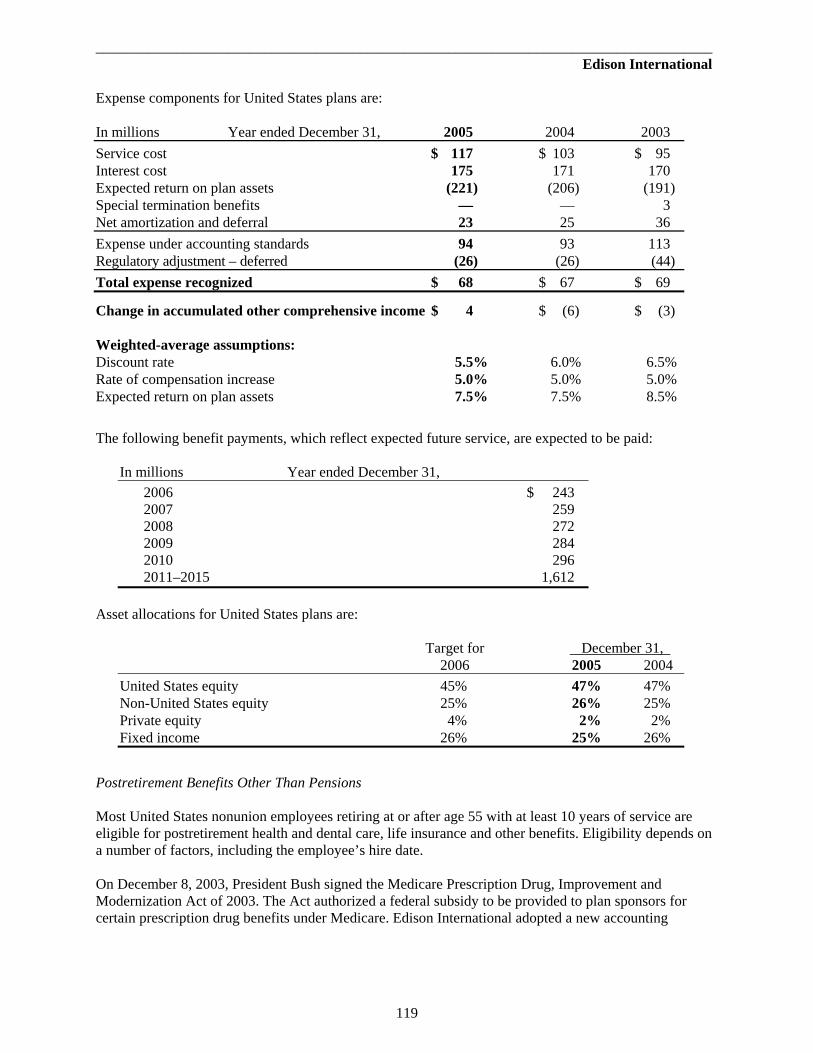
119
____________________________________________________________________________________ Edison International
Expense components for United States plans are: In millions Year ended December 31, 2005 2004 2003
Service cost $ 117 $ 103 $ 95 Interest cost 175 171 170 Expected return on plan assets (221) (206) (191) Special termination benefits — — 3 Net amortization and deferral 23 25 36
Expense under accounting standards 94 93 113 Regulatory adjustment – deferred (26) (26) (44)
Total expense recognized $ 68 $ 67 $ 69
Change in accumulated other comprehensive income $ 4 $ (6) $ (3) Weighted-average assumptions: Discount rate 5.5% 6.0% 6.5% Rate of compensation increase 5.0% 5.0% 5.0% Expected return on plan assets 7.5% 7.5% 8.5%
The following benefit payments, which reflect expected future service, are expected to be paid:
In millions Year ended December 31,
2006 $ 243 2007 259 2008 272 2009 284 2010 296 2011–2015 1,612
Asset allocations for United States plans are:
Target for December 31, 2006 2005 2004
United States equity 45% 47% 47% Non-United States equity 25% 26% 25% Private equity 4% 2% 2% Fixed income 26% 25% 26%
Postretirement Benefits Other Than Pensions Most United States nonunion employees retiring at or after age 55 with at least 10 years of service are eligible for postretirement health and dental care, life insurance and other benefits. Eligibility depends on a number of factors, including the employee’s hire date. On December 8, 2003, President Bush signed the Medicare Prescription Drug, Improvement and Modernization Act of 2003. The Act authorized a federal subsidy to be provided to plan sponsors for certain prescription drug benefits under Medicare. Edison International adopted a new accounting

120
____________________________________________________________________________________ Notes to Consolidated Financial Statements pronouncement for the effects of the Act, effective July 1, 2004, which reduced Edison International’s accumulated benefits obligation by $120 million upon adoption. The expected contributions (all by the employer) to the postretirement benefits other than pensions trust are $79 million for the year ended December 31, 2006. This amount is subject to change based on, among other things, the limits established for federal tax deductibility. Edison International uses a December 31 measurement date. The fair value of plan assets is determined by market value. Information on plan assets and benefit obligations is shown below: In millions Year ended December 31, 2005 2004
Change in benefit obligation Benefit obligation at beginning of year $ 2,212 $ 2,199 Service cost 46 42 Interest cost 123 126 Amendments (15) 30 Actuarial loss (gain) 48 (90) Benefits paid (57) (95)
Benefit obligation at end of year $ 2,357 $ 2,212
Change in plan assets Fair value of plan assets at beginning of year $ 1,465 $ 1,390 Actual return on assets 92 144 Employer contributions 73 26 Benefits paid (57) (95)
Fair value of plan assets at end of year $ 1,573 $ 1,465
Funded status $ (784) $ (747) Unrecognized net loss 869 858 Unrecognized prior service cost (284) (299)
Recorded liability $ (199) $ (188)
Assumed health care cost trend rates: Rate assumed for following year 10.25% 10.0% Ultimate rate 5.0% 5.0% Year ultimate rate reached 2011 2010 Weighted-average assumptions at end of year: Discount rate 5.5% 5.75%
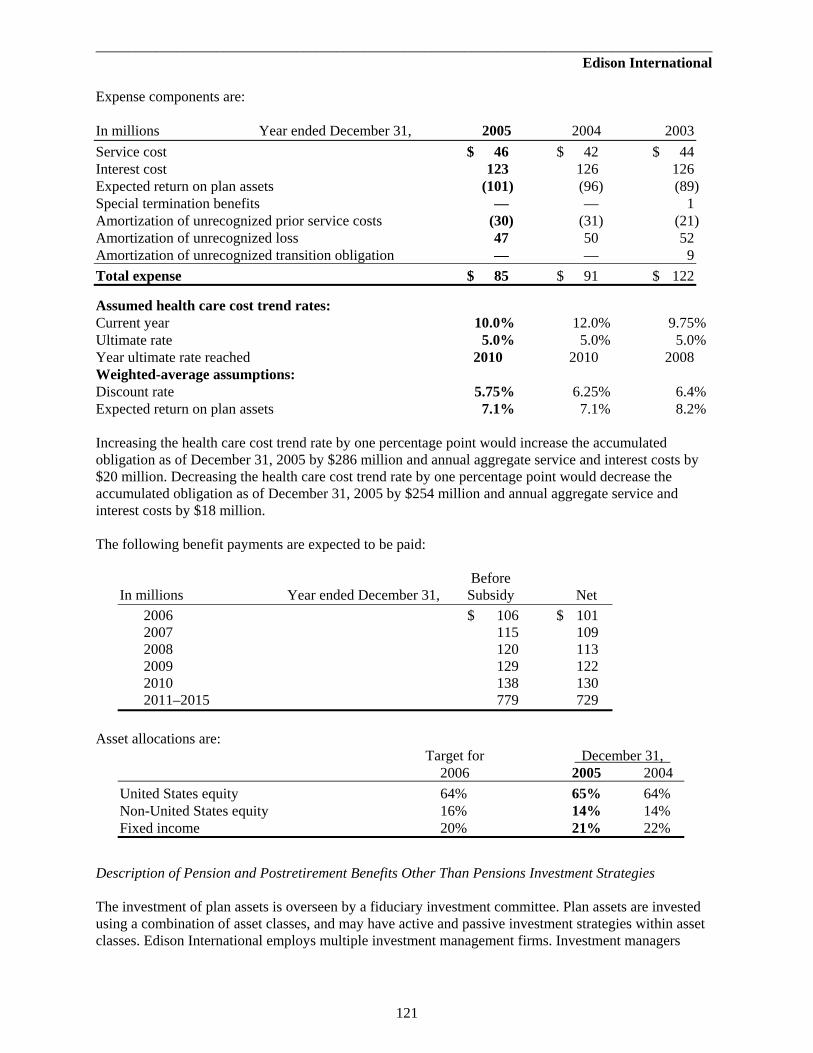
121
____________________________________________________________________________________________ Edison International
Expense components are: In millions Year ended December 31, 2005 2004 2003
Service cost $ 46 $ 42 $ 44 Interest cost 123 126 126 Expected return on plan assets (101) (96) (89) Special termination benefits — — 1 Amortization of unrecognized prior service costs (30) (31) (21) Amortization of unrecognized loss 47 50 52 Amortization of unrecognized transition obligation — — 9
Total expense $ 85 $ 91 $ 122
Assumed health care cost trend rates: Current year 10.0% 12.0% 9.75% Ultimate rate 5.0% 5.0% 5.0% Year ultimate rate reached 2010 2010 2008 Weighted-average assumptions: Discount rate 5.75% 6.25% 6.4% Expected return on plan assets 7.1% 7.1% 8.2% Increasing the health care cost trend rate by one percentage point would increase the accumulated obligation as of December 31, 2005 by $286 million and annual aggregate service and interest costs by $20 million. Decreasing the health care cost trend rate by one percentage point would decrease the accumulated obligation as of December 31, 2005 by $254 million and annual aggregate service and interest costs by $18 million. The following benefit payments are expected to be paid: Before
In millions Year ended December 31, Subsidy Net
2006 $ 106 $ 101 2007 115 109 2008 120 113 2009 129 122 2010 138 130 2011–2015 779 729
Asset allocations are:
Target for December 31, 2006 2005 2004
United States equity 64% 65% 64% Non-United States equity 16% 14% 14% Fixed income 20% 21% 22%
Description of Pension and Postretirement Benefits Other Than Pensions Investment Strategies The investment of plan assets is overseen by a fiduciary investment committee. Plan assets are invested using a combination of asset classes, and may have active and passive investment strategies within asset classes. Edison International employs multiple investment management firms. Investment managers

122
____________________________________________________________________________________ Notes to Consolidated Financial Statements within each asset class cover a range of investment styles and approaches. Risk is controlled through diversification among multiple asset classes, managers, styles and securities. Plan, asset class and individual manager performance is measured against targets. Edison International also monitors the stability of its investments managers’ organizations. Allowable investment types include: United States Equity: Common and preferred stock of large, medium, and small companies which are predominantly United States-based. Non-United States Equity: Equity securities issued by companies domiciled outside the United States and in depository receipts which represent ownership of securities of non-United States companies. Private Equity: Limited partnerships that invest in nonpublicly traded entities. Fixed Income: Fixed income securities issued or guaranteed by the United States government, non-United States governments, government agencies and instrumentalities, mortgage backed securities and corporate debt obligations. A small portion of the fixed income position may be held in debt securities that are below investment grade. Permitted ranges around asset class portfolio weights are plus or minus 5%. Where approved by the fiduciary investment committee, futures contracts are used for portfolio rebalancing and to approach fully invested portfolio positions. Where authorized, a few of the plan’s investment managers employ limited use of derivatives, including futures contracts, options, options on futures and interest rate swaps in place of direct investment in securities to gain efficient exposure to markets. Derivatives are not used to leverage the plans or any portfolios. Determination of the Expected Long-Term Rate of Return on Assets for United States Plans The overall expected long term rate of return on assets assumption is based on the target asset allocation for plan assets, capital markets return forecasts for asset classes employed, and active management excess return expectations. A portion of postretirement benefits other than pensions trust asset returns are subject to taxation, so the expected long-term rate of return for these assets is determined on an after-tax basis. Capital Markets Return Forecasts The estimated total return for fixed income is based on an equilibrium yield for intermediate United States government bonds plus a premium for exposure to nongovernment bonds in the broad fixed income market. The equilibrium yield is based on analysis of historic data and is consistent with experience over various economic environments. The premium of the broad market over United States government bonds is a historic average premium. The estimated rate of return for equity is estimated to be a 3% premium over the estimated total return of intermediate United States government bonds. This value is determined by combining estimates of real earnings growth, dividend yields and inflation, each of which was determined using historical analysis. The rate of return for private equity is estimated to be a 5% premium over public equity, reflecting a premium for higher volatility and illiquidity. Active Management Excess Return Expectations For asset classes that are actively managed, an excess return premium is added to the capital market return forecasts discussed above.

123
____________________________________________________________________________________ Edison International
Stock-Based Compensation Under various plans, Edison International may grant stock options at exercise prices equal to the market price at the grant date and other awards based on its common stock to directors and certain employees. Options generally expire 10 years after the grant date and vest over a period of up to five years, with expense accruing evenly over the vesting period. Edison International has approximately 12.5 million shares remaining for future issuance under equity compensation plans. Most Edison International stock options issued prior to 2000 accrue dividend equivalents, subject to certain performance criteria. The 2003, 2004 and 2005 options accrue dividend equivalents for the first five years of the option term. Unless deferred, dividend equivalents accumulate without interest. The fair value for each option granted, reflecting the basis for the pro forma disclosures in Note 1, was determined as of the grant date using the Black-Scholes option-pricing model. The following assumptions were used in determining fair value through the model:
December 31, 2005 2004 2003
Expected years until exercise 9 to 10 9 to 10 10 Risk-free interest rate 4.1% to 4.3% 4.0% to 4.3% 3.8% to 4.5% Expected dividend yield 2.1% to 3.1% 2.7 to 3.7% 1.8% Expected volatility 15% to 20% 19% to 22% 44% to 53%
A summary of the status of Edison International stock options is as follows: Weighted-Average Share Exercise Fair Value Options Price at Grant
Outstanding, Dec. 31, 2002 11,836,292 $21.46 Granted 3,819,930 $12.38 $7.31 Expired (482,394) $23.48 Forfeited (110,094) $15.02 Exercised (260,481) $17.67
Outstanding, Dec. 31, 2003 14,803,253 $19.17 Granted 4,550,344 $21.97 $6.60 Expired (6,194) $18.10 Forfeited (218,695) $17.63 Exercised (2,766,788) $17.25
Outstanding, Dec. 31, 2004 16,361,920 $20.30 Granted 3,508,487 $32.48 $9.45 Expired — — Forfeited (410,056) $21.78 Exercised (4,128,692) $20.49
Outstanding, Dec. 31, 2005 15,331,659 $22.99

124
____________________________________________________________________________________ Notes to Consolidated Financial Statements A summary of stock options outstanding at December 31, 2005 is as follows: Outstanding Exercisable Weighted Average Weighted Weighted Remaining Average Average Range of Number Years of Exercise Number Exercise Exercise Prices of Options Contractual Life Price of Options Price
$ 8.90–$13.99 2,833,514 7 $12.20 1,490,600 $12.13 $14.00–$20.99 2,365,309 5 $18.70 1,777,117 $18.72 $21.00–$31.49 6,780,259 6 $24.30 3,675,410 $26.27 $31.50–$46.87 3,352,577 9 $32.50 86,543 $33.12
Total 15,331,659 7 $22.99 7,029,670 $21.45
The number of options exercisable and their weighted-average exercise prices at December 31, 2004 and 2003 were 7,580,036 at $22.66 and 7,337,939 at $23.37, respectively. Performance shares were awarded to executives in January 2003, January 2004 and January 2005 and vest at the end of December 2005, 2006 and 2007, respectively. The number of common shares paid out from the performance share awards depends on the performance of Edison International common stock relative to the stock performance of a specified group of companies. Performance share values are accrued ratably over the vesting period based on the value of the underlying Edison International common stock. The number of performance shares granted and their weighted-average grant-date value for 2005, 2004 and 2003 were 261,642 at $32.32, 344,244 at $21.93, and 570,313 at $12.32, respectively. In the pro forma disclosure reflected in Note 1, the portions of these performance shares settled in stock, which were half of the total shares outstanding, were treated as equity awards. The weighted-average grant-date fair values of these performance shares were $46.09, $33.62 and $21.42, for 2005, 2004 and 2003, respectively. See Note 1 for Edison International’s accounting policy and expenses related to stock-based compensation. Note 7. Jointly Owned Utility Projects
SCE owns interests in several generating stations and transmission systems for which each participant provides its own financing. SCE’s share of expenses for each project is included on the consolidated statements of income.
SCE’s investment in each project as of December 31, 2005 is:
Accumulated Depreciation Investment and Ownership In millions in Facility Amortization Interest
Transmission systems: Eldorado $ 60 $ 9 60% Pacific Intertie 306 80 50 Generating stations: Four Corners Units 4 and 5 (coal) 499 407 48 Mohave (coal) 350 269 56 Palo Verde (nuclear) 1,710 1,468 16
San Onofre (nuclear) 4,522 3,956 75
Total $ 7,447 $ 6,189

125
____________________________________________________________________________________ Edison International
All of Mohave Generating Station and a portion of San Onofre and Palo Verde are included in regulatory assets on the consolidated balance sheets. See Note 1. Mohave ceased operations on December 31, 2005. At this time, SCE does not know the length of the shutdown period, and a permanent shutdown remains possible. Note 8. Commitments Leases Edison International has operating leases for office space, vehicles, property and other equipment (with varying terms, provisions and expiration dates). Unit-specific contracts (signed or modified after June 30, 2003) in which SCE takes virtually all of the output of a facility are generally considered to be leases under accounting rules. At December 31, 2005, SCE had six power contracts that were classified as operating leases and one power contract that was classified as a capital lease (executed in late 2005) under accounting rules. This capital lease (net commitment of $15 million) is reported as a long-term obligation on the consolidated balance sheet under “Other long-term liabilities.” During 2001, EME entered into a sale-leaseback of its Homer City facilities to third-party lessors for an aggregate purchase price of $1.6 billion, consisting of $782 million in cash and assumption of debt (with a fair value of $809 million). During 2000, EME entered into a sale-leaseback transaction for power facilities, located in Illinois, with third party lessors for an aggregate purchase price of $1.4 billion. The lease costs for the power facilities are levelized over the terms of the power facilities’ respective leases. The gain on the sale of the facilities, power plant and equipment has been deferred and is being amortized over the terms of the respective leases. Estimated remaining commitments (the majority of which are related to EME’s long-term leases for the Powerton, Joliet and Homer City power plants) for noncancelable operating leases at December 31, 2005 are: Operating
In millions Year ended December 31, Leases
2006 $ 554 2007 661 2008 628 2009 566 2010 548 Thereafter 2,988
Total $ 5,945
Operating lease expense was $289 million in 2005, $228 million in 2004 and $257 million in 2003. Nuclear Decommissioning As a result of an accounting standard adopted in 2003, SCE recorded the fair value of its liability for AROs, primarily related to the decommissioning of its nuclear power facilities. At that time, SCE adjusted its nuclear decommissioning obligation, capitalized the initial costs of the ARO into a nuclear-
126
____________________________________________________________________________________ Notes to Consolidated Financial Statements related ARO regulatory asset, and also recorded an ARO regulatory liability as a result of timing differences between the recognition of costs recorded in accordance with the standard and the recovery of the related asset retirement costs through the rate-making process. SCE has collected in rates amounts for the future costs of removal of its nuclear assets, and has placed those amounts in independent trusts. The fair value of decommissioning SCE’s nuclear power facilities is $2.6 billion as of December 31, 2005, based on site-specific studies performed in 2005 for San Onofre and Palo Verde. Changes in the estimated costs, timing of decommissioning, or the assumptions underlying these estimates could cause material revisions to the estimated total cost to decommission. SCE estimates that it will spend approximately $11.4 billion through 2049 to decommission its active nuclear facilities. This estimate is based on SCE’s decommissioning cost methodology used for rate-making purposes, escalated at rates ranging from 1.7% to 7.5% (depending on the cost element) annually. These costs are expected to be funded from independent decommissioning trusts, which effective October 2003 receive contributions of approximately $32 million per year. SCE estimates annual after-tax earnings on the decommissioning funds of 4.5% to 5.6%. If the assumed return on trust assets is not earned, additional funds needed for decommissioning will be recoverable through rates. Decommissioning of San Onofre Unit 1 is underway and will be completed in three phases: (1) decontamination and dismantling of all structures and some foundations; (2) spent fuel storage monitoring; and (3) fuel storage facility dismantling, removal of remaining foundations, and site restoration. Phase one is scheduled to continue through 2008. Phase two is expected to continue until 2026. Phase three will be conducted concurrently with the San Onofre Units 2 and 3 decommissioning projects. In February 2004, SCE announced that it discontinued plans to ship the San Onofre Unit 1 reactor pressure vessel to a disposal site until such time as appropriate arrangements are made for its permanent disposal. It will continue to be stored at its current location at San Onofre Unit 1. This action results in placing the disposal of the reactor pressure vessel in Phase three of the San Onofre Unit 1 decommissioning project. All of SCE’s San Onofre Unit 1 decommissioning costs will be paid from its nuclear decommissioning trust funds and are subject to CPUC review. The estimated remaining cost to decommission San Onofre Unit 1 is recorded as an ARO liability ($186 million at December 31, 2005). Total expenditures for the decommissioning of San Onofre Unit 1 were $414 million from the beginning of the project in 1998 through December 31, 2005. SCE plans to decommission its nuclear generating facilities by a prompt removal method authorized by the Nuclear Regulatory Commission. Decommissioning is expected to begin after the plants’ operating licenses expire. The operating licenses currently expire in 2022 for San Onofre Units 2 and 3, and in 2025, 2026 and 2027 for the Palo Verde units. Decommissioning costs, which are recovered through nonbypassable customer rates over the term of each nuclear facility’s operating license, are recorded as a component of depreciation expense, with a corresponding credit to the ARO regulatory liability. The earnings impact of amortization of the ARO asset included within the unamortized nuclear investment and accretion of the ARO liability, both created under this new standard, are deferred as increases to the ARO regulatory liability account, with no impact on earnings. SCE has collected in rates amounts for the future costs of removal of its nuclear assets. The cost of removal amounts, in excess of fair value collected for assets not legally required to be removed, are classified as regulatory liabilities. Decommissioning expense under the rate-making method was $118 million in 2005, $125 million in 2004 and $118 million in 2003. The ARO for decommissioning SCE’s active nuclear facilities was $2.4 billion at December 31, 2005 and $2.0 billion at December 31, 2004.

127
____________________________________________________________________________________ Edison International
Decommissioning funds collected in rates are placed in independent trusts, which, together with accumulated earnings, will be utilized solely for decommissioning. Trust investments (at fair value) include:
In millions Maturity Dates December 31, 2005 2004
Municipal bonds 2006 – 2039 $ 863 $ 784 Stock – 1,451 1,403 United States government issues 2006 – 2035 479 485 Corporate bonds 2006 – 2045 42 41 Short-term 2006 72 44
Total $ 2,907 $ 2,757
Note: Maturity dates as of December 31, 2005. Trust fund earnings (based on specific identification) increase the trust fund balance and the ARO regulatory liability. Net earnings (loss) were $87 million in 2005, $91 million in 2004 and $93 million in 2003. Proceeds from sales of securities (which are reinvested) were $2.0 billion in 2005, $2.5 billion in 2004 and $2.2 billion in 2003. Net unrealized holding gains were $852 million and $796 million at December 31, 2005 and 2004, respectively. Approximately 91% of the cumulative trust fund contributions were tax-deductible. Other Commitments SCE and EME have fuel supply contracts which require payment only if the fuel is made available for purchase. SCE has a coal fuel contract that requires payment of certain fixed charges whether or not coal is delivered. At December 31, 2005, EME had a contractual commitment to transport natural gas. EME is committed to pay minimum fees under this agreement, which has a remaining contract length of 12 years. At December 31, 2005, EME’s subsidiaries had contractual commitments for the transport of coal to their respective facilities, with remaining contract lengths that range from one year to six years. EME is committed to pay minimum fees under these agreements. SCE has power-purchase contracts with certain QFs (cogenerators and small power producers) and other power producers. These contracts provide for capacity payments if a facility meets certain performance obligations and energy payments based on actual power supplied to SCE (the energy payments are not included in the table below). There are no requirements to make debt-service payments. In an effort to replace higher-cost contract payments with lower-cost replacement power, SCE has entered into purchased-power settlements to end its contract obligations with certain QFs. The settlements are reported as power purchase contracts on the consolidated balance sheets. Certain commitments for the years 2006 through 2010 are estimated below:
In millions 2006 2007 2008 2009 2010
Fuel supply $ 493 $ 404 $ 211 $ 134 $ 111 Gas and coal transportation payments 234 224 93 84 85 Purchased power 842 775 528 417 393

128
____________________________________________________________________________________ Notes to Consolidated Financial Statements SCE has an unconditional purchase obligation for firm transmission service from another utility. Minimum payments are based, in part, on the debt-service requirements of the transmission service provider, whether or not the transmission line is operable. The contract requires minimum payments of $62 million through 2016 (approximately $6 million per year). At December 31, 2005, in connection with wind projects in development, EME had entered into agreements with two turbine vendors securing 105 turbines for $114 million in 2006 and $78 million in 2007. In addition, EME has options to acquire an additional 100 turbines for deliveries in 2007. At December 31, 2005, Midwest Generation was party to a long-term power purchase contract with Calumet Energy Team LLC entered into as part of the settlement agreement with Commonwealth Edison, which terminated Midwest Generation’s obligation to build additional gas-fired generation in the Chicago area. The contract requires Midwest Generation to pay a monthly capacity payment and gives Midwest Generation an option to purchase energy from Calumet Energy Team at prices based primarily on operations and maintenance and fuel costs. These minimum commitments are estimated to be $4 million for each of the next five years.
Guarantees and Indemnities Edison International’s subsidiaries have various financial and performance guarantees and indemnifications which are issued in the normal course of business. As discussed below, these contracts included performance guarantees, guarantees of debt and indemnifications. Tax Indemnity Agreements In connection with the sale-leaseback transactions that EME has entered into related to the Collins Station in Illinois, the Powerton and Joliet Stations in Illinois and the Homer City facilities in Pennsylvania, EME and several of its subsidiaries entered into tax indemnity agreements. Under these tax indemnity agreements, these entities agreed to indemnify the lessors in the sale-leaseback transactions for specified adverse tax consequences that could result in certain situations set forth in each tax indemnity agreement, including specified defaults under the respective leases. The potential indemnity obligations under these tax indemnity agreements could be significant. Due to the nature of these potential obligations, EME cannot determine a maximum potential liability which would be triggered by a valid claim from the lessors. EME has not recorded a liability related to these indemnities. In connection with the termination of the Collins Station lease in 2004 (see Note 14), Midwest Generation will continue to have obligations under the tax indemnity agreement with the former lease equity investor. Indemnities Provided as Part of EME’s Acquisition of the Illinois Plants In connection with the acquisition of the Illinois plants, EME agreed to indemnify Commonwealth Edison with respect to specified environmental liabilities before and after December 15, 1999, the date of sale. The indemnification claims are reduced by any insurance proceeds and tax benefits related to such claims and are subject to a requirement that Commonwealth Edison takes all reasonable steps to mitigate losses related to any such indemnification claim. Due to the nature of the obligation under this indemnity, a maximum potential liability cannot be determined. This indemnification for environmental liabilities is not limited in term and would be triggered by a valid claim from Commonwealth Edison. Except as discussed below, EME has not recorded a liability related to this indemnity. Midwest Generation entered into a supplemental agreement with Commonwealth Edison and Exelon Generation Company on February 20, 2003 to resolve a dispute regarding interpretation of its reimbursement obligation for asbestos claims under the environmental indemnities set forth in the asset sale agreement. Under this supplemental agreement, Midwest Generation agreed to reimburse

129
____________________________________________________________________________________ Edison International
Commonwealth Edison and Exelon Generation for 50% of specific existing asbestos claims and expenses less recovery of insurance costs, and agreed to a sharing arrangement for liabilities and expenses associated with future asbestos-related claims as specified in the agreement. As a general matter, Commonwealth Edison and Midwest Generation apportion responsibility for future asbestos-related claims based upon the number of exposure sites that are Commonwealth Edison locations or Midwest Generation locations. The obligations under this agreement are not subject to a maximum liability. The supplemental agreement has a five-year term with an automatic renewal provision (subject to the right of either party to terminate). Payments are made under this indemnity upon tender by Commonwealth Edison of appropriate proof of liability for an asbestos-related settlement, judgment, verdict, or expense. There were between 185 and 195 cases for which Midwest Generation was potentially liable and that had not been settled and dismissed at December 31, 2005. Midwest Generation had recorded a $67 million and $69 million liability at December 31, 2005 and 2004, respectively, related to this matter. The amounts recorded by Midwest Generation for the asbestos-related liability are based upon a number of assumptions. Future events, such as the number of new claims to be filed each year, the average cost of disposing of claims, as well as the numerous uncertainties surrounding asbestos litigation in the United States, could cause the actual costs to be higher or lower than projected. Indemnity Provided as Part of EME’s Acquisition of the Homer City Facilities In connection with the acquisition of the Homer City facilities, EME Homer City Generation L.P. (EME Homer City) agreed to indemnify the sellers with respect to specific environmental liabilities before and after the date of sale. EME guaranteed the obligations of EME Homer City. Due to the nature of the obligation under this indemnity provision, it is not subject to a maximum potential liability and does not have an expiration date. Payments would be triggered under this indemnity by a claim from the sellers. EME has not recorded a liability related to this indemnity. Indemnities Provided Under Asset Sale Agreements The asset sale agreements for the sale of EME’s international assets contain indemnities from EME to the purchasers, including indemnification for taxes imposed with respect to operations of the assets prior to the sale and for pre-closing environmental liabilities. EME also provided an indemnity to IPM for matters arising out of the exercise by one of its project partners of a purported right of first refusal. The right of first refusal matter has been submitted to arbitration, with hearings having been conducted during February 2006. It is expected that a decision of the arbitration panel will be rendered in the coming months. Not all indemnities under the asset sale agreements have specific expiration dates. Payments would be triggered under these indemnities by valid claims from the sellers or purchasers, as the case may be. At December 31, 2005 and 2004, EME had recorded a liability of $122 million and $87 million, respectively, related to these matters. In connection with the sale of various domestic assets, EME has from time to time provided indemnities to the purchasers for taxes imposed with respect to operations of the asset prior to the sale. EME has also provided indemnities to purchasers for items specified in each agreement (for example, specific pre-existing litigation matters and/or environmental conditions). Due to the nature of the obligations under these indemnity agreements, a maximum potential liability cannot be determined. Not all indemnities under the asset sale agreements have specific expiration dates. Payments would be triggered under these indemnities by valid claims from the sellers or purchasers, as the case may be. EME has not recorded a liability related to these indemnities.

130
____________________________________________________________________________________ Notes to Consolidated Financial Statements Capacity Indemnification Agreements EME has guaranteed, jointly and severally with Texaco Inc., the obligations of March Point Cogeneration Company under its project power sales agreements to repay capacity payments to the project’s power purchaser in the event that the power sales agreements terminate, March Point Cogeneration Company abandons the project, or the project fails to return to normal operations within a reasonable time after a complete or partial shutdown, during the term of the power sales agreements. In addition, a subsidiary of EME has guaranteed the obligations of Sycamore Cogeneration Company under its project power sales agreement to repay capacity payments to the project’s power purchaser in the event that the project unilaterally terminates its performance or reduces its electric power producing capability during the term of the power sales agreements. The obligations under the indemnification agreements as of December 31, 2005, if payment were required, would be $124 million. EME has not recorded a liability related to these indemnities. Indemnity Provided as Part of the Acquisition of Mountainview In connection with the acquisition of Mountainview, SCE agreed to indemnify the seller with respect to specific environmental claims related to SCE’s previously owned San Bernardino Generating Station, divested by SCE in 1998 and reacquired as part of the Mountainview acquisition. The generating station has not operated since early 2001. SCE retained certain responsibilities with respect to environmental claims as part of the original divestiture of the station. The aggregate liability for either party to the purchase agreement for damages and other amounts is a maximum of $60 million. This indemnification for environmental liabilities expires on or before March 12, 2033. SCE has not recorded a liability related to this indemnity. Other SCE Indemnities SCE provides other indemnifications through contracts entered into in the normal course of business. These are primarily indemnifications against adverse litigation outcomes in connection with underwriting agreements, and specified environmental indemnities and income taxes with respect to assets sold. SCE’s obligations under these agreements may be limited in terms of time and/or amount, and in some instances SCE may have recourse against third parties for certain indemnities. The obligated amounts of these indemnifications often are not explicitly stated, and the overall maximum amount of the obligation under these indemnifications cannot be reasonably estimated. SCE has not recorded a liability related to these indemnities. Note 9. Contingencies In addition to the matters disclosed in these Notes, Edison International is involved in other legal, tax and regulatory proceedings before various courts and governmental agencies regarding matters arising in the ordinary course of business. Edison International believes the outcome of these other proceedings will not materially affect its results of operations or liquidity. Environmental Remediation Edison International is subject to numerous environmental laws and regulations, which require it to incur substantial costs to operate existing facilities, construct and operate new facilities, and mitigate or remove the effect of past operations on the environment. Edison International believes that it is in substantial compliance with environmental regulatory requirements; however, possible future developments, such as the enactment of more stringent environmental laws and regulations, could affect the costs and the manner in which business is conducted
131
____________________________________________________________________________________ Edison International
and could cause substantial additional capital expenditures. There is no assurance that additional costs would be recovered from customers or that Edison International’s financial position and results of operations would not be materially affected. Edison International records its environmental remediation liabilities when site assessments and/or remedial actions are probable and a range of reasonably likely cleanup costs can be estimated. Edison International reviews its sites and measures the liability quarterly, by assessing a range of reasonably likely costs for each identified site using currently available information, including existing technology, presently enacted laws and regulations, experience gained at similar sites, and the probable level of involvement and financial condition of other potentially responsible parties. These estimates include costs for site investigations, remediation, operations and maintenance, monitoring and site closure. Unless there is a probable amount, Edison International records the lower end of this reasonably likely range of costs (classified as other long-term liabilities) at undiscounted amounts. Edison International’s recorded estimated minimum liability to remediate its 34 identified sites at SCE (24 sites) and EME (10 sites related to Midwest Generation) is $84 million, $82 million of which is related to SCE. Edison International’s other subsidiaries have no identified remediation sites. The ultimate costs to clean up Edison International’s identified sites may vary from its recorded liability due to numerous uncertainties inherent in the estimation process, such as: the extent and nature of contamination; the scarcity of reliable data for identified sites; the varying costs of alternative cleanup methods; developments resulting from investigatory studies; the possibility of identifying additional sites; and the time periods over which site remediation is expected to occur. Edison International believes that, due to these uncertainties, it is reasonably possible that cleanup costs could exceed its recorded liability by up to $115 million, all of which is related to SCE. The upper limit of this range of costs was estimated using assumptions least favorable to Edison International among a range of reasonably possible outcomes. In addition to its identified sites (sites in which the upper end of the range of costs is at least $1 million), SCE also has 31 immaterial sites whose total liability ranges from $4 million (the recorded minimum liability) to $9 million. The CPUC allows SCE to recover environmental remediation costs at certain sites, representing $30 million of its recorded liability, through an incentive mechanism (SCE may request to include additional sites). Under this mechanism, SCE will recover 90% of cleanup costs through customer rates; shareholders fund the remaining 10%, with the opportunity to recover these costs from insurance carriers and other third parties. SCE has successfully settled insurance claims with all responsible carriers. SCE expects to recover costs incurred at its remaining sites through customer rates. SCE has recorded a regulatory asset of $56 million for its estimated minimum environmental-cleanup costs expected to be recovered through customer rates. Edison International’s identified sites include several sites for which there is a lack of currently available information, including the nature and magnitude of contamination, and the extent, if any, that Edison International may be held responsible for contributing to any costs incurred for remediating these sites. Thus, no reasonable estimate of cleanup costs can be made for these sites. Edison International expects to clean up its identified sites over a period of up to 30 years. Remediation costs in each of the next several years are expected to range from $11 million to $25 million. Recorded costs for 2005 were $13 million. Based on currently available information, Edison International believes it is unlikely that it will incur amounts in excess of the upper limit of the estimated range for its identified sites and, based upon the CPUC’s regulatory treatment of environmental remediation costs incurred at SCE, Edison International believes that costs ultimately recorded will not materially affect its results of operations or financial

132
____________________________________________________________________________________ Notes to Consolidated Financial Statements position. There can be no assurance, however, that future developments, including additional information about existing sites or the identification of new sites, will not require material revisions to such estimates. Federal Income Taxes Edison International has reached a settlement with the IRS on tax issues and pending affirmative claims relating to its 1991–1993 tax years. This settlement, which was signed by Edison International in March 2005 and approved by the United States Congress Joint Committee on Taxation on July 27, 2005, resulted in a third quarter 2005 net earnings benefit for Edison International of approximately $65 million, including interest, most of which relates to SCE. This benefit was reflected in the caption “Income tax (benefit)” on the consolidated statements of income. Edison International received Revenue Agent Reports from the IRS in August 2002 and in January 2005 asserting deficiencies in federal corporate income taxes with respect to audits of its 1994–1996 and 1997–1999 tax years, respectively. Many of the asserted tax deficiencies are timing differences and, therefore, amounts ultimately paid (exclusive of penalties), if any, would be deductible on future tax returns of Edison International. As part of a nationwide challenge of certain types of lease transactions, the IRS has raised issues about the deferral of income taxes associated with Edison Capital’s cross-border, leveraged leases. The IRS is challenging Edison Capital’s foreign power plant and electric locomotive sale/leaseback transactions entered into in 1993 and 1994 (Replacement Leases, which the IRS refers to as a sale-in/lease-out or SILO). The IRS is also challenging Edison Capital’s foreign power plant and electric transmission system lease/leaseback transactions entered into in 1997 and 1998 (Lease/Leaseback, which the IRS refers to as a lease-in/lease-out or LILO). Edison Capital also entered into a lease/service contract transaction in 1999 involving a foreign telecommunication system (Service Contract, which the IRS also refers to as a SILO). The IRS did not yet assert an adjustment for the Service Contract but is expected to challenge the Service Contract in subsequent audit cycles. The following table summarizes estimated federal and state income taxes deferred from these leases. Repayment of these deferred taxes would be accelerated if the IRS prevails: In millions
Tax Years Under Appeal 1994 – 1999
Unaudited Tax Years 2000 – 2005
Total
Replacement Leases (SILO) $ 44 $ 36 $ 80 Lease/Leaseback (LILO) 558 570 1,128 Service Contract (SILO) — 272 272 $ 602 $878 $ 1,480 Edison International believes it properly reported these transactions based on applicable statutes, regulations and case law in effect at the time the transactions were entered into, and it is vigorously defending its tax treatment of these leases. Written protests were filed to appeal the audit adjustments for the tax years under appeal asserting that the IRS’s position misstates material facts, misapplies the law and is incorrect. This matter is now being considered by the Administrative Appeals branch of the IRS. If Edison International is not successful in its defense of the tax treatment for these lease transactions, the payment of taxes, exclusive of any interest or penalties, would not affect results of operations under current accounting standards; however, the imposition of interest and any penalties at 20% of any tax adjustment sustained by the IRS would have a material impact on earnings. As of December 31, 2005, the

133
____________________________________________________________________________________ Edison International
interest on the proposed tax adjustments (excluding penalties) is estimated to be $323 million. Moreover, the FASB is currently considering changes to the accounting for leveraged leases which, if adopted, will be applicable to those leases where the tax treatment or the timing of the realization of tax benefits associated with them is altered. Under the proposed accounting rule, a change in the timing of expected cash flows related to these lease, including the realization of the tax benefits, would require the recalculation of the income allocated over the life of the lease, with the cumulative effect of the change recognized immediately. This could result in a material charge against earnings, although future income would be expected to increase over the remaining terms of the affected leases. In addition, the payment of taxes, interest and penalties could have a significant impact on cash flow. In connection with litigation of this matter, Edison International may pay a portion of the taxes plus interest and penalties and then seek a refund that accrues interest to the extent it prevails. At this time, Edison International is unable to predict the impact of the ultimate resolution of these matters. The IRS Revenue Agent Report for the 1997–1999 audit also asserted deficiencies with respect to a transaction entered into by an SCE subsidiary which may be considered substantially similar to a listed transaction described by the IRS as a contingent liability company. While Edison International intends to defend its tax return position with respect to this transaction, the tax benefits relating to the capital loss deductions will not be claimed for financial accounting and reporting purposes until and unless these tax losses are sustained. In April 2004, Edison International filed California Franchise Tax amended returns for tax years 1997 through 2002 to abate the possible imposition of new California penalty provisions on transactions that may be considered as listed or substantially similar to listed transactions described in an IRS notice that was published in 2001. These transactions include certain Edison Capital leveraged lease transactions and the SCE subsidiary contingent liability company transaction described above. Edison International filed these amended returns under protest retaining its appeal rights. FERC Refund Proceedings In 2000, the FERC initiated an investigation into the justness and reasonableness of rates charged by sellers of electricity in the California Power Exchange (PX) and ISO markets. On March 26, 2003, the FERC staff issued a report concluding that there had been pervasive gaming and market manipulation of both the electric and natural gas markets in California and on the West Coast during 2000–2001 and describing many of the techniques and effects of that market manipulation. SCE is participating in several related proceedings seeking recovery of refunds from sellers of electricity and natural gas who manipulated the electric and natural gas markets. SCE is required to refund to customers 90% of any refunds actually realized by SCE net of litigation costs, except for the El Paso Natural Gas Company settlement agreement discussed below, and 10% will be retained by SCE as a shareholder incentive. A brief summary of the various settlements is below: • In June 2004, SCE received its first settlement payment of $76 million resulting from a settlement
agreement with El Palo Natural Gas Company. Approximately $66 million of this amount was credited to purchased-power expense, and was refunded to SCE’s ratepayers through the energy resource recovery account (ERRA) mechanism over the following twelve months, and the remaining $10 million was used to offset SCE’s incurred legal costs. In May 2005, SCE received its final settlement payment of $66 million, which was also refunded to ratepayers through the ERRA mechanism.
• In August 2004, SCE received its $37 million share of settlement proceeds resulting from a FERC-approved settlement agreement with The Williams Cos. and Williams Power Company.

134
____________________________________________________________________________________ Notes to Consolidated Financial Statements • In November 2004, SCE received its $42 million share of settlement proceeds resulting from a
FERC-approved settlement agreement with West Coast Power, LLC and its owners, Dynegy Inc. and NRG Energy, Inc.
• In January 2005, SCE received its $45 million share of settlement proceeds resulting from a FERC-
approved settlement agreement with Duke Energy Corporation and a number of its affiliates. • In April 2005, the FERC approved a settlement agreement among SCE, Pacific Gas and Electric
(PG&E), San Diego Gas & Electric (SDG&E) and several governmental entities, and Mirant Corporation and a number of its affiliates (collectively Mirant), all of whom are debtors in Chapter 11 bankruptcy proceedings pending in Texas. In April and May 2005, SCE received its $68 million share of the cash portion of the settlement proceeds. SCE also received a $33 million share of an allowed, unsecured claim in the bankruptcy of one of the Mirant parties which was sold for $35 million in December 2005.
• In November 2005, the FERC approved a settlement agreement among SCE, PG&E, SDG&E and
several governmental entities, and Enron Corporation and a number of its affiliates (collectively Enron), most of which are debtors in Chapter 11 bankruptcy proceedings pending in New York. In January 2006, SCE received cash settlement proceeds of $4 million and anticipates receiving approximately $5 million in additional cash proceeds assuming certain contingencies are satisfied. SCE also received an allowed, unsecured claim against one of the Enron debtors in the amount of $241 million. In February 2006, SCE received a partial distribution of $10 million of its allowed claim. The remaining amount of the allowed claim that will actually be realized will depend on events in Enron’s bankruptcy that impact the value of the relevant debtor estate.
• In December 2005, the FERC approved a settlement agreement among SCE, PG&E, SDG&E, several
governmental entities and certain other parties, and Reliant Energy, Inc. and a number of its affiliates (collectively Reliant). In January 2006, SCE received its $65 million share of the settlement proceeds. SCE expects to receive an additional $66 million in 2006.
On November 19, 2004, the CPUC issued a resolution authorizing SCE to establish an energy settlement memorandum account (ESMA) for the purpose of recording the foregoing settlement proceeds (excluding the El Paso settlement) from energy providers and allocating them in accordance with a settlement agreement. The resolution provides a mechanism whereby portions of the settlement proceeds recorded in the ESMA are allocated to recovery of SCE’s litigation costs and expenses in the FERC refund proceedings described above and the 10% shareholder incentive. Remaining amounts for each settlement are to be refunded to ratepayers through the ERRA mechanism. During 2005, SCE recognized $23 million in shareholder incentives related to the FERC refunds described above. Investigations Regarding Performance Incentives Rewards SCE is eligible under its CPUC-approved performance-based ratemaking (PBR) mechanism to earn rewards or penalties based on its performance in comparison to CPUC-approved standards of customer satisfaction, employee injury and illness reporting, and system reliability. SCE has been conducting investigations into its performance under these PBR mechanisms and has reported to the CPUC certain findings of misconduct and misreporting as further discussed below. As a result of the reported events, the CPUC could institute its own proceedings to determine whether and in what amounts to order refunds or disallowances of past and potential PBR rewards for customer satisfaction, injury and illness reporting, and system reliability portions of PBR. The CPUC also may consider whether to impose additional penalties on SCE. SCE cannot predict with certainty the outcome

135
____________________________________________________________________________________ Edison International
of these matters or estimate the potential amount of refunds, disallowances, and penalties that may be required. Customer Satisfaction SCE received two letters in 2003 from one or more anonymous employees alleging that personnel in the service planning group of SCE’s transmission and distribution business unit altered or omitted data in attempts to influence the outcome of customer satisfaction surveys conducted by an independent survey organization. The results of these surveys are used, along with other factors, to determine the amounts of any incentive rewards or penalties to SCE under the PBR provisions for customer satisfaction. SCE recorded aggregate customer satisfaction rewards of $28 million for the years 1998, 1999 and 2000. Potential customer satisfaction rewards aggregating $10 million for the years 2001 and 2002 are pending before the CPUC and have not been recognized in income by SCE. SCE also anticipated that it could be eligible for customer satisfaction rewards of approximately $10 million for 2003. Following its internal investigation, SCE proposed to refund to ratepayers $7 million of the PBR rewards previously received and forgo an additional $5 million of the PBR rewards pending that are both attributable to the design organization’s portion of the customer satisfaction rewards for the entire PBR period (1997–2003). In addition, SCE also proposed to refund all of the approximately $2 million of customer satisfaction rewards associated with meter reading. As a result of these findings, SCE accrued a $9 million charge in 2004 for the potential refunds of rewards that have been received. SCE has taken remedial action as to the customer satisfaction survey misconduct by severing the employment of several supervisory personnel, updating system process and related documentation for survey reporting, and implementing additional supervisory controls over data collection and processing. Performance incentive rewards for customer satisfaction expired in 2003 pursuant to the 2003 general rate case. The CPUC has not yet opened a formal investigation into this matter. However, it has submitted several data requests to SCE and has requested an opportunity to interview a number of SCE employees in the design organization. SCE has responded to these requests and the CPUC has conducted interviews of approximately 20 employees who were disciplined for misconduct and four senior managers and executives of the transmission and distribution business unit. Employee Injury and Illness Reporting In light of the problems uncovered with the customer satisfaction surveys, SCE conducted an investigation into the accuracy of SCE’s employee injury and illness reporting. The yearly results of employee injury and illness reporting to the CPUC are used to determine the amount of the incentive reward or penalty to SCE under the PBR mechanism. Since the inception of PBR in 1997, SCE has received $20 million in employee safety incentives for 1997 through 2000 and, based on SCE’s records, may be entitled to an additional $15 million for 2001 through 2003. On October 21, 2004, SCE reported to the CPUC and other appropriate regulatory agencies certain findings concerning SCE’s performance under the PBR incentive mechanism for injury and illness reporting. SCE disclosed in the investigative findings to the CPUC that SCE failed to implement an effective recordkeeping system sufficient to capture all required data for first aid incidents. As a result of these findings, SCE proposed to the CPUC that it not collect any reward under the mechanism for any year before 2005, and it return to ratepayers the $20 million it has already received.
136
____________________________________________________________________________________ Notes to Consolidated Financial Statements Therefore, SCE accrued a $20 million charge in 2004 for the potential refund of these rewards. SCE has also proposed to withdraw the pending rewards for the 2001–2003 time frames. SCE has taken other remedial action to address the issues identified, including revising its organizational structure and overall program for environmental, health and safety compliance and disciplining employees who committed wrongdoing. SCE submitted a report on the results of its investigation to the CPUC on December 3, 2004. As with the customer satisfaction matter, the CPUC has not yet opened a formal investigation into this matter. ISO Disputed Charges On April 20, 2004, the FERC issued an order concerning a dispute between the ISO and the Cities of Anaheim, Azusa, Banning, Colton and Riverside, California over the proper allocation and characterization of certain charges. The order reversed an arbitrator’s award that had affirmed the ISO’s characterization in May 2000 of the charges as Intra-Zonal Congestion costs and allocation of those charges to scheduling coordinators (SCs) in the affected zone within the ISO transmission grid. The April 20, 2004 order directed the ISO to shift the costs from SCs in the affected zone to the responsible participating transmission owner, SCE. The potential cost to SCE, net of amounts SCE expects to receive through the PX, SCE’s SC at the time, is estimated to be approximately $20 million to $25 million, including interest. On April 20, 2005, the FERC stayed its April 20, 2004 order during the pendency of SCE’s appeal filed with the Court of Appeals for the D.C. Circuit. On February 7, 2006, the FERC advised SCE that the FERC will move the Court of Appeals for a voluntary remand so that the FERC may amend the order on appeal. A decision is expected in late 2006. The FERC may require SCE to pay these costs, but SCE does not believe this outcome is probable. If SCE is required to pay these costs, SCE may seek recovery in its reliability service rates. Leveraged Lease Investments Edison Capital has a net leveraged lease investment, before deferred taxes, of $58 million in three aircraft leased to American Airlines. American Airlines has reported net losses since 2000. A default in the leveraged lease by American Airlines could result in a loss of some or all of Edison Capital’s lease investment. At December 31, 2005, American Airlines was current in its lease payments to Edison Capital. Edison Capital also has a net leveraged lease investment, before deferred taxes, of $43 million in a large natural gas-fired cogeneration plant leased to Midland Cogeneration Venture. During 2005, Midland Cogeneration Venture wrote down the book value of the power plant as a result of a substantial increase in long-term natural gas prices. A default of the lease could result in a loss of some or all of Edison Capital’s lease investment. At December 31, 2005, Midland Cogeneration Venture was current in its payments under the lease. Navajo Nation Litigation In June 1999, the Navajo Nation filed a complaint in the United States District Court for the District of Columbia (D.C. District Court) against Peabody Holding Company (Peabody) and certain of its affiliates, Salt River Project Agricultural Improvement and Power District, and SCE arising out of the coal supply agreement for Mohave. The complaint asserts claims for, among other things, violations of the federal Racketeer Influenced and Corrupt Organizations statute, interference with fiduciary duties and contractual relations, fraudulent misrepresentation by nondisclosure, and various contract-related claims. The complaint claims that the defendants’ actions prevented the Navajo Nation from obtaining the full value in royalty rates for the coal supplied to Mohave. The complaint seeks damages of not less than $600 million, trebling of that amount, and punitive damages of not less than $1 billion, as well as a declaration that Peabody’s lease and contract rights to mine coal on Navajo Nation lands should be terminated. SCE joined Peabody’s motion to strike the Navajo Nation’s complaint. In addition, SCE and

137
____________________________________________________________________________________ Edison International
other defendants filed motions to dismiss. The D.C. District Court denied these motions for dismissal, except for Salt River Project Agricultural Improvement and Power District’s motion for its separate dismissal from the lawsuit. Certain issues related to this case were addressed by the United States Supreme Court in a separate legal proceeding filed by the Navajo Nation in the United States Court of Federal Claims against the United States Department of Interior. In that action, the Navajo Nation claimed that the Government breached its fiduciary duty concerning negotiations relating to the coal lease involved in the Navajo Nation’s lawsuit against SCE and Peabody. On March 4, 2003, the Supreme Court concluded, by majority decision, that there was no breach of a fiduciary duty and that the Navajo Nation did not have a right to relief against the Government. Based on the Supreme Court’s conclusion, SCE and Peabody brought motions to dismiss or for summary judgment in the D.C. District Court action but the D.C. District Court denied the motions on April 13, 2004. The Court of Appeals for the Federal Circuit, acting on a suggestion filed by the Navajo Nation on remand from the Supreme Court’s March 4, 2003 decision held in an October 24, 2003 decision that the Supreme Court’s decision was focused on three specific statutes or regulations and therefore did not address the question of whether a network of other statutes, treaties and regulations imposed judicially enforceable fiduciary duties on the United States during the time period in question. On March 16, 2004, the Federal Circuit issued an order remanding the case against the Government to the Court of Federal Claims, which considered (1) whether the Navajo Nation previously waived its “network of other laws” argument and, (2) if not, whether the Navajo Nation can establish that the Government breached any fiduciary duties pursuant to such “network.” On December 20, 2005, the Court of Federal Claims issued its ruling and found that although there was no waiver, the Navajo Nation did not establish that a “network of other laws” created a judicially enforceable trust obligation. The Navajo Nation filed a notice of appeal from this ruling on February 14, 2006. Pursuant to a joint request of the parties, the D.C. District Court granted a stay of the action in that court to allow the parties to attempt to resolve, through facilitated negotiations, all issues associated with Mohave. Negotiations are ongoing and the stay has been continued until further order of the court. SCE cannot predict with certainty the outcome of the 1999 Navajo Nation’s complaint against SCE, the impact on the complaint of the Supreme Court’s decision and the recent Court of Federal Claims ruling in the Navajo Nation’s suit against the Government, or the impact of the complaint on the possibility of resumed operation of Mohave following the cessation of operation on December 31, 2005. Nuclear Insurance Federal law limits public liability claims from a nuclear incident to $10.8 billion. SCE and other owners of San Onofre and Palo Verde have purchased the maximum private primary insurance available ($300 million). The balance is covered by the industry’s retrospective rating plan that uses deferred premium charges to every reactor licensee if a nuclear incident at any licensed reactor in the United States results in claims and/or costs which exceed the primary insurance at that plant site. Federal regulations require this secondary level of financial protection. The Nuclear Regulatory Commission exempted San Onofre Unit 1 from this secondary level, effective June 1994. The current maximum deferred premium for each nuclear incident is $101 million per reactor, but not more than $15 million per reactor may be charged in any one year for each incident. The maximum deferred premium per reactor and the yearly assessment per reactor for each nuclear incident will be adjusted for inflation on a 5-year schedule. The next inflation adjustment will occur on August 31, 2008. Based on its ownership interests, SCE could be required to pay a maximum of $199 million per nuclear incident. However, it would have to pay no more than $30 million per incident in any one year. Such amounts include a 5% surcharge if

138
____________________________________________________________________________________ Notes to Consolidated Financial Statements additional funds are needed to satisfy public liability claims and are subject to adjustment for inflation. If the public liability limit above is insufficient, federal regulations may impose further revenue-raising measures to pay claims, including a possible additional assessment on all licensed reactor operators. Property damage insurance covers losses up to $500 million, including decontamination costs, at San Onofre and Palo Verde. Decontamination liability and property damage coverage exceeding the primary $500 million also has been purchased in amounts greater than federal requirements. Additional insurance covers part of replacement power expenses during an accident-related nuclear unit outage. A mutual insurance company owned by utilities with nuclear facilities issues these policies. If losses at any nuclear facility covered by the arrangement were to exceed the accumulated funds for these insurance programs, SCE could be assessed retrospective premium adjustments of up to $44 million per year. Insurance premiums are charged to operating expense. Procurement of Renewable Resources California law requires SCE to increase its procurement of renewable resources by at least 1% of its annual retail electricity sales per year so that 20% of its annual electricity sales are procured from renewable resources by no later than December 31, 2017. The Joint Energy Action Plan adopted in 2003 by the CPUC and the California Energy Commission (CEC) accelerated the deadline to 2010. SCE entered into a contract with Calpine Energy Services, L.P. (Calpine) to purchase the output of certain existing geothermal facilities in northern California. In January 2003, the CPUC issued a resolution approving the contract. SCE interpreted the resolution as authorizing SCE to count all of the output of the geothermal facilities towards the obligation to increase SCE’s procurement from renewable resources and counted the entire output of the facilities toward its 1% obligation in 2003, 2004 and 2005. On July 21, 2005, the CPUC issued a decision stating that SCE can only count procurement pursuant to the Calpine contract towards its 1% annual renewable procurement requirement if it is certified as “incremental” by the CEC. On February 1, 2006, the CEC certified approximately 25% and 17% of SCE’s 2003 and 2004 procurement, respectively, from the Calpine geothermal facilities as “incremental.” A similar outcome is anticipated with respect to the CEC’s certification review for 2005. On August 26, 2005, SCE filed an application for rehearing and a petition for modification of the CPUC’s July 21, 2005 decision. On January 26, 2006, the CPUC denied SCE’s application for rehearing of the decision. The CPUC has not yet ruled on SCE’s petition for modification. The petition for modification seeks a clarification that SCE will not be subjected to penalties for relying on the CPUC’s 2003 resolution in submitting compliance reports to the CPUC and planning its subsequent renewable procurement activities. The petition for modification also seeks an express finding that the decision will be applied prospectively only; i.e., that no past procurement deficits will accrue for any prior period based on the decision. If SCE is not successful in its attempt to modify the July 21, 2005 CPUC decision and can only count the output deemed “incremental” by the CEC, SCE could have deficits in meeting its renewable procurement obligations for 2003 and 2004. However, based on the CPUC’s rules for compliance with renewable procurement targets, SCE believes that it will have until 2007 to make up these deficits before becoming subject to penalties for those years. The CEC’s and the CPUC’s treatment of the output from the geothermal facilities could also result in SCE being deemed to be out of compliance in 2005 and 2006. Under current CPUC decisions, potential penalties for SCE’s failure to achieve its renewable procurement obligations for any year will be considered by the CPUC in SCE’s annual compliance filing. On December 20, 2005, Calpine and certain of its affiliates initiated Chapter 11 bankruptcy proceedings in the United States Bankruptcy Court for the Southern District of New York. As part of those proceedings, Calpine sought to reject its contract with SCE as of the petition filing date. On January 27,
139
____________________________________________________________________________________ Edison International
2006, after the matter had been withdrawn from the Bankruptcy Court’s jurisdiction, the United States District Court for the Southern District of New York denied Calpine’s motion to reject the contract and ruled that the FERC has exclusive jurisdiction to alter the terms of the contract with SCE. Calpine has appealed the District Court’s ruling to the United States Court of Appeals for the Second Circuit. Calpine may also file a petition with the FERC seeking authorization to reject the contract. The CPUC may take the position that any authorized rejection of the contract would cause SCE to be out of compliance with its renewable procurement obligations during any period in which renewable electricity deliveries are reduced or eliminated as a result of the rejection.
Further, in December 2005, SCE made filings advising the CPUC that the need for transmission upgrades to interconnect new renewable projects and the time it will take under the current process to license and construct such transmission upgrades may prevent SCE from meeting its statutory renewables procurement obligations through 2010 and potentially beyond 2010 depending in part on the results of a pending solicitation for new renewable resources. SCE has requested that the CPUC take several actions in order to expedite the licensing process for transmission upgrades. The CPUC may take the position that SCE’s failure to meet the 20% goal by 2010 due to transmission constraints would cause SCE to be out of compliance with its renewable procurement obligations.
Under the CPUC’s current rules, the maximum penalty for failing to achieve renewables procurement targets is $25 million per year. SCE cannot predict with certainty whether it will be assessed penalties.
Spent Nuclear Fuel
Under federal law, the United States Department of Energy (DOE) is responsible for the selection and construction of a facility for the permanent disposal of spent nuclear fuel and high-level radioactive waste. The DOE did not meet its obligation to begin acceptance of spent nuclear fuel not later than January 31, 1998. It is not certain when the DOE will begin accepting spent nuclear fuel from San Onofre or other nuclear power plants. Extended delays by the DOE have led to the construction of costly alternatives and associated siting and environmental issues. SCE has paid the DOE the required one-time fee applicable to nuclear generation at San Onofre through April 6, 1983 (approximately $24 million, plus interest). SCE is also paying the required quarterly fee equal to 0.1¢-per-kWh of nuclear-generated electricity sold after April 6, 1983. On January 29, 2004, SCE, as operating agent, filed a complaint against the DOE in the United States Court of Federal Claims seeking damages for DOE’s failure to meet its obligation to begin accepting spent nuclear fuel from San Onofre. The case is currently stayed until March 31, 2006, when SCE will seek to lift the stay and go forward with the litigation.
SCE has primary responsibility for the interim storage of spent nuclear fuel generated at San Onofre. Spent nuclear fuel is stored in the San Onofre Units 2 and 3 spent fuel pools and the San Onofre independent spent fuel storage installation where all of Unit 1’s spent fuel located at San Onofre is stored. There is now sufficient space in the Unit 2 and 3 spent fuel pools to meet plant requirements through mid-2007 and mid-2008, respectively. In order to maintain a full core off-load capability, SCE is planning to begin moving Unit 2 and 3 spent fuel into the independent spent fuel storage installation by early 2007. In order to increase on-site storage capacity and maintain core off-load capability, Palo Verde has constructed a dry cask storage facility. Arizona Public Service, as operating agent, plans to continually load casks on a schedule to maintain full core off-load capability for all three units. Schedule Coordinator Tariff Dispute SCE serves as a schedule coordinator for Los Angeles Department of Water & Power (DWP) over the ISO-controlled grid. In late 2003, SCE began charging DWP under a tariff subject to refund for FERC-authorized charges incurred by SCE on the DWP’s behalf. The scheduling coordinator charges are billed to DWP under a FERC tariff that remains subject to dispute. DWP has paid the amounts billed under

140
____________________________________________________________________________________ Notes to Consolidated Financial Statements protest but requested the FERC declare that SCE was obligated to serve as the DWP’s scheduling coordinator without charge. The FERC accepted SCE’s tariff for filing, but held that the rates charged to DWP have not been shown to be just and reasonable and thus made them subject to refund and further review at the FERC. As a result, SCE could be required to refund all or part of the amounts collected from DWP under the tariff. During the fourth quarter of 2005 SCE accrued a $25 million charge to earnings for the potential refunds, reflected in the consolidated statements of income caption “Purchased power”. If the FERC ultimately rules that SCE may not collect the scheduling coordinator charges from DWP and requires the amounts collected to be refunded to DWP, SCE would attempt to recover the scheduling coordinator charges from all transmission grid customers through another regulatory mechanism. However, the availability of other recovery mechanisms is uncertain, and ultimate recovery of the scheduling coordinator charges cannot be assured. Note 10. Business Segments Edison International’s reportable business segments include its electric utility operation segment (SCE), a nonutility power generation segment (MEHC – parent only and EME), and a financial services provider segment (Edison Capital). Edison International evaluates performance based on net income. SCE is a rate-regulated electric utility that supplies electric energy to a 50,000 square-mile area of central, coastal and Southern California. SCE also produces electricity. MEHC, through its ownership of EME and its subsidiaries, is engaged in the business of developing, acquiring, owning or leasing, operating and selling energy and capacity from electric power generation facilities. Through EME, MEHC also conducts price risk management and energy trading activities in power markets open to competition. Edison Capital is a provider of financial services with investments worldwide. The significant accounting policies of the segments are the same as those described in Note 1. EME derived a significant source of its nonutility power generation revenue from electric power sold into the PJM Interconnection, LLC (PJM) market from the Homer City facilities in the past three fiscal years and from the Illinois plants in 2005 and 2004. Sales into the PJM pool accounted from approximately $1.6 billion in 2005, $376 million in 2004 and $323 million in 2003 of EME’s nonutility power generation revenue. In 2004 and 2003, a significant source of revenue from EME’s sale of energy and capacity was derived from its Midwest Generation subsidiary’s sales to Exelon Generation Company under three power purchase agreements. These power purchase agreements had all expired by the end of 2004. Revenue from such sales was $586 million in 2004 and $708 million in 2003. For the year ended December 31, 2004, approximately $241 million of EME’s nonutility power generation revenue was from sales to BP Energy Company, a third-party customer. An investment grade affiliate of BP Energy has guaranteed payment of amounts due under the related contracts.
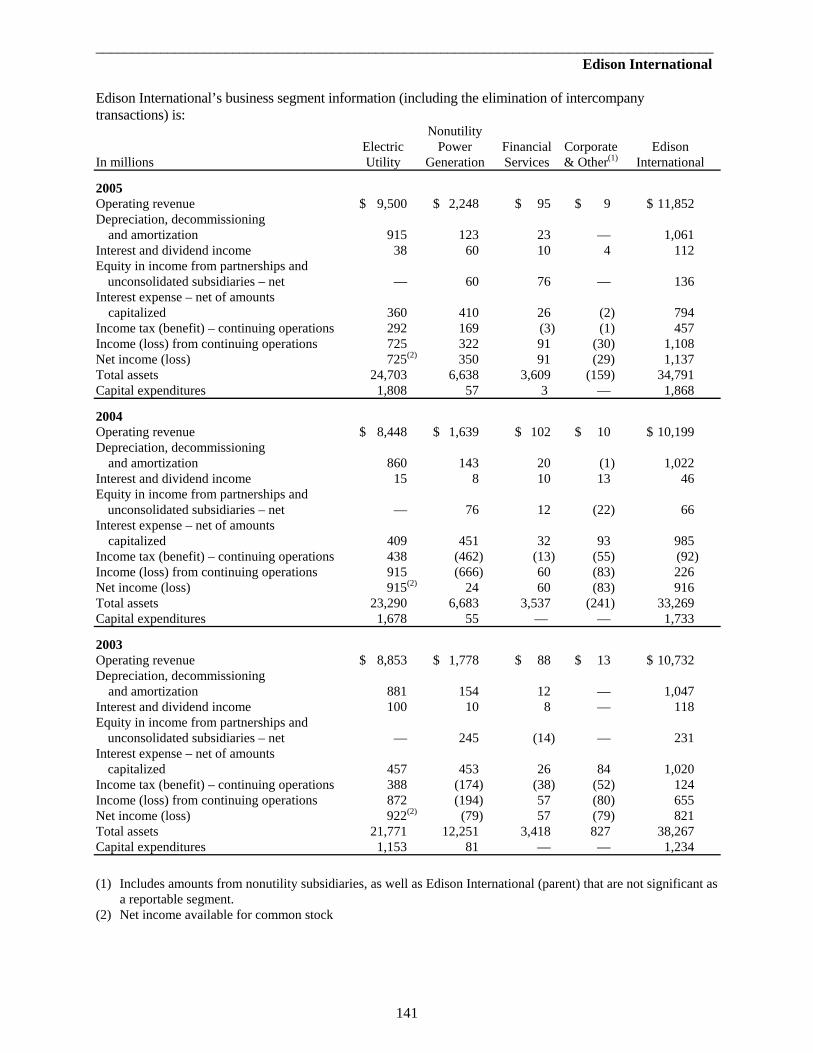
141
______________________________________________________________________________________ Edison International
Edison International’s business segment information (including the elimination of intercompany transactions) is: Nonutility Electric Power Financial Corporate Edison In millions Utility Generation Services & Other(1) International
2005 Operating revenue $ 9,500 $ 2,248 $ 95 $ 9 $ 11,852 Depreciation, decommissioning and amortization 915 123 23 — 1,061 Interest and dividend income 38 60 10 4 112 Equity in income from partnerships and unconsolidated subsidiaries – net — 60 76 — 136 Interest expense – net of amounts capitalized 360 410 26 (2) 794 Income tax (benefit) – continuing operations 292 169 (3) (1) 457 Income (loss) from continuing operations 725 322 91 (30) 1,108 Net income (loss) 725(2) 350 91 (29) 1,137 Total assets 24,703 6,638 3,609 (159) 34,791 Capital expenditures 1,808 57 3 — 1,868
2004 Operating revenue $ 8,448 $ 1,639 $ 102 $ 10 $ 10,199 Depreciation, decommissioning and amortization 860 143 20 (1) 1,022 Interest and dividend income 15 8 10 13 46 Equity in income from partnerships and unconsolidated subsidiaries – net — 76 12 (22) 66 Interest expense – net of amounts capitalized 409 451 32 93 985 Income tax (benefit) – continuing operations 438 (462) (13) (55) (92) Income (loss) from continuing operations 915 (666) 60 (83) 226 Net income (loss) 915(2) 24 60 (83) 916 Total assets 23,290 6,683 3,537 (241) 33,269 Capital expenditures 1,678 55 — — 1,733
2003 Operating revenue $ 8,853 $ 1,778 $ 88 $ 13 $ 10,732 Depreciation, decommissioning and amortization 881 154 12 — 1,047 Interest and dividend income 100 10 8 — 118 Equity in income from partnerships and unconsolidated subsidiaries – net — 245 (14) — 231 Interest expense – net of amounts capitalized 457 453 26 84 1,020 Income tax (benefit) – continuing operations 388 (174) (38) (52) 124 Income (loss) from continuing operations 872 (194) 57 (80) 655 Net income (loss) 922(2) (79) 57 (79) 821 Total assets 21,771 12,251 3,418 827 38,267 Capital expenditures 1,153 81 — — 1,234
(1) Includes amounts from nonutility subsidiaries, as well as Edison International (parent) that are not significant as
a reportable segment. (2) Net income available for common stock

142
____________________________________________________________________________________ Notes to Consolidated Financial Statements The net income reported for electric utility includes earnings from discontinued operations of $50 million for 2003. The net income (loss) reported for nonutility power generation includes earnings from discontinued operations of $29 million for 2005, $690 million for 2004 and $124 million for 2003. Geographic Information Edison International’s foreign and domestic revenue and assets information is:
In millions Year ended December 31, 2005 2004 2003
Revenue United States $ 11,789 $ 10,096 $ 10,533 International 63 103 199
Total $ 11,852 $ 10,199 $ 10,732
In millions December 31, 2005 2004
Assets United States $ 32,481 $ 30,838 International 2,299 2,309 Assets of discontinued operations 11 122
Total $ 34,791 $ 33,269
Note 11. Discontinued Operations On February 3, 2005, EME sold its 25% equity interest in the Tri Energy project, pursuant to a purchase agreement dated December 15, 2004, to a consortium comprised of International Power plc (70%) and Mitsui & Co., Ltd. (30%), referred to as IPM, for approximately $20 million. On January 10, 2005, EME sold its 50% equity interest in the Caliraya-Botocan-Kalayaan project to Corporacion IMPSA S.A., pursuant to a purchase agreement dated November 5, 2004. Proceeds from the sale were approximately $104 million. On December 16, 2004, EME sold the stock and related assets of MEC International B.V. (MECIBV) to IPM, pursuant to a purchase agreement dated July 29, 2004. The purchase agreement was entered into following a competitive bidding process. The sale of MECIBV included the sale of EME’s interests in ten electric power generating projects or companies located in Europe, Asia, Australia, and Puerto Rico. Consideration from the sale of MECIBV and related assets was $2.0 billion. On September 30, 2004, EME sold its 51% interest in Contact Energy to Origin Energy New Zealand Limited pursuant to a purchase agreement dated July 20, 2004. The purchase agreement was entered into following a competitive bidding process. Consideration for the sale was NZ$1.6 billion (approximately $1.1 billion) which includes NZ$535 million of debt assumed by the purchaser. EME previously owned a 220 MW power plant located in the United Kingdom, referred to as the Lakeland project. An administrative receiver was appointed in 2002 as a result of a default by its counterparty, a subsidiary of TXU Europe Group plc. Following a claim for termination of the power sales agreement, the Lakeland project received a settlement of £116 million (approximately $217 million). EME is entitled to receive the remaining amount of the settlement after payment of creditor claims. Payments received to date include £13 million (approximately $24 million) in March 2005 and £18 million (approximately $31 million) in February 2006. Beginning in 2002, EME reported

143
____________________________________________________________________________________ Edison International
the Lakeland project as discontinued operations and accounts for its ownership of Lakeland Power on the cost method (earnings are recognized as cash is distributed from the project). For all years presented, the results of EME’s international projects, discussed above have been accounted for as discontinued operations on the consolidated financial statements in accordance with an accounting standard related to the impairment and disposal of long-lived assets. In July 2003, SCE sold its oil storage and pipeline facilities to Pacific Terminals LLC for $158 million. As a result, in third quarter 2003, SCE recorded a $44 million after-tax gain to shareholders. In 2003 the results of SCE’s oil storage and pipeline facilities unit have been accounted for as a discontinued operation in accordance with an accounting standard related to the impairment and disposal of long-lived assets. There was no revenue from discontinued operations in 2005. Revenue from discontinued operations was $1.3 billion in 2004 and $1.5 billion in 2003. The pre-tax earnings (loss) from discontinued operations was $(20) million in 2005, $737 million in 2004 and $296 million in 2003. The pre-tax loss from discontinued operations in 2005 included a $9 million gain on sale before taxes. The pre-tax earnings from discontinued operations in 2004 included a $532 million gain on sale before taxes related to EME’s international power generation portfolio. During the third quarter of 2005, EME recorded tax benefit adjustments of $28 million, which resulted from the completion of the 2004 federal and California income tax returns and quarterly review of tax accruals. The majority of the tax adjustments were related to the sale of the international projects in December 2004. These adjustments (benefits) are included in income from discontinued operations – net of tax on the consolidated statements of income. During the fourth quarter of 2005, EME recorded an after-tax charge of $25 million related to a tax indemnity for a project sold to IPM in December 2004. This charge related to an adverse tax court ruling in Spain, which the local company plans to appeal. The carrying value of assets and liabilities recorded as discontinued operations is:
In millions December 31, 2005 2004
Assets Cash and equivalents $ 2 $ 2 Other current assets — 2
Total current assets 2 4
Investments in partnerships and unconsolidated subsidiaries — 107 Other long-term assets 9 11
Total assets of discontinued operations $ 11 $ 122 Liabilities Accounts payable and accrued liabilities $ — $ 2
Total current liabilities — 2
Customer advances and other deferred credits 4 4 Other long-term liabilities 10 9
Total liabilities of discontinued operations $ 14 $ 15

144
____________________________________________________________________________________ Notes to Consolidated Financial Statements Assets and liabilities of most of EME’s foreign operations were translated at end of period rates of exchange, and the income statements were translated at the monthly average rates of exchange. Gains or losses from translation of foreign currency financial statements are included in comprehensive income in shareholders’ equity. Note 12. Acquisitions and Dispositions Acquisitions On December 27, 2005, EME completed a transaction with Padoma Project Holdings, LLC to acquire a 100% interest in the San Juan Mesa Wind Project, which owns a 120 MW wind power generation facility located in New Mexico, referred to as the San Juan Mesa wind project. The total purchase price was approximately $157 million. The acquisition was funded with cash. The acquisition was accounted for utilizing the purchase method. The fair value of the San Juan Mesa wind project was equal to the purchase price and as a result, the entire purchase price was allocated to nonutility property in Edison International’s consolidated balance sheet. Edison International’s consolidated statement of income will reflect the operations of the San Juan Mesa project beginning January 1, 2006. The pro forma effects of the San Juan Mesa wind project acquisition on Edison International’s consolidated financial statements were not material. In March 2004, SCE acquired Mountainview Power Company LLC, which consisted of a power plant in the early stages of construction in Redlands, California. SCE recommenced full construction of the approximately $600 million project. The Mountainview project is fully operational. Dispositions In March 2004, EME completed the sale of its 50% partnership interest in Brooklyn Navy Yard Cogeneration Partners L.P. for a sales price of approximately $42 million. EME recorded an impairment charge of $53 million during the fourth quarter of 2003 related to the planned disposition of this investment and a pre-tax loss of approximately $4 million during the first quarter of 2004 due to changes in the terms of the sale. In January 2004, EME completed the sale of 100% of its stock of Edison Mission Energy Oil & Gas, which in turn held minority interests in Four Star Oil & Gas. Proceeds from the sale were approximately $100 million. EME recorded a pre-tax gain on the sale of approximately $47 million during the first quarter of 2004. In fourth quarter 2003, Gordonsville Energy Limited Partnership, in which EME owns a 50% interest, completed the sale of the Gordonsville cogeneration facility. Proceeds from the sale, including distribution of a debt service reserve fund, were $36 million. In second quarter 2003, EME recorded an impairment charge of $6 million related to the planned disposition of this investment. Note 13. Investments in Leveraged Leases, Partnerships and Unconsolidated Subsidiaries Leveraged Leases Edison Capital is the lessor in various power generation, electric transmission and distribution, transportation and telecommunication leases with terms of 24 to 38 years. Each of Edison Capital’s leveraged lease transactions was completed and accounted for in accordance with lease accounting standards. All operating, maintenance, insurance and decommissioning costs are the responsibility of the lessees. The acquisition cost of these facilities was $6.9 billion at both December 31, 2005 and 2004.

145
____________________________________________________________________________________ Edison International
The equity investment in these facilities is generally 20% of the cost to acquire the facilities. The balance of the acquisition costs was funded by nonrecourse debt secured by first liens on the leased property. The lenders do not have recourse to Edison Capital in the event of loan default. The net income from leveraged leases is:
In millions Year ended December 31, 2005 2004 2003
Income from leveraged leases $ 71 $ 81 $ 82 Tax effect of pre-tax income: Current 45 35 40 Deferred (72) (64) (71)
Total tax expense (27) (29) (31)
Net income from leveraged leases $ 44 $ 52 $ 51
The net investment in leveraged leases is:
In millions December 31, 2005 2004
Rentals receivable – net $ 3,431 $ 3,479 Estimated residual value 42 42 Unearned income (1,026) (1,097)
Investment in leveraged leases 2,447 2,424 Deferred income taxes (2,203) (2,132)
Net investment in leveraged leases $ 244 $ 292
Rental receivables are net of principal and interest on nonrecourse debt, credit reserves and the current portion of rentals receivable. Credit reserves were $16 million and $14 million at December 31, 2005 and 2004, respectively. The current portion of rentals receivable was $32 million and $19 million at December 31, 2005 and 2004, respectively. Partnerships and Unconsolidated Subsidiaries Edison International and its nonutility subsidiaries have equity interests primarily in energy projects, oil and gas and real estate investment partnerships. For 2003, the summarized financial information included Four Star Oil & Gas Company, Gordonsville Energy and Brooklyn Navy Yard. On January 7, 2004, EME sold 100% of its stock of Edison Mission Energy Oil & Gas, which in turn held minority interests in Four Star Oil & Gas. On November 21, 2003, EME sold its interest in Gordonsville Energy and on March 31, 2004, EME sold its interest in Brooklyn Navy Yard. Therefore, Gordonsville and Four Star Oil & Gas are not included in the balances for 2005 and 2004. Brooklyn Navy Yard’s first quarter 2004 results are included in the summarized financial information for 2004. The summarized financial information for 2003 also included four power projects (Kern River, Midway-Sunset, Sycamore and Watson) partially owned by EME. In compliance with a new accounting standard, on March 31, 2004, SCE began consolidating these projects; therefore, they are not included in the balances for 2004. See “Variable Interest Entities” in Note 1 for further details. The difference between the carrying value of these equity investments and the underlying equity in the net assets was $2 million at December 31, 2005. The difference is being amortized over the life of the energy projects.

146
____________________________________________________________________________________ Notes to Consolidated Financial Statements Summarized financial information of these investments is:
In millions Year ended December 31, 2005 2004 2003
Revenue $ 717 $ 719 $ 2,399 Expenses 745 698 2,062
Income (loss) before accounting change (28) 21 337 Cumulative effect of accounting change – net of tax — — (7)
Net income (loss) $ (28) $ 21 $ 330
In millions December 31, 2005 2004
Current assets $ 446 $ 485 Other assets 4,376 4,462 4,947
Total assets $ 4,822 $ 4,947
Current liabilities $ 333 $ 234 Other liabilities 2,353 2,277 Equity 2,136 2,436
Total liabilities and equity $ 4,822 $ 4,947
The undistributed earnings of equity method investments were $75 million in both 2005 and 2004. Note 14. Impairment Losses and Loss on Lease Termination Impairment Loss on Equity Method Investment During the third quarter of 2005, EME fully impaired its equity investment in the March Point project following an updated forecast of future project cash flows. The March Point project is a 140 MW natural gas-fired cogeneration facility located in Anacortes, Washington, in which a subsidiary of EME owns a 50% partnership interest. The March Point project sells electricity to Puget Sound Energy, Inc. under two power purchase agreements that expire in 2011 and sells steam to Equilon Enterprises, LLC (a subsidiary of Shell Oil) under a steam supply agreement that also expires in 2011. March Point purchases a portion of its fuel requirements under long-term contracts with the remaining requirements purchased at current market prices. March Point’s power sales agreements do not provide for a price adjustment related to the project’s fuel costs. During the first nine months of 2005, long-term natural gas prices increased substantially, thereby adversely affecting the future cash flows of the March Point project. As a result, EME concluded that its investment was impaired and recorded a $55 million charge during the third quarter of 2005. Asset Impairments In September 2004, EME completed an analysis of future competitiveness in the expanded PJM Interconnection, LLC marketplace of its eight remaining small peaking units in Illinois. Based on this analysis, EME decided to decommission six of the eight small peaking units. As a result of the decision to decommission the units, projected cash flows associated with the Illinois peaking units were less than the book value of the units resulting in an impairment under an accounting standard for the impairment or disposal of long-lived assets. During the third quarter of 2004, EME recorded a pre-tax impairment charge of $29 million (approximately $18 million after tax).

147
____________________________________________________________________________________________ Edison International
During 2003, EME recorded asset impairment charges of $304 million, consisting of $245 million related to eight small peaking plants owned by Midwest Generation in Illinois and $53 million and $6 million to write-down the estimated net proceeds from the planned sale of its interests in the Brooklyn Navy Yard and Gordonsville projects, respectively (see Note 12). The impairment charge related to the peaking plants in Illinois resulted from a revised long-term outlook for capacity revenue from the peaking plants. The lower capacity revenue outlook is the result of a number of factors, including higher long-term natural gas prices and current generation overcapacity. The book value of these assets was written down from $286 million to an estimated fair market value of $41 million. The estimated fair market value was determined based on discounting estimated future pretax cash flows using a 17.5% discount rate. Loss on Lease Termination In April 2004, Midwest Generation terminated the Collins Station lease through a negotiated transaction with the lease equity investor. Midwest Generation made a lease termination payment of approximately $960 million. This amount represented the $774 million of lease debt outstanding, plus accrued interest, and the amount owed to the lease equity investor for early termination of the lease. Midwest Generation received title to the Collins Station as part of the transaction. EME recorded a pre-tax loss of approximately $956 million (approximately $587 million after tax) due to termination of the lease, and the planned decommissioning of the asset and disposition of excess inventory.

148
Quarterly Financial Data (Unaudited) Edison International
2005 In millions, except per-share amounts Total Fourth Third Second First
Operating revenue $11,852 $2,975 $3,783 $2,649 $2,446 Operating income 2,313 612 843 409 448 Income from continuing operations 1,108 299 435 180 194 Income (loss) from discontinued operations – net 30 (26) 27 21 7 Cumulative effect of accounting change – net (1) (1) — — — Net income 1,137 272 462 201 201 Basic earnings (loss) per share: Continuing operations 3.38 0.91 1.33 0.55 0.59 Discontinued operations 0.09 (0.08) 0.08 0.06 0.02 Total 3.47 0.83 1.41 0.61 0.61 Diluted earnings (loss) per share: Continuing operations 3.34 0.90 1.31 0.55 0.59 Discontinued operations 0.09 (0.08) 0.08 0.06 0.02 Total 3.43 0.82 1.39 0.61 0.61 Dividends declared per share 1.02 0.27 0.25 0.25 0.25 Common stock prices: High 49.16 49.16 47.64 40.96 34.95 Low 30.43 40.51 38.75 34.70 30.43 Close 47.28 43.61 47.28 40.55 34.72
2004 In millions, except per-share amounts Total Fourth Third Second First
Operating revenue $ 10,199 $ 2,327 $ 3,188 $ 2,565 $ 2,116 Operating income (loss) 1,100 451 788 (381) 239 Income (loss) from continuing operations 226 259 314 (400) 52 Income from discontinued operations – net 690 120 498 26 46 Cumulative effect of accounting change – net — — — — (1) Net income (loss) 916 379 813 (374) 97 Basic earnings (loss) per share: Continuing operations 0.69 0.79 0.96 (1.23) 0.16 Discontinued operations 2.12 0.37 1.53 0.08 0.14 Total 2.81 1.16 2.49 (1.15) 0.30 Diluted earnings (loss) per share: Continuing operations 0.68 0.78 0.95 (1.21) 0.16 Discontinued operations 2.09 0.36 1.51 0.08 0.14 Total 2.77 1.14 2.46 (1.13) 0.30 Dividends declared per share 0.85 0.25 0.20 0.20 0.20 Common stock prices: High 32.52 32.52 27.49 25.82 24.35 Low 21.24 26.39 25.14 21.77 21.24 Close 32.03 32.03 27.39 25.57 24.29
As a result of rounding, the total of the four quarters does not always equal the amount for the year.
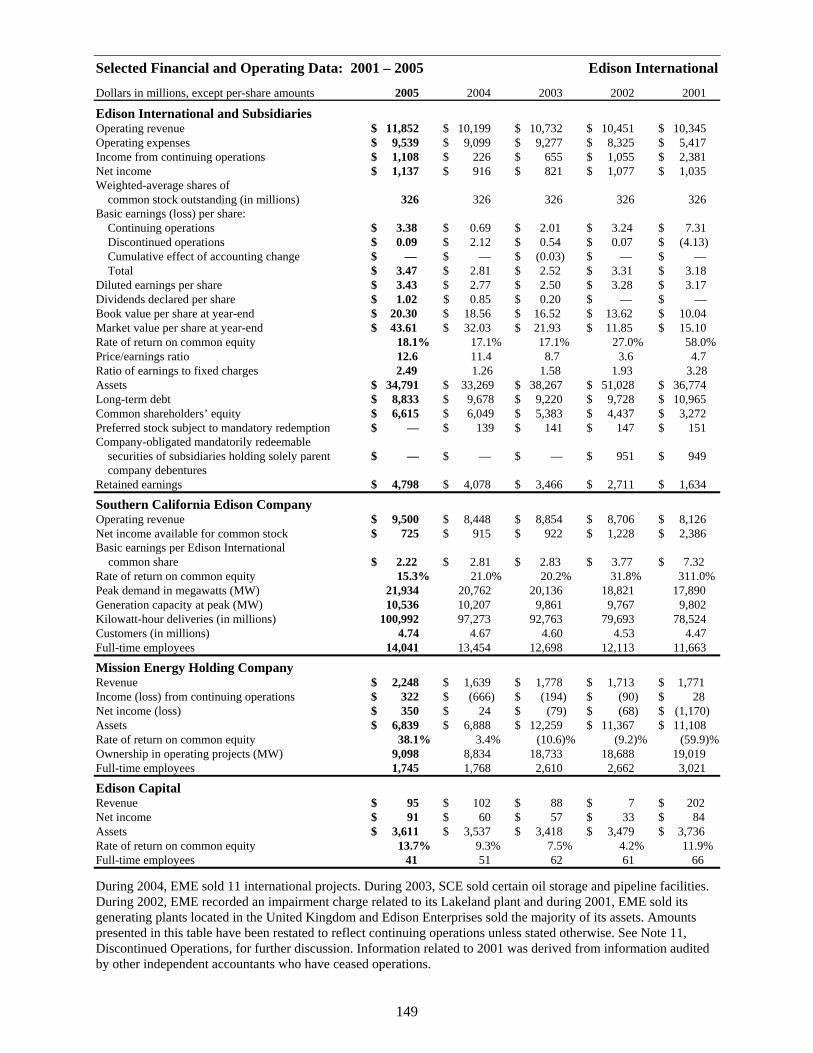
149
Selected Financial and Operating Data: 2001 – 2005 Edison International
Dollars in millions, except per-share amounts 2005 2004 2003 2002 2001
Edison International and Subsidiaries Operating revenue $ 11,852 $ 10,199 $ 10,732 $ 10,451 $ 10,345 Operating expenses $ 9,539 $ 9,099 $ 9,277 $ 8,325 $ 5,417 Income from continuing operations $ 1,108 $ 226 $ 655 $ 1,055 $ 2,381 Net income $ 1,137 $ 916 $ 821 $ 1,077 $ 1,035 Weighted-average shares of common stock outstanding (in millions) 326 326 326 326 326 Basic earnings (loss) per share: Continuing operations $ 3.38 $ 0.69 $ 2.01 $ 3.24 $ 7.31 Discontinued operations $ 0.09 $ 2.12 $ 0.54 $ 0.07 $ (4.13) Cumulative effect of accounting change $ — $ — $ (0.03) $ — $ — Total $ 3.47 $ 2.81 $ 2.52 $ 3.31 $ 3.18 Diluted earnings per share $ 3.43 $ 2.77 $ 2.50 $ 3.28 $ 3.17 Dividends declared per share $ 1.02 $ 0.85 $ 0.20 $ — $ — Book value per share at year-end $ 20.30 $ 18.56 $ 16.52 $ 13.62 $ 10.04 Market value per share at year-end $ 43.61 $ 32.03 $ 21.93 $ 11.85 $ 15.10 Rate of return on common equity 18.1% 17.1% 17.1% 27.0% 58.0% Price/earnings ratio 12.6 11.4 8.7 3.6 4.7 Ratio of earnings to fixed charges 2.49 1.26 1.58 1.93 3.28 Assets $ 34,791 $ 33,269 $ 38,267 $ 51,028 $ 36,774 Long-term debt $ 8,833 $ 9,678 $ 9,220 $ 9,728 $ 10,965 Common shareholders’ equity $ 6,615 $ 6,049 $ 5,383 $ 4,437 $ 3,272 Preferred stock subject to mandatory redemption $ — $ 139 $ 141 $ 147 $ 151 Company-obligated mandatorily redeemable securities of subsidiaries holding solely parent $ — $ — $ — $ 951 $ 949 company debentures Retained earnings $ 4,798 $ 4,078 $ 3,466 $ 2,711 $ 1,634
Southern California Edison Company Operating revenue $ 9,500 $ 8,448 $ 8,854 $ 8,706 $ 8,126 Net income available for common stock $ 725 $ 915 $ 922 $ 1,228 $ 2,386 Basic earnings per Edison International common share $ 2.22 $ 2.81 $ 2.83 $ 3.77 $ 7.32 Rate of return on common equity 15.3% 21.0% 20.2% 31.8% 311.0% Peak demand in megawatts (MW) 21,934 20,762 20,136 18,821 17,890 Generation capacity at peak (MW) 10,536 10,207 9,861 9,767 9,802 Kilowatt-hour deliveries (in millions) 100,992 97,273 92,763 79,693 78,524 Customers (in millions) 4.74 4.67 4.60 4.53 4.47 Full-time employees 14,041 13,454 12,698 12,113 11,663
Mission Energy Holding Company Revenue $ 2,248 $ 1,639 $ 1,778 $ 1,713 $ 1,771 Income (loss) from continuing operations $ 322 $ (666) $ (194) $ (90) $ 28 Net income (loss) $ 350 $ 24 $ (79) $ (68) $ (1,170) Assets $ 6,839 $ 6,888 $ 12,259 $ 11,367 $ 11,108 Rate of return on common equity 38.1% 3.4% (10.6)% (9.2)% (59.9)% Ownership in operating projects (MW) 9,098 8,834 18,733 18,688 19,019 Full-time employees 1,745 1,768 2,610 2,662 3,021
Edison Capital Revenue $ 95 $ 102 $ 88 $ 7 $ 202 Net income $ 91 $ 60 $ 57 $ 33 $ 84 Assets $ 3,611 $ 3,537 $ 3,418 $ 3,479 $ 3,736 Rate of return on common equity 13.7% 9.3% 7.5% 4.2% 11.9% Full-time employees 41 51 62 61 66
During 2004, EME sold 11 international projects. During 2003, SCE sold certain oil storage and pipeline facilities. During 2002, EME recorded an impairment charge related to its Lakeland plant and during 2001, EME sold its generating plants located in the United Kingdom and Edison Enterprises sold the majority of its assets. Amounts presented in this table have been restated to reflect continuing operations unless stated otherwise. See Note 11, Discontinued Operations, for further discussion. Information related to 2001 was derived from information audited by other independent accountants who have ceased operations.

E d i s o n I n t e r n a t i o n a l
153
John E. Bryson 3
Chairman of the Board, President and Chief Executive Officer, Edison International;Chairman of the Board, SouthernCalifornia Edison Company;Chairman of the Board, Edison Capital A director since 1990†
France A. Córdova 4,5
Chancellor,University of California, RiversideRiverside, CaliforniaA director since 2004
Bradford M. Freeman 1,4,5
Founding Partner,Freeman Spogli & Co. (private investment company)Los Angeles, CaliforniaA director since 2002
Bruce Karatz 2,3,5
Chairman and Chief Executive Officer,KB Home (homebuilding)Los Angeles, CaliforniaA director since 2002
Luis G. Nogales 1,2,4
Managing Partner,Nogales Investors, LLC (private equity investment company) Los Angeles, California A director since 1993
Ronald L. Olson 3,4
Senior Partner, Munger, Tolles and Olson (law firm) Los Angeles, CaliforniaA director since 1995
James M. Rosser 3,4
President, California State University, Los Angeles Los Angeles, CaliforniaA director since 1985
Board of Directors * Edison InternationalManagement Team
Richard T. Schlosberg, III 1,2,5
Retired President and Chief Executive Officer,The David and Lucile PackardFoundation (private family foundation)San Antonio, TexasA director since 2002
Robert H. Smith 1,2,5
Robert H. Smith Investments andConsulting (banking and financial-related consulting services)Pasadena, CaliforniaA director since 1987
Thomas C. Sutton 1,2,3
Chairman of the Board and Chief Executive Officer, Pacific Life Insurance CompanyNewport Beach, CaliforniaA director since 1995
1 Audit Committee 2 Compensation and Executive Personnel
Committee 3 Executive Committee 4 Finance Committee 5 Nominating/Corporate Governance
Committee
* Service includes Edison International and Southern California Edison Company Board memberships.
† For Southern California Edison Company, a director from 1990-1999; 2003 to present.
John E. BrysonChairman of the Board, President andChief Executive Officer
J.A. (Lon) BouknightExecutive Vice Presidentand General Counsel
Thomas R. McDanielExecutive Vice President, Chief Financial Officer andTreasurer
Polly L. GaultSenior Vice President, Public Affairs
Mahvash YazdiSenior Vice President,Business Integration, and Chief Information Officer
Michael U. AlvarezVice President, Strategic Planning
Diane L. FeatherstoneVice President and General Auditor
Frederick J. Grigsby, Jr.Vice President,Human Resources and Labor Relations
Barbara E. MathewsVice President, Associate GeneralCounsel, Chief Governance Officer andCorporate Secretary
Jo Ann Newton Vice President, Investor Relations
Barbara J. ParskyVice President,Corporate Communications
Anthony L. SmithVice President, Tax
Kenneth S. StewartVice President and Chief Ethics and Compliance Officer
Linda G. SullivanVice President andController

E d i s o n I n t e r n a t i o n a l
154
Jodi M. CollinsVice President, Information Technology
Diane L. FeatherstoneVice President and General Auditor
Frederick J. Grigsby, Jr.Vice President,Human Resources and Labor Relations
Harry B. HutchisonVice President,Customer Service Operations
Akbar JazayeriVice President,Revenue and Tariffs
Walter J. JohnstonVice President,Power Delivery
Brian KatzVice President,Nuclear Oversight andRegulatory Affairs
James A. KellyVice President,Engineering and Technical Services
R. W. (Russ) Krieger, Jr.Vice President, Power Production
Barbara E. MathewsVice President, Associate General Counsel, Chief Governance Officer, andCorporate Secretary
Barbara J. ParskyVice President,Corporate Communications
Kevin M. PayneVice President,Enterprise Resource Planning
Frank J. QuevedoVice President,Equal Opportunity
James T. ReillyVice President, Nuclear Engineering andTechnical Services
Anthony L. SmithVice President,Tax
Kenneth S. StewartVice President and Chief Ethics and Compliance Officer
Linda G. SullivanVice President and Controller
Raymond W. WaldoVice President,Nuclear Generation
Edison Mission Group*
Theodore F. Craver, Jr.Chairman of the Board, President and Chief Executive Officer
Guy F. GorneySenior Vice President, Coal Generation
Paul JacobSenior Vice President, Marketing and Trading
W. James Scilacci Senior Vice President andChief Financial Officer
Raymond W. VickersSenior Vice President and General Counsel
John P. Finneran, Jr.Vice President, Business Management
Gerard P. LoughmanVice President, Development
Jenene J. WilsonVice President, Human Resources
* Parent company of Edison Mission Energy and Edison Capital.
Southern California Edison Company
John E. BrysonChairman of the Board
Alan J. FohrerChief Executive Officer
John R. FielderPresident
Bruce C. FosterSenior Vice President,Regulatory Operations
Polly L. GaultSenior Vice President, Public Affairs
Ronald L. LitzingerSenior Vice President,Transmission and Distribution
Thomas M. NoonanSenior Vice President andChief Financial Officer
Stephen E. PickettSenior Vice President andGeneral Counsel
Pedro J. PizarroSenior Vice President,Power Procurement
Richard M. RosenblumSenior Vice President,Generation and Chief Nuclear Officer
Mahvash YazdiSenior Vice President,Business Integration and Chief Information Officer
Lynda L. ZieglerSenior Vice President, Customer Service
Robert C. BoadaVice President and Treasurer
William L. BryanVice President, Business Customer Division
Ann P. CohnVice President andAssociate General Counsel
Annual MeetingThe annual meeting of shareholderswill be held on Thursday, April 27,2006, at 10:00 a.m., Pacific Time,at the Pacific Palms ConferenceResort; One Industry HillsParkway, City of Industry,California 91744.
Corporate Governance PracticesA description of EdisonInternational’s corporate gover-nance practices is available on ourWeb site at www.edisoninvestor.com.The Edison International BoardNominating/Corporate GovernanceCommittee periodically reviews theCompany’s corporate governancepractices and makes recommenda-tions to the Company’s Board thatthe practices be updated from timeto time.
Stock Listing and TradingInformation
Edison International Common StockThe New York Stock Exchange usesthe ticker symbol EIX; daily news-papers list the stock as EdisonInt.
Transfer Agent and RegistrarWells Fargo Bank, N.A., whichmaintains shareholder records, isthe transfer agent and registrar forEdison International’s commonstock. Shareholders may call Wells Fargo Shareowner Services,(800) 347-8625, between 7 a.m.and 7 p.m. (Central Time), Mondaythrough Friday, to speak with a rep-resentative (or to use the interactivevoice response unit 24 hours a day,seven days a week) regarding:
� stock transfer and name-changerequirements;
� address changes, includingdividend payment addresses;
� electronic deposit of dividends;
� taxpayer identification numbersubmissions or changes;
� duplicate 1099 and W-9 forms;
� notices of, and replacement of,lost or destroyed stock certificatesand dividend checks;
� Edison International’s DividendReinvestment and Direct StockPurchase Plan, including enroll-ments, purchases, withdrawals,terminations, transfers, sales,duplicate statements, and directdebit of optional cash for dividendreinvestment; and
� requests for access to onlineaccount information.
Inquiries may also be directed to:
MailWells Fargo Bank, N.A.Shareowner Services Department161 North Concord Exchange StreetSouth St. Paul, MN 55075-1139
Fax(651) 450-4033
Wells Fargo Shareowner ServicesSM
www.wellsfargo.com/shareownerservices
Web Addresswww.edisoninvestor.com
Online account information: www.shareowneronline.com
Dividend Reinvestment and Direct Stock Purchase PlanA prospectus and enrollment formsfor Edison International’s commonstock Dividend Reinvestment and Direct Stock Purchase Plan are available from Wells FargoShareowner Services upon request.
Edison International Annual Report Shareholder Information

2244 Walnut Grove AvenueRosemead, California 91770www.edison.com