edinburgh research explorer · the evolutionary interaction between influenza a virus and the human...
TRANSCRIPT

Edinburgh Research Explorer
The genomic and epidemiological dynamics of human influenzaA virus
Citation for published version:Rambaut, A, Pybus, OG, Nelson, MI, Viboud, C, Taubenberger, JK & Holmes, EC 2008, 'The genomic andepidemiological dynamics of human influenza A virus' Nature, vol 453, no. 7195, pp. 615-619. DOI:10.1038/nature06945
Digital Object Identifier (DOI):10.1038/nature06945
Link:Link to publication record in Edinburgh Research Explorer
Document Version:Peer reviewed version
Published In:Nature
General rightsCopyright for the publications made accessible via the Edinburgh Research Explorer is retained by the author(s)and / or other copyright owners and it is a condition of accessing these publications that users recognise andabide by the legal requirements associated with these rights.
Take down policyThe University of Edinburgh has made every reasonable effort to ensure that Edinburgh Research Explorercontent complies with UK legislation. If you believe that the public display of this file breaches copyright pleasecontact [email protected] providing details, and we will remove access to the work immediately andinvestigate your claim.
Download date: 15. Jul. 2018

The genomic and epidemiological dynamics of human influenza Avirus
Andrew Rambaut1, Oliver G. Pybus2, Martha I. Nelson3, Cecile Viboud4, Jeffery K.Taubenberger5, and Edward C. Holmes3,4
1Institute of Evolutionary Biology, University of Edinburgh, Ashworth Laboratories, Edinburgh EH9 3JT,UK
2Department of Zoology, University of Oxford, South Parks Road, Oxford OX1 3PS, UK
3Center for Infectious Disease Dynamics, Department of Biology, The Pennsylvania State University, MuellerLaboratory, University Park, Pennsylvania 16802, USA
4Fogarty International Center, National Institutes of Health, Bethesda, Maryland 20892, USA
5Laboratory of Infectious Diseases, National Institute of Allergy and Infectious Diseases, National Institutesof Health, Bethesda, Maryland 20892, USA
AbstractThe evolutionary interaction between influenza A virus and the human immune system, manifest as‘antigenic drift’ of the viral haemagglutinin, is one of the best described patterns in molecularevolution. However, little is known about the genome-scale evolutionary dynamics of this pathogen.Similarly, how genomic processes relate to global influenza epidemiology, in which the A/H3N2and A/H1N1 subtypes co-circulate, is poorly understood. Here through an analysis of 1,302 completeviral genomes sampled from temperate populations in both hemispheres, we show that the genomicevolution of influenza A virus is characterized by a complex interplay between frequent reassortmentand periodic selective sweeps. The A/H3N2 and A/H1N1 subtypes exhibit different evolutionarydynamics, with diverse lineages circulating in A/H1N1, indicative of weaker antigenic drift. Theseresults suggest a sink-source model of viral ecology in which new lineages are seeded from apersistent influenza reservoir, which we hypothesize to be located in the tropics, to sink populationsin temperate regions.
Influenza is one of the most important respiratory infections of humans, responsible for 250,000to 500,000 deaths annually1. Of the three types of influenza virus, type A is the most virulentand is associated with seasonal (winter) epidemics in temperate regions, more persistenttransmission in the tropics2, and occasional large-scale global pandemics characterized byincreased morbidity and mortality.
Since the global pandemic of 1918 caused by a subtype H1N1 influenza A virus, five genomesegments have maintained an unbroken evolutionary history within humans—those encodingthe nucleocapsid protein (NP), the matrix proteins (M1 and M2) and the nonstructural proteins(NS1 and NS2), and two encoding polymerase proteins (PB2 and PA)3,4. In contrast, newhaemagglutinin (HA) and neuraminidase (NA) surface glycoproteins, as well as the PB1
Correspondence and requests for materials should be addressed to A.R. ([email protected]) and E.C.H. ([email protected])..Author Contributions A.R. and E.C.H. conceived the study. A.R. and O.G.P. undertook the genome sequence analyses and developmentof methods. E.C.H., A.R. and O.G.P. wrote the paper. M.I.N., C.V. and J.K.T. provided epidemiological and virological data. All authorsinterpreted the results and commented on the paper.Author Information Reprints and permissions information is available at www.nature.com/reprints.Full Methods and any associated references are available in the online version of the paper at www.nature.com/nature.
NIH Public AccessAuthor ManuscriptNature. Author manuscript; available in PMC 2009 May 29.
Published in final edited form as:Nature. 2008 May 29; 453(7195): 615–619.
NIH
-PA Author Manuscript
NIH
-PA Author Manuscript
NIH
-PA Author Manuscript

polymerase, have been acquired by human influenza A virus through reassortment with avianinfluenza viruses. These acquisitions coincided with global pandemics; the HA subtype H2and the NA subtype N2 appeared in 1957, the HA subtype H3 emerged in 1968, and a newPB1 segment was acquired in both 1957 and 1968. Although A/H1N1 viruses re-emerged in1977 (ref. 5) and continue to circulate, seasonal epidemics of influenza A virus since 1968have been dominated by A/H3N2 viruses6, and characterized by punctuated antigenicevolution7.
Despite the recent availability of complete genome sequence data8, many aspects of theevolutionary and epidemiological dynamics of influenza A virus remain opaque. In particular,there has been no rigorous measurement of viral diversity across time, across space and amongsubtypes. Additionally, most studies of evolutionary dynamics have focused on singlesegments, without exploring the interactions among them. Although comparative studies haverevealed that reassortment occurs frequently within A/H3N2 (refs 9, 10), within and betweenthe A/H2N2 and A/H1N1 subtypes11-13, and among avian influenza viruses14, the full extentof reassortment, and how it relates to antigenic evolution, has not been determined. At theepidemiological scale, although it is apparent that A/H3N2 and A/H1N1 experience oscillatingseasonal dynamics, the forces that determine this periodicity, and how they vary spatially, areunknown.
To help to resolve these issues, we examined in detail the evolutionary dynamics of influenzaA virus at the genomic and epidemiological scales. Using a data set of 1,302 A/H3N2 and A/H1N1 isolates sampled over a 12-yr period and that is illustrative of large populations intemperate regions from the Northern (New York state, USA) and Southern (New Zealand)Hemispheres, we quantify the genetic diversity of influenza A virus among subtypes, genomesegments and geographic locations.
Dynamics of influenza genetic diversityThe changing patterns of genetic diversity in viral isolates from New York state and NewZealand clearly reveal the seasonal dynamics of influenza A in individual temperatepopulations (Fig. 1). In the case of the better-sampled A/H3N2 subtype, the pattern exposedby our coalescent-based analysis is of an annual series of peaks in genetic diversity interspersedby strong genetic bottlenecks at the end of most influenza seasons. As expected, geneticdiversity of the New York state epidemics peak in the Northern Hemisphere winter, whereasthose of New Zealand are offset by approximately 6 months, corresponding to the SouthernHemisphere winter. (A similar pattern was observed when 123 genome sequences fromAustralia were added, suggesting that these patterns are common to other temperatepopulations, see Supplementary Information.) Furthermore, the genetic diversity of A/H3N2is usually lower in New Zealand than in New York state, probably reflecting the smaller hostpopulation in New Zealand (most isolates were sampled from Canterbury, South Island).Differences in the size of the host population may also explain why A/H3N2 in New Zealandis sometimes less diverse than A/H1N1 in New York state, even though A/H3N2 is usuallyepidemiologically dominant. The absolute amount of genetic diversity, even at seasonal peaks,is small compared to other rapidly evolving viruses that infect far fewer people15,16,suggesting that strong natural selection, in addition to periodic bottlenecks, reduces the levelof diversity that co-circulates at any time. Simulations demonstrate that our reconstructions ofgenetic diversity are robust to the sampling protocol (Supplementary Information).
More notable is that, in both populations, A/H1N1 seasons exhibiting highly defined peaks indiversity typically coincide with weakly defined peaks in A/H3N2 diversity (that is, themeasures of the epidemic ‘peakedness’ for A/H3N2 and A/H1N1 are negatively correlated;Wilcoxon signed-rank test, W = 348, n = 32, P < 0.002; Supplementary Figs 1 and 2). This
Rambaut et al. Page 2
Nature. Author manuscript; available in PMC 2009 May 29.
NIH
-PA Author Manuscript
NIH
-PA Author Manuscript
NIH
-PA Author Manuscript

implies an evolutionary interaction between subtypes; for example, that A/H1N1 epidemicsare suppressed by herd immunity when A/H3N2 is dominant, or that A/H3N2 out-competesA/H1N1, perhaps owing to greater replicative fitness. Consistent with our observation, A/H1N1 only dominates in seasons following unusually mild H3N2 epidemics17, and infectionwith one subtype can protect against reinfection with the other in sequential epidemics18.Furthermore, since 1977, A/H1N1 epidemics exhibit lower mortality rates than A/H3N2epidemics (refs 19 and 20) and are less spatially synchronized21-23. In both hemispheres, A/H1N1 seems less prone to the seasonal genetic bottlenecks that characterize A/H3N2,suggesting that genetically diverse A/H1N1 lineages are better able to coexist. This mightindicate that antigenic selection acts with less potency on A/H1N1, manifest as lower rates ofamino acid fixation in HA1 (ref. 17), so that the selective turnover of lineages occurs moreslowly17,24.
The persistence of viral diversity between epidemic peaks for A/H3N2 and A/H1N1 has twoexplanations: that chains of infection are surviving in each population and across inter-epidemic intervals, or that genetic diversity is imported into temperate populations each year.Phylogenetic evidence strongly weighs against the former, because there are few directphylogenetic links between influenza A viruses sampled in successive seasons from specificlocations, as expected if in situ evolution was commonplace25,26. Furthermore, a high risk ofstochastic extinction makes the repeated survival of small chains of infection betweensuccessive epidemics unlikely. Additionally, the dates of segment ancestry in the New Yorkstate 1999-2000 season reappeared precisely in the 2002-2003 season, after a major bottleneckin the A/H1N1-dominant 2000-2001 season, strongly suggesting that diversity was maintainedin a reservoir population.
Extrapolating the evolutionary dynamics of influenza in New York state and New Zealand toother comparable populations in the Northern and Southern Hemispheres leads us to proposea ‘source-sink’ model for the global ecology of influenza A virus (Fig. 2). Continual—butlargely unidirectional—gene flow from a common source population (or a linked network ofsource populations24,27) provides the viruses that ignite each epidemic in populations of theNorthern and Southern Hemispheres. Although southern China has been proposed as theepicentre of influenza A virus28, it is possible that tropical regions generally represent idealsource populations because of extended viral transmission2. A necessary consequence of thismodel is that selection-driven antigenic drift will be much more efficient in the sourcepopulation, the long-term effective size of which is maintained by a high background infectionrate and by the absence of the severe population bottlenecks associated with temperatelocalities2. Hence, the observation of antigenic change in temperate populations is a secondaryeffect of selection within, and gene flow from, the source population. This explains the paradoxof there being frequent positive selection on HA across seasons at a global scale29-31 but littleevidence for antigenic drift at the scale of individual seasonal epidemics in those temperatepopulations studied so far26,32. To test this hypothesis, it will be essential to obtain moreinfluenza virus samples from tropical regions, such as South-East Asia.
Genomic diversity and reassortmentTo determine the genome-wide evolutionary dynamics of human influenza A, we inferred thepopulation genetic history of each segment of A/H3N2 viruses sampled from New York state(the largest data set). This analysis demonstrated that, at any given time, individual segmentscan differ substantially in their relative genetic diversity and hence in phylogenetic history(Supplementary Fig. 3).
To determine the causes of these differences in genetic diversity, we estimated the time to themost recent common ancestor (TMRCA) of each segment for each influenza season (Fig. 3a;
Rambaut et al. Page 3
Nature. Author manuscript; available in PMC 2009 May 29.
NIH
-PA Author Manuscript
NIH
-PA Author Manuscript
NIH
-PA Author Manuscript

the highest posterior density intervals for each estimate are shown in Supplementary Fig. 4).Most TMRCAs fall well before the start of the season from which they were sampled, suchthat multiple lineages persist across multiple epidemic troughs, consistent with our source-sinkmodel. TMRCAs also vary among segments and among years, reflecting the interactingprocesses of genomic reassortment, natural selection and gene flow. For example, theTMRCAs of the NP segment are usually greater than those of the HA segment, indicating thatgenetic diversity persists for longer in the former. These changing patterns of diversity providea unique insight into genome-wide evolutionary processes. In particular, the 2001-2002 seasonis characterized by reduced TMRCAs across the entire A/H3N2 genome (following a dominantA/H1N1 season), such that all segments have approximately the same TMRCA, stronglysuggesting a genome-wide selective sweep. In the following 2002-2003 season, geneticdiversity reappears at the genomic scale, so that all segments have TMRCAs dating no laterthan 1999-2000. Subsequently, in 2003-2004, the HA segment alone has a reduced TMRCA,indicating that it underwent a selective sweep, with reassortment maintaining the diversity ofother segments. Another genome-wide selective sweep is reflected in the tight TMRCAs of2004-2005.
An analysis of the HA and NA from A/H1N1 in New York state and New Zealand reveals asimilar pattern of temporal fluctuations in diversity (Fig. 3b). However, the TMRCAs are oftenmuch greater than those observed for A/H3N2 in the same year, providing further evidencethat greater variation persists among epidemic seasons in A/H1N1 than in A/H3N2. This maybe due to a smaller effective population size or weaker immune selection in A/H1N1, such thatnatural selection is less effective at fixing advantageous variants.
The occurrence of reassortment and natural selection also coincides with changes in HAantigenicity (Fig. 3a). The earliest antigenic transition in our data is between Beijing/1993(BE93)-like and Wuhan/1995 (WU95)-like viruses7. This is associated with a sharp increasein the TMRCA of PB2 in the 1996-1997 season, owing to the reappearance of a lineage presentuntil 1994-1995, coupled with reassortment. Similarly, the WU95 to Sydney/1997-like virus(SY97) transition coincides with a marked reduction in the genetic diversity of all segmentsother than M1/2, in which reassortment has unlinked this segment from the rest of the genome,whereas a new HA lineage is acquired at the time of the SY97 to Fujian/2002-like virus (FU02)antigenic change33. Finally, the genome-wide selective sweep of 2004-2005 coincides withthe FU02 to California/2004-like virus (CA04) antigenic transition.
Evolutionary interactions among segmentsWe used multivariate statistics to summarize the differences in phylogenetic history amongsegments for A/H3N2 viruses from New York state (Fig. 4 and Supplementary Fig. 12). Eachcloud of points of equal colour corresponds to a specific segment of the influenza virus genome,with the spread of points within a cloud representing the statistical uncertainty in thephylogenetic history of that segment. Clearly, the differences in history among segments aregreater than the estimation error for each segment. The most prominent result is the divergentposition of HA, particularly in relation to NA, even though both encode surface glycoproteins.These differences in evolutionary history are compatible with frequent reassortment,suggesting that the HA segment is continually placed in new genomic backgrounds, perhapsgreatly affecting virus fitness.
In contrast, there is clear similarity in the phylogenetic histories of the HA and M1/2 segments,compatible with the observations that HA interacts structurally with M1 in viral assembly andthat the M2 ion channel balances the pH for optimal HA fusion34-38. There is also a similarityin phylogenetic history among the NS and NP segments, and to a lesser extent among the PB2,PB1 and PA polymerase complex segments, suggesting that they are subject to varying degrees
Rambaut et al. Page 4
Nature. Author manuscript; available in PMC 2009 May 29.
NIH
-PA Author Manuscript
NIH
-PA Author Manuscript
NIH
-PA Author Manuscript

of physical linkage. Elucidating the physiological basis for these linkage patterns willundoubtedly provide information about the emergence of pandemic strains of influenza virus.
Further insights into segment interactions are provided by an analysis of evolutionary rates inA/H3N2 isolates from New York state (Supplementary Fig. 5). We identified a major ratedifference between those segments expressed on the surface of the virion (high rates) and thosethat only have internal functions (low rates); the exception to this was the NS segment, forwhich only the NS2 protein is a minor virion component. As expected given its role in immuneevasion, the HA protein exhibits the highest overall rate of evolutionary change (mean of 5.72× 10⁻³ nucleotide substitutions per site per year (subs per site per year), 95% highest posteriordensity interval 5.17, 6.28 × 10⁻³ subs per site per year), as well as the highest rate ofnonsynonymous substitution, indicated by the relative rates at the first and second versus thethird codon positions. More surprisingly, the M1/2, NS1/2 and NA segments evolve at ratesoverlapping those of HA (mean of 5.20 × 10⁻³ subs per site per year (95% highest posteriordensity interval 4.36, 6.07 × 10⁻³ subs per site per year), 5.39 × 10⁻³ (4.48, 6.35 × 10⁻³) and5.41 × 10-3 (4.81, 5.99 × 10⁻³), respectively), although with lower rates of nonsynonymouschange. In contrast, the three segments that constitute the viral polymerase, as well as the RNA-binding NP, exhibit markedly lower rates at all sites and at the first and second codon positionsonly, revealing stronger selective constraints against amino acid variation.
Because the NA and HA segments have different phylogenetic histories, their similarities inoverall evolutionary rate are unlikely to be wholly due to genetic linkage. Hence, the NA isalso likely to be subject to relatively strong positive selection, either for antigenic variation orfor functional compatibility with HA39. Immunemediated selection may also explain theincreased rates in M1/2 and NS1/2. The extracellular domain of the M2 ion channel is a keytarget in the development of a ‘universal’ influenza vaccine40, whereas the M1 protein is themajor component of the viral capsid and a potential target of cellular immune responses41.Likewise, NS1 encodes a pleiotropic, nonstructural protein that downregulates double-stranded-RNA-induced antiviral responses42, or that perhaps co-evolves with the PB1 segmentas observed in the last two pandemics30,43.
ConclusionsOur analyses suggest that the evolutionary dynamics of influenza A virus are shaped by acomplex interplay between rapid mutation, frequent reassortment, widespread gene flow,natural selection (occasionally generating genome-wide selective sweeps), functionalinteractions among segments, and global epidemiological dynamics. Although the increasedrates of evolution in HA support models in which this protein is subject to strong selection forimmune escape, the high rates of evolutionary change in other virion-associated proteins (thathave different phylogenetic histories to HA) indicate that they are likewise subject to strongpositive selection. It is possible that a significant component of this adaptation involvesoptimizing the functional compatibility of segments; for example, a new HA variant may notincrease fitness unless it is linked to functionally compatible segments. Such a phenomenonmay explain why the lineage leading to the FU02 antigenic type did not dominate the viralpopulation until a few years after its initial appearance and co-incident with an HA reassortmentevent33.
Equally notable was the high degree of genomic reassortment and its association with periodicselective sweeps. It is therefore crucial to consider the process of antigenic drift within thecontext of frequent reassortment and genome-wide epistatic interactions. Reassortment placesantigenically novel HA variants into different genomic back-grounds, a fraction of which mayrestore, or even increase, the viral replicative fitness that may have been lost as a result of thechange in HA. Although it is unlikely that the reassortment rate per se varies among segments,
Rambaut et al. Page 5
Nature. Author manuscript; available in PMC 2009 May 29.
NIH
-PA Author Manuscript
NIH
-PA Author Manuscript
NIH
-PA Author Manuscript

it is probable that most reassortments involving certain segment combinations are deleterious—such as those involving HA and M1/2, which seem to be relatively tightly linked—and areremoved by purifying selection, giving rise to the similarities and differences in phylogenetichistory discovered here.
In addition to genome-wide interactions, it is essential to consider the complex spatialepidemiological dynamics of influenza if we are to fully understand antigenic evolution. Weobserved consistent dynamical patterns in two populations illustrative of temperate regions inthe Northern and Southern Hemispheres, together with the persistence of viral lineages acrossmultiple epidemics. To resolve these apparently contradictory observations, we propose theexistence of a continuous reservoir or source population, within which the strong selection forantigenic change takes place. Such complexity necessarily means that the long-term successof any individual lineage of influenza virus is dependent not only on its antigenic propertiesbut also on its replicative capacity, its transmissibility and the environmental factors thatperhaps underlie the seasonality of influenza in temperate regions. In this context, it is importantto determine the precise reasons why antigenic evolution proceeds at a reduced pace in A/H1N1, such that multiple lineages co-circulate globally, even though this subtype isoccasionally the major cause of seasonal influenza.
METHODS SUMMARYComplete genome sequences of A/H3N2 and A/H1N1 influenza viruses from New York state,USA, and New Zealand, were collated from the NCBI Influenza Database as part of theInfluenza Genome Sequencing Project8,44. Sequence alignments representing each genomicsegment, viral subtype and sampling location were assembled. Evolutionary dynamics wereestimated for each data set using an established bayesian Markov chain Monte Carlo (MCMC)approach45,46 that incorporates the exact day of viral sampling. Each MCMC analysis resultedin marginal posterior estimates of: the rate of nucleotide substitution (Supplementary Fig. 5);the relative evolutionary rate at the first and second versus the third codon positions(Supplementary Fig. 5); and the dynamics of population genetic diversity through time (seeFig. 1 and Supplementary Fig. 4). Additionally, an estimate of the posterior distribution ofgenealogies that relate the sequence data was inferred concurrently for each alignment. Fromthese distributions, we obtained the marginal posterior estimate of the TMRCA of eachgenomic segment in each influenza season (Fig. 3a, b). Differences between the node-heightdistributions of each posterior set of genealogies were visualized using multidimensionalscaling (Fig. 4). The node heights and topological structure of each genealogical distributionwas summarized using the maximum clade support approach (Supplementary Fig. 3).
Supplementary MaterialRefer to Web version on PubMed Central for supplementary material.
Acknowledgements
This research was supported in part by the Intramural Research Program of the NIH, Fogarty International Center, theNational Institute of Allergy and Infectious Diseases and the National Institute of General Medical Sciences. A.R. andO.G.P. are supported by The Royal Society of London. A.R. works as a part of the Interdisciplinary Centre for Humanand Avian Influenza Research (ICHAIR).
APPENDIX
METHODSTo examine the interaction between the H1N1 and H3N2 subtypes of human influenza A virusand the seasonal fluctuations in the Northern and Southern Hemispheres, we compiled the HA
Rambaut et al. Page 6
Nature. Author manuscript; available in PMC 2009 May 29.
NIH
-PA Author Manuscript
NIH
-PA Author Manuscript
NIH
-PA Author Manuscript

and NA genes (coding regions only) for A/H1N1 in New York state (81 isolates sampledbetween 1995 and 2003) and in New Zealand (127 isolates sampled between 2000 and 2005),as well as for A/H3N2 in New York state (687 isolates sampled between 1993 and 2005) andin New Zealand (407 isolates between 2000 and 2005). Influenza is strongly seasonal in bothlocalities, with few reported cases outside of their respective winters (data available at theWorld Health Organization ‘FluNet’ surveillance system;http://gamapserver.who.int/GlobalAtlas/home.asp). To examine genome-wide evolutionaryprocesses in more detail, we conducted an equivalent analysis on each segment of the 687isolates of A/H3N2 sampled from New York state. For each segment, the protein-codingregions were extracted and aligned. For segments with more than one gene (M1/2 and NS1/2),both genes were concatenated, with overlapping codons included only once (seeSupplementary Information). In all cases, alignment was unambiguous, resulting in thefollowing data sets: PB2 (2,277 nucleotides), PB1 (2,271 nucleotides), PA (2,148 nucleotides),HA (1,698 nucleotides), NP (1,494 nucleotides), NA (1,407 nucleotides), M1/2 (979nucleotides) and NS1/2 (835 nucleotides). A full list of viral isolates, along with their GenBankaccession numbers, is available as Supplementary Information.
We used a flexible demographic model to examine the seasonal changes in genetic diversityover the sampling time span47. This approach, based on the coalescent48, allows the overallgenetic diversity of a population to be estimated from a small sample of genetic sequences. Anestimate of the change in diversity over time can be obtained for a given genealogy47.Individual estimates obtained from many different genealogies are combined, with genealogiesand parameter values sampled according to their relative probability, given the sequencedata45,46. In the absence of natural selection, the genetic diversity measure obtained reflectsthe change in effective number of infections over time (Neτ, where τ is the average generationtime). Because strong natural selection has previously been demonstrated for influenza A virus,we interpret these plots as measures of relative genetic diversity. The MCMC approachimplemented in the BEAST package has the advantage that it is not conditioned on a single,and potentially unrepresentative, estimate of the underlying genealogy. It provides marginalposterior estimates of all the parameters of the substitution process including the overall rateof molecular evolution and the times of all the nodes in the genealogy—a timescale that isinformed by the known dates (days) of sampling of the sequences and the amount of geneticchange between them45,49. Indeed, the use of sequences that have been sampled over manyseasons allows the reconstruction of fluctuating dynamics limited by the date of the earliestsample (see Supplementary Information).
For these analyses, we used a nucleotide-substitution model that accommodates the differentrates of and constraints on evolution at the different codon positions50. This allows us toestimate the overall rate of molecular evolution for each gene and the relative rate of first andsecond codon position to the third—a measure of the constraint against amino acid change thatcorrelates strongly with the ratio of nonsynonymous to synonymous nucleotidesubstitutions50.
We investigated the effect of reassortment among segments by comparing the correlation ofphylogenetic trees sampled independently for each segment. For each tree, we identified themost recent common ancestor of the samples from each season and plotted a marginal posteriorprobability distribution for the time of these nodes (Fig. 3). Furthermore, we estimated oneminus the correlation coefficient of these TMRCAs both within and between a sample of 500trees from the posterior distribution obtained from the MCMC analysis of each genomicsegment. These relationships were plotted using the multi-dimensional scaling dimensionreduction technique (Fig. 4) and pair-wise in Supplementary Fig. 12.
Rambaut et al. Page 7
Nature. Author manuscript; available in PMC 2009 May 29.
NIH
-PA Author Manuscript
NIH
-PA Author Manuscript
NIH
-PA Author Manuscript

For each segment alignment, we used two independent runs of BEAST of 100,000,000 stepssampling trees and parameters every 10,000 steps. The two runs were compared to confirmthat both had converged and were sampling the same distributions, and were then combined(having removed 10% as ‘burn-in’). All the results here were summarized from the remaining18,000 sampled trees or parameter values.
References47. Drummond AJ, Rambaut A, Shapiro B, Pybus OG. Bayesian coalescent inference of past population
dynamics from molecular sequences. Mol. Biol. Evol 2005;22:1185–1192. [PubMed: 15703244]48. Kingman J. The coalescent. Stochastic Process. Appl 1982;13:235–248.49. Rambaut A. Estimating the rate of molecular evolution: Incorporating noncontemporaneous
sequences into maximum likelihood phylogenies. Bioinformatics 2000;16:395–399. [PubMed:10869038]
50. Shapiro B, Rambaut A, Drummond AJ. Choosing appropriate substitution models for the phylogeneticanalysis of protein-coding sequences. Mol. Biol. Evol 2006;23:7–9. [PubMed: 16177232]
References1. WHO. Fact sheet Number 211. Influenza. 2003. http://www.who.int/mediacentre/factsheets/fs211/)2. Viboud C, Alonso WJ, Simonsen L. Influenza in tropical regions. PLoS Med 2006;3:e89. [PubMed:
16509764]3. Reid AH, Taubenberger JK, Fanning TG. Evidence of an absence: the genetic origins of the 1918
pandemic influenza virus. Nature Rev. Microbiol 2004;2:909–914. [PubMed: 15494747]4. Taubenberger JK, et al. Characterization of the 1918 influenza virus polymerase genes. Nature
2005;437:889–893. [PubMed: 16208372]5. Scholtissek C, von Hoyningen V, Rott R. Genetic relatedness between the new 1977 epidemic strains
(H1N1) of influenza and human influenza strains isolated between 1947 and 1957 (H1N1). Virology1978;89:613–617. [PubMed: 716220]
6. Taubenberger JK, Morens DM. 1918 Influenza: the mother of all pandemics. Emerg. Infect. Dis2006;12:15–22. [PubMed: 16494711]
7. Smith DJ, et al. Mapping the antigenic and genetic evolution of influenza virus. Science 2004;305:371–376. [PubMed: 15218094]
8. Ghedin E, et al. Large-scale sequencing of human influenza reveals the dynamic nature of viral genomeevolution. Nature 2005;437:1162–1166. [PubMed: 16208317]
9. Lindstrom SE, et al. Phylogenetic analysis of the entire genome of influenza A (H3N2) viruses fromJapan: evidence for genetic reassortment of the six internal genes. J. Virol 1998;72:8021–8031.[PubMed: 9733841]
10. Schweiger B, Bruns L, Meixenberger K. Reassortment between human A(H3N2) viruses is animportant evolutionary mechanism. Vaccine 2006;24:6683–6690. [PubMed: 17030498]
11. Gregory V, et al. Emergence of influenza A H1N2 reassortant viruses in the human population during2001. Virology 2002;300:1–7. [PubMed: 12202200]
12. Lindstrom SE, Cox NJ, Klimov A. Genetic analysis of human H2N2 and early H3N2 influenza viruses,1957-1972: evidence for genetic divergence and multiple reassortment events. Virology2004;328:101–119. [PubMed: 15380362]
13. Young JF, Palese P. Evolution of human influenza A viruses in nature: recombination contributes togenetic variation of H1N1 strains. Proc. Natl Acad. Sci. USA 1979;76:6547–6551. [PubMed:293742]
14. Macken CA, Webby RJ, Bruno WJ. Genotype turnover by reassortment of replication complex genesfrom avian influenza A virus. J. Gen. Virol 2006;87:2803–2815. [PubMed: 16963738]
15. Carrington C, Foster J, Pybus O, Bennett S, Holmes E. Invasion and maintenance of dengue virustype 2 and type 4 in the Americas. J. Virol 2005;79:14680–14687. [PubMed: 16282468]
16. Lemey P, Rambaut A, Pybus O. HIV evolutionary dynamics within and among hosts. AIDS Rev2006;8:125–140. [PubMed: 17078483]
Rambaut et al. Page 8
Nature. Author manuscript; available in PMC 2009 May 29.
NIH
-PA Author Manuscript
NIH
-PA Author Manuscript
NIH
-PA Author Manuscript

17. Wolf YI, Viboud C, Holmes EC, Koonin EV, Lipman DJ. Long intervals of stasis punctuated bybursts of positive selection in the seasonal evolution of influenza A virus. Biol. Direct 2006;1:34.[PubMed: 17067369]
18. Sonoguchi T, Naito H, Hara M, Takeuchi Y, Fukumi H. Cross-subtype protection in humans duringsequential, overlapping, and/or concurrent epidemics caused by H3N2 and H1N1 influenza viruses.J. Infect. Dis 1985;151:81–88. [PubMed: 3965596]
19. Kaji M, Watanabe A, Aizawa H. Differences in clinical features between influenza A H1N1, A H3N2,and B in adult patients. Respirology 2003;8:231–233. [PubMed: 12753540]
20. Wright PF, Thompson J, Karzon DT. Differing virulence of H1N1 and H3N2 influenza strains. Am.J. Epidemiol 1980;112:814–819. [PubMed: 7457472]
21. Hay AJ, Gregory V, Douglas AR, Lin YP. The evolution of human influenza viruses. Phil. Trans. R.Soc. Lond. B 2001;356:1861–1870. [PubMed: 11779385]
22. Finkelman B, et al. Global patterns in seasonal activity of influenza A/H3N2, A/H1N1, and B from1997 to 2005: viral coexistence and latitudinal gradients. PLoS ONE 2007;2:e1296. [PubMed:18074020]
23. Viboud C, et al. Synchrony, waves, and spatial hierarchies in the spread of influenza. Science2006;312:447–451. [PubMed: 16574822]
24. Ferguson NM, Galvani AP, Bush RM. Ecological and immunological determinants of influenzaevolution. Nature 2003;422:428–433. [PubMed: 12660783]
25. Nelson MI, Simonsen L, Viboud C, Miller MA, Holmes EC. Phylogenetic analysis reveals the globalcirculation pattern of seasonal influenza A viruses. PLoS Pathog 2007;3:e131.
26. Nelson MI, et al. Stochastic processes are key determinants of short-term evolution in influenza Avirus. PLoS Pathog 2006;2:e125. [PubMed: 17140286]
27. Alonso WJ, et al. Seasonality of influenza in Brazil: a traveling wave from the Amazon to thesubtropics. Am. J. Epidemiol 2007;165:1434–1442. [PubMed: 17369609]
28. Shortridge KF. Is China an influenza epicentre? Chin. Med. J. (Engl.) 1997;110:637–641. [PubMed:9594271]
29. Bush RM, Fitch WM, Bender CA, Cox NJ. Positive selection on the H3 hemagglutinin gene of humaninfluenza virus A. Mol. Biol. Evol 1999;16:1457–1465. [PubMed: 10555276]
30. Fitch WM, Leiter JM, Li XQ, Palese P. Positive Darwinian evolution in human influenza A viruses.Proc. Natl Acad. Sci. USA 1991;88:4270–4274. [PubMed: 1840695]
31. Shih AC, Hsiao TC, Ho MS, Li WH. Simultaneous amino acid substitutions at antigenic sites driveinfluenza A hemagglutinin evolution. Proc. Natl Acad. Sci. USA 2007;104:6283–6288. [PubMed:17395716]
32. Lavenu A, et al. Detailed analysis of the genetic evolution of influenza virus during the course of anepidemic. Epidemiol. Infect 2006;134:514–520. [PubMed: 16316493]
33. Holmes EC, et al. Whole-genome analysis of human influenza A virus reveals multiple persistentlineages and reassortment among recent H3N2 viruses. PLoS Biol 2005;3:e300. [PubMed:16026181]
34. Ali A, Avalos RT, Ponimaskin E, Nayak DP. Influenza virus assembly: effect of influenza virusglycoproteins on the membrane association of M1 protein. J. Virol 2000;74:8709–8719. [PubMed:10954572]
35. Barman S, Ali A, Hui EK, Adhikary L, Nayak DP. Transport of viral proteins to the apical membranesand interaction of matrix protein with glycoproteins in the assembly of influenza viruses. Virus Res2001;77:61–69. [PubMed: 11451488]
36. Enami M, Enami K. Influenza virus hemagglutinin and neuraminidase glycoproteins stimulate themembrane association of the matrix protein. J. Virol 1996;70:6653–6657. [PubMed: 8794300]
37. Ohuchi M, et al. Rescue of vector-expressed fowl plague virus hemagglutinin in biologically activeform by acidotropic agents and coexpressed M2 protein. J. Virol 1994;68:920–926. [PubMed:8289394]
38. Takeuchi K, Lamb RA. Influenza virus M2 protein ion channel activity stabilizes the native form offowl plague virus hemagglutinin during intracellular transport. J. Virol 1994;68:911–919. [PubMed:7507186]
Rambaut et al. Page 9
Nature. Author manuscript; available in PMC 2009 May 29.
NIH
-PA Author Manuscript
NIH
-PA Author Manuscript
NIH
-PA Author Manuscript

39. Mitnaul LJ, et al. Balanced hemagglutinin and neuraminidase activities are critical for efficientreplication of influenza A virus. J. Virol 2000;74:6015–6020. [PubMed: 10846083]
40. Gerhard W, Mozdzanowska K, Zharikova D. Prospects for universal influenza virus vaccine. Emerg.Infect. Dis 2006;12:569–574. [PubMed: 16704803]
41. Berkhoff EG, et al. Functional constraints of influenza A virus epitopes limit escape from cytotoxicT lymphocytes. J. Virol 2005;79:11239–11246. [PubMed: 16103176]
42. Krug RM, Yuan W, Noah DL, Latham AG. Intracellular warfare between human influenza virusesand human cells: the roles of the viral NS1 protein. Virology 2003;309:181–189. [PubMed:12758165]
43. Ludwig S, Schultz U, Mandler J, Fitch WM, Scholtissek C. Phylogenetic relationship of thenonstructural (NS) genes of influenza A viruses. Virology 1991;183:566–577. [PubMed: 1830182]
44. Influenza Genome Sequencing Project. 2007.http://www.niaid.nih.gov/dmid/genomes/mscs/influenza.htm
45. Drummond AJ, Nicholls GK, Rodrigo AG, Solomon W. Estimating mutation parameters, populationhistory and genealogy simultaneously from temporally spaced sequence data. Genetics2002;161:1307–1320. [PubMed: 12136032]
46. Drummond AJ, Rambaut A. BEAST: bayesian evolutionary analysis sampling trees. BMC Evol. Biol2007;7:214. [PubMed: 17996036]
Rambaut et al. Page 10
Nature. Author manuscript; available in PMC 2009 May 29.
NIH
-PA Author Manuscript
NIH
-PA Author Manuscript
NIH
-PA Author Manuscript

Figure 1. Population dynamics of genetic diversity in influenza A virusBayesian skyline plots of the HA and NA segments for the A/H3N2 and A/H1N1 subtypes inNew York state (top) and New Zealand (bottom). The horizontal shaded blocks represent thewinter seasons. The y-axes represent a measure of relative genetic diversity (see Methods fordetails). The shorter timescale of New Zealand skyline plot is due to the shorter samplingperiod.
Rambaut et al. Page 11
Nature. Author manuscript; available in PMC 2009 May 29.
NIH
-PA Author Manuscript
NIH
-PA Author Manuscript
NIH
-PA Author Manuscript

Figure 2. A ‘source-sink’ model for the evolution of influenza A virusViral genetic and antigenic diversity (shown by different colours) is continuously generated ina reservoir, or ‘source’ population, perhaps represented by the tropics, before being exportedto ‘sink’ populations in the Northern and Southern Hemispheres as shown by the arrows. Thecontinuous transmission of influenza A virus in the source population, and hence its largereffective population size, allows natural selection for antigenic diversity to proceed moreefficiently than in the sink populations that are afflicted by major seasonal bottlenecks.
Rambaut et al. Page 12
Nature. Author manuscript; available in PMC 2009 May 29.
NIH
-PA Author Manuscript
NIH
-PA Author Manuscript
NIH
-PA Author Manuscript

Figure 3. Population genetic history of human influenza A virusa, b, Time to the most recent common ancestor (TMRCA) of each genomic segment for A/H3N2 isolates circulating each season in New York state (a) and HA and NA genomic segmentsfor the A/H3N2 and A/H1N1 isolates circulating in New York state and New Zealand (b). Thevalues shown represent the mean and 95% highest posterior density intervals for TMRCAsestimated across the trees sampled using bayesian MCMC analyses. Explicit posteriorprobabilities of whether any season has a TMRCA that is older than that of each precedingseason are given in Supplementary Table 1. The diagonal line goes through 1st January of eachseason (1st July for New Zealand), approximating the seasonal mid-point. The timescale ofmajor changes in antigenic (HA) type in the United States is also depicted. In the NorthernHemisphere, individual influenza seasons straddle two years, whereas in the SouthernHemisphere they are contained within one calendar year.
Rambaut et al. Page 13
Nature. Author manuscript; available in PMC 2009 May 29.
NIH
-PA Author Manuscript
NIH
-PA Author Manuscript
NIH
-PA Author Manuscript
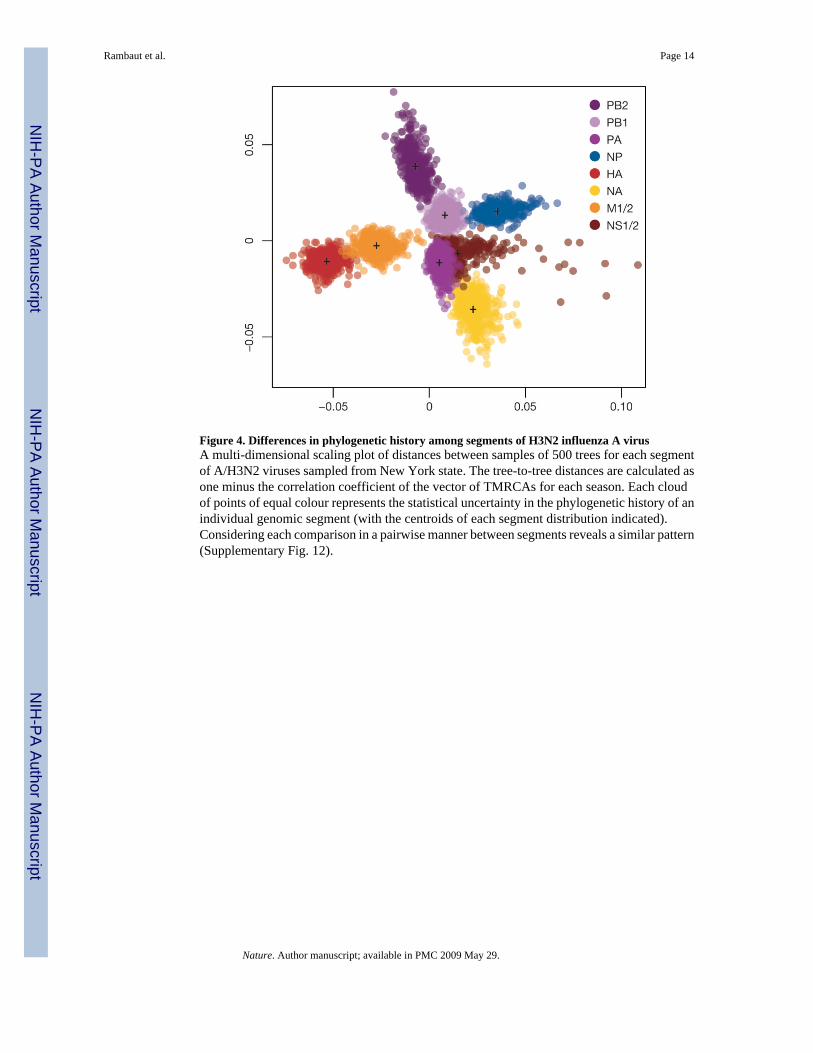
Figure 4. Differences in phylogenetic history among segments of H3N2 influenza A virusA multi-dimensional scaling plot of distances between samples of 500 trees for each segmentof A/H3N2 viruses sampled from New York state. The tree-to-tree distances are calculated asone minus the correlation coefficient of the vector of TMRCAs for each season. Each cloudof points of equal colour represents the statistical uncertainty in the phylogenetic history of anindividual genomic segment (with the centroids of each segment distribution indicated).Considering each comparison in a pairwise manner between segments reveals a similar pattern(Supplementary Fig. 12).
Rambaut et al. Page 14
Nature. Author manuscript; available in PMC 2009 May 29.
NIH
-PA Author Manuscript
NIH
-PA Author Manuscript
NIH
-PA Author Manuscript