edelweiss fund scorebook · strictly private and confidential edelweiss fund scorebook guide to the...
TRANSCRIPT

Strictly Private and Confidential
Edelweiss Fund Scorebook
Guide to the top Mutual Funds
Edelweiss – Ideas create, values protect
Oct - Dec Quarter – FY 2015-16
Industry AUM Trends
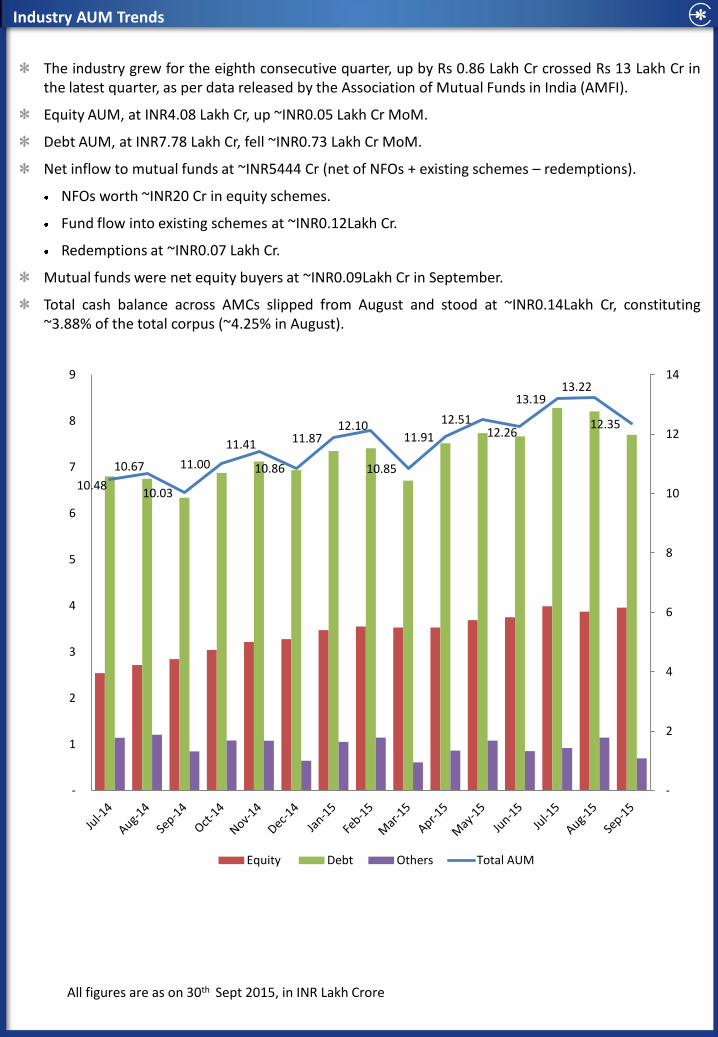
The industry grew for the eighth consecutive quarter, up by Rs 0.86 Lakh Cr crossed Rs 13 Lakh Cr in the latest quarter, as per data released by the Association of Mutual Funds in India (AMFI).
Equity AUM, at INR4.08 Lakh Cr, up ~INR0.05 Lakh Cr MoM.
Debt AUM, at INR7.78 Lakh Cr, fell ~INR0.73 Lakh Cr MoM.
Net inflow to mutual funds at ~INR5444 Cr (net of NFOs + existing schemes – redemptions).
NFOs worth ~INR20 Cr in equity schemes.
Fund flow into existing schemes at ~INR0.12Lakh Cr.
Redemptions at ~INR0.07 Lakh Cr.
Mutual funds were net equity buyers at ~INR0.09Lakh Cr in September.
Total cash balance across AMCs slipped from August and stood at ~INR0.14Lakh Cr, constituting ~3.88% of the total corpus (~4.25% in August).
All figures are as on 30th Sept 2015, in INR Lakh Crore
10.48
10.67
10.03
11.00
11.41
10.86
11.87 12.10
10.85
11.91
12.51 12.26
13.19 13.22
12.35
-
2
4
6
8
10
12
14
-
1
2
3
4
5
6
7
8
9
Equity Debt Others Total AUM
EQUITY MUTUAL FUNDS
Inflow of ~INR5444 CR into equity schemes (net of NFOs + existing schemes – redemptions) in September. For the seventeenth straight month, flows have remained positive. Fund flow into existing schemes was at ~INR12532Cr, while redemptions stood at INR7108 Cr.
As equity markets world over displayed weakness in the early part of September, Nifty was no different. However, with the FOMC dithering on the rate lift-off and RBI aggressively resorting to monetary easing, sentiments have shown some signs of improvement. Key events like ongoing Bihar elections and Q2FY16 earnings season should set the tone for October.
The correction offered funds a chance to lap up quality large-cap names like HDFC Bank, Infosys, L&T and Axis Bank. On the other hand, funds trimmed positions in IDFC (ahead of demerger of IDFC Bank), Maruti (expensive valuations), Wipro and Dr Reddys Labs.
Fair bit of churning was seen in the IT space. Funds were also seen adding beaten down erstwhile Street favorites like Tata Motors and ONGC.
HDFC Mutual Fund's major additions were HDFC Bank (INR145Cr), ICICI Bank(INR87Cr) and Power Grid (INR85 Cr). Its major reductions were Emami (INR 65Cr), BPCL (INR 62 Cr) and P&G (INR6 Cr). Prabhat Dairy (IPO) was a fresh inclusion in the portfolio. Gateway Distriparks and Amtek Auto were complete exits.
Reliance Mutual Fund's major additions were HDFC (INR 115Cr), SBI(INR 99Cr) and ICICI Bank(INR 9Cr). Its major reductions were Maruti (INR262 Cr), Indiabulls Housing Finance(INR 71 Cr) and Cadila Healthcare(INR 71 Cr). Bajaj Corp and SMS Pharma were new additions in August. Kaveri Seed was a prominent exit.
ICICI Prudential Mutual Fund's significant additions were Reliance (INR 345 Cr), L&T (INR 279Cr) and Cipla(INR 249Cr).Its major reductions were IDFC(INR 308Cr), Dr.Reddy’s Lab (INR 215Cr) and Bata India (INR 212 Cr). Allahabad Bank was prominent new entry, while Ceat was a complete exit in September.
Franklin Templeton Mutual Fund's major additions were LT (INR 75 Cr), Ultratech Cement (INR 74 Cr) and ICICI Bank (INR 68 Cr). It's major reductions were Bajaj Auto (INR 28 Cr), CRISIL (INR 25 Cr) and Wipro(INR 24 Cr) . Adani Ports was a new entry and NMDC was a complete exit.
UTI Mutual Fund's major additions were IDFC and Mahindra & Mahindra Financial Services (INR122 Cr each) and Aditya Birla Nuvo (INR50 Cr). Its major reductions were ICICI Bank (INR79 Cr), Maruti (INR 29Cr) and Bharat Forge (INR 28 Cr). SKS Microfinance was a new entrant while Amtek Auto was a complete exit in September.
Birla SL Mutual Fund's major additions were Infosys (INR 223 Cr), Coal India (INR 187 Cr) and LT (INR 150 Cr). It's major reductions were Wipro (INR 141Cr), IDFC (INR120 Cr) and Motherson Sumi (INR 57 Cr). Adani Ports was the new entry and NALCO complete exit.
Equity: What's in, What's out?

LARGE CAP FUNDS • Birla SL Frontline Equity Fund
• SBI Bluechip Fund
• Franklin India Prima Plus Fund
• L&T Equity Fund
Birla SL Frontline Equity Large Cap
SCHEME INFO
RATIOS (For 1 year ended Sept’15)
TOP 5 HOLDINGS
ATTRIBUTION ANALYSIS (Qtr ended Sept 2015)
SCHEME DESCRIPTION
Source: ACE MF, Morningstar Direct. Data is as of 30th Sept 2015 wherever not mentioned. Best & Worst performance is calculated on YoY daily rolling basis.
Best Month Worst Month
Fund: 31.64% Index: 32.36%
Fund: -21.06% Index: -21.36%
MARKET CAP BREAK UP
PERFORMANCE – 5 Years
BEST/WORST RETURNS (as of 30th Sept 2015)
Market Cap Definition(INR Cr.): Giant Cap: >89,000, Large Cap: 20,000-89,000, Mid Cap: 5,900-20,000, Small Cap: 1,600-5,900 & Microcap: <1,600
Sector Name % Holding Company Name % Holding
Financial Services 30.0 HDFC Bank Ltd 6.46
Technology 17.5 Infosys Ltd 6.16
Consumer Cyclical 12.9 ICICI Bank Ltd 4.29
Healthcare 9.3 ITC Ltd 3.38
Basic Materials 7.5 Reliance Industries Ltd 3.37
AUM in Cr. 9,792
Benchmark S&P BSE 200 India INR
Expense Ratio 2.26
Inception Date 30-08-2002
Fund Manager Mahesh Patil
Exit Load 1% for 1Y
Beta 0.95 Alpha 5.35
Std Dev Scheme 19.09 Index 19.87
Portfolio Weights
Benchmark Weights
Sector Effect
Stock Effect
Active Return
TOP 3
Industrials 7.13 5.58 -0.19 0.89 0.69
Financial Services 32.71 31.38 -0.02 0.34 0.31
Communication Services 0.42 2.52 0.30 0.00 0.30
WORST 3 Real Estate 0.22 0.00 0.01 0.00 0.01
Technology 14.76 15.72 -0.12 -0.03 -0.15
Consumer Cyclical 13.48 10.09 -0.08 -0.07 -0.15
Attribution Total 0.41 1.72 2.13
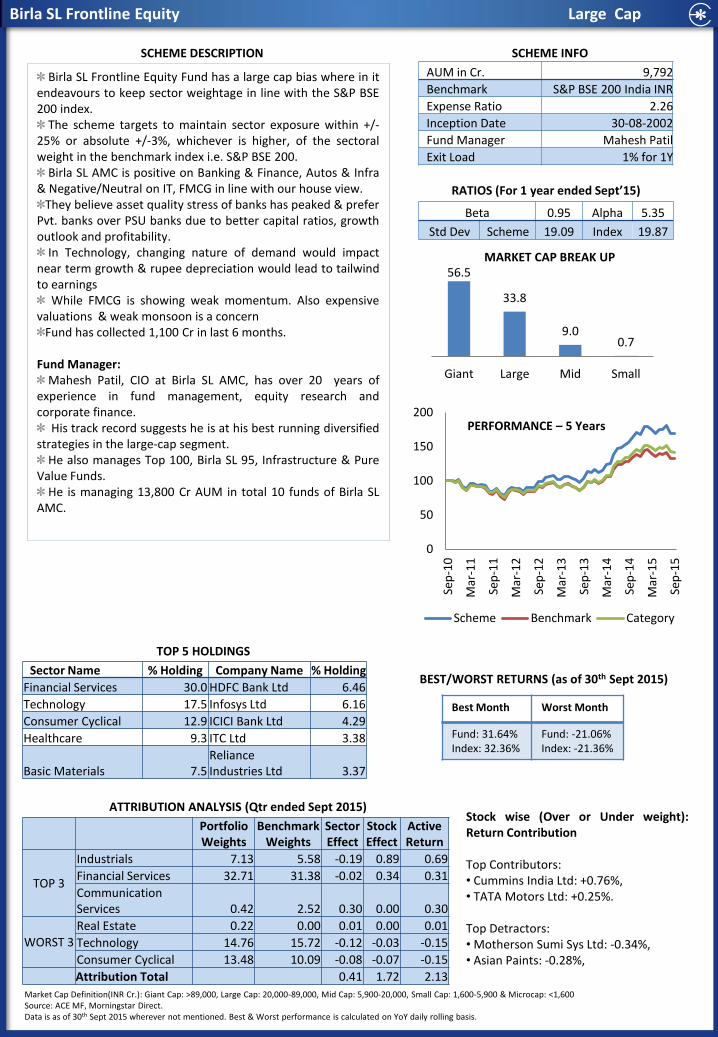
Birla SL Frontline Equity Fund has a large cap bias where in it endeavours to keep sector weightage in line with the S&P BSE 200 index.
The scheme targets to maintain sector exposure within +/-25% or absolute +/-3%, whichever is higher, of the sectoral weight in the benchmark index i.e. S&P BSE 200.
Birla SL AMC is positive on Banking & Finance, Autos & Infra & Negative/Neutral on IT, FMCG in line with our house view.
They believe asset quality stress of banks has peaked & prefer Pvt. banks over PSU banks due to better capital ratios, growth outlook and profitability.
In Technology, changing nature of demand would impact near term growth & rupee depreciation would lead to tailwind to earnings
While FMCG is showing weak momentum. Also expensive valuations & weak monsoon is a concern
Fund has collected 1,100 Cr in last 6 months.
Fund Manager: Mahesh Patil, CIO at Birla SL AMC, has over 20 years of
experience in fund management, equity research and corporate finance.
His track record suggests he is at his best running diversified strategies in the large-cap segment.
He also manages Top 100, Birla SL 95, Infrastructure & Pure Value Funds.
He is managing 13,800 Cr AUM in total 10 funds of Birla SL AMC.
Stock wise (Over or Under weight): Return Contribution Top Contributors: • Cummins India Ltd: +0.76%, • TATA Motors Ltd: +0.25%. Top Detractors: • Motherson Sumi Sys Ltd: -0.34%, • Asian Paints: -0.28%,
56.5
33.8
9.0 0.7
Giant Large Mid Small
0
50
100
150
200
Sep
-10
Mar
-11
Sep
-11
Mar
-12
Sep
-12
Mar
-13
Sep
-13
Mar
-14
Sep
-14
Mar
-15
Sep
-15
Scheme Benchmark Category
SBI Bluechip Fund Large Cap
SCHEME INFO
RATIOS (For 1 year ended Sept’15)
TOP 5 HOLDINGS
ATTRIBUTION ANALYSIS (Qtr ended Sept 2015)
SCHEME DESCRIPTION
Best Month Worst Month
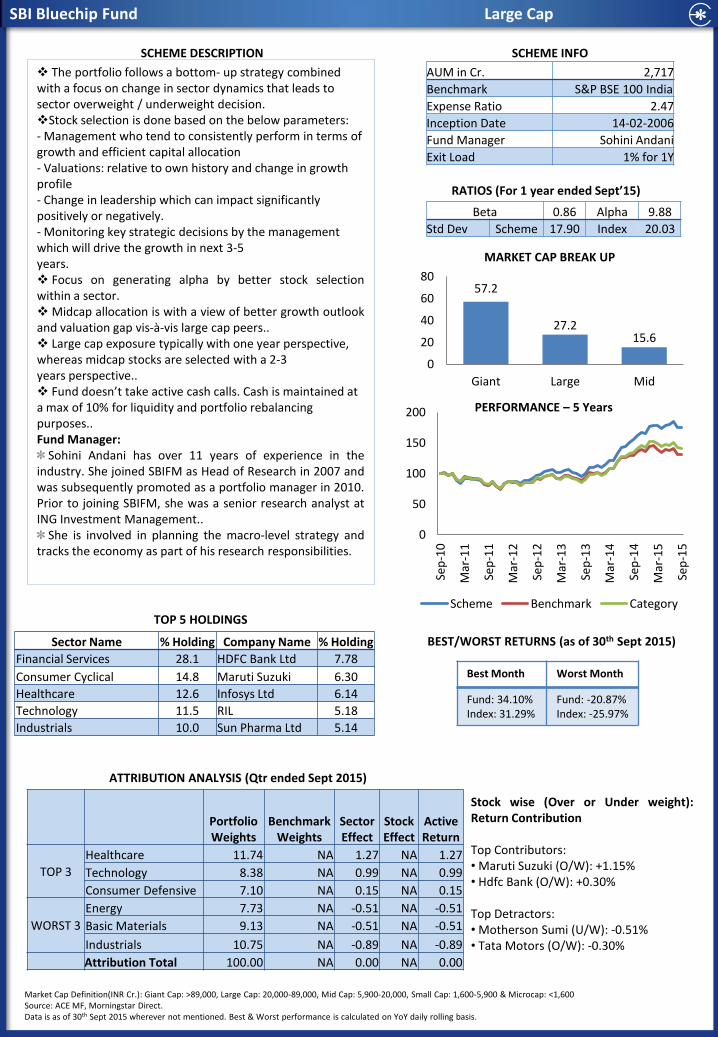
Fund: 34.10% Index: 31.29%
Fund: -20.87% Index: -25.97%
MARKET CAP BREAK UP
PERFORMANCE – 5 Years
BEST/WORST RETURNS (as of 30th Sept 2015) Sector Name % Holding Company Name % Holding
Financial Services 28.1 HDFC Bank Ltd 7.78
Consumer Cyclical 14.8 Maruti Suzuki 6.30
Healthcare 12.6 Infosys Ltd 6.14
Technology 11.5 RIL 5.18
Industrials 10.0 Sun Pharma Ltd 5.14
AUM in Cr. 2,717
Benchmark S&P BSE 100 India
Expense Ratio 2.47
Inception Date 14-02-2006
Fund Manager Sohini Andani
Exit Load 1% for 1Y
Beta 0.86 Alpha 9.88
Std Dev Scheme 17.90 Index 20.03
Portfolio Weights
Benchmark Weights
Sector Effect
Stock Effect
Active Return
TOP 3
Healthcare 11.74 NA 1.27 NA 1.27
Technology 8.38 NA 0.99 NA 0.99
Consumer Defensive 7.10 NA 0.15 NA 0.15
WORST 3
Energy 7.73 NA -0.51 NA -0.51
Basic Materials 9.13 NA -0.51 NA -0.51
Industrials 10.75 NA -0.89 NA -0.89
Attribution Total 100.00 NA 0.00 NA 0.00
The portfolio follows a bottom- up strategy combined with a focus on change in sector dynamics that leads to sector overweight / underweight decision. Stock selection is done based on the below parameters: - Management who tend to consistently perform in terms of growth and efficient capital allocation - Valuations: relative to own history and change in growth profile - Change in leadership which can impact significantly positively or negatively. - Monitoring key strategic decisions by the management which will drive the growth in next 3-5 years. Focus on generating alpha by better stock selection within a sector. Midcap allocation is with a view of better growth outlook and valuation gap vis-à-vis large cap peers.. Large cap exposure typically with one year perspective, whereas midcap stocks are selected with a 2-3 years perspective.. Fund doesn’t take active cash calls. Cash is maintained at a max of 10% for liquidity and portfolio rebalancing purposes.. Fund Manager:
Sohini Andani has over 11 years of experience in the industry. She joined SBIFM as Head of Research in 2007 and was subsequently promoted as a portfolio manager in 2010. Prior to joining SBIFM, she was a senior research analyst at ING Investment Management..
She is involved in planning the macro-level strategy and tracks the economy as part of his research responsibilities.
Stock wise (Over or Under weight): Return Contribution Top Contributors: • Maruti Suzuki (O/W): +1.15% • Hdfc Bank (O/W): +0.30% Top Detractors: • Motherson Sumi (U/W): -0.51% • Tata Motors (O/W): -0.30%
Source: ACE MF, Morningstar Direct. Data is as of 30th Sept 2015 wherever not mentioned. Best & Worst performance is calculated on YoY daily rolling basis.
Market Cap Definition(INR Cr.): Giant Cap: >89,000, Large Cap: 20,000-89,000, Mid Cap: 5,900-20,000, Small Cap: 1,600-5,900 & Microcap: <1,600
57.2
27.2 15.6
0
20
40
60
80
Giant Large Mid
0
50
100
150
200
Sep
-10
Mar
-11
Sep
-11
Mar
-12
Sep
-12
Mar
-13
Sep
-13
Mar
-14
Sep
-14
Mar
-15
Sep
-15
Scheme Benchmark Category
Franklin India Prima Plus Large Cap
SCHEME INFO
RATIOS (For 1 year ended Sept’15)
TOP 5 HOLDINGS
ATTRIBUTION ANALYSIS (Qtr ended Sept 2015)
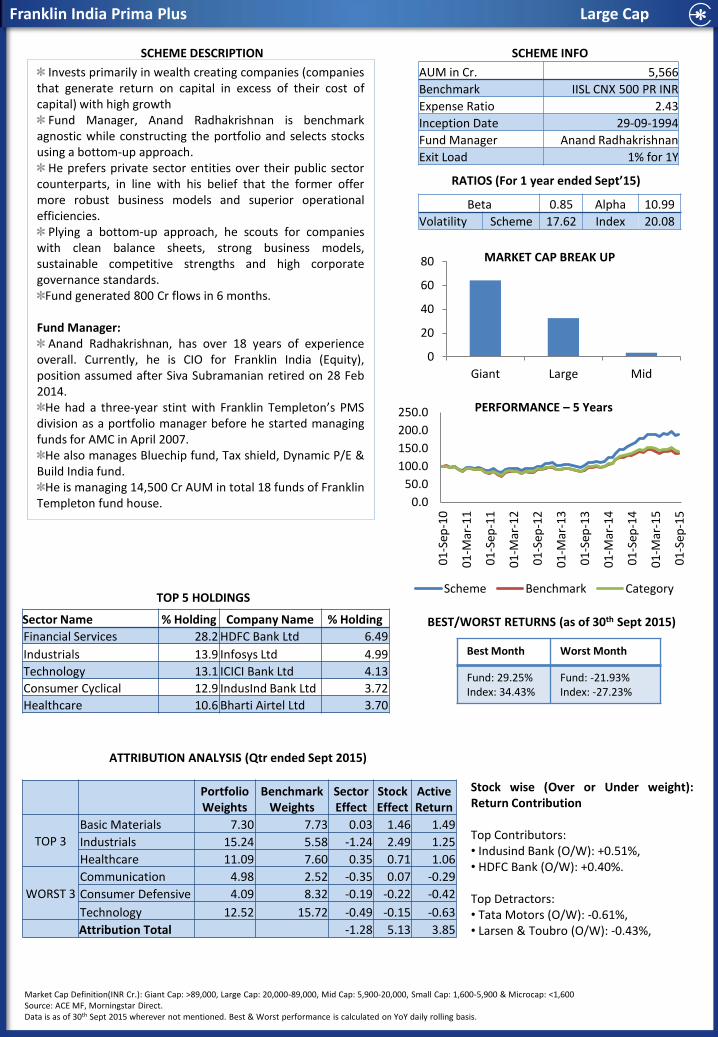
Stock wise (Over or Under weight): Return Contribution Top Contributors: • Indusind Bank (O/W): +0.51%, • HDFC Bank (O/W): +0.40%. Top Detractors: • Tata Motors (O/W): -0.61%, • Larsen & Toubro (O/W): -0.43%,
SCHEME DESCRIPTION
MARKET CAP BREAK UP
PERFORMANCE – 5 Years
BEST/WORST RETURNS (as of 30th Sept 2015) Sector Name % Holding Company Name % Holding
Financial Services 28.2 HDFC Bank Ltd 6.49
Industrials 13.9 Infosys Ltd 4.99
Technology 13.1 ICICI Bank Ltd 4.13
Consumer Cyclical 12.9 IndusInd Bank Ltd 3.72
Healthcare 10.6 Bharti Airtel Ltd 3.70
AUM in Cr. 5,566
Benchmark IISL CNX 500 PR INR
Expense Ratio 2.43
Inception Date 29-09-1994
Fund Manager Anand Radhakrishnan
Exit Load 1% for 1Y
Beta 0.85 Alpha 10.99
Volatility Scheme 17.62 Index 20.08
Portfolio Weights
Benchmark Weights
Sector Effect
Stock Effect
Active Return
TOP 3
Basic Materials 7.30 7.73 0.03 1.46 1.49
Industrials 15.24 5.58 -1.24 2.49 1.25
Healthcare 11.09 7.60 0.35 0.71 1.06
WORST 3
Communication 4.98 2.52 -0.35 0.07 -0.29
Consumer Defensive 4.09 8.32 -0.19 -0.22 -0.42
Technology 12.52 15.72 -0.49 -0.15 -0.63
Attribution Total -1.28 5.13 3.85
Invests primarily in wealth creating companies (companies that generate return on capital in excess of their cost of capital) with high growth
Fund Manager, Anand Radhakrishnan is benchmark agnostic while constructing the portfolio and selects stocks using a bottom-up approach.
He prefers private sector entities over their public sector counterparts, in line with his belief that the former offer more robust business models and superior operational efficiencies.
Plying a bottom-up approach, he scouts for companies with clean balance sheets, strong business models, sustainable competitive strengths and high corporate governance standards.
Fund generated 800 Cr flows in 6 months.
Fund Manager: Anand Radhakrishnan, has over 18 years of experience
overall. Currently, he is CIO for Franklin India (Equity), position assumed after Siva Subramanian retired on 28 Feb 2014.
He had a three-year stint with Franklin Templeton’s PMS division as a portfolio manager before he started managing funds for AMC in April 2007.
He also manages Bluechip fund, Tax shield, Dynamic P/E & Build India fund.
He is managing 14,500 Cr AUM in total 18 funds of Franklin Templeton fund house.
Source: ACE MF, Morningstar Direct. Data is as of 30th Sept 2015 wherever not mentioned. Best & Worst performance is calculated on YoY daily rolling basis.
Market Cap Definition(INR Cr.): Giant Cap: >89,000, Large Cap: 20,000-89,000, Mid Cap: 5,900-20,000, Small Cap: 1,600-5,900 & Microcap: <1,600
0
20
40
60
80
Giant Large Mid
0.0
50.0
100.0
150.0
200.0
250.0
01
-Sep
-10
01
-Mar
-11
01
-Sep
-11
01
-Mar
-12
01
-Sep
-12
01
-Mar
-13
01
-Sep
-13
01
-Mar
-14
01
-Sep
-14
01
-Mar
-15
01
-Sep
-15
Scheme Benchmark Category
Best Month Worst Month
Fund: 29.25% Index: 34.43%
Fund: -21.93% Index: -27.23%
L&T Equity Large Cap
SCHEME INFO
RATIOS (For 1 year ended Sept’15)
TOP 5 HOLDINGS
ATTRIBUTION ANALYSIS (Qtr ended Sept 2015)
SCHEME DESCRIPTION
MARKET CAP BREAK UP
PERFORMANCE – 5 Years
BEST/WORST RETURNS (as of 30th Sept 2015)
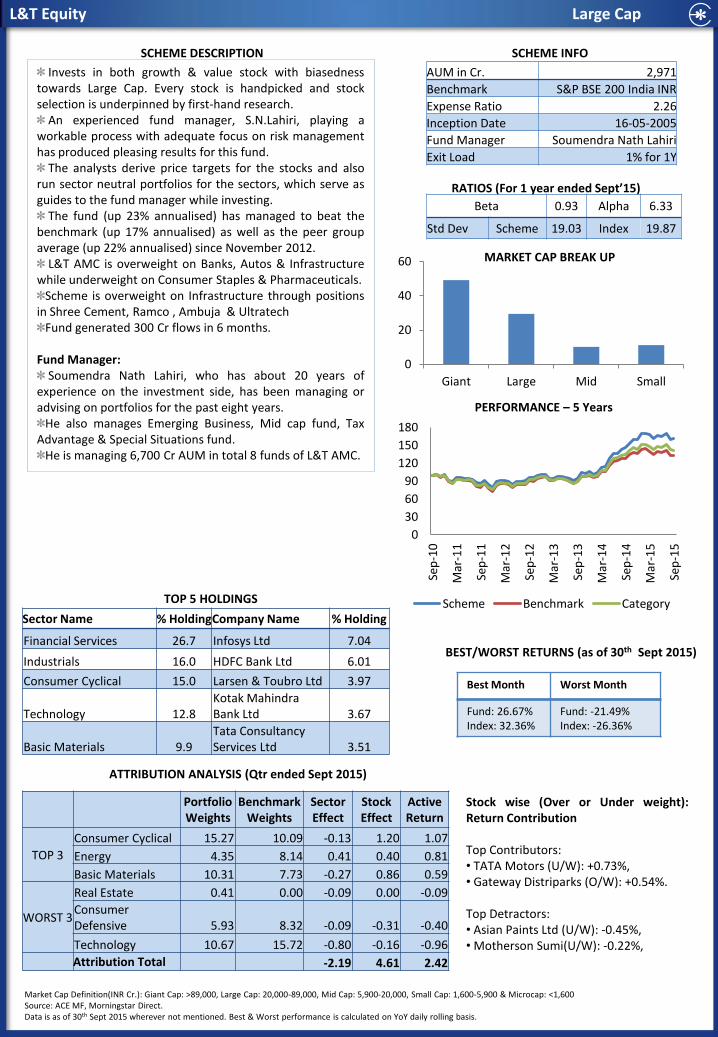
AUM in Cr. 2,971
Benchmark S&P BSE 200 India INR
Expense Ratio 2.26
Inception Date 16-05-2005
Fund Manager Soumendra Nath Lahiri
Exit Load 1% for 1Y
Beta 0.93 Alpha 6.33
Std Dev Scheme 19.03 Index 19.87
Portfolio Weights
Benchmark Weights
Sector Effect
Stock Effect
Active Return
TOP 3
Consumer Cyclical 15.27 10.09 -0.13 1.20 1.07
Energy 4.35 8.14 0.41 0.40 0.81
Basic Materials 10.31 7.73 -0.27 0.86 0.59
WORST 3
Real Estate 0.41 0.00 -0.09 0.00 -0.09
Consumer Defensive 5.93 8.32 -0.09 -0.31 -0.40
Technology 10.67 15.72 -0.80 -0.16 -0.96
Attribution Total -2.19 4.61 2.42
Sector Name % Holding Company Name % Holding
Financial Services 26.7 Infosys Ltd 7.04
Industrials 16.0 HDFC Bank Ltd 6.01
Consumer Cyclical 15.0 Larsen & Toubro Ltd 3.97
Technology 12.8 Kotak Mahindra Bank Ltd 3.67
Basic Materials 9.9 Tata Consultancy Services Ltd 3.51
Invests in both growth & value stock with biasedness towards Large Cap. Every stock is handpicked and stock selection is underpinned by first-hand research.
An experienced fund manager, S.N.Lahiri, playing a workable process with adequate focus on risk management has produced pleasing results for this fund.
The analysts derive price targets for the stocks and also run sector neutral portfolios for the sectors, which serve as guides to the fund manager while investing.
The fund (up 23% annualised) has managed to beat the benchmark (up 17% annualised) as well as the peer group average (up 22% annualised) since November 2012.
L&T AMC is overweight on Banks, Autos & Infrastructure while underweight on Consumer Staples & Pharmaceuticals.
Scheme is overweight on Infrastructure through positions in Shree Cement, Ramco , Ambuja & Ultratech
Fund generated 300 Cr flows in 6 months. Fund Manager:
Soumendra Nath Lahiri, who has about 20 years of experience on the investment side, has been managing or advising on portfolios for the past eight years.
He also manages Emerging Business, Mid cap fund, Tax Advantage & Special Situations fund.
He is managing 6,700 Cr AUM in total 8 funds of L&T AMC.
Stock wise (Over or Under weight): Return Contribution Top Contributors: • TATA Motors (U/W): +0.73%, • Gateway Distriparks (O/W): +0.54%. Top Detractors: • Asian Paints Ltd (U/W): -0.45%, • Motherson Sumi(U/W): -0.22%,
Source: ACE MF, Morningstar Direct. Data is as of 30th Sept 2015 wherever not mentioned. Best & Worst performance is calculated on YoY daily rolling basis.
Market Cap Definition(INR Cr.): Giant Cap: >89,000, Large Cap: 20,000-89,000, Mid Cap: 5,900-20,000, Small Cap: 1,600-5,900 & Microcap: <1,600
0
20
40
60
Giant Large Mid Small
0
30
60
90
120
150
180 Se
p-1
0
Mar
-11
Sep
-11
Mar
-12
Sep
-12
Mar
-13
Sep
-13
Mar
-14
Sep
-14
Mar
-15
Sep
-15
Scheme Benchmark Category
Best Month Worst Month
Fund: 26.67% Index: 32.36%
Fund: -21.49% Index: -26.36%
MID CAP FUNDS • Franklin India Prima Fund
• HDFC Mid Cap Opportunities Fund
• Canara Robeco Emerging Equities Fund
• ICICI Pru Mid Cap Fund
Franklin India Prima Fund Mid Cap
SCHEME INFO
RATIOS (For 1 year ended Sept’15)
TOP 5 HOLDINGS
ATTRIBUTION ANALYSIS (Qtr ended Sept 2015)
SCHEME DESCRIPTION
MARKET CAP BREAK UP
PERFORMANCE – 5 Years
BEST/WORST RETURNS (as of 30th Sept 2015) Sector Name % Holding Company Name % Holding
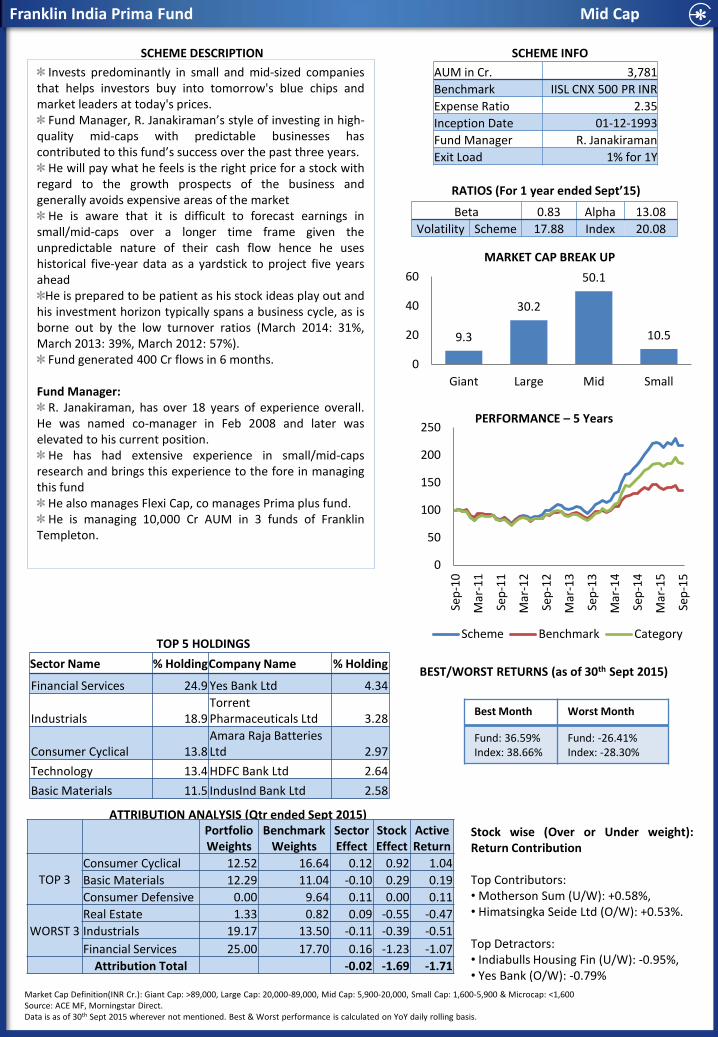
Financial Services 24.9 Yes Bank Ltd 4.34
Industrials 18.9 Torrent Pharmaceuticals Ltd 3.28
Consumer Cyclical 13.8 Amara Raja Batteries Ltd 2.97
Technology 13.4 HDFC Bank Ltd 2.64
Basic Materials 11.5 IndusInd Bank Ltd 2.58
AUM in Cr. 3,781
Benchmark IISL CNX 500 PR INR
Expense Ratio 2.35
Inception Date 01-12-1993
Fund Manager R. Janakiraman
Exit Load 1% for 1Y
Beta 0.83 Alpha 13.08
Volatility Scheme 17.88 Index 20.08
Portfolio Weights
Benchmark Weights
Sector Effect
Stock Effect
Active Return
TOP 3 Consumer Cyclical 12.52 16.64 0.12 0.92 1.04
Basic Materials 12.29 11.04 -0.10 0.29 0.19
Consumer Defensive 0.00 9.64 0.11 0.00 0.11
WORST 3
Real Estate 1.33 0.82 0.09 -0.55 -0.47
Industrials 19.17 13.50 -0.11 -0.39 -0.51
Financial Services 25.00 17.70 0.16 -1.23 -1.07
Attribution Total -0.02 -1.69 -1.71
Invests predominantly in small and mid-sized companies that helps investors buy into tomorrow's blue chips and market leaders at today's prices.
Fund Manager, R. Janakiraman’s style of investing in high-quality mid-caps with predictable businesses has contributed to this fund’s success over the past three years.
He will pay what he feels is the right price for a stock with regard to the growth prospects of the business and generally avoids expensive areas of the market
He is aware that it is difficult to forecast earnings in small/mid-caps over a longer time frame given the unpredictable nature of their cash flow hence he uses historical five-year data as a yardstick to project five years ahead
He is prepared to be patient as his stock ideas play out and his investment horizon typically spans a business cycle, as is borne out by the low turnover ratios (March 2014: 31%, March 2013: 39%, March 2012: 57%).
Fund generated 400 Cr flows in 6 months.
Fund Manager: R. Janakiraman, has over 18 years of experience overall.
He was named co-manager in Feb 2008 and later was elevated to his current position.
He has had extensive experience in small/mid-caps research and brings this experience to the fore in managing this fund
He also manages Flexi Cap, co manages Prima plus fund. He is managing 10,000 Cr AUM in 3 funds of Franklin
Templeton.
Stock wise (Over or Under weight): Return Contribution Top Contributors: • Motherson Sum (U/W): +0.58%, • Himatsingka Seide Ltd (O/W): +0.53%. Top Detractors: • Indiabulls Housing Fin (U/W): -0.95%, • Yes Bank (O/W): -0.79%
Source: ACE MF, Morningstar Direct. Data is as of 30th Sept 2015 wherever not mentioned. Best & Worst performance is calculated on YoY daily rolling basis.
Market Cap Definition(INR Cr.): Giant Cap: >89,000, Large Cap: 20,000-89,000, Mid Cap: 5,900-20,000, Small Cap: 1,600-5,900 & Microcap: <1,600
9.3
30.2
50.1
10.5
0
20
40
60
Giant Large Mid Small
0
50
100
150
200
250
Sep
-10
Mar
-11
Sep
-11
Mar
-12
Sep
-12
Mar
-13
Sep
-13
Mar
-14
Sep
-14
Mar
-15
Sep
-15
Scheme Benchmark Category
Best Month Worst Month
Fund: 36.59% Index: 38.66%
Fund: -26.41% Index: -28.30%
HDFC Mid Cap Opp Fund Mid Cap
SCHEME INFO
RATIOS (For 1 year ended Sept’15)
TOP 5 HOLDINGS
ATTRIBUTION ANALYSIS (Qtr ended Sept 2015)
SCHEME DESCRIPTION
MARKET CAP BREAK UP
PERFORMANCE - 5 Years
BEST/WORST RETURNS (as of 30th Sept 2015) Sector Name % Holding Company Name % Holding
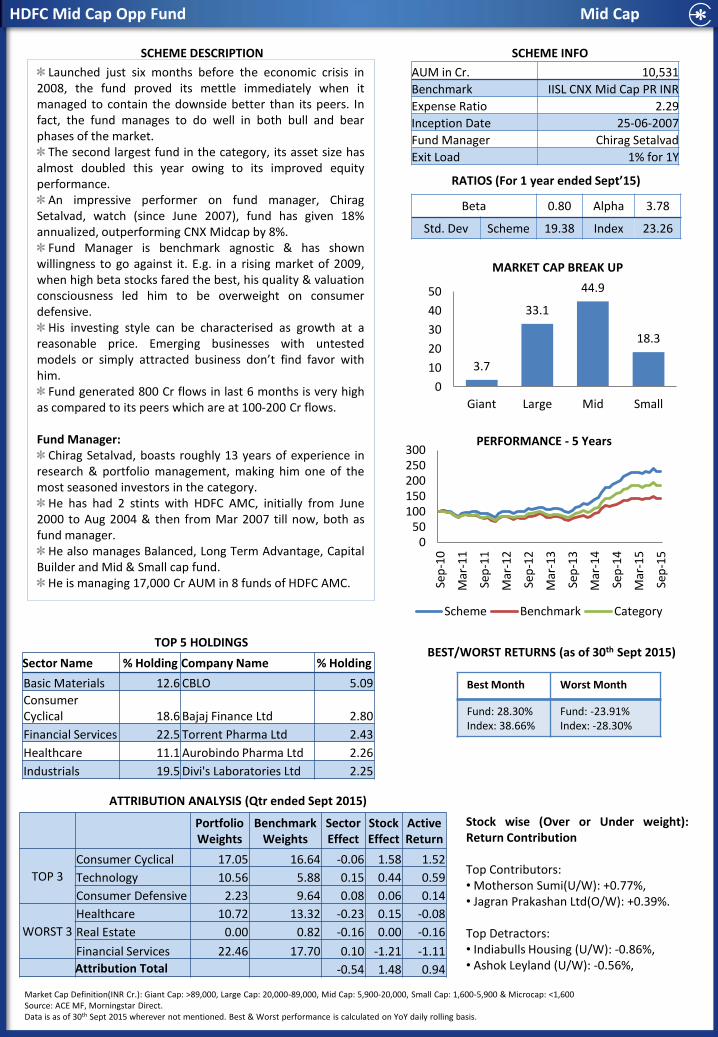
Basic Materials 12.6 CBLO 5.09
Consumer Cyclical 18.6 Bajaj Finance Ltd 2.80
Financial Services 22.5 Torrent Pharma Ltd 2.43
Healthcare 11.1 Aurobindo Pharma Ltd 2.26
Industrials 19.5 Divi's Laboratories Ltd 2.25
AUM in Cr. 10,531
Benchmark IISL CNX Mid Cap PR INR
Expense Ratio 2.29
Inception Date 25-06-2007
Fund Manager Chirag Setalvad
Exit Load 1% for 1Y
Beta 0.80 Alpha 3.78
Std. Dev Scheme 19.38 Index 23.26
Portfolio Weights
Benchmark Weights
Sector Effect
Stock Effect
Active Return
TOP 3
Consumer Cyclical 17.05 16.64 -0.06 1.58 1.52
Technology 10.56 5.88 0.15 0.44 0.59
Consumer Defensive 2.23 9.64 0.08 0.06 0.14
WORST 3
Healthcare 10.72 13.32 -0.23 0.15 -0.08
Real Estate 0.00 0.82 -0.16 0.00 -0.16
Financial Services 22.46 17.70 0.10 -1.21 -1.11
Attribution Total -0.54 1.48 0.94
Launched just six months before the economic crisis in 2008, the fund proved its mettle immediately when it managed to contain the downside better than its peers. In fact, the fund manages to do well in both bull and bear phases of the market.
The second largest fund in the category, its asset size has almost doubled this year owing to its improved equity performance.
An impressive performer on fund manager, Chirag Setalvad, watch (since June 2007), fund has given 18% annualized, outperforming CNX Midcap by 8%.
Fund Manager is benchmark agnostic & has shown willingness to go against it. E.g. in a rising market of 2009, when high beta stocks fared the best, his quality & valuation consciousness led him to be overweight on consumer defensive.
His investing style can be characterised as growth at a reasonable price. Emerging businesses with untested models or simply attracted business don’t find favor with him.
Fund generated 800 Cr flows in last 6 months is very high as compared to its peers which are at 100-200 Cr flows.
Fund Manager:
Chirag Setalvad, boasts roughly 13 years of experience in research & portfolio management, making him one of the most seasoned investors in the category.
He has had 2 stints with HDFC AMC, initially from June 2000 to Aug 2004 & then from Mar 2007 till now, both as fund manager.
He also manages Balanced, Long Term Advantage, Capital Builder and Mid & Small cap fund.
He is managing 17,000 Cr AUM in 8 funds of HDFC AMC.
Stock wise (Over or Under weight): Return Contribution Top Contributors: • Motherson Sumi(U/W): +0.77%, • Jagran Prakashan Ltd(O/W): +0.39%. Top Detractors: • Indiabulls Housing (U/W): -0.86%, • Ashok Leyland (U/W): -0.56%,
Source: ACE MF, Morningstar Direct. Data is as of 30th Sept 2015 wherever not mentioned. Best & Worst performance is calculated on YoY daily rolling basis.
Market Cap Definition(INR Cr.): Giant Cap: >89,000, Large Cap: 20,000-89,000, Mid Cap: 5,900-20,000, Small Cap: 1,600-5,900 & Microcap: <1,600
3.7
33.1
44.9
18.3
0
10
20
30
40
50
Giant Large Mid Small
0 50
100 150 200 250 300
Sep
-10
Mar
-11
Sep
-11
Mar
-12
Sep
-12
Mar
-13
Sep
-13
Mar
-14
Sep
-14
Mar
-15
Sep
-15
Scheme Benchmark Category
Best Month Worst Month
Fund: 28.30% Index: 38.66%
Fund: -23.91% Index: -28.30%
Canara Robeco Emerging Equities Fund Mid Cap
SCHEME INFO
RATIOS (For 1 year ended Sept’15)
TOP 5 HOLDINGS
ATTRIBUTION ANALYSIS (Qtr ended Sept 2015)
SCHEME DESCRIPTION
MARKET CAP BREAK UP
PERFORMANCE – 5 Years
BEST/WORST RETURNS (as of 30th Sept 2015)
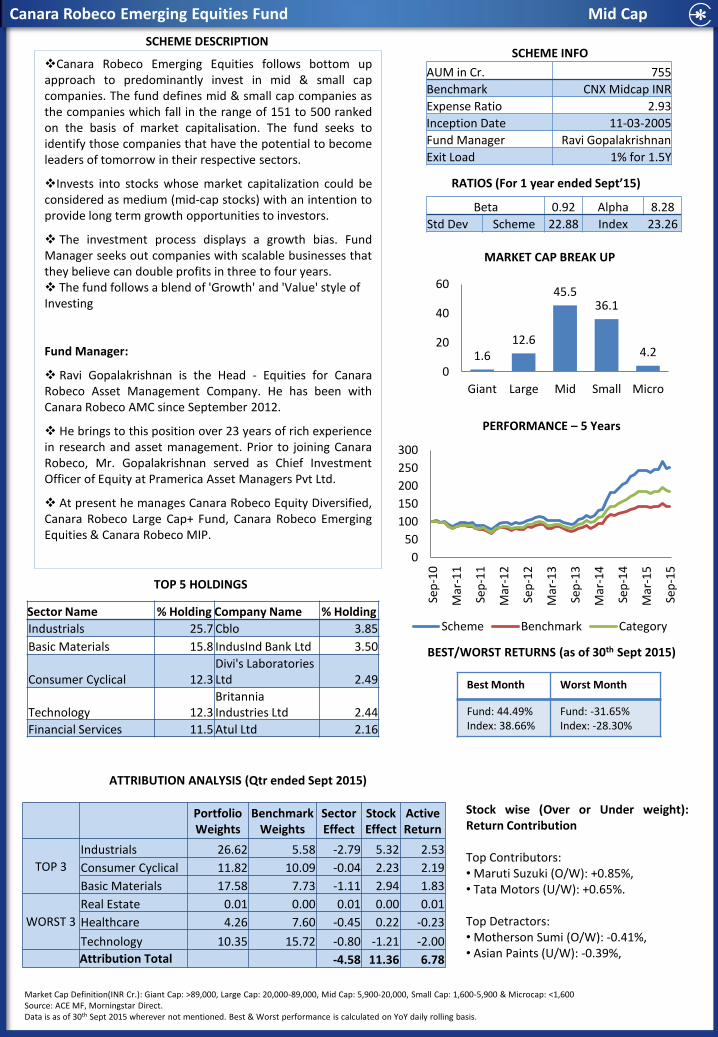
Sector Name % Holding Company Name % Holding
Industrials 25.7 Cblo 3.85
Basic Materials 15.8 IndusInd Bank Ltd 3.50
Consumer Cyclical 12.3 Divi's Laboratories Ltd 2.49
Technology 12.3 Britannia Industries Ltd 2.44
Financial Services 11.5 Atul Ltd 2.16
AUM in Cr. 755
Benchmark CNX Midcap INR
Expense Ratio 2.93
Inception Date 11-03-2005
Fund Manager Ravi Gopalakrishnan
Exit Load 1% for 1.5Y
Beta 0.92 Alpha 8.28
Std Dev Scheme 22.88 Index 23.26
Portfolio Weights
Benchmark Weights
Sector Effect
Stock Effect
Active Return
TOP 3
Industrials 26.62 5.58 -2.79 5.32 2.53
Consumer Cyclical 11.82 10.09 -0.04 2.23 2.19
Basic Materials 17.58 7.73 -1.11 2.94 1.83
WORST 3
Real Estate 0.01 0.00 0.01 0.00 0.01
Healthcare 4.26 7.60 -0.45 0.22 -0.23
Technology 10.35 15.72 -0.80 -1.21 -2.00
Attribution Total -4.58 11.36 6.78
Stock wise (Over or Under weight): Return Contribution Top Contributors: • Maruti Suzuki (O/W): +0.85%, • Tata Motors (U/W): +0.65%. Top Detractors: • Motherson Sumi (O/W): -0.41%, • Asian Paints (U/W): -0.39%,
Canara Robeco Emerging Equities follows bottom up approach to predominantly invest in mid & small cap companies. The fund defines mid & small cap companies as the companies which fall in the range of 151 to 500 ranked on the basis of market capitalisation. The fund seeks to identify those companies that have the potential to become leaders of tomorrow in their respective sectors.
Invests into stocks whose market capitalization could be considered as medium (mid-cap stocks) with an intention to provide long term growth opportunities to investors.
The investment process displays a growth bias. Fund Manager seeks out companies with scalable businesses that they believe can double profits in three to four years. The fund follows a blend of 'Growth' and 'Value' style of Investing
Fund Manager:
Ravi Gopalakrishnan is the Head - Equities for Canara Robeco Asset Management Company. He has been with Canara Robeco AMC since September 2012.
He brings to this position over 23 years of rich experience in research and asset management. Prior to joining Canara Robeco, Mr. Gopalakrishnan served as Chief Investment Officer of Equity at Pramerica Asset Managers Pvt Ltd.
At present he manages Canara Robeco Equity Diversified, Canara Robeco Large Cap+ Fund, Canara Robeco Emerging Equities & Canara Robeco MIP.
Source: ACE MF, Morningstar Direct. Data is as of 30th Sept 2015 wherever not mentioned. Best & Worst performance is calculated on YoY daily rolling basis.
Market Cap Definition(INR Cr.): Giant Cap: >89,000, Large Cap: 20,000-89,000, Mid Cap: 5,900-20,000, Small Cap: 1,600-5,900 & Microcap: <1,600
1.6 12.6
45.5 36.1
4.2
0
20
40
60
Giant Large Mid Small Micro
Best Month Worst Month
Fund: 44.49% Index: 38.66%
Fund: -31.65% Index: -28.30%
0
50
100
150
200
250
300
Sep
-10
Mar
-11
Sep
-11
Mar
-12
Sep
-12
Mar
-13
Sep
-13
Mar
-14
Sep
-14
Mar
-15
Sep
-15
Scheme Benchmark Category
ICICI Pru Mid Cap Mid Cap
SCHEME INFO
RATIOS (For 1 year ended Sept’15)
TOP 5 HOLDINGS
ATTRIBUTION ANALYSIS (Qtr ended Sept 2015)
SCHEME DESCRIPTION
MARKET CAP BREAK UP
PERFORMANCE – 5 Years
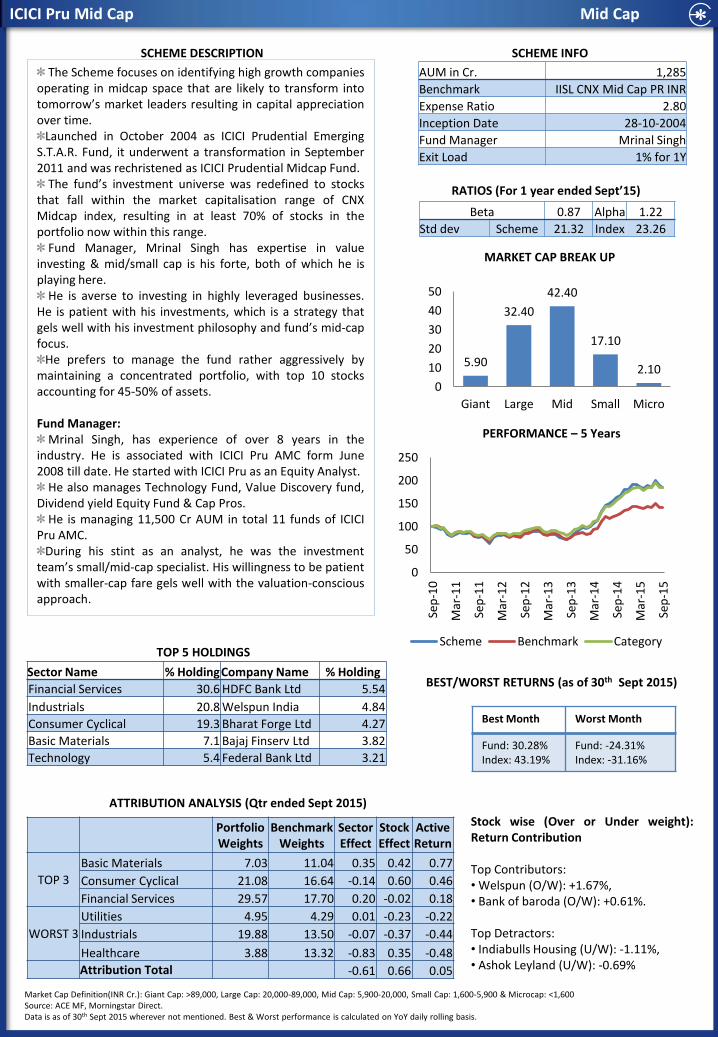
BEST/WORST RETURNS (as of 30th Sept 2015) Sector Name % Holding Company Name % Holding
Financial Services 30.6 HDFC Bank Ltd 5.54
Industrials 20.8 Welspun India 4.84
Consumer Cyclical 19.3 Bharat Forge Ltd 4.27
Basic Materials 7.1 Bajaj Finserv Ltd 3.82
Technology 5.4 Federal Bank Ltd 3.21
AUM in Cr. 1,285
Benchmark IISL CNX Mid Cap PR INR
Expense Ratio 2.80
Inception Date 28-10-2004
Fund Manager Mrinal Singh
Exit Load 1% for 1Y
Beta 0.87 Alpha 1.22
Std dev Scheme 21.32 Index 23.26
Portfolio Weights
Benchmark Weights
Sector Effect
Stock Effect
Active Return
TOP 3
Basic Materials 7.03 11.04 0.35 0.42 0.77
Consumer Cyclical 21.08 16.64 -0.14 0.60 0.46
Financial Services 29.57 17.70 0.20 -0.02 0.18
WORST 3
Utilities 4.95 4.29 0.01 -0.23 -0.22
Industrials 19.88 13.50 -0.07 -0.37 -0.44
Healthcare 3.88 13.32 -0.83 0.35 -0.48
Attribution Total -0.61 0.66 0.05
The Scheme focuses on identifying high growth companies operating in midcap space that are likely to transform into tomorrow’s market leaders resulting in capital appreciation over time.
Launched in October 2004 as ICICI Prudential Emerging S.T.A.R. Fund, it underwent a transformation in September 2011 and was rechristened as ICICI Prudential Midcap Fund.
The fund’s investment universe was redefined to stocks that fall within the market capitalisation range of CNX Midcap index, resulting in at least 70% of stocks in the portfolio now within this range.
Fund Manager, Mrinal Singh has expertise in value investing & mid/small cap is his forte, both of which he is playing here.
He is averse to investing in highly leveraged businesses. He is patient with his investments, which is a strategy that gels well with his investment philosophy and fund’s mid-cap focus.
He prefers to manage the fund rather aggressively by maintaining a concentrated portfolio, with top 10 stocks accounting for 45-50% of assets.
Fund Manager:
Mrinal Singh, has experience of over 8 years in the industry. He is associated with ICICI Pru AMC form June 2008 till date. He started with ICICI Pru as an Equity Analyst.
He also manages Technology Fund, Value Discovery fund, Dividend yield Equity Fund & Cap Pros.
He is managing 11,500 Cr AUM in total 11 funds of ICICI Pru AMC.
During his stint as an analyst, he was the investment team’s small/mid-cap specialist. His willingness to be patient with smaller-cap fare gels well with the valuation-conscious approach.
Stock wise (Over or Under weight): Return Contribution Top Contributors: • Welspun (O/W): +1.67%, • Bank of baroda (O/W): +0.61%. Top Detractors: • Indiabulls Housing (U/W): -1.11%, • Ashok Leyland (U/W): -0.69%
Source: ACE MF, Morningstar Direct. Data is as of 30th Sept 2015 wherever not mentioned. Best & Worst performance is calculated on YoY daily rolling basis.
Market Cap Definition(INR Cr.): Giant Cap: >89,000, Large Cap: 20,000-89,000, Mid Cap: 5,900-20,000, Small Cap: 1,600-5,900 & Microcap: <1,600
Best Month Worst Month
Fund: 30.28% Index: 43.19%
Fund: -24.31% Index: -31.16%
5.90
32.40
42.40
17.10
2.10
0
10
20
30
40
50
Giant Large Mid Small Micro
0
50
100
150
200
250
Sep
-10
Mar
-11
Sep
-11
Mar
-12
Sep
-12
Mar
-13
Sep
-13
Mar
-14
Sep
-14
Mar
-15
Sep
-15
Scheme Benchmark Category
FLEXI CAP FUNDS • ICICI Pru Value Discovery Fund
• Birla SL Advantage Fund
• Motilal Oswal Most Focussed Multicap 35 Fund
ICICI Pru Value Discovery Fund Flexi Cap
SCHEME INFO
RATIOS (For 1 year ended Sept’15)
TOP 5 HOLDINGS
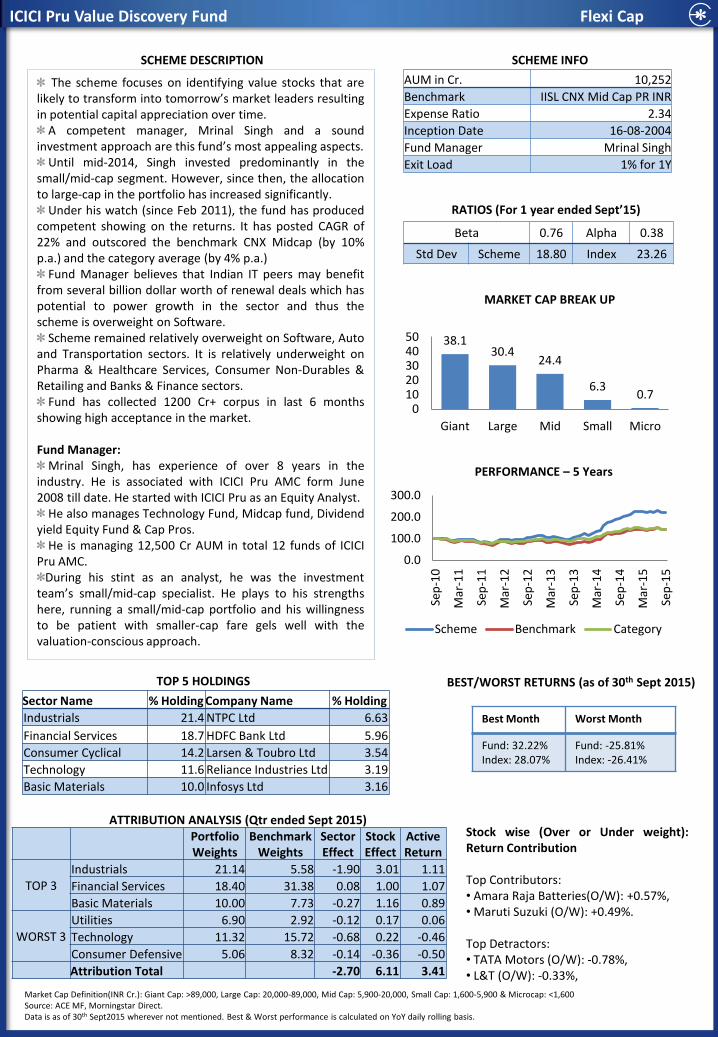
ATTRIBUTION ANALYSIS (Qtr ended Sept 2015) Stock wise (Over or Under weight): Return Contribution Top Contributors: • Amara Raja Batteries(O/W): +0.57%, • Maruti Suzuki (O/W): +0.49%. Top Detractors: • TATA Motors (O/W): -0.78%, • L&T (O/W): -0.33%,
SCHEME DESCRIPTION
MARKET CAP BREAK UP
PERFORMANCE – 5 Years
BEST/WORST RETURNS (as of 30th Sept 2015)
Sector Name % Holding Company Name % Holding
Industrials 21.4 NTPC Ltd 6.63
Financial Services 18.7 HDFC Bank Ltd 5.96
Consumer Cyclical 14.2 Larsen & Toubro Ltd 3.54
Technology 11.6 Reliance Industries Ltd 3.19
Basic Materials 10.0 Infosys Ltd 3.16
AUM in Cr. 10,252
Benchmark IISL CNX Mid Cap PR INR
Expense Ratio 2.34
Inception Date 16-08-2004
Fund Manager Mrinal Singh
Exit Load 1% for 1Y
Beta 0.76 Alpha 0.38
Std Dev Scheme 18.80 Index 23.26
Portfolio Weights
Benchmark Weights
Sector Effect
Stock Effect
Active Return
TOP 3 Industrials 21.14 5.58 -1.90 3.01 1.11
Financial Services 18.40 31.38 0.08 1.00 1.07
Basic Materials 10.00 7.73 -0.27 1.16 0.89
WORST 3 Utilities 6.90 2.92 -0.12 0.17 0.06
Technology 11.32 15.72 -0.68 0.22 -0.46
Consumer Defensive 5.06 8.32 -0.14 -0.36 -0.50
Attribution Total -2.70 6.11 3.41
The scheme focuses on identifying value stocks that are likely to transform into tomorrow’s market leaders resulting in potential capital appreciation over time.
A competent manager, Mrinal Singh and a sound investment approach are this fund’s most appealing aspects.
Until mid-2014, Singh invested predominantly in the small/mid-cap segment. However, since then, the allocation to large-cap in the portfolio has increased significantly.
Under his watch (since Feb 2011), the fund has produced competent showing on the returns. It has posted CAGR of 22% and outscored the benchmark CNX Midcap (by 10% p.a.) and the category average (by 4% p.a.)
Fund Manager believes that Indian IT peers may benefit from several billion dollar worth of renewal deals which has potential to power growth in the sector and thus the scheme is overweight on Software.
Scheme remained relatively overweight on Software, Auto and Transportation sectors. It is relatively underweight on Pharma & Healthcare Services, Consumer Non-Durables & Retailing and Banks & Finance sectors.
Fund has collected 1200 Cr+ corpus in last 6 months showing high acceptance in the market.
Fund Manager:
Mrinal Singh, has experience of over 8 years in the industry. He is associated with ICICI Pru AMC form June 2008 till date. He started with ICICI Pru as an Equity Analyst.
He also manages Technology Fund, Midcap fund, Dividend yield Equity Fund & Cap Pros.
He is managing 12,500 Cr AUM in total 12 funds of ICICI Pru AMC.
During his stint as an analyst, he was the investment team’s small/mid-cap specialist. He plays to his strengths here, running a small/mid-cap portfolio and his willingness to be patient with smaller-cap fare gels well with the valuation-conscious approach.
Source: ACE MF, Morningstar Direct. Data is as of 30th Sept2015 wherever not mentioned. Best & Worst performance is calculated on YoY daily rolling basis.
Market Cap Definition(INR Cr.): Giant Cap: >89,000, Large Cap: 20,000-89,000, Mid Cap: 5,900-20,000, Small Cap: 1,600-5,900 & Microcap: <1,600
38.1 30.4
24.4
6.3 0.7
0 10 20 30 40 50
Giant Large Mid Small Micro
0.0
100.0
200.0
300.0
Sep
-10
Mar
-11
Sep
-11
Mar
-12
Sep
-12
Mar
-13
Sep
-13
Mar
-14
Sep
-14
Mar
-15
Sep
-15
Scheme Benchmark Category
Best Month Worst Month
Fund: 32.22% Index: 28.07%
Fund: -25.81% Index: -26.41%
Birla SL Advantage Fund Flexi Cap
SCHEME INFO
RATIOS (For 1 year ended Sept’15)
TOP 5 HOLDINGS
ATTRIBUTION ANALYSIS (Qtr ended Sept 2015)
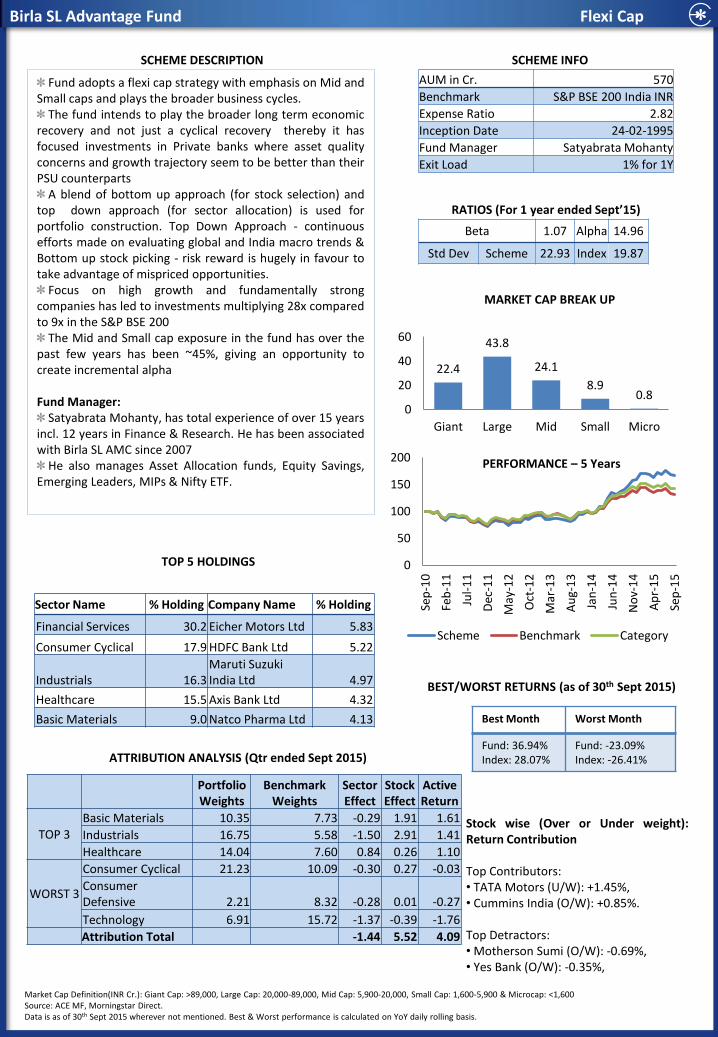
Stock wise (Over or Under weight): Return Contribution Top Contributors: • TATA Motors (U/W): +1.45%, • Cummins India (O/W): +0.85%. Top Detractors: • Motherson Sumi (O/W): -0.69%, • Yes Bank (O/W): -0.35%,
SCHEME DESCRIPTION
MARKET CAP BREAK UP
PERFORMANCE – 5 Years
BEST/WORST RETURNS (as of 30th Sept 2015)
Sector Name % Holding Company Name % Holding
Financial Services 30.2 Eicher Motors Ltd 5.83
Consumer Cyclical 17.9 HDFC Bank Ltd 5.22
Industrials 16.3 Maruti Suzuki India Ltd 4.97
Healthcare 15.5 Axis Bank Ltd 4.32
Basic Materials 9.0 Natco Pharma Ltd 4.13
AUM in Cr. 570
Benchmark S&P BSE 200 India INR
Expense Ratio 2.82
Inception Date 24-02-1995
Fund Manager Satyabrata Mohanty
Exit Load 1% for 1Y
Beta 1.07 Alpha 14.96
Std Dev Scheme 22.93 Index 19.87
Portfolio Weights
Benchmark Weights
Sector Effect
Stock Effect
Active Return
TOP 3 Basic Materials 10.35 7.73 -0.29 1.91 1.61
Industrials 16.75 5.58 -1.50 2.91 1.41
Healthcare 14.04 7.60 0.84 0.26 1.10
WORST 3
Consumer Cyclical 21.23 10.09 -0.30 0.27 -0.03
Consumer Defensive 2.21 8.32 -0.28 0.01 -0.27
Technology 6.91 15.72 -1.37 -0.39 -1.76
Attribution Total -1.44 5.52 4.09
Fund adopts a flexi cap strategy with emphasis on Mid and Small caps and plays the broader business cycles.
The fund intends to play the broader long term economic recovery and not just a cyclical recovery thereby it has focused investments in Private banks where asset quality concerns and growth trajectory seem to be better than their PSU counterparts
A blend of bottom up approach (for stock selection) and top down approach (for sector allocation) is used for portfolio construction. Top Down Approach - continuous efforts made on evaluating global and India macro trends & Bottom up stock picking - risk reward is hugely in favour to take advantage of mispriced opportunities.
Focus on high growth and fundamentally strong companies has led to investments multiplying 28x compared to 9x in the S&P BSE 200
The Mid and Small cap exposure in the fund has over the past few years has been ~45%, giving an opportunity to create incremental alpha Fund Manager:
Satyabrata Mohanty, has total experience of over 15 years incl. 12 years in Finance & Research. He has been associated with Birla SL AMC since 2007
He also manages Asset Allocation funds, Equity Savings, Emerging Leaders, MIPs & Nifty ETF.
Source: ACE MF, Morningstar Direct. Data is as of 30th Sept 2015 wherever not mentioned. Best & Worst performance is calculated on YoY daily rolling basis.
Market Cap Definition(INR Cr.): Giant Cap: >89,000, Large Cap: 20,000-89,000, Mid Cap: 5,900-20,000, Small Cap: 1,600-5,900 & Microcap: <1,600
22.4
43.8
24.1
8.9 0.8
0
20
40
60
Giant Large Mid Small Micro
0
50
100
150
200
Sep
-10
Feb
-11
Jul-
11
Dec
-11
May
-12
Oct
-12
Mar
-13
Au
g-1
3
Jan
-14
Jun
-14
No
v-1
4
Ap
r-1
5
Sep
-15
Scheme Benchmark Category
Best Month Worst Month
Fund: 36.94% Index: 28.07%
Fund: -23.09% Index: -26.41%
Motilal MOST Focused Multicap 35 Flexi Cap
SCHEME INFO
RATIOS (For 1 year ended Sept’15)
TOP 5 HOLDINGS
ATTRIBUTION ANALYSIS (Qtr ended Sept 2015)
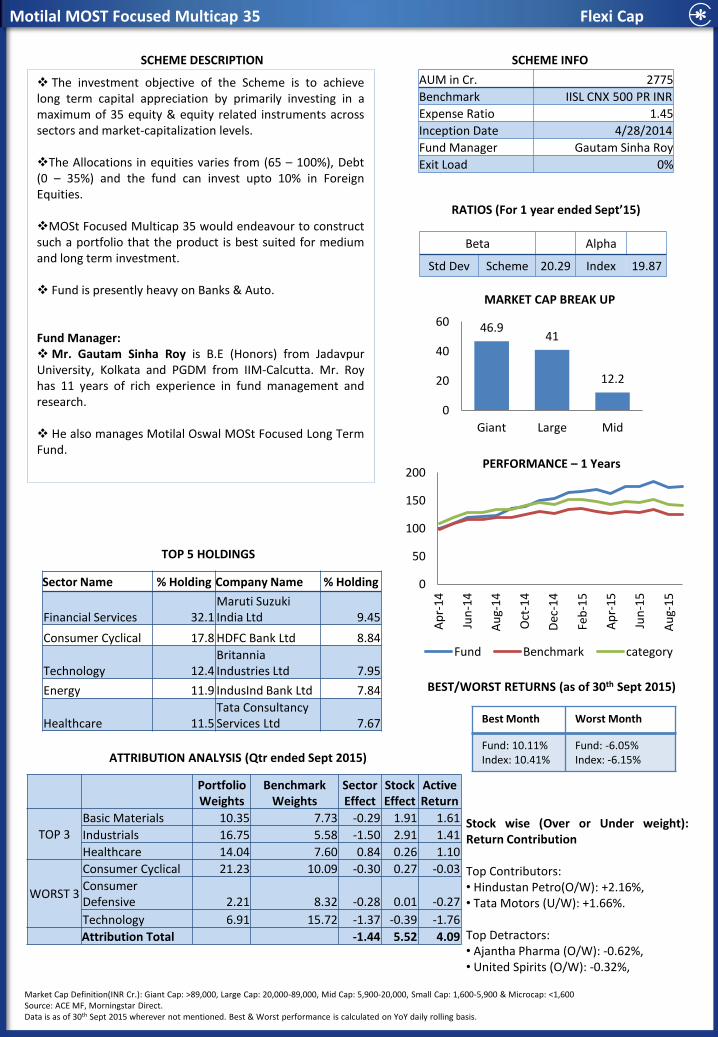
Stock wise (Over or Under weight): Return Contribution Top Contributors: • Hindustan Petro(O/W): +2.16%, • Tata Motors (U/W): +1.66%. Top Detractors: • Ajantha Pharma (O/W): -0.62%, • United Spirits (O/W): -0.32%,
SCHEME DESCRIPTION
MARKET CAP BREAK UP
PERFORMANCE – 1 Years
BEST/WORST RETURNS (as of 30th Sept 2015)
Sector Name % Holding Company Name % Holding
Financial Services 32.1 Maruti Suzuki India Ltd 9.45
Consumer Cyclical 17.8 HDFC Bank Ltd 8.84
Technology 12.4 Britannia Industries Ltd 7.95
Energy 11.9 IndusInd Bank Ltd 7.84
Healthcare 11.5 Tata Consultancy Services Ltd 7.67
AUM in Cr. 2775
Benchmark IISL CNX 500 PR INR
Expense Ratio 1.45
Inception Date 4/28/2014
Fund Manager Gautam Sinha Roy
Exit Load 0%
Beta Alpha
Std Dev Scheme 20.29 Index 19.87
Portfolio Weights
Benchmark Weights
Sector Effect
Stock Effect
Active Return
TOP 3 Basic Materials 10.35 7.73 -0.29 1.91 1.61
Industrials 16.75 5.58 -1.50 2.91 1.41
Healthcare 14.04 7.60 0.84 0.26 1.10
WORST 3
Consumer Cyclical 21.23 10.09 -0.30 0.27 -0.03
Consumer Defensive 2.21 8.32 -0.28 0.01 -0.27
Technology 6.91 15.72 -1.37 -0.39 -1.76
Attribution Total -1.44 5.52 4.09
The investment objective of the Scheme is to achieve long term capital appreciation by primarily investing in a maximum of 35 equity & equity related instruments across sectors and market-capitalization levels.
The Allocations in equities varies from (65 – 100%), Debt (0 – 35%) and the fund can invest upto 10% in Foreign Equities. MOSt Focused Multicap 35 would endeavour to construct such a portfolio that the product is best suited for medium and long term investment.
Fund is presently heavy on Banks & Auto.
Fund Manager: Mr. Gautam Sinha Roy is B.E (Honors) from Jadavpur University, Kolkata and PGDM from IIM-Calcutta. Mr. Roy has 11 years of rich experience in fund management and research.
He also manages Motilal Oswal MOSt Focused Long Term Fund.
Source: ACE MF, Morningstar Direct. Data is as of 30th Sept 2015 wherever not mentioned. Best & Worst performance is calculated on YoY daily rolling basis.
Market Cap Definition(INR Cr.): Giant Cap: >89,000, Large Cap: 20,000-89,000, Mid Cap: 5,900-20,000, Small Cap: 1,600-5,900 & Microcap: <1,600
Best Month Worst Month
Fund: 10.11% Index: 10.41%
Fund: -6.05% Index: -6.15%
46.9 41
12.2
0
20
40
60
Giant Large Mid
0
50
100
150
200
Ap
r-1
4
Jun
-14
Au
g-1
4
Oct
-14
Dec
-14
Feb
-15
Ap
r-1
5
Jun
-15
Au
g-1
5
Fund Benchmark category
THEMATIC FUNDS • Franklin Build India Fund
• Reliance Banking Fund
Franklin Build India Fund Thematic
SCHEME INFO
RATIOS (For 1 year ended Sept’15)
TOP 5 HOLDINGS
SCHEME DESCRIPTION
MARKET CAP BREAK UP
PERFORMANCE – 5 Years
BEST/WORST RETURNS (as of 30th Sept 2015) Sector Name % Holding Company Name % Holding
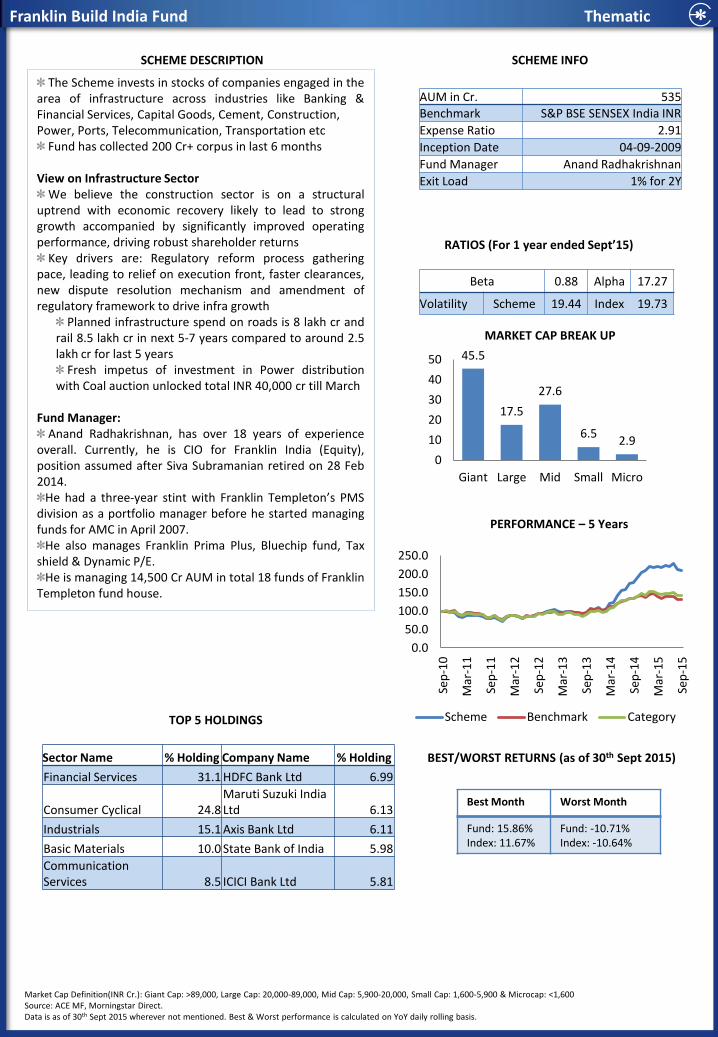
Financial Services 31.1 HDFC Bank Ltd 6.99
Consumer Cyclical 24.8 Maruti Suzuki India Ltd 6.13
Industrials 15.1 Axis Bank Ltd 6.11
Basic Materials 10.0 State Bank of India 5.98
Communication Services 8.5 ICICI Bank Ltd 5.81
AUM in Cr. 535 Benchmark S&P BSE SENSEX India INR
Expense Ratio 2.91
Inception Date 04-09-2009
Fund Manager Anand Radhakrishnan
Exit Load 1% for 2Y
Beta 0.88 Alpha 17.27
Volatility Scheme 19.44 Index 19.73
The Scheme invests in stocks of companies engaged in the area of infrastructure across industries like Banking & Financial Services, Capital Goods, Cement, Construction, Power, Ports, Telecommunication, Transportation etc
Fund has collected 200 Cr+ corpus in last 6 months View on Infrastructure Sector
We believe the construction sector is on a structural uptrend with economic recovery likely to lead to strong growth accompanied by significantly improved operating performance, driving robust shareholder returns
Key drivers are: Regulatory reform process gathering pace, leading to relief on execution front, faster clearances, new dispute resolution mechanism and amendment of regulatory framework to drive infra growth
Planned infrastructure spend on roads is 8 lakh cr and rail 8.5 lakh cr in next 5-7 years compared to around 2.5 lakh cr for last 5 years
Fresh impetus of investment in Power distribution with Coal auction unlocked total INR 40,000 cr till March
Fund Manager:
Anand Radhakrishnan, has over 18 years of experience overall. Currently, he is CIO for Franklin India (Equity), position assumed after Siva Subramanian retired on 28 Feb 2014.
He had a three-year stint with Franklin Templeton’s PMS division as a portfolio manager before he started managing funds for AMC in April 2007.
He also manages Franklin Prima Plus, Bluechip fund, Tax shield & Dynamic P/E.
He is managing 14,500 Cr AUM in total 18 funds of Franklin Templeton fund house.
Source: ACE MF, Morningstar Direct. Data is as of 30th Sept 2015 wherever not mentioned. Best & Worst performance is calculated on YoY daily rolling basis.
Market Cap Definition(INR Cr.): Giant Cap: >89,000, Large Cap: 20,000-89,000, Mid Cap: 5,900-20,000, Small Cap: 1,600-5,900 & Microcap: <1,600
45.5
17.5
27.6
6.5 2.9
0
10
20
30
40
50
Giant Large Mid Small Micro
0.0
50.0
100.0
150.0
200.0
250.0
Sep
-10
Mar
-11
Sep
-11
Mar
-12
Sep
-12
Mar
-13
Sep
-13
Mar
-14
Sep
-14
Mar
-15
Sep
-15
Scheme Benchmark Category
Best Month Worst Month
Fund: 15.86% Index: 11.67%
Fund: -10.71% Index: -10.64%
Reliance Banking Fund Thematic
SCHEME INFO
RATIOS (For 1 year ended Sept’15)
TOP 5 HOLDINGS
SCHEME DESCRIPTION
MARKET CAP BREAK UP
PERFORMANCE – 5 Years
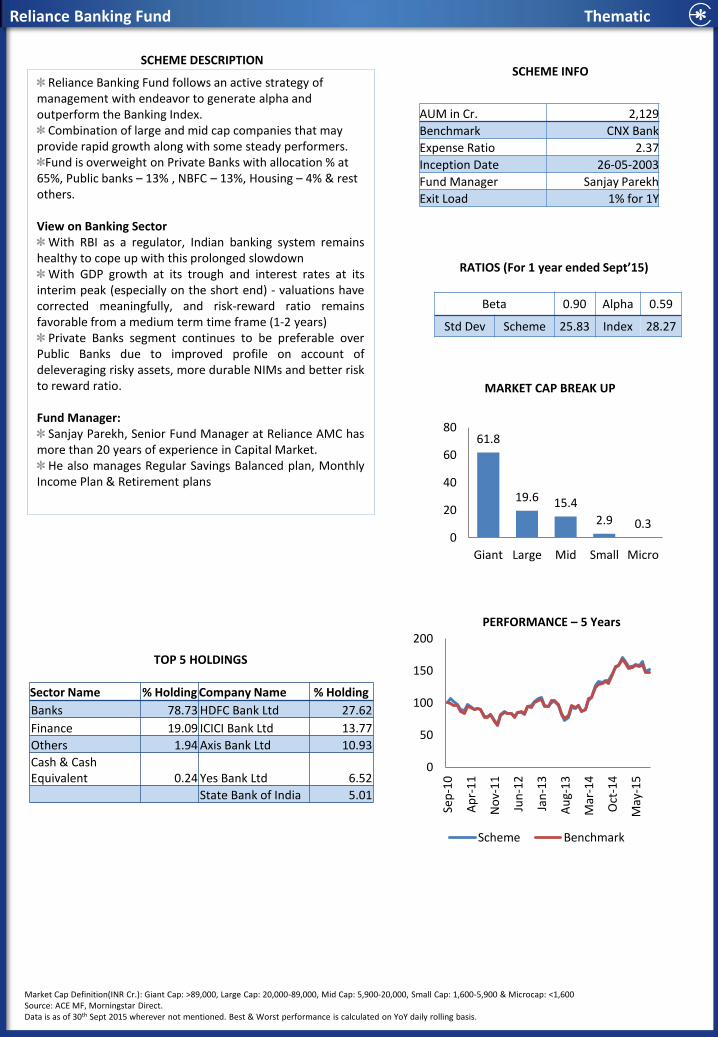
Sector Name % Holding Company Name % Holding
Banks 78.73 HDFC Bank Ltd 27.62
Finance 19.09 ICICI Bank Ltd 13.77
Others 1.94 Axis Bank Ltd 10.93
Cash & Cash Equivalent 0.24 Yes Bank Ltd 6.52
State Bank of India 5.01
AUM in Cr. 2,129
Benchmark CNX Bank
Expense Ratio 2.37
Inception Date 26-05-2003
Fund Manager Sanjay Parekh
Exit Load 1% for 1Y
Beta 0.90 Alpha 0.59
Std Dev Scheme 25.83 Index 28.27
Reliance Banking Fund follows an active strategy of management with endeavor to generate alpha and outperform the Banking Index.
Combination of large and mid cap companies that may provide rapid growth along with some steady performers.
Fund is overweight on Private Banks with allocation % at 65%, Public banks – 13% , NBFC – 13%, Housing – 4% & rest others. View on Banking Sector
With RBI as a regulator, Indian banking system remains healthy to cope up with this prolonged slowdown
With GDP growth at its trough and interest rates at its interim peak (especially on the short end) - valuations have corrected meaningfully, and risk-reward ratio remains favorable from a medium term time frame (1-2 years)
Private Banks segment continues to be preferable over Public Banks due to improved profile on account of deleveraging risky assets, more durable NIMs and better risk to reward ratio. Fund Manager:
Sanjay Parekh, Senior Fund Manager at Reliance AMC has more than 20 years of experience in Capital Market.
He also manages Regular Savings Balanced plan, Monthly Income Plan & Retirement plans
Source: ACE MF, Morningstar Direct. Data is as of 30th Sept 2015 wherever not mentioned. Best & Worst performance is calculated on YoY daily rolling basis.
Market Cap Definition(INR Cr.): Giant Cap: >89,000, Large Cap: 20,000-89,000, Mid Cap: 5,900-20,000, Small Cap: 1,600-5,900 & Microcap: <1,600
61.8
19.6 15.4
2.9 0.3 0
20
40
60
80
Giant Large Mid Small Micro
0
50
100
150
200
Sep
-10
Ap
r-1
1
No
v-1
1
Jun
-12
Jan
-13
Au
g-1
3
Mar
-14
Oct
-14
May
-15
Scheme Benchmark
BALANCED FUNDS • HDFC Balanced Fund
• ICICI Pru Balanced Advantage Fund
• Edelweiss Absolute Return Fund
HDFC Balanced Fund Balanced
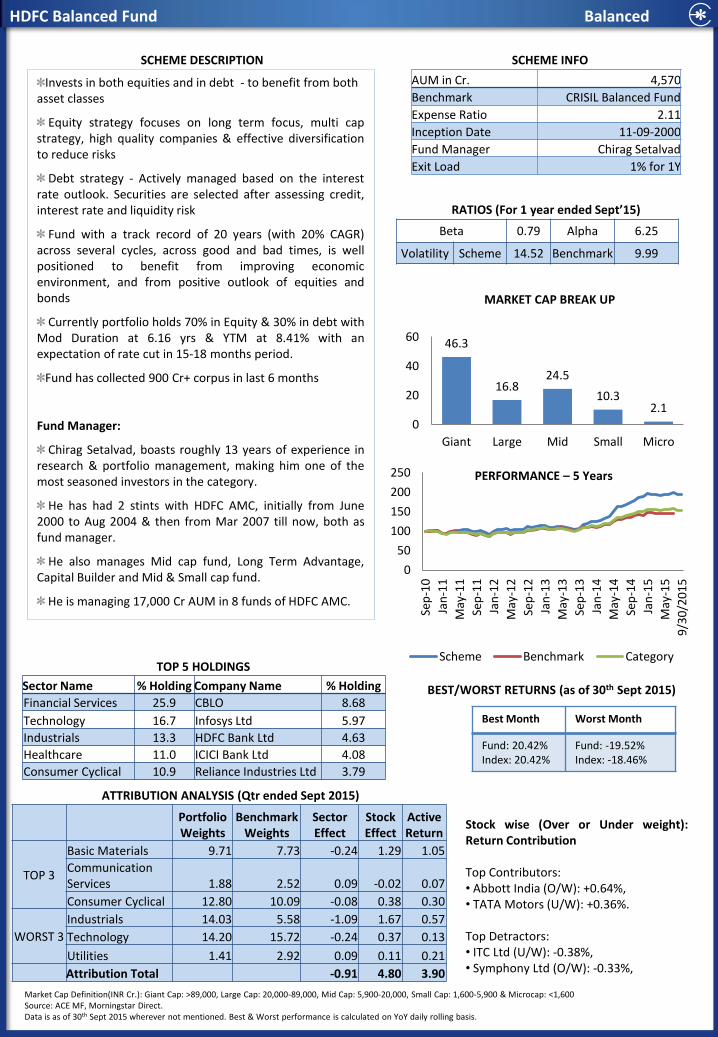
Invests in both equities and in debt - to benefit from both asset classes
Equity strategy focuses on long term focus, multi cap strategy, high quality companies & effective diversification to reduce risks
Debt strategy - Actively managed based on the interest rate outlook. Securities are selected after assessing credit, interest rate and liquidity risk
Fund with a track record of 20 years (with 20% CAGR) across several cycles, across good and bad times, is well positioned to benefit from improving economic environment, and from positive outlook of equities and bonds
Currently portfolio holds 70% in Equity & 30% in debt with Mod Duration at 6.16 yrs & YTM at 8.41% with an expectation of rate cut in 15-18 months period.
Fund has collected 900 Cr+ corpus in last 6 months
Fund Manager:
Chirag Setalvad, boasts roughly 13 years of experience in research & portfolio management, making him one of the most seasoned investors in the category.
He has had 2 stints with HDFC AMC, initially from June 2000 to Aug 2004 & then from Mar 2007 till now, both as fund manager.
He also manages Mid cap fund, Long Term Advantage, Capital Builder and Mid & Small cap fund.
He is managing 17,000 Cr AUM in 8 funds of HDFC AMC.
SCHEME INFO
RATIOS (For 1 year ended Sept’15)
TOP 5 HOLDINGS
ATTRIBUTION ANALYSIS (Qtr ended Sept 2015)
Stock wise (Over or Under weight): Return Contribution Top Contributors: • Abbott India (O/W): +0.64%, • TATA Motors (U/W): +0.36%. Top Detractors: • ITC Ltd (U/W): -0.38%, • Symphony Ltd (O/W): -0.33%,
SCHEME DESCRIPTION
MARKET CAP BREAK UP
PERFORMANCE – 5 Years
BEST/WORST RETURNS (as of 30th Sept 2015) Sector Name % Holding Company Name % Holding
Financial Services 25.9 CBLO 8.68
Technology 16.7 Infosys Ltd 5.97
Industrials 13.3 HDFC Bank Ltd 4.63
Healthcare 11.0 ICICI Bank Ltd 4.08
Consumer Cyclical 10.9 Reliance Industries Ltd 3.79
AUM in Cr. 4,570
Benchmark CRISIL Balanced Fund
Expense Ratio 2.11
Inception Date 11-09-2000
Fund Manager Chirag Setalvad
Exit Load 1% for 1Y
Beta 0.79 Alpha 6.25
Volatility Scheme 14.52 Benchmark 9.99
Portfolio Weights
Benchmark Weights
Sector Effect
Stock Effect
Active Return
TOP 3
Basic Materials 9.71 7.73 -0.24 1.29 1.05
Communication Services 1.88 2.52 0.09 -0.02 0.07
Consumer Cyclical 12.80 10.09 -0.08 0.38 0.30
WORST 3
Industrials 14.03 5.58 -1.09 1.67 0.57
Technology 14.20 15.72 -0.24 0.37 0.13
Utilities 1.41 2.92 0.09 0.11 0.21
Attribution Total -0.91 4.80 3.90
Source: ACE MF, Morningstar Direct. Data is as of 30th Sept 2015 wherever not mentioned. Best & Worst performance is calculated on YoY daily rolling basis.
Market Cap Definition(INR Cr.): Giant Cap: >89,000, Large Cap: 20,000-89,000, Mid Cap: 5,900-20,000, Small Cap: 1,600-5,900 & Microcap: <1,600
46.3
16.8 24.5
10.3 2.1
0
20
40
60
Giant Large Mid Small Micro
0
50
100
150
200
250
Sep
-10
Jan
-11
May
-11
Sep
-11
Jan
-12
May
-12
Sep
-12
Jan
-13
May
-13
Sep
-13
Jan
-14
May
-14
Sep
-14
Jan
-15
May
-15
9/3
0/2
01
5
Scheme Benchmark Category
Best Month Worst Month
Fund: 20.42% Index: 20.42%
Fund: -19.52% Index: -18.46%
ICICI Pru Balanced Advantage Fund Balanced
SCHEME INFO
RATIOS (For 1 year ended Sept’15)
TOP 5 HOLDINGS
ATTRIBUTION ANALYSIS (Qtr ended Sept 2015)
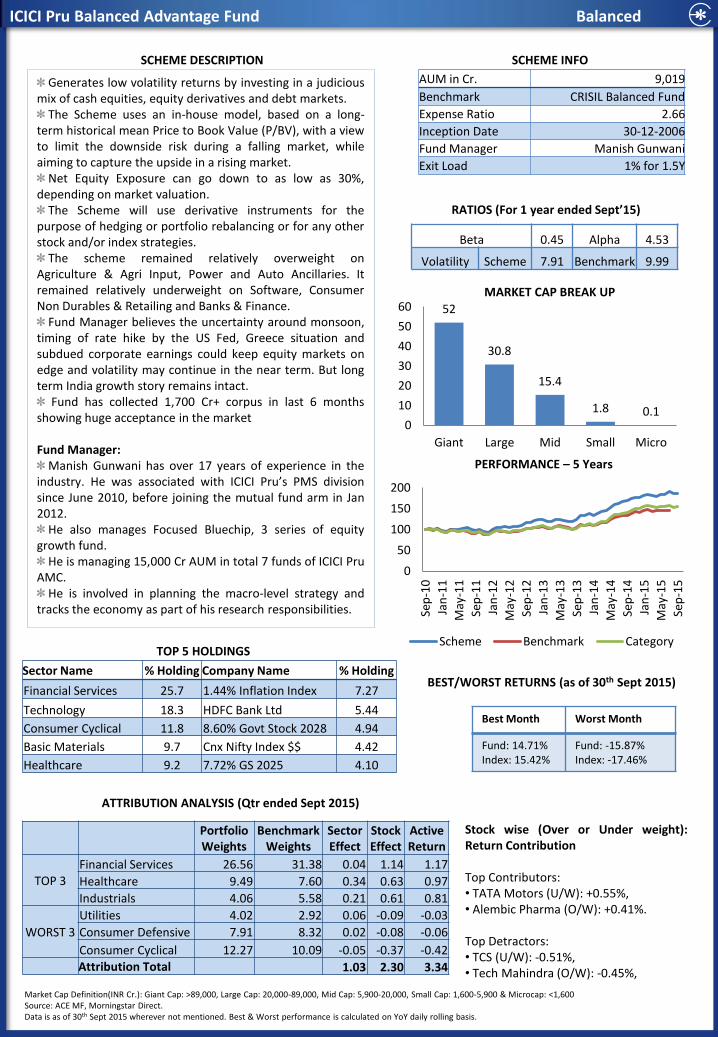
Stock wise (Over or Under weight): Return Contribution Top Contributors: • TATA Motors (U/W): +0.55%, • Alembic Pharma (O/W): +0.41%. Top Detractors: • TCS (U/W): -0.51%, • Tech Mahindra (O/W): -0.45%,
SCHEME DESCRIPTION
MARKET CAP BREAK UP
PERFORMANCE – 5 Years
BEST/WORST RETURNS (as of 30th Sept 2015) Sector Name % Holding Company Name % Holding
Financial Services 25.7 1.44% Inflation Index 7.27
Technology 18.3 HDFC Bank Ltd 5.44
Consumer Cyclical 11.8 8.60% Govt Stock 2028 4.94
Basic Materials 9.7 Cnx Nifty Index $$ 4.42
Healthcare 9.2 7.72% GS 2025 4.10
AUM in Cr. 9,019
Benchmark CRISIL Balanced Fund
Expense Ratio 2.66
Inception Date 30-12-2006
Fund Manager Manish Gunwani
Exit Load 1% for 1.5Y
Portfolio Weights
Benchmark Weights
Sector Effect
Stock Effect
Active Return
TOP 3 Financial Services 26.56 31.38 0.04 1.14 1.17
Healthcare 9.49 7.60 0.34 0.63 0.97
Industrials 4.06 5.58 0.21 0.61 0.81
WORST 3
Utilities 4.02 2.92 0.06 -0.09 -0.03
Consumer Defensive 7.91 8.32 0.02 -0.08 -0.06
Consumer Cyclical 12.27 10.09 -0.05 -0.37 -0.42 Attribution Total 1.03 2.30 3.34
Generates low volatility returns by investing in a judicious mix of cash equities, equity derivatives and debt markets.
The Scheme uses an in-house model, based on a long-term historical mean Price to Book Value (P/BV), with a view to limit the downside risk during a falling market, while aiming to capture the upside in a rising market.
Net Equity Exposure can go down to as low as 30%, depending on market valuation.
The Scheme will use derivative instruments for the purpose of hedging or portfolio rebalancing or for any other stock and/or index strategies.
The scheme remained relatively overweight on Agriculture & Agri Input, Power and Auto Ancillaries. It remained relatively underweight on Software, Consumer Non Durables & Retailing and Banks & Finance.
Fund Manager believes the uncertainty around monsoon, timing of rate hike by the US Fed, Greece situation and subdued corporate earnings could keep equity markets on edge and volatility may continue in the near term. But long term India growth story remains intact.
Fund has collected 1,700 Cr+ corpus in last 6 months showing huge acceptance in the market Fund Manager:
Manish Gunwani has over 17 years of experience in the industry. He was associated with ICICI Pru’s PMS division since June 2010, before joining the mutual fund arm in Jan 2012.
He also manages Focused Bluechip, 3 series of equity growth fund.
He is managing 15,000 Cr AUM in total 7 funds of ICICI Pru AMC.
He is involved in planning the macro-level strategy and tracks the economy as part of his research responsibilities.
Source: ACE MF, Morningstar Direct. Data is as of 30th Sept 2015 wherever not mentioned. Best & Worst performance is calculated on YoY daily rolling basis.
Market Cap Definition(INR Cr.): Giant Cap: >89,000, Large Cap: 20,000-89,000, Mid Cap: 5,900-20,000, Small Cap: 1,600-5,900 & Microcap: <1,600
Beta 0.45 Alpha 4.53
Volatility Scheme 7.91 Benchmark 9.99
52
30.8
15.4
1.8 0.1 0
10
20
30
40
50
60
Giant Large Mid Small Micro
0
50
100
150
200
Sep
-10
Jan
-11
May
-11
Sep
-11
Jan
-12
May
-12
Sep
-12
Jan
-13
May
-13
Sep
-13
Jan
-14
May
-14
Sep
-14
Jan
-15
May
-15
Sep
-15
Scheme Benchmark Category
Best Month Worst Month
Fund: 14.71% Index: 15.42%
Fund: -15.87% Index: -17.46%
Edelweiss Absolute Return Fund Balanced
SCHEME INFO
RATIOS (For 1 year ended Sept’15)
TOP 5 HOLDINGS
ATTRIBUTION ANALYSIS (Qtr ended Sept 2015)
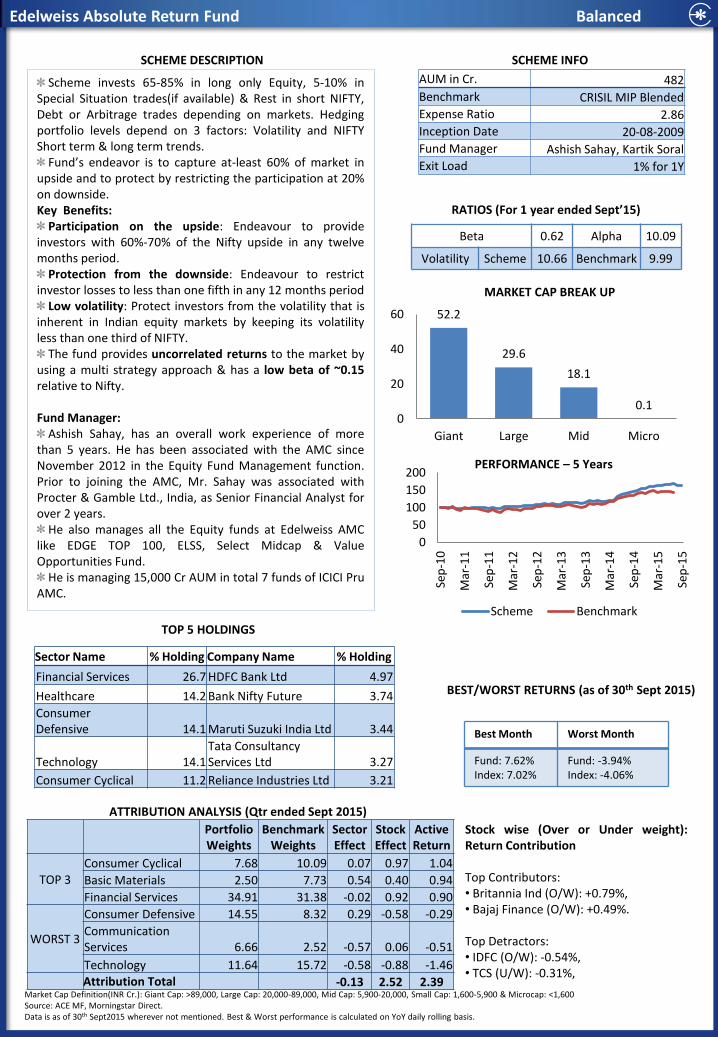
Stock wise (Over or Under weight): Return Contribution Top Contributors: • Britannia Ind (O/W): +0.79%, • Bajaj Finance (O/W): +0.49%. Top Detractors: • IDFC (O/W): -0.54%, • TCS (U/W): -0.31%,
SCHEME DESCRIPTION
MARKET CAP BREAK UP
PERFORMANCE – 5 Years
BEST/WORST RETURNS (as of 30th Sept 2015)
Sector Name % Holding Company Name % Holding
Financial Services 26.7 HDFC Bank Ltd 4.97
Healthcare 14.2 Bank Nifty Future 3.74
Consumer Defensive 14.1 Maruti Suzuki India Ltd 3.44
Technology 14.1 Tata Consultancy Services Ltd 3.27
Consumer Cyclical 11.2 Reliance Industries Ltd 3.21
AUM in Cr. 482
Benchmark CRISIL MIP Blended
Expense Ratio 2.86
Inception Date 20-08-2009
Fund Manager Ashish Sahay, Kartik Soral
Exit Load 1% for 1Y
Portfolio Weights
Benchmark Weights
Sector Effect
Stock Effect
Active Return
TOP 3 Consumer Cyclical 7.68 10.09 0.07 0.97 1.04
Basic Materials 2.50 7.73 0.54 0.40 0.94
Financial Services 34.91 31.38 -0.02 0.92 0.90
WORST 3
Consumer Defensive 14.55 8.32 0.29 -0.58 -0.29
Communication Services 6.66 2.52 -0.57 0.06 -0.51
Technology 11.64 15.72 -0.58 -0.88 -1.46 Attribution Total -0.13 2.52 2.39
Scheme invests 65-85% in long only Equity, 5-10% in Special Situation trades(if available) & Rest in short NIFTY, Debt or Arbitrage trades depending on markets. Hedging portfolio levels depend on 3 factors: Volatility and NIFTY Short term & long term trends.
Fund’s endeavor is to capture at-least 60% of market in upside and to protect by restricting the participation at 20% on downside. Key Benefits:
Participation on the upside: Endeavour to provide investors with 60%-70% of the Nifty upside in any twelve months period.
Protection from the downside: Endeavour to restrict investor losses to less than one fifth in any 12 months period
Low volatility: Protect investors from the volatility that is inherent in Indian equity markets by keeping its volatility less than one third of NIFTY.
The fund provides uncorrelated returns to the market by using a multi strategy approach & has a low beta of ~0.15 relative to Nifty. Fund Manager:
Ashish Sahay, has an overall work experience of more than 5 years. He has been associated with the AMC since November 2012 in the Equity Fund Management function. Prior to joining the AMC, Mr. Sahay was associated with Procter & Gamble Ltd., India, as Senior Financial Analyst for over 2 years.
He also manages all the Equity funds at Edelweiss AMC like EDGE TOP 100, ELSS, Select Midcap & Value Opportunities Fund.
He is managing 15,000 Cr AUM in total 7 funds of ICICI Pru AMC.
Source: ACE MF, Morningstar Direct. Data is as of 30th Sept2015 wherever not mentioned. Best & Worst performance is calculated on YoY daily rolling basis.
Market Cap Definition(INR Cr.): Giant Cap: >89,000, Large Cap: 20,000-89,000, Mid Cap: 5,900-20,000, Small Cap: 1,600-5,900 & Microcap: <1,600
Beta 0.62 Alpha 10.09
Volatility Scheme 10.66 Benchmark 9.99
52.2
29.6
18.1
0.1 0
20
40
60
Giant Large Mid Micro
0
50
100
150
200
Sep
-10
Mar
-11
Sep
-11
Mar
-12
Sep
-12
Mar
-13
Sep
-13
Mar
-14
Sep
-14
Mar
-15
Sep
-15
Scheme Benchmark
Best Month Worst Month
Fund: 7.62% Index: 7.02%
Fund: -3.94% Index: -4.06%

ARBITRAGE FUNDS • Edelweiss Arbitrage Fund
• ICICI Pru Equity Arbitrage Fund
Edelweiss Arbitrage Fund Arbitrage
SCHEME INFO
TOP 10 HOLDINGS
SCHEME DESCRIPTION
ASSET ALLOCATION
PERFORMANCE – 1 Years
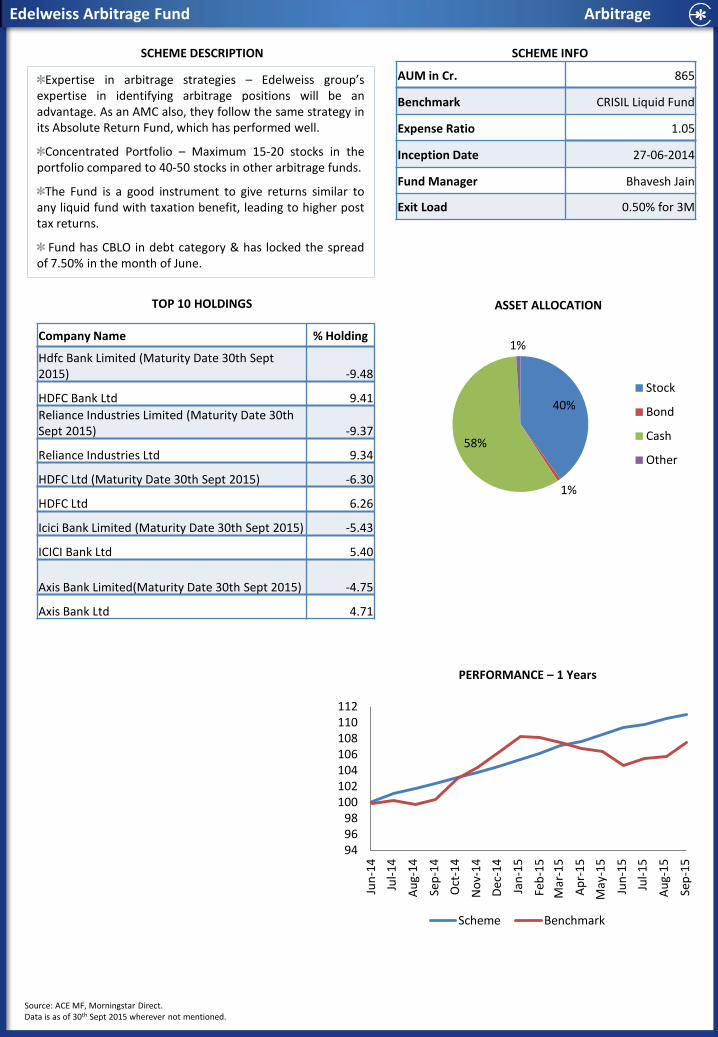
Expertise in arbitrage strategies – Edelweiss group’s expertise in identifying arbitrage positions will be an advantage. As an AMC also, they follow the same strategy in its Absolute Return Fund, which has performed well.
Concentrated Portfolio – Maximum 15-20 stocks in the portfolio compared to 40-50 stocks in other arbitrage funds.
The Fund is a good instrument to give returns similar to any liquid fund with taxation benefit, leading to higher post tax returns.
Fund has CBLO in debt category & has locked the spread of 7.50% in the month of June.
Company Name % Holding
Hdfc Bank Limited (Maturity Date 30th Sept 2015) -9.48
HDFC Bank Ltd 9.41
Reliance Industries Limited (Maturity Date 30th Sept 2015) -9.37
Reliance Industries Ltd 9.34
HDFC Ltd (Maturity Date 30th Sept 2015) -6.30
HDFC Ltd 6.26
Icici Bank Limited (Maturity Date 30th Sept 2015) -5.43
ICICI Bank Ltd 5.40
Axis Bank Limited(Maturity Date 30th Sept 2015) -4.75
Axis Bank Ltd 4.71
AUM in Cr. 865
Benchmark CRISIL Liquid Fund
Expense Ratio 1.05
Inception Date 27-06-2014
Fund Manager Bhavesh Jain
Exit Load 0.50% for 3M
Source: ACE MF, Morningstar Direct. Data is as of 30th Sept 2015 wherever not mentioned.
40%
1%
58%
1%
Stock
Bond
Cash
Other
94 96 98
100 102 104 106 108 110 112
Jun
-14
Jul-
14
Au
g-1
4
Sep
-14
Oct
-14
No
v-1
4
Dec
-14
Jan
-15
Feb
-15
Mar
-15
Ap
r-1
5
May
-15
Jun
-15
Jul-
15
Au
g-1
5
Sep
-15
Scheme Benchmark
ICICI Pru Equity Arbitrage Fund Arbitrage
SCHEME INFO
TOP 10 HOLDINGS
SCHEME DESCRIPTION
ASSET ALLOCATION
PERFORMANCE – 5 Years
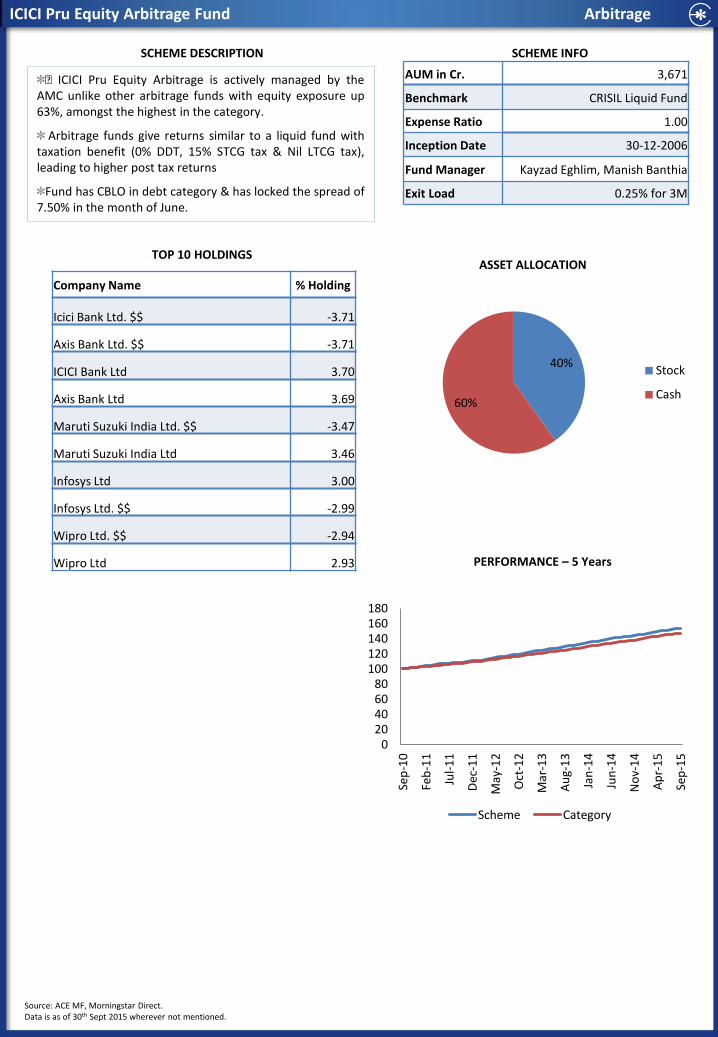
Ÿ ICICI Pru Equity Arbitrage is actively managed by the AMC unlike other arbitrage funds with equity exposure up 63%, amongst the highest in the category.
Arbitrage funds give returns similar to a liquid fund with taxation benefit (0% DDT, 15% STCG tax & Nil LTCG tax), leading to higher post tax returns
Fund has CBLO in debt category & has locked the spread of 7.50% in the month of June.
Company Name % Holding
Icici Bank Ltd. $$ -3.71
Axis Bank Ltd. $$ -3.71
ICICI Bank Ltd 3.70
Axis Bank Ltd 3.69
Maruti Suzuki India Ltd. $$ -3.47
Maruti Suzuki India Ltd 3.46
Infosys Ltd 3.00
Infosys Ltd. $$ -2.99
Wipro Ltd. $$ -2.94
Wipro Ltd 2.93
AUM in Cr. 3,671
Benchmark CRISIL Liquid Fund
Expense Ratio 1.00
Inception Date 30-12-2006
Fund Manager Kayzad Eghlim, Manish Banthia
Exit Load 0.25% for 3M
Source: ACE MF, Morningstar Direct. Data is as of 30th Sept 2015 wherever not mentioned.
40%
60%
Stock
Cash
0 20 40 60 80
100 120 140 160 180
Sep
-10
Feb
-11
Jul-
11
Dec
-11
May
-12
Oct
-12
Mar
-13
Au
g-1
3
Jan
-14
Jun
-14
No
v-1
4
Ap
r-1
5
Sep
-15
Scheme Category

DEBT MUTUAL FUNDS
AUM Trends in Debt Market
Debt: What’s Happening?
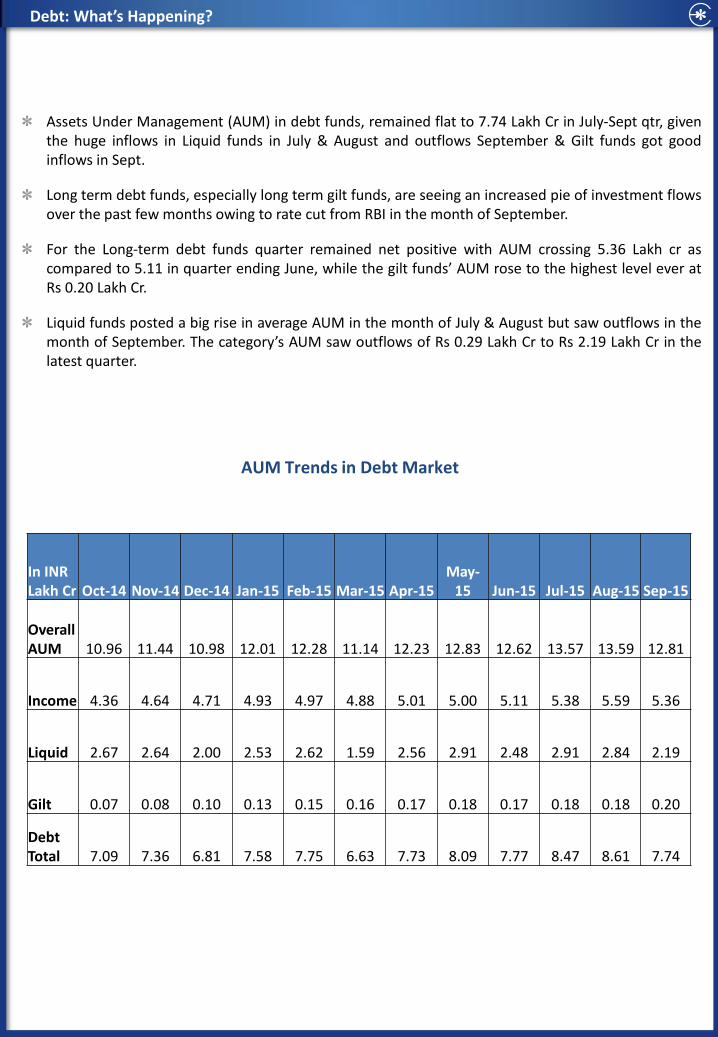
Assets Under Management (AUM) in debt funds, remained flat to 7.74 Lakh Cr in July-Sept qtr, given the huge inflows in Liquid funds in July & August and outflows September & Gilt funds got good inflows in Sept.
Long term debt funds, especially long term gilt funds, are seeing an increased pie of investment flows over the past few months owing to rate cut from RBI in the month of September.
For the Long-term debt funds quarter remained net positive with AUM crossing 5.36 Lakh cr as compared to 5.11 in quarter ending June, while the gilt funds’ AUM rose to the highest level ever at Rs 0.20 Lakh Cr.
Liquid funds posted a big rise in average AUM in the month of July & August but saw outflows in the month of September. The category’s AUM saw outflows of Rs 0.29 Lakh Cr to Rs 2.19 Lakh Cr in the latest quarter.
In INR Lakh Cr Oct-14 Nov-14 Dec-14 Jan-15 Feb-15 Mar-15 Apr-15
May-15 Jun-15 Jul-15 Aug-15 Sep-15
Overall AUM 10.96 11.44 10.98 12.01 12.28 11.14 12.23 12.83 12.62 13.57 13.59 12.81
Income 4.36 4.64 4.71 4.93 4.97 4.88 5.01 5.00 5.11 5.38 5.59 5.36
Liquid 2.67 2.64 2.00 2.53 2.62 1.59 2.56 2.91 2.48 2.91 2.84 2.19
Gilt 0.07 0.08 0.10 0.13 0.15 0.16 0.17 0.18 0.17 0.18 0.18 0.20
Debt Total 7.09 7.36 6.81 7.58 7.75 6.63 7.73 8.09 7.77 8.47 8.61 7.74
ACCRUAL FUNDS - ST • ICICI Pru Short Term Fund
• IDFC SSIF ST Fund
ICICI Pru Short Term Income Plan Accrual ST
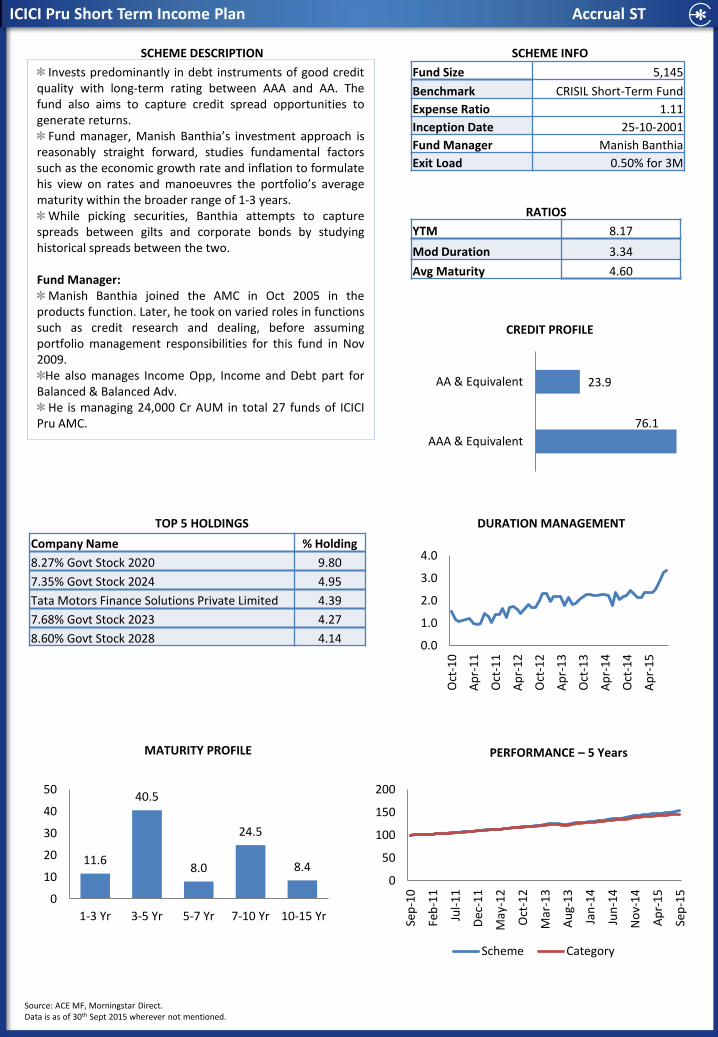
Invests predominantly in debt instruments of good credit quality with long-term rating between AAA and AA. The fund also aims to capture credit spread opportunities to generate returns.
Fund manager, Manish Banthia’s investment approach is reasonably straight forward, studies fundamental factors such as the economic growth rate and inflation to formulate his view on rates and manoeuvres the portfolio’s average maturity within the broader range of 1-3 years.
While picking securities, Banthia attempts to capture spreads between gilts and corporate bonds by studying historical spreads between the two.
Fund Manager:
Manish Banthia joined the AMC in Oct 2005 in the products function. Later, he took on varied roles in functions such as credit research and dealing, before assuming portfolio management responsibilities for this fund in Nov 2009.
He also manages Income Opp, Income and Debt part for Balanced & Balanced Adv.
He is managing 24,000 Cr AUM in total 27 funds of ICICI Pru AMC.
SCHEME INFO
RATIOS
TOP 5 HOLDINGS
SCHEME DESCRIPTION
CREDIT PROFILE
DURATION MANAGEMENT
MATURITY PROFILE
Company Name % Holding
8.27% Govt Stock 2020 9.80
7.35% Govt Stock 2024 4.95
Tata Motors Finance Solutions Private Limited 4.39
7.68% Govt Stock 2023 4.27
8.60% Govt Stock 2028 4.14
Fund Size 5,145
Benchmark CRISIL Short-Term Fund
Expense Ratio 1.11
Inception Date 25-10-2001
Fund Manager Manish Banthia
Exit Load 0.50% for 3M
YTM 8.17
Mod Duration 3.34
Avg Maturity 4.60
PERFORMANCE – 5 Years
Source: ACE MF, Morningstar Direct. Data is as of 30th Sept 2015 wherever not mentioned.
76.1
23.9
AAA & Equivalent
AA & Equivalent
0.0
1.0
2.0
3.0
4.0
Oct
-10
Ap
r-1
1
Oct
-11
Ap
r-1
2
Oct
-12
Ap
r-1
3
Oct
-13
Ap
r-1
4
Oct
-14
Ap
r-1
5
11.6
40.5
8.0
24.5
8.4
0
10
20
30
40
50
1-3 Yr 3-5 Yr 5-7 Yr 7-10 Yr 10-15 Yr
0
50
100
150
200
Sep
-10
Feb
-11
Jul-
11
Dec
-11
May
-12
Oct
-12
Mar
-13
Au
g-1
3
Jan
-14
Jun
-14
No
v-1
4
Ap
r-1
5
Sep
-15
Scheme Category
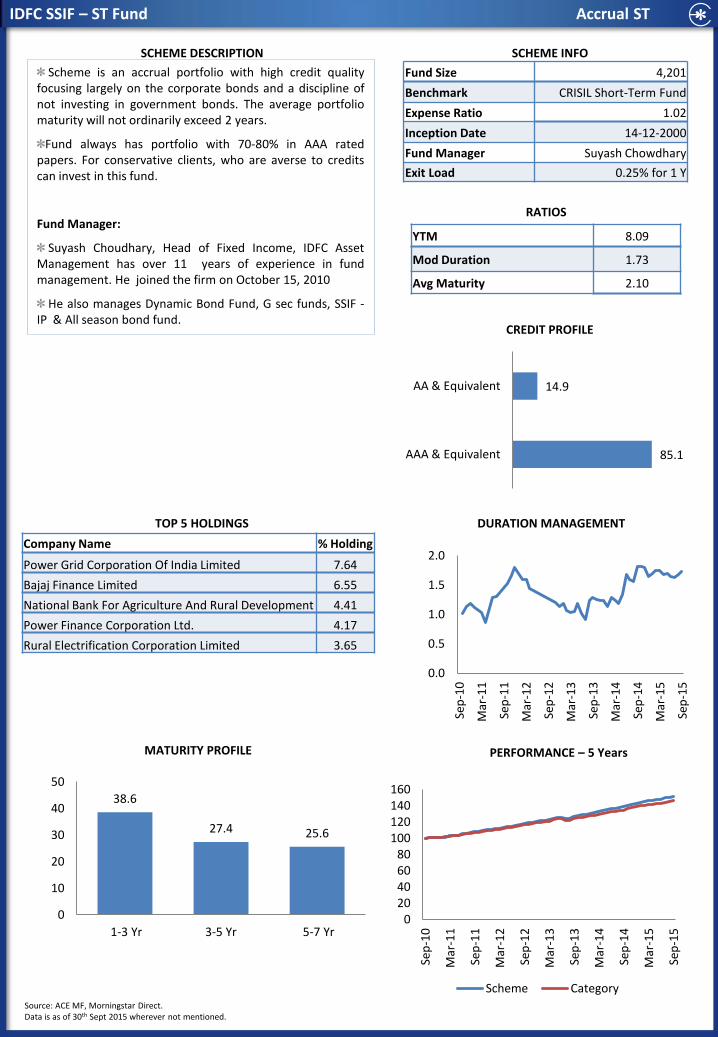
IDFC SSIF – ST Fund Accrual ST
SCHEME INFO
RATIOS
TOP 5 HOLDINGS
SCHEME DESCRIPTION
CREDIT PROFILE
DURATION MANAGEMENT
PERFORMANCE – 5 Years MATURITY PROFILE
Company Name % Holding
Power Grid Corporation Of India Limited 7.64
Bajaj Finance Limited 6.55
National Bank For Agriculture And Rural Development 4.41
Power Finance Corporation Ltd. 4.17
Rural Electrification Corporation Limited 3.65
Fund Size 4,201
Benchmark CRISIL Short-Term Fund
Expense Ratio 1.02
Inception Date 14-12-2000
Fund Manager Suyash Chowdhary
Exit Load 0.25% for 1 Y
YTM 8.09
Mod Duration 1.73
Avg Maturity 2.10
Scheme is an accrual portfolio with high credit quality focusing largely on the corporate bonds and a discipline of not investing in government bonds. The average portfolio maturity will not ordinarily exceed 2 years.
Fund always has portfolio with 70-80% in AAA rated papers. For conservative clients, who are averse to credits can invest in this fund.
Fund Manager:
Suyash Choudhary, Head of Fixed Income, IDFC Asset Management has over 11 years of experience in fund management. He joined the firm on October 15, 2010
He also manages Dynamic Bond Fund, G sec funds, SSIF - IP & All season bond fund.
Source: ACE MF, Morningstar Direct. Data is as of 30th Sept 2015 wherever not mentioned.
85.1
14.9
AAA & Equivalent
AA & Equivalent
0.0
0.5
1.0
1.5
2.0
Sep
-10
Mar
-11
Sep
-11
Mar
-12
Sep
-12
Mar
-13
Sep
-13
Mar
-14
Sep
-14
Mar
-15
Sep
-15
38.6
27.4 25.6
0
10
20
30
40
50
1-3 Yr 3-5 Yr 5-7 Yr 0
20 40 60 80
100 120 140 160
Sep
-10
Mar
-11
Sep
-11
Mar
-12
Sep
-12
Mar
-13
Sep
-13
Mar
-14
Sep
-14
Mar
-15
Sep
-15
Scheme Category
ACCRUAL FUNDS – LT • Birla SL Medium Term Fund
• ICICI Pru Regular Savings Fund
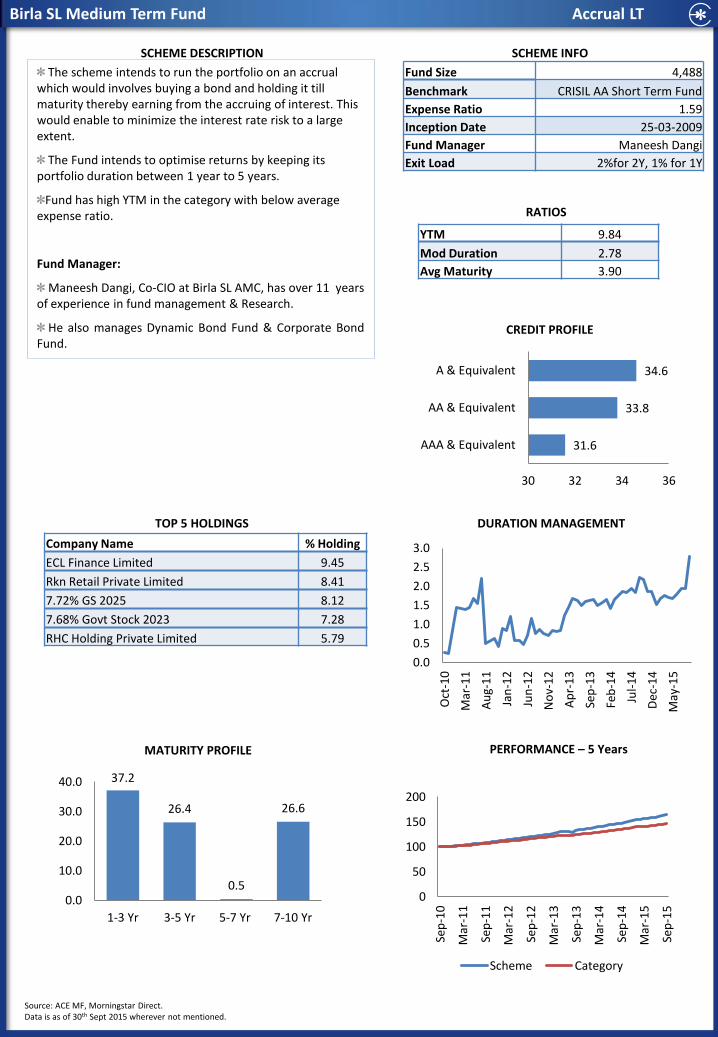
Birla SL Medium Term Fund Accrual LT
SCHEME INFO
RATIOS
TOP 5 HOLDINGS
SCHEME DESCRIPTION
CREDIT PROFILE
DURATION MANAGEMENT
PERFORMANCE – 5 Years MATURITY PROFILE
Company Name % Holding
ECL Finance Limited 9.45
Rkn Retail Private Limited 8.41
7.72% GS 2025 8.12
7.68% Govt Stock 2023 7.28
RHC Holding Private Limited 5.79
Fund Size 4,488
Benchmark CRISIL AA Short Term Fund
Expense Ratio 1.59
Inception Date 25-03-2009
Fund Manager Maneesh Dangi
Exit Load 2%for 2Y, 1% for 1Y
YTM 9.84
Mod Duration 2.78
Avg Maturity 3.90
The scheme intends to run the portfolio on an accrual which would involves buying a bond and holding it till maturity thereby earning from the accruing of interest. This would enable to minimize the interest rate risk to a large extent.
The Fund intends to optimise returns by keeping its portfolio duration between 1 year to 5 years.
Fund has high YTM in the category with below average expense ratio.
Fund Manager:
Maneesh Dangi, Co-CIO at Birla SL AMC, has over 11 years of experience in fund management & Research.
He also manages Dynamic Bond Fund & Corporate Bond Fund.
Source: ACE MF, Morningstar Direct. Data is as of 30th Sept 2015 wherever not mentioned.
31.6
33.8
34.6
30 32 34 36
AAA & Equivalent
AA & Equivalent
A & Equivalent
0.0
0.5
1.0
1.5
2.0
2.5
3.0
Oct
-10
Mar
-11
Au
g-1
1
Jan
-12
Jun
-12
No
v-1
2
Ap
r-1
3
Sep
-13
Feb
-14
Jul-
14
Dec
-14
May
-15
37.2
26.4
0.5
26.6
0.0
10.0
20.0
30.0
40.0
1-3 Yr 3-5 Yr 5-7 Yr 7-10 Yr
0
50
100
150
200
Sep
-10
Mar
-11
Sep
-11
Mar
-12
Sep
-12
Mar
-13
Sep
-13
Mar
-14
Sep
-14
Mar
-15
Sep
-15
Scheme Category
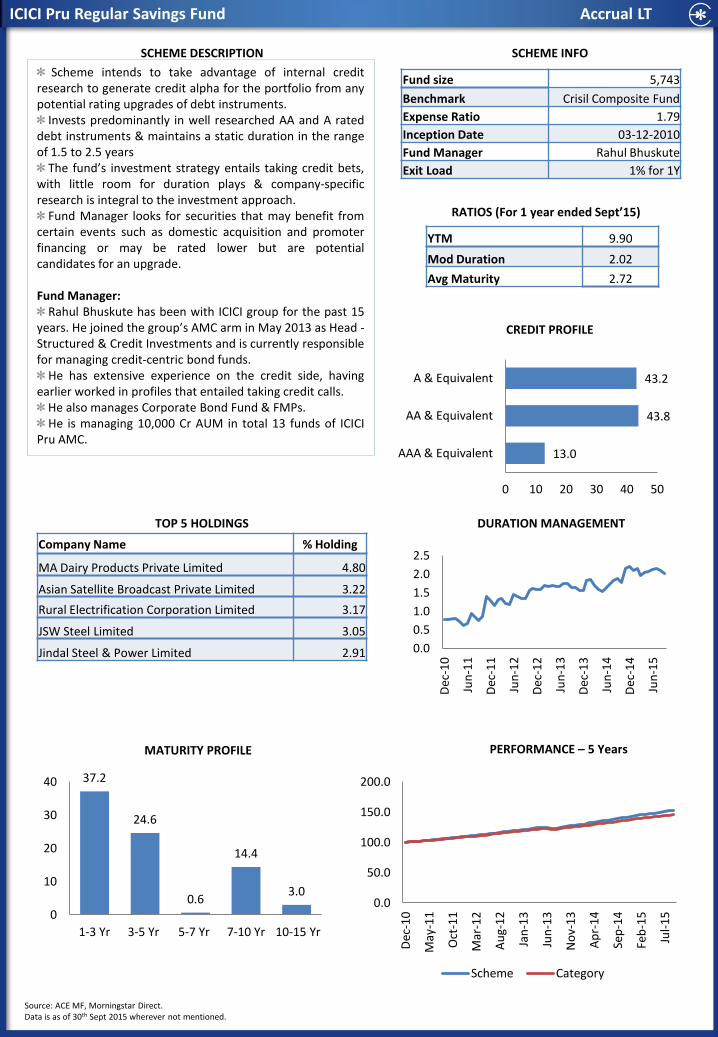
ICICI Pru Regular Savings Fund Accrual LT
SCHEME INFO
RATIOS (For 1 year ended Sept’15)
TOP 5 HOLDINGS
SCHEME DESCRIPTION
CREDIT PROFILE
DURATION MANAGEMENT
PERFORMANCE – 5 Years MATURITY PROFILE
Scheme intends to take advantage of internal credit research to generate credit alpha for the portfolio from any potential rating upgrades of debt instruments.
Invests predominantly in well researched AA and A rated debt instruments & maintains a static duration in the range of 1.5 to 2.5 years
The fund’s investment strategy entails taking credit bets, with little room for duration plays & company-specific research is integral to the investment approach.
Fund Manager looks for securities that may benefit from certain events such as domestic acquisition and promoter financing or may be rated lower but are potential candidates for an upgrade. Fund Manager:
Rahul Bhuskute has been with ICICI group for the past 15 years. He joined the group’s AMC arm in May 2013 as Head - Structured & Credit Investments and is currently responsible for managing credit-centric bond funds.
He has extensive experience on the credit side, having earlier worked in profiles that entailed taking credit calls.
He also manages Corporate Bond Fund & FMPs. He is managing 10,000 Cr AUM in total 13 funds of ICICI
Pru AMC.
Company Name % Holding
MA Dairy Products Private Limited 4.80
Asian Satellite Broadcast Private Limited 3.22
Rural Electrification Corporation Limited 3.17
JSW Steel Limited 3.05
Jindal Steel & Power Limited 2.91
Fund size 5,743
Benchmark Crisil Composite Fund
Expense Ratio 1.79
Inception Date 03-12-2010
Fund Manager Rahul Bhuskute
Exit Load 1% for 1Y
YTM 9.90
Mod Duration 2.02
Avg Maturity 2.72
Source: ACE MF, Morningstar Direct. Data is as of 30th Sept 2015 wherever not mentioned.
13.0
43.8
43.2
0 10 20 30 40 50
AAA & Equivalent
AA & Equivalent
A & Equivalent
0.0
0.5
1.0
1.5
2.0
2.5
Dec
-10
Jun
-11
Dec
-11
Jun
-12
Dec
-12
Jun
-13
Dec
-13
Jun
-14
Dec
-14
Jun
-15
37.2
24.6
0.6
14.4
3.0
0
10
20
30
40
1-3 Yr 3-5 Yr 5-7 Yr 7-10 Yr 10-15 Yr
0.0
50.0
100.0
150.0
200.0
Dec
-10
May
-11
Oct
-11
Mar
-12
Au
g-1
2
Jan
-13
Jun
-13
No
v-1
3
Ap
r-1
4
Sep
-14
Feb
-15
Jul-
15
Scheme Category

DYNAMIC FUNDS • IDFC Dynamic Bond Fund
• Reliance Dynamic Fund
IDFC Dynamic Bond Fund Dynamic
SCHEME INFO
RATIOS
TOP 5 HOLDINGS
SCHEME DESCRIPTION
CREDIT PROFILE
DURATION MANAGEMENT
PERFORMANCE – 5 Years MATURITY PROFILE
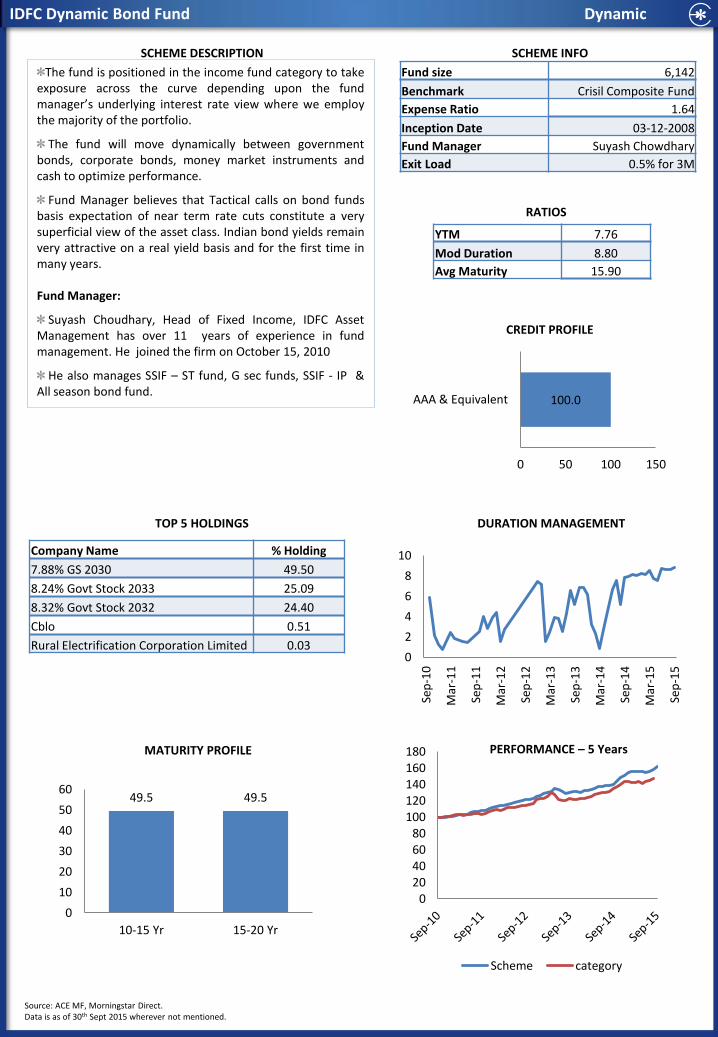
The fund is positioned in the income fund category to take exposure across the curve depending upon the fund manager’s underlying interest rate view where we employ the majority of the portfolio.
The fund will move dynamically between government bonds, corporate bonds, money market instruments and cash to optimize performance.
Fund Manager believes that Tactical calls on bond funds basis expectation of near term rate cuts constitute a very superficial view of the asset class. Indian bond yields remain very attractive on a real yield basis and for the first time in many years.
Fund Manager:
Suyash Choudhary, Head of Fixed Income, IDFC Asset Management has over 11 years of experience in fund management. He joined the firm on October 15, 2010
He also manages SSIF – ST fund, G sec funds, SSIF - IP & All season bond fund.
Company Name % Holding
7.88% GS 2030 49.50
8.24% Govt Stock 2033 25.09
8.32% Govt Stock 2032 24.40
Cblo 0.51
Rural Electrification Corporation Limited 0.03
Fund size 6,142
Benchmark Crisil Composite Fund
Expense Ratio 1.64
Inception Date 03-12-2008
Fund Manager Suyash Chowdhary
Exit Load 0.5% for 3M
YTM 7.76
Mod Duration 8.80
Avg Maturity 15.90
Source: ACE MF, Morningstar Direct. Data is as of 30th Sept 2015 wherever not mentioned.
100.0
0 50 100 150
AAA & Equivalent
0
2
4
6
8
10
Sep
-10
Mar
-11
Sep
-11
Mar
-12
Sep
-12
Mar
-13
Sep
-13
Mar
-14
Sep
-14
Mar
-15
Sep
-15
49.5 49.5
0
10
20
30
40
50
60
10-15 Yr 15-20 Yr
0 20 40 60 80
100 120 140 160 180
Scheme category
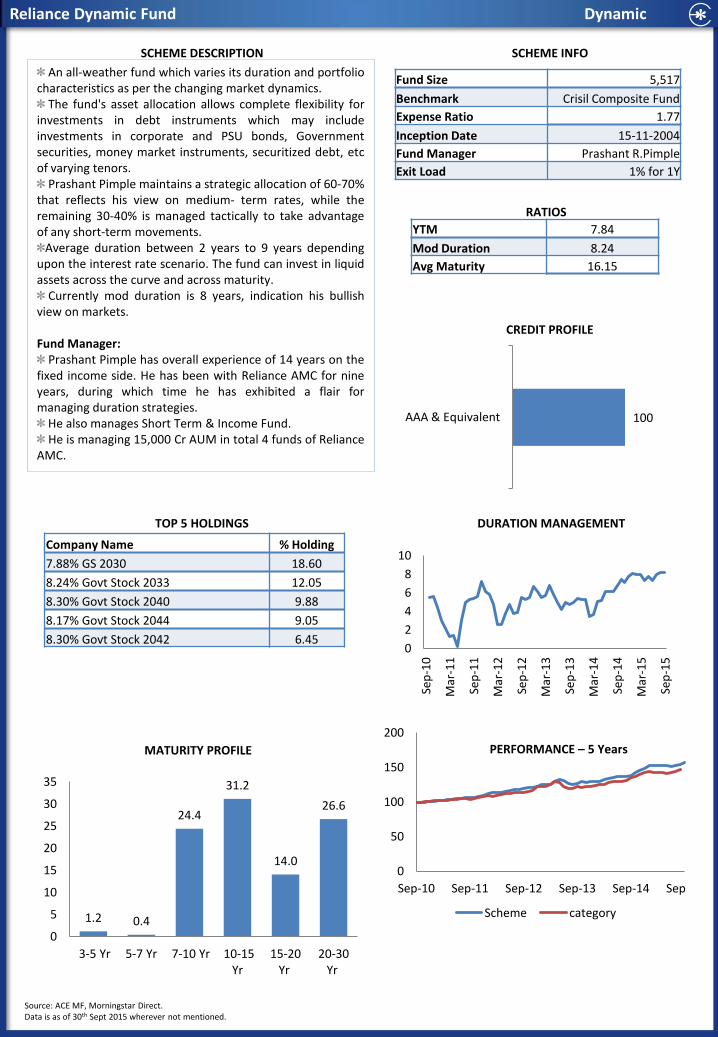
Reliance Dynamic Fund Dynamic
An all-weather fund which varies its duration and portfolio characteristics as per the changing market dynamics.
The fund's asset allocation allows complete flexibility for investments in debt instruments which may include investments in corporate and PSU bonds, Government securities, money market instruments, securitized debt, etc of varying tenors.
Prashant Pimple maintains a strategic allocation of 60-70% that reflects his view on medium- term rates, while the remaining 30-40% is managed tactically to take advantage of any short-term movements.
Average duration between 2 years to 9 years depending upon the interest rate scenario. The fund can invest in liquid assets across the curve and across maturity.
Currently mod duration is 8 years, indication his bullish view on markets. Fund Manager:
Prashant Pimple has overall experience of 14 years on the fixed income side. He has been with Reliance AMC for nine years, during which time he has exhibited a flair for managing duration strategies.
He also manages Short Term & Income Fund. He is managing 15,000 Cr AUM in total 4 funds of Reliance
AMC.
SCHEME INFO
RATIOS
TOP 5 HOLDINGS
SCHEME DESCRIPTION
CREDIT PROFILE
DURATION MANAGEMENT
PERFORMANCE – 5 Years MATURITY PROFILE
Company Name % Holding
7.88% GS 2030 18.60
8.24% Govt Stock 2033 12.05
8.30% Govt Stock 2040 9.88
8.17% Govt Stock 2044 9.05
8.30% Govt Stock 2042 6.45
Fund Size 5,517
Benchmark Crisil Composite Fund
Expense Ratio 1.77
Inception Date 15-11-2004
Fund Manager Prashant R.Pimple
Exit Load 1% for 1Y
YTM 7.84
Mod Duration 8.24
Avg Maturity 16.15
100 AAA & Equivalent
Source: ACE MF, Morningstar Direct. Data is as of 30th Sept 2015 wherever not mentioned.
0
2
4
6
8
10
Sep
-10
Mar
-11
Sep
-11
Mar
-12
Sep
-12
Mar
-13
Sep
-13
Mar
-14
Sep
-14
Mar
-15
Sep
-15
1.2 0.4
24.4
31.2
14.0
26.6
0
5
10
15
20
25
30
35
3-5 Yr 5-7 Yr 7-10 Yr 10-15 Yr
15-20 Yr
20-30 Yr
0
50
100
150
200
Sep-10 Sep-11 Sep-12 Sep-13 Sep-14 Sep-15
Scheme category
INCOME FUNDS • IDFC G sec – Invest Plan
• Reliance Gilt Securities Fund
• ICICI Pru Long Term Gilt Fund
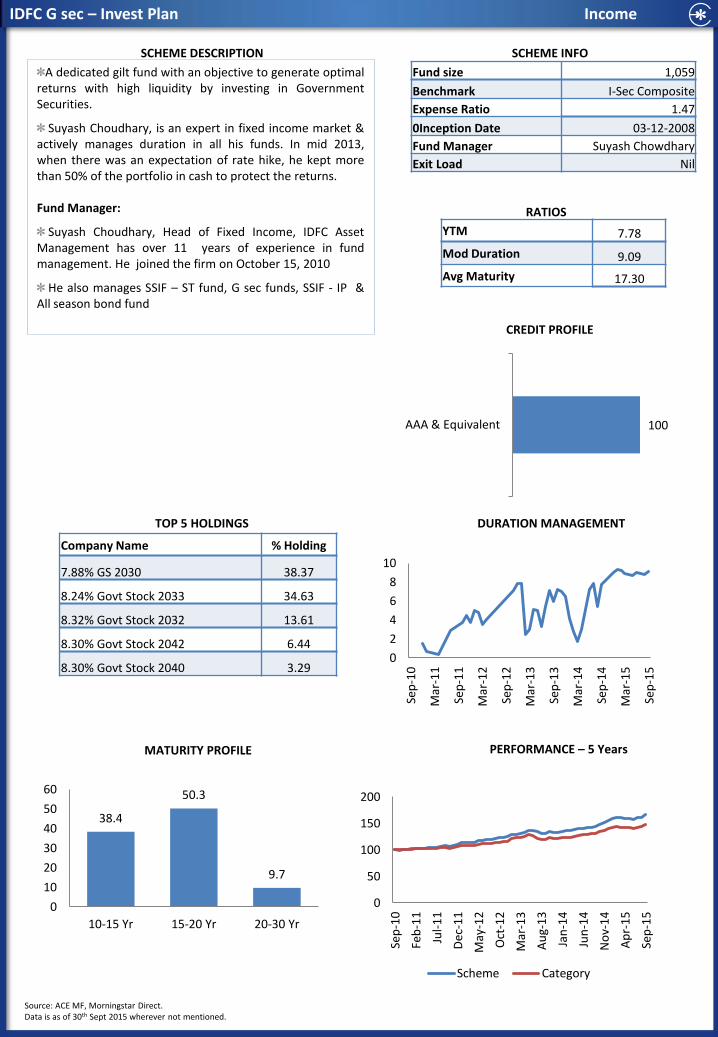
IDFC G sec – Invest Plan Income
SCHEME INFO
RATIOS
TOP 5 HOLDINGS
SCHEME DESCRIPTION
CREDIT PROFILE
DURATION MANAGEMENT
PERFORMANCE – 5 Years MATURITY PROFILE
A dedicated gilt fund with an objective to generate optimal returns with high liquidity by investing in Government Securities.
Suyash Choudhary, is an expert in fixed income market & actively manages duration in all his funds. In mid 2013, when there was an expectation of rate hike, he kept more than 50% of the portfolio in cash to protect the returns.
Fund Manager:
Suyash Choudhary, Head of Fixed Income, IDFC Asset Management has over 11 years of experience in fund management. He joined the firm on October 15, 2010
He also manages SSIF – ST fund, G sec funds, SSIF - IP & All season bond fund
Company Name % Holding
7.88% GS 2030 38.37
8.24% Govt Stock 2033 34.63
8.32% Govt Stock 2032 13.61
8.30% Govt Stock 2042 6.44
8.30% Govt Stock 2040 3.29
Fund size 1,059
Benchmark I-Sec Composite
Expense Ratio 1.47
0Inception Date 03-12-2008
Fund Manager Suyash Chowdhary
Exit Load Nil
YTM 7.78
Mod Duration 9.09
Avg Maturity 17.30
100 AAA & Equivalent
Source: ACE MF, Morningstar Direct. Data is as of 30th Sept 2015 wherever not mentioned.
0
2
4
6
8
10
Sep
-10
Mar
-11
Sep
-11
Mar
-12
Sep
-12
Mar
-13
Sep
-13
Mar
-14
Sep
-14
Mar
-15
Sep
-15
38.4
50.3
9.7
0
10
20
30
40
50
60
10-15 Yr 15-20 Yr 20-30 Yr
0
50
100
150
200
Sep
-10
Feb
-11
Jul-
11
Dec
-11
May
-12
Oct
-12
Mar
-13
Au
g-1
3
Jan
-14
Jun
-14
No
v-1
4
Ap
r-1
5
Sep
-15
Scheme Category
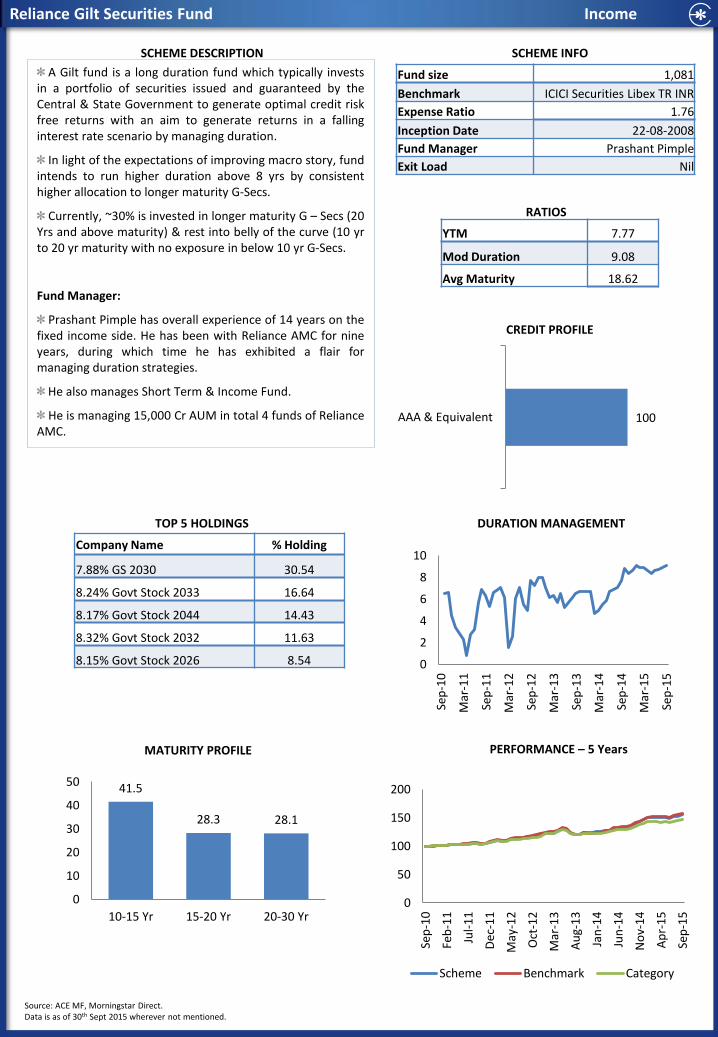
Reliance Gilt Securities Fund Income
SCHEME INFO
RATIOS
TOP 5 HOLDINGS
SCHEME DESCRIPTION
CREDIT PROFILE
DURATION MANAGEMENT
PERFORMANCE – 5 Years MATURITY PROFILE
A Gilt fund is a long duration fund which typically invests in a portfolio of securities issued and guaranteed by the Central & State Government to generate optimal credit risk free returns with an aim to generate returns in a falling interest rate scenario by managing duration.
In light of the expectations of improving macro story, fund intends to run higher duration above 8 yrs by consistent higher allocation to longer maturity G-Secs.
Currently, ~30% is invested in longer maturity G – Secs (20 Yrs and above maturity) & rest into belly of the curve (10 yr to 20 yr maturity with no exposure in below 10 yr G-Secs.
Fund Manager:
Prashant Pimple has overall experience of 14 years on the fixed income side. He has been with Reliance AMC for nine years, during which time he has exhibited a flair for managing duration strategies.
He also manages Short Term & Income Fund.
He is managing 15,000 Cr AUM in total 4 funds of Reliance AMC.
Company Name % Holding
7.88% GS 2030 30.54
8.24% Govt Stock 2033 16.64
8.17% Govt Stock 2044 14.43
8.32% Govt Stock 2032 11.63
8.15% Govt Stock 2026 8.54
Fund size 1,081
Benchmark ICICI Securities Libex TR INR
Expense Ratio 1.76
Inception Date 22-08-2008
Fund Manager Prashant Pimple
Exit Load Nil
YTM 7.77
Mod Duration 9.08
Avg Maturity 18.62
100 AAA & Equivalent
Source: ACE MF, Morningstar Direct. Data is as of 30th Sept 2015 wherever not mentioned.
0
2
4
6
8
10
Sep
-10
Mar
-11
Sep
-11
Mar
-12
Sep
-12
Mar
-13
Sep
-13
Mar
-14
Sep
-14
Mar
-15
Sep
-15
41.5
28.3 28.1
0
10
20
30
40
50
10-15 Yr 15-20 Yr 20-30 Yr 0
50
100
150
200
Sep
-10
Feb
-11
Jul-
11
Dec
-11
May
-12
Oct
-12
Mar
-13
Au
g-1
3
Jan
-14
Jun
-14
No
v-1
4
Ap
r-1
5
Sep
-15
Scheme Benchmark Category
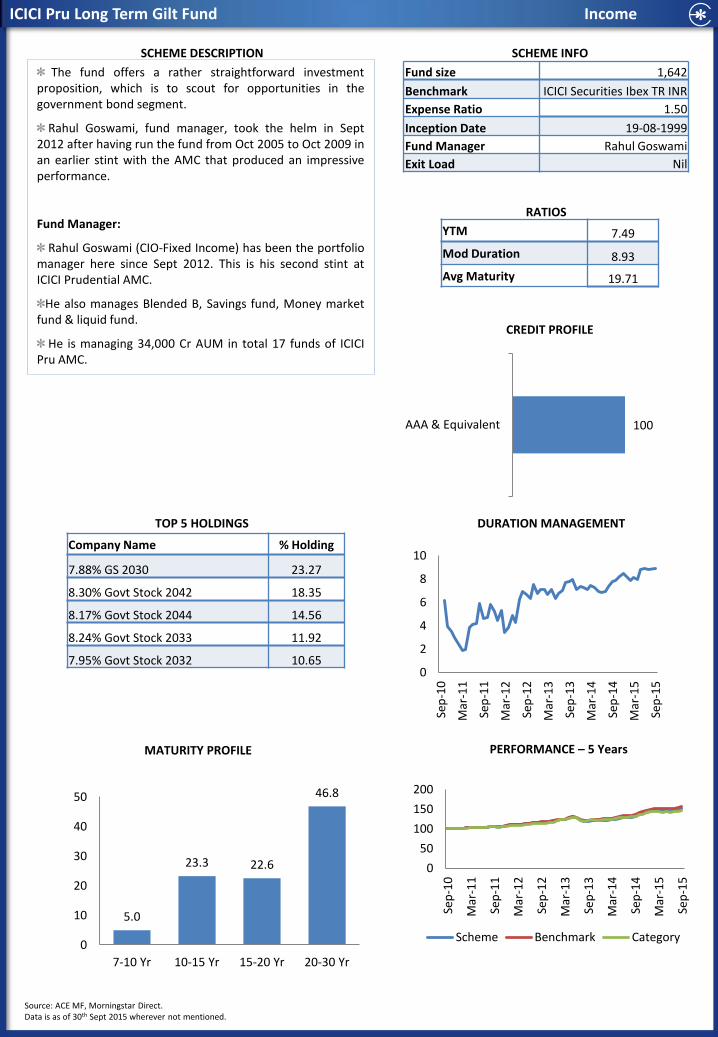
ICICI Pru Long Term Gilt Fund Income
SCHEME INFO
RATIOS
TOP 5 HOLDINGS
SCHEME DESCRIPTION
CREDIT PROFILE
DURATION MANAGEMENT
PERFORMANCE – 5 Years MATURITY PROFILE
The fund offers a rather straightforward investment proposition, which is to scout for opportunities in the government bond segment.
Rahul Goswami, fund manager, took the helm in Sept 2012 after having run the fund from Oct 2005 to Oct 2009 in an earlier stint with the AMC that produced an impressive performance.
Fund Manager:
Rahul Goswami (CIO-Fixed Income) has been the portfolio manager here since Sept 2012. This is his second stint at ICICI Prudential AMC.
He also manages Blended B, Savings fund, Money market fund & liquid fund.
He is managing 34,000 Cr AUM in total 17 funds of ICICI Pru AMC.
Company Name % Holding
7.88% GS 2030 23.27
8.30% Govt Stock 2042 18.35
8.17% Govt Stock 2044 14.56
8.24% Govt Stock 2033 11.92
7.95% Govt Stock 2032 10.65
Fund size 1,642
Benchmark ICICI Securities Ibex TR INR
Expense Ratio 1.50
Inception Date 19-08-1999
Fund Manager Rahul Goswami
Exit Load Nil
YTM 7.49
Mod Duration 8.93
Avg Maturity 19.71
100 AAA & Equivalent
Source: ACE MF, Morningstar Direct. Data is as of 30th Sept 2015 wherever not mentioned.
0
2
4
6
8
10
Sep
-10
Mar
-11
Sep
-11
Mar
-12
Sep
-12
Mar
-13
Sep
-13
Mar
-14
Sep
-14
Mar
-15
Sep
-15
5.0
23.3 22.6
46.8
0
10
20
30
40
50
7-10 Yr 10-15 Yr 15-20 Yr 20-30 Yr
0
50
100
150
200
Sep
-10
Mar
-11
Sep
-11
Mar
-12
Sep
-12
Mar
-13
Sep
-13
Mar
-14
Sep
-14
Mar
-15
Sep
-15
Scheme Benchmark Category
LIQUID FUNDS • Reliance Liquidity Fund
• DWS Cash Opportunities Fund
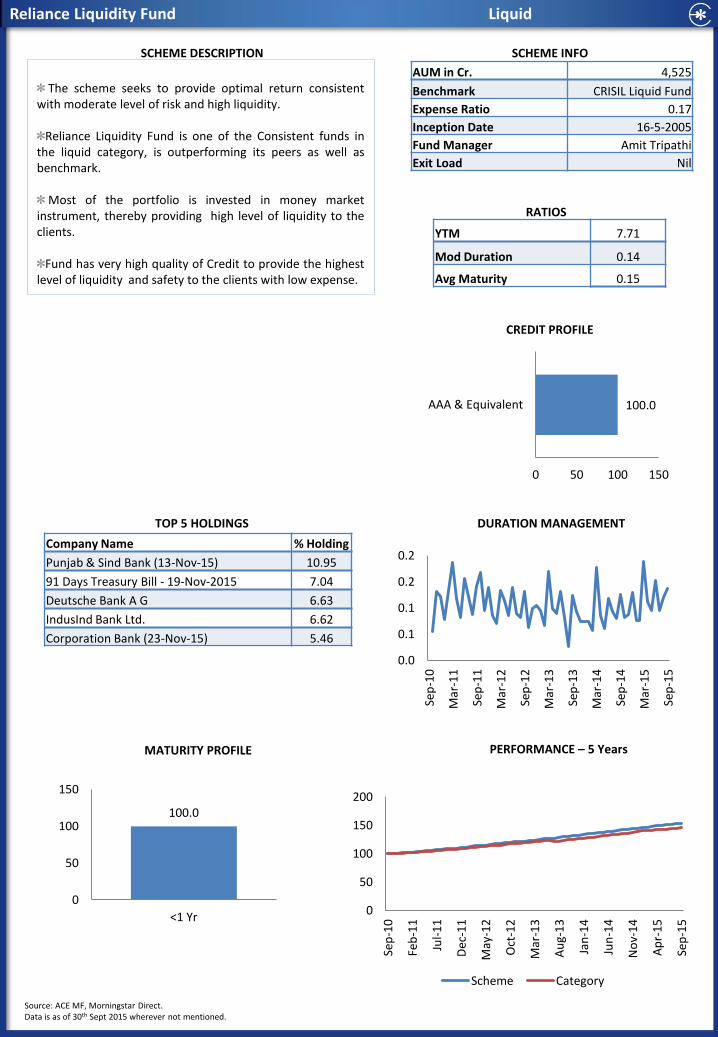
Reliance Liquidity Fund Liquid
SCHEME INFO
RATIOS
TOP 5 HOLDINGS
SCHEME DESCRIPTION
CREDIT PROFILE
DURATION MANAGEMENT
PERFORMANCE – 5 Years MATURITY PROFILE
The scheme seeks to provide optimal return consistent
with moderate level of risk and high liquidity.
Reliance Liquidity Fund is one of the Consistent funds in the liquid category, is outperforming its peers as well as benchmark.
Most of the portfolio is invested in money market instrument, thereby providing high level of liquidity to the clients.
Fund has very high quality of Credit to provide the highest
level of liquidity and safety to the clients with low expense.
Company Name % Holding
Punjab & Sind Bank (13-Nov-15) 10.95
91 Days Treasury Bill - 19-Nov-2015 7.04
Deutsche Bank A G 6.63
IndusInd Bank Ltd. 6.62
Corporation Bank (23-Nov-15) 5.46
AUM in Cr. 4,525
Benchmark CRISIL Liquid Fund
Expense Ratio 0.17
Inception Date 16-5-2005
Fund Manager Amit Tripathi
Exit Load Nil
YTM 7.71
Mod Duration 0.14
Avg Maturity 0.15
Source: ACE MF, Morningstar Direct. Data is as of 30th Sept 2015 wherever not mentioned.
100.0
0 50 100 150
AAA & Equivalent
0.0
0.1
0.1
0.2
0.2
Sep
-10
Mar
-11
Sep
-11
Mar
-12
Sep
-12
Mar
-13
Sep
-13
Mar
-14
Sep
-14
Mar
-15
Sep
-15
100.0
0
50
100
150
<1 Yr 0
50
100
150
200
Sep
-10
Feb
-11
Jul-
11
Dec
-11
May
-12
Oct
-12
Mar
-13
Au
g-1
3
Jan
-14
Jun
-14
No
v-1
4
Ap
r-1
5
Sep
-15
Scheme Category
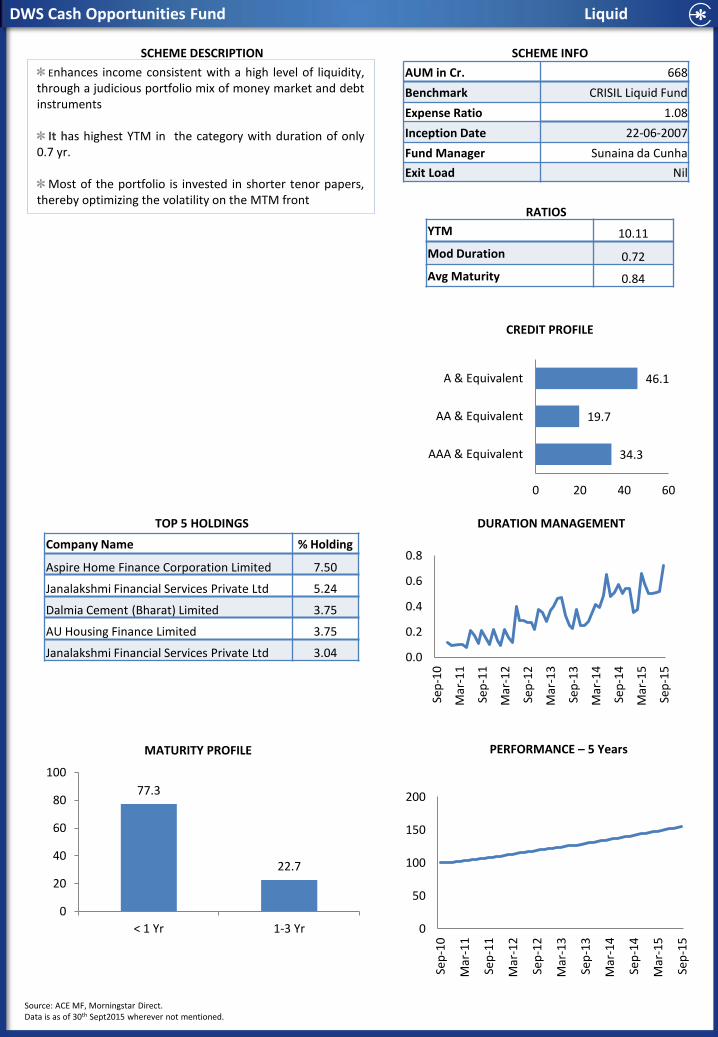
DWS Cash Opportunities Fund Liquid
Enhances income consistent with a high level of liquidity, through a judicious portfolio mix of money market and debt instruments
It has highest YTM in the category with duration of only
0.7 yr. Most of the portfolio is invested in shorter tenor papers,
thereby optimizing the volatility on the MTM front
SCHEME INFO
RATIOS
TOP 5 HOLDINGS
SCHEME DESCRIPTION
CREDIT PROFILE
DURATION MANAGEMENT
PERFORMANCE – 5 Years MATURITY PROFILE
Company Name % Holding
Aspire Home Finance Corporation Limited 7.50
Janalakshmi Financial Services Private Ltd 5.24
Dalmia Cement (Bharat) Limited 3.75
AU Housing Finance Limited 3.75
Janalakshmi Financial Services Private Ltd 3.04
AUM in Cr. 668
Benchmark CRISIL Liquid Fund
Expense Ratio 1.08
Inception Date 22-06-2007
Fund Manager Sunaina da Cunha
Exit Load Nil
YTM 10.11
Mod Duration 0.72
Avg Maturity 0.84
77.3
22.7
0
20
40
60
80
100
< 1 Yr 1-3 Yr
Source: ACE MF, Morningstar Direct. Data is as of 30th Sept2015 wherever not mentioned.
34.3
19.7
46.1
0 20 40 60
AAA & Equivalent
AA & Equivalent
A & Equivalent
0.0
0.2
0.4
0.6
0.8
Sep
-10
Mar
-11
Sep
-11
Mar
-12
Sep
-12
Mar
-13
Sep
-13
Mar
-14
Sep
-14
Mar
-15
Sep
-15
0
50
100
150
200
Sep
-10
Mar
-11
Sep
-11
Mar
-12
Sep
-12
Mar
-13
Sep
-13
Mar
-14
Sep
-14
Mar
-15
Sep
-15
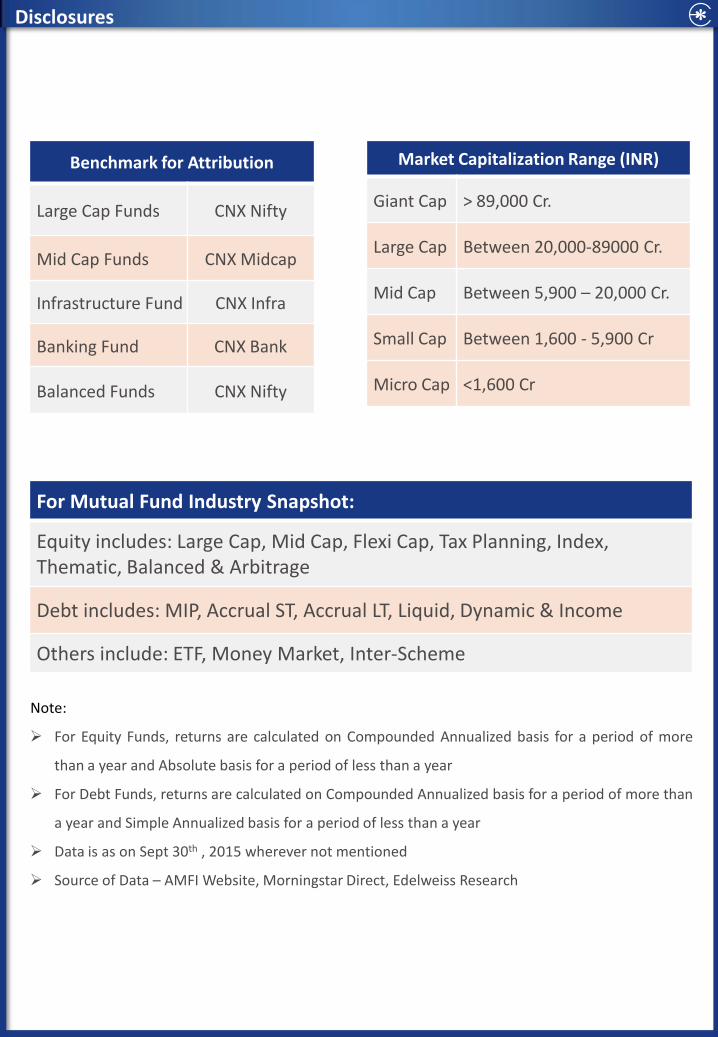
Disclosures
Benchmark for Attribution
Large Cap Funds CNX Nifty
Mid Cap Funds CNX Midcap
Infrastructure Fund CNX Infra
Banking Fund CNX Bank
Balanced Funds CNX Nifty
Market Capitalization Range (INR)
Giant Cap > 89,000 Cr.
Large Cap Between 20,000-89000 Cr.
Mid Cap Between 5,900 – 20,000 Cr.
Small Cap Between 1,600 - 5,900 Cr
Micro Cap <1,600 Cr
For Mutual Fund Industry Snapshot:
Equity includes: Large Cap, Mid Cap, Flexi Cap, Tax Planning, Index, Thematic, Balanced & Arbitrage
Debt includes: MIP, Accrual ST, Accrual LT, Liquid, Dynamic & Income
Others include: ETF, Money Market, Inter-Scheme
Note:
For Equity Funds, returns are calculated on Compounded Annualized basis for a period of more
than a year and Absolute basis for a period of less than a year
For Debt Funds, returns are calculated on Compounded Annualized basis for a period of more than
a year and Simple Annualized basis for a period of less than a year
Data is as on Sept 30th , 2015 wherever not mentioned
Source of Data – AMFI Website, Morningstar Direct, Edelweiss Research
This document has been prepared by Edelweiss Securities Ltd. (Edelweiss) and is strictly confidential and is intended for the use by recipient only and may not be circulated, redistributed, retransmitted or disclosed, in whole or in part, or in any form or manner, without the express written consent of Edelweiss. Receipt and review of this document constitutes your agreement not to circulate, redistribute, retransmit or disclose to others the contents, opinions, conclusion, or information contained herein. This document does not constitute an offer or solicitation for the purchase or sale of any financial instrument or as an official confirmation of any transaction. In the preparation of the material contained in this document, Edelweiss has used information that is publicly available, including information developed in-house, Information gathered & material used in this document is believed to be from reliable sources and is given in good faith. Edelweiss however does not warrant the accuracy, reasonableness and/or completeness of any information. For data reference to any third party in this material no such party will assume any liability for the same. Edelweiss and/or any affiliate of Edelweiss does not in any way through this material solicit any offer for purchase, sale of any financial transaction/products of any financial instrument dealt in this material. All recipients of this material should before dealing and/or transacting in any of the products referred to in this material make their own investigation, seek appropriate professional advice. The investments discussed in this material may not be suitable for all investors. Any person subscribing to or investigating in any product/financial instruments should do so on the basis of and after verifying the terms attached to such product/financial instrument. Edelweiss (including its affiliates) and any of its officers, directors, personnel and employees, shall not be liable for any loss, damage of any nature, including but not limited to direct, indirect, punitive, special, exemplary, and consequential, as also any loss of profit in any way arising from the use of this material in any manner. The recipient alone shall be fully responsible/are liable for any decision taken on the basis of this material. Edelweiss has included statements/opinions/recommendations in this document which contain words or phrases such as “will”, “expect”, “should” and similar expressions or variations of such expressions, that are “forward looking statements”. Financial products and instruments are subject to market risks and yields may fluctuate depending on various factors affecting capital/debt markets. Please note that past performance of financial products and instruments does not necessarily indicate the future prospects and performance thereof. Actual results may differ materially from those suggested by the forward looking statements due to risks or uncertainties associated with our expectations with respect to, but not limited to, exposure to market risks, general economic and political conditions in India and other countries globally, which have an impact on our services and/or investments, the monetary and interest policies of India, inflation, deflation, unanticipated turbulence in interest rates, foreign exchange rates, equity prices or rates or prices, the performance of the financial markets in India and globally, changes in domestic and foreign laws, regulations and taxes and changes in competition in the industry. By their nature, certain market risk disclosures are only estimates and could be materially different from what actually occurs in the future. As a result, actual future gains or losses could materially differ from those that have been estimated. Edelweiss (including its affiliates) or its officers, directors, personnel and employees, including persons involved in the preparation or issuance of this material may; (a) from time to time, have positions in, and buy or sell or (b) be engaged in any other transaction and earn brokerage or other compensation in the financial instruments/products discussed herein or act as advisor or lender/borrower in respect of such securities/financial instruments/products or have other potential conflict of interest with respect to any recommendation and related information and opinions. The said persons may have acted upon and/or in a manner contradictory with the information contained here. This document is intended to be used only by resident Indians, non-resident Indians, persons of Indian origin, subject to the applicable laws and regulations of any Indian or foreign regulatory authority. This document should not be regarded as solicitation of business in any jurisdiction including India. Mutual Fund investments are subject to market risk please read the offer document of the respective schemes carefully before investing. The information provided in these reports remains, unless otherwise stated, the copyright of Edelweiss. All layout, design, original artwork, concepts and other Intellectual Properties, remains the property and copyright of Edelweiss and may not be used in any form or for any purpose whatsoever by any party without the express written permission of the copyright holders. Additional Disclaimer for U.S. Persons This document is a product of Edelweiss Securities Limited (Edelweiss). Edelweiss and its subsidiaries / associate companies is/are resident outside the United States (U.S.) and are not associated persons of any U.S. regulated broker-dealer and therefore Edelweiss and its associates is/are not subject to supervision by a U.S. broker-dealer, and is/are not required to satisfy the regulatory licensing requirements of FINRA or required to otherwise comply with U.S. rules or regulations regarding, among other things, communications with a subject company, public appearances and trading securities held by Edelweiss. This document is intended for distribution by Edelweiss Securities Limited only to "Major Institutional Investors" as defined by Rule 15a-6(b)(4) of the U.S. Securities and Exchange Act, 1934 (the Exchange Act) and interpretations thereof by U.S. Securities and Exchange Commission (SEC) in reliance on Rule 15a 6(a)(2). If the recipient of this document is not a Major Institutional Investor as specified above, then it should not act upon this document and return the same to the sender. Further, this document may not be copied, duplicated and/or transmitted onward to any U.S. person, which is not the Major Institutional Investor. In reliance on the exemption from registration provided by Rule 15a-6 of the Exchange Act and interpretations thereof by the SEC in order to conduct certain business with Major Institutional Investors, Edelweiss Securities Limited has entered into an agreement with a U.S. registered broker-dealer, Marco Polo Securities Inc. ("Marco Polo"). Transactions in securities discussed in this research report should be effected through Marco Polo or another U.S. registered broker dealer. Mutual Fund investments are subject to market risk please read the offer document of the respective schemes carefully before investing.
Alok Saigal [email protected]
+91 22 4088 5917
Pradyuman Singh [email protected]
+91 22 4342 8286
Investment Advisory Group
Safe Harbor