edb historian user guide (edb220-70)
TRANSCRIPT

eDB Historian User Guide
Section 1. Introduction1.1 Section Overview. . . . . . . . . . . . . . . . . . . . . . . . . . . . . . . . . . . . . . . . . . . . . . . . . . . . 1-11.2 eDB Architecture . . . . . . . . . . . . . . . . . . . . . . . . . . . . . . . . . . . . . . . . . . . . . . . . . . . . 1-1
1.2.1 Distributed Data Collection . . . . . . . . . . . . . . . . . . . . . . . . . . . . . . . . . . . . . 1-11.2.2 Relational Database Platform . . . . . . . . . . . . . . . . . . . . . . . . . . . . . . . . . . . 1-21.2.3 Fault Tolerance . . . . . . . . . . . . . . . . . . . . . . . . . . . . . . . . . . . . . . . . . . . . . . 1-21.2.4 Tape Backup/Restoration . . . . . . . . . . . . . . . . . . . . . . . . . . . . . . . . . . . . . . 1-2
1.3 eDB Reporting . . . . . . . . . . . . . . . . . . . . . . . . . . . . . . . . . . . . . . . . . . . . . . . . . . . . . . 1-21.4 Applications for the eDB Historian . . . . . . . . . . . . . . . . . . . . . . . . . . . . . . . . . . . . . . . 1-2
1.4.1 eDB as a Local DCS Historian. . . . . . . . . . . . . . . . . . . . . . . . . . . . . . . . . . . 1-21.4.2 eDB as a Site or Enterprise Data Integrator . . . . . . . . . . . . . . . . . . . . . . . . 1-2
1.5 List of Terms . . . . . . . . . . . . . . . . . . . . . . . . . . . . . . . . . . . . . . . . . . . . . . . . . . . . . . . 1-41.6 Key Elements of the eDB. . . . . . . . . . . . . . . . . . . . . . . . . . . . . . . . . . . . . . . . . . . . . . 1-51.7 Background Information. . . . . . . . . . . . . . . . . . . . . . . . . . . . . . . . . . . . . . . . . . . . . . . 1-51.8 Contents of this Document . . . . . . . . . . . . . . . . . . . . . . . . . . . . . . . . . . . . . . . . . . . . 1-61.9 Additional Reference Documents . . . . . . . . . . . . . . . . . . . . . . . . . . . . . . . . . . . . . . . 1-6
Section 2. Configuring eDB Historian Points in aWindows based Ovation System2.1 Section Overview. . . . . . . . . . . . . . . . . . . . . . . . . . . . . . . . . . . . . . . . . . . . . . . . . . . . 2-12.2 Creating a Point . . . . . . . . . . . . . . . . . . . . . . . . . . . . . . . . . . . . . . . . . . . . . . . . . . . . . 2-12.3 Deadband (DB) Algorithm Description. . . . . . . . . . . . . . . . . . . . . . . . . . . . . . . . . . . 2-14
2.3.1 Rules . . . . . . . . . . . . . . . . . . . . . . . . . . . . . . . . . . . . . . . . . . . . . . . . . . . . . 2-152.4 Import History Configuration . . . . . . . . . . . . . . . . . . . . . . . . . . . . . . . . . . . . . . . . . . 2-16
2.4.1 Pic_file_gen Utility . . . . . . . . . . . . . . . . . . . . . . . . . . . . . . . . . . . . . . . . . . . 2-21
Section 3. Collection3.1 Section Overview. . . . . . . . . . . . . . . . . . . . . . . . . . . . . . . . . . . . . . . . . . . . . . . . . . . . 3-13.2 Collection. . . . . . . . . . . . . . . . . . . . . . . . . . . . . . . . . . . . . . . . . . . . . . . . . . . . . . . . . . 3-1
3.2.1 Distributed Data Collection . . . . . . . . . . . . . . . . . . . . . . . . . . . . . . . . . . . . . 3-13.3 Scanner Functionality . . . . . . . . . . . . . . . . . . . . . . . . . . . . . . . . . . . . . . . . . . . . . . . . 3-1
3.3.1 Point Value Scanning . . . . . . . . . . . . . . . . . . . . . . . . . . . . . . . . . . . . . . . . . 3-23.3.2 Point Attribute Scanning . . . . . . . . . . . . . . . . . . . . . . . . . . . . . . . . . . . . . . . 3-3
3.4 Common Scanner Features. . . . . . . . . . . . . . . . . . . . . . . . . . . . . . . . . . . . . . . . . . . . 3-43.5 Monitoring WDPF, Ovation, and Other Systems . . . . . . . . . . . . . . . . . . . . . . . . . . . . 3-4
3.5.1 WDPF Systems . . . . . . . . . . . . . . . . . . . . . . . . . . . . . . . . . . . . . . . . . . . . . . 3-43.5.2 Ovation Systems . . . . . . . . . . . . . . . . . . . . . . . . . . . . . . . . . . . . . . . . . . . . . 3-43.5.3 OPC Systems . . . . . . . . . . . . . . . . . . . . . . . . . . . . . . . . . . . . . . . . . . . . . . . 3-5
3.6 Configuring the Operator Event Log in a Windows Based Ovation System . . . . . . . 3-63.7 Configuring an Alarm Event in a Windows Based Ovation System. . . . . . . . . . . . . . 3-9
3.7.1 Overview . . . . . . . . . . . . . . . . . . . . . . . . . . . . . . . . . . . . . . . . . . . . . . . . . . . 3-93.8 Configuring a Historical Collection of SOEs in a Windows Based Ovation System 3-14
3.8.1 Controller configuration parameters for the SOE Logger . . . . . . . . . . . . . 3-143.8.2 Configuration of SOE Points and Hardware in an Ovation System. . . . . . 3-17
1eDB220-70
Emerson Process Management Proprietary Class 2C
Table of Contents, Cont’d
Section 4. Common User Interface Features for Data Retrieval4.1 Section Overview. . . . . . . . . . . . . . . . . . . . . . . . . . . . . . . . . . . . . . . . . . . . . . . . . . . . 4-14.2 Common User Interfaces. . . . . . . . . . . . . . . . . . . . . . . . . . . . . . . . . . . . . . . . . . . . . . 4-1
4.2.1 Browse and Select Point(s) Window . . . . . . . . . . . . . . . . . . . . . . . . . . . . . . 4-14.2.2 Absolute or Relative Date/Time . . . . . . . . . . . . . . . . . . . . . . . . . . . . . . . . . . 4-4
Section 5. Historical Trends in an Ovation System5.1 Section Overview. . . . . . . . . . . . . . . . . . . . . . . . . . . . . . . . . . . . . . . . . . . . . . . . . . . . 5-15.2 Accessing the Trend Display Window . . . . . . . . . . . . . . . . . . . . . . . . . . . . . . . . . . . . 5-2
5.2.1 Saving Trends . . . . . . . . . . . . . . . . . . . . . . . . . . . . . . . . . . . . . . . . . . . . . . . 5-45.3 Stand Alone Trends. . . . . . . . . . . . . . . . . . . . . . . . . . . . . . . . . . . . . . . . . . . . . . . . . . 5-45.4 Point Groups . . . . . . . . . . . . . . . . . . . . . . . . . . . . . . . . . . . . . . . . . . . . . . . . . . . . . . . 5-5
5.4.1 Adding a Trend Point Group . . . . . . . . . . . . . . . . . . . . . . . . . . . . . . . . . . . . 5-65.4.2 Adding a Point to a Point Group . . . . . . . . . . . . . . . . . . . . . . . . . . . . . . . . . 5-95.4.3 Modifying a Point Trend Group . . . . . . . . . . . . . . . . . . . . . . . . . . . . . . . . . 5-14
Section 6. Historical Review6.1 Section Overview. . . . . . . . . . . . . . . . . . . . . . . . . . . . . . . . . . . . . . . . . . . . . . . . . . . . 6-16.2 Configuring and Accessing the Historical Review . . . . . . . . . . . . . . . . . . . . . . . . . . . 6-1
6.2.1 Configuring the Historical Review Application for the eDB Desktop Suite. . 6-16.2.2 Accessing the Historical Review Application on a Stand Alone eDB System 6-26.2.3 Accessing the Historical Review from a Windows based Ovation System 6-26.2.4 Configuring the Historical Review from a Windows based Ovation System 6-26.2.5 The Historical Review Window Components. . . . . . . . . . . . . . . . . . . . . . . . 6-26.2.6 Menu Bar . . . . . . . . . . . . . . . . . . . . . . . . . . . . . . . . . . . . . . . . . . . . . . . . . . . 6-36.2.7 Toolbar. . . . . . . . . . . . . . . . . . . . . . . . . . . . . . . . . . . . . . . . . . . . . . . . . . . . . 6-56.2.8 Selection Criteria . . . . . . . . . . . . . . . . . . . . . . . . . . . . . . . . . . . . . . . . . . . . . 6-66.2.9 Column Headings . . . . . . . . . . . . . . . . . . . . . . . . . . . . . . . . . . . . . . . . . . . . 6-66.2.10 Results Display . . . . . . . . . . . . . . . . . . . . . . . . . . . . . . . . . . . . . . . . . . . . . . 6-66.2.11 Status Bar . . . . . . . . . . . . . . . . . . . . . . . . . . . . . . . . . . . . . . . . . . . . . . . . . . 6-6
6.3 Setting Preferences . . . . . . . . . . . . . . . . . . . . . . . . . . . . . . . . . . . . . . . . . . . . . . . . . . 6-66.4 Historical Point Review . . . . . . . . . . . . . . . . . . . . . . . . . . . . . . . . . . . . . . . . . . . . . . . 6-8
6.4.1 Accessing the Point Review Window. . . . . . . . . . . . . . . . . . . . . . . . . . . . . . 6-86.4.2 Filter by Specific Points . . . . . . . . . . . . . . . . . . . . . . . . . . . . . . . . . . . . . . . . 6-96.4.3 Review Type Definitions . . . . . . . . . . . . . . . . . . . . . . . . . . . . . . . . . . . . . . 6-116.4.4 Filtering by Point Characteristics . . . . . . . . . . . . . . . . . . . . . . . . . . . . . . . . 6-136.4.5 Filtering by Point Groups . . . . . . . . . . . . . . . . . . . . . . . . . . . . . . . . . . . . . . 6-15
6.5 Historical Alarm Review. . . . . . . . . . . . . . . . . . . . . . . . . . . . . . . . . . . . . . . . . . . . . . 6-166.5.1 Accessing the Historical Alarm Message Review Window . . . . . . . . . . . . 6-166.5.2 Accessing the Historical Filter Options Window . . . . . . . . . . . . . . . . . . . . 6-176.5.3 Selecting a Review of All Points . . . . . . . . . . . . . . . . . . . . . . . . . . . . . . . . 6-186.5.4 Selecting a Review of a Single Point . . . . . . . . . . . . . . . . . . . . . . . . . . . . . 6-196.5.5 Selecting a Review of Specific Alarm Types . . . . . . . . . . . . . . . . . . . . . . . 6-206.5.6 Selecting a Review of Specific Point Types. . . . . . . . . . . . . . . . . . . . . . . . 6-21
6.6 Operator Event Historical Review . . . . . . . . . . . . . . . . . . . . . . . . . . . . . . . . . . . . . . 6-236.6.1 Selecting All Operator Event Message Subtypes for Review . . . . . . . . . . 6-246.6.2 Selecting Specific Groups of Operator Event Messages for Review. . . . . 6-256.6.3 Selecting Specific Event Message Subtypes for Review. . . . . . . . . . . . . . 6-266.6.4 Selecting a Single Point for Review. . . . . . . . . . . . . . . . . . . . . . . . . . . . . . 6-27
2 eDB220-70
Emerson Process Management Proprietary Class 2C

Table of Contents, Cont’d
6.7 SOE Historical Review. . . . . . . . . . . . . . . . . . . . . . . . . . . . . . . . . . . . . . . . . . . . . . . 6-286.7.1 Accessing the SOE Review Window . . . . . . . . . . . . . . . . . . . . . . . . . . . . . 6-286.7.2 Selecting All SOE Messages for Review . . . . . . . . . . . . . . . . . . . . . . . . . . 6-296.7.3 Selecting Single Point Based SOE Messages for Review. . . . . . . . . . . . . 6-306.7.4 Selecting Single Drop Based SOE Messages for Review . . . . . . . . . . . . . 6-31
6.8 Ascii Review . . . . . . . . . . . . . . . . . . . . . . . . . . . . . . . . . . . . . . . . . . . . . . . . . . . . . . 6-326.8.1 Accessing the Historical Ascii Review Window . . . . . . . . . . . . . . . . . . . . . 6-326.8.2 Selecting an Ascii Review of All Drops . . . . . . . . . . . . . . . . . . . . . . . . . . . 6-336.8.3 Selecting an Ascii Review of a Single Drop. . . . . . . . . . . . . . . . . . . . . . . . 6-33
6.9 Common Review . . . . . . . . . . . . . . . . . . . . . . . . . . . . . . . . . . . . . . . . . . . . . . . . . . . 6-346.10 Printing and Saving Historical Review. . . . . . . . . . . . . . . . . . . . . . . . . . . . . . . . . . . 6-39
6.10.1 Printing Historical Reviews . . . . . . . . . . . . . . . . . . . . . . . . . . . . . . . . . . . . 6-396.10.2 Print Previewing Historical Reviews . . . . . . . . . . . . . . . . . . . . . . . . . . . . . 6-396.10.3 Saving Historical Reviews as Text. . . . . . . . . . . . . . . . . . . . . . . . . . . . . . . 6-39
6.11 Column Sorting in the Review Results Window. . . . . . . . . . . . . . . . . . . . . . . . . . . . 6-39
Section 7. Reporting7.1 Section Overview. . . . . . . . . . . . . . . . . . . . . . . . . . . . . . . . . . . . . . . . . . . . . . . . . . . . 7-17.2 Generating Reports . . . . . . . . . . . . . . . . . . . . . . . . . . . . . . . . . . . . . . . . . . . . . . . . . . 7-2
7.2.1 eDB Report Manager. . . . . . . . . . . . . . . . . . . . . . . . . . . . . . . . . . . . . . . . . . 7-37.2.2 Report Manager Configuration Database . . . . . . . . . . . . . . . . . . . . . . . . . . 7-37.2.3 ExpressCalc Report Results Database . . . . . . . . . . . . . . . . . . . . . . . . . . . . 7-37.2.4 Report Layout File (.rpt). . . . . . . . . . . . . . . . . . . . . . . . . . . . . . . . . . . . . . . . 7-37.2.5 Report User Function Library (UFL) . . . . . . . . . . . . . . . . . . . . . . . . . . . . . . 7-37.2.6 Crystal Report Engine . . . . . . . . . . . . . . . . . . . . . . . . . . . . . . . . . . . . . . . . . 7-4
7.3 Building Report Layouts. . . . . . . . . . . . . . . . . . . . . . . . . . . . . . . . . . . . . . . . . . . . . . . 7-57.3.1 Direct Reports Versus ExpressCalc Reports. . . . . . . . . . . . . . . . . . . . . . . . 7-57.3.2 Standard Reports Library. . . . . . . . . . . . . . . . . . . . . . . . . . . . . . . . . . . . . . . 7-57.3.3 Crystal Reports Layout File Contents . . . . . . . . . . . . . . . . . . . . . . . . . . . . . 7-57.3.4 Crystal Report Layout File Fields. . . . . . . . . . . . . . . . . . . . . . . . . . . . . . . . . 7-77.3.5 Crystal Report Layout File Formulas . . . . . . . . . . . . . . . . . . . . . . . . . . . . . . 7-77.3.6 Modifying an Existing Report Layout File (.rpt) . . . . . . . . . . . . . . . . . . . . . . 7-77.3.7 Creating a New Report Layout . . . . . . . . . . . . . . . . . . . . . . . . . . . . . . . . . 7-10
7.4 eDB Report Manager. . . . . . . . . . . . . . . . . . . . . . . . . . . . . . . . . . . . . . . . . . . . . . . . 7-127.4.1 Overview . . . . . . . . . . . . . . . . . . . . . . . . . . . . . . . . . . . . . . . . . . . . . . . . . . 7-127.4.2 Security . . . . . . . . . . . . . . . . . . . . . . . . . . . . . . . . . . . . . . . . . . . . . . . . . . . 7-127.4.3 eDB Report Manager Procedure Overview . . . . . . . . . . . . . . . . . . . . . . . . 7-127.4.4 Using the eDB Report Manager Application . . . . . . . . . . . . . . . . . . . . . . . 7-137.4.5 Configuring the eDB Report Manager . . . . . . . . . . . . . . . . . . . . . . . . . . . . 7-137.4.6 Configuring Shift Time Intervals. . . . . . . . . . . . . . . . . . . . . . . . . . . . . . . . . 7-167.4.7 eDB Report Manager Application Window . . . . . . . . . . . . . . . . . . . . . . . . 7-177.4.8 eDB Report Manager Report Generation Queue . . . . . . . . . . . . . . . . . . . 7-217.4.9 Configuring Report Formats . . . . . . . . . . . . . . . . . . . . . . . . . . . . . . . . . . . 7-267.4.10 Configuring Report Definitions. . . . . . . . . . . . . . . . . . . . . . . . . . . . . . . . . . 7-307.4.11 Defining Report Properties . . . . . . . . . . . . . . . . . . . . . . . . . . . . . . . . . . . . 7-337.4.12 Demanding Reports. . . . . . . . . . . . . . . . . . . . . . . . . . . . . . . . . . . . . . . . . . 7-497.4.13 Configuring Events . . . . . . . . . . . . . . . . . . . . . . . . . . . . . . . . . . . . . . . . . . 7-517.4.14 Adding or Editing the Report List . . . . . . . . . . . . . . . . . . . . . . . . . . . . . . . . 7-607.4.15 Data Backup . . . . . . . . . . . . . . . . . . . . . . . . . . . . . . . . . . . . . . . . . . . . . . . 7-617.4.16 View Last Crystal Report Error . . . . . . . . . . . . . . . . . . . . . . . . . . . . . . . . . 7-627.4.17 Importing and Exporting the eDB Report Manager Database . . . . . . . . . . 7-63
3eDB220-70
Emerson Process Management Proprietary Class 2C

Table of Contents, Cont’d
7.4.18 Minimize to System Tray . . . . . . . . . . . . . . . . . . . . . . . . . . . . . . . . . . . . . . 7-637.4.19 Status Log File. . . . . . . . . . . . . . . . . . . . . . . . . . . . . . . . . . . . . . . . . . . . . . 7-64
Section 8. Lab History8.1 Section Overview. . . . . . . . . . . . . . . . . . . . . . . . . . . . . . . . . . . . . . . . . . . . . . . . . . . . 8-18.2 Lab History Data Storage . . . . . . . . . . . . . . . . . . . . . . . . . . . . . . . . . . . . . . . . . . . . . 8-18.3 Lab History Data Send Interface . . . . . . . . . . . . . . . . . . . . . . . . . . . . . . . . . . . . . . . . 8-18.4 Lab History Data Files . . . . . . . . . . . . . . . . . . . . . . . . . . . . . . . . . . . . . . . . . . . . . . . . 8-28.5 Lab History Data Retrieval. . . . . . . . . . . . . . . . . . . . . . . . . . . . . . . . . . . . . . . . . . . . . 8-4
Section 9. Table Definitions9.1 Point Data Configuration . . . . . . . . . . . . . . . . . . . . . . . . . . . . . . . . . . . . . . . . . . . . . . 9-1
9.1.1 Historical Data Table . . . . . . . . . . . . . . . . . . . . . . . . . . . . . . . . . . . . . . . . . . 9-19.1.2 Aggregate Configuration . . . . . . . . . . . . . . . . . . . . . . . . . . . . . . . . . . . . . . . 9-39.1.3 Attribute Collection. . . . . . . . . . . . . . . . . . . . . . . . . . . . . . . . . . . . . . . . . . . . 9-49.1.4 Current Value Table (Not Currently Implemented) . . . . . . . . . . . . . . . . . . . 9-59.1.5 Point Audit History Table (Not Currently Implemented). . . . . . . . . . . . . . . . 9-6
9.2 Message Collection Configuration . . . . . . . . . . . . . . . . . . . . . . . . . . . . . . . . . . . . . . . 9-69.3 Configuration . . . . . . . . . . . . . . . . . . . . . . . . . . . . . . . . . . . . . . . . . . . . . . . . . . . . . . . 9-9
9.3.1 Operating Parameters . . . . . . . . . . . . . . . . . . . . . . . . . . . . . . . . . . . . . . . . . 9-99.3.2 Partition Management Configuration . . . . . . . . . . . . . . . . . . . . . . . . . . . . . . 9-99.3.3 Partition Management Log Configuration . . . . . . . . . . . . . . . . . . . . . . . . . 9-119.3.4 Data Source Configuration . . . . . . . . . . . . . . . . . . . . . . . . . . . . . . . . . . . . 9-129.3.5 Point Configuration . . . . . . . . . . . . . . . . . . . . . . . . . . . . . . . . . . . . . . . . . . 9-139.3.6 Point Alias Table (Not Currently Implemented) . . . . . . . . . . . . . . . . . . . . . 9-139.3.7 User Comments (Not Currently Implemented) . . . . . . . . . . . . . . . . . . . . . 9-149.3.8 Audit Log (Not Currently Implemented) . . . . . . . . . . . . . . . . . . . . . . . . . . . 9-149.3.9 Point Groups (Not Currently Implemented) . . . . . . . . . . . . . . . . . . . . . . . . 9-149.3.10 Batch Runs (Not Currently Implemented) . . . . . . . . . . . . . . . . . . . . . . . . . 9-159.3.11 Group/Batch Retrievals (Not Currently Implemented) . . . . . . . . . . . . . . . . 9-159.3.12 Trigger Configuration . . . . . . . . . . . . . . . . . . . . . . . . . . . . . . . . . . . . . . . . . 9-17
Section 10. Database Maintenance10.1 Section Overview. . . . . . . . . . . . . . . . . . . . . . . . . . . . . . . . . . . . . . . . . . . . . . . . . . . 10-110.2 Checking the System for Errors. . . . . . . . . . . . . . . . . . . . . . . . . . . . . . . . . . . . . . . . 10-2
10.2.1 Automated Error Notification . . . . . . . . . . . . . . . . . . . . . . . . . . . . . . . . . . . 10-210.2.2 Manual Error Checking . . . . . . . . . . . . . . . . . . . . . . . . . . . . . . . . . . . . . . . 10-2
10.3 Tape Pool Management . . . . . . . . . . . . . . . . . . . . . . . . . . . . . . . . . . . . . . . . . . . . . 10-210.3.1 Tape Pool Backup . . . . . . . . . . . . . . . . . . . . . . . . . . . . . . . . . . . . . . . . . . . 10-210.3.2 Cycling Tapes . . . . . . . . . . . . . . . . . . . . . . . . . . . . . . . . . . . . . . . . . . . . . . 10-310.3.3 Checking Space on Tape . . . . . . . . . . . . . . . . . . . . . . . . . . . . . . . . . . . . . 10-310.3.4 Adding Tapes to the Tape Pool . . . . . . . . . . . . . . . . . . . . . . . . . . . . . . . . . 10-3
10.4 Expiring Jobs on Tape. . . . . . . . . . . . . . . . . . . . . . . . . . . . . . . . . . . . . . . . . . . . . . . 10-5
Section 11. Licensing11.1 Section Overview. . . . . . . . . . . . . . . . . . . . . . . . . . . . . . . . . . . . . . . . . . . . . . . . . . . 11-1
11.1.1 Obtaining License Keys . . . . . . . . . . . . . . . . . . . . . . . . . . . . . . . . . . . . . . . 11-1
4 eDB220-70
Emerson Process Management Proprietary Class 2C

Table of Contents, Cont’d
Appendix A. Emerson Provided Report SamplesA.1 Section Overview. . . . . . . . . . . . . . . . . . . . . . . . . . . . . . . . . . . . . . . . . . . . . . . . . . . . A-1
A.1.1 Direct Reports . . . . . . . . . . . . . . . . . . . . . . . . . . . . . . . . . . . . . . . . . . . . . . . A-1A.1.2 ExpressCalc Reports . . . . . . . . . . . . . . . . . . . . . . . . . . . . . . . . . . . . . . . . . . A-2
Appendix B. Oracle Client Software InstallationB.1 Installing Oracle Client Software . . . . . . . . . . . . . . . . . . . . . . . . . . . . . . . . . . . . . . . . B-1
B.1.1 Installation Instructions . . . . . . . . . . . . . . . . . . . . . . . . . . . . . . . . . . . . . . . . B-1
Glossary
Index
5eDB220-70
Emerson Process Management Proprietary Class 2C

SECTION 1. INTRODUCTION
1.1 SECTION OVERVIEW
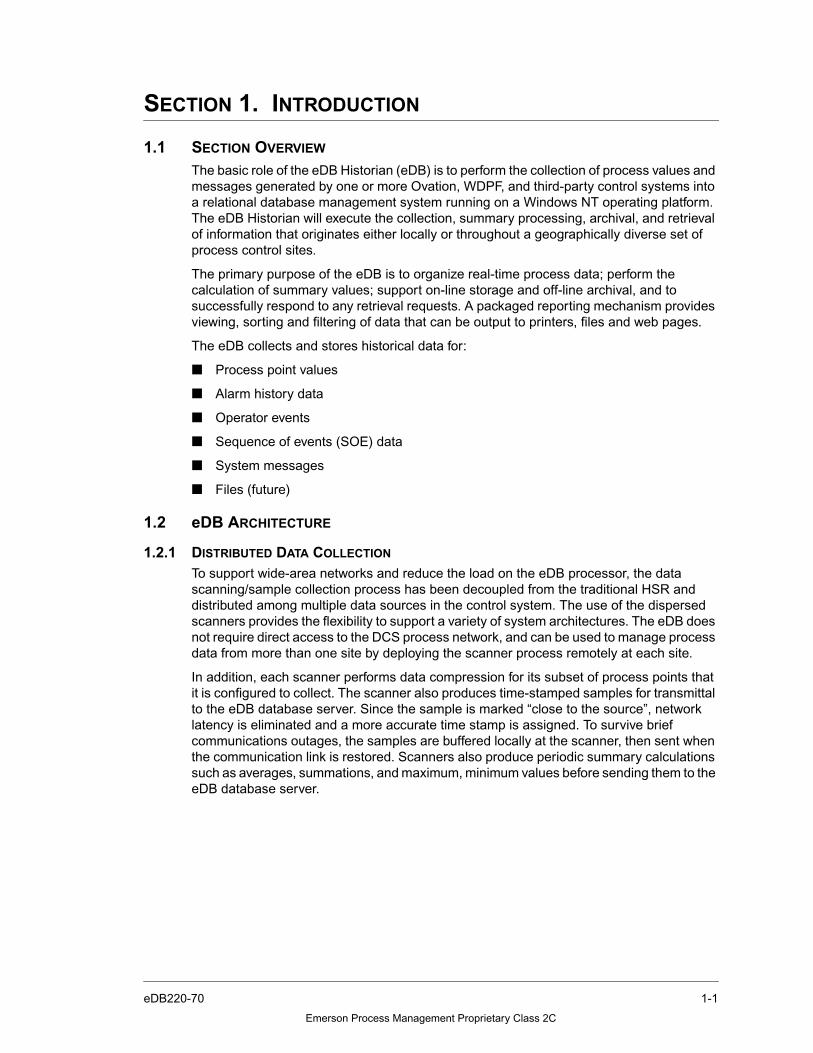
The basic role of the eDB Historian (eDB) is to perform the collection of process values andmessages generated by one or more Ovation, WDPF, and third-party control systems intoa relational database management system running on a Windows NT operating platform.The eDB Historian will execute the collection, summary processing, archival, and retrievalof information that originates either locally or throughout a geographically diverse set ofprocess control sites.
The primary purpose of the eDB is to organize real-time process data; perform thecalculation of summary values; support on-line storage and off-line archival, and tosuccessfully respond to any retrieval requests. A packaged reporting mechanism providesviewing, sorting and filtering of data that can be output to printers, files and web pages.
The eDB collects and stores historical data for:
■ Process point values
■ Alarm history data
■ Operator events
■ Sequence of events (SOE) data
■ System messages
■ Files (future)
1.2 eDB ARCHITECTURE
1.2.1 DISTRIBUTED DATA COLLECTION
To support wide-area networks and reduce the load on the eDB processor, the datascanning/sample collection process has been decoupled from the traditional HSR anddistributed among multiple data sources in the control system. The use of the dispersedscanners provides the flexibility to support a variety of system architectures. The eDB doesnot require direct access to the DCS process network, and can be used to manage processdata from more than one site by deploying the scanner process remotely at each site.
In addition, each scanner performs data compression for its subset of process points thatit is configured to collect. The scanner also produces time-stamped samples for transmittalto the eDB database server. Since the sample is marked “close to the source”, networklatency is eliminated and a more accurate time stamp is assigned. To survive briefcommunications outages, the samples are buffered locally at the scanner, then sent whenthe communication link is restored. Scanners also produce periodic summary calculationssuch as averages, summations, and maximum, minimum values before sending them to theeDB database server.
1-1eDB220-70
Emerson Process Management Proprietary Class 2C

1.3 eDB Reporting
1.2.2 RELATIONAL DATABASE PLATFORM
Designed to operate on the Windows NT Operating System, and structured around theOracle 8i RDBMS, the eDB provides database management, scalable deployment, secureand open data access, backup and recovery, a selection of development tools, and a web-based applications architecture. Compressed samples received from the distributedhistorical data scanners are processed and stored into the eDB Detailed Data Table.Thesedetailed data tables are shown in full context in Section 9. Periodically, summarizedsamples from the scanners are processed for optional storage into the Aggregate DataTables. The point values stored within the Detailed Data Table are used to support requestsby the Ovation Historical Trend, specific reports, and Historical Review applications forhistorical data. The eDB will also support historical data requests for WDPF trends andspecial desktop applications, such as Microsoft Excel. Message-based process data alsois collected and stored into eDB relational database tables. These will include operatoractions, sequence of events messages, alarms, and eDB system events.
All historical data is accessible to SQL and ODBC client applications, including thereporting package bundled with the eDB Historian. These applications can be used toevaluate the process activity that occurred around an event or across a specific period oftime.
1.2.3 FAULT TOLERANCE
The eDB incorporates automatic tape backups, RAID technology and migration of historicaldata to removable media to offer levels of fault tolerance.
1.2.4 TAPE BACKUP/RESTORATION
A tape drive is also included which provides periodic database backups and can be usedto perform database recovery. The periodic background backup operation occursautomatically, notifying the user whenever a blank tape in the pool needs to be inserted.This is described in more detail in Section 10.
1.3 eDB REPORTING
The eDB Reporting System combines traditional DCS data logging features with moresophisticated reporting capabilities. eDB reports may contain complex relational querystatements used to recall process data history during the period of time that another pointwas exhibiting certain specified conditions. Graphs and presentation elements may also beincluded to enhance the reports, and users may direct the output to a system printer, an E-mail address, to a file, or to a web server for a web delivery of report files.
1.4 APPLICATIONS FOR THE eDB HISTORIAN
1.4.1 eDB AS A LOCAL DCS HISTORIAN
When functioning as a typical DCS historian, the eDB collects the data necessary tosupport the local operations personnel’s trend analyses, regulatory reporting, and faultisolation.
1.4.2 eDB AS A SITE OR ENTERPRISE DATA INTEGRATOR
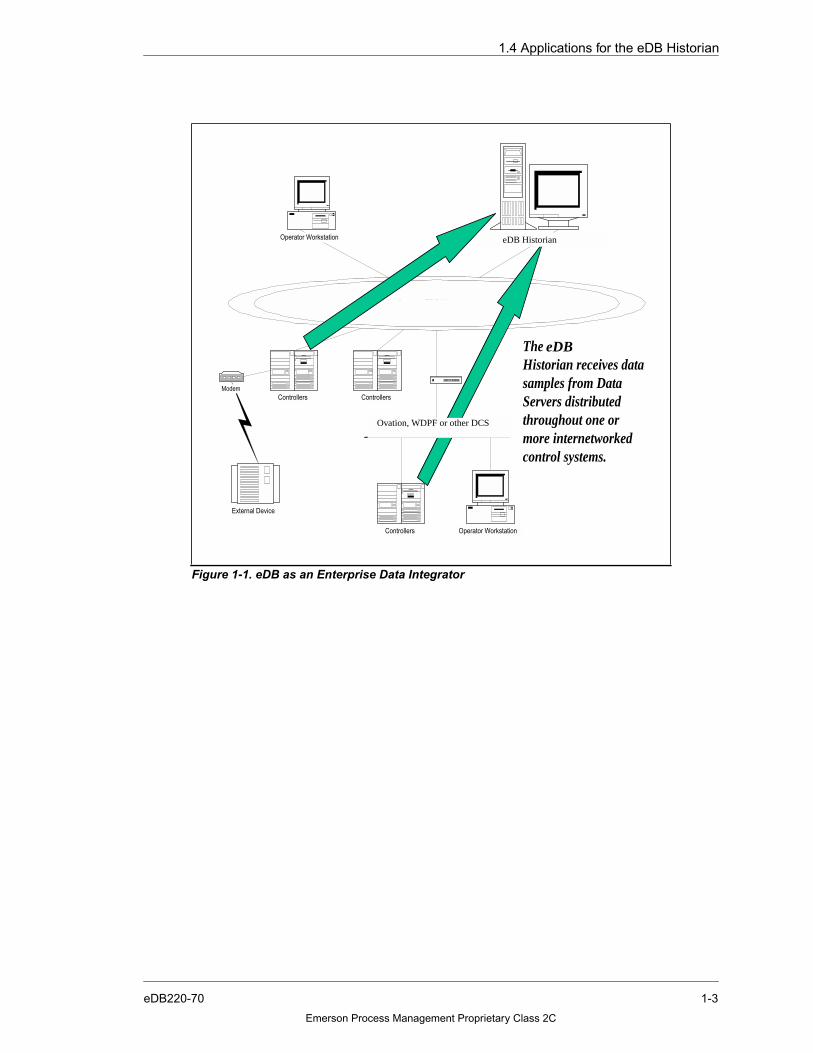
When connected to multiple control systems, the eDB can serve as a centralized databasefor process data. Systems may be contained either within the same site or locatedthousands of miles from one another. Scanners for each appropriate data type aredeployed at each individual site. These individual sites can be a homogeneous orheterogeneous set of control systems, as shown in Figure 1-1.
1-2 eDB220-70
Emerson Process Management Proprietary Class 2C
1.4 Applications for the eDB Historian
Figure 1-1. eDB as an Enterprise Data Integrator
Ovation FDDI Network
Controllers Controllers
Operator Workstation Enterprise Process Historian
Operator WorkstationControllers
Modem
External Device
Ovation, WDPF or other DCS
The EnterpriseHistorian receives datasamples from DataServers distributedthroughout one ormore internetworkedcontrol systems.
eDB
Ovation, WDPF or other DCS
eDB Historian
1-3eDB220-70
Emerson Process Management Proprietary Class 2C

1.5 List of Terms
1.5 LIST OF TERMS
The following is a list of terminology common to the eDB application.
Table 1-1. Terms
Term Description
Absolute Time Date/time specified in numeric month, day, year and hour,minutes, seconds.
Alias An assigned alternative name assigned to a process point in adatabase.
BIOS Basic Input/Output System.
Browser An application that enables viewing of documents in HTML format.
DBMS Database Management System.
DCS Distributed Control System
FAT File Allocation Table. A data structure that MS-DOS creates on thedisk when the disk is formatted.
NSECS Nanoseconds
NTFS NT File System. An advanced file system designed for usespecifically with the Windows NT operating system.
ODBC Open Database Connectivity
OLAP Online Analytical Processing
OLE Object Linking and Embedding
OPC OLE for Process Control is a set of standard OLE/COM interfaceprotocols intended to foster greater interpretability betweenautomation/control applications, field systems/devices, andbusiness/office applications in the process control industry.
OS Operating System
RAID Redundant Array of Independent Disks. A data storage method inwhich data is distributed among two or more hard disk drives.
RDBMS Relational Database Management System
Relative Time Specific date/time dependent on something else, such as thecurrent time, current hour and so on. Letters and numbers areused.
SCSI Small Computer System Interface. A SCSI bus is used to connectmicrocomputers to peripheral devices.
SOE Sequence of Events
SQL Structured Query Language
TCP/IP Transmission Control Protocol/Internet Protocol. The defaultstandard for data transmission over networks.
1-4 eDB220-70
Emerson Process Management Proprietary Class 2C

1.6 Key Elements of the eDB
1.6 KEY ELEMENTS OF THE eDB
1.7 BACKGROUND INFORMATION
The following are some basic concepts common to all eDB functions:
■ Data collection refers to the gathering and storing of data by the eDB throughscanning the Process Control Network or by receiving information through a networkconnection. Some types of data are collected unconditionally while other data iscollected by filtering through collection criteria.
■ Data type refers to the kind of data collected by the eDB. The two types of datacollected by the eDB are: Numerical Point data, and Message data. These data typesare defined as follows:
❒ Numerical Point data This type of data is scanned from the Process ControlNetwork, and consists of point value and status information. Analog point data isfiltered via a deadband.
❒ Message data is collected by the SOE History, Alarm History, and Operator EventHistory scanner software. This data is sent to the eDB through a networkconnection.
■ Data flow is the progression or flow of data from the original source to hard disk andthen to removable media.
■ Data retrieval refers to selecting of data by searching the RDBMS for information/datameeting specific criteria. Filtering capabilities vary based on the application beingutilized
Table 1-2. Key Elements of the eDB
Function Benefit
Multiple DCS Sources Provides users with a single centralized historian tosupport varied vendor systems and/or multiple unitanalysis.
Distributed Collection Solves the problem of improperly time tagging data thathas traversed various networks and data links, by timetagging the data close to the source.
Relational Database Leverages the benefits of a robust and mature databasemanagement system that is optimized for the processcontrol environment. Provides the customers with state-of-the-art solutions for retrieval and queries,redundancy, backup, archival, reporting, and interfacingto process control applications and enterprise systems.
Detailed Data Storage Supports the identification of system abnormalities byproviding analysis tools and high resolution views to theprocess activity. The eDB also provides enterpriseapplications the ability to drill-down to uncover thereasons behind a particular aggregate result.
Aggregate Data Storage Summarizes calculations (for example, averages, max/mins, accumulations) for use in reports and upstreamanalyses.
1-5eDB220-70
Emerson Process Management Proprietary Class 2C
1.8 Contents of this Document
■ Configuration refers to the customization of the system.
1.8 CONTENTS OF THIS DOCUMENT
This document is organized into the following sections:
Section 1. Introduction provides an overview of the eDB Historian, and provides a list ofadditonal reference documents.
Section 2. Configuring eDB Historian Points in a Windows based Ovation Systemdescribes the configuration of Historian points in an Ovation system.
Section 3. Collection describes the collection subsystem of the eDB Historian.
Section 4. Common User Interface Features for Data Retrieval describes the commoninterfaces used in many eDB functions.
Section 5. Historical Trends in an Ovation System describes Historical Trending.
Section 6. Historical Review describes the Historical Review application.
Section 7. Reporting describes the reports subsystem of the eDB.
Section 8. Lab History describes Lab History data storage.
Section 9. Table Definitions describes the data storage system.
Section 10. Database Maintenance describes the maintenance of the system database.
Section 11. Licensing describes the Emerson license process.
Section A. Emerson Provided Report Samples provides samples of the Emerson reporttemplates.
Section B. Oracle Client Software Installation describes the Oracle Client SoftwareInstallation.
1.9 ADDITIONAL REFERENCE DOCUMENTS
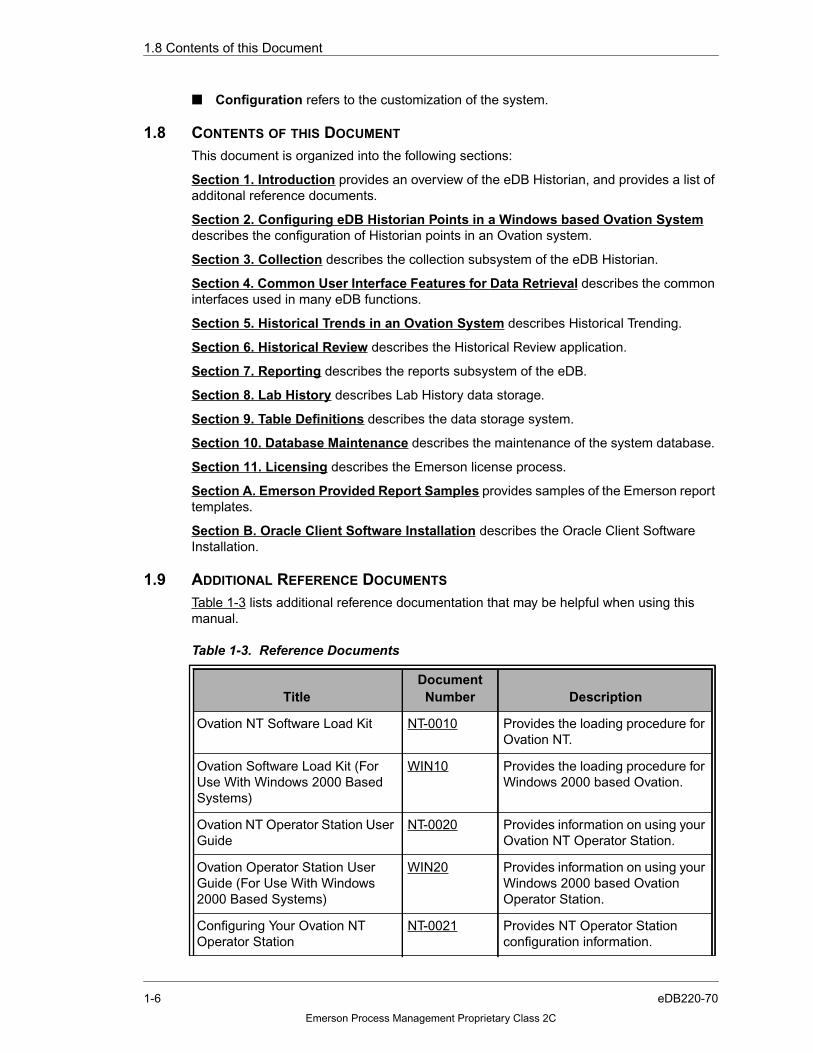
Table 1-3 lists additional reference documentation that may be helpful when using thismanual.
Table 1-3. Reference Documents
TitleDocumentNumber Description
Ovation NT Software Load Kit NT-0010 Provides the loading procedure forOvation NT.
Ovation Software Load Kit (ForUse With Windows 2000 BasedSystems)
WIN10 Provides the loading procedure forWindows 2000 based Ovation.
Ovation NT Operator Station UserGuide
NT-0020 Provides information on using yourOvation NT Operator Station.
Ovation Operator Station UserGuide (For Use With Windows2000 Based Systems)
WIN20 Provides information on using yourWindows 2000 based OvationOperator Station.
Configuring Your Ovation NTOperator Station
NT-0021 Provides NT Operator Stationconfiguration information.
1-6 eDB220-70
Emerson Process Management Proprietary Class 2C
1.9 Additional Reference Documents
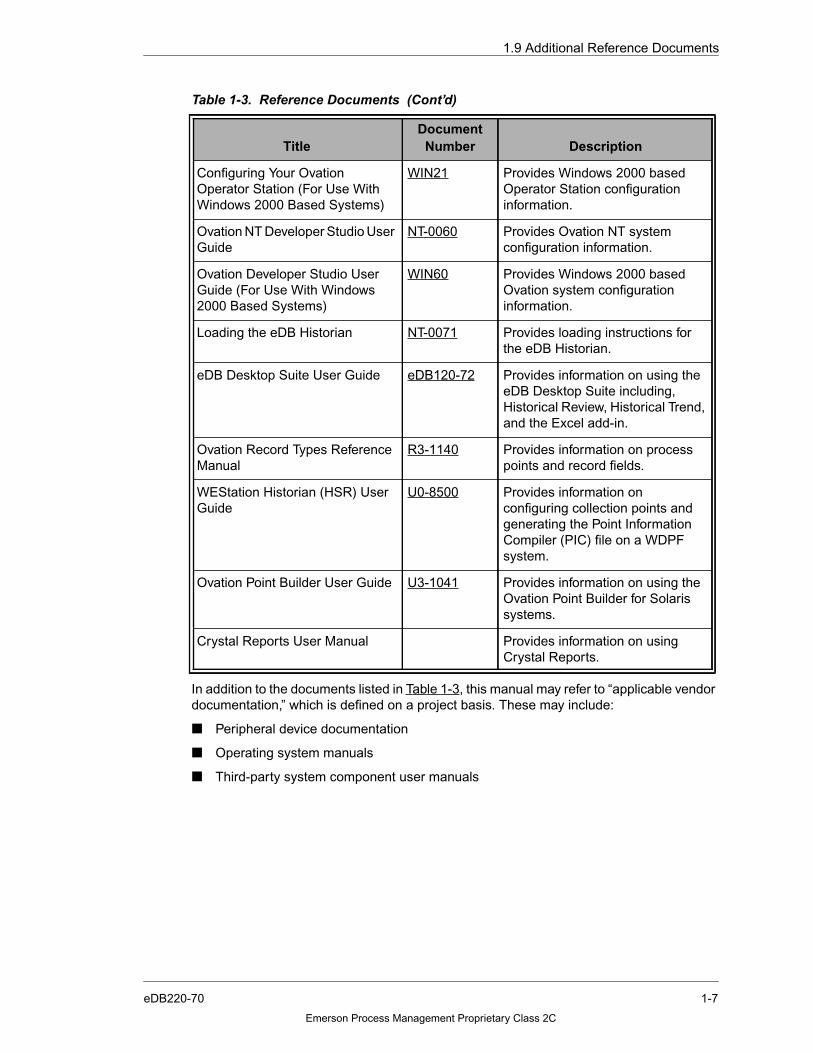
In addition to the documents listed in Table 1-3, this manual may refer to “applicable vendordocumentation,” which is defined on a project basis. These may include:
■ Peripheral device documentation
■ Operating system manuals
■ Third-party system component user manuals
Configuring Your OvationOperator Station (For Use WithWindows 2000 Based Systems)
WIN21 Provides Windows 2000 basedOperator Station configurationinformation.
Ovation NT Developer Studio UserGuide
NT-0060 Provides Ovation NT systemconfiguration information.
Ovation Developer Studio UserGuide (For Use With Windows2000 Based Systems)
WIN60 Provides Windows 2000 basedOvation system configurationinformation.
Loading the eDB Historian NT-0071 Provides loading instructions forthe eDB Historian.
eDB Desktop Suite User Guide eDB120-72 Provides information on using theeDB Desktop Suite including,Historical Review, Historical Trend,and the Excel add-in.
Ovation Record Types ReferenceManual
R3-1140 Provides information on processpoints and record fields.
WEStation Historian (HSR) UserGuide
U0-8500 Provides information onconfiguring collection points andgenerating the Point InformationCompiler (PIC) file on a WDPFsystem.
Ovation Point Builder User Guide U3-1041 Provides information on using theOvation Point Builder for Solarissystems.
Crystal Reports User Manual Provides information on usingCrystal Reports.
Table 1-3. Reference Documents (Cont’d)
TitleDocumentNumber Description
1-7eDB220-70
Emerson Process Management Proprietary Class 2C

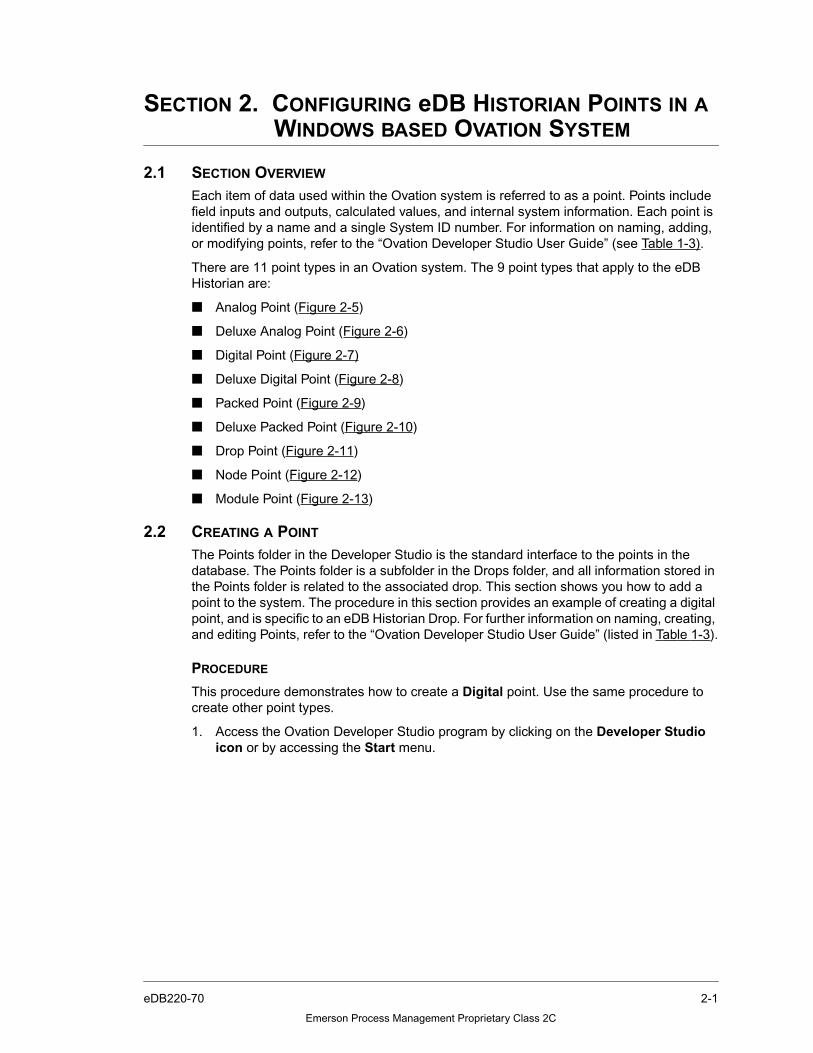
SECTION 2. CONFIGURING eDB HISTORIAN POINTS IN AWINDOWS BASED OVATION SYSTEM
2.1 SECTION OVERVIEW
Each item of data used within the Ovation system is referred to as a point. Points includefield inputs and outputs, calculated values, and internal system information. Each point isidentified by a name and a single System ID number. For information on naming, adding,or modifying points, refer to the “Ovation Developer Studio User Guide” (see Table 1-3).
There are 11 point types in an Ovation system. The 9 point types that apply to the eDBHistorian are:
■ Analog Point (Figure 2-5)
■ Deluxe Analog Point (Figure 2-6)
■ Digital Point (Figure 2-7)
■ Deluxe Digital Point (Figure 2-8)
■ Packed Point (Figure 2-9)
■ Deluxe Packed Point (Figure 2-10)
■ Drop Point (Figure 2-11)
■ Node Point (Figure 2-12)
■ Module Point (Figure 2-13)
2.2 CREATING A POINT
The Points folder in the Developer Studio is the standard interface to the points in thedatabase. The Points folder is a subfolder in the Drops folder, and all information stored inthe Points folder is related to the associated drop. This section shows you how to add apoint to the system. The procedure in this section provides an example of creating a digitalpoint, and is specific to an eDB Historian Drop. For further information on naming, creating,and editing Points, refer to the “Ovation Developer Studio User Guide” (listed in Table 1-3).
PROCEDURE
This procedure demonstrates how to create a Digital point. Use the same procedure tocreate other point types.
1. Access the Ovation Developer Studio program by clicking on the Developer Studioicon or by accessing the Start menu.
2-1eDB220-70
Emerson Process Management Proprietary Class 2C

2.2 Creating a Point
2. In the System Tree, drill down to the appropriate Drop folder and open the Points folder.
3. Right-click on the Digital Points folder and select Insert New (see Figure 2-2). TheInsert New Digital Points Wizard appears as shown in Figure 2-3.
Figure 2-1. Point Type Folders
Figure 2-2. Insert New Digital Point
2-2 eDB220-70
Emerson Process Management Proprietary Class 2C
2.2 Creating a Point
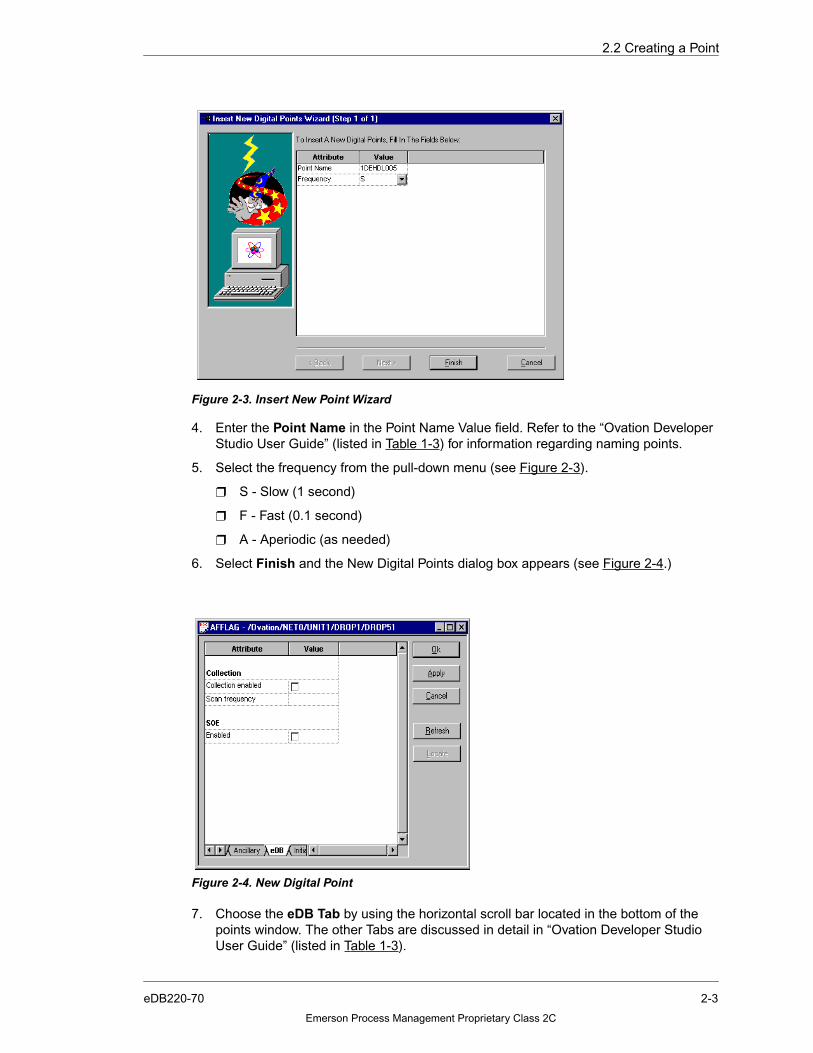
4. Enter the Point Name in the Point Name Value field. Refer to the “Ovation DeveloperStudio User Guide” (listed in Table 1-3) for information regarding naming points.
5. Select the frequency from the pull-down menu (see Figure 2-3).
❒ S - Slow (1 second)
❒ F - Fast (0.1 second)
❒ A - Aperiodic (as needed)
6. Select Finish and the New Digital Points dialog box appears (see Figure 2-4.)
7. Choose the eDB Tab by using the horizontal scroll bar located in the bottom of thepoints window. The other Tabs are discussed in detail in “Ovation Developer StudioUser Guide” (listed in Table 1-3).
Figure 2-3. Insert New Point Wizard
Figure 2-4. New Digital Point
2-3eDB220-70
Emerson Process Management Proprietary Class 2C

2.2 Creating a Point
8. Enter the appropriate values in this tab. Make sure that “collection enabled” is checked.
9. Select Apply (accepts changes and window remains open) or Ok (accepts changesand dismisses window) to accept the changes. If all required fields have beencompleted, the point is added to the database. If a required field was not completed, awarning box appears prompting you to complete the necessary information.
10. Once changes are complete, right-click on the selected Points folder in the studio andselect Load from the pop-up menu. All configuration changes must be loaded beforethey will take effect. Refer to the “Ovation Developer Studio User Guide” (listed in Table1-3) for more information.
The following figures (Figure 2-5 through Figure 2-13) and tables (Table 2-1 through Table2-9) further explain the appropriate configuration options for the different types of availableeDB points.
Figure 2-5. Analog Points
2-4 eDB220-70
Emerson Process Management Proprietary Class 2C
2.2 Creating a Point
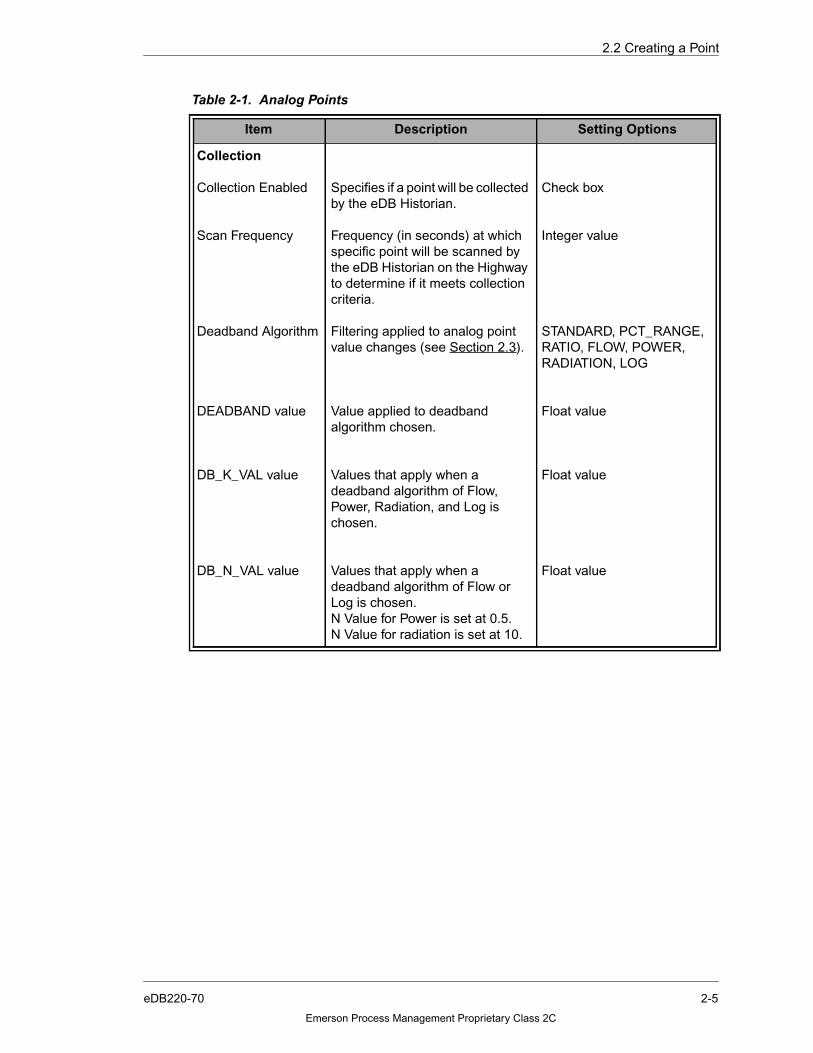
Table 2-1. Analog Points
Item Description Setting Options
Collection
Collection Enabled
Scan Frequency
Deadband Algorithm
DEADBAND value
DB_K_VAL value
DB_N_VAL value
Specifies if a point will be collectedby the eDB Historian.
Frequency (in seconds) at whichspecific point will be scanned bythe eDB Historian on the Highwayto determine if it meets collectioncriteria.
Filtering applied to analog pointvalue changes (see Section 2.3).
Value applied to deadbandalgorithm chosen.
Values that apply when adeadband algorithm of Flow,Power, Radiation, and Log ischosen.
Values that apply when adeadband algorithm of Flow orLog is chosen.N Value for Power is set at 0.5.N Value for radiation is set at 10.
Check box
Integer value
STANDARD, PCT_RANGE,RATIO, FLOW, POWER,RADIATION, LOG
Float value
Float value
Float value
2-5eDB220-70
Emerson Process Management Proprietary Class 2C
2.2 Creating a Point
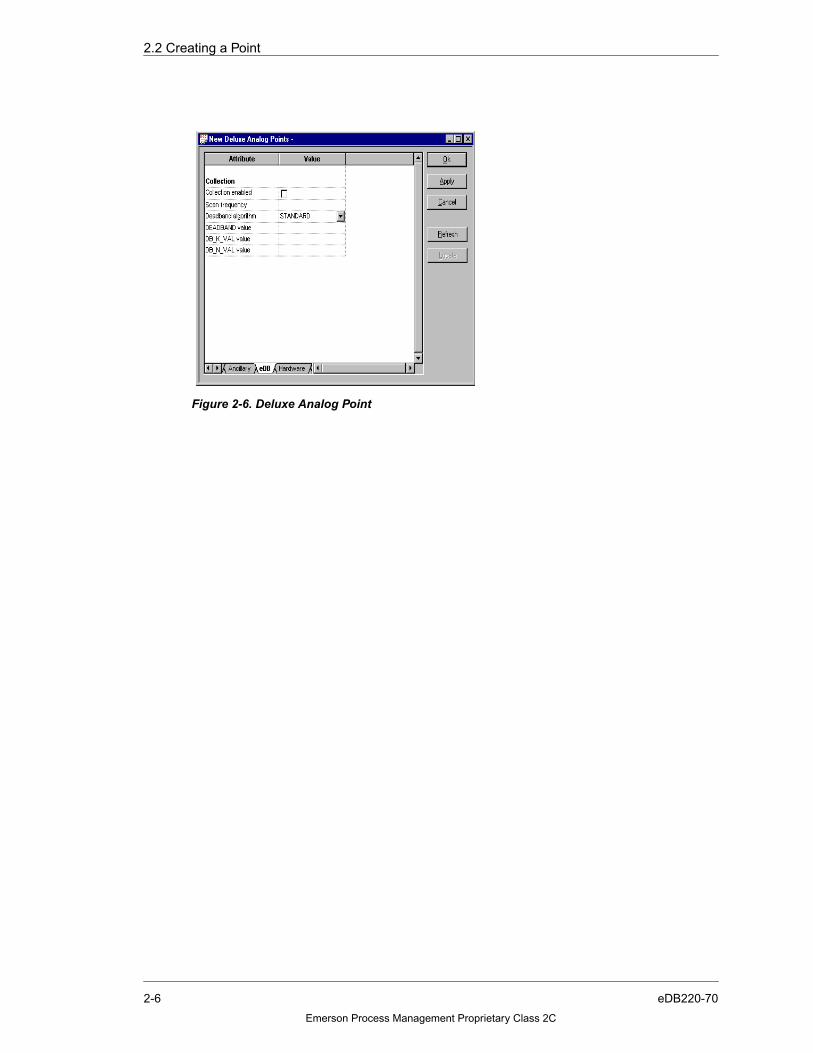
Figure 2-6. Deluxe Analog Point
2-6 eDB220-70
Emerson Process Management Proprietary Class 2C

2.2 Creating a Point
Table 2-2. Deluxe Analog Point
Item Description Setting Options
Collection
Collection Enabled
Scan Frequency
Deadband Algorithm
DEADBAND value
DB_K_VAL value
DB_N_VAL value
Specifies if a point will becollected by the eDB Historian.
Frequency (in seconds) atwhich specific point will bescanned by the eDB Historianon the Highway to determine ifit meets collection criteria.
Filtering applied to analogpoint value changes (seeSection 2.3).
Value applied to deadbandalgorithm chosen.
Values that apply when adeadband algorithm of Flow,Power, Radiation, and Log ischosen
Values that apply when adeadband algorithm of Flow orLog is chosen.N Value for Power is set at 0.5.N Value for Radiation is set at10.
Check box
Integer value
STANDARD, PCT_RANGE,RATIO, FLOW, POWER,RADIATION, LOG
Floating point value
Floating point value
Floating point value
2-7eDB220-70
Emerson Process Management Proprietary Class 2C

2.2 Creating a Point
Figure 2-7. Digital Point
Table 2-3. Digital Point
Item Description Setting Options
Collection
Collection Enabled
Scan Frequency
Specifies if a point will becollected by the eDB Historian.
Frequency (in seconds) atwhich specific point will bescanned by the eDB Historianon the network to determine if itmeets collection criteria.
Check box
Integer value
SOE
Enabled This parameter specifies thatthe point is to be collected bythe SOE subsystem.
Check box
2-8 eDB220-70
Emerson Process Management Proprietary Class 2C

2.2 Creating a Point
Figure 2-8. Deluxe Digital Points
Table 2-4. Deluxe Digital Points
Item Description Setting Options
Collection
Collection Enabled
Scan Frequency
Specifies if a point will becollected by the eDB Historian.
Frequency (in seconds) atwhich specific point will bescanned by the eDB Historianon the network to determine if itmeets collection criteria.
Check box
Integer value
SOE
Enabled This parameter specifies thatthe point is to be collected bythe SOE subsystem.
Check box
2-9eDB220-70
Emerson Process Management Proprietary Class 2C

2.2 Creating a Point
Figure 2-9. Packed Point
Table 2-5. Packed Point
Item Description Setting Options
Collection
Collection Enabled
Scan Frequency
Specifies if a point will be collected bythe eDB Historian.
Frequency (in seconds) at whichspecific point will be scanned by theeDB Historian on the network todetermine if it meets collection criteria.
Check box
Integer value
2-10 eDB220-70
Emerson Process Management Proprietary Class 2C
2.2 Creating a Point
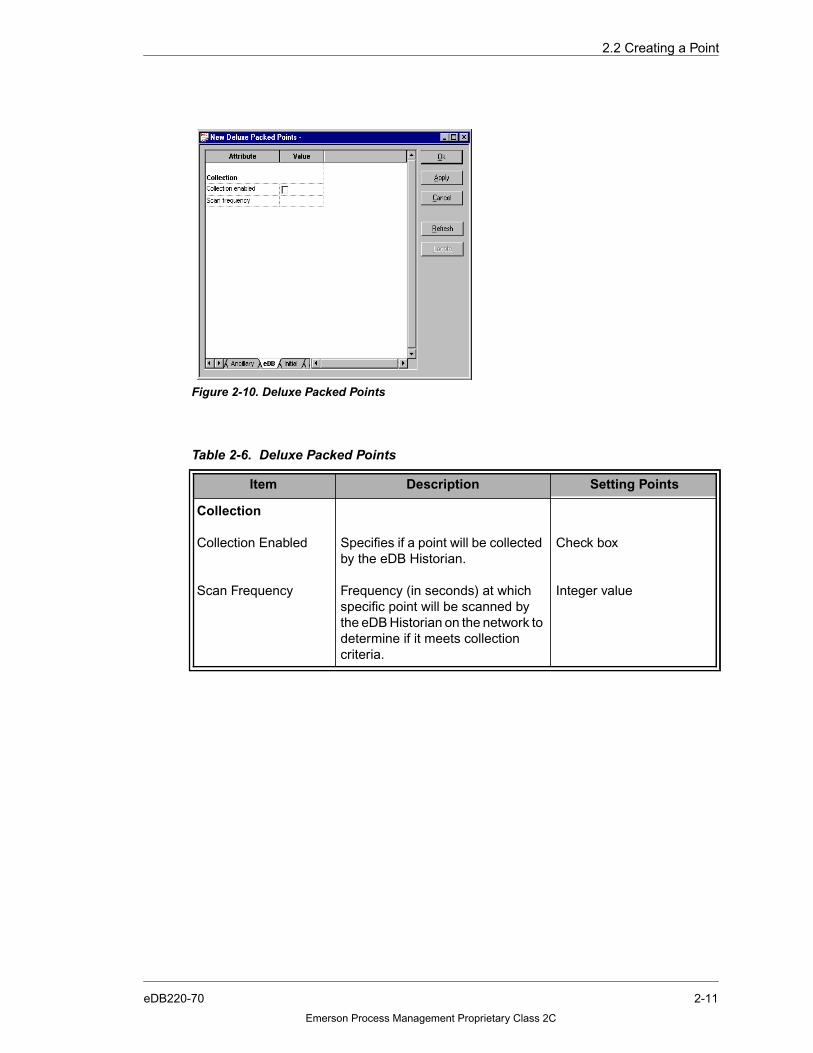
Figure 2-10. Deluxe Packed Points
Table 2-6. Deluxe Packed Points
Item Description Setting Points
Collection
Collection Enabled
Scan Frequency
Specifies if a point will be collectedby the eDB Historian.
Frequency (in seconds) at whichspecific point will be scanned bythe eDB Historian on the network todetermine if it meets collectioncriteria.
Check box
Integer value
2-11eDB220-70
Emerson Process Management Proprietary Class 2C

2.2 Creating a Point
Figure 2-11. Drop Points
Table 2-7. Drop Points
Item Description Setting Options
Collection
Collection Enabled
Scan Frequency
Specifies if a point will be collectedby the eDB Historian.
Frequency (in seconds) at whichspecific point will be scanned bythe eDB Historian on the network todetermine if it meets collectioncriteria.
Check box
Integer value
2-12 eDB220-70
Emerson Process Management Proprietary Class 2C
2.2 Creating a Point
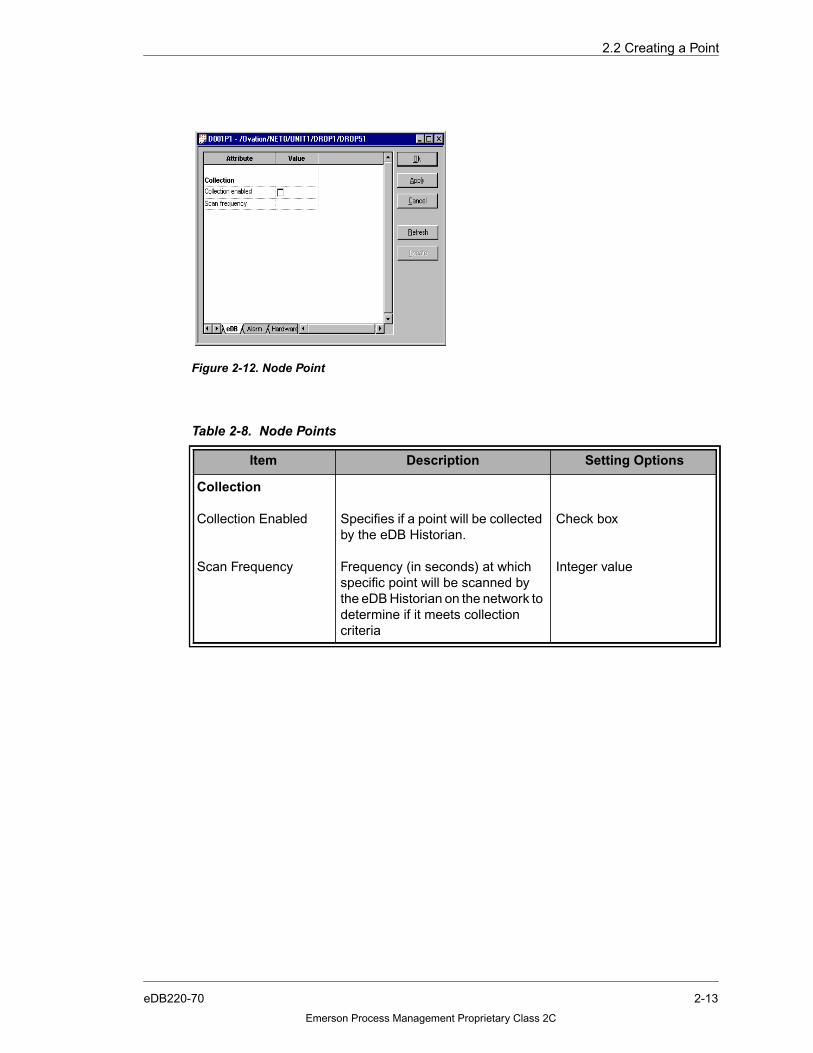
Figure 2-12. Node Point
Table 2-8. Node Points
Item Description Setting Options
Collection
Collection Enabled
Scan Frequency
Specifies if a point will be collectedby the eDB Historian.
Frequency (in seconds) at whichspecific point will be scanned bythe eDB Historian on the network todetermine if it meets collectioncriteria
Check box
Integer value
2-13eDB220-70
Emerson Process Management Proprietary Class 2C

2.3 Deadband (DB) Algorithm Description
2.3 DEADBAND (DB) ALGORITHM DESCRIPTION
The Deadband Algorithm is the rule that is applied to an Analog Point to determine if it is tobe stored. The following algorithms can be used:
■ FLOW
■ LOG
■ PCT_RANGE
■ POWER
■ RADIATION
■ RATIO
■ STANDARD
For definitions of these algorithm types, see Section 2.3.1 below.
Figure 2-13. Module Points
Table 2-9. Module Points
Item Description Setting Options
Collection
Collection enabled
Scan Frequency
Specifies if a point will becollected by the eDBHistorian.
Frequency (in seconds) atwhich specific point will bescanned by the eDBHistorian on the network todetermine if it meetscollection criteria
Check box
Integer value
2-14 eDB220-70
Emerson Process Management Proprietary Class 2C

2.3 Deadband (DB) Algorithm Description
2.3.1 RULES
1. A deadband algorithm is only valid for analog points.
2. The following definitions and rules are for the various deadband algorithms:
FLOW 1. A comparison is made between the currentcollection deadband and the results of thecurrent and previous stored processvalues raised to the power specified by1/DB_N_VAL.
2. The collection deadband is calculated asfollows:DEADBAND * (DB_K_VAL**1/DB_N_VAL)
3. DB_N_VAL is fixed at 0.5.
LOG 1. A comparison is made between the currentcollection deadband and the logarithms ofthe current and previously stored processvalues.
2. The collection deadband is calculated asfollows:DEADBAND * DB_K_VAL
PCT_RANGE 1. DEADBAND value is interpreted as apercentage of the operating range definedby the full scale value (point record fieldTV) minus the its minimum scale value(point record field BV).
2. DEADBAND value cannot be greater than100.
POWER 1. A comparison is made between the currentcollection deadband and the results of thecurrent and previous stored processvalues raised to the power specified by1/DB_N_VAL.
2. The collection deadband is calculated asfollows:DEADBAND * (DB_K_VAL**1/DB_N_VAL)
2-15eDB220-70
Emerson Process Management Proprietary Class 2C

2.4 Import History Configuration
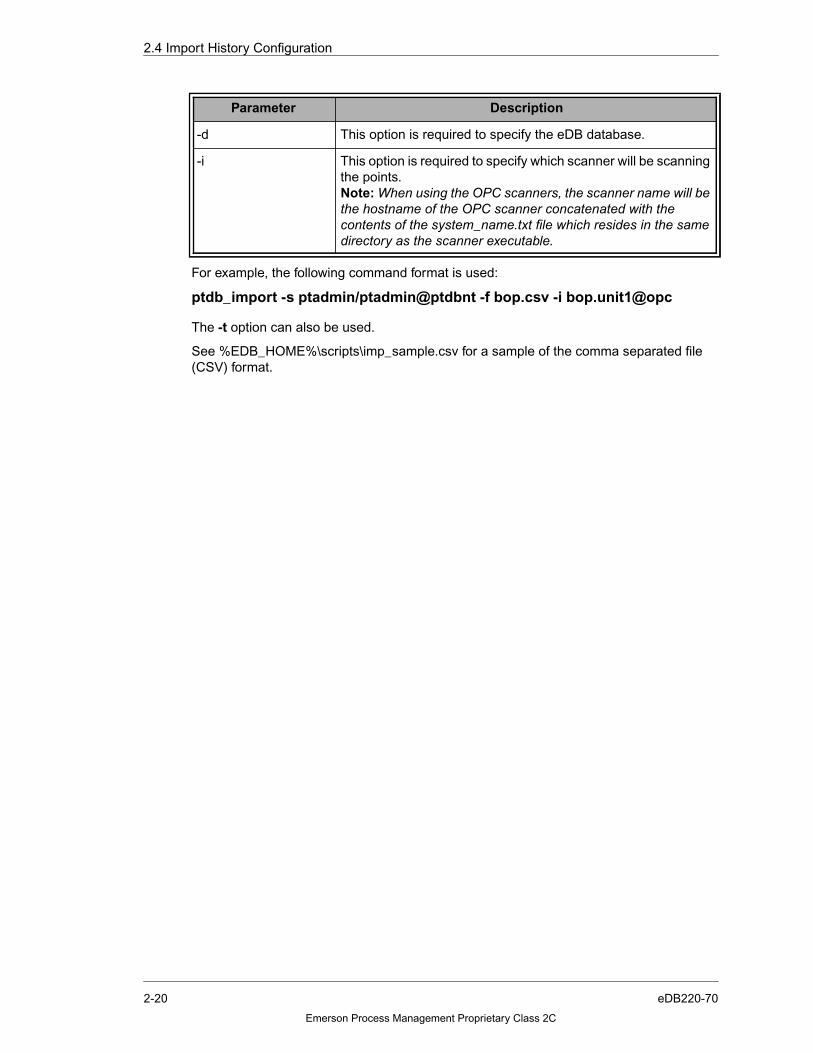
2.4 IMPORT HISTORY CONFIGURATION
The ptdb_import utility reads historian configuration information from a DCS system andupdates the eDB configuration with that information. The DCS systems which can be usedare: Ovation, WDPF, and OPC systems.
Note:
The ptdb_import utility must be run for each scanner on your system.
The ptdb_import utility is run from a DOS Command Prompt window. To run the utility:
1. Open a DOS Command Prompt window and change to the eDB home directory:cd %EDB_HOME%\bin
2. The usage for the command line is ptdb_import [options]
The available options and parameters are:
RADIATION 1. A comparison is made between the currentcollection deadband and the logarithms ofthe current and previously stored processvalues.
2. The collection deadband is calculated asfollows:DEADBAND * DB_K_VAL
3. DB_N_VAL is fixed at 10.0.
RATIO 1. The collection deadband is recalculatedevery time the process value differs fromthe last stored value by the amountspecified by DEADBAND. The newcollection deadband must be calculated tobe a percentage of the new collection’svalue.
STANDARD 1. DEADBAND value is interpreted in straightengineering units.This can also be referredto as a “box car” deadband algorithm.
Parameter Description
-h Print a short description for all of the options.
-d user/passwd@dbase Specify the eDB user, password, and database which isthe destination for the import information.
-s user/passwd@dbase Specify an Ovation NT PTDB user, password, anddatabase which is the source for the import information.(If importing from NT Power Tools only.)
2-16 eDB220-70
Emerson Process Management Proprietary Class 2C

2.4 Import History Configuration
For convenience, all of the commands needed to import the database and create thescanner configuration files can be put into a batch file.
IMPORTING FROM A WINDOWS BASED OVATION SYSTEM
When an eDB is used as the historian from a Windows based Ovation System, thecollection parameters for each point are initialized using the Ovation Developer Studio pointediting tools. Refer to the “Ovation Developer Studio User Guide” (see Table 1-3) for moreinformation. Once all of the points are configured, the ptdb_import utility is used to transferthe appropriate information directly from the Ovation Developer Studio database to the eDBdatabase. To do that, the following options are required:
For example, the following command format is used:
ptdb_import -s ptadmin/ptadmin@ptdbnt -d ehsys/sys@wpceh -i drop160.unit1@w3
Optional command line parameters are:
-n network Specify the network name in the Ovation NT databasewhich points must match in order to be imported. (Ifimporting from NT Power Tools only.)
-u unit Specify the unit name in the Ovation NT database whichpoints must match in order to be imported. (If importingfrom NT Power Tools only.)
-f file_name Specify PIC/CSV file which is the source for importinformation.
-i scanner_name Specify the scanner name (for example,DROP146.UNIT1@W3) which will send point samplesto the eDB.Note: Each scanner connected to the eDB must have aunique name. If the scanner name is new and does notexist in the eDB database, the program will ask whethera new entry should be made in the eDB database. Afterensuring that the name is correct, answer this questionwith “y” to create the new entry.
-x unit@network Specify replacement unit and network
-t test_mode 0=Search/Load (Def), 1=Search/Print, 2=Search/Print/Load
Parameter Description
-s This option is required to specify the Ovation Developer Studiodatabase.
-d This option is required to specify the eDB database.
-i This option is required to specify which scanner will be scanningthe points.
Parameter Description
2-17eDB220-70
Emerson Process Management Proprietary Class 2C
2.4 Import History Configuration
❒ The -x option can also be used to replace the actual unit and network names foreach point with the given unit and network names. This is useful if the eDB is usedto collect information from multiple Ovation systems which do not have unique unit/network names.
❒ The -n and -u options can be used to import points only from the specified networkand unit. This is useful where different scanners are used to collect informationfrom different units in the same Ovation database.
❒ The -t option can also be used.
❒ If you wish to import from multiple NT systems, you must edit ptdb_import in thetnsnames file.
IMPORTING FROM AN OVATION SOLARIS SYSTEM
When an eDB is used as the historian for an Ovation Solaris System, the collectionparameters for each point are initialized using the Point Builder point editing tool. Refer tothe “Point Builder User Guide” (listed in Table 1-3) for more information.
Note:
Points which will be scanned by the eDB system must have the history typeMAIN enabled.
Once all of the points are configured, use the Generate HSR PIC File function of the PointBuilder to create the main.pic file. This PIC file must be transferred to the eDB. Once on theeDB, the ptdb_import utility is used to transfer the appropriate information from the PIC fileto the eDB database. To do that, the following options are required:
For example, the following command format is used:
ptdb_import -d ehsys/sys@wpceh -f main.pic.drop160 -i drop160.unit99@w3
Optional command line parameters are:
❒ The -x option can also be used to replace the actual unit and network names foreach point with the given unit and network names. This is useful if the eDB is usedto collect information from multiple Ovation systems which do not have unique unit/network names.
❒ The -t option can also be used.
Parameter Description
-f This option is required to specify the name of the PIC file.
-d This option is required to specify the eDB database.
-i This option is required to specify which scanner will be scanningthe points.
2-18 eDB220-70
Emerson Process Management Proprietary Class 2C

2.4 Import History Configuration
IMPORTING FROM A WDPF SYSTEM
When an eDB is used as the historian for a WDPF system, the collection parameters foreach point are initialized using the hsrpic compiler and the hsrpicfile.src source file. Referto the “WEStation Historian (HSR) User Guide” (listed in Table 1-3) for more information onconfiguring collection points and generating the Point Information Compiler (PIC) file on aWDPF system.
The hsrpic compiler is used to generate the ‘main.pic’ file for the system. This PIC file mustbe transferred to the eDB. Once on the eDB, the ptdb_import utility is used to transfer theappropriate information from the PIC file to the eDB database. To do that, the followingoptions are required:
For example, the following command format is used: (this command should be typed on oneline)
ptdb_import -s ptadmin/ptadmin@ptdbnt -f main.pic.drop146 -x unit5@wdpf-i drop146.unit5@wdpf
The -t option can also be used.
IMPORTING FROM AN OPC SYSTEM
When an eDB is used as the historian for an OPC system, the collection parameters foreach point are specified in a comma separated file which can be created in a text editor.The file must have CSV as the extension. This csv file must be transferred to the eDB. Onceon the eDB, the ptdb_import utility is used to transfer the appropriate information from thefile to the eDB database. To do that, the following options are required:
Parameter Description
-f This option is required to specify the name of the PIC file.
-d This option is required to specify the eDB database.
-x This option is required only when more than one WDPF systemwill be scanned by the eDB. Use of this option appends the givenunit and network names to each point name when the pointname is imported into the eDB system. This is required so thatthe eDB can be used to collect information from multiple WDPFsystems which may have identical point names.
-i This option is required to specify which scanner will be scanningthe points.Note: When using WDPF drops as eDB scanners, the scannername will be the drop name concatenated with the contents ofthe system_name.txt file which resides in the same directory asthe scanner executable.
Parameter Description
-f This option is required to specify the name of the CSV file.
2-19eDB220-70
Emerson Process Management Proprietary Class 2C
2.4 Import History Configuration
For example, the following command format is used:
ptdb_import -s ptadmin/ptadmin@ptdbnt -f bop.csv -i bop.unit1@opc
The -t option can also be used.
See %EDB_HOME%\scripts\imp_sample.csv for a sample of the comma separated file(CSV) format.
-d This option is required to specify the eDB database.
-i This option is required to specify which scanner will be scanningthe points.Note: When using the OPC scanners, the scanner name will bethe hostname of the OPC scanner concatenated with thecontents of the system_name.txt file which resides in the samedirectory as the scanner executable.
Parameter Description
2-20 eDB220-70
Emerson Process Management Proprietary Class 2C

2.4 Import History Configuration
2.4.1 PIC_FILE_GEN UTILITY
The pic_file_gen utility creates configuration files for the point and attribute scanners byreading the appropriate information from the eDB database and writing it to a file which isused by the scanner.
Note:
This is only necessary for OPC scanners. Online configuration issupported for all Emerson scanners.
The pic_file_gen utility is run from a DOS command prompt window. To run it,
1. Open a DOS window and change to the eDB home directory:cd %EDB_HOME%\bin
2. The usage for the command is: pic_file_gen [options]
The available options and parameters are:
For all systems, three options are required. The following command format is used:
pic_file_gen -d ehsys/sys@wpceh -f scn_msgs.cfg.146 -i drop146.unit1@w3
The name of the scanner specified with the -i parameter must match the name of thescanner used in a previous ptdb_import operation. The file generated must be transferredto the scanner with the name scn_msgs.cfg. If an attribute scanner is also running on thesame scanner, then the scn_msgs.cfg file must be copied to attr_msgs.cfg.
For convenience, all of the commands needed to import the database and create thescanner configuration files can be put into a batch file.
Parameter Description
-h Print a short description for all of the options.
-d user/passwd@dbase
Specify the eDB user, password, and database which is thesource for the scanner configuration file information.
-s user/passwd@dbase
Specify an Ovation NT PTDB user, password, and databasewhich can be used as a source for some of the scannerconfiguration file information.
Note: This option is only available for Windows based Ovationsystems, and is only provided to assist debugging. It causes thepic_file_gen utility to re-look up the record type and SID of eachpoint on the Ovation database server rather than use the recordtype and SID which were stored in the eDB database byptdb_import.
-f file_name Specify the output scanner configuration file name.
-i scanner_name Specify the scanner name (for example,DROP146.UNIT1@W3) which will use the configuration file.
2-21eDB220-70
Emerson Process Management Proprietary Class 2C


SECTION 3. COLLECTION
3.1 SECTION OVERVIEW
This section addresses the collection subsystem of the eDB Historian. The eDB Historianhas two classes of devices over which the functions of the system are split: The eDBHistorian and the Scanners. The eDB Historian permanently stores the information andmanages retrievals. The Scanners monitor the plant and send the values and events thatneed to be stored to the eDB Historian. The Scanners use networking technology tocommunicate with the eDB Historian.
This section also addresses necessary scanner configuration for a Windows based Ovationsystem. Configuration must be done using the Ovation Developer Studio. CompleteOvation configuration information can be found in “Configuring Your Ovation OperatorStation” (listed in Table 1-3) and “Ovation Developer Studio User Guide” (listed inTable 1-3).
3.2 COLLECTION
The Collection subsystem functions are a set of threads that are responsible for managingthe database tables. It is responsible for the receiving of data from the DCS scannerclient(s) and placing this data into the database table. It is also responsible for managementof the data link(s) to the client machine(s) to provide acknowledgement of data transfer.
3.2.1 DISTRIBUTED DATA COLLECTION
To support wide-area networks and reduce the load on the eDB processor, the datascanning/sample collection process has been moved from the eDB host and distributedamong multiple data sources in the control system. The use of the dispersed scannersprovides the flexibility to support a variety of system architectures. The eDB does notrequire a direct interface to the DCS process network and it can be used to manageprocess data from more than one site.
In addition, each scanner performs data compression for its subset of process points, whilealso producing time-stamped samples for transmittal to the eDB database server. Since thesample is marked “close to the source”, network latency is eliminated and a more accuratetime is assigned. To survive brief communications outages, the samples are bufferedlocally, then sent when the link is restored. Scanners also produce periodic summarycalculations such as averages, summations, maximum and, minimum values beforesending them to the eDB database server.
3.3 SCANNER FUNCTIONALITY
A typical system configuration will have one eDB Historian and one or more scanners.Scanners may have different functions. The Scanner functions include:
■ Point Value Scanning (see Section 3.3.1)
■ Point Attribute Scanning (see Section 3.3.2)
■ Operator Events Scanning (see Section 3.6)
■ Alarm Scanning (see Section 3.7)
■ Sequence of Events Scanning (see Section 3.8)
3-1eDB220-70
Emerson Process Management Proprietary Class 2C

3.3 Scanner Functionality
3.3.1 POINT VALUE SCANNING
TIMESTAMPED VALUES
When Point Value Scanning starts, every process value configured for collection is read,along with its status and is reported to the eDB Historian. After this initial snapshot, eachprocess value is read again every scan period. The scan periods can be any multiple of onesecond. A deadband compression algorithm is used for analog points which compares thenewly read value with the last value stored to the eDB Historian. The algorithm determinesif the newly read value should be stored again. Available Deadband compressed algorithmsare described in Table 3-1.
Table 3-1. Deadband Compressed Algorithms
Algorithm Definition
Percent of Range The deadband value is interpreted as a percentage ofthe operating range defined by the point’s full scalevalue minus the scale value. Value cannot exceed 100.
Power A comparison is made between the current collectiondeadband and the results of the current and previousstored process values raised to the power specified by1/DB_N_VAL. Collection deadband is calculated asfollowsDEADBAND * (DB_K_VAL**1/DB_N_VAL).DB_N_VAL is fixed at 0.5.
Logarithm A comparison is made between the current collectiondeadband and the logarithms of the current andpreviously stored process values. Collection deadbandis calculated as followsDEADBAND * DB_K_VAL
Ratio The collection deadband is recalculated every time theprocess value differs from the last stored value by theamount specified by DEADBAND. The new collectiondeadband is calculated to be a percentage of the newcollection’s value.
Flow A comparison is made between the current collectiondeadband and the results of the current and previouslystored process values raised to the power specified by1/DB_N_VAL.Collection deadband is calculated as followsDEADBAND * (DB_K_VAL**1/DBN_VAL)
Radiation A comparison is made between the current collectiondeadband and the logarithms of the current andpreviously stored process values. Collection deadbandis calculated as followsDEADBAND * DB_K_VALDB_N_VAL is fixed at 10.0.
3-2 eDB220-70
Emerson Process Management Proprietary Class 2C

3.3 Scanner Functionality
If the compressions algorithm for a particular point has not determined that the value bereported for one hour, that point’s value and status is reported anyway. A value is alwaysreported to the eDB Historian if any significant status for a point changes.
AGGREGATE VALUES
When the process value is being read as in Point Value Scanning, a record is updatedwhich tracks aggregates of the value over a 10 minute time period. At the end of the timeperiod, the aggregate record is sent to the eDB Historian. The record is then reset for thenext time period. The nature of the aggregate record is different for different value types:
Digital Type (I/O) Values Aggregate:
■ Average
■ Toggle Counts
■ Time Set
■ Time Reset
■ Count of Good Quality Samples Taken
Analog Type Values (floating point) Aggregate:
■ Average
■ Maximum Value
■ Time of Maximum
■ Minimum Value
■ Time of Minimum
■ Status
Value types are defined in Section 5. The presence of aggregate records in the databasefacilities the computation of aggregate over longer periods, such as hourly, daily, andweekly averages.
3.3.2 POINT ATTRIBUTE SCANNING
A process point in an industrial system includes the process value and its status, plusattributes of the point itself. Point Attribute Scanning reads a subset of the attributes of thepoint and reports them to the eDB Historian.
While the point values in an industrial system can change significantly, the attributes of thepoints change much more slowly. Changes in attributes are caused by actions such as anengineer manually editing the attributes. These slowly changing attributes are read muchless often. In Point Attribute Scanning, the attribute values are only read every two hoursand reported to the eDB Historian.
Attributes collected and stored in Point Attribute Scanning include:
■ Point Name
■ English Description
■ Engineering Units
■ Set and Reset Description
■ Top and Bottom of Scale
■ Alarm limits
3-3eDB220-70
Emerson Process Management Proprietary Class 2C

3.4 Common Scanner Features
Point Attribute Scanning occurs for each point that is configured for Point Value Scanning.The Point Attributes can be retrieved from the eDB Historian at any time and are used whendisplaying trends of point values.
3.4 COMMON SCANNER FEATURES
As described above, each scanning function gathers pieces of information, which are thenreported to the eDB Historian. The reporting of this information to the eDB Historian takesplace over a network connection between the Scanner and the eDB Historian.
In order for this communication to be reliable and tolerant of failures, the information istemporarily stored in the Scanner until the eDB Historian confirms that the information hasbeen permanently stored there. The temporary storage also ensures that information is notlost during short network outages or during short times of unavailability of the eDBHistorian. In the event that the temporary storage becomes full and data must be lost, thedatabase is updated to indicate the periods that data is missing.
The size of the temporary storage on the scanner is configurable. It can be made smallerwhen resources in the Scanner machine are limited. It can be made larger to allow forlonger periods of failure without losing information.
Where possible, this temporary storage is on magnetic media, so that the data is not lostduring a failure of the Scanner.
3.5 MONITORING WDPF, OVATION, AND OTHER SYSTEMS
A single eDB Historian system can be used to monitor Ovation, WDPF and other types ofsystems. The same eDB Historian system can monitor many systems of various types. Thefollowing is a guideline for integrating the eDB Historian with various systems.
3.5.1 WDPF SYSTEMS
When an eDB Historian is used to monitor a WDPF system, one scanner of each requiredtype must exist on the WDPF highway. These Scanners would reside in one or more SolarisWEStation drops. The WDPF system would have to be configured to have the appropriateScanner WEStations as the Sequence of Event logger and the Operator Event Logger.
Each Scanner would gather its data and would store it temporarily until it is sent to the eDBHistorian for permanent storage.
3.5.2 OVATION SYSTEMS
When an eDB Historian is used to monitor an Ovation System, the Scanners are distributedthroughout the Ovation system.
A single drop or multiple drops can be configured to perform Point Scanning. Each Scannerdrop is configured to know the network address of the eDB Historian, and will maintain aconnection to it as long as they are running.
On the same Ovation System, there should be one of each of the other types of Scanners(Attribute, Alarm, Sequence of Event and Operator Event). These will reside in Windowsbased Stations or in Solaris Ovation Stations. The Ovation System must be configured tohave the appropriate Scanner drops as the Sequence of Event logger and the OperatorEvent Logger.
Each Scanner would gather its data and would store it temporarily until it is sent to the eDBHistorian for permanent storage.
3-4 eDB220-70
Emerson Process Management Proprietary Class 2C
3.5 Monitoring WDPF, Ovation, and Other Systems
3.5.3 OPC SYSTEMS
OPC (OLE for Process Control) is “a set of standard OLE/COM interface protocols intendedto foster greater interoperability between automation/control applications, field systems/devices, and business/office applications in the process control industry”. (From “OPCOverview” by the OPC Task Force, October 1998)
OPC provides a standard mechanism to enable industrial systems from different vendorsto communicate with each other. Currently there are three OPC interfaces specified: DataAccess, Alarm, Events and Historical Data Access.
In OPC, servers are data sources. The data is made available to OPC clients, whichconnect to the servers and request data of interest.
When using the eDB as a historical repository for an OPC system, Scanners are the OPCclients that are connected to OPC servers. There are two types of OPC Servers of interestto the Scanning: Data Access Servers and Alarm and Event Servers. Point Scanningfunctions are obtained with a Scanner as a client to an OPC Data Access Server. Alarm,Sequence of Event and Operator Event Scanning functions are obtained with anotherScanner as a client to an OPC Alarm and Event Server. The OPC Servers send data to theScanners, which store it temporarily until it is sent to the eDB Historian for permanentstorage. The Scanners should be near the OPC servers so that the temporary storage canoccur even if the network connection between the Scanner and the eDB Historian is notavailable.
DIFFERENCES IN SCANNING WITH OPC SCANNERS
There are two main differences in Scanning functions between OPC Scanners and WDPF/Ovation Scanners.
1. The determination of whether current values should be reported may occur in the OPCServer and not in the Scanner. In this case, the selection of compression algorithms isnot available. Instead, only the “percent of range” deadband algorithm is available.
2. There are few point attributes defined in OPC. Fewer attributes will be available fromOPC Attribute Scanners than from Ovation/WDPF Attribute Scanners.
3-5eDB220-70
Emerson Process Management Proprietary Class 2C
3.6 Configuring the Operator Event Log in a Windows Based Ovation System
3.6 CONFIGURING THE OPERATOR EVENT LOG IN A WINDOWS BASED OVATIONSYSTEM
When a plant operator performs certain functions, such as forcing the value of a point orchanging a control loop from automatic to manual, messages are generated within anindustrial system indicating the occurrence of the event. These messages are known asOperator Event Messages. In the Operator Event Scanner, all of the Operator EventsMessages are gathered and reported to the eDB Historian. The messages are available forretrieval at any time.
Ovation Operator Event Messages can be configured at the Network or Unit level in theDeveloper Studio hierarchy. If you choose to configure at the Network level, then all dropsunder that network will use that configuration, provided there is no Unit level Event Loggerconfiguration. If you are choosing to configure at the Network level, then do not create aUnit version. If you choose to configure at the Unit level, then all drops under that Unit willuse that configuration.
Use the following procedure to configure the Operator Event Log (Unit level) using theOvation Developer Studio. For more information on using the Ovation Developer Studio,see “Ovation Developer Studio User Guide” (listed in Table 1-3).
1. Access the Ovation Developer Studio program by clicking on the Developer Studioicon or by accessing the Start menu.
2. Drill down to the Event Log Configuration folder by navigating through the followingpath:
Systems folder -> Networks folder (you may configure at this level) or -> Units folder-> Open your selected unit (see Figure 3-1)
3. Double-click to open the Configuration folder.
4. Click on the Event Log Configuration folder and an icon will appear in the WorkPadwindow. If there is no object, select Insert New via the right-click menu.
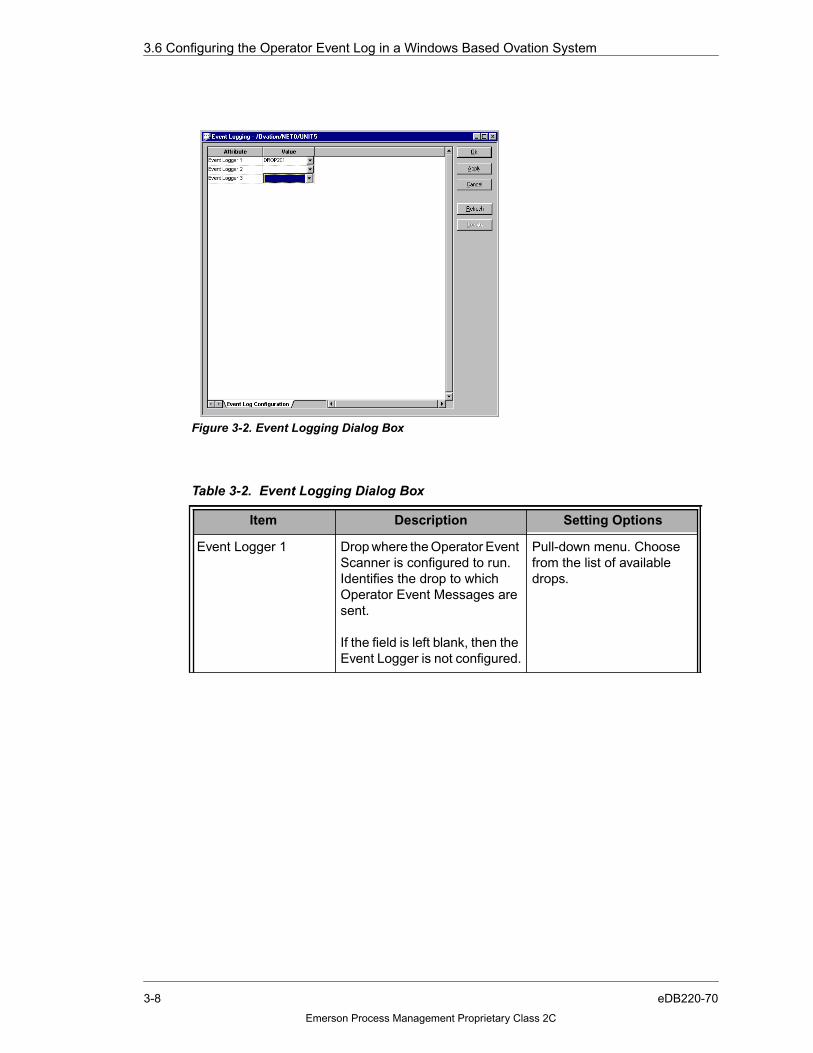
5. Double-click to open the Event Logging icon in the WorkPad window. The EventLogging dialog box appears (see Figure 3-2).
6. From the pull-down menus, select the drops you would like to configure (see Table 3-2).
Note:
The drop or drops specified here must match the drop where the OperatorEvent Scanner has been configured to run on the Ovation system.
7. Select Apply or Ok to accept the changes. Apply accepts changes and the dialog boxremains open. Ok accepts changes and dismisses the dialog box.
8. The configuration changes you made will not take effect until they are downloaded tothe drop. See “Configuring Your Ovation Operator Station” (listed in Table 1-3) forinformation on downloading changes to a drop.
3-6 eDB220-70
Emerson Process Management Proprietary Class 2C

3.6 Configuring the Operator Event Log in a Windows Based Ovation System
Figure 3-1. Developer Studio System Tree
3-7eDB220-70
Emerson Process Management Proprietary Class 2C
3.6 Configuring the Operator Event Log in a Windows Based Ovation System
Figure 3-2. Event Logging Dialog Box
Table 3-2. Event Logging Dialog Box
Item Description Setting Options
Event Logger 1 Drop where the Operator EventScanner is configured to run.Identifies the drop to whichOperator Event Messages aresent.
If the field is left blank, then theEvent Logger is not configured.
Pull-down menu. Choosefrom the list of availabledrops.
3-8 eDB220-70
Emerson Process Management Proprietary Class 2C

3.7 Configuring an Alarm Event in a Windows Based Ovation System
3.7 CONFIGURING AN ALARM EVENT IN A WINDOWS BASED OVATION SYSTEM
3.7.1 OVERVIEW
Alarms are generated when abnormal conditions occur in the process or when conditionsoccur which require special attention. In Alarm Scanning, all of the alarms in the systemthat pass the eDB filter are gathered and reported to the eDB Historian for permanentstorage. They are then available for retrieval at any time.
Note:
Make sure that your Alarms Events are configured to be sent to the Dropwhere the Alarm Scanner software is running. If this field is left blank, thenthe messages will be sent to the machine that the alarms are running on.
Configuring Alarms in an Ovation System is described in detail in “Configuring Your OvationOperator Station” (listed in Table 1-3).
PROCEDURE
Use the following procedure to configure the Alarm Historical Storage Tab:
1. Access the Ovation Developer Studio.
2. Drill down to the Alarm folder by navigating through the following path:
Studio System Tree -> System Folder (or appropriate level such as, Network,Unit, or Drop) -> Configuration Folder -> Alarm Folder
Event Logger 2 Drop where the Operator EventScanner is configured to run ifmore than one scanner isdeployed. Identifies the drop towhich Operator EventMessages are sent.
If the field is left blank, then asecond Event Logger is notconfigured.
Pull-down menu. Choosefrom the list of availabledrops.
Event Logger 3 Drop where the Operator EventScanner is configured to run ifmore than one scanner isdeployed. Identifies the drop towhich Operator EventMessages are sent.
If the field is left blank, then athird Event Logger is notconfigured.
Pull-down menu. Choosefrom the list of availabledrops.
Table 3-2. Event Logging Dialog Box (Cont’d)
Item Description Setting Options
3-9eDB220-70
Emerson Process Management Proprietary Class 2C
3.7 Configuring an Alarm Event in a Windows Based Ovation System
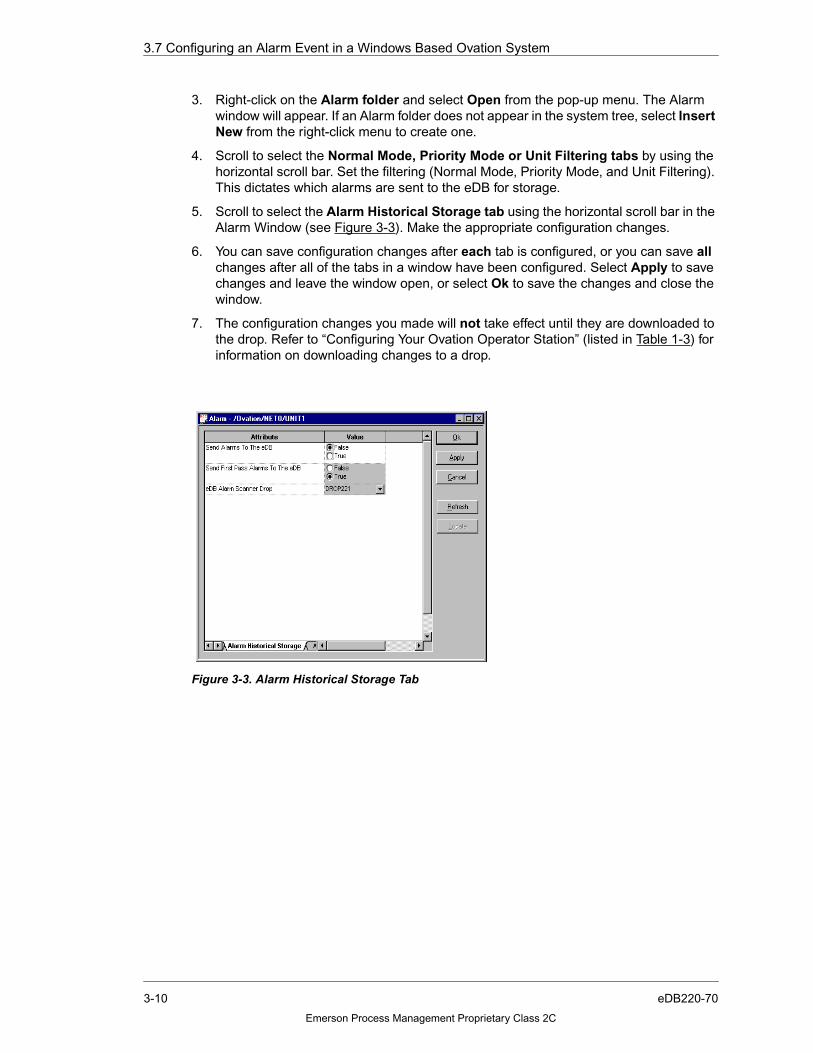
3. Right-click on the Alarm folder and select Open from the pop-up menu. The Alarmwindow will appear. If an Alarm folder does not appear in the system tree, select InsertNew from the right-click menu to create one.
4. Scroll to select the Normal Mode, Priority Mode or Unit Filtering tabs by using thehorizontal scroll bar. Set the filtering (Normal Mode, Priority Mode, and Unit Filtering).This dictates which alarms are sent to the eDB for storage.
5. Scroll to select the Alarm Historical Storage tab using the horizontal scroll bar in theAlarm Window (see Figure 3-3). Make the appropriate configuration changes.
6. You can save configuration changes after each tab is configured, or you can save allchanges after all of the tabs in a window have been configured. Select Apply to savechanges and leave the window open, or select Ok to save the changes and close thewindow.
7. The configuration changes you made will not take effect until they are downloaded tothe drop. Refer to “Configuring Your Ovation Operator Station” (listed in Table 1-3) forinformation on downloading changes to a drop.
Figure 3-3. Alarm Historical Storage Tab
3-10 eDB220-70
Emerson Process Management Proprietary Class 2C

3.7 Configuring an Alarm Event in a Windows Based Ovation System
Table 3-3 explains the setting options for the Alarm Historical Storage tab.
Table 3-3. Alarms for Historical Storage Tab
Item Description Setting Options
Send Alarms to the eDB Identifies whether alarmswill be sent to the eDB.
Send Alarm Message toeDBFalse (Default)True
Send First Pass Alarms tothe eDB
Identifies whether alarmswill be sent to the eDB onfirst pass. It is onlyapplicable if alarms will besent to the eDB.
Send Alarm Message to theeDB on the First PassFalseTrue (Default)
eDB Scanner Drop Name Select the Station wherethe scanner software isrunning. If this field is leftblank, then the messageswill be sent to the machinethat the alarms are runningon.
Choose from the Drop pull-down menu.
Figure 3-4. Normal Mode Filtering
3-11eDB220-70
Emerson Process Management Proprietary Class 2C

3.7 Configuring an Alarm Event in a Windows Based Ovation System
Table 3-4 explains the eDB setting options available in the Normal/Priority Mode Filteringtabs. For a complete explanation of these tabs, see “Configuring Your Ovation OperatorStation” (listed in Table 1-3).
Figure 3-5. Priority Mode Filtering
Table 3-4. Normal/Priority Mode Filtering
Item Description Setting Options
Normal/Priority ModeFiltering Priorities:
Shows the priority that analarm must have to be sent tothe eDB for normal and prioritymodes.
Valid Priorities“–” (wildcard) or“1–8” (“18” means that 1 and 8are used, “1478” = 1,4,7,8 etc.)
Normal eDB Priority “–” (Default)(Entry Field)
Normal eDB Priority“–” (Default)(Entry Field)
3-12 eDB220-70
Emerson Process Management Proprietary Class 2C
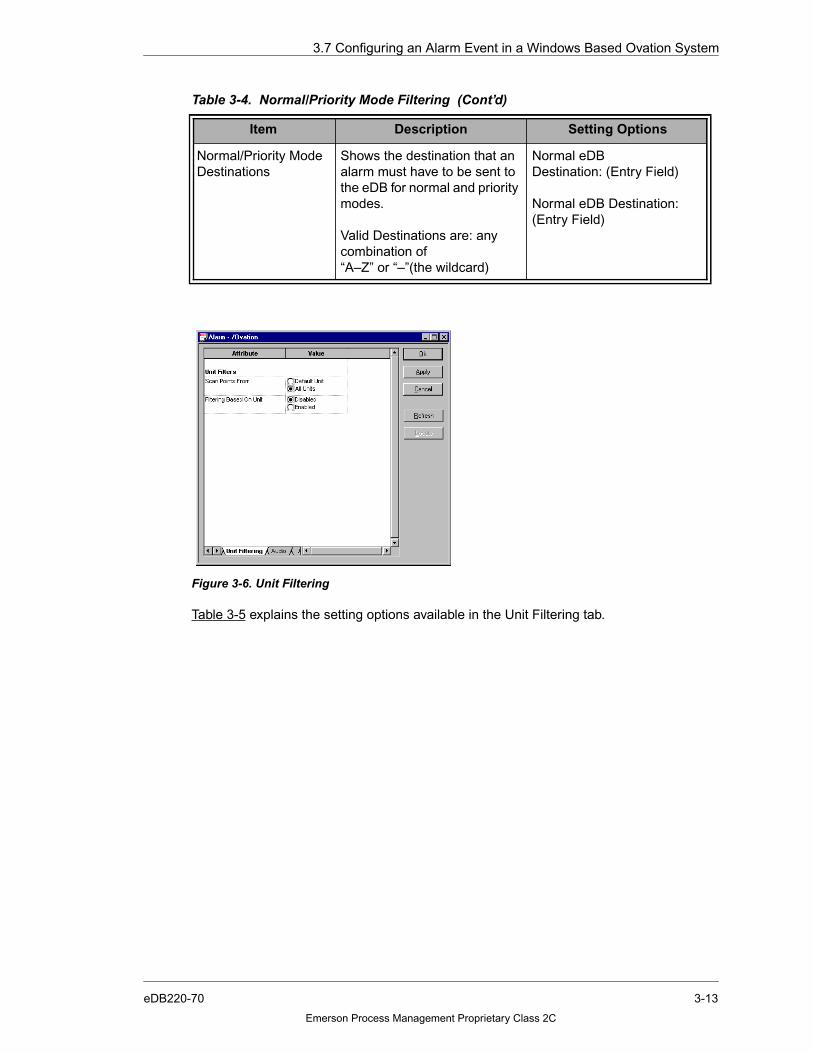
3.7 Configuring an Alarm Event in a Windows Based Ovation System
Table 3-5 explains the setting options available in the Unit Filtering tab.
Item Description Setting Options
Normal/Priority ModeDestinations
Shows the destination that analarm must have to be sent tothe eDB for normal and prioritymodes.
Valid Destinations are: anycombination of“A–Z” or “–”(the wildcard)
Normal eDBDestination: (Entry Field)
Normal eDB Destination:(Entry Field)
Figure 3-6. Unit Filtering
Table 3-4. Normal/Priority Mode Filtering (Cont’d)
3-13eDB220-70
Emerson Process Management Proprietary Class 2C
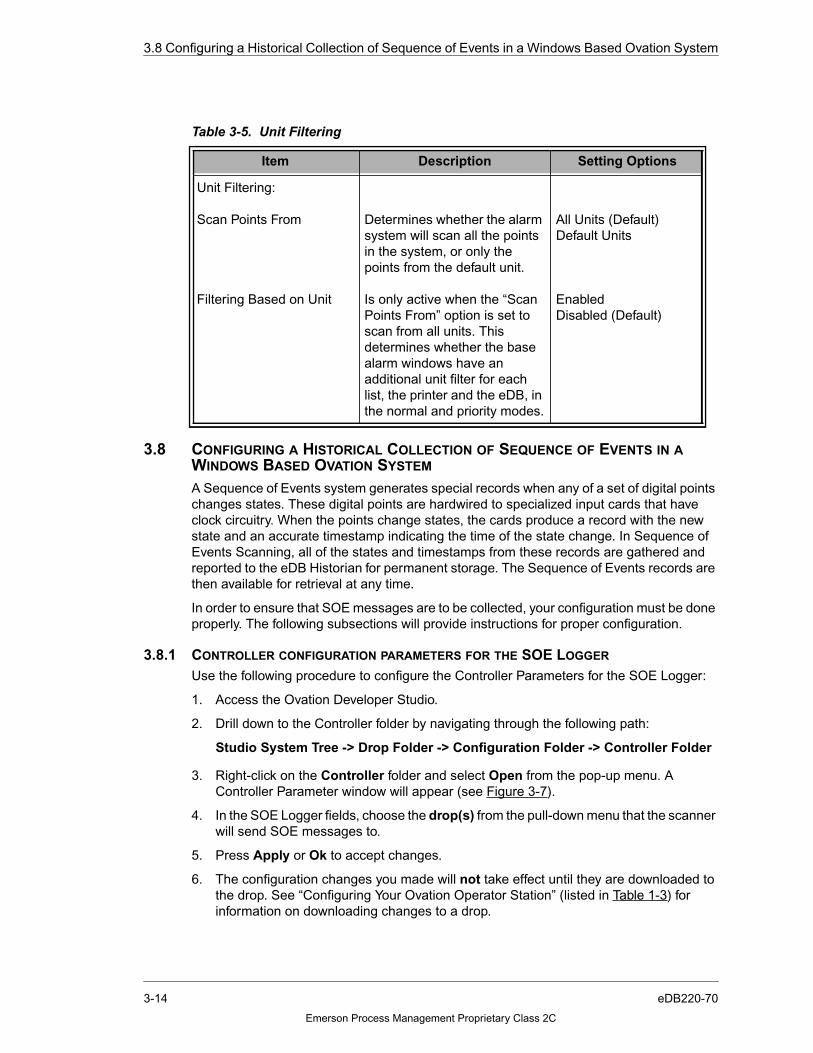
3.8 Configuring a Historical Collection of Sequence of Events in a Windows Based Ovation System
3.8 CONFIGURING A HISTORICAL COLLECTION OF SEQUENCE OF EVENTS IN AWINDOWS BASED OVATION SYSTEM
A Sequence of Events system generates special records when any of a set of digital pointschanges states. These digital points are hardwired to specialized input cards that haveclock circuitry. When the points change states, the cards produce a record with the newstate and an accurate timestamp indicating the time of the state change. In Sequence ofEvents Scanning, all of the states and timestamps from these records are gathered andreported to the eDB Historian for permanent storage. The Sequence of Events records arethen available for retrieval at any time.
In order to ensure that SOE messages are to be collected, your configuration must be doneproperly. The following subsections will provide instructions for proper configuration.
3.8.1 CONTROLLER CONFIGURATION PARAMETERS FOR THE SOE LOGGER
Use the following procedure to configure the Controller Parameters for the SOE Logger:
1. Access the Ovation Developer Studio.
2. Drill down to the Controller folder by navigating through the following path:
Studio System Tree -> Drop Folder -> Configuration Folder -> Controller Folder
3. Right-click on the Controller folder and select Open from the pop-up menu. AController Parameter window will appear (see Figure 3-7).
4. In the SOE Logger fields, choose the drop(s) from the pull-down menu that the scannerwill send SOE messages to.
5. Press Apply or Ok to accept changes.
6. The configuration changes you made will not take effect until they are downloaded tothe drop. See “Configuring Your Ovation Operator Station” (listed in Table 1-3) forinformation on downloading changes to a drop.
Table 3-5. Unit Filtering
Item Description Setting Options
Unit Filtering:
Scan Points From
Filtering Based on Unit
Determines whether the alarmsystem will scan all the pointsin the system, or only thepoints from the default unit.
Is only active when the “ScanPoints From” option is set toscan from all units. Thisdetermines whether the basealarm windows have anadditional unit filter for eachlist, the printer and the eDB, inthe normal and priority modes.
All Units (Default)Default Units
EnabledDisabled (Default)
3-14 eDB220-70
Emerson Process Management Proprietary Class 2C

3.8 Configuring a Historical Collection of Sequence of Events in a Windows Based Ovation System
Table 3-6 explains the fields in the Controller Parameters tab. For additional informationabout the Controller, refer to “Ovation Controller User Guide” (listed in Table 1-3).
Figure 3-7. Controller Parameter
Table 3-6. Controller Parameters
Tab Field Description
ControllerParameters
System Memory This radio button selects thesize of the Controllerconfiguration including RAMand Flash:Normal: requires a minimum16 MB of RAM and 10 MBFlash.Expanded: requires aminimum 32 MB of RAM and20 MB Flash.
3-15eDB220-70
Emerson Process Management Proprietary Class 2C

3.8 Configuring a Historical Collection of Sequence of Events in a Windows Based Ovation System
Tab Field Description
ControllerParameters(Cont’d)
Send Messages To Selects Workstation dropwhere Controller messages(error and informational) will besent.Default = None
SOE Logger 1 Selects the first ScannerWorkstation drop where SOEmessages will be sent.Default = None
SOE Logger 2 Selects the second ScannerWorkstation drop where SOEmessages will be sent.Default = None
Save Variables @Interval (min.)
Text entry field which indicatesthe time period (in minutes)that variable point values willbe saved. The saved value isthen used as the initial value ofthe point on restarts. Refer to“Ovation Developer StudioUser Guide” (listed in Table 1-3) for information on specifyinga point as a save variable point.Drop specific value
TimeKeeper Selects the device that willsynchronize time for theController:DefaultOneTwoThree
If Default is selected, thesoftware selects one of theIOIC cards (PCQL, PCRL, orPCRR).
Note:All SOE modules in aController must be connectedto the IOIC card that isconfigured as the Time Keeper.
Table 3-6. Controller Parameters (Cont’d)
3-16 eDB220-70
Emerson Process Management Proprietary Class 2C
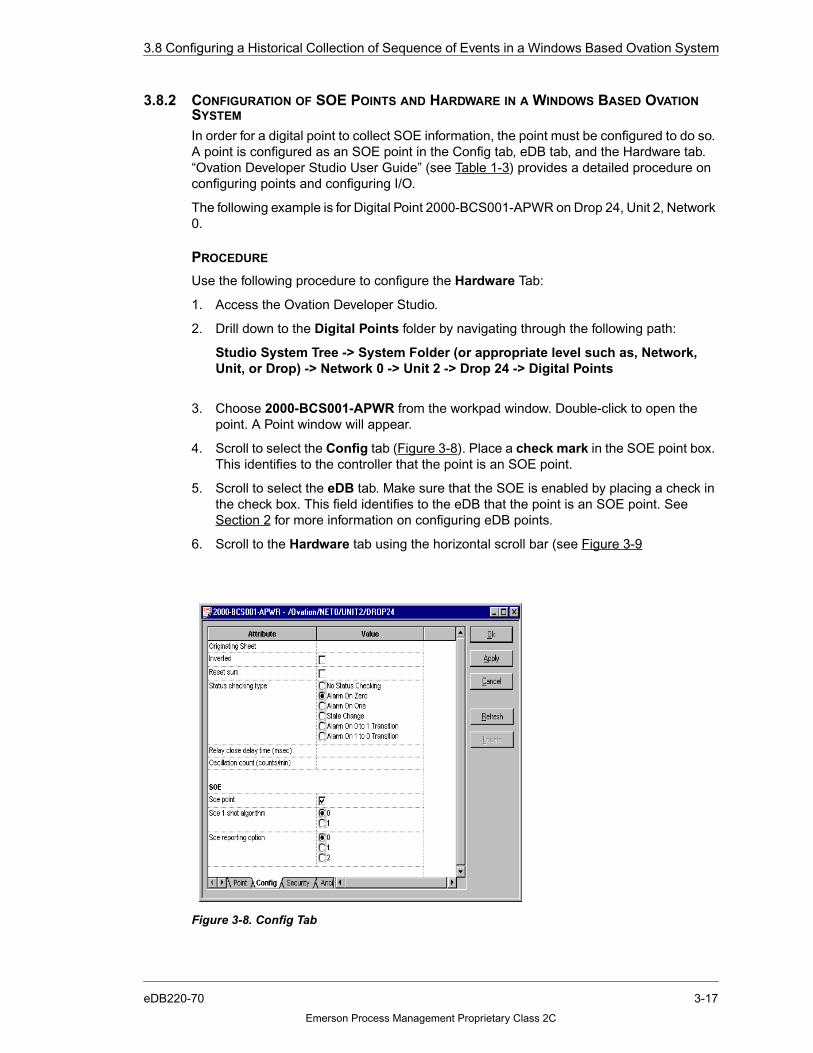
3.8 Configuring a Historical Collection of Sequence of Events in a Windows Based Ovation System
3.8.2 CONFIGURATION OF SOE POINTS AND HARDWARE IN A WINDOWS BASED OVATIONSYSTEM
In order for a digital point to collect SOE information, the point must be configured to do so.A point is configured as an SOE point in the Config tab, eDB tab, and the Hardware tab.“Ovation Developer Studio User Guide” (see Table 1-3) provides a detailed procedure onconfiguring points and configuring I/O.
The following example is for Digital Point 2000-BCS001-APWR on Drop 24, Unit 2, Network0.
PROCEDURE
Use the following procedure to configure the Hardware Tab:
1. Access the Ovation Developer Studio.
2. Drill down to the Digital Points folder by navigating through the following path:
Studio System Tree -> System Folder (or appropriate level such as, Network,Unit, or Drop) -> Network 0 -> Unit 2 -> Drop 24 -> Digital Points
3. Choose 2000-BCS001-APWR from the workpad window. Double-click to open thepoint. A Point window will appear.
4. Scroll to select the Config tab (Figure 3-8). Place a check mark in the SOE point box.This identifies to the controller that the point is an SOE point.
5. Scroll to select the eDB tab. Make sure that the SOE is enabled by placing a check inthe check box. This field identifies to the eDB that the point is an SOE point. SeeSection 2 for more information on configuring eDB points.
6. Scroll to the Hardware tab using the horizontal scroll bar (see Figure 3-9
Figure 3-8. Config Tab
3-17eDB220-70
Emerson Process Management Proprietary Class 2C
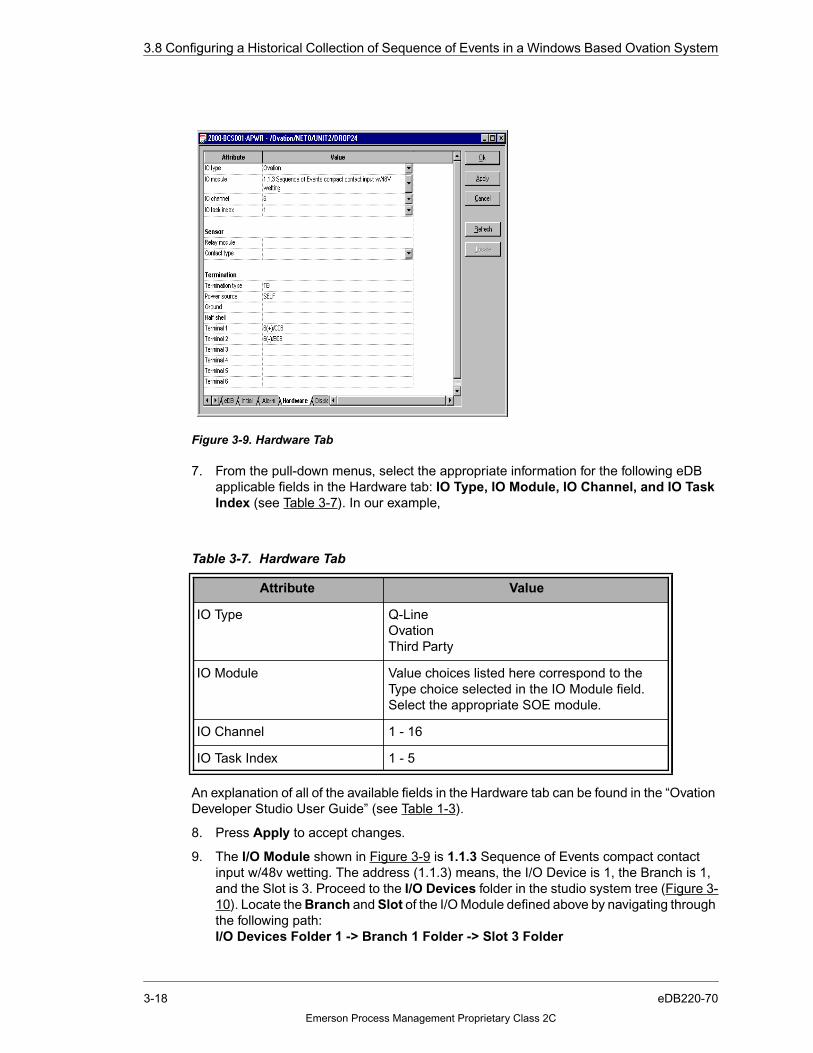
3.8 Configuring a Historical Collection of Sequence of Events in a Windows Based Ovation System
7. From the pull-down menus, select the appropriate information for the following eDBapplicable fields in the Hardware tab: IO Type, IO Module, IO Channel, and IO TaskIndex (see Table 3-7). In our example,
An explanation of all of the available fields in the Hardware tab can be found in the “OvationDeveloper Studio User Guide” (see Table 1-3).
8. Press Apply to accept changes.
9. The I/O Module shown in Figure 3-9 is 1.1.3 Sequence of Events compact contactinput w/48v wetting. The address (1.1.3) means, the I/O Device is 1, the Branch is 1,and the Slot is 3. Proceed to the I/O Devices folder in the studio system tree (Figure 3-10). Locate the Branch and Slot of the I/O Module defined above by navigating throughthe following path:I/O Devices Folder 1 -> Branch 1 Folder -> Slot 3 Folder
Figure 3-9. Hardware Tab
Table 3-7. Hardware Tab
Attribute Value
IO Type Q-LineOvationThird Party
IO Module Value choices listed here correspond to theType choice selected in the IO Module field.Select the appropriate SOE module.
IO Channel 1 - 16
IO Task Index 1 - 5
3-18 eDB220-70
Emerson Process Management Proprietary Class 2C
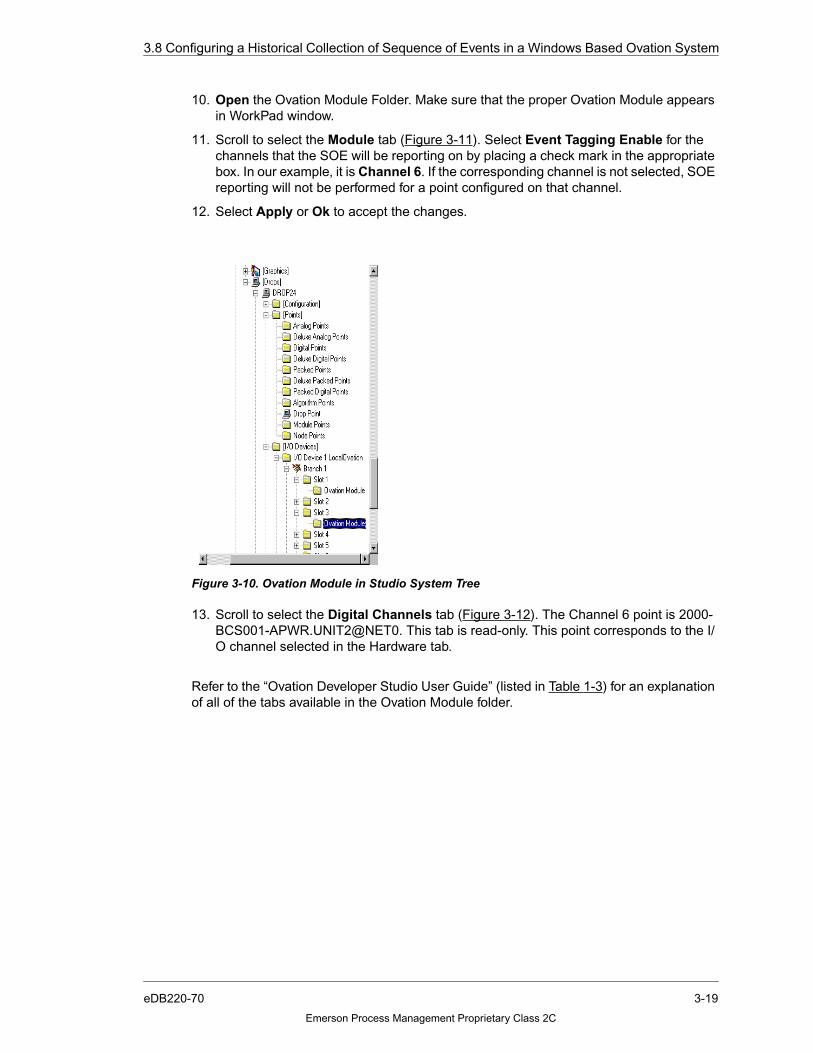
3.8 Configuring a Historical Collection of Sequence of Events in a Windows Based Ovation System
10. Open the Ovation Module Folder. Make sure that the proper Ovation Module appearsin WorkPad window.
11. Scroll to select the Module tab (Figure 3-11). Select Event Tagging Enable for thechannels that the SOE will be reporting on by placing a check mark in the appropriatebox. In our example, it is Channel 6. If the corresponding channel is not selected, SOEreporting will not be performed for a point configured on that channel.
12. Select Apply or Ok to accept the changes.
13. Scroll to select the Digital Channels tab (Figure 3-12). The Channel 6 point is 2000-BCS001-APWR.UNIT2@NET0. This tab is read-only. This point corresponds to the I/O channel selected in the Hardware tab.
Refer to the “Ovation Developer Studio User Guide” (listed in Table 1-3) for an explanationof all of the tabs available in the Ovation Module folder.
Figure 3-10. Ovation Module in Studio System Tree
3-19eDB220-70
Emerson Process Management Proprietary Class 2C

3.8 Configuring a Historical Collection of Sequence of Events in a Windows Based Ovation System
14. The configuration changes you made will not take effect until they are loaded to thedrop. Refer to the “Ovation Developer Studio User Guide” (listed in Table 1-3) forinformation on loading a drop.
Figure 3-11. Module Tab
Figure 3-12. Digital Channels
3-20 eDB220-70
Emerson Process Management Proprietary Class 2C
SECTION 4. COMMON USER INTERFACE FEATURES FORDATA RETRIEVAL
4.1 SECTION OVERVIEW
Data can be retrieved from the eDB Historian in many ways. The following sectionsdescribe the common dialog boxes that are seen when retrieving data from the followingeDB functions:
■ Historian Excel Add-In
■ Historical Review
■ Historical Trend
■ Reporting
4.2 COMMON USER INTERFACES
The following interfaces are used in many eDB functions:
■ Browse and Select Point(s) Window (see Section 4.2.1)
Note:
Wildcard symbols % and * can be used in the dialogs for name/descriptionfiltering.
■ Absolute and Relative Date/Time Window (see Section 4.2.2)
4.2.1 BROWSE AND SELECT POINT(S) WINDOW
The Browse and Select Point(s) window (Figure 4-1) appears when the Browse button ischosen from the eDB function dialogs listed in Section 4.1.
4-1eDB220-70
Emerson Process Management Proprietary Class 2C
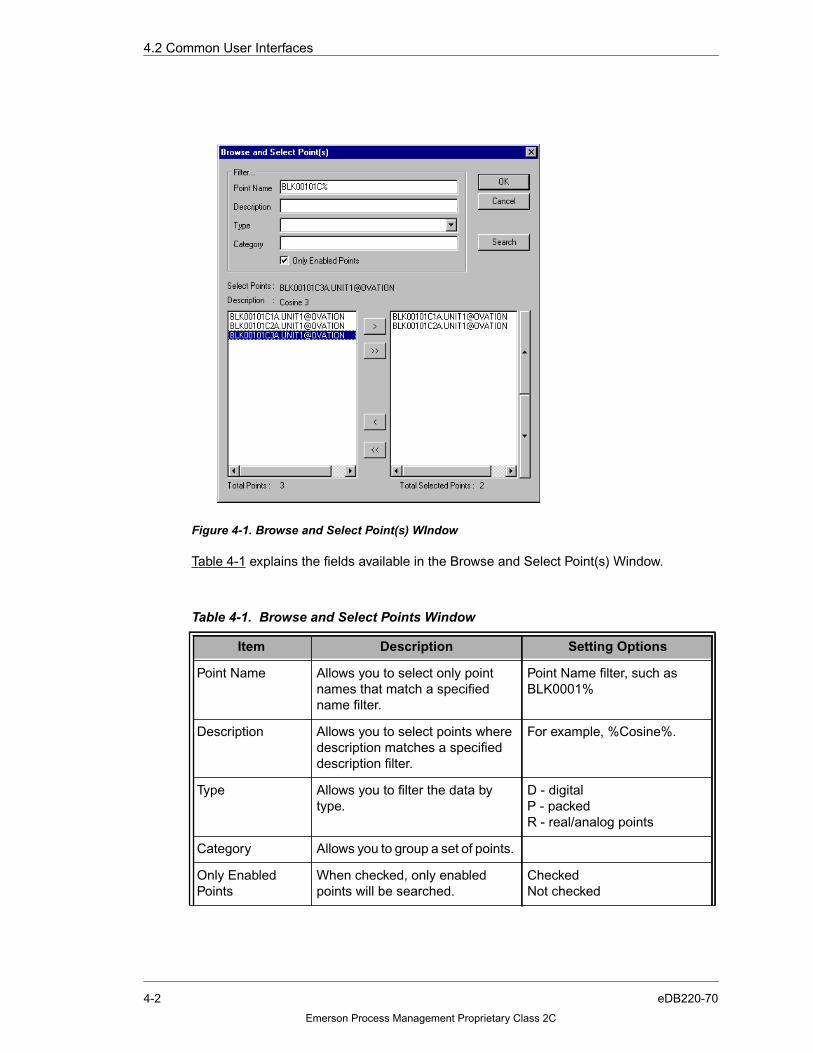
4.2 Common User Interfaces
Table 4-1 explains the fields available in the Browse and Select Point(s) Window.
Figure 4-1. Browse and Select Point(s) WIndow
Table 4-1. Browse and Select Points Window
Item Description Setting Options
Point Name Allows you to select only pointnames that match a specifiedname filter.
Point Name filter, such asBLK0001%
Description Allows you to select points wheredescription matches a specifieddescription filter.
For example, %Cosine%.
Type Allows you to filter the data bytype.
D - digitalP - packedR - real/analog points
Category Allows you to group a set of points.
Only EnabledPoints
When checked, only enabledpoints will be searched.
CheckedNot checked
4-2 eDB220-70
Emerson Process Management Proprietary Class 2C
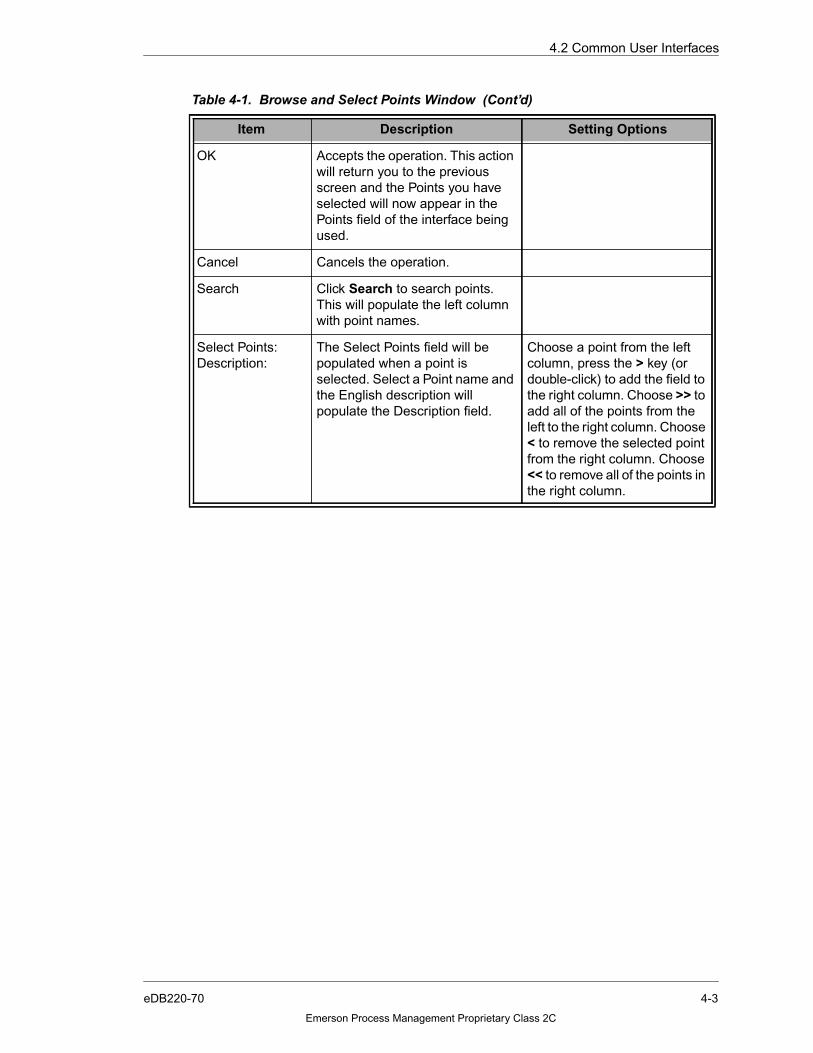
4.2 Common User Interfaces
OK Accepts the operation. This actionwill return you to the previousscreen and the Points you haveselected will now appear in thePoints field of the interface beingused.
Cancel Cancels the operation.
Search Click Search to search points.This will populate the left columnwith point names.
Select Points:Description:
The Select Points field will bepopulated when a point isselected. Select a Point name andthe English description willpopulate the Description field.
Choose a point from the leftcolumn, press the > key (ordouble-click) to add the field tothe right column. Choose >> toadd all of the points from theleft to the right column. Choose< to remove the selected pointfrom the right column. Choose<< to remove all of the points inthe right column.
Table 4-1. Browse and Select Points Window (Cont’d)
Item Description Setting Options
4-3eDB220-70
Emerson Process Management Proprietary Class 2C

4.2 Common User Interfaces
4.2.2 ABSOLUTE OR RELATIVE DATE/TIME
Common dialogs are provided in all retrievals for specifying start and end times. Times maybe specified in Absolute or Relative format.
The A and R buttons allow you to select your time in Absolute or Relative format. The downarrow button produces a calendar from which you can also choose your start and end times(see Figure 4-2).
The Relative Date/Time Window appears when the .. button is selected from the Start Timeand End Time fields (see Figure 4-3).
Figure 4-2. Get Exception Data Window with A, R, .., and Calendar Shown
4-4 eDB220-70
Emerson Process Management Proprietary Class 2C

4.2 Common User Interfaces
Table 4-2 explains the setting options available in the Relative Date/Time Window.
Figure 4-3. Relative Date/TIme Window
Table 4-2. Relative Date/Time Window
Item Description
Current Time (c) Current time will be used as selected start orend time.
Current Hour (ch) Beginning of current hour.
Today 00:00:00 (td) Midnight of today.
Yesterday 00:00:00 (yd) Midnight of yesterday.
Last Sunday 00:00:00 (su) Midnight of last Sunday.
Last Monday 00:00:00 (mo) Midnight of last Monday.
Last Tuesday 00:00:00 (tu) Midnight of last Tuesday.
Last Wednesday 00:00:00 (we) Midnight of last Wednesday.
Last Thursday 00:00:00 (th) Midnight of last Thursday.
Last Friday 00:00:00 (fr) Midnight of last Friday.
Last Saturday 00:00:00 (sa) Midnight of last Saturday.
Hours:Minutes:Seconds Enter the offset from the selected time indicator,such as 1 hr 15 mins before current time.
Relative Time Displays the relative time string that is created.
OK Accepts the changes.
Cancel Cancels the operation.
4-5eDB220-70
Emerson Process Management Proprietary Class 2C


SECTION 5. HISTORICAL TRENDS IN AN OVATION SYSTEM
5.1 SECTION OVERVIEW
The Historical Trend feature extracts historical data from the eDB Historian to displaygraphical and numerical trends.
The Historical Trend capability allows the user to display up to eight points in severaldifferent graphical layouts and up to 600 values per point in a tabular trend. Creating,building, and displaying trends is discussed in detail in “Ovation Operator Station UserGuide” (listed in Table 1-3). Historian configuration is discussed in detail in “ConfiguringYour Ovation Operator Station User Guide” (listed in Table 1-3).
■ Points in a trend can be determined by the user or by pre-determined trend groups. See“Ovation Developer Studio User Guide” (listed in Table 1-3) for more information onTrend Groups.
■ Points can have temporary high or low scales applied, as well as logarithmic or linearscales.
■ Trend displays show the point names and values, high and low scales, as well asengineering unit information.
■ An unlimited number of Historical Trend Display windows can be displayed at one time.However, only one trend can be active at a time.
■ The Historical Trend Display window also provides access to trends using live data(only for an Ovation system, not on a stand alone system). For information on livetrends, see “Ovation Operator Station User Guide” (listed in Table 1-3).
5-1eDB220-70
Emerson Process Management Proprietary Class 2C

5.2 Accessing the Trend Display Window
5.2 ACCESSING THE TREND DISPLAY WINDOW
The Trend Display window is accessed from the Ovation Applications folder at theOperator Station. Refer to “Ovation Operator Station User Guide” (see Table 1-3) for moreinformation on the trend display. Use the following procedure to access this window. Openthe Ovation Applications folder at the Operator Station.
1. Click on the Trend icon.
2. The Trend Display window appears, as shown in Figure 5-2.
3. Select the Trend pull-down menu and choose Properties. A Trend Properties dialogbox appears (see Figure 5-3).
4. Select HSR from the source pull-down menu to display a historical trend. For furtherinformation on Live trends, see “Ovation Developer Studio User Guide” (listed in Table1-3).
Figure 5-1. Trend Icon
Figure 5-2. Trend Display Window
5-2 eDB220-70
Emerson Process Management Proprietary Class 2C

5.2 Accessing the Trend Display Window
Table 5-1 explains the setting options available in the Trend Properties dialog box.
Figure 5-3. Trend Properties
Table 5-1. Trend Properties
Item Description Setting Options
Data
Source Live or Historical data. Live or HSR
Time
Duration Duration is the total time of thetrend. This field is onlyapplicable if the range selectedis Start Time/Duration or EndTime/Duration.
Pull-down menu. The choices are:10 min30 min100 min5 hr10 hr30 hr100 hrs200 hrs25 days33.3 days
5-3eDB220-70
Emerson Process Management Proprietary Class 2C
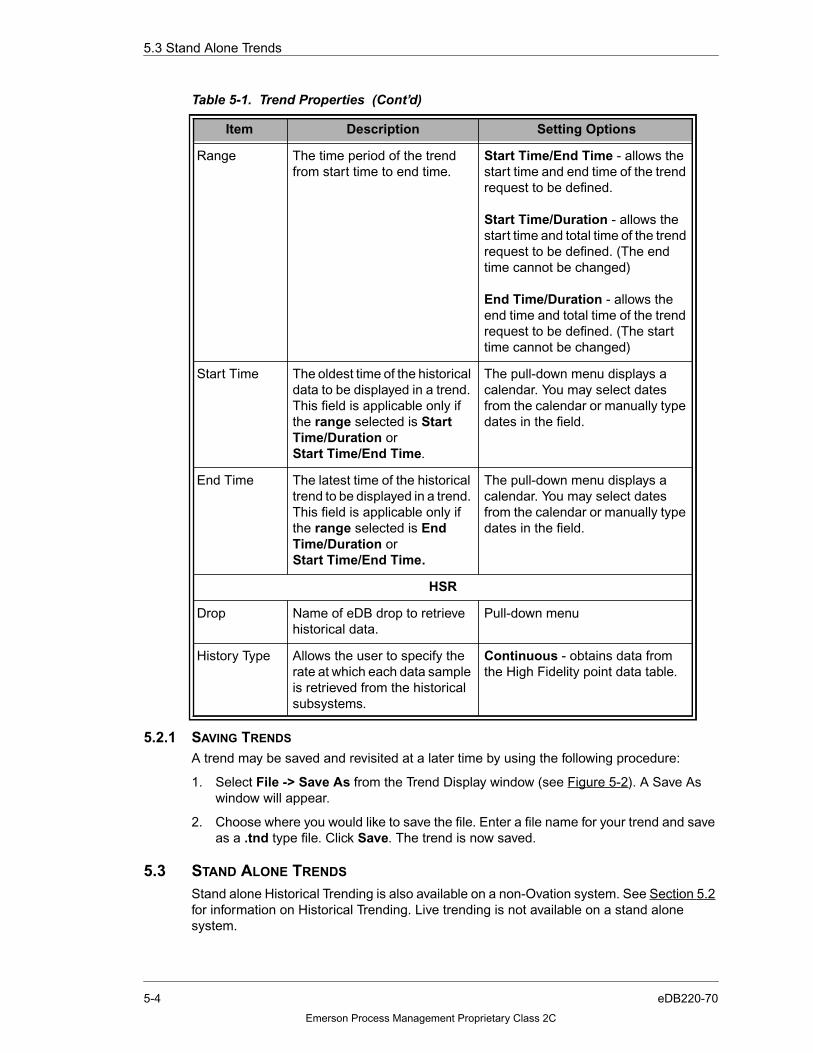
5.3 Stand Alone Trends
5.2.1 SAVING TRENDS
A trend may be saved and revisited at a later time by using the following procedure:
1. Select File -> Save As from the Trend Display window (see Figure 5-2). A Save Aswindow will appear.
2. Choose where you would like to save the file. Enter a file name for your trend and saveas a .tnd type file. Click Save. The trend is now saved.
5.3 STAND ALONE TRENDS
Stand alone Historical Trending is also available on a non-Ovation system. See Section 5.2for information on Historical Trending. Live trending is not available on a stand alonesystem.
Range The time period of the trendfrom start time to end time.
Start Time/End Time - allows thestart time and end time of the trendrequest to be defined.
Start Time/Duration - allows thestart time and total time of the trendrequest to be defined. (The endtime cannot be changed)
End Time/Duration - allows theend time and total time of the trendrequest to be defined. (The starttime cannot be changed)
Start Time The oldest time of the historicaldata to be displayed in a trend.This field is applicable only ifthe range selected is StartTime/Duration orStart Time/End Time.
The pull-down menu displays acalendar. You may select datesfrom the calendar or manually typedates in the field.
End Time The latest time of the historicaltrend to be displayed in a trend.This field is applicable only ifthe range selected is EndTime/Duration orStart Time/End Time.
The pull-down menu displays acalendar. You may select datesfrom the calendar or manually typedates in the field.
HSR
Drop Name of eDB drop to retrievehistorical data.
Pull-down menu
History Type Allows the user to specify therate at which each data sampleis retrieved from the historicalsubsystems.
Continuous - obtains data fromthe High Fidelity point data table.
Table 5-1. Trend Properties (Cont’d)
Item Description Setting Options
5-4 eDB220-70
Emerson Process Management Proprietary Class 2C

5.4 Point Groups
5.4 POINT GROUPS
Point Groups are various points grouped together for monitoring and trending purposes.Point Groups are added through the Ovation Developer Studio.
The Point Group folder is located under the System folder in the System Tree of the OvationDeveloper Studio. By creating Point Groups at the System level, they will be distributed toall the system drops. For information on adding Point Groups to a system, see “OvationDeveloper Studio User Guide” (listed in Table 1-3).
There are two types of Point Groups: Trend Point Groups and PDS Point Groups. TrendPoint Groups associate a commonly used set of points and track them over time and will beexplained in this section. PDS Point Groups are explained in “Ovation Developer StudioUser Guide” (listed in Table 1-3).
Accessing the Point Groups Folder
1. Launch Ovation Developer Studio.
2. Open the System folder and locate the Point Groups folder (see Figure 5-4).
3. Open the Point Groups folder to reveal two subfolders: Trend Point Groups and PDSPoint Groups.
Figure 5-4. Point Groups Folder
5-5eDB220-70
Emerson Process Management Proprietary Class 2C

5.4 Point Groups
5.4.1 ADDING A TREND POINT GROUP
1. Access the Ovation Developer Studio and in the System folder, open the Point Groupsfolder.
2. Right click the Trend Point Groups folder and select Insert New. The Insert New TrendPoint Group Wizard appears, as shown in Figure 5-5.
3. Enter the trend group name in the Group Name field, using up to 30 characters.
4. Enter a group number (to define the group) in the Group Number field. The GroupNumber is used to identify group information. A maximum of 5,000 groups can bedefined.
If a group number is outside the range of 1 to 5,000, a warning box appears and thegroup is not added.
If the group number currently exists, a warning box will appear when you try to add thepoint to the database.
Figure 5-5. Insert New Trend Point Groups Wizard
5-6 eDB220-70
Emerson Process Management Proprietary Class 2C

5.4 Point Groups
5. Select Finish and the New Trend Point Groups dialog box appears, as shown inFigure 5-6.
6. Enter the title of the trend group in the Group Title field.
7. Pull down the Grid menu to enable or disable grid lines on the trend graph.
8. Complete the remaining fields.
Table 5-2 explains the Historical Trend fields available in the Historical New Trend PointGroups dialog box.
Figure 5-6. The New Trend Point Group Dialog Box
Table 5-2. Historical New Trend Point Groups Fields
Item Description Setting Options
Group Number Automatically entered as definedin the New Trend Point GroupWizard dialog box.
See Figure 5-5.
Group Title The title is only a description of thepoint group and is not required.
Entry field, using up to 30characters.
Grid Enables or disables the grid lineson the trend graph.
Enable or Disable
5-7eDB220-70
Emerson Process Management Proprietary Class 2C

5.4 Point Groups
Live TrendDuration
The unit of trend measurement. Allpoints in a single window use thesame collection interval.
Pull-down menu. The choicesare:10 minutes30 minutes100 minutes5 hours10 hours30 hours100 hours200 hours2-5 days33.3 days
Historical Type Allows the user to specify whichtype of point data to retrieve, highfidelity, or aggregate
Continuous - obtains datafrom the high fidelity table.Aggregate - obtain data fromhigh fidelity table (future)
Range The time range format of ahistorical request.
Start/Interval - allows the starttime and processing period ofthe trend request to be defined.(The end time can not bechanged). When selected, theHistorical Period field isgrayed-out.
Start/Period - allows thedefinitive start time to bedefined. When selected,Historical Interval/ Units andHistorical Interval/Valuefields are grayed-out.
Historical Period Allows the user to specify thelength of the historical trend. Thisfield is grayed-out if the Start/Interval field is selected.
Entry field.
Historical Interval(value)
Allows the user to specify thespacing between the historicaltrend. An Integer input plus theHistorical Interval (units) fieldmakes a complete interval.
Numerical entry field.
Historical Interval(units)
Allows the user to interpret theinterval specified above.
Pull-down menu.Minutes, Hours, or Days
Historical StartTime Offset(value)
The Start Time Offset specifiesthe relative start time offset fromthe current time of the historicalinterval.
Numerical entry field
Table 5-2. Historical New Trend Point Groups Fields (Cont’d)
Item Description Setting Options
5-8 eDB220-70
Emerson Process Management Proprietary Class 2C
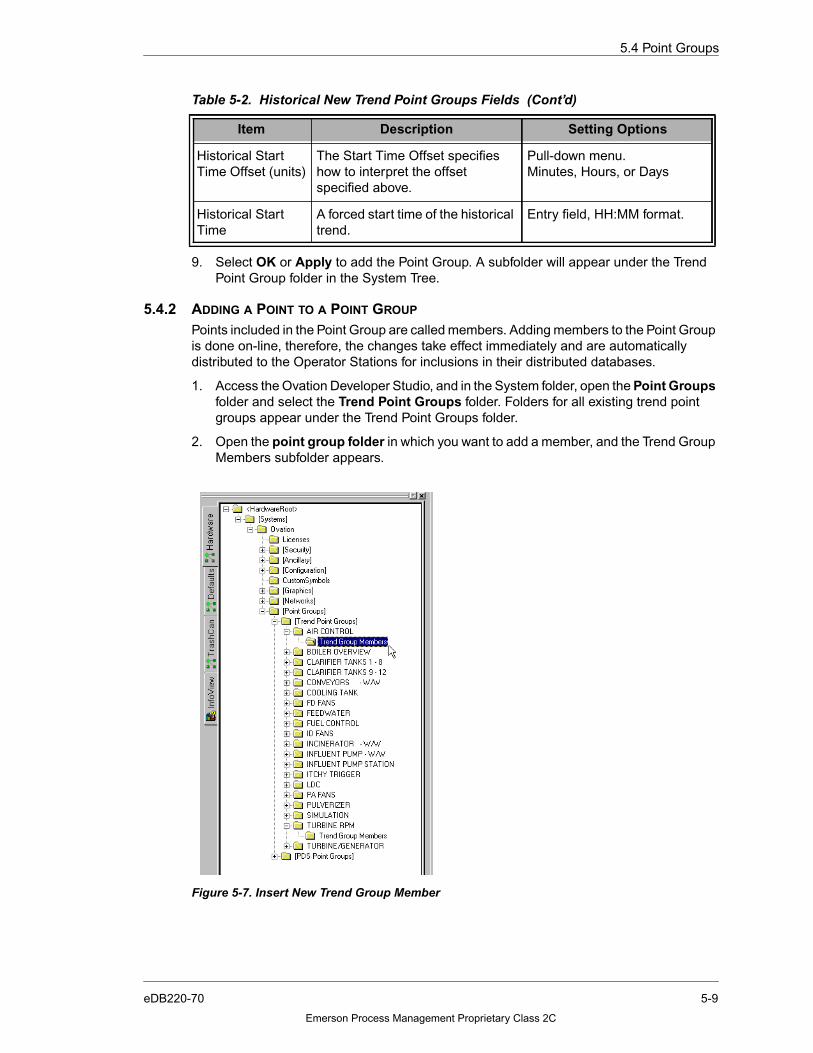
5.4 Point Groups
9. Select OK or Apply to add the Point Group. A subfolder will appear under the TrendPoint Group folder in the System Tree.
5.4.2 ADDING A POINT TO A POINT GROUP
Points included in the Point Group are called members. Adding members to the Point Groupis done on-line, therefore, the changes take effect immediately and are automaticallydistributed to the Operator Stations for inclusions in their distributed databases.
1. Access the Ovation Developer Studio, and in the System folder, open the Point Groupsfolder and select the Trend Point Groups folder. Folders for all existing trend pointgroups appear under the Trend Point Groups folder.
2. Open the point group folder in which you want to add a member, and the Trend GroupMembers subfolder appears.
Historical StartTime Offset (units)
The Start Time Offset specifieshow to interpret the offsetspecified above.
Pull-down menu.Minutes, Hours, or Days
Historical StartTime
A forced start time of the historicaltrend.
Entry field, HH:MM format.
Figure 5-7. Insert New Trend Group Member
Table 5-2. Historical New Trend Point Groups Fields (Cont’d)
Item Description Setting Options
5-9eDB220-70
Emerson Process Management Proprietary Class 2C

5.4 Point Groups
3. Right click the Trend Point Groups and select Insert New. The Insert New TrendGroup Members Wizard appears, as shown in Figure 5-8.
4. Enter the name of the point that will be added to the Trend Group in the Point Nameentry field.
5. Use the pull-down menu to select a Rank.
6. Select Finish and the New Trend Group Members dialog box appears, as shown inFigure 5-9. Information added to the Insert New Trend Group Members Wizard nowappears in the Config tab.
7. Complete the remaining fields. Table 5-3 explains the fields in the New Trend GroupMember dialog box.
Figure 5-8. Insert New Trend Group Members Wizard
Figure 5-9. New Trend Group Member Dialog Box
5-10 eDB220-70
Emerson Process Management Proprietary Class 2C
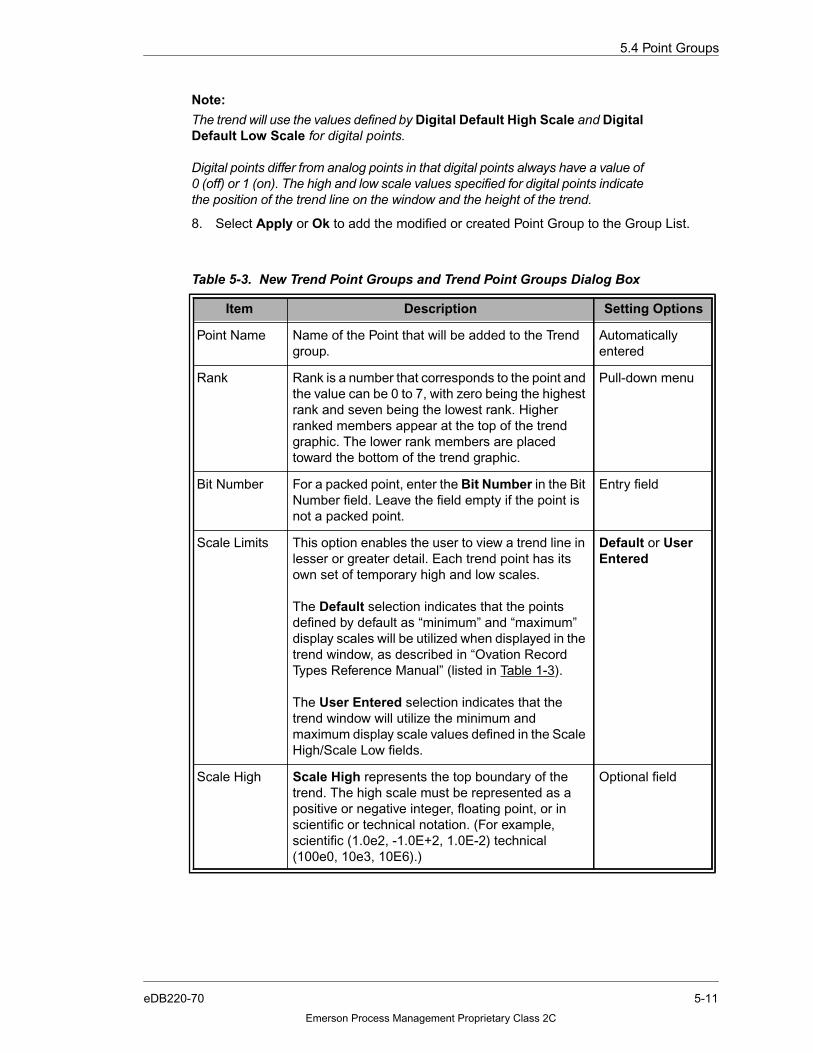
5.4 Point Groups
Note:
The trend will use the values defined by Digital Default High Scale and DigitalDefault Low Scale for digital points.
Digital points differ from analog points in that digital points always have a value of0 (off) or 1 (on). The high and low scale values specified for digital points indicatethe position of the trend line on the window and the height of the trend.
8. Select Apply or Ok to add the modified or created Point Group to the Group List.
Table 5-3. New Trend Point Groups and Trend Point Groups Dialog Box
Item Description Setting Options
Point Name Name of the Point that will be added to the Trendgroup.
Automaticallyentered
Rank Rank is a number that corresponds to the point andthe value can be 0 to 7, with zero being the highestrank and seven being the lowest rank. Higherranked members appear at the top of the trendgraphic. The lower rank members are placedtoward the bottom of the trend graphic.
Pull-down menu
Bit Number For a packed point, enter the Bit Number in the BitNumber field. Leave the field empty if the point isnot a packed point.
Entry field
Scale Limits This option enables the user to view a trend line inlesser or greater detail. Each trend point has itsown set of temporary high and low scales.
The Default selection indicates that the pointsdefined by default as “minimum” and “maximum”display scales will be utilized when displayed in thetrend window, as described in “Ovation RecordTypes Reference Manual” (listed in Table 1-3).
The User Entered selection indicates that thetrend window will utilize the minimum andmaximum display scale values defined in the ScaleHigh/Scale Low fields.
Default or UserEntered
Scale High Scale High represents the top boundary of thetrend. The high scale must be represented as apositive or negative integer, floating point, or inscientific or technical notation. (For example,scientific (1.0e2, -1.0E+2, 1.0E-2) technical(100e0, 10e3, 10E6).)
Optional field
5-11eDB220-70
Emerson Process Management Proprietary Class 2C

5.4 Point Groups
Scale Low Scale Low represents the bottom boundary of thetrend. The low scale must be represented as apositive or negative integer, floating point, or inscientific or technical notation. (For example,scientific (1.0e2, -1.0E+2, 1.0E-2) technical(100e0, 10e3, 10E6).)
Optional field
Transient Selecting Yes causes the second digital averagevalue (0 or 1) of any 3 same consecutive values inthe trend data, to be changed to the opposite state,if the second digital average value was not in thesame state for its entire processing period.
The transient option does not show true data, andis meant to bring out digital state changes thatwould otherwise remain hidden on trends of digitalpoints for processing periods greater than 1second.
A trend around the time of the digital activityshould be performed, with the processing perioddecreased and the transient option disabled toshow the true digital states. (This option isapplicable only when the processing type isAverage Value.)
Yes or No
Summary Pull down the Summary menu. Select Yes toinclude a summary section or No to exclude asummary section. The summary consists of datafor each point, such as averages, maximums, andminimums.
Yes or No
Table 5-3. New Trend Point Groups and Trend Point Groups Dialog Box (Cont’d)
Item Description Setting Options
5-12 eDB220-70
Emerson Process Management Proprietary Class 2C

5.4 Point Groups
ProcessingType
Defines what will be displayed for the specifiedprocess point for each individual processingperiod. Pull down the Processing Type menu, andselect an applicable type.
The available types are:Actual Value - displays the point at the end of eachprocessing periodAverage - displays the average value of the pointover each individual processing period.Integration - displays the integral of the point withrespect to seconds, multiplied by the specifiedintegration constant, over each processing period.Minimum Value - displays the minimum value ofthe process point over each processing period.Maximum Value - displays the maximum value ofthe specified point over each processing period.Time Set Mins - displays the number of minuteswhich the digital point, or selected bit of a packedprocess point, spent in the Set state over eachprocessing period.Time Reset Mins - displays the number of minuteswhich the digital point, or selected bit of a packedprocess point, spent in the Reset state over eachprocessing period.Time Set Hours - displays the number of hourswhich the digital point, or selected bit of a packedprocess point, spent in the Set state over eachprocessing period.Time Reset Hours - displays the number of hourswhich the digital point, or selected bit of a packedprocess point, spent in the Reset state over eachprocessing period.Toggle - displays the number of state changes forthe specified digital point, or selected bit of apacked process point, which occurred over eachprocessing period.Toggle Set - displays the number of state changesto the Set state for the digital point, or selected bitof a packed process point, which occurred overeach processing period.Toggle Reset - displays the number of statechanges to the Reset state for the digital point, orselected bit of a packed process point, whichoccurred over each processing period.Unpacked Bit Value - displays a selected bit of thepoint at the end of each processing period.
Pull-down menu
Table 5-3. New Trend Point Groups and Trend Point Groups Dialog Box (Cont’d)
Item Description Setting Options
5-13eDB220-70
Emerson Process Management Proprietary Class 2C

5.4 Point Groups
5.4.3 MODIFYING A POINT TREND GROUP
Point Trend Groups can be modified at the group level and the member level.
PROCEDURES FOR MODIFYING THE POINT TREND GROUP AT THE GROUP LEVEL.
1. Access the Ovation Developer Studio, and in the System folder, open the Point Groupfolder and select the Trend Point Groups folder. Folders for all existing trend pointgroups appear under the Trend Point Groups folder.
2. Right click the trend points group folder that you wish to modify and select Open. TheTrend Point Group dialog box appears as shown in Figure 5-10.
3. Make necessary changes and select Ok.
Table 5-3 explains the setting options available in the Trend Point Group dialog box.
IntegrationValue
Enter the integration constant in the IntegrationValue field. This field is only applicable when theprocessing type is Integration.
Integer value
Figure 5-10. The Trend Point Group Dialog Box
Table 5-3. New Trend Point Groups and Trend Point Groups Dialog Box (Cont’d)
Item Description Setting Options
5-14 eDB220-70
Emerson Process Management Proprietary Class 2C
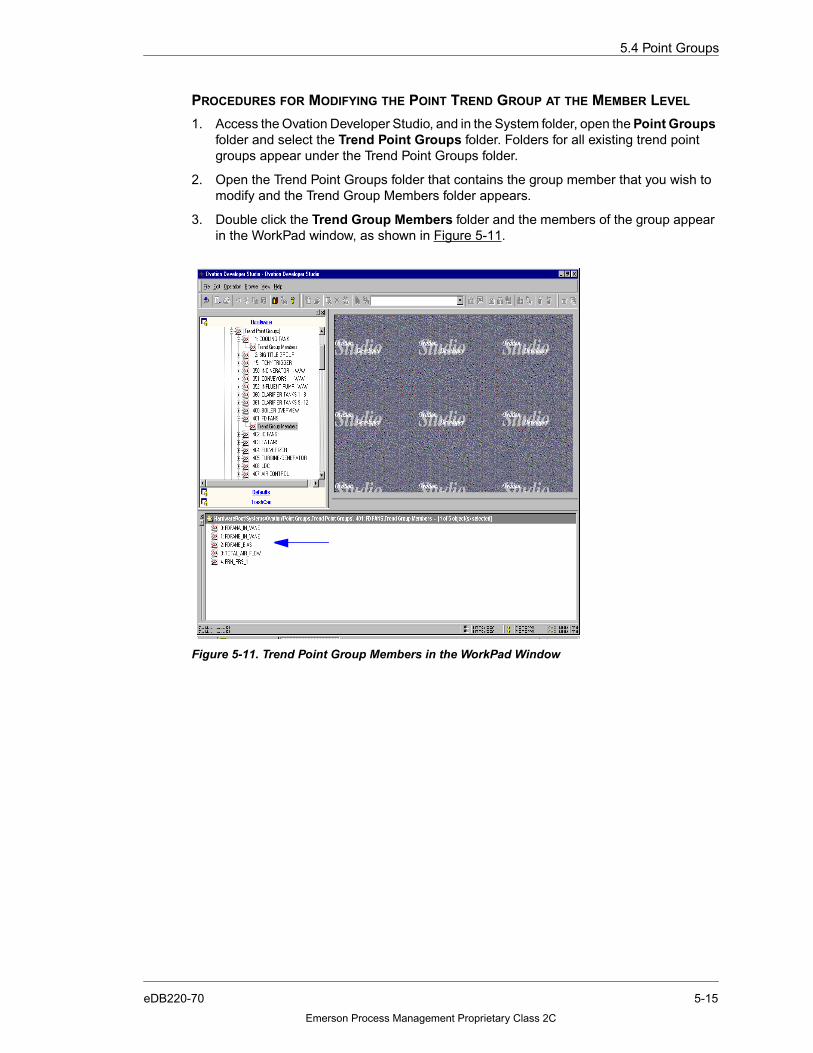
5.4 Point Groups
PROCEDURES FOR MODIFYING THE POINT TREND GROUP AT THE MEMBER LEVEL
1. Access the Ovation Developer Studio, and in the System folder, open the Point Groupsfolder and select the Trend Point Groups folder. Folders for all existing trend pointgroups appear under the Trend Point Groups folder.
2. Open the Trend Point Groups folder that contains the group member that you wish tomodify and the Trend Group Members folder appears.
3. Double click the Trend Group Members folder and the members of the group appearin the WorkPad window, as shown in Figure 5-11.
Figure 5-11. Trend Point Group Members in the WorkPad Window
5-15eDB220-70
Emerson Process Management Proprietary Class 2C
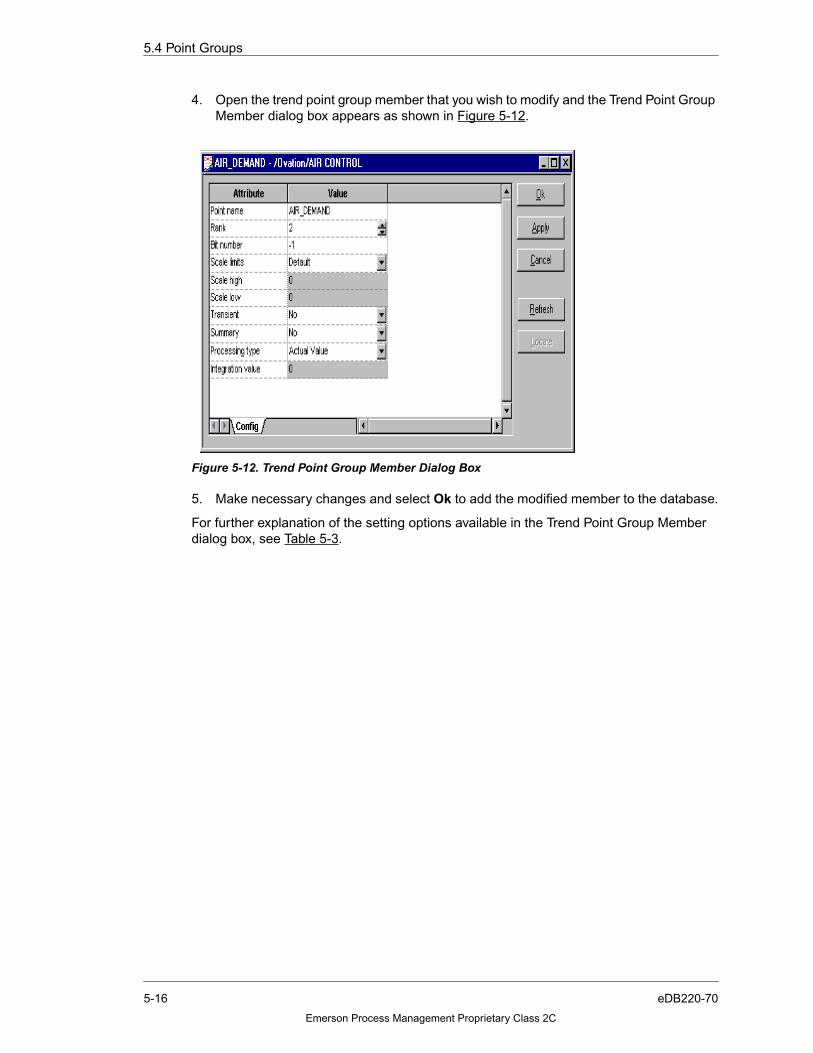
5.4 Point Groups
4. Open the trend point group member that you wish to modify and the Trend Point GroupMember dialog box appears as shown in Figure 5-12.
5. Make necessary changes and select Ok to add the modified member to the database.
For further explanation of the setting options available in the Trend Point Group Memberdialog box, see Table 5-3.
Figure 5-12. Trend Point Group Member Dialog Box
5-16 eDB220-70
Emerson Process Management Proprietary Class 2C

SECTION 6. HISTORICAL REVIEW
6.1 SECTION OVERVIEW
This section describes the Historical Review application.
The Historical Review is a tool that provides the user with the ability to retrieve historicaldata. The Historical Review Application provides the following six different types of reviews.
■ Point (Section 6.4)
Point reviews are based on a selected time range, points to be included in the review(filtering by point name, point groups, or characteristics) and selected specific review types.These review types define the type of collected point data which is to be retrieved. Forexample, all changes in point value may be of interest, or only the changes that occurredwhen the point(s) entered a particular status.
■ Alarm (Section 6.5)
The Alarm review can review alarm messages (including specific point record types) thatoccurred on all drops or a single drop, selected alarm types, point types, or individualpoints.
■ Operator Event (Section 6.6)
The Operator Event review provides a review of Operator Event messages based on allsubtypes, specific grouped subtypes, selected subtypes, and messages for a single point.
■ SOE (Section 6.7)
SOE reviews can be based on drop name, point name, or both.
■ Ascii (Section 6.8)
Ascii messages are any text messages generated by the user. The Ascii review can display,print, or save Ascii messages that occur on all drops or a single drop.
■ Common (Section 6.9)
Common reviews allow combined reviews of one or more of the above types to be displayedtogether.
6.2 CONFIGURING AND ACCESSING THE HISTORICAL REVIEW
The Historical Review must first be configured and accessed.
6.2.1 CONFIGURING THE HISTORICAL REVIEW APPLICATION FOR THE eDB DESKTOP SUITE
Use the following procedure to configure the Historical Review application, if using the “eDBDesktop Suite” package:
1. Access Start -> Programs -> eDB Desktop Suite-> HsrHostConfig.
6-1eDB220-70
Emerson Process Management Proprietary Class 2C

6.2 Configuring and Accessing the Historical Review
2. The HSR Host Config window appears (see Figure 6-1).
3. Enter the Historian(s) IP Address and Host Name and select Ok. Up to five eDBHistorians may be specified.
6.2.2 ACCESSING THE HISTORICAL REVIEW APPLICATION ON A STAND ALONE eDB SYSTEM
The Historical Review Application (see Figure 6-2) is accessed from the eDB drop usingthe following path: Start -> Programs -> eDB Desktop Suite -> Hist Review.
6.2.3 ACCESSING THE HISTORICAL REVIEW APPLICATION FROM A MICROSOFT WINDOWSBASED OVATION SYSTEM
The Historical Review Application (see Figure 6-2) is accessed from an Operator Stationusing the following path: Start -> Ovation NT-> Ovation Applications -> Hist Review.
6.2.4 CONFIGURING THE HISTORICAL REVIEW APPLICATION FROM A MICROSOFT WINDOWSBASED OVATION SYSTEM
Refer to “Configuring Your Ovation Operator Station User Guide” (listed in Table 1-3) forHistorian configuration information.
6.2.5 THE HISTORICAL REVIEW WINDOW COMPONENTS
Upon opening the Historical Review Application, the Historical Review window appears,refer to Figure 6-2. The Historical Review interface is comprised of:
■ Menu Bar
■ Tool Bar
■ Selection Criteria
■ Column Headings
■ Results Display
■ Tabs
■ Status Bar
Figure 6-1. HSR Host Config Window
6-2 eDB220-70
Emerson Process Management Proprietary Class 2C

6.2 Configuring and Accessing the Historical Review
6.2.6 MENU BAR
The Menu Bar contains five cascade buttons (see Figure 6-2). Each button displays a pull-down menu.
Table 6-1 provides a description of the pull-down menus.
Figure 6-2. Historical Review Window
Menu Bar
Toolbar
Tabs
Selection Criteria
Results Display
Status Bar
Column Headings
6-3eDB220-70
Emerson Process Management Proprietary Class 2C
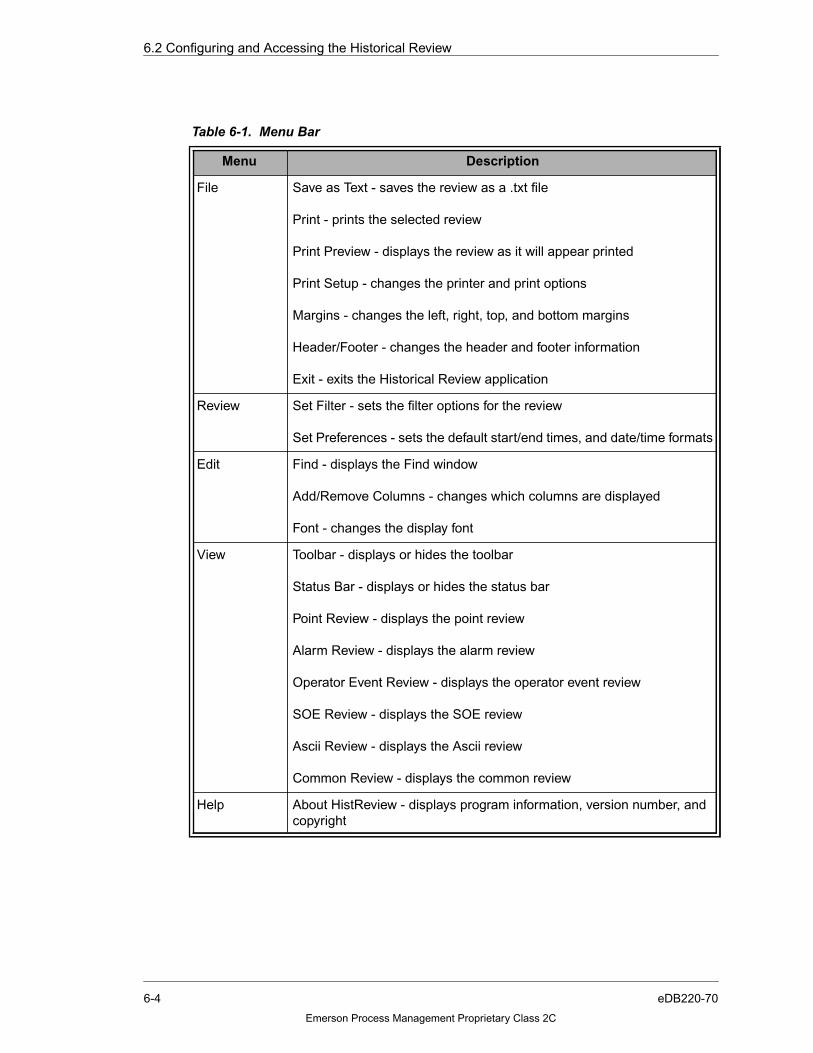
6.2 Configuring and Accessing the Historical Review
Table 6-1. Menu Bar
Menu Description
File Save as Text - saves the review as a .txt file
Print - prints the selected review
Print Preview - displays the review as it will appear printed
Print Setup - changes the printer and print options
Margins - changes the left, right, top, and bottom margins
Header/Footer - changes the header and footer information
Exit - exits the Historical Review application
Review Set Filter - sets the filter options for the review
Set Preferences - sets the default start/end times, and date/time formats
Edit Find - displays the Find window
Add/Remove Columns - changes which columns are displayed
Font - changes the display font
View Toolbar - displays or hides the toolbar
Status Bar - displays or hides the status bar
Point Review - displays the point review
Alarm Review - displays the alarm review
Operator Event Review - displays the operator event review
SOE Review - displays the SOE review
Ascii Review - displays the Ascii review
Common Review - displays the common review
Help About HistReview - displays program information, version number, andcopyright
6-4 eDB220-70
Emerson Process Management Proprietary Class 2C
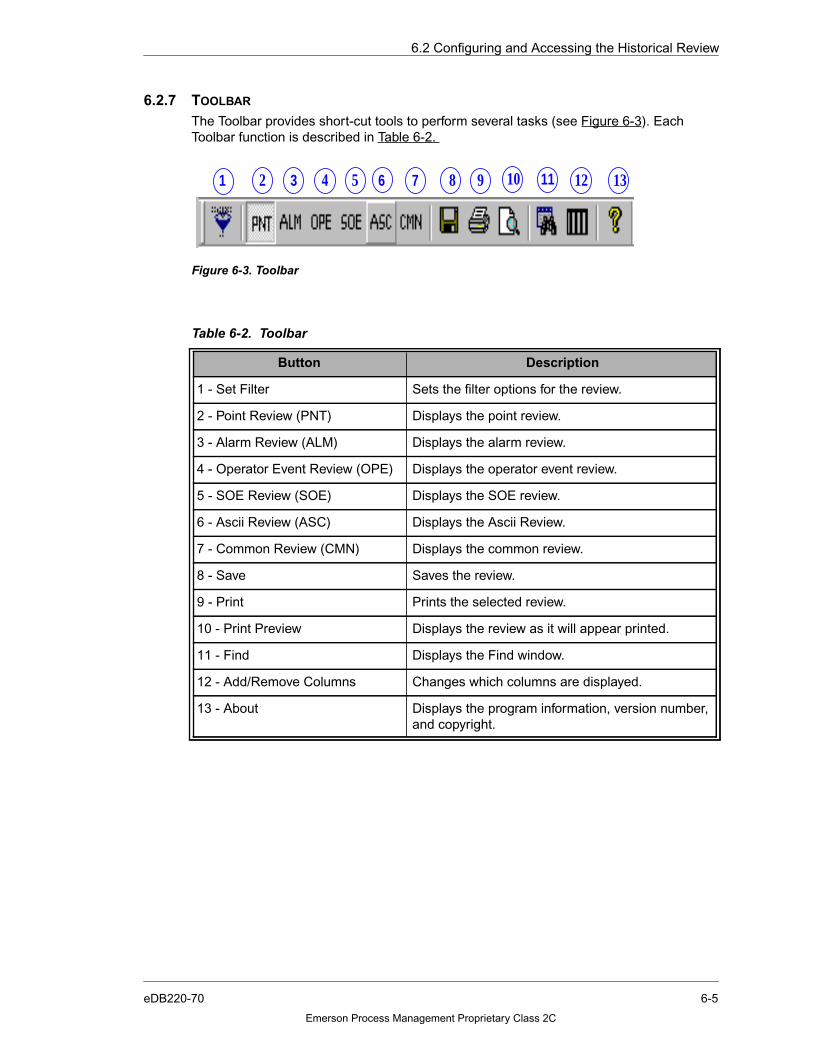
6.2 Configuring and Accessing the Historical Review
6.2.7 TOOLBAR
The Toolbar provides short-cut tools to perform several tasks (see Figure 6-3). EachToolbar function is described in Table 6-2.
Figure 6-3. Toolbar
Table 6-2. Toolbar
Button Description
1 - Set Filter Sets the filter options for the review.
2 - Point Review (PNT) Displays the point review.
3 - Alarm Review (ALM) Displays the alarm review.
4 - Operator Event Review (OPE) Displays the operator event review.
5 - SOE Review (SOE) Displays the SOE review.
6 - Ascii Review (ASC) Displays the Ascii Review.
7 - Common Review (CMN) Displays the common review.
8 - Save Saves the review.
9 - Print Prints the selected review.
10 - Print Preview Displays the review as it will appear printed.
11 - Find Displays the Find window.
12 - Add/Remove Columns Changes which columns are displayed.
13 - About Displays the program information, version number,and copyright.
1 2 3 4 5 6 7 8 9 10 11 12 13
6-5eDB220-70
Emerson Process Management Proprietary Class 2C

6.3 Setting Preferences
6.2.8 SELECTION CRITERIA
The selection criteria area of the window identifies the Start/End times you have chosen forthe review, and the filter criteria identifies chosen filters (see Figure 6-2).
6.2.9 COLUMN HEADINGS
The available Column headings that appear in the window are dependent upon which typeof review was chosen (see Figure 6-2). You may configure which column headings appearby choosing Edit -> Add/Remove Columns or choose the Add/Remove Columns buttonon the toolbar. A dialog will appear listing the available columns. Place a check mark nextto the column heading you would like to display.
6.2.10 RESULTS DISPLAY
Once a review is complete, the applicable review data will appear in the Results area of thewindow (see Figure 6-2).
6.2.11 STATUS BAR
The Status Bar provides information on Review Status and number of Points, Alarms,Operator Events, SOEs, Asciis, and Common reviews (see Figure 6-2).
6.3 SETTING PREFERENCES
The Preferences window allows you to set default intervals between Start and End times.You can also set the default format for the date/time as well as the Start and End Time inthe dialogs. This procedure is the same for all historical reviews.
Use the following procedure to set preferences:
1. From the Historical Review window (see Figure 6-2), select Review -> SetPreferences.
Figure 6-4. Add/Remove Columns Dialog
6-6 eDB220-70
Emerson Process Management Proprietary Class 2C
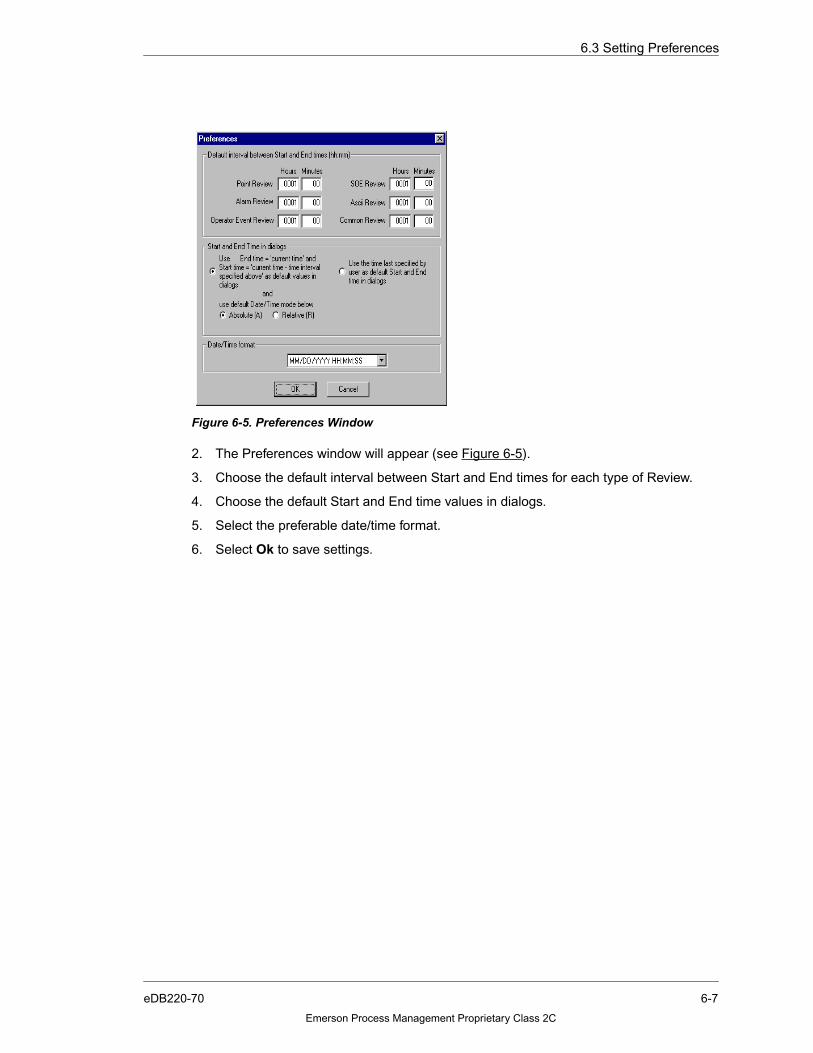
6.3 Setting Preferences
2. The Preferences window will appear (see Figure 6-5).
3. Choose the default interval between Start and End times for each type of Review.
4. Choose the default Start and End time values in dialogs.
5. Select the preferable date/time format.
6. Select Ok to save settings.
Figure 6-5. Preferences Window
6-7eDB220-70
Emerson Process Management Proprietary Class 2C
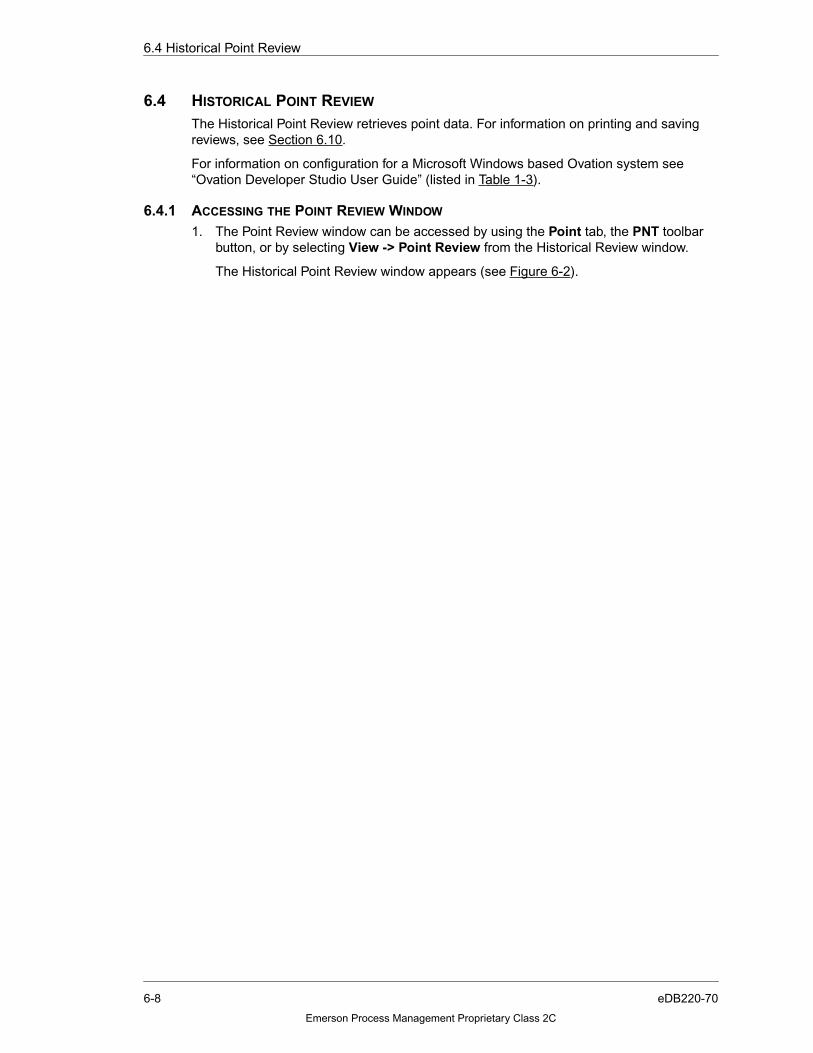
6.4 Historical Point Review
6.4 HISTORICAL POINT REVIEW
The Historical Point Review retrieves point data. For information on printing and savingreviews, see Section 6.10.
For information on configuration for a Microsoft Windows based Ovation system see“Ovation Developer Studio User Guide” (listed in Table 1-3).
6.4.1 ACCESSING THE POINT REVIEW WINDOW
1. The Point Review window can be accessed by using the Point tab, the PNT toolbarbutton, or by selecting View -> Point Review from the Historical Review window.
The Historical Point Review window appears (see Figure 6-2).
6-8 eDB220-70
Emerson Process Management Proprietary Class 2C
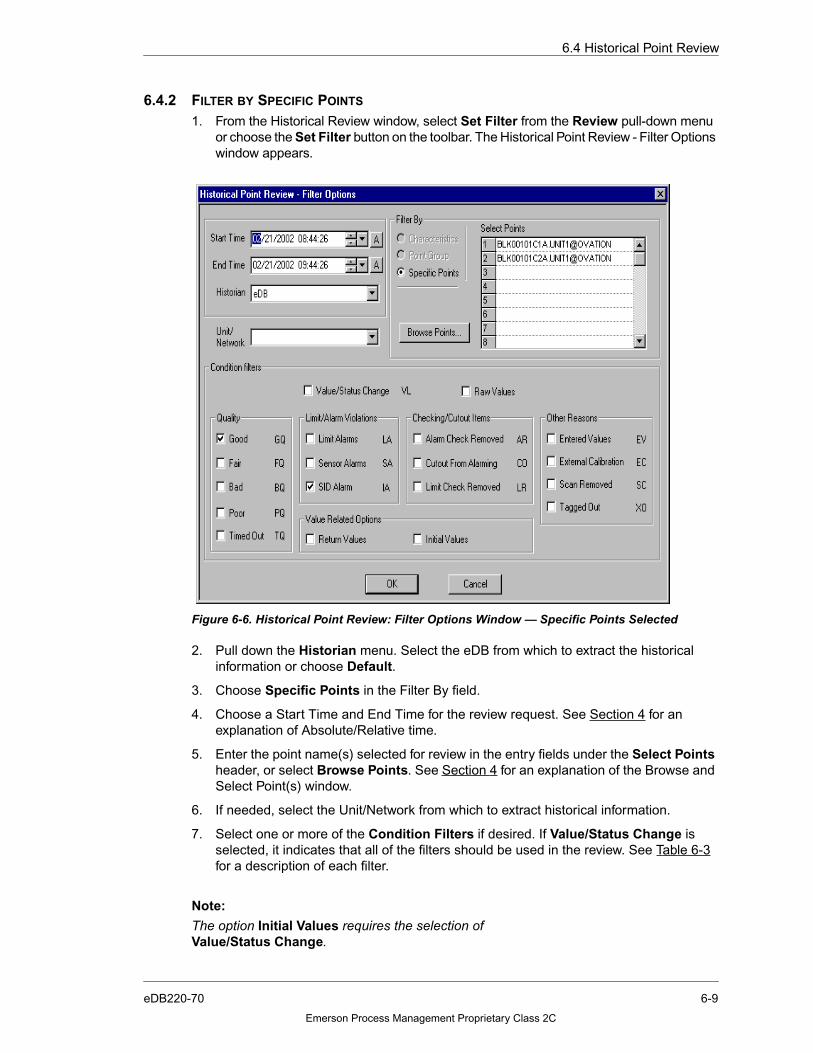
6.4 Historical Point Review
6.4.2 FILTER BY SPECIFIC POINTS
1. From the Historical Review window, select Set Filter from the Review pull-down menuor choose the Set Filter button on the toolbar. The Historical Point Review - Filter Optionswindow appears.
2. Pull down the Historian menu. Select the eDB from which to extract the historicalinformation or choose Default.
3. Choose Specific Points in the Filter By field.
4. Choose a Start Time and End Time for the review request. See Section 4 for anexplanation of Absolute/Relative time.
5. Enter the point name(s) selected for review in the entry fields under the Select Pointsheader, or select Browse Points. See Section 4 for an explanation of the Browse andSelect Point(s) window.
6. If needed, select the Unit/Network from which to extract historical information.
7. Select one or more of the Condition Filters if desired. If Value/Status Change isselected, it indicates that all of the filters should be used in the review. See Table 6-3for a description of each filter.
Note:
The option Initial Values requires the selection ofValue/Status Change.
Figure 6-6. Historical Point Review: Filter Options Window — Specific Points Selected
6-9eDB220-70
Emerson Process Management Proprietary Class 2C

6.4 Historical Point Review
8. Select Ok to begin the review. A status dialog will appear informing you that the PointReview is in progress.
Note:
To cancel a review in progress, select the Cancel button. Themessage, “Data retrieval terminated by user” will appear in the windowfooter.
When the review process is completed, the following message appears inthe window footer:
Point review complete.
6-10 eDB220-70
Emerson Process Management Proprietary Class 2C
6.4 Historical Point Review
6.4.3 REVIEW TYPE DEFINITIONS
Point data is collected by the eDB based on various types of status changes, such as achange in the point’s value or alarm status. When specifying a review of point data, theoperator may select specific types of status changes which are of interest.
The Condition Filters option boxes (see Figure 6-7), located on the lower half of theHistorical Point Review - Filter Options window, are used to select one or more of theseoptions. Selecting the Value/Status Change option indicates that all filters should be used.
Table 6-3 provides a brief description of each filter option. To select review type(s), click onone or more of the option boxes. Keep the following guidelines in mind:
■ At least one Review Type or Quality option box must be selected.
■ Each entry returned in the review will be annotated with all applicable statusinformation. Note that a single item may match more than one review type.
■ Depending on the combination of review types selected, the review may show allcollected values which match a review type, or may show only entries for changes to aspecified status.
Figure 6-7. Review Type and Quality Options
6-11eDB220-70
Emerson Process Management Proprietary Class 2C

6.4 Historical Point Review
Table 6-3. Condition Filters Historical Point Review - Filter Options Window
Review Type,Quality, or Filter Option Description
Value/Status Change Retrieves all collected changes in value or status.
Raw Values Retrieves the actual data as it was collected, includingduplicate data (heart beat) where the value/status hasnot changed.
Good GQ Retrieves all collected changes when point had goodquality.
Fair FQ Retrieves all collected changes when point had fairquality.
Bad BQ Retrieves all collected changes when point had badquality.
Poor PQ Retrieves all collected changes when point had poorquality.
Timed Out Retrieves occurrences when point timed-out.
Limit Alarms Retrieves occurrences when point was removed fromlimit or alarm checking.
Sensor Alarms Retrieves occurrences when point went into sensoralarm.
SID Alarm Retrieves points in SID alarm.
Alarm Check Removed Retrieves points for which alarm checking has beendisabled.
Cutout from Alarming Retrieves occurrences when point was cut-out fromalarm checking.
Limit Check Removed Retrieves points for which limit checking has beendisabled.
Entered Values Retrieves occurrences of operator-entered values.
External Calibration Retrieves points whose status indicates that externalcalibration is set.
Scan Removed Retrieves occurrences when point was removed fromscan.
Tagged Out Retrieves points whose status indicates they havetagged out.
6-12 eDB220-70
Emerson Process Management Proprietary Class 2C

6.4 Historical Point Review
6.4.4 FILTERING BY POINT CHARACTERISTICS
Note:
The following procedure applies to an Ovation system. It is not applicableto the eDB Desktop Suite.
This type of retrieval may take a long time depending upon how manypoints are specified.
1. From the Historical Review window, select Set Filter from the Review pull-down menu orchoose the Set Filter button on the toolbar. The Historical Point Review - Filter Optionswindow appears (see Figure 6-6).
2. Pull down the Historian menu. Select the eDB from which to extract the historicalinformation.
3. Choose Characteristics in the Filter By field. The Select Characteristics field and thePredefined list will appear (see Figure 6-8).
Return Values Retrieves values showing return from the selectedconditions, in addition to the samples which satisfy theother conditions.
Initial Values Retrieves the initial value from the start of the chosentime range, in addition to the samples which satisfy theother chosen conditions. This is the value as was setfor a point coming into the retrieval time rangespecified.
Table 6-3. Condition Filters Historical Point Review - Filter Options Window (Cont’d)
Review Type,Quality, or Filter Option Description
6-13eDB220-70
Emerson Process Management Proprietary Class 2C
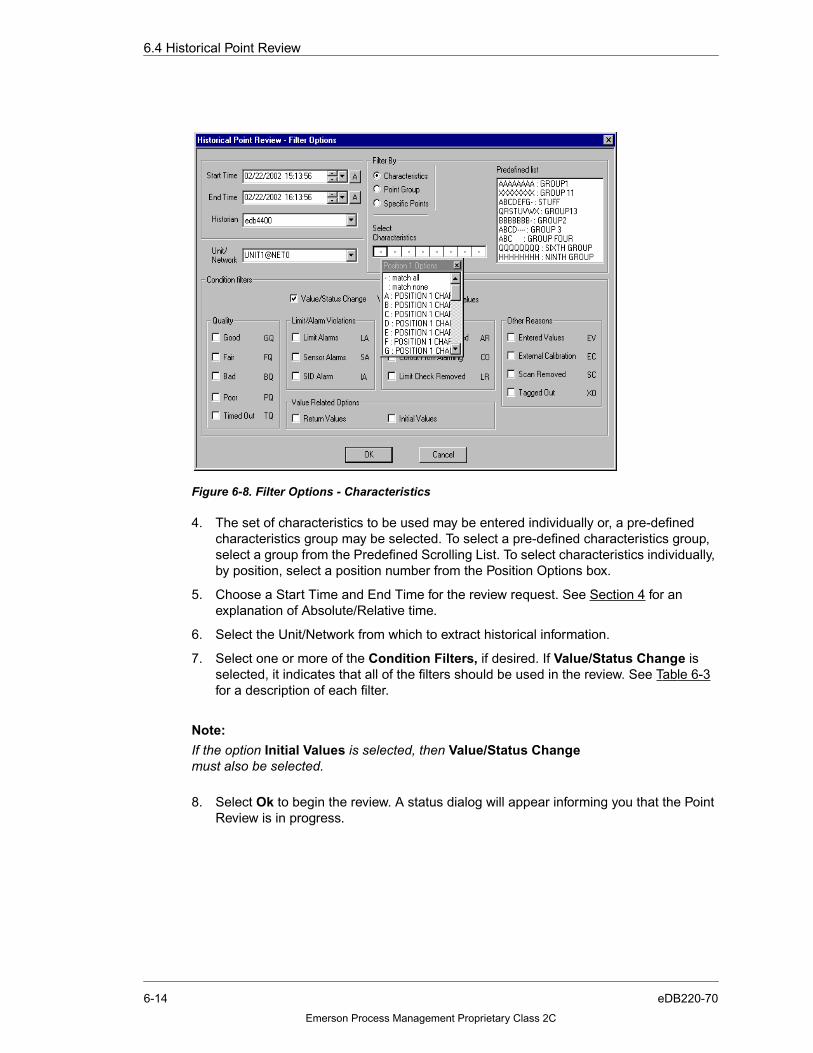
6.4 Historical Point Review
4. The set of characteristics to be used may be entered individually or, a pre-definedcharacteristics group may be selected. To select a pre-defined characteristics group,select a group from the Predefined Scrolling List. To select characteristics individually,by position, select a position number from the Position Options box.
5. Choose a Start Time and End Time for the review request. See Section 4 for anexplanation of Absolute/Relative time.
6. Select the Unit/Network from which to extract historical information.
7. Select one or more of the Condition Filters, if desired. If Value/Status Change isselected, it indicates that all of the filters should be used in the review. See Table 6-3for a description of each filter.
Note:
If the option Initial Values is selected, then Value/Status Changemust also be selected.
8. Select Ok to begin the review. A status dialog will appear informing you that the PointReview is in progress.
Figure 6-8. Filter Options - Characteristics
6-14 eDB220-70
Emerson Process Management Proprietary Class 2C

6.4 Historical Point Review
Note:
To cancel a review in progress, select the Cancel button. Themessage, “Data retrieval terminated by user” will appearin the window footer.
When the review process is completed, the following message appears inthe window footer:
Point review complete.
6.4.5 FILTERING BY POINT GROUPS
1. From the Historical Review window, select Set Filter from the Review pull-down menuor choose the Set Filter button on the toolbar. The Historical Point Review - Filter Optionswindow appears.
2. Choose Point Groups in the Filter By field. The Group Number and Point Groups fieldswill appear (see Figure 6-9).
3. Select a Group Number from the scrolling list. The number of the group selectedappears in the Group Number field. For more information on groups, see “OvationDeveloper Studio User Guide” (listed in Table 1-3).
4. Select one or more of the Conditional Filters, if desired. If Value/Status Change isselected, it indicates that all of the filters should be used in the review. See Section6.4.3 for a description of each filter.
5. Select Ok to begin the review. A status dialog will appear informing you that the PointReview is in progress.
Figure 6-9. Filter Options - Point Groups
6-15eDB220-70
Emerson Process Management Proprietary Class 2C
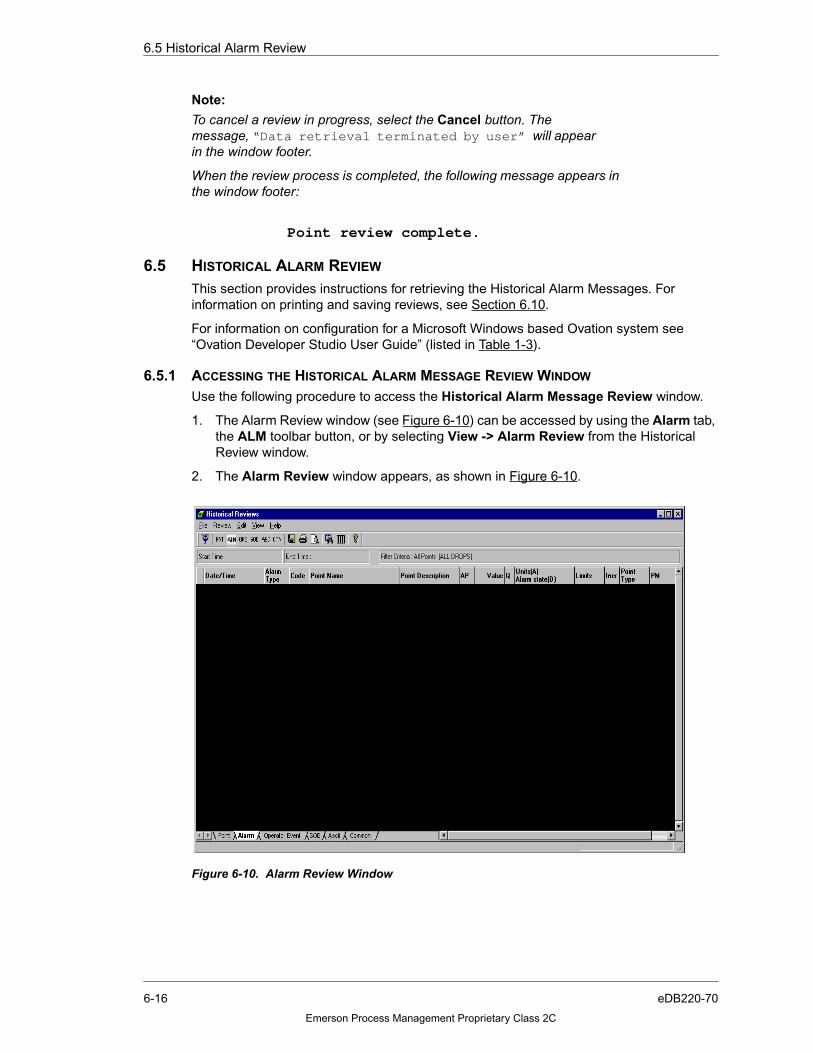
6.5 Historical Alarm Review
Note:
To cancel a review in progress, select the Cancel button. Themessage, “Data retrieval terminated by user” will appearin the window footer.
When the review process is completed, the following message appears inthe window footer:
Point review complete.
6.5 HISTORICAL ALARM REVIEW
This section provides instructions for retrieving the Historical Alarm Messages. Forinformation on printing and saving reviews, see Section 6.10.
For information on configuration for a Microsoft Windows based Ovation system see“Ovation Developer Studio User Guide” (listed in Table 1-3).
6.5.1 ACCESSING THE HISTORICAL ALARM MESSAGE REVIEW WINDOW
Use the following procedure to access the Historical Alarm Message Review window.
1. The Alarm Review window (see Figure 6-10) can be accessed by using the Alarm tab,the ALM toolbar button, or by selecting View -> Alarm Review from the HistoricalReview window.
2. The Alarm Review window appears, as shown in Figure 6-10.
Figure 6-10. Alarm Review Window
6-16 eDB220-70
Emerson Process Management Proprietary Class 2C
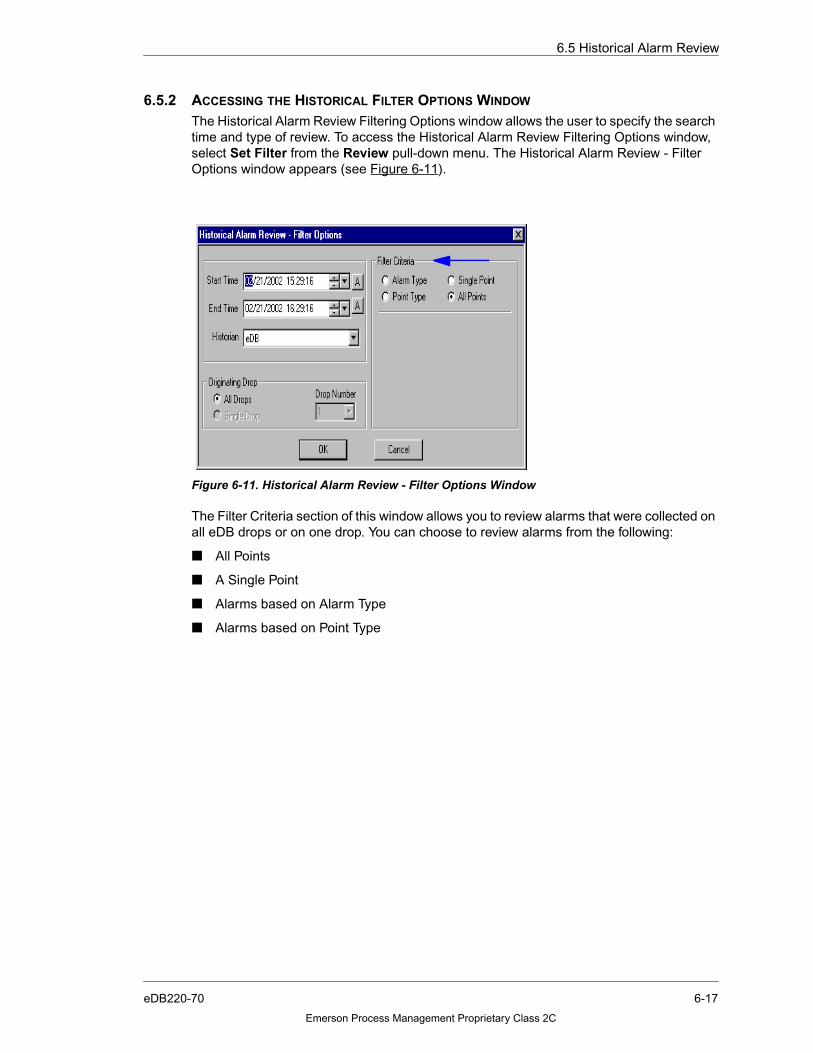
6.5 Historical Alarm Review
6.5.2 ACCESSING THE HISTORICAL FILTER OPTIONS WINDOW
The Historical Alarm Review Filtering Options window allows the user to specify the searchtime and type of review. To access the Historical Alarm Review Filtering Options window,select Set Filter from the Review pull-down menu. The Historical Alarm Review - FilterOptions window appears (see Figure 6-11).
The Filter Criteria section of this window allows you to review alarms that were collected onall eDB drops or on one drop. You can choose to review alarms from the following:
■ All Points
■ A Single Point
■ Alarms based on Alarm Type
■ Alarms based on Point Type
Figure 6-11. Historical Alarm Review - Filter Options Window
6-17eDB220-70
Emerson Process Management Proprietary Class 2C

6.5 Historical Alarm Review
6.5.3 SELECTING A REVIEW OF ALL POINTS
This review can include alarms that were collected on all eDB drops or one drop.
1. Access the Historical Alarm Review - Filter Options window (see Figure 6-11).
2. Select the Historian from which to extract the historical information or choose Default.
3. Choose All Points in the Filter Criteria area of the Historical Alarm Review - FilterOptions window (see Figure 6-11).
4. Enter the start time and end time of the review request. See Section 4 for a descriptionof the Absolute/Relative (A/R buttons) time format.
5. Use the Originating Drop section of the window to choose the drop(s) originating thealarm. Select one of the following options:
❒ All Drops to search all drops for alarms.
OR
❒ Single Drop to search one drop for alarms. If Single Drop is selected, the DropNumber field highlights. Select a drop number using the pull-down menu.
6. Choose Ok to begin the review. A status dialog will appear informing you that the AlarmReview is in progress.
Note:
To cancel a review in progress, select the Cancel button. Themessage, “Data retrieval terminated by user” will appearin the window footer.
When the review process is completed, the following message appears inthe window footer:
Alarm review complete.
The applicable review data appears in the window. Note that for reviewdisplays, the number of alarms reviewed is shown on the right side of thefooter.
6-18 eDB220-70
Emerson Process Management Proprietary Class 2C

6.5 Historical Alarm Review
6.5.4 SELECTING A REVIEW OF A SINGLE POINT
1. Choose Single Point in the Filter Criteria area of the Historical Alarm Review - FilterOptions window (see Figure 6-12).
2. Select the Historian from which to extract the historical information or choose Default.
3. The Point Name field appears (see Figure 6-12). Enter a Point Name or select BrowsePoints to browse points. See Section 4 for a description of the Browse and SelectPoint(s) window.
4. Enter the start time and end time of the review request. See Section 4 for a descriptionof the Absolute/Relative (A/R buttons) time format.
5. Use the Originating Drop section of the window to choose the drop(s) originating thealarm. Select one of the following options:
❒ All Drops to search all drops for alarms.
OR
❒ Single Drop to search one drop for alarms. If Single Drop is selected, the DropNumber field highlights. Select a drop number using the pull-down menu.
6. Select Ok to begin the review. A status dialog will appear informing you that the AlarmReview is in progress.
Figure 6-12. Filter Options - Single Point
6-19eDB220-70
Emerson Process Management Proprietary Class 2C
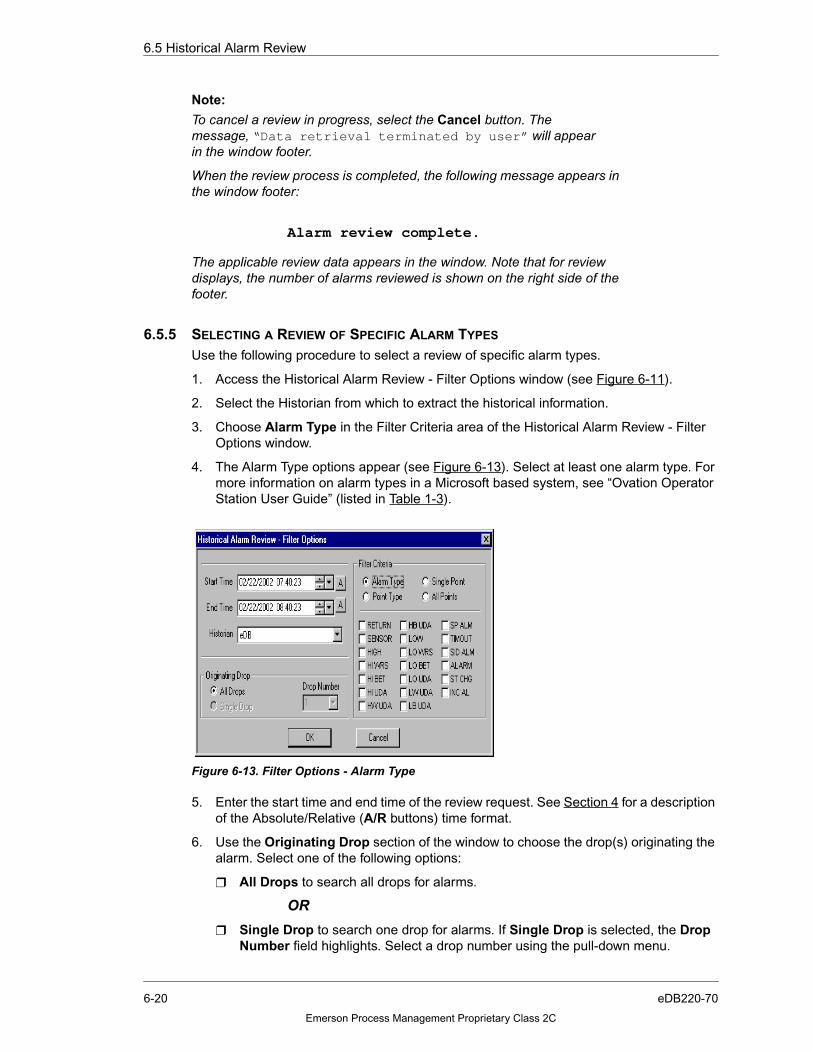
6.5 Historical Alarm Review
Note:
To cancel a review in progress, select the Cancel button. Themessage, “Data retrieval terminated by user” will appearin the window footer.
When the review process is completed, the following message appears inthe window footer:
Alarm review complete.
The applicable review data appears in the window. Note that for reviewdisplays, the number of alarms reviewed is shown on the right side of thefooter.
6.5.5 SELECTING A REVIEW OF SPECIFIC ALARM TYPES
Use the following procedure to select a review of specific alarm types.
1. Access the Historical Alarm Review - Filter Options window (see Figure 6-11).
2. Select the Historian from which to extract the historical information.
3. Choose Alarm Type in the Filter Criteria area of the Historical Alarm Review - FilterOptions window.
4. The Alarm Type options appear (see Figure 6-13). Select at least one alarm type. Formore information on alarm types in a Microsoft based system, see “Ovation OperatorStation User Guide” (listed in Table 1-3).
5. Enter the start time and end time of the review request. See Section 4 for a descriptionof the Absolute/Relative (A/R buttons) time format.
6. Use the Originating Drop section of the window to choose the drop(s) originating thealarm. Select one of the following options:
❒ All Drops to search all drops for alarms.
OR
❒ Single Drop to search one drop for alarms. If Single Drop is selected, the DropNumber field highlights. Select a drop number using the pull-down menu.
Figure 6-13. Filter Options - Alarm Type
6-20 eDB220-70
Emerson Process Management Proprietary Class 2C

6.5 Historical Alarm Review
7. Select Ok to begin the review. A status dialog will appear informing you that the AlarmReview is in progress.
Note:
To cancel a review in progress, select the Cancel button. Themessage, “Data retrieval terminated by user” will appearin the window footer.
When the review process is completed, the following message appears inthe window footer:
Alarm review complete.
The applicable review data appears in the window. Note that for reviewdisplays, the number of alarms reviewed is shown on the right side of thefooter.
6.5.6 SELECTING A REVIEW OF SPECIFIC POINT TYPES
1. Access the Historical Alarm Review - Filter Options window (see Figure 6-11).
2. Select the Historian from which to extract the historical information.
3. Choose Point Type in the Filter Criteria area of the Historical Alarm Review - FilterOptions window (see Figure 6-11).
4. The Point Type options appear (see Figure 6-14). Select at least one point type fromthe point type choices. For more information on point types, see “Ovaton Record TypesReference Manual” (Table 1-3).
5. Enter the start time and end time of the review request. See Section 4 for a descriptionof the Absolute/Relative (A/R buttons) time format.
6. Use the Originating Drop section of the window to choose the drop(s) originating thealarm. Select one of the following options:
❒ All Drops to search all drops for alarms.
OR
Figure 6-14. Filter Options - Point Type
6-21eDB220-70
Emerson Process Management Proprietary Class 2C
6.5 Historical Alarm Review
❒ Single Drop to search one drop for alarms. If Single Drop is selected, the DropNumber field highlights. Select a drop number using the pull-down menu.
7. Select Ok to begin the review. A status dialog will appear informing you that the AlarmReview is in progress.
Note:
To cancel a review in progress, select the Cancel button. Themessage, “Data retrieval terminated by user” will appearin the window footer.
When the review process is completed, the following message appears inthe window footer:
Alarm review complete.
The applicable review data appears in the window. Note that for reviewdisplays, the number of alarms reviewed is shown on the right side of thefooter.
6-22 eDB220-70
Emerson Process Management Proprietary Class 2C

6.6 Operator Event Historical Review
6.6 OPERATOR EVENT HISTORICAL REVIEW
The Operator Event Historical Review accesses Operator Event history to retrieve data. Forinformation on printing and saving reviews, see Section 6.10.
For information on configuration for a Microsoft Windows based Ovation system see“Ovation Developer Studio User Guide” (listed in Table 1-3).
Four types of reviews can be specified:
■ All Subtypes
■ Groups
■ Selected Subtypes
■ Single Point
The Operator Event Review window is accessed using the following procedure:
1. Access the Operator Event Review window by using the Operator Event tab, the OPEtoolbar button, or by selecting View -> Operator Event Review from the HistoricalReview window (see Figure 6-15).
.
2. From the Review pull-down menu, select Set Filter or choose the Set Filter button onthe toolbar.
The Historical Operator Event Review - Filter Options window appears (see Figure6-16).
Figure 6-15. Operator Event Review Window
6-23eDB220-70
Emerson Process Management Proprietary Class 2C

6.6 Operator Event Historical Review
6.6.1 SELECTING ALL OPERATOR EVENT MESSAGE SUBTYPES FOR REVIEW
1. Access the Historical Operator Event Review - Filter Options window (see Figure 6-16).
2. Select the Historian from which to extract the historical information or choose Default.
3. Choose All Subtypes in the Filter Criteria area of the Historical Operator Event Review- Filter Options window (see Figure 6-16).
4. Enter the start time and end time of the review request. See Section 4 for a descriptionof the Absolute/Relative (A/R buttons) time format.
5. Use the Originating Drop section of the window to choose the drop(s) originating thealarm. Select one of the following options:
❒ All Drops to search all drops for Operator Events.
OR
❒ Single Drop to search one drop for Operator Events. If Single Drop is selected,the Drop Number field highlights. Select a drop number using the pull-down menu.
6. Choose Ok to begin the review. A status dialog will appear informing you that theOperator Event Review is in progress.
Note:
To cancel a review in progress, select the Cancel button. Themessage, “Data retrieval terminated by user” will appearin the window footer.
When the review process is completed, the following message appears inthe window footer:
Figure 6-16. Historical Operator Event Review - Filter Options Window
6-24 eDB220-70
Emerson Process Management Proprietary Class 2C

6.6 Operator Event Historical Review
Operator event review complete.
The applicable review data appears in the window. Note that for reviewdisplays, the number of operator events reviewed is shown on the right sideof the footer.
6.6.2 SELECTING SPECIFIC GROUPS OF OPERATOR EVENT MESSAGES FOR REVIEW
1. Access the Historical Operator Event Review - Filter Options window (see Figure 6-16).
2. Select the Historian from which to extract the historical information or choose Default.
3. Choose Groups in the Filter Criteria area of the Historical Operator Event Review -Filter Options window (see Figure 6-17).
4. The Groups appear (see Figure 6-17). Select the desired group from the scrolling list.
5. Enter the start time and end time of the review request. See Section 4 for a descriptionof the Absolute/Relative (A/R buttons) time format.
6. Use the Originating Drop section of the window to choose the drop(s) originating thealarm. Select one of the following options:
❒ All Drops to search all drops for Operator Event.
OR
❒ Single Drop to search one drop for Operator Event. If Single Drop is selected, theDrop Number field highlights. Select a drop number using the pull-down menu.
7. Choose Ok to begin the review. A status dialog will appear informing you that theOperator Event Review is in progress.
Note:
To cancel a review in progress, select the Cancel button. Themessage, “Data retrieval terminated by user” will appearin the window footer.
When the review process is completed, the following message appears inthe window footer:
Figure 6-17. Operator Event Filter Options - Groups
6-25eDB220-70
Emerson Process Management Proprietary Class 2C

6.6 Operator Event Historical Review
Operator event review complete.
The applicable review data appears in the window. Note that for reviewdisplays, the number of operator events reviewed is shown on the right sideof the footer.
6.6.3 SELECTING SPECIFIC EVENT MESSAGE SUBTYPES FOR REVIEW
1. Access the Historical Operator Event Review - Filter Options window (see Figure 6-16).
2. Select the Historian from which to extract the historical information or choose Default.
3. Choose Subtypes in the Filter Criteria area of the Historical Operator Event Review -Filter Options window.
4. The Subtypes appear (see Figure 6-18). Select the desired Subtypes from thescrolling list.
5. Enter the start time and end time of the review request. See Section 4 for a descriptionof the Absolute/Relative (A/R buttons) time format.
6. Use the Originating Drop section of the window to choose the drop(s) originating thealarm. Select one of the following options:
❒ All Drops to search all drops for Operator Events.
OR
❒ Single Drop to search one drop for Operator Events. If Single Drop is selected,the Drop Number field highlights. Select a drop number using the pull-down menu.
7. Choose Ok to begin the review. A status dialog will appear informing you that theOperator Event Review is in progress.
Note:
To cancel a review in progress, select the Cancel button. Themessage, “Data retrieval terminated by user” will appearin the window footer.
Figure 6-18. Op Event Filter Options - Subtypes
6-26 eDB220-70
Emerson Process Management Proprietary Class 2C

6.6 Operator Event Historical Review
When the review process is completed, the following message appears inthe window footer:
Operator event review complete.
The applicable review data appears in the window. Note that for reviewdisplays, the number of operator events reviewed is shown on the right sideof the footer.
6.6.4 SELECTING A SINGLE POINT FOR REVIEW
1. Access the Historical Operator Event Review - Filter Options window (see Figure 6-16).
2. Select the Historian from which to extract the historical information or choose Default.
3. Choose Single Point in the Filter Criteria area of the Historical Operator Event Review- Filter Options window.
4. The Point Name field appear (see Figure 6-19). Enter the desired Point Name orchoose Browse Points to browse points. See Section 4 for a description of the Browseand Select Point(s) window.
5. Enter the start time and end time of the review request. See Section 4 for a descriptionof the Absolute/Relative (A/R buttons) time format.
6. Use the Originating Drop section of the window to choose the drop(s) originating thealarm. Select one of the following options:
❒ All Drops to search all drops for Operator Events.
OR
❒ Single Drop to search one drop for Operator Events. If Single Drop is selected,the Drop Number field highlights. Select a drop number using the pull-down menu.
7. Choose Ok to begin the review. A status dialog will appear informing you that theOperator Event Review is in progress.
Figure 6-19. Op Event Filter Options - Single Point
6-27eDB220-70
Emerson Process Management Proprietary Class 2C

6.7 SOE Historical Review
Note:
To cancel a review in progress, select the Cancel button. Themessage, “Data retrieval terminated by user” will appearin the window footer.
When the review process is completed, the following message appears inthe window footer:
Operator event review complete.
The applicable review data appears in the window. Note that for reviewdisplays, the number of operator events reviewed is shown on the right sideof the footer.
6.7 SOE HISTORICAL REVIEW
The Historical SOE Review accesses Sequence of Events (SOE) history to retrieve data.Reviews can be based on drop name, point name, or both. For information on printing andsaving reviews, see Section 6.10.
For information on configuration for a Microsoft Windows based Ovation system see“Ovation Developer Studio User Guide” (listed in Table 1-3).
6.7.1 ACCESSING THE SOE REVIEW WINDOW
The SOE Review window is accessed using the following procedure:
1. Access the SOE Review window by using the SOE tab, the SOE toolbar button, or byselecting View -> SOE Review from the Historical Review window (see Figure 6-20).
Figure 6-20. SOE Review Window
6-28 eDB220-70
Emerson Process Management Proprietary Class 2C

6.7 SOE Historical Review
2. From the Review pull-down menu, select Set Filter or choose the Set Filter button onthe toolbar.
The Historical SOE Review - Filter Options window appears (see Figure 6-21).
Three types of reviews can be specified:
■ All
■ Single Point
■ Single Drop
6.7.2 SELECTING ALL SOE MESSAGES FOR REVIEW
Use the following procedure to review all SOE messages on all drops.
1. Access the SOE Review - Filter Options window (see Figure 6-21).
2. Select the Historian from which to extract the historical information or choose Default.
3. Choose All in the Filter Criteria area of the Historical SOE Review - Filter Optionswindow.
4. Enter the start time and end time of the review request. See Section 4 for a descriptionof the Absolute/Relative (A/R buttons) time format.
5. Select Ok to begin the review. A status dialog will appear informing you that the SOEReview is in progress.
Note:
To cancel a review in progress, select the Cancel button. Themessage, “Data retrieval terminated by user” will appearin the window footer.
When the review process is completed, the following message appears inthe window footer:
Figure 6-21. SOE Filter Options
6-29eDB220-70
Emerson Process Management Proprietary Class 2C

6.7 SOE Historical Review
SOE review complete.
The applicable review data appears in the window. Note that for reviewdisplays, the number of SOEs reviewed is shown on the right side of thefooter.
6.7.3 SELECTING SINGLE POINT BASED SOE MESSAGES FOR REVIEW
1. Access the Historical SOE Review - Filter Options window (see Figure 6-21).
2. Select the Historian from which to extract the historical information or choose Default.
3. Choose Single Point in the Filter Criteria area of the Historical SOE Review - FilterOptions window (see Figure 6-22).
4. A Point Name field appears (see Figure 6-22). Enter a Point Name or choose BrowsePoints to browse points. See Section 4 for an explanation of the Browse and SelectPoint(s) window.
5. Enter the start time and end time of the review request. See Section 4 for a descriptionof the Absolute/Relative (A/R buttons) time format.
6. Select Ok to begin the review. A status dialog will appear informing you that the SOEReview is in progress.
Note:
To cancel a review in progress, select the Cancel button. Themessage, “Data retrieval terminated by user” will appearin the window footer.
When the review process is completed, the following message appears inthe window footer:
Figure 6-22. SOE Filter Options - Single Point
6-30 eDB220-70
Emerson Process Management Proprietary Class 2C
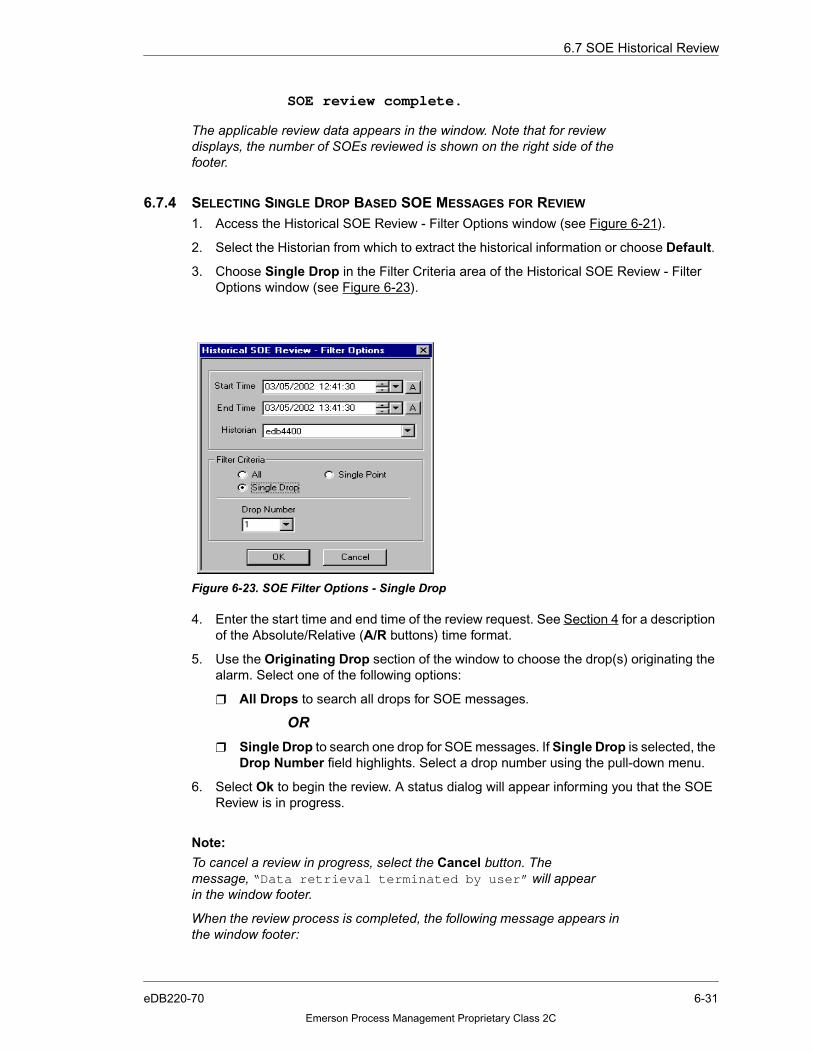
6.7 SOE Historical Review
SOE review complete.
The applicable review data appears in the window. Note that for reviewdisplays, the number of SOEs reviewed is shown on the right side of thefooter.
6.7.4 SELECTING SINGLE DROP BASED SOE MESSAGES FOR REVIEW
1. Access the Historical SOE Review - Filter Options window (see Figure 6-21).
2. Select the Historian from which to extract the historical information or choose Default.
3. Choose Single Drop in the Filter Criteria area of the Historical SOE Review - FilterOptions window (see Figure 6-23).
4. Enter the start time and end time of the review request. See Section 4 for a descriptionof the Absolute/Relative (A/R buttons) time format.
5. Use the Originating Drop section of the window to choose the drop(s) originating thealarm. Select one of the following options:
❒ All Drops to search all drops for SOE messages.
OR
❒ Single Drop to search one drop for SOE messages. If Single Drop is selected, theDrop Number field highlights. Select a drop number using the pull-down menu.
6. Select Ok to begin the review. A status dialog will appear informing you that the SOEReview is in progress.
Note:
To cancel a review in progress, select the Cancel button. Themessage, “Data retrieval terminated by user” will appearin the window footer.
When the review process is completed, the following message appears inthe window footer:
Figure 6-23. SOE Filter Options - Single Drop
6-31eDB220-70
Emerson Process Management Proprietary Class 2C
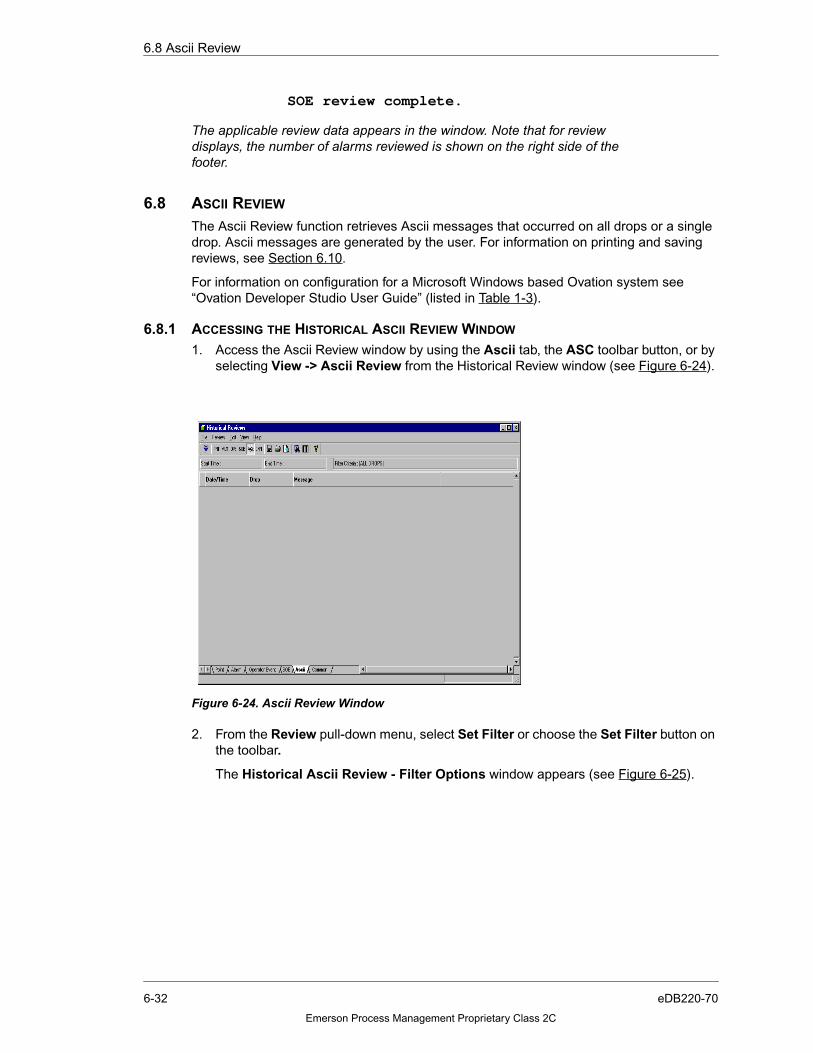
6.8 Ascii Review
SOE review complete.
The applicable review data appears in the window. Note that for reviewdisplays, the number of alarms reviewed is shown on the right side of thefooter.
6.8 ASCII REVIEW
The Ascii Review function retrieves Ascii messages that occurred on all drops or a singledrop. Ascii messages are generated by the user. For information on printing and savingreviews, see Section 6.10.
For information on configuration for a Microsoft Windows based Ovation system see“Ovation Developer Studio User Guide” (listed in Table 1-3).
6.8.1 ACCESSING THE HISTORICAL ASCII REVIEW WINDOW
1. Access the Ascii Review window by using the Ascii tab, the ASC toolbar button, or byselecting View -> Ascii Review from the Historical Review window (see Figure 6-24).
2. From the Review pull-down menu, select Set Filter or choose the Set Filter button onthe toolbar.
The Historical Ascii Review - Filter Options window appears (see Figure 6-25).
Figure 6-24. Ascii Review Window
6-32 eDB220-70
Emerson Process Management Proprietary Class 2C

6.8 Ascii Review
6.8.2 SELECTING AN ASCII REVIEW OF ALL DROPS
1. Access the Historical Ascii Review - Filter Options window (see Figure 6-25).
2. Select the Historian from which to extract the historical information or choose Default.
3. Choose All in the Filter Criteria area of the Historical Ascii Review - Filter Optionswindow.
4. Choose a Start Time and End Time for the review request. See Section 4 for anexplanation of Absolute/Relative time.
5. Select Ok to begin the review. A status dialog will appear informing you that the AsciiReview is in progress.
Note:
To cancel a review in progress, select the Cancel button. Themessage, “Data retrieval terminated by user” will appearin the window footer.
When the review process is completed, the following message appears inthe window footer:
Ascii review complete.
The applicable review data appears in the window. Note that for reviewdisplays, the number of Asciis messages reviewed is shown on the rightside of the footer.
6.8.3 SELECTING AN ASCII REVIEW OF A SINGLE DROP
1. Access the Historical Ascii Review - Filter Options window (see Figure 6-25).
2. Select the Historian from which to extract the historical information.
3. Choose Single Drop in the Filter Criteria area of the Historical Ascii Review - FilterOptions window (see Figure 6-26).
Figure 6-25. Filter Options - Ascii
6-33eDB220-70
Emerson Process Management Proprietary Class 2C

6.9 Common Review
4. Enter the start time and end time of the review request. See Section 4 for a descriptionof the Absolute/Relative (A/R buttons) time format.
5. Use the Originating Drop section of the window to choose the drop(s) originating theAscii message. Choose Single Drop to search one drop for Ascii message. The DropNumber field highlights. Select a drop number using the pull-down menu.
6. Select Ok to begin the review. A status dialog will appear informing you that the AsciiReview is in progress.
Note:
To cancel a review in progress, select the Cancel button. Themessage, “Data retrieval terminated by user” will appearin the window footer.
When the review process is completed, the following message appears inthe window footer:
Ascii review complete.
The applicable review data appears in the window. Note that for reviewdisplays, the number of Ascii messages reviewed is shown on the rightside of the footer.
6.9 COMMON REVIEW
The Common Review window provides a view of one or more types of review data which isdisplayed in chronological order. This allows the user to view history of multiple types ofprocess events in a single view, for example, Operator Events and Point Reviews in thesame display. For information on printing and saving reviews, see Section 6.10.
1. Access the Common Review window by using the Common tab, the CMN toolbarbutton, or by selecting View -> Common Review from the Historical Review window(see Figure 6-27).
Figure 6-26. Filter Options - Single Drops
6-34 eDB220-70
Emerson Process Management Proprietary Class 2C
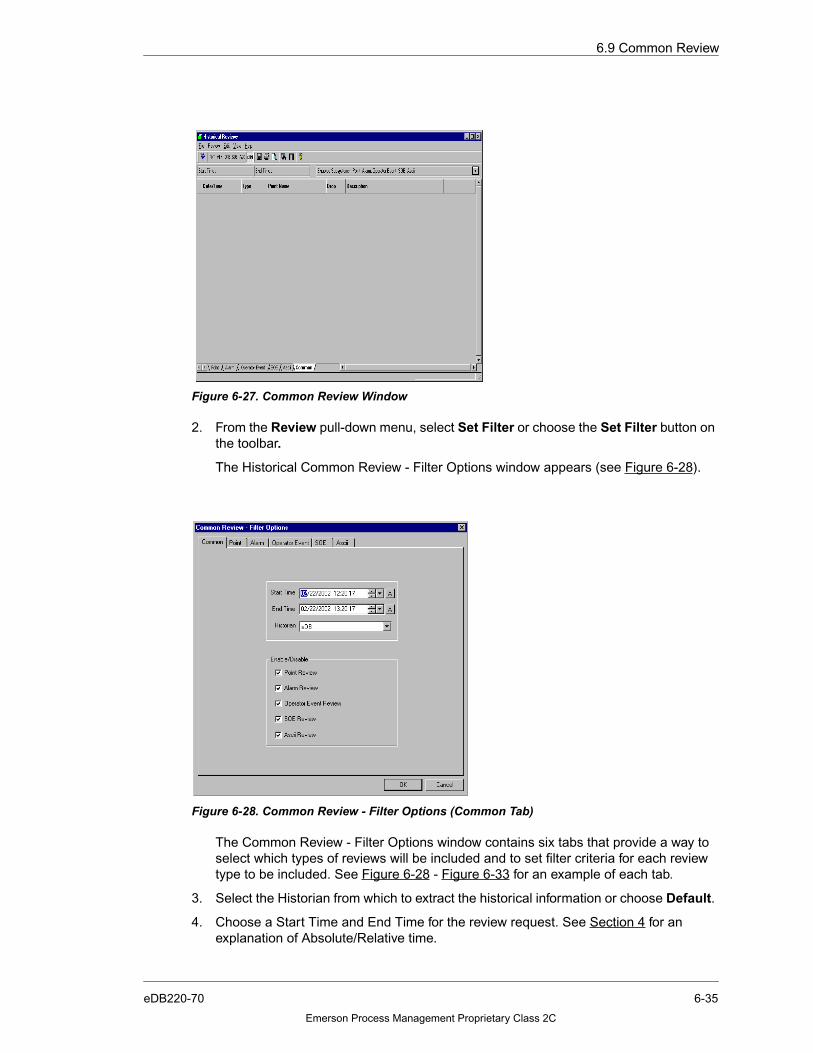
6.9 Common Review
2. From the Review pull-down menu, select Set Filter or choose the Set Filter button onthe toolbar.
The Historical Common Review - Filter Options window appears (see Figure 6-28).
The Common Review - Filter Options window contains six tabs that provide a way toselect which types of reviews will be included and to set filter criteria for each reviewtype to be included. See Figure 6-28 - Figure 6-33 for an example of each tab.
3. Select the Historian from which to extract the historical information or choose Default.
4. Choose a Start Time and End Time for the review request. See Section 4 for anexplanation of Absolute/Relative time.
Figure 6-27. Common Review Window
Figure 6-28. Common Review - Filter Options (Common Tab)
6-35eDB220-70
Emerson Process Management Proprietary Class 2C

6.9 Common Review
5. Select the types of review data to include.
6. Select the criteria for each selected review type.
7. Click Ok to begin the Review. A status dialog will appear informing you that theCommon Review is in progress.
Note:
To cancel a review in progress, select the Cancel button. Themessage, “Data retrieval terminated by user” will appearin the window footer.
When the review process is completed, the following message appears inthe window footer:
Common review complete.
The applicable review data appears in the window. Note that for reviewdisplays, the number of records reviewed is shown on the right side of thefooter.
Figure 6-29. Common Review - Filter Options (Point Tab)
6-36 eDB220-70
Emerson Process Management Proprietary Class 2C
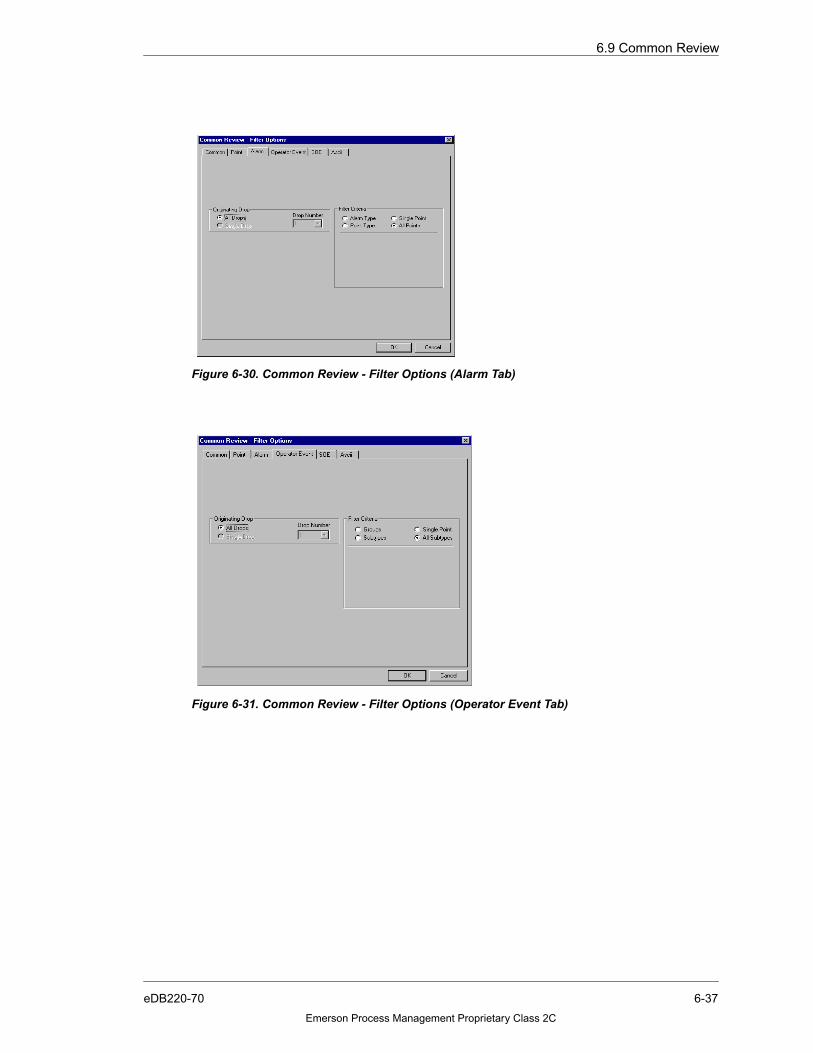
6.9 Common Review
Figure 6-30. Common Review - Filter Options (Alarm Tab)
Figure 6-31. Common Review - Filter Options (Operator Event Tab)
6-37eDB220-70
Emerson Process Management Proprietary Class 2C

6.9 Common Review
Figure 6-32. Common Review - Filter Options (SOE Tab)
Figure 6-33. Common Review - Filter Options (Ascii Tab)
6-38 eDB220-70
Emerson Process Management Proprietary Class 2C

6.10 Printing and Saving Historical Review
6.10 PRINTING AND SAVING HISTORICAL REVIEW
The following sections discuss printing, print previewing and saving historical reviews.These procedures apply to all of the historical reviews.
6.10.1 PRINTING HISTORICAL REVIEWS
After the review properties have been selected and applied, a review request can be sentto the Printer to be printed. Use the following procedure to print reviews.
1. From the Historical Review window, select the File -> Print. You may also select thePrinter icon from the toolbar.
2. The standard Windows Print window appears. Make any necessary changes.
3. Select Ok to begin printing.
6.10.2 PRINT PREVIEWING HISTORICAL REVIEWS
After the review properties have been selected and applied, a review request can bepreviewed before it is printed. Use the following procedure to print preview.
1. From the Historical Review window, select the File -> Print Preview. You may alsoselect the Print Preview icon from the toolbar.
2. The standard Windows Print Preview window will appear.
3. Choose Close to return to the Historical Review window.
6.10.3 SAVING HISTORICAL REVIEWS AS TEXT
After the review properties have been selected, a review request can be saved as a text file.Use the following procedure to save reviews.
1. From the Historical Review window, select File -> Save as Text. You may also choosethe Save icon on the toolbar.
2. The standard Windows Save As window will appear.
3. Choose a directory in which to save the file, name the file, and choose Save. ChooseCancel to cancel the save.
6.11 COLUMN SORTING IN THE REVIEW RESULTS WINDOW
1. Click on a column heading to sort the data in descending order.
2. Click again to sort the data in ascending order.
6-39eDB220-70
Emerson Process Management Proprietary Class 2C


SECTION 7. REPORTING
7.1 SECTION OVERVIEW
The eDB Historian Report Server is a package for designing, modifying, and generatingreports that display data collected by the eDB Historian.
The Report Server package can be loaded and run on an Engineering Station or anOperator Station.
Note:
It is recommended that the Report Server package be loaded on amachine other than the eDB. If there is a lack of other available machines,then the Report Server can run on the eDB. The machine will need OracleClient software to generate all of the report types. Refer to Appendix B formore information.
Reports can be generated, either scheduled, triggered by an event, or on demand, usingthe eDB Report Manager. Through the eDB Report Manager, the user can specify whethera report output is to be generated periodically, on an event, or on operator demand, whatdata the report output will display, what report layout file the report must use, and where thereport output will go.
For the eDB Historian, reports are built and executed using a third party product calledCrystal Reports from Crystal Decisions. Refer to the Crystal Reports User Manual forinformation regarding the use of Crystal Reports.
Note:
Crystal Decisions maintains a website that provides useful informationregarding Crystal Reports. This site can be reached atcommunity.crystaldecisions.com
7-1eDB220-70
Emerson Process Management Proprietary Class 2C

7.2 Generating Reports
7.2 GENERATING REPORTS
The eDB Report Manager is comprised of six components. The six components arerepresented in the following diagram:
■ Report Manager
■ Report Manager Configuration Database
■ Report Layout File (.rpt)
■ ExpressCalc Report Results Database
■ Report User Function Library
■ Crystal Report Engine
Figure 7-1. eDB Report Manager Components
eDB Report Server
7-2 eDB220-70
Emerson Process Management Proprietary Class 2C

7.2 Generating Reports
7.2.1 eDB REPORT MANAGER
The eDB Report Manager, developed by Emerson, controls the generation of all reportoutputs through an Active X link to the Crystal Reports Engine. Through a series of dialogboxes, the user is able to define and schedule multiple report outputs by defining the reporttype, configuring the points used in the report, defining the desired report definition file,specifying the desired start time (or event) and report time duration, and identifying anyreport specific information such as header text. The output from these user dialog boxes isused to generate a report trigger that initiates the generation of the report.
Note:
ExpressCalc and Direct report types are defined in Section 7.3.1 of thisdocument.
7.2.2 REPORT MANAGER CONFIGURATION DATABASE
The Report Manager Configuration Database contains all information required by thereport manager to generate a desired report at the desired time or following a triggeredevent. Also included in the database is report related data that is passed from the reportmanager to the actual report via the Report User Function Library. Some of the informationin these tables include report header text, points used in each report, start and stop times,as well as data critical to maintaining the schedules defined by the user.The ReportManager Configuration Database resides inside an Access Database at the client machinerequesting reports.
7.2.3 EXPRESSCALC REPORT RESULTS DATABASE
Historical data gathered and pre-processed by the ExpressCalc Report pre-processor isstored in the tables of this database. This data is available to the Crystal Reports Enginefor use with ExpressCalc Reports.
The ExpressCalc Report Results Database resides inside an Access Database at the clientmachine requesting reports. ExpressCalc reports are defined in Section 7.3.1.
7.2.4 REPORT LAYOUT FILE (.RPT)The .rpt file is the template that the report engine uses to provide the report output. Thereport definition in this file defines what table data will be displayed and the format used todisplay the data.
The Report Builder only creates a report layout file, not final reports with data. This reportlayout file describes the data to be obtained when the report is actually generated, and howit is to be formatted. Refer to Section 7.3 for information on building report layouts.
A complete library of standard reports is provided as part of the Report Server (seeAppendix A). These are fully functional reports that are designed to address most of theusers reporting needs.
7.2.5 REPORT USER FUNCTION LIBRARY (UFL)The Report User Function Library, developed by Emerson, is a support library that providesa series of convenient and easy to use functions that enable the user to perform commonfunctions such as:
■ Convert GMT to local time
■ Obtain definitions to perform specific data groupings
■ Evaluate historical data values and statuses
7-3eDB220-70
Emerson Process Management Proprietary Class 2C
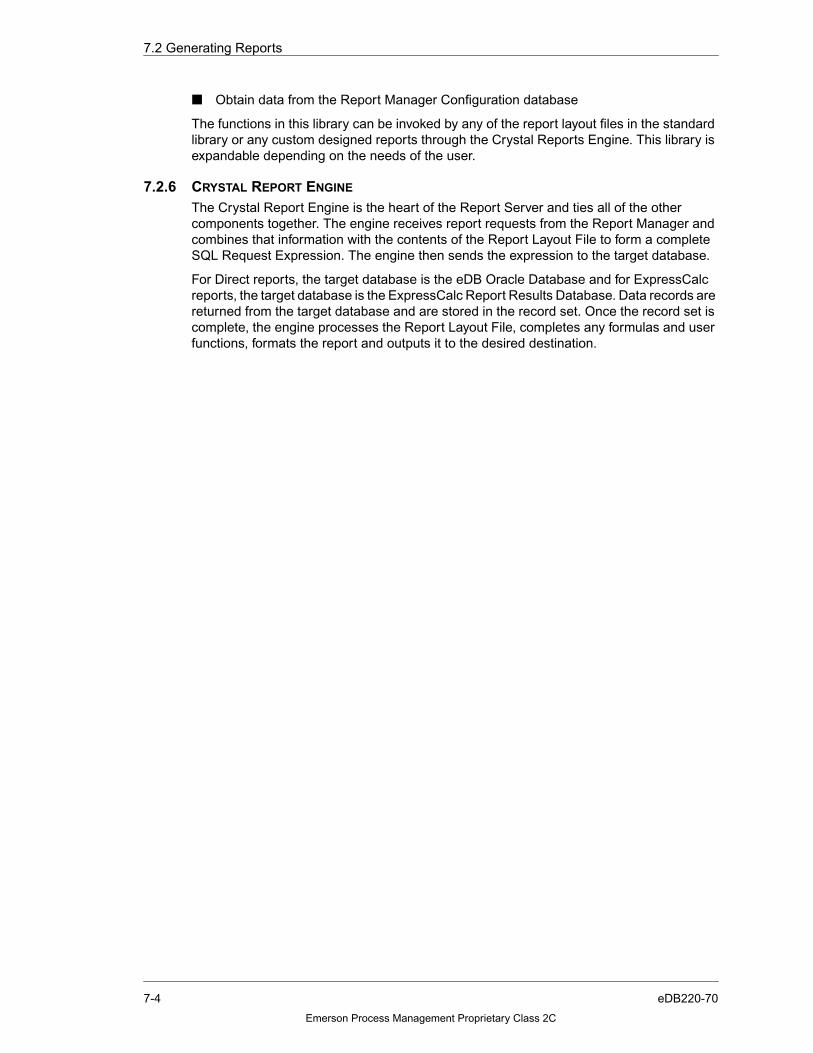
7.2 Generating Reports
■ Obtain data from the Report Manager Configuration database
The functions in this library can be invoked by any of the report layout files in the standardlibrary or any custom designed reports through the Crystal Reports Engine. This library isexpandable depending on the needs of the user.
7.2.6 CRYSTAL REPORT ENGINE
The Crystal Report Engine is the heart of the Report Server and ties all of the othercomponents together. The engine receives report requests from the Report Manager andcombines that information with the contents of the Report Layout File to form a completeSQL Request Expression. The engine then sends the expression to the target database.
For Direct reports, the target database is the eDB Oracle Database and for ExpressCalcreports, the target database is the ExpressCalc Report Results Database. Data records arereturned from the target database and are stored in the record set. Once the record set iscomplete, the engine processes the Report Layout File, completes any formulas and userfunctions, formats the report and outputs it to the desired destination.
7-4 eDB220-70
Emerson Process Management Proprietary Class 2C
7.3 Building Report Layouts
7.3 BUILDING REPORT LAYOUTS
Reports contain data gathered from the eDB Historian Database, either directly or viaExpressCalc, and are presented in a format specified in the user created Report LayoutFile.
The Report Builder creates Report Layout Files that define the table data to be presentedand the form and format that is to be presented on the report. This form and format includessuch things as:
■ Grouping and placement of data on the report
■ Summarization of data gathered
■ Data display details such as font type, font size, and font attributes
■ Support display such as graphics, supplemental text, and page counts
The Report Builder uses the Crystal Reports Integrated Design Environment (IDE) togenerate all Report Layout files. This is a user friendly platform provided with CrystalReports to design, develop, and test report layout files.
7.3.1 DIRECT REPORTS VERSUS EXPRESSCALC REPORTS
All historical data originates in the eDB Oracle Database. However, for reporting purposes,the data can be accessed using either of the following two methods.
The Direct Report Method allows the report designer to access data directly from the eDBOracle Database in original storage form with no pre-processing performed. All report dataprocessing must be done within the Report Layout File using formulas, functions, and thereport design techniques. The standard report library contains point data and message textreports that can be used as templates for new and/or modified reports of this type. Reportdesigns using this method can take longer to complete and are more complex.
The ExpressCalc Report Method uses a report pre-processor to collect and process datafrom the eDB Oracle Database based upon configurations defined in the Report Manager.The pre-processor output is then stored in the Report Results Database which is madeavailable to any report designer. This method minimizes the need for any data processinginside the Report Layout File. Reports can be designed and completed faster using simpledrag and drop principles. The standard Report Library contains templates that can be usedto generate reports quickly and easily.
Both methods are available to the report designer. Unless otherwise specified, allinformation provided in the following sections apply to both reporting methods.
7.3.2 STANDARD REPORTS LIBRARY
The Report Server includes a full selection of standard Direct Reports Layout Files, bothpoint data and message text, that are designed to address most of the users reportingneeds. There are also ExpressCalc Report File Templates available as part of the standardproduct.
7.3.3 CRYSTAL REPORTS LAYOUT FILE CONTENTS
Each Report Layout File is broken down into report sections that define where informationis placed on the report and when the information for that section was created. There arefive sections that are mandatory for all Report Layout Files and two optional sections thatcan be added to Report Layout Files, based upon need. To view or alter these sections,load the reports layout file into the Crystal Reports IDE. The five mandatory sections are:
7-5eDB220-70
Emerson Process Management Proprietary Class 2C
7.3 Building Report Layouts
■ Report Header - This section appears at the top of the first page of a report. Thissection is printed one time per report at the start of the report, and the contents of thesection are evaluated only one time at the start of the report.
■ Report Footer - This section appears at the bottom of the last page of the report. Thissection is printed one time per report at the end of the report, and the contents of thesection are evaluated only one time at the end of the report.
■ Page Header - This section appears at the top of each page of a report. This sectionis printed one time for each report page at the start of the page, and the contents of thesection are evaluated one time per page at the start of each report page.
■ Page Footer - This section appears at the bottom of the each page of a report. Thesection is printed one time for each report page at the end of the page, and the contentsof the section are evaluated one time per page at the end of each report page.
■ Details - This section is the body of the report. Data in this section is processed foreach record in the record set evaluated.
OPTIONAL SECTIONS
The optional sections appear in sets of two and a variable number of sets can be added toa Report Layout File by the user. The purpose of these sections are to group and/or sortrecord set data according to a specified criteria. Grouping, Sorting, and Totaling record datais discussed in detail in the Crystal Reports User Manual.
Each set of two contains:
■ Group Header - This is the beginning section for each group set added. The section isprinted one time for each section at the start of the section, and the contents of thesection are evaluated one time per section at the start of each section.
■ Group Footer - This is the ending section for each group set added. The section isprinted one time for each section at the end of the section, and the contents of thesection are evaluated one time per section at the end of each section.
Each section has a sizing handle to allow the user to determine the amount of space thesection will use in the final report output. There is also a section submenu that can beaccessed with a right mouse click. This provides the capability to hide, suppress or furtherformat any section. Formatting is discussed in detail in the Crystal Reports User Manual.
7-6 eDB220-70
Emerson Process Management Proprietary Class 2C

7.3 Building Report Layouts
7.3.4 CRYSTAL REPORT LAYOUT FILE FIELDS
Report Layout Files are populated with fields that contain information that is displayed onthe final report output. Fields are categorized according to type. Some of the more commonfields used are:
■ Database: for display of record data
■ Text: for display of fixed text information
■ Formula: for greater degree of control over report data
■ Parameter: see the Crystal Reports User Guide
■ Special: for display of specific data such as page number, and so forth
Field type selection, placement, and formatting are discussed in the Crystal Reports UserGuide.
The Crystal Reports IDE manages fields as objects. As such, each field has a uniqueidentity and set of properties. Field placement and size can be managed through Windowsdrag and drop principles and sizing handle principles. There is also a field submenuaccessible with a right mouse click on the field. This provides the capability to edit, size, orfurther format any field.
7.3.5 CRYSTAL REPORT LAYOUT FILE FORMULAS
The use of formulas provide the user with a greater degree of control over report output interms of data processing, placement, display, grouping and collection. Formulas areactually functions written in programming language syntax that provide access to othersupport functions in the libraries that are provided with the Crystal Reports Developmentpackage.
Formulas are also the only method of access to the Report Function Library which containsfunctions that enable the user to perform a variety of tasks such as:
■ Obtain data from the Report Manager Configuration Database
■ Convert GMT to local time
■ Obtain definitions to perform specific data groupings
■ Evaluate historical data values and statuses
Formula, formula development, and formula language syntax are discussed in detail in theCrystal Reports User Guide.
7.3.6 MODIFYING AN EXISTING REPORT LAYOUT FILE (.RPT)A complete library of fully functional Report Layout Files (.rpt) is provided with the ReportServer. These files should address most of your reporting needs. Refer to Appendix A forreport samples.
However, there may be occasions where project reporting needs cannot be satisfied withthis Report Layout File Library without some modifications. On those occasions, a newReport Layout File can be generated using one of the existing files as a template.
7-7eDB220-70
Emerson Process Management Proprietary Class 2C

7.3 Building Report Layouts
Use the following procedure to find the Report Layout File that most closely matches yourreporting needs:
1. Launch Crystal Reports IDE from the Windows environment by navigating through thefollowing path:
Start -> Programs -> Seagate Crystal Reports (see Figure 7-2)
2. Within Crystal Reports, use the File -> Open menu command (see Figure 7-2).
3. An Open Report Folders dialog box appears (see Figure 7-3). This dialog box containstwo folders, the MsgReports Folder, the PtReports Folder.
Figure 7-2. Crystal Reports Main Screen (File Menu)
7-8 eDB220-70
Emerson Process Management Proprietary Class 2C

7.3 Building Report Layouts
4. The PtReports Folder contains Point Report templates and the MsgReports Foldercontains Message Report templates. Choose the desired folder and click Open. TheEmerson provided sample .rpt files will appear (see Figure 7-4, and Figure 7-5).
5. Choose a sample template and click Open.
Figure 7-3. Open Report Folders Dialog Box
Figure 7-4. Message Templates
7-9eDB220-70
Emerson Process Management Proprietary Class 2C
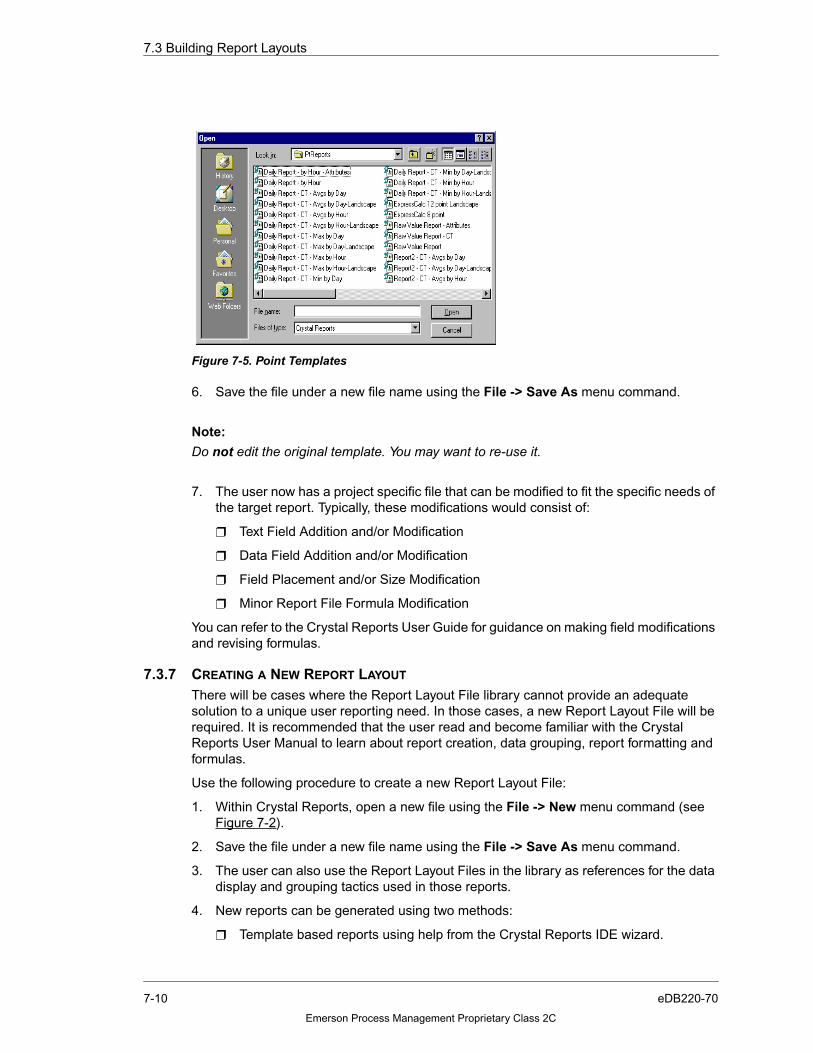
7.3 Building Report Layouts
6. Save the file under a new file name using the File -> Save As menu command.
Note:
Do not edit the original template. You may want to re-use it.
7. The user now has a project specific file that can be modified to fit the specific needs ofthe target report. Typically, these modifications would consist of:
❒ Text Field Addition and/or Modification
❒ Data Field Addition and/or Modification
❒ Field Placement and/or Size Modification
❒ Minor Report File Formula Modification
You can refer to the Crystal Reports User Guide for guidance on making field modificationsand revising formulas.
7.3.7 CREATING A NEW REPORT LAYOUT
There will be cases where the Report Layout File library cannot provide an adequatesolution to a unique user reporting need. In those cases, a new Report Layout File will berequired. It is recommended that the user read and become familiar with the CrystalReports User Manual to learn about report creation, data grouping, report formatting andformulas.
Use the following procedure to create a new Report Layout File:
1. Within Crystal Reports, open a new file using the File -> New menu command (seeFigure 7-2).
2. Save the file under a new file name using the File -> Save As menu command.
3. The user can also use the Report Layout Files in the library as references for the datadisplay and grouping tactics used in those reports.
4. New reports can be generated using two methods:
❒ Template based reports using help from the Crystal Reports IDE wizard.
Figure 7-5. Point Templates
7-10 eDB220-70
Emerson Process Management Proprietary Class 2C

7.3 Building Report Layouts
❒ Blank reports without Crystal Reports IDE wizard help.
Template based reports make use of the Crystal Reports IDE format wizards and standardreporting objects to generate the Report Layout Files. These files provide excellent reportoutput, however, there is limited control over report output. Formulas can be added to thesereports to gain a considerable degree of control.
Blank reports provide a very high degree of report output, however, they require extensiveuse of custom design procedures, formulas and running totals.
7-11eDB220-70
Emerson Process Management Proprietary Class 2C

7.4 eDB Report Manager
7.4 eDB REPORT MANAGER
7.4.1 OVERVIEW
The user can create customized reports and execute them in order to view or print thehistorical data from the eDB database. Crystal Reports provides the basic functionality ofcreating and executing customized reports. The report generation can be made moreefficient if the scheduling and generation of reports is automated. The eDB Report Manageris an application that is designed to automatically schedule and generate reports.
The eDB Report Manager uses an event driven mechanism to generate reports at regulartime intervals, in response to system events, or on demand. This application allows the userto configure the report details.
The eDB Report Manager application consists of two independent tasks that communicatevia the Report Manager Configuration Database.
■ Scheduler - The “Scheduler” task regularly scans the configuration tables for allreports in the database to determine if it is time for any configured reports to begenerated or if a report trigger event has occurred. If a report is due to be generated,the “Scheduler” will compile all required details of a report, point list, start or stop times,and so on, into a single entry in the report queue.
■ Generator - The “Generator” task regularly scans the report queue to look for entriesdue for processing. For each pending entry found in the report queue, the “Generator”will gather the information in the entry and generate the report through the CrystalReport Engine. Because these two tasks are independent of each other, they can beconfigured to run on different frequencies and stopped and started independently.
7.4.2 SECURITY
Access is based on your Windows login name. Non administrative users have access to allreports and may request generation of a report, but may not modify any of the reportconfiguration parameters.
7.4.3 eDB REPORT MANAGER PROCEDURE OVERVIEW
This application is designed to run on a Windows NT 4.0 platform and uses an ODBCconnection to store and retrieve data from a Report Manager Configuration Database.Using the application typically involves the following steps:
1. Configure eDB report manager (Section 7.4.5)
2. Configure shift lengths (Section 7.4.6)
3. Configure reports formats (Section 7.4.9)
4. Define reports details (Section 7.4.10, Section 7.4.11)
5. Generate reports for a given time interval (on demand) (Section 7.4.12)
6. Configure reports under timed, triggered, or demand events (Section 7.4.13)
Some of the additional features supported by this application are:
■ View Crystal Report error (Section 7.4.15)
■ Import and Export Report Manager Database (Section 7.4.17)
■ Minimize to System Tray (Section 7.4.18)
■ Status Log File (Section 7.4.19)
7-12 eDB220-70
Emerson Process Management Proprietary Class 2C

7.4 eDB Report Manager
7.4.4 USING THE eDB REPORT MANAGER APPLICATION
The eDB Report Manager Application should start automatically when the Operator Stationis turned on, and you log in, but it can also be started manually.
Use the following procedure to manually start the eDB Report Manager application:
1. Right-click to open the My Computer icon on your desktop and choose Explore fromthe pop-up menu.
2. Open the Drive where the eDB Historian software is loaded (for example D: or E:)
3. Double-click to open the eDBHistorian folder.
4. Double-click to open the Reports folder.
5. Double-click to open the EHRPTScheduler.exe file.
6. The eDB Report Manager will open and minimize to the System Tray (typically, locatedon the far right side of the task bar at the bottom of computer monitor screen).
You can restore the application window by right-clicking or double-clicking the icon on theSystem Tray.
Note:
The eDB Report Manager can be shut-down if File -> Exit is chosen or the“X” button in the top right corner is selected. After the selection, amessage dialog box will appear requesting confirmation to minimize to theSystem Tray. When No is selected, the Manager will shut-down. If the eDBReport Manager is shut-down, scheduled or triggered reports will not run.Minimize the program to the System Tray when not in use.
7.4.5 CONFIGURING THE eDB REPORT MANAGER
This Configuration dialog box allows you to configure the eDB Report Manager. This box isaccessed by choosing File -> Configure eDB Report Manager or the shortcut icon on thetoolbar. The Configuration dialog box contains three tabs, General, SOE, and Triggers(see Figure 7-6 through Figure 7-8).
PROCEDURE
Use the following procedure to configure the eDB Report Manager:
1. Access the File submenu from the eDB Report Manager window.
2. Choose Configure eDB Report Manager. The Configuration dialog box appears. Thisdialog box contains three tabs, General, SOE, and Triggers (see Figure 7-6 throughFigure 7-8).
3. Make your changes in each tab and select Ok to accept the changes.
7-13eDB220-70
Emerson Process Management Proprietary Class 2C

7.4 eDB Report Manager
Figure 7-6. General Configuration Tab
Figure 7-7. SOE Configuration Tab
7-14 eDB220-70
Emerson Process Management Proprietary Class 2C
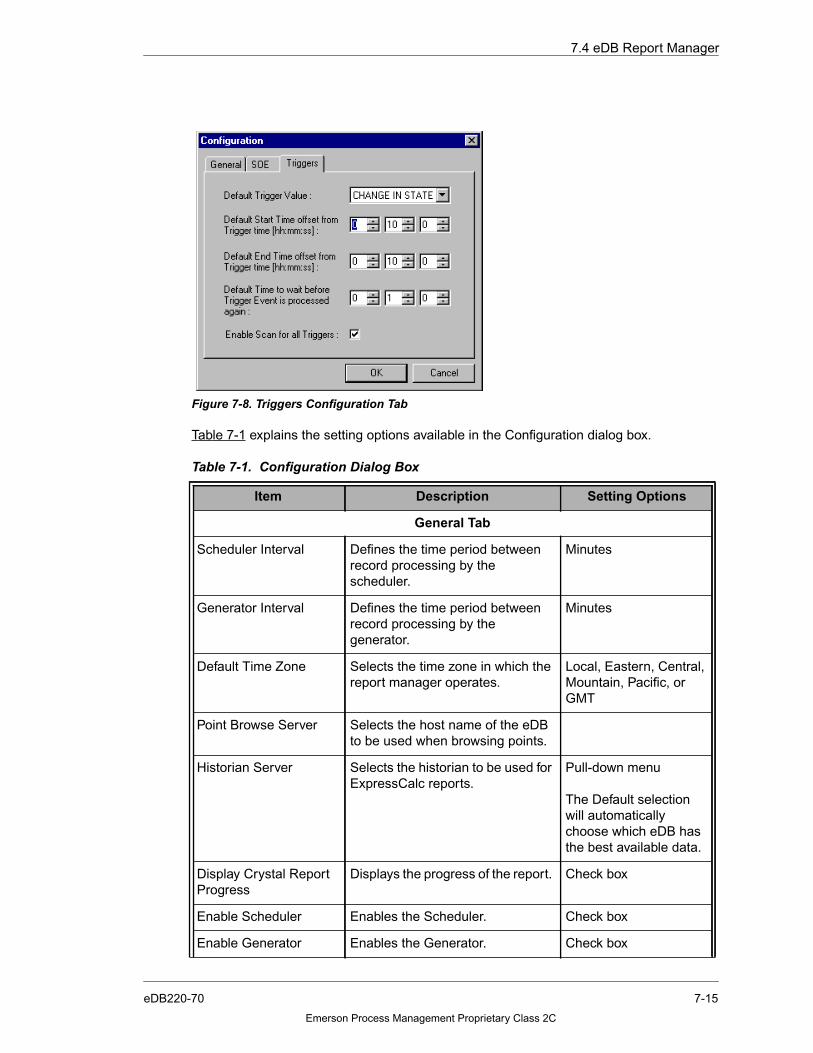
7.4 eDB Report Manager
Table 7-1 explains the setting options available in the Configuration dialog box.
Figure 7-8. Triggers Configuration Tab
Table 7-1. Configuration Dialog Box
Item Description Setting Options
General Tab
Scheduler Interval Defines the time period betweenrecord processing by thescheduler.
Minutes
Generator Interval Defines the time period betweenrecord processing by thegenerator.
Minutes
Default Time Zone Selects the time zone in which thereport manager operates.
Local, Eastern, Central,Mountain, Pacific, orGMT
Point Browse Server Selects the host name of the eDBto be used when browsing points.
Historian Server Selects the historian to be used forExpressCalc reports.
Pull-down menu
The Default selectionwill automaticallychoose which eDB hasthe best available data.
Display Crystal ReportProgress
Displays the progress of the report. Check box
Enable Scheduler Enables the Scheduler. Check box
Enable Generator Enables the Generator. Check box
7-15eDB220-70
Emerson Process Management Proprietary Class 2C

7.4 eDB Report Manager
7.4.6 CONFIGURING SHIFT TIME INTERVALS
The Shift Configuration dialog box allows you to configure the time definitions for Shifttimes. By default, the report manager supports three shifts which are eight hours in length,and these shift times may be changed. If a timed event has a Shift time format, the nextevent due date time is calculated by using this table.
PROCEDURE
Use the following procedure to configure Shift Time Intervals:
1. Access the File submenu from the eDB Report Manager window.
SOE Tab
Last SOE Processed Identifies the date and time of thelast SOE message processed.
Date, time andnanoseconds
Max SOE Hold Time Defines the maximum time periodto hold SOE messages beforeprinting.
Seconds
Max SOE Hold Count Defines the maximum SOEmessage count to hold beforeprinting.
Messages
Report Definition Identifies the report definition usedto generate the SOE report.
List box
Enable Enables/Disables automatic SOEreport generation.
Check box
Triggers Tab
Default Trigger Value Selects the default trigger value foruse when defining new triggers.
0,1, or Change in State.
Default Start Time offsetfrom Trigger time(hh:mm:ss)
Selects the default for the amountof time (prior to trigger) that will beincluded in the report.
Default End Time offsetfrom Trigger time(hh:mm:ss)
Selects the default for the amountof time (after the trigger) that will beincluded in the report.
Default Time to waitbefore Trigger Event isprocessed again
Selects the default time to waitbetween processing theoccurrence of the same trigger.
Enable Scan for allTriggers
Enables/disables the scan for alltriggers.
Check box.
Table 7-1. Configuration Dialog Box (Cont’d)
Item Description Setting Options
7-16 eDB220-70
Emerson Process Management Proprietary Class 2C
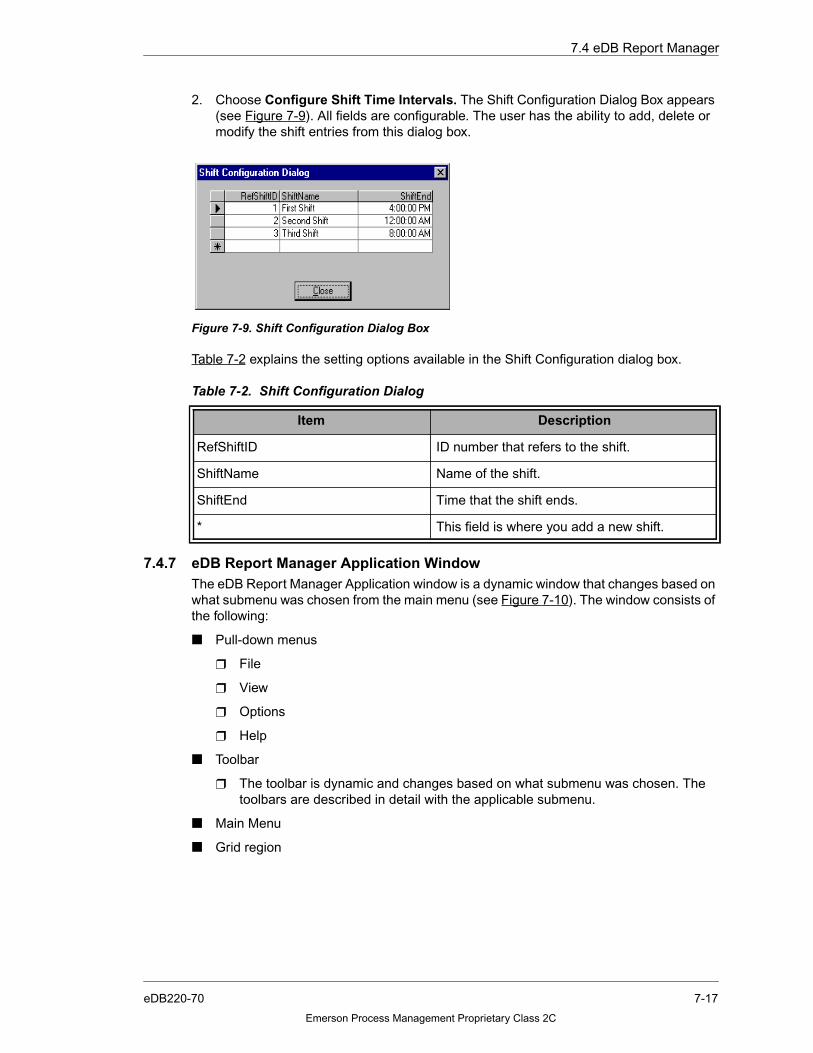
7.4 eDB Report Manager
2. Choose Configure Shift Time Intervals. The Shift Configuration Dialog Box appears(see Figure 7-9). All fields are configurable. The user has the ability to add, delete ormodify the shift entries from this dialog box.
Table 7-2 explains the setting options available in the Shift Configuration dialog box.
7.4.7 eDB Report Manager Application WindowThe eDB Report Manager Application window is a dynamic window that changes based onwhat submenu was chosen from the main menu (see Figure 7-10). The window consists ofthe following:
■ Pull-down menus
❒ File
❒ View
❒ Options
❒ Help
■ Toolbar
❒ The toolbar is dynamic and changes based on what submenu was chosen. Thetoolbars are described in detail with the applicable submenu.
■ Main Menu
■ Grid region
Figure 7-9. Shift Configuration Dialog Box
Table 7-2. Shift Configuration Dialog
Item Description
RefShiftID ID number that refers to the shift.
ShiftName Name of the shift.
ShiftEnd Time that the shift ends.
* This field is where you add a new shift.
7-17eDB220-70
Emerson Process Management Proprietary Class 2C
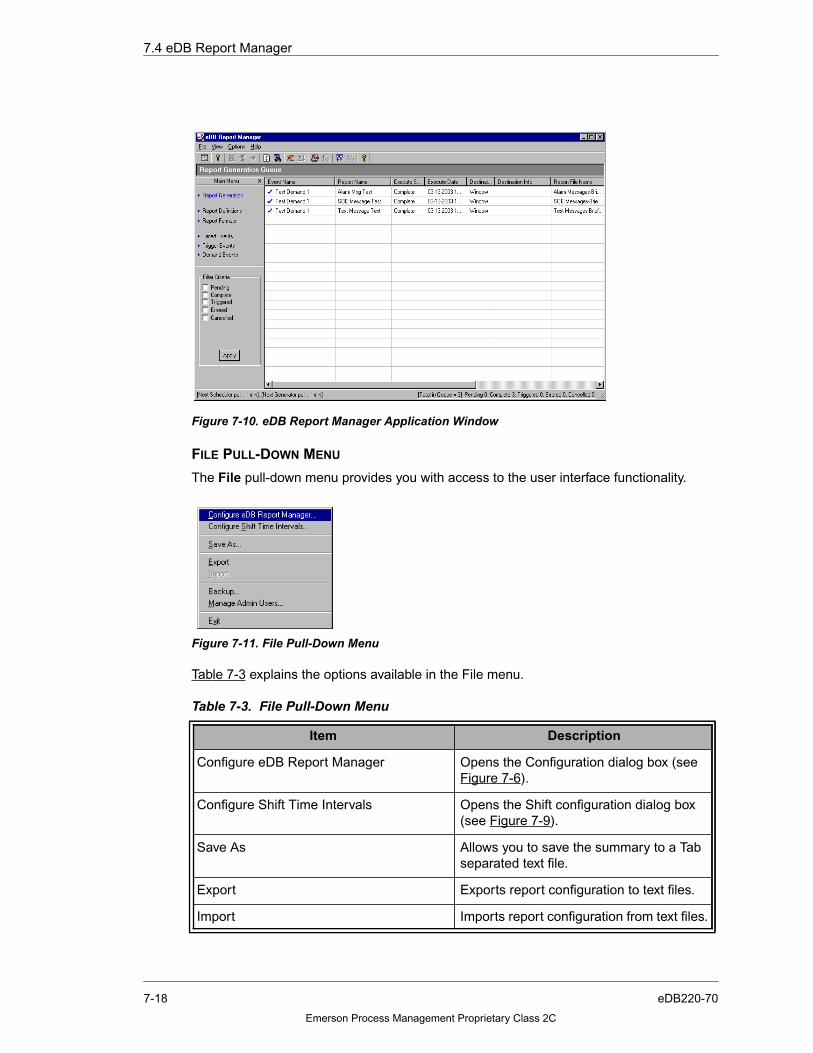
7.4 eDB Report Manager
FILE PULL-DOWN MENU
The File pull-down menu provides you with access to the user interface functionality.
Table 7-3 explains the options available in the File menu.
Figure 7-10. eDB Report Manager Application Window
Figure 7-11. File Pull-Down Menu
Table 7-3. File Pull-Down Menu
Item Description
Configure eDB Report Manager Opens the Configuration dialog box (seeFigure 7-6).
Configure Shift Time Intervals Opens the Shift configuration dialog box(see Figure 7-9).
Save As Allows you to save the summary to a Tabseparated text file.
Export Exports report configuration to text files.
Import Imports report configuration from text files.
7-18 eDB220-70
Emerson Process Management Proprietary Class 2C

7.4 eDB Report Manager
VIEW PULL-DOWN MENU
The choices available in the View menu (Figure 7-12) allow you to configure the view of theeDB Report Manager application. A check mark denotes the current selection.
Table 7-4 explains the setting options available in the View pull-down menu.
Backup Opens the Backup Data dialog box (seeFigure 7-40).
Manage Admin Users Displays an Admin Users dialog box. Youcan add or remove administrative usersfrom this dialog.
Exit Exits the eDB Report Manager.
Figure 7-12. View Pull-Down Menu
Table 7-4. View Pull-Down Menu
Item Description
Toolbar A checkmark denotes that the toolbar isvisible.
Status Bar A checkmark denoted that the status bar isvisible.
Find Displays the find dialog box.
Report Generation A checkmark denotes that the ReportGeneration submenu is visible.
Report Definitions A checkmark denotes that the ReportDefinitions submenu is visible.
Report Formats A checkmark denotes that the Report Formatssubmenu is visible.
Timed Events A checkmark denotes that the Timed Eventssubmenu is visible.
Table 7-3. File Pull-Down Menu (Cont’d)
Item Description
7-19eDB220-70
Emerson Process Management Proprietary Class 2C
7.4 eDB Report Manager
OPTIONS PULL-DOWN MENU
The Options menu changes based upon what was chosen from the Main Menu. Section7.4.9 describes the available selections from the Options menu when a Report submenu ischosen. Section 7.4.13 describes the available selections from the Options menu when aEvent submenu is chosen. These choices are also available from the right-click menu.
HELP PULL-DOWN MENU
The eDB Report Manager offers a Help pull-down menu. On-line Help will be provided in afuture release (see Figure 7-13). The About selection provides release information.
Trigger Events A checkmark denotes that the Trigger Eventssubmenu is visible.
Demand Events A checkmark denotes that the DemandEvents submenu is visible.
Figure 7-13. Help Pull-Down Menu
Table 7-4. View Pull-Down Menu (Cont’d)
Item Description
7-20 eDB220-70
Emerson Process Management Proprietary Class 2C

7.4 eDB Report Manager
eDB REPORT MANAGER MAIN MENU
The Main Menu (see Figure 7-14) provides access to the different submenus of the eDBReport Manager. The submenus are:
■ Report Generation (see Section 7.4.8)
■ Report Definitions (see Section 7.4.10)
■ Report Formats (see Section 7.4.9)
■ Timed Events (see Section 7.4.13)
■ Trigger Events (see Section 7.4.13)
■ Demand Events (see Section 7.4.13)
The grid portion of the window will change based on what was chosen from the Main Menu.The columns can be sorted and filtered.
7.4.8 eDB REPORT MANAGER REPORT GENERATION QUEUE
Figure 7-15 displays the Report Generation Queue. This is the home window of the eDBReport Manager. Report generation queue records are the records that are inserted by theScheduler into a queue that is processed by the Generator. The queue is a table in theReport Manager Configuration database.
Figure 7-14. Main Menu
7-21eDB220-70
Emerson Process Management Proprietary Class 2C
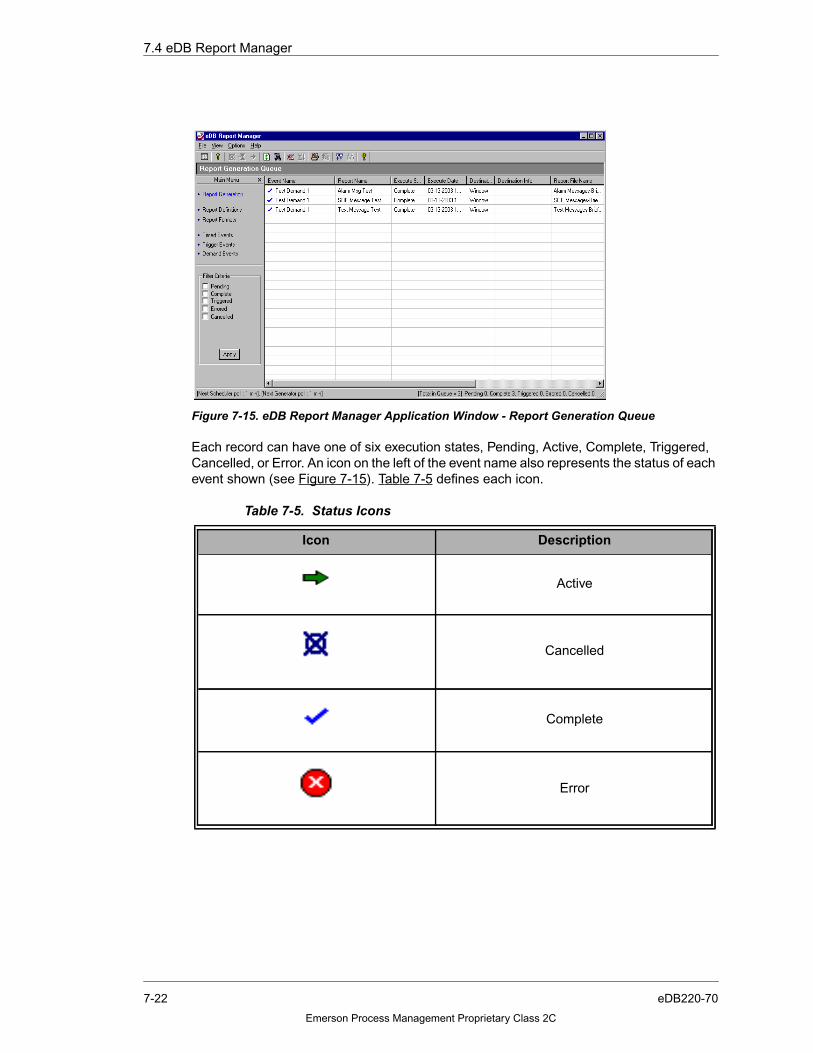
7.4 eDB Report Manager
Each record can have one of six execution states, Pending, Active, Complete, Triggered,Cancelled, or Error. An icon on the left of the event name also represents the status of eachevent shown (see Figure 7-15). Table 7-5 defines each icon.
Figure 7-15. eDB Report Manager Application Window - Report Generation Queue
Table 7-5. Status Icons
Icon Description
Active
Cancelled
Complete
Error
7-22 eDB220-70
Emerson Process Management Proprietary Class 2C

7.4 eDB Report Manager
By viewing the Report Generation Queue, the user can review the status of the reports thatwere scheduled and printed. This queue is constantly updated to ensure that records overone week old are deleted from the queue.
These records are presented in a scrollable grid format and include information pertainingto the events addressed including:
■ Event Name
■ Report Name
■ Execution Status
■ Execution Date
■ Report Output Destination
■ Destination Information
■ Report File Name
■ Report File Path
■ Create Date
■ Start Date
■ End Date
A Save As menu option is provided to permit export of this summary to a tab separated textfile file that can then be used for later review analysis.
REPORT GENERATION QUEUE TOOLBAR
The Report Generation Queue toolbar provides shortcuts to submenus.
Figure 7-16 displays the eDB Report Generation Toolbar.
Pending
Triggered
Figure 7-16. eDB Report Generation ToolBar
Table 7-5. Status Icons (Cont’d)
Icon Description
7-23eDB220-70
Emerson Process Management Proprietary Class 2C

7.4 eDB Report Manager
Table 7-6 defines the Icons in the Report Generation Queue toolbar.
Table 7-6. Icon Definitions
Icon Description
Show/hide left main menu bar
Configure eDB Report Manager
Change status to cancelled
Change status to pending
Generate report
Refresh from database
Find a string
Stop Scheduling Reports
Start Scheduling Reports
Stop Generating Reports
Start Generating Reports
7-24 eDB220-70
Emerson Process Management Proprietary Class 2C
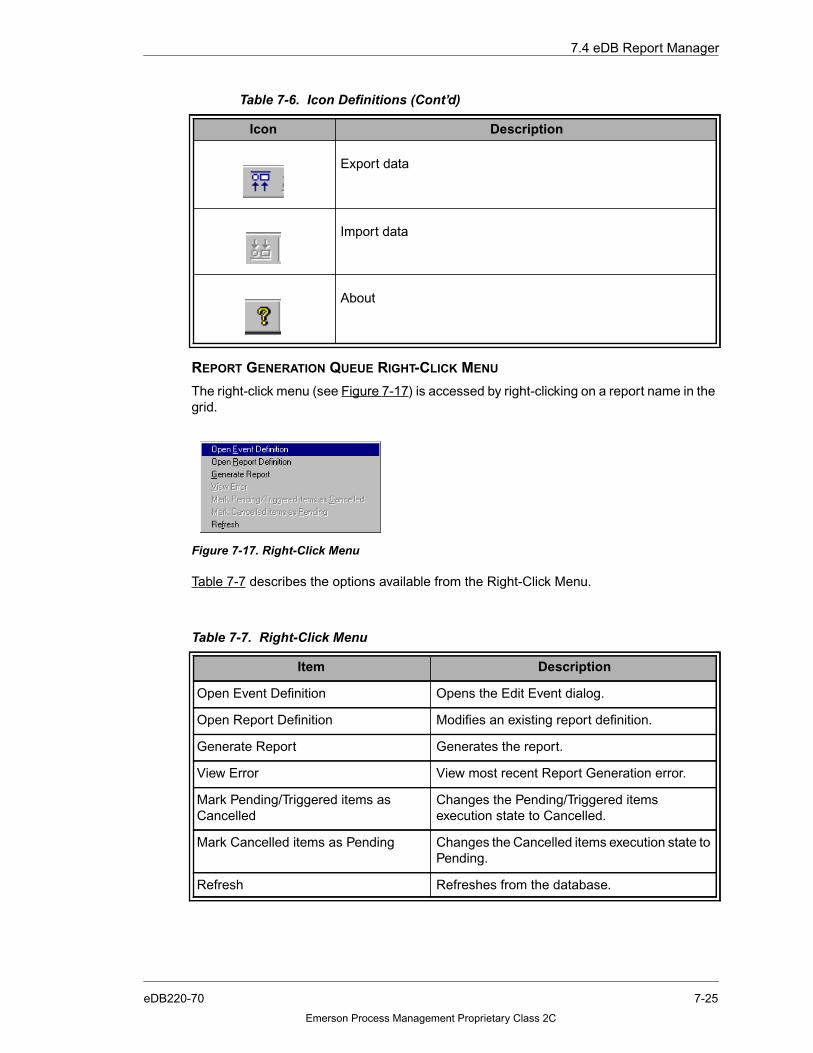
7.4 eDB Report Manager
REPORT GENERATION QUEUE RIGHT-CLICK MENU
The right-click menu (see Figure 7-17) is accessed by right-clicking on a report name in thegrid.
Table 7-7 describes the options available from the Right-Click Menu.
Export data
Import data
About
Figure 7-17. Right-Click Menu
Table 7-7. Right-Click Menu
Item Description
Open Event Definition Opens the Edit Event dialog.
Open Report Definition Modifies an existing report definition.
Generate Report Generates the report.
View Error View most recent Report Generation error.
Mark Pending/Triggered items asCancelled
Changes the Pending/Triggered itemsexecution state to Cancelled.
Mark Cancelled items as Pending Changes the Cancelled items execution state toPending.
Refresh Refreshes from the database.
Table 7-6. Icon Definitions (Cont’d)
Icon Description
7-25eDB220-70
Emerson Process Management Proprietary Class 2C

7.4 eDB Report Manager
7.4.9 CONFIGURING REPORT FORMATS
The Report Formats dialog box allows you to select the standard report templates orcustom report layouts files that you want to use for your reporting needs. This is the firststep in the reporting process.
REPORT FORMATS TOOLBAR
The Report Formats toolbar provides shortcuts to submenus.
Figure 7-18 displays the eDB Report Formats Toolbar.
Table 7-8 defines the Icons in the toolbar.
Figure 7-18. eDB Report Format ToolBar
Table 7-8. Icon Definitions
Icon Description
Show/hide left main menu bar
Configure eDB Report Manager
Add new format
Open report format definition
Delete
Refresh from database
Find a string
7-26 eDB220-70
Emerson Process Management Proprietary Class 2C
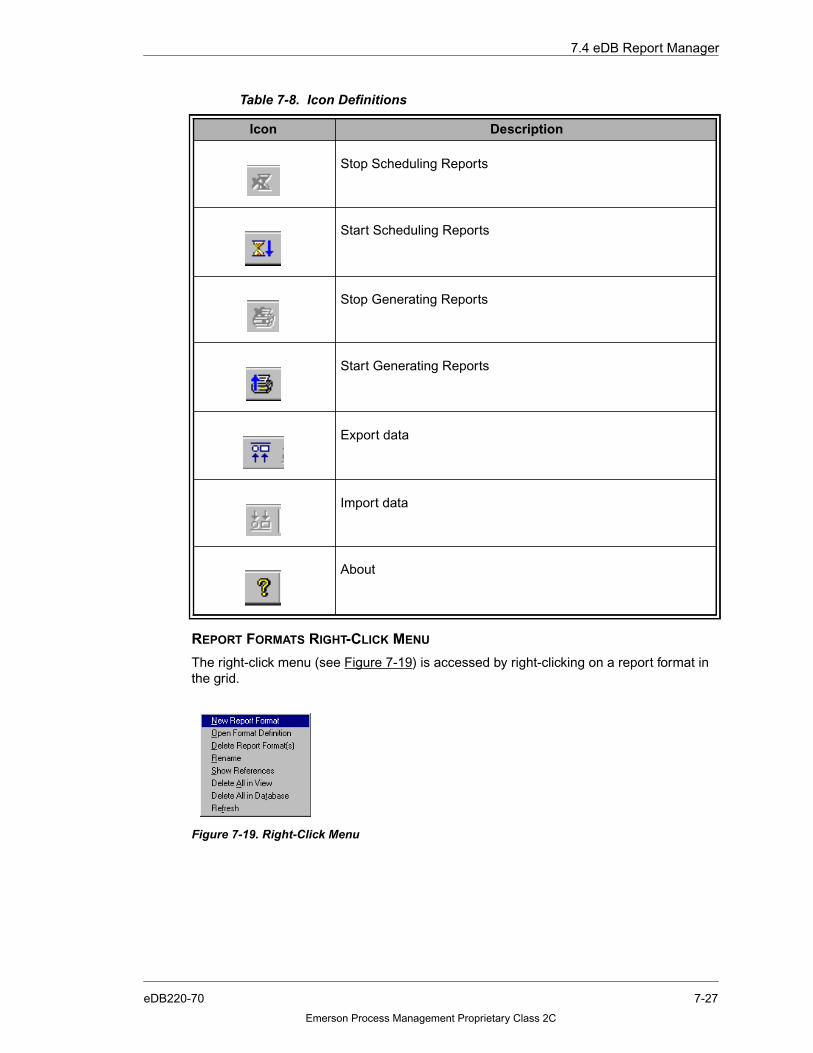
7.4 eDB Report Manager
REPORT FORMATS RIGHT-CLICK MENU
The right-click menu (see Figure 7-19) is accessed by right-clicking on a report format inthe grid.
Stop Scheduling Reports
Start Scheduling Reports
Stop Generating Reports
Start Generating Reports
Export data
Import data
About
Figure 7-19. Right-Click Menu
Table 7-8. Icon Definitions
Icon Description
7-27eDB220-70
Emerson Process Management Proprietary Class 2C

7.4 eDB Report Manager
Table 7-9 describes the options available from the Right-Click menu.
PROCEDURES
Use the following procedure to create a new Report Format:
1. Choose Report Formats from the Main Menu of the eDB Report Manager window.
2. Create a New Report Format by choosing Options -> Add New Report Format, theright-click menu, or the shortcut icon on the toolbar. A Report Format Propertieswindow will appear (see Figure 7-20). You may add multiple formats.
Use the following procedure to edit an existing Report Format:
1. Choose Report Formats from the Main Menu of the eDB Report Manager window
2. Configure an existing Report Format by double-clicking to open a Report Format fromthe grid, the right-click menu, or the shortcut icon on the toolbar. A Report FormatProperties window will appear (see Figure 7-20).
Table 7-9. Right-Click Menu
Item Description
New Report Format Opens the Report Format Properties window.
Open Format Definition Opens the Report Properties dialog.
Delete Report Format(s) Delete selected report formats.
Rename Rename a report format.
Show References Displays a Reference dialog that lists entriesreferring to the report selected.Shows whichEvents use report definitions.
Delete all in View Delete all report formats shown with currentfilter settings.
Delete all in Database Deletes all Report Formats from theconfiguration database.
Refresh Refreshes grid contents from the configurationdatabase.
Figure 7-20. Report Format Properties Window
7-28 eDB220-70
Emerson Process Management Proprietary Class 2C

7.4 eDB Report Manager
3. To change the Report Properties, press Select RPT File. A Select Report File windowwill appear (see Figure 7-21.)
4. Open the MsgReports or the PtReports folder. Select a new format (.rpt file) to add.Choose Ok.
Figure 7-21. Select Report File Window
7-29eDB220-70
Emerson Process Management Proprietary Class 2C

7.4 eDB Report Manager
7.4.10 CONFIGURING REPORT DEFINITIONS
After configuring the report formats, the next step is to define the reports for the project.Defining reports involves entering the details for each report. Once the reports are defined,they can be directly executed/generated.
REPORT DEFINITIONS TOOLBAR
The Report Definitions toolbar provides shortcuts to submenus.
Figure 7-22 displays the eDB Report Definitions Toolbar.
Table 7-10 defines the Icons in the toolbar.
Figure 7-22. eDB Report Definitions ToolBar
Table 7-10. Icon Definitions
Icon Description
Show/hide left main menu bar
Configure eDB Report Manager
Add report definition
Open report definition
Delete report definition
Make copy of report definition
Generate report
Refresh from database
7-30 eDB220-70
Emerson Process Management Proprietary Class 2C

7.4 eDB Report Manager
REPORT OPTIONS MENU
The Options menu changes based upon what was chosen from the Main Menu. Figure 7-23 displays the available selections from the Options menu when a Report Definition ischosen. These choices are also available from the right-click menu.
Find a string
Favorites
Stop Scheduling Reports
Start Scheduling Reports
Stop Generating Reports
Start Generating Reports
Export data
Import data
About
Table 7-10. Icon Definitions (Cont’d)
Icon Description
7-31eDB220-70
Emerson Process Management Proprietary Class 2C

7.4 eDB Report Manager
.
Table 7-11 explains the options available in the Report Options menu.
Figure 7-23. Report Options Pull-Down Menu
Table 7-11. Report Options Menu
Item Description
New Report Definition Creates a new report definition.
Point - ExpressCalcPoint - DirectAlarmSOEText
Open Report Definition Modifies an existing report definition.
Delete Report Definition Deletes an existing report definition.
Rename Renames an existing report definition.
Favorites Displays a Favorites dialog that allows youto add reports to your list of Favorites. Youcan show, create new, edit reports list, anddelete favorites from this dialog.
Make Copy Creates a copy of an existing reportdefinition.
Open Report Format Opens/modifies the associated reportformat.
Generate Report Generates reports for this report definition.
Show References Displays a References dialog that listentries referring to the report selected.Shows which events use report definitions.
Delete All in View Delete all report definitions shown withcurrent filter settings.
7-32 eDB220-70
Emerson Process Management Proprietary Class 2C
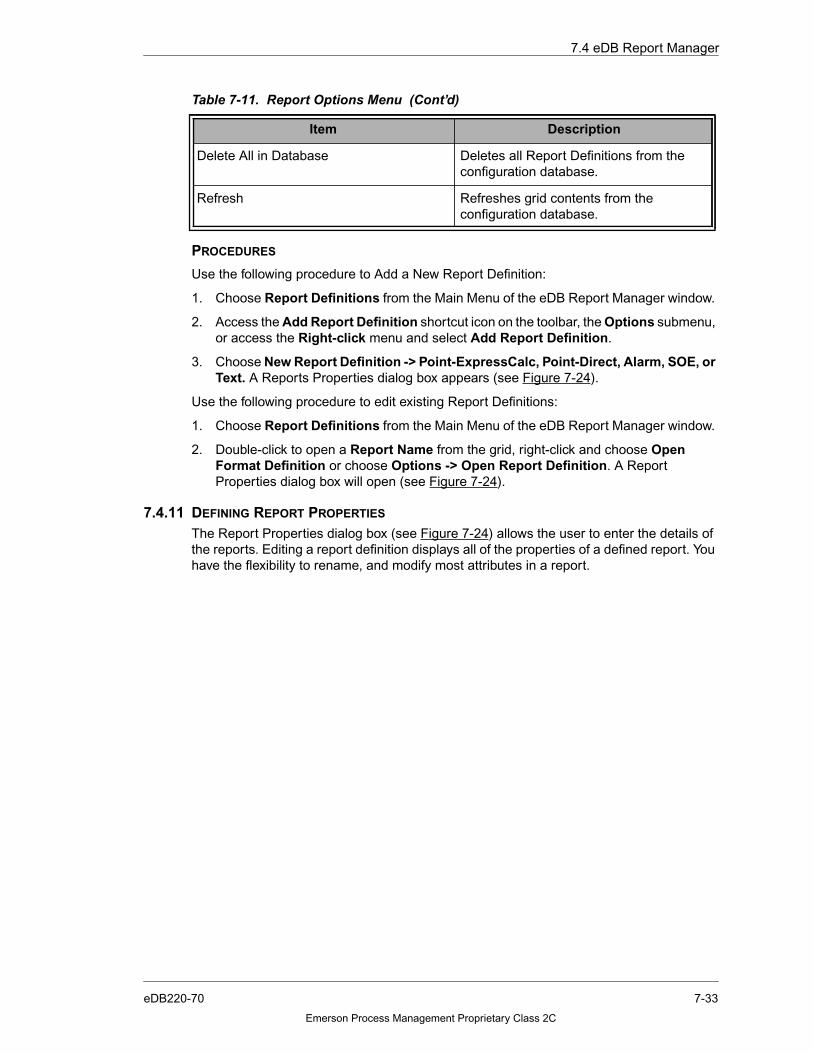
7.4 eDB Report Manager
PROCEDURES
Use the following procedure to Add a New Report Definition:
1. Choose Report Definitions from the Main Menu of the eDB Report Manager window.
2. Access the Add Report Definition shortcut icon on the toolbar, the Options submenu,or access the Right-click menu and select Add Report Definition.
3. Choose New Report Definition -> Point-ExpressCalc, Point-Direct, Alarm, SOE, orText. A Reports Properties dialog box appears (see Figure 7-24).
Use the following procedure to edit existing Report Definitions:
1. Choose Report Definitions from the Main Menu of the eDB Report Manager window.
2. Double-click to open a Report Name from the grid, right-click and choose OpenFormat Definition or choose Options -> Open Report Definition. A ReportProperties dialog box will open (see Figure 7-24).
7.4.11 DEFINING REPORT PROPERTIES
The Report Properties dialog box (see Figure 7-24) allows the user to enter the details ofthe reports. Editing a report definition displays all of the properties of a defined report. Youhave the flexibility to rename, and modify most attributes in a report.
Delete All in Database Deletes all Report Definitions from theconfiguration database.
Refresh Refreshes grid contents from theconfiguration database.
Table 7-11. Report Options Menu (Cont’d)
Item Description
7-33eDB220-70
Emerson Process Management Proprietary Class 2C
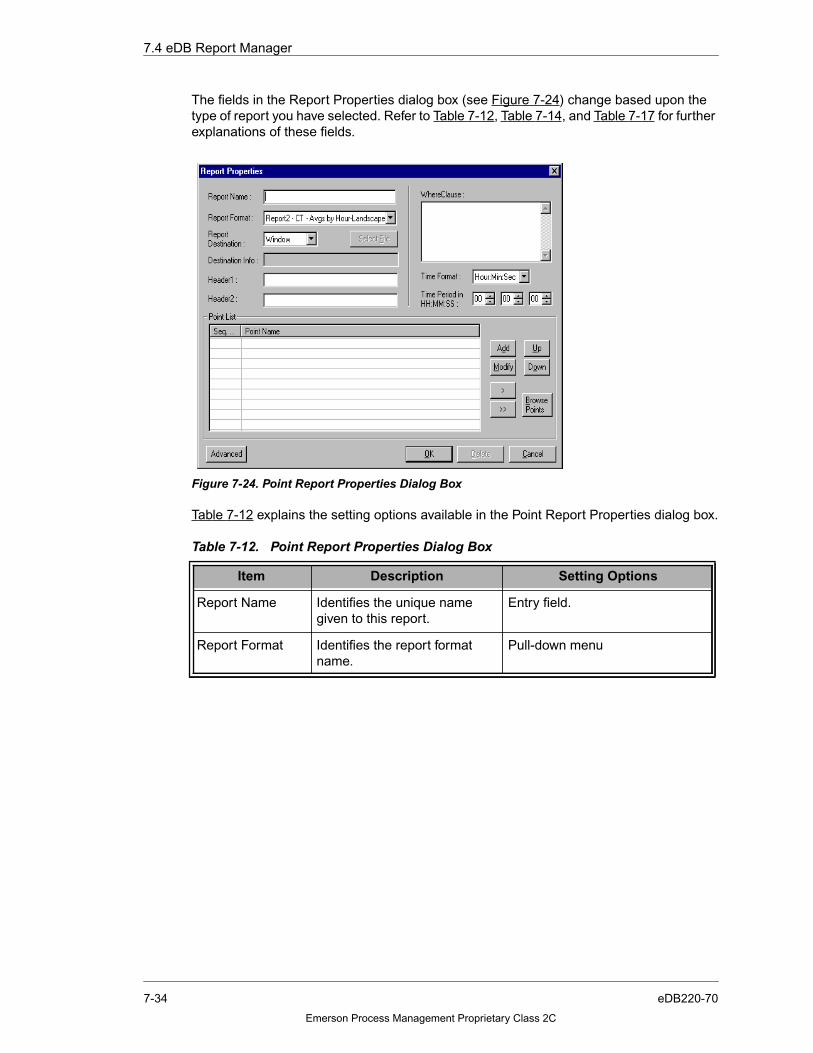
7.4 eDB Report Manager
The fields in the Report Properties dialog box (see Figure 7-24) change based upon thetype of report you have selected. Refer to Table 7-12, Table 7-14, and Table 7-17 for furtherexplanations of these fields.
Table 7-12 explains the setting options available in the Point Report Properties dialog box.
Figure 7-24. Point Report Properties Dialog Box
Table 7-12. Point Report Properties Dialog Box
Item Description Setting Options
Report Name Identifies the unique namegiven to this report.
Entry field.
Report Format Identifies the report formatname.
Pull-down menu
7-34 eDB220-70
Emerson Process Management Proprietary Class 2C

7.4 eDB Report Manager
ReportDestination
Identifies the destination of thereport.
Window, Printer, File, Exchange orMapi
When Window is selected, thegenerated report will display in anon-screen window.
When Printer is selected, clickSelect Printer and a Print Setupwindow appears allowing the userto select the destination of theprinted report (see Figure 7-25).
When File is selected, click SelectFile and a Save As windowappears (see Figure 7-26). Thiswindow allows you to choose anoutput file type. Reports can besent to the following formats:Text Files (.txt)Word (.doc)HTML (.htm, .html)CSV (.csv)Excel (.xls)RTF (.rtf)
When Mapi is selected, chooseSelect Mail, and a Mail Propertieswindow appears (see Figure 7-27). This window allows you to e-mail the file.
Exchange will be available in afuture release.
Destination Info This field will populate with thedestination of the report whenFile, Printer, or Mapi isselected in the ReportDestination field.
You cannot edit this field.
Header1 You can enter information thatwill appear in the Header 1area of the report.
Optional
Header2 You can enter information thatwill appear in the Header 2area of the report.
Optional
Table 7-12. Point Report Properties Dialog Box (Cont’d)
Item Description Setting Options
7-35eDB220-70
Emerson Process Management Proprietary Class 2C

7.4 eDB Report Manager
WhereClause This clause displays thespecified record selectioncriteria. This is automaticallygenerated.
The user may edit this clause,however, this is notrecommended.
Time Format Identifies the time periodformat of the report.
Hour:Min:Sec, Day, Month or Shift
Time Period Quantifies the time period ofthe report. Corresponds to theselected Time Format.
Point Name Identifies the point names to beincluded in this report.
Seq. Position of point within thereport.
Up The user can rearrange thepoint names in the point list byclicking the Up button.Arranging the Point Names in aspecific order is done forformatting certain pointreports.
Down The user can rearrange thepoint names in the point list byclicking the Down button.Arranging the Point Names in aspecific order is done forformatting certain pointreports.
Add The Add button allows you toadd additional point names tothe report details by enteringunique point names in thePoint Edit Box and clickingAdd.
Modify Allows you to modify pointnames in the point name listthrough the Modify PointInformation pop-up window.
> Removes a highlighted pointname from the list.
>> Removes all highlighted pointnames from the list.
Table 7-12. Point Report Properties Dialog Box (Cont’d)
Item Description Setting Options
7-36 eDB220-70
Emerson Process Management Proprietary Class 2C
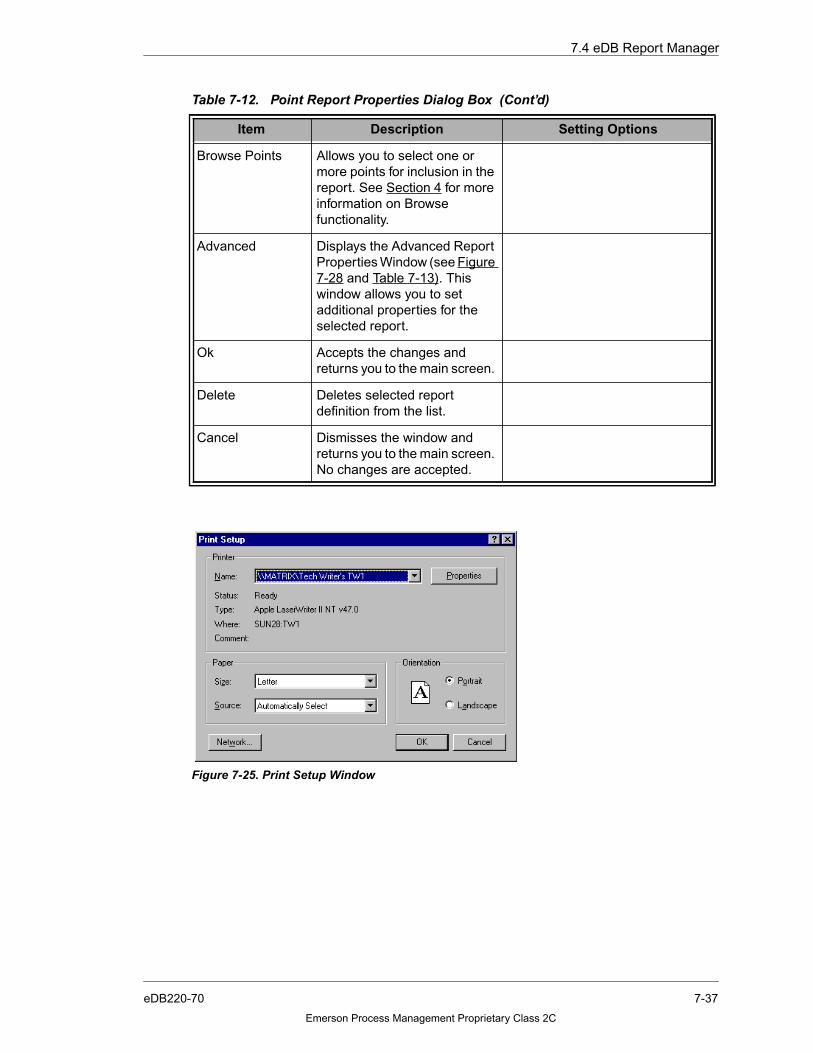
7.4 eDB Report Manager
Browse Points Allows you to select one ormore points for inclusion in thereport. See Section 4 for moreinformation on Browsefunctionality.
Advanced Displays the Advanced ReportProperties Window (see Figure7-28 and Table 7-13). Thiswindow allows you to setadditional properties for theselected report.
Ok Accepts the changes andreturns you to the main screen.
Delete Deletes selected reportdefinition from the list.
Cancel Dismisses the window andreturns you to the main screen.No changes are accepted.
Figure 7-25. Print Setup Window
Table 7-12. Point Report Properties Dialog Box (Cont’d)
Item Description Setting Options
7-37eDB220-70
Emerson Process Management Proprietary Class 2C

7.4 eDB Report Manager
Figure 7-26. Save As File Dialog Box
Figure 7-27. Mail Properties Window
Figure 7-28. Advanced Report Properties
7-38 eDB220-70
Emerson Process Management Proprietary Class 2C

7.4 eDB Report Manager
Table 7-13 explains the setting options available in the Advanced Report PropertiesWindow.
The Message Report Properties dialog box (see Figure 7-29) will appear if a Message(Alarm, SOE, or Text) based report format is chosen.
Table 7-14 explains the options available in the Message Report Properties dialog box.
Table 7-13. Advanced Report Properties
Item Description Setting Options
Adjust the start time to Allows you to automaticallyselect a start time when areport is demanded.
Nonestart of yearstart of monthstart of weekstart of daystart of shiftstart of hour
Additional Offset Allows you to add orsubtract from the offset.
AddSubtractMonths, Days, Hours,Minutes, Seconds
Do not allow the reportgeneration to exceed thefollowing time period.
Allows you to set limits onreport generation.
CheckboxYears, Months, Days, Hours,Minutes, Seconds
Ok Accepts the changes anddismisses the window.
Cancel Cancels the changes andcloses the window.
Figure 7-29. Message Report Properties Dialog Box
7-39eDB220-70
Emerson Process Management Proprietary Class 2C

7.4 eDB Report Manager
Table 7-14. Message Report Properties Dialog Box
Item Description Setting Options
Report Name Identifies the unique namegiven to this report.
Automatically entered.
Report Format Identifies the report formatname.
Pull-down menu
Report Destination Identifies the destination of thereport.
Window, Printer, File, Exchange orMapi. Click Select File to select adestination.
When Window is selected, thegenerated report will display in anon-screen window.
When Printer is selected, clickSelect Printer and a Print Setupwindow appears allowing the userto select the destination of theprinted report (see Figure 7-25).
When File is selected, click SelectFile and a Save As windowappears (see Figure 7-26). Thiswindow allows you to choose anoutput file type. Reports can besent to the following formats:Text Files (.txt)Word (.doc)HTML (.htm, .html)CSV (.csv)Excel (.xls)RTF (.rtf)
When Mapi is selected, chooseSelect Mail, and a Mail Propertieswindow appears (see Figure 7-27). This window allows you to e-mail the file.
Exchange will be available in afuture release
Destination Info This field will populate with thedestination of the report whenFile, Printer, or Mapi isselected in the ReportDestination field.
The user cannot edit this field.
7-40 eDB220-70
Emerson Process Management Proprietary Class 2C

7.4 eDB Report Manager
Header1 The user can enter informationthat will appear in the Header 1area of the report.
Optional
Header2 The user can enter informationthat will appear in the Header 2area of the report.
Optional
WhereClause This clause displays recordselection criteria. This isautomatically generated.
The user may edit this clause,however, this is notrecommended.
Time Format Identifies the time periodformat of the report.
Hour:Min:Sec, Day, Month, orShift.
Time Period Quantifies the time period ofthe report. Corresponds to theselected Time Format.
Additional MsgFilters:
Message Type
Message Sub type
Message Source
Source System
Source Node
Filtering messages allows theuser to further define theamount of return on yourreport. The filters are defined inTable 7-15.
Alphanumeric entry
Numeric entry
Numeric entry
Numeric entry
Numeric entry
Primary Text FieldSearch String
Additional filter that allows youto further define the amount ofdata on your report. Forexample, Cosine.
Alphanumeric entry
Advanced Produces the AdvancedReport Properties Window(see Figure 7-28). This windowallows you to set additionalproperties for the selectedreport.
Ok Accepts the changes andreturns you to the main screen.
Delete Deletes selected report fromthe list.
Cancel Cancels the window andreturns you to the main screen.No changes are accepted.
Table 7-14. Message Report Properties Dialog Box (Cont’d)
Item Description Setting Options
7-41eDB220-70
Emerson Process Management Proprietary Class 2C

7.4 eDB Report Manager
Table 7-15. Additional Alarm Message Filters
Msg Type Message TypeMessageSubtype
MessageSource
SourceSystem
SourceNode
Alarm Alarm MessageTypes aredescribed indetail in the“OvationOperatorStation UserGuides” (listedin Table 1-3).
0 - No Entry1 - New Alarm2 - Return3 - IncrementalAlarm4 - StatusChange5 - Timed OutDrop6 - SpuriousAlarm7 - SuppressedAlarm8 - AcknowledgedAlarm9 - ReleasedAlarm
Scanner ID Unit # Drop #
SOE Not applicable Not applicable Scanner ID Unit # Drop #
Text SYSTEMOPEVENT
OPEVENTmessagesubtypes aredefined in Table7-16.
Scanner ID Unit # Drop #
7-42 eDB220-70
Emerson Process Management Proprietary Class 2C

7.4 eDB Report Manager
Table 7-16. OPEVENT Message Subtypes
Subtype Number Operator Event Category Type
100 Mode Change
120 Setpoint Change
121 Output Change
164 Status Check State Change
180 LS Print Cancellation
200 Scan Off
201 Scan On
202 Alarm Check Removal
203 Alarm Check Restoration
204 Limit Check Removal
205 Limit Check Restoration
206 Value Enter
207 High Limit Change
208 Low Limit Change
209 Incremental Change
210 Alarm Deadband Change
211 All Force Bits Clear
212 All Force Bits Set
218 Automatic Cutout Disabled
219 Automatic Cutout Enabled
231 MMI Logon/Logoff
240 Point Field Change
241 Atrend Events
252 Group Pt Force Clear
253 Group Pt Force
254 Set Force Group Pt
144 Value Clamp On
145 Value Clamp Off
146 Engineering Range Checking On
7-43eDB220-70
Emerson Process Management Proprietary Class 2C

7.4 eDB Report Manager
147 Engineering Range Checking Off
148 Reasonability Range Checking On
149 Reasonability Range Checking Off
152 Test Mode Good
153 Test Mode Fair
154 Test Mode Poor
155 Test Mode Bad
156 Test Mode Static
157 Test Mode Off
158 Removed From Service
159 Restored To Service
Table 7-16. OPEVENT Message Subtypes (Cont’d)
Subtype Number Operator Event Category Type
7-44 eDB220-70
Emerson Process Management Proprietary Class 2C

7.4 eDB Report Manager
The Report Properties - ExpressCalc dialog box will appear if the ExpressCalc Reportformat was chosen (see Figure 7-30).
Table 7-17 explains the setting options available in the Report Properties ExpressCalcdialog box.
Figure 7-30. Report Properties - ExpressCalc Dialog Box
Table 7-17. Report Properties - ExpressCalc Dialog Box
Item Description Setting Options
Report Name Identifies the unique namegiven to this report.
Entry field
Report Format Identifies the report formatname.
Pull-down menu
7-45eDB220-70
Emerson Process Management Proprietary Class 2C
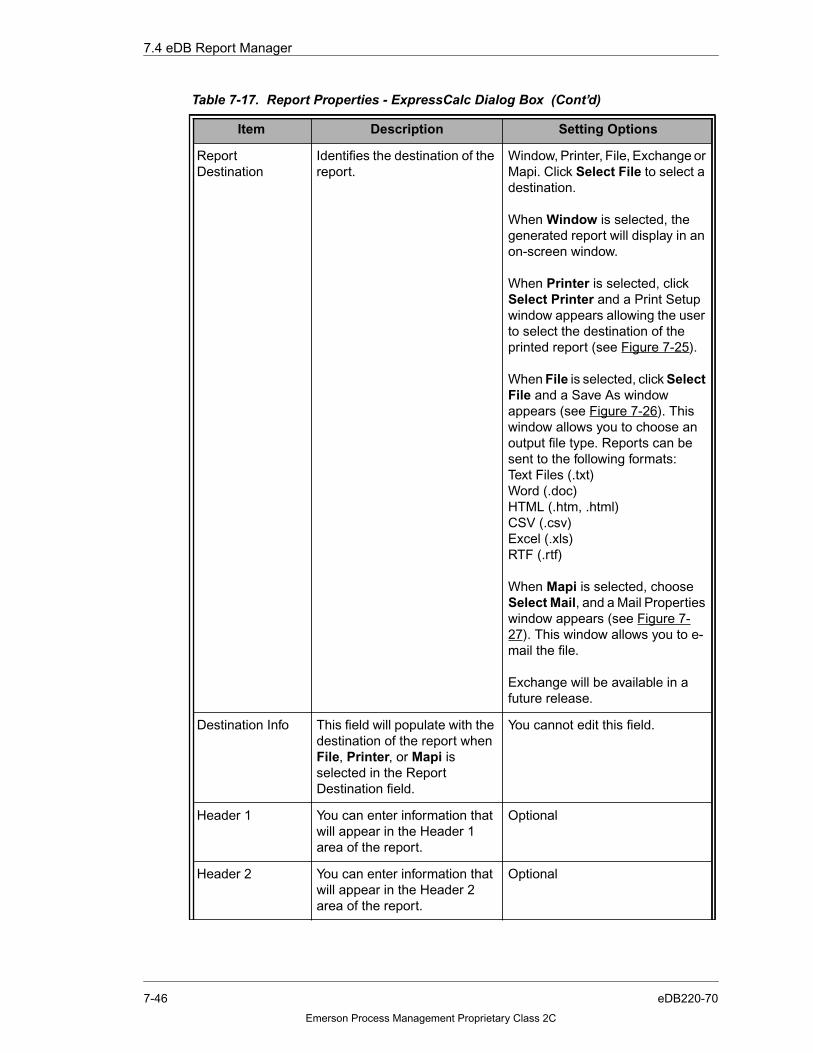
7.4 eDB Report Manager
ReportDestination
Identifies the destination of thereport.
Window, Printer, File, Exchange orMapi. Click Select File to select adestination.
When Window is selected, thegenerated report will display in anon-screen window.
When Printer is selected, clickSelect Printer and a Print Setupwindow appears allowing the userto select the destination of theprinted report (see Figure 7-25).
When File is selected, click SelectFile and a Save As windowappears (see Figure 7-26). Thiswindow allows you to choose anoutput file type. Reports can besent to the following formats:Text Files (.txt)Word (.doc)HTML (.htm, .html)CSV (.csv)Excel (.xls)RTF (.rtf)
When Mapi is selected, chooseSelect Mail, and a Mail Propertieswindow appears (see Figure 7-27). This window allows you to e-mail the file.
Exchange will be available in afuture release.
Destination Info This field will populate with thedestination of the report whenFile, Printer, or Mapi isselected in the ReportDestination field.
You cannot edit this field.
Header 1 You can enter information thatwill appear in the Header 1area of the report.
Optional
Header 2 You can enter information thatwill appear in the Header 2area of the report.
Optional
Table 7-17. Report Properties - ExpressCalc Dialog Box (Cont’d)
Item Description Setting Options
7-46 eDB220-70
Emerson Process Management Proprietary Class 2C

7.4 eDB Report Manager
Report TimeFormat
Identifies the time periodformat of the report.
Hour:Min:Sec, Day, Month, orShift.
Time Period inHH:MM:SS
Quantifies the time period ofthe report. Corresponds to theselected Time Format.
Sample IntervalTime Format
Identifies the sample timeformat required by the pre-processor to generate therequested number of samplesfor the report.
Hour:Min:Sec, or DayorNo. of intervals
Sample IntervalTime Value
Quantifies the sample time orinterval count required by thepre-processor to generate therequested number of samplesfor the report. Corresponds tothe selected Sample IntervalTime Format.
Seq. No. Position of point within thereport.
Point Name Identifies the point names to beincluded in this report.
Processing Type Defines the processing typerequired by the pre-processorto generate the desiredsampling results. Required foreach point in the point list.
Pull-down menu. Choices are:ActualActual BitAverageMaximum ValueMinimum ValueTime of MaximumTime of MinimumIntegrationToggleToggle SetToggle ResetTime SetTime Reset
Bit Number Defines the bit number in apacked digital point required bythe pre-processor to generatethe desired sample results.This is used with the Actual Bitprocessing type.
0 - 31
Table 7-17. Report Properties - ExpressCalc Dialog Box (Cont’d)
Item Description Setting Options
7-47eDB220-70
Emerson Process Management Proprietary Class 2C

7.4 eDB Report Manager
Integral Constant Value required by the pre-processor to performintegration on the selectedpoint in the point list. Activeonly when Processing type isset to integration.
Floating point
Up You can rearrange the pointnames in the point list byclicking the Up button.Arranging the Point Names in aspecific order is done forformatting certain pointreports.
Down You can rearrange the pointnames in the point list byclicking the Down button.Arranging the Point Names in aspecific order is done forformatting certain pointreports.
Add The Add button allows you toadd additional point names tothe report details by enteringunique point names in thePoint Edit Box and clickingAdd.
Modify Allows you to modify pointnames in the point name list.
> Removes a highlighted pointname from the list.
>> Removes all highlighted pointnames from the list.
Browse Points Allows you to select one ormore points for inclusion in thereport. See Section 4 for moreinformation.
Advanced Produces the AdvancedReport Properties Window(see Figure 7-28). This windowallows you to set additionalproperties for the selectedreport.
Ok Accepts the changes andreturns you to the main screen.
Table 7-17. Report Properties - ExpressCalc Dialog Box (Cont’d)
Item Description Setting Options
7-48 eDB220-70
Emerson Process Management Proprietary Class 2C

7.4 eDB Report Manager
7.4.12 DEMANDING REPORTS
After the report definitions have been created, the reports are ready to be generated orscheduled. The reports can be generated directly from the Report Definitions main menuor from the occurrence of a timed, triggered, or demand event.
Choosing Generate Report from the Options menu, the Right-Click menu, or from theshortcut icon on the toolbar displays a Generate “Report Definition Name” dialog box asshown in Figure 7-31.
Table 7-18 explains the setting options available in the Generate “Report Definition Name”dialog box.
Cancel Cancels the window andreturns you to the main screen.No changes are accepted.
Delete Deletes selected report fromthe list.
Figure 7-31. Generate “Report Definition Name” Dialog Box
Table 7-18. Generate “Report Definition Name” Dialog Box
Item Description Setting Options
Start Date Time Allows you to select a start timefor the time interval. Times maybe specified in Absolute orRelative format. Refer toSection 4.2.2 for moreinformation.
The pull-down menu displays acalendar. You may select datesfrom the calendar or manuallyenter dates in the field.
End Date Time Allows the user to select anend time for the time interval.Times may be specified inAbsolute or Relative format.Refer to Section 4.2.2 for moreinformation.
The pull-down menu displays acalendar. You may select datesfrom the calendar or manuallyenter dates in the field.
Table 7-17. Report Properties - ExpressCalc Dialog Box (Cont’d)
Item Description Setting Options
7-49eDB220-70
Emerson Process Management Proprietary Class 2C

7.4 eDB Report Manager
ReportDestination
Window, Printer, File, Exchange orMapi. Click Select File to select adestination.
When Window is selected, thegenerated report will display in anon-screen window.
When Printer is selected, clickSelect Printer and a Print Setupwindow appears allowing the userto select the destination of theprinted report (see Figure 7-25).
When File is selected, click SelectFile and a Save As windowappears (see Figure 7-26). Thiswindow allows you to choose anoutput file type. Reports can besent to the following formats:Text Files (.txt)Word (.doc)HTML (.htm, .html)CSV (.csv)Excel (.xls)RTF (.rtf)
When Mapi is selected, chooseSelect Mail, and a Mail Propertieswindow appears (see Figure 7-27). This window allows you to e-mail the file.
Exchange will be available in afuture release.
Destination Info This field will populate with thedestination of the report whenFile, Printer, or Mapi isselected in the ReportDestination field.
The user cannot edit this field.
Ok Causes the report to beexecuted immediately.
Cancel Dismisses window. No report isprinted.
Table 7-18. Generate “Report Definition Name” Dialog Box (Cont’d)
Item Description Setting Options
7-50 eDB220-70
Emerson Process Management Proprietary Class 2C

7.4 eDB Report Manager
7.4.13 CONFIGURING EVENTS
Reports can be printed based on timed, triggered, or demand events.
EVENTS TOOLBAR
The Events Toolbar provides shortcuts to submenus.
Figure 7-32 displays the Events Toolbar.
Table 7-19 defines the icons in the Events toolbar.
Figure 7-32. Events Toolbar
Table 7-19. Icon Definitions
Icon Description
Show/hide left main menu bar
Configure eDB Report Manager
Add new event
Open event definition
Delete
Refresh from database
Find a string
7-51eDB220-70
Emerson Process Management Proprietary Class 2C
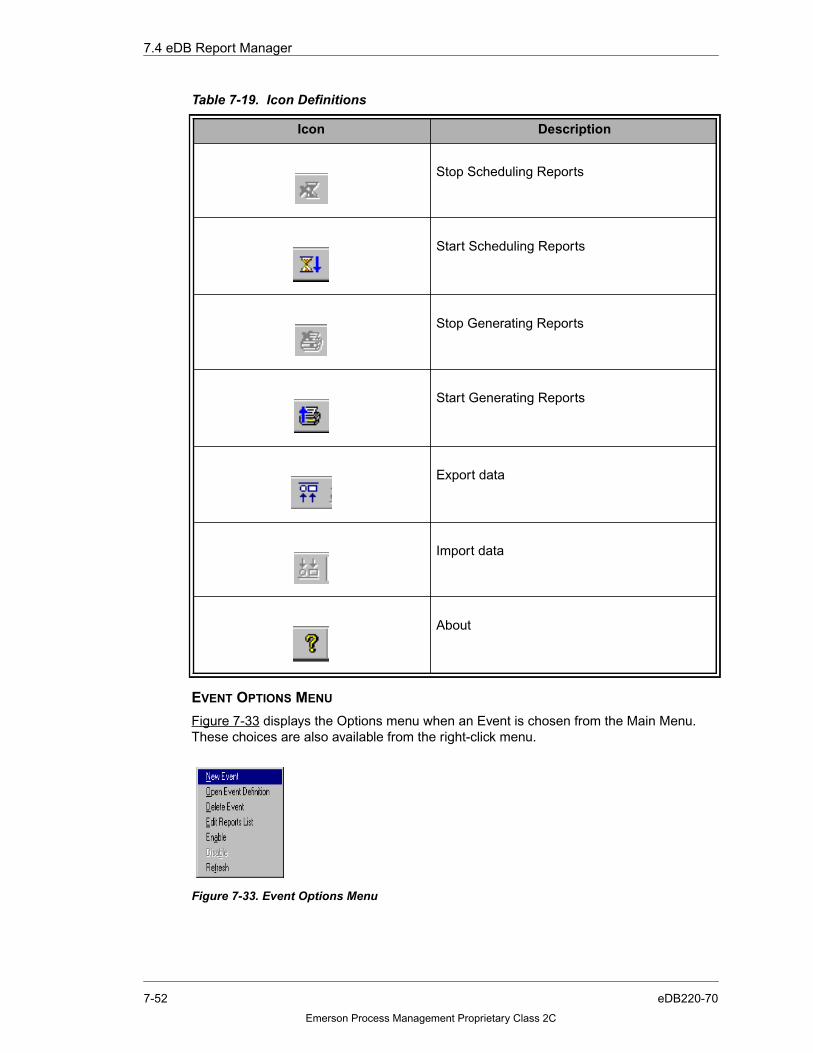
7.4 eDB Report Manager
EVENT OPTIONS MENU
Figure 7-33 displays the Options menu when an Event is chosen from the Main Menu.These choices are also available from the right-click menu.
Stop Scheduling Reports
Start Scheduling Reports
Stop Generating Reports
Start Generating Reports
Export data
Import data
About
Figure 7-33. Event Options Menu
Table 7-19. Icon Definitions
Icon Description
7-52 eDB220-70
Emerson Process Management Proprietary Class 2C

7.4 eDB Report Manager
Table 7-20 explains the setting options available in the Event Options menu.
Table 7-20. Event Options Menu
Item Description
New Event Opens the New Event dialog.
Open Event Definition Opens the Edit Event dialog.
Delete Event Deletes the event.
Edit Reports List Opens the Select Reports Window.
Enable Enables the event.
Disable Disables the event.
Refresh Refreshes the screen.
7-53eDB220-70
Emerson Process Management Proprietary Class 2C
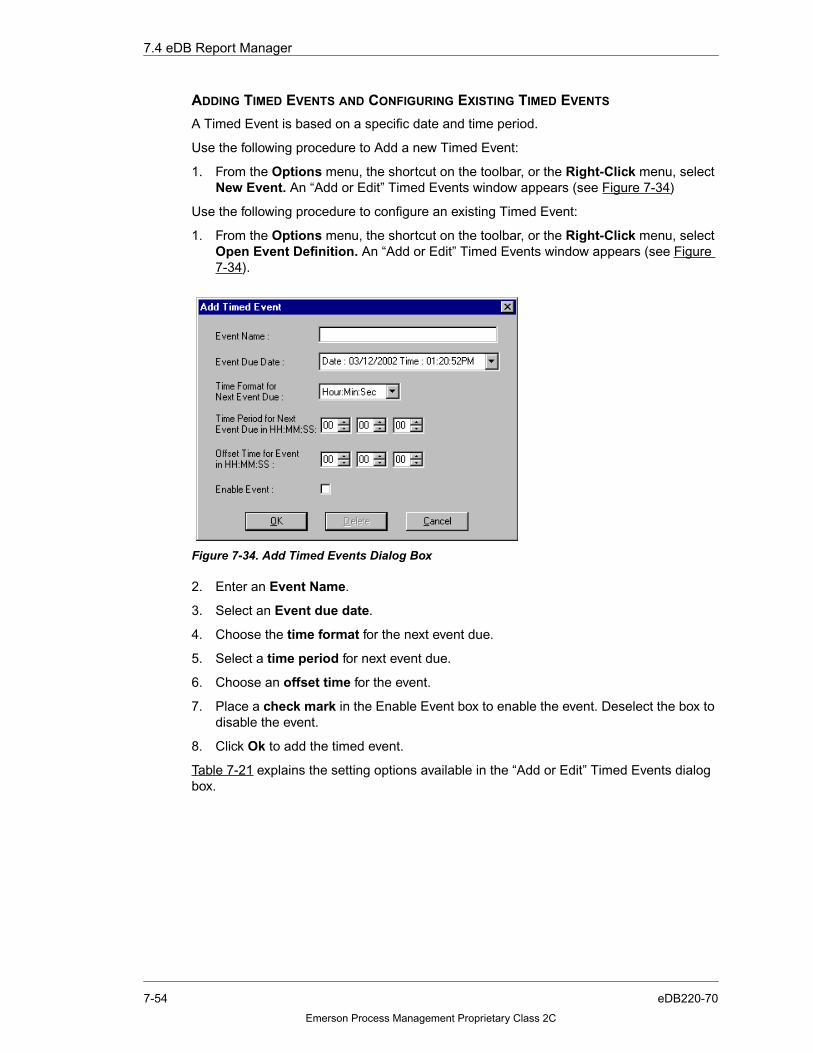
7.4 eDB Report Manager
ADDING TIMED EVENTS AND CONFIGURING EXISTING TIMED EVENTS
A Timed Event is based on a specific date and time period.
Use the following procedure to Add a new Timed Event:
1. From the Options menu, the shortcut on the toolbar, or the Right-Click menu, selectNew Event. An “Add or Edit” Timed Events window appears (see Figure 7-34)
Use the following procedure to configure an existing Timed Event:
1. From the Options menu, the shortcut on the toolbar, or the Right-Click menu, selectOpen Event Definition. An “Add or Edit” Timed Events window appears (see Figure7-34).
2. Enter an Event Name.
3. Select an Event due date.
4. Choose the time format for the next event due.
5. Select a time period for next event due.
6. Choose an offset time for the event.
7. Place a check mark in the Enable Event box to enable the event. Deselect the box todisable the event.
8. Click Ok to add the timed event.
Table 7-21 explains the setting options available in the “Add or Edit” Timed Events dialogbox.
Figure 7-34. Add Timed Events Dialog Box
7-54 eDB220-70
Emerson Process Management Proprietary Class 2C
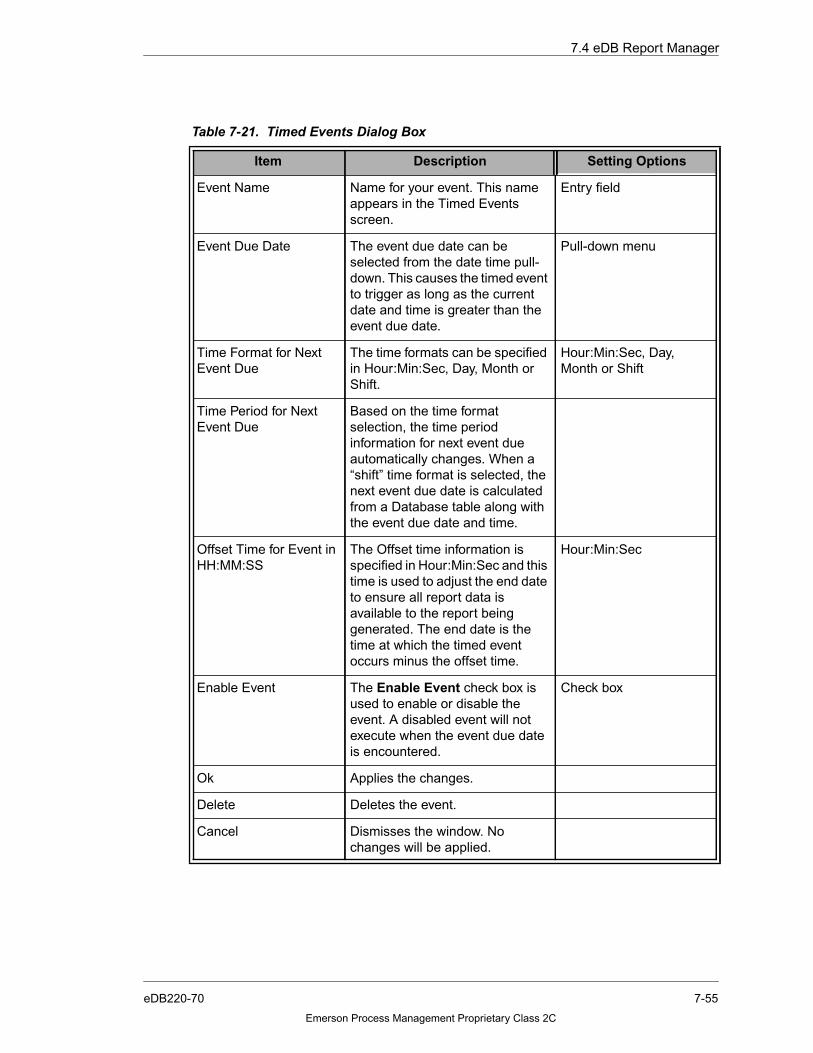
7.4 eDB Report Manager
Table 7-21. Timed Events Dialog Box
Item Description Setting Options
Event Name Name for your event. This nameappears in the Timed Eventsscreen.
Entry field
Event Due Date The event due date can beselected from the date time pull-down. This causes the timed eventto trigger as long as the currentdate and time is greater than theevent due date.
Pull-down menu
Time Format for NextEvent Due
The time formats can be specifiedin Hour:Min:Sec, Day, Month orShift.
Hour:Min:Sec, Day,Month or Shift
Time Period for NextEvent Due
Based on the time formatselection, the time periodinformation for next event dueautomatically changes. When a“shift” time format is selected, thenext event due date is calculatedfrom a Database table along withthe event due date and time.
Offset Time for Event inHH:MM:SS
The Offset time information isspecified in Hour:Min:Sec and thistime is used to adjust the end dateto ensure all report data isavailable to the report beinggenerated. The end date is thetime at which the timed eventoccurs minus the offset time.
Hour:Min:Sec
Enable Event The Enable Event check box isused to enable or disable theevent. A disabled event will notexecute when the event due dateis encountered.
Check box
Ok Applies the changes.
Delete Deletes the event.
Cancel Dismisses the window. Nochanges will be applied.
7-55eDB220-70
Emerson Process Management Proprietary Class 2C

7.4 eDB Report Manager
ADDING TRIGGERED EVENTS AND CONFIGURING EXISTING TRIGGERED EVENTS
A Triggered Event is based on a digital point that will be monitored for change.
Use the following procedure to Add a Triggered Event:
1. From the Options menu or the Right-Click menu, select New Event. An “Add or Edit”Trigger Events window appears (see Figure 7-35).
Use the following procedure to edit an existing Triggered Event:
2. From the Options menu or the Right-Click menu, select Open Event Definition. An“Add or Edit” Trigger Events window appears (see Figure 7-35)
3. Enter an Event Name.
4. Enter a point name for the digital trigger point or select Browse Points and a Browseand Select Point(s) window will appear. See Section 4 for an explanation of the Browseand Select Point(s) window.
5. Select a Trigger Value from the pull-down menu.
6. Enter a Start Time and End Time offset from trigger time.
7. Enter a Time to wait before this Trigger Event is processed again.
8. Enter the Last Processed Time. The default is the current time.
9. Choose to enable or disable the event.
10. Click Ok to add the trigger event.
Figure 7-35. Trigger Event Window
7-56 eDB220-70
Emerson Process Management Proprietary Class 2C
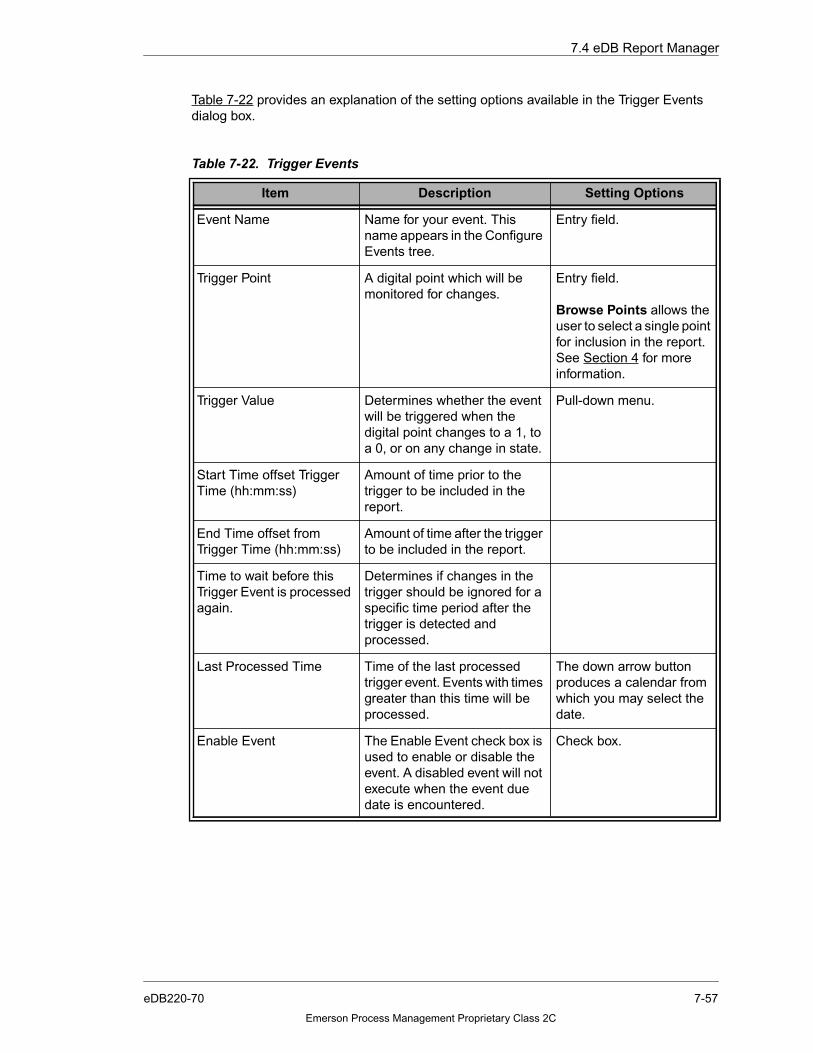
7.4 eDB Report Manager
Table 7-22 provides an explanation of the setting options available in the Trigger Eventsdialog box.
Table 7-22. Trigger Events
Item Description Setting Options
Event Name Name for your event. Thisname appears in the ConfigureEvents tree.
Entry field.
Trigger Point A digital point which will bemonitored for changes.
Entry field.
Browse Points allows theuser to select a single pointfor inclusion in the report.See Section 4 for moreinformation.
Trigger Value Determines whether the eventwill be triggered when thedigital point changes to a 1, toa 0, or on any change in state.
Pull-down menu.
Start Time offset TriggerTime (hh:mm:ss)
Amount of time prior to thetrigger to be included in thereport.
End Time offset fromTrigger Time (hh:mm:ss)
Amount of time after the triggerto be included in the report.
Time to wait before thisTrigger Event is processedagain.
Determines if changes in thetrigger should be ignored for aspecific time period after thetrigger is detected andprocessed.
Last Processed Time Time of the last processedtrigger event. Events with timesgreater than this time will beprocessed.
The down arrow buttonproduces a calendar fromwhich you may select thedate.
Enable Event The Enable Event check box isused to enable or disable theevent. A disabled event will notexecute when the event duedate is encountered.
Check box.
7-57eDB220-70
Emerson Process Management Proprietary Class 2C

7.4 eDB Report Manager
ADDING A DEMAND EVENT AND CONFIGURING EXISTING DEMAND EVENTS
Creating a Demand event is similar to creating a Timed event except that the Demand eventdoes not have any time specific attributes.
Use the following procedure to Add a Demand Event:
1. From the Options menu or the Right-Click menu, select New Event. An “Add or Edit”Demand Events window appears (see Figure 7-36).
Use the following procedure to Edit a Demand Event:
1. From the Options menu or the Right-Click menu, select Open Event Definition. An“Add or Edit” Demand Events window appears (see Figure 7-36).
2. Enter an Event Name in the “Add or Edit” Demand Event window.
3. Place a check in the Enable Event check box and the Event will enable. Deselect thecheck box and the event will not be enabled.
4. Click Ok to Add or Edit the Demand Event.
GENERATING A REPORT FROM A DEMAND EVENT
For a Demand Event, choosing Generate Report from the Demand Event Options menu,the Right-Click menu, or from the shortcut icon on the toolbar displays a Select Start TImeand End Time dialog box (see Figure 7-37).
Figure 7-36. Add Demand Event
Figure 7-37. Select Start Time and End Time Dialog Box
7-58 eDB220-70
Emerson Process Management Proprietary Class 2C
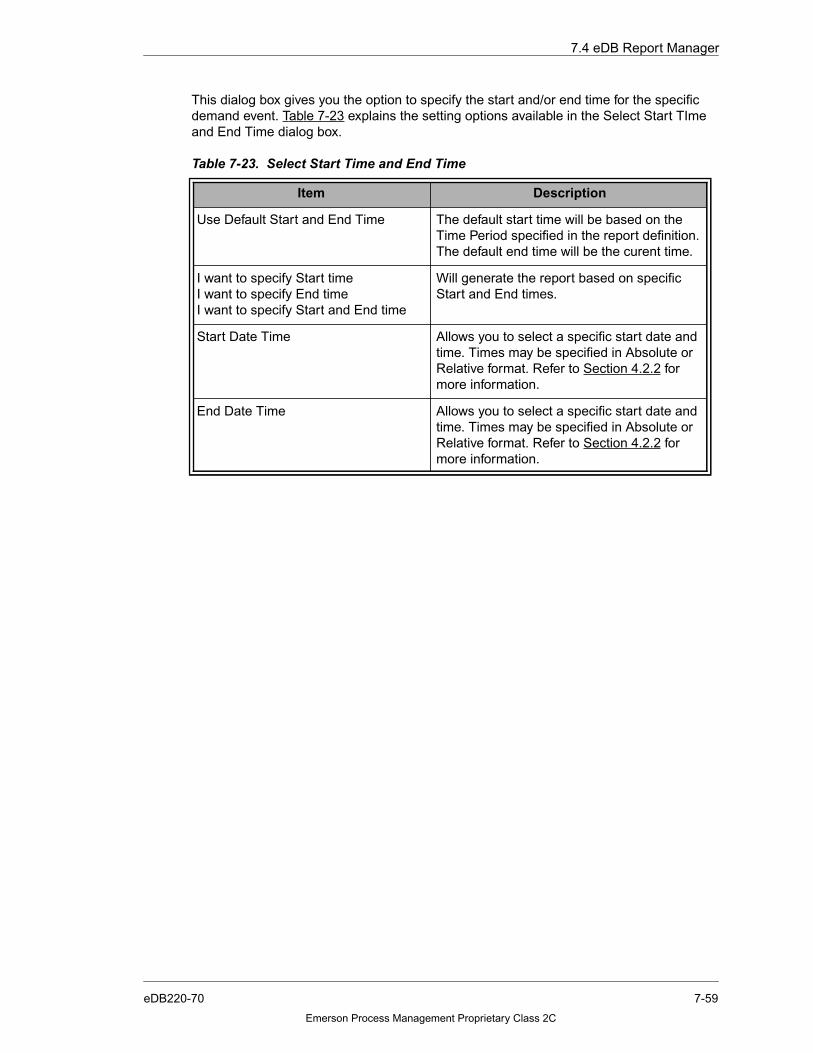
7.4 eDB Report Manager
This dialog box gives you the option to specify the start and/or end time for the specificdemand event. Table 7-23 explains the setting options available in the Select Start TImeand End Time dialog box.
Table 7-23. Select Start Time and End Time
Item Description
Use Default Start and End Time The default start time will be based on theTime Period specified in the report definition.The default end time will be the curent time.
I want to specify Start timeI want to specify End timeI want to specify Start and End time
Will generate the report based on specificStart and End times.
Start Date Time Allows you to select a specific start date andtime. Times may be specified in Absolute orRelative format. Refer to Section 4.2.2 formore information.
End Date Time Allows you to select a specific start date andtime. Times may be specified in Absolute orRelative format. Refer to Section 4.2.2 formore information.
7-59eDB220-70
Emerson Process Management Proprietary Class 2C

7.4 eDB Report Manager
7.4.14 ADDING OR EDITING THE REPORT LIST
Reports can be printed based on Timed, Triggered, or Demand events.
Use the following procedure to add or edit a reports list:
1. Access the Main Menu. Choose Timed, Triggered, or Demand Events.
2. The grid will populate with any scheduled events. All reports for the selected event areshown in the Report List on the bottom half of the screen (Figure 7-38).
3. Choose an Event, and select the Edit Reports List button, or choose Options -> EditReports List. A Select Reports window will appear (see Figure 7-39.
4. Choose an Available Report Name and add it to the Added Report names. Reports canbe moved up or down, removed, and filtered from this dialog.
5. Click Ok to add the report name to the report list for the selected event.
Table 7-24 explains the setting options available in the Select Reports window.
Figure 7-38. Report List
Figure 7-39. Select Reports Window
ReportList
7-60 eDB220-70
Emerson Process Management Proprietary Class 2C

7.4 eDB Report Manager
7.4.15 DATA BACKUP
The eDB Report Manager is equipped with an automatic Backup system. It isrecommended that this backup be enabled. To enable and configure the Backup, performthe following steps:
1. Choose File -> Backup. The Backup Data window will appear (see Figure 7-40).
Table 7-24. Select Reports Window
Item Description
Event Name Name of the Event
Available Report Names Displays a list of available defined reportnames that can be tied to an event.
Add Adds the Available Report Name to the AddedReport Names column.
Add All Adds all of the Available Report Names to theAdded Report Names column.
Filter Allows the user to filter reports shown in theAvailable Report Names window.
Show All Disables report filtering and shows all reportdefinitions.
Added Report Names Displays a list of defined report names alreadytied to an event. This list identifies the printorder.
Move Up Moves the selected Added Report Name up.This configures the print order of the reports.
Move Down Moves the selected Report Name down. Thisalso configures the print order of the reports.
Remove Removes the added report name and returnsit to the available report names list.
Remove All Removes all of the added report names andreturns them to the available report names list.
Ok Clicking OK accepts all changes and commitsthe added report names to the respectiveevent.
Cancel Dismisses the window.
7-61eDB220-70
Emerson Process Management Proprietary Class 2C

7.4 eDB Report Manager
2. Place a check in the box to enable the automatic backup.
3. Choose the interval for backup. The system will automatically perform data backupsbased on this interval.
4. Choose Do Backup Now, to perform an immediate backup of data.
If the automatic backup is disabled, you can choose to be reminded to backup data.
7.4.16 VIEW LAST CRYSTAL REPORT ERROR
The Last Crystal Report Error dialog box enables you to view the most recent error returnedby the Crystal Report generator. This feature allows you to determine if there were anyerrors encountered while generating reports. Figure 7-41 displays the Last Crystal ReportError dialog box. This feature will be grayed out if no errors are present.
A Save As button is provided to permit export of this summary to an HTML file that can thenbe used for later review analysis. This HTML file cannot be viewed within the eDB ReportManager application and requires a Web browser for viewing.
PROCEDURE
Use the following procedure to view the Last Crystal Report Error Dialog Box:
1. Access the Options submenu from the eDB Report Manager window.
2. Choose View Crystal Reports Error. The Last Crystal Report Error dialog boxappears (see Figure 7-41).
Figure 7-40. Backup Data Dialog Box
Figure 7-41. Last Crystal Report Error Dialog Box
7-62 eDB220-70
Emerson Process Management Proprietary Class 2C

7.4 eDB Report Manager
7.4.17 IMPORTING AND EXPORTING THE eDB REPORT MANAGER DATABASE
This option allows the user to transport the eDB Report Manager database informationfrom one computer to another. The imported or exported database will contain data that iscurrent at the time of the import or export action. This function is located under the Filemenu and shortcut icons exists on the toolbar for this action. Refer to Section 7.2.2 forfurther information. This feature also provides the capability for transporting existing reportconfiguration across multiple revisions of the Report Manager application.
ISSUES WHEN COPYING REPORT CONFIGURATION FROM ONE MACHINE TO ANOTHER
Importing is only allowed if no report definitions and no report formats are configured. Thisis the state of the Report Manager when a new install is performed. However, this state canalso be achieved by choosing Delete All in Database from the Report Definitions Optionspull-down menu and from the Report Formats Options pull-down menu. Once they are alldeleted, an import may be performed.
On the source machine, the export function will export the configuration to a series of files“tbl*.exp” in the eDBHistorian\Reports directory. These are files that should be copied to thetarget machine to be imported. Drive letters to be used should be the same on the sourceand target machines or else the export files will have to be manually edited.
In addition, if report layout files (.rpt files in eDBHistorian\Reports\PtReports oreDBHistorian\Reports\MsgReports) are customized, those report layout files should becopied to the target machine.
Importing configuration is deliberately not a one -step process due to the potential to losechanges by accidentally importing old export files which would lose all changes since thelast export. Also, the export/import feature is dependent on the hardware configurationsbeing identical (drive letters) without requiring editing of the .exp files.
7.4.18 MINIMIZE TO SYSTEM TRAY
The eDB Report Manager is usually started when you log in and is minimized to the SystemTray. At any time, you can restore the application from its iconized state by double-clickingor right-clicking on the System Tray icon. Generally, the application is restored forconfiguration purpose to view the current status.
The application can again be iconized onto the System Tray by using the followingprocedure:
1. Access the File submenu from the eDB Report Manager window.
2. Choose Exit. A Quit Application window appears (see Figure 7-42).
3. Select Yes to minimize the application to the System Tray.
4. This action can also be accessed by clicking the minimize button in the top right-handcorner of the window.
Figure 7-42. Quit Application Window
7-63eDB220-70
Emerson Process Management Proprietary Class 2C
7.4 eDB Report Manager
7.4.19 STATUS LOG FILE
Exiting the Application generates an HTML log file (EhRptScheduler.htm) under theEPH_HOME\Reports directory. The status log file can be viewed by a browser to analyzethe queue entries. The queue entries in the HTML log file are formatted in the form of a tablewith the events and report details. The pending records are displayed in light sea green,the completed records are displayed in light sky blue and the records with errors aredisplayed in red color.
Note:
This file cannot be viewed within the report manager application. A Webbrowser is required to view this HTML file.
7-64 eDB220-70
Emerson Process Management Proprietary Class 2C

SECTION 8. LAB HISTORY
8.1 SECTION OVERVIEW
The Lab History functionality for the eDB Historian consists of the ability to store processpoint data in a latent manner. This means that point data needs to be stored by the eDBthat is time stamped in the past. Typically, this point data is entered in the system by a userthrough an application which then packages the data and sends it to the eDB. This data ishistorically stored in the eDB database and can be retrieved through the same mechanismsas regularly scanned point data in the eDB, such as, Reports, Trends, and Reviews.
8.2 LAB HISTORY DATA STORAGE
The storage of Lab History point data in the eDB is performed via an (API) that allows theuser to send Lab History point data and Lab History attribute data. The API connects to theeDB Historian and transfers the point and attribute data to be stored.
You must configure Lab History points that are to be stored in the eDB. This will identify theLab History points for which you will provide data samples and attributes.
Points that are configured in the eDB as Lab History points will consume license countpoints in the very same manner as regularly collected scanner points. Lab History pointsthat have been previously configured in the eDB can be disabled so they will not consumelicense usage.
It is up to the user/application to provide Attribute data for all Lab History points that aresent to the eDB. The user should send Attribute samples to the eDB prior to sending yourcorresponding Lab History point data samples since the attribute data is required toperform retrievals via reports, trends and reviews.
Lab History attribute data will be stored in the existing attribute data table (PT_ATTRIB) andis subject to the same storage rules, for example attribute data is not kept historically.
Storage of the Lab History point data will occur in the same manner as other process pointdata in the eDB. This involves storing the Lab History point data in its own table(PT_LAB_HIST) and treating this table with the same rules as the other process point datatables (see Section 9). These rules include:
■ Managing space utilized by the entire eDB. This includes rolling off oldest data to fit newdata if the disks are approaching full capacity.
■ Migrating data files from internal Oracle space to the external RAID array.
■ Initial schema creation by the installation process.
Storage of Lab History data that is timestamped in the future is not supported. Only LabHistory data received by the eDB with a timestamp equal to or less than the current time(up to 45 days old) will be stored.
An annotated text entry may be stored along with the Lab History point sample.
8.3 LAB HISTORY DATA SEND INTERFACE
A Lab Data executable is provided that will send Lab Data Configuration, Attributes andData samples to the eDB for storage. This executable can be invoked as a command lineprogram with arguments or as a Windows UI program where the execution options may bechosen.
8-1eDB220-70
Emerson Process Management Proprietary Class 2C
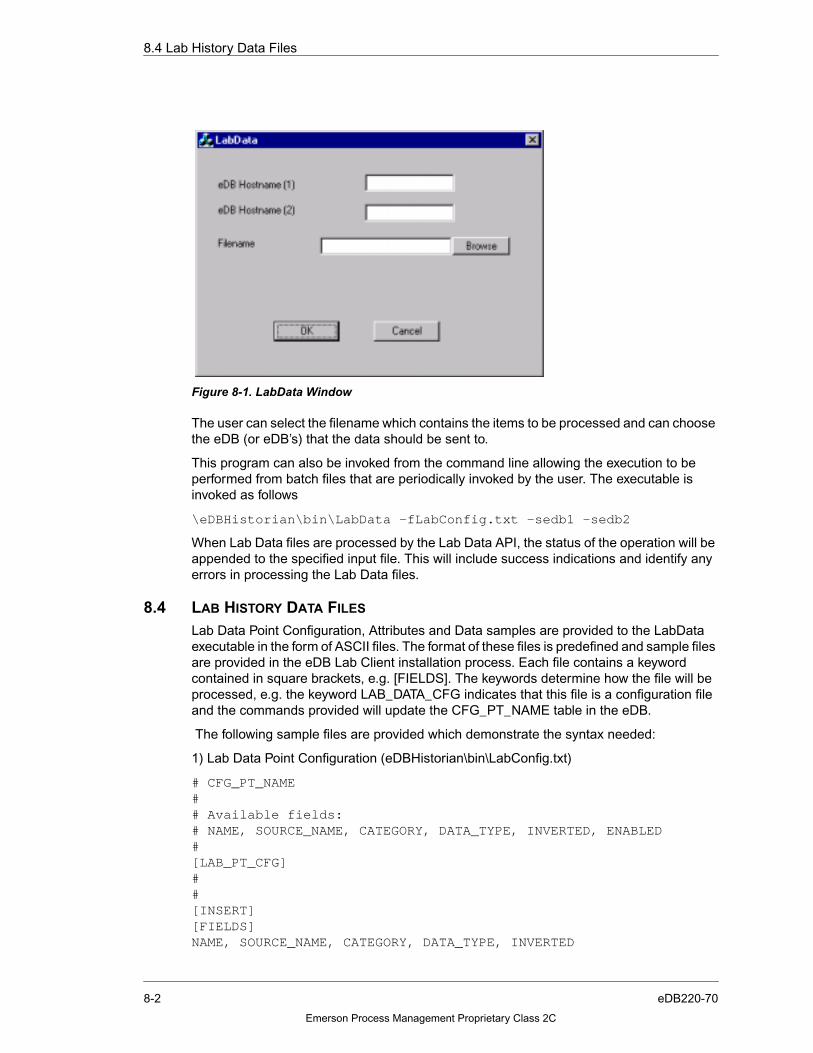
8.4 Lab History Data Files
The user can select the filename which contains the items to be processed and can choosethe eDB (or eDB’s) that the data should be sent to.
This program can also be invoked from the command line allowing the execution to beperformed from batch files that are periodically invoked by the user. The executable isinvoked as follows
\eDBHistorian\bin\LabData -fLabConfig.txt –sedb1 –sedb2
When Lab Data files are processed by the Lab Data API, the status of the operation will beappended to the specified input file. This will include success indications and identify anyerrors in processing the Lab Data files.
8.4 LAB HISTORY DATA FILES
Lab Data Point Configuration, Attributes and Data samples are provided to the LabDataexecutable in the form of ASCII files. The format of these files is predefined and sample filesare provided in the eDB Lab Client installation process. Each file contains a keywordcontained in square brackets, e.g. [FIELDS]. The keywords determine how the file will beprocessed, e.g. the keyword LAB_DATA_CFG indicates that this file is a configuration fileand the commands provided will update the CFG_PT_NAME table in the eDB.
The following sample files are provided which demonstrate the syntax needed:
1) Lab Data Point Configuration (eDBHistorian\bin\LabConfig.txt)
# CFG_PT_NAME## Available fields:# NAME, SOURCE_NAME, CATEGORY, DATA_TYPE, INVERTED, ENABLED#[LAB_PT_CFG]##[INSERT][FIELDS]NAME, SOURCE_NAME, CATEGORY, DATA_TYPE, INVERTED
Figure 8-1. LabData Window
8-2 eDB220-70
Emerson Process Management Proprietary Class 2C

8.4 Lab History Data Files
##DEMO_LAB_01.UNIT0@OVATION, "DEMO_LAB_01", "LAB", "R", "N"DEMO_LAB_02.UNIT0@OVATION, "DEMO_LAB_02", "LAB", "D", "N"DEMO_LAB_03.UNIT0@OVATION, "DEMO_LAB_03", "LAB", "R", "N"DEMO_LAB_04.UNIT0@OVATION, "DEMO_LAB_04", "LAB", "R", "N"DEMO_LAB_05.UNIT0@OVATION, "DEMO_LAB_05", "LAB", "R", "N"DEMO_LAB_06.UNIT0@OVATION, "DEMO_LAB_06", "LAB", "R", "N"DEMO_LAB_07.UNIT0@OVATION, "DEMO_LAB_07", "LAB", "R", "N"DEMO_LAB_08.UNIT0@OVATION, "DEMO_LAB_08", "LAB", "R", "N"
2) Lab Data Attribute Samples (eDBHistorian\bin\LabConfig.txt)
# PT_ATTRIB## Available fields:# NAME, DESCRIPTION, AUX_DESCRIPTION, ENGINEERING_UNITS,SET_DESCRIPTION, RESET_DESCRIPTION, SIGNIFICANT_DIGITS,BOTTOM_SCALE, TOP_SCALE, LOW_LIMIT, HIGH_LIMIT#[LAB_PT_ATTRIB]##[INSERT][FIELDS]NAME, DESCRIPTION, AUX_DESCRIPTION, ENGINEERING_UNITS,SET_DESCRIPTION, RESET_DESCRIPTION, SIGNIFICANT_DIGITS,BOTTOM_SCALE, TOP_SCALE, LOW_LIMIT, HIGH_LIMIT##DEMO_LAB_01.UNIT0@OVATION, "DEMO_LAB_01 DESC", "DEMO_LAB_01 AUX","Ohm", "ON", "OFF", 1, 11, 20, 12, 19DEMO_LAB_02.UNIT0@OVATION, "DEMO_LAB_02 DIGITAL", "DEMO_LAB_02AUX", "", "TRUE", "FALSE", 1, 0, 1, 0, 1DEMO_LAB_03.UNIT0@OVATION, "DEMO_LAB_03 DESC", "DEMO_LAB_03 AUX","Amp", "1", "0", 3, 31, 40, 32, 39DEMO_LAB_04.UNIT0@OVATION, "DEMO_LAB_04 DESC", "DEMO_LAB_04 AUX","MHz", "OFF","ON", 4, 41, 50, 42, 49DEMO_LAB_05.UNIT0@OVATION, "DEMO_LAB_05 DESC", "DEMO_LAB_05 AUX","Watts", "ON", "OFF", 5, 51, 60, 52, 59DEMO_LAB_06.UNIT0@OVATION, "DEMO_LAB_06 DESC", "DEMO_LAB_06 AUX","HP", "ON", "OFF", 6, 61, 70, 62, 69DEMO_LAB_07.UNIT0@OVATION, "DEMO_LAB_07 DESC", "DEMO_LAB_07 AUX","Volts", "OFF","ON", 7, 71, 80, 72, 79DEMO_LAB_08.UNIT0@OVATION, "DEMO_LAB_08 DESC", "DEMO_LAB_08 AUX","cm", "ON", "OFF", 8, 81, 90, 82, 89
3) Lab Data Point Samples (eDBHistorian\bin\LabConfig.txt)
8-3eDB220-70
Emerson Process Management Proprietary Class 2C

8.5 Lab History Data Retrieval
# PT_LAB_HIST## Available fields:# NAME, TIMESTAMP_GMT|TIMESTAMP_LOCAL, TIME_NSEC, SAMP_FLAGS,F_VALUE, STS, MEMO#[LAB_DATA]##[INSERT][FIELDS]NAME, TIMESTAMP_GMT, F_VALUE, STS, MEMO##DEMO_LAB_01.UNIT0@OVATION, "03/10/2003 11:11:11", 18.1, GQ, MEMO1DEMO_LAB_02.UNIT0@OVATION, "03/10/2003 11:11:12", 0, GQ, MEMO2DEMO_LAB_03.UNIT0@OVATION, "03/10/2003 11:11:13", 33.3, FQ, MEMO3DEMO_LAB_04.UNIT0@OVATION, "03/10/2003 11:11:14", 44.4, BQ, MEMO4DEMO_LAB_05.UNIT0@OVATION, "03/10/2003 11:11:15", 55.5, 1, MEMO5DEMO_LAB_06.UNIT0@OVATION, "03/10/2003 11:11:16", 66.6, 2, MEMO6DEMO_LAB_07.UNIT0@OVATION, "03/10/2003 11:11:17", 77.7, 3, MEMO7DEMO_LAB_08.UNIT0@OVATION, "03/10/2003 11:11:18", 88.8, 0x34, MEMO8##[FIELDS]NAME, TIMESTAMP_GMT, F_VALUE, STS, MEMODEMO_LAB_01.UNIT0@OVATION, "03/12/2003 11:11:11", 12.1, GQ, MEMO1DEMO_LAB_02.UNIT0@OVATION, "03/12/2003 11:11:12", 1, GQ, MEMO2
DEMO_LAB_03.UNIT0@OVATION, "03/12/2003 11:11:13", 38, FQ, MEMO3DEMO_LAB_04.UNIT0@OVATION, "03/12/2003 11:11:14", 48, BQ, MEMO4DEMO_LAB_05.UNIT0@OVATION, "03/12/2003 11:11:15", 58, 1, MEMO5DEMO_LAB_06.UNIT0@OVATION, "03/12/2003 11:11:16", 68, 2, MEMO6DEMO_LAB_07.UNIT0@OVATION, "03/12/2003 11:11:17", 78, 3, MEMO7DEMO_LAB_08.UNIT0@OVATION, "03/12/2003 11:11:18", 82, 0x34, MEMO8
8.5 LAB HISTORY DATA RETRIEVAL
Existing retrieval interfaces into process point data will also be used to present Lab HistoryData. These interfaces include:
■ Ovation Historical Trend
■ Ovation Historical Point Review Application
■ Desktop Suite (minus Excel plug-in)
■ Reports
Lab History Data will be presented in the Historical Trend application. Lab History data willbe retrieved in conjunction with HF (High Fidelity) Data that is collected in the eDB throughpoint scanners. This will allow the Trend to show both scanner generated data along withLab History data. Both of these types of data can be shown in the same Trend. You canrequest Lab History data in the Historical Trend application, the Historical Reviewapplication and Express Calc Reports in the same manner that HF data is requested.
8-4 eDB220-70
Emerson Process Management Proprietary Class 2C
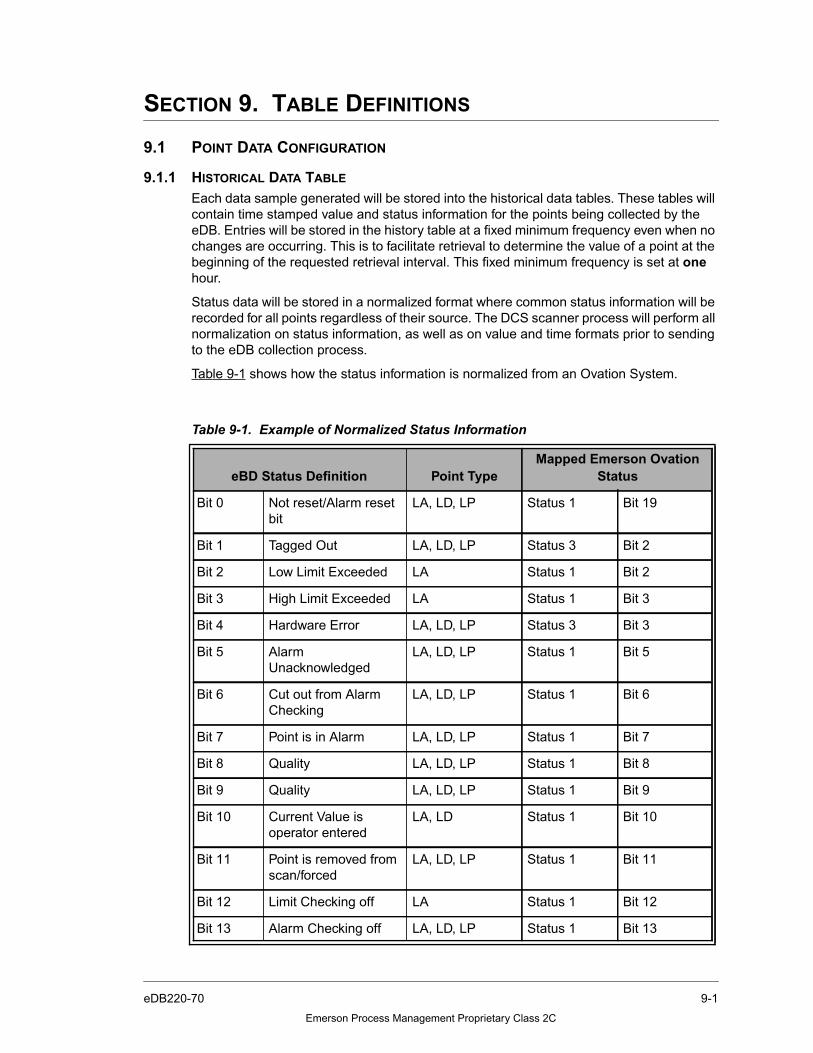
SECTION 9. TABLE DEFINITIONS
9.1 POINT DATA CONFIGURATION
9.1.1 HISTORICAL DATA TABLE
Each data sample generated will be stored into the historical data tables. These tables willcontain time stamped value and status information for the points being collected by theeDB. Entries will be stored in the history table at a fixed minimum frequency even when nochanges are occurring. This is to facilitate retrieval to determine the value of a point at thebeginning of the requested retrieval interval. This fixed minimum frequency is set at onehour.
Status data will be stored in a normalized format where common status information will berecorded for all points regardless of their source. The DCS scanner process will perform allnormalization on status information, as well as on value and time formats prior to sendingto the eDB collection process.
Table 9-1 shows how the status information is normalized from an Ovation System.
Table 9-1. Example of Normalized Status Information
eBD Status Definition Point TypeMapped Emerson Ovation
Status
Bit 0 Not reset/Alarm resetbit
LA, LD, LP Status 1 Bit 19
Bit 1 Tagged Out LA, LD, LP Status 3 Bit 2
Bit 2 Low Limit Exceeded LA Status 1 Bit 2
Bit 3 High Limit Exceeded LA Status 1 Bit 3
Bit 4 Hardware Error LA, LD, LP Status 3 Bit 3
Bit 5 AlarmUnacknowledged
LA, LD, LP Status 1 Bit 5
Bit 6 Cut out from AlarmChecking
LA, LD, LP Status 1 Bit 6
Bit 7 Point is in Alarm LA, LD, LP Status 1 Bit 7
Bit 8 Quality LA, LD, LP Status 1 Bit 8
Bit 9 Quality LA, LD, LP Status 1 Bit 9
Bit 10 Current Value isoperator entered
LA, LD Status 1 Bit 10
Bit 11 Point is removed fromscan/forced
LA, LD, LP Status 1 Bit 11
Bit 12 Limit Checking off LA Status 1 Bit 12
Bit 13 Alarm Checking off LA, LD, LP Status 1 Bit 13
9-1eDB220-70
Emerson Process Management Proprietary Class 2C
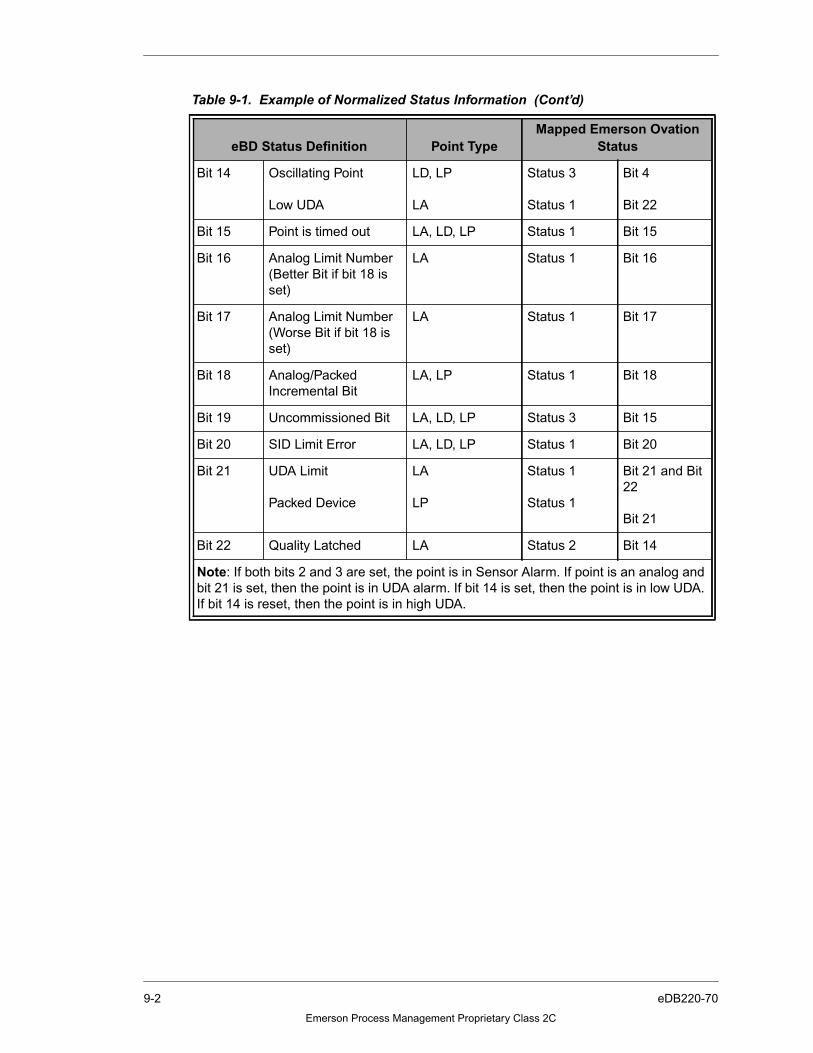
Bit 14 Oscillating Point
Low UDA
LD, LP
LA
Status 3
Status 1
Bit 4
Bit 22
Bit 15 Point is timed out LA, LD, LP Status 1 Bit 15
Bit 16 Analog Limit Number(Better Bit if bit 18 isset)
LA Status 1 Bit 16
Bit 17 Analog Limit Number(Worse Bit if bit 18 isset)
LA Status 1 Bit 17
Bit 18 Analog/PackedIncremental Bit
LA, LP Status 1 Bit 18
Bit 19 Uncommissioned Bit LA, LD, LP Status 3 Bit 15
Bit 20 SID Limit Error LA, LD, LP Status 1 Bit 20
Bit 21 UDA Limit
Packed Device
LA
LP
Status 1
Status 1
Bit 21 and Bit22
Bit 21
Bit 22 Quality Latched LA Status 2 Bit 14
Note: If both bits 2 and 3 are set, the point is in Sensor Alarm. If point is an analog andbit 21 is set, then the point is in UDA alarm. If bit 14 is set, then the point is in low UDA.If bit 14 is reset, then the point is in high UDA.
Table 9-1. Example of Normalized Status Information (Cont’d)
eBD Status Definition Point TypeMapped Emerson Ovation
Status
9-2 eDB220-70
Emerson Process Management Proprietary Class 2C

Table 9-3. PT_LAB_HIST
9.1.2 AGGREGATE CONFIGURATION
When the process value is being read as in Point Value Scanning, a record is updatedwhich tracks aggregates of the value over a 10 minute time period. At the end of the timeperiod, the aggregate record is sent to the eDB Historian. The record is then reset for thenext time period.
Table 9-2. PT_HF_HIST
Table Name:- PT_HF_HIST
Column Name Column Description
ID Unique point ID
TIMESTAMP Oracle Format timestamp in GMT
TIME_NSEC High resolution time stamp in nanoseconds
SAMP_FLAGS Indicates duplicate data, modified data, and soforth
F_VALUE Floating Point value of sample as appropriate
RAW_VALUE Raw value of sample as appropriate
STS Status and Quality indicators for value fields
Table Name:- PT_LAB_HIST
Column Name Column Description
ID Unique point ID
TIMESTAMP Oracle format timestamp in GMT
TIME_NSEC High resolution time stamp in nanoseconds
SAMP_FLAGS Indicates duplicate data, modified data, and soforth
F_VALUE Floating point value of sample as appropriate
STS Status and Quality indicators for value field
MEMO Annotated user text meno (80 chars)
9-3eDB220-70
Emerson Process Management Proprietary Class 2C

9.1.3 ATTRIBUTE COLLECTION
Various attributes will be stored for each point in the system. The most recent set of pointattributes will be maintained for each point in the point attributes table. Entries will beupdated in the attribute history table at a fixed minimum frequency even when no changesare occurring.
Attributes may be sent periodically by the DCS Scanner or may be requested by thecollection subsystem as required. For example, the collection subsystem could request theattributes for a point if an attribute record has not been received within a given interval forthe point.
Table 9-4. PT_AG_HIST
Table Name:- PT_AG_HIST
Column Name Column Description
ID Unique point ID
TIMESTAMP Oracle Format timestamp in GMT
AVG_VAL Average of point over the aggregate interval
MAX_VAL Maximum of point over the aggregate interval
MIN_VAL Minimum of point over the aggregate interval
MAX_TIME Time of maximum of point over aggregate interval
MAX_TIME_NSEC Time in nanoseconds of point over aggregate interval
MIN_TIME Time of minimum of point over aggregate interval
MIN TIME NSEC Time in nanoseconds of minimum of point overaggregate interval
TOGGLE_SET Count transitions to 1 of digital point over the aggregateinterval
TOGGLE_RESET Count transitions to 0 of digital point over the aggregateinterval
TIME_SET Amount of time in 1 state for digital over the aggregateinterval
TIME_RESET Amount of time in 0 state for digital over the aggregateinterval
STS Status and Quality indicators for value fields
Table 9-5. PT_ATTRIB
Table Name:- PT_ATTRIB
Column Name Column Description
ID Unique point ID
9-4 eDB220-70
Emerson Process Management Proprietary Class 2C

9.1.4 CURRENT VALUE TABLE (NOT CURRENTLY IMPLEMENTED)The current or most recent value of each point may optionally be stored in a current valuetable. This will allow quick access to the most recent value for each point in the system. Thetable will include a timestamp indication of when the value was placed in the table. The tablewill contain one row for each point currently defined to be collected by the eDB. This tableis currently not implemented in the first releases.
TIMESTAMP Oracle Format timestamp in GMT
TIME_NSEC High resolution timestamp in nanoseconds
SAMP_FLAGS Flag information
DESCRIPTION English Description
AUX_DESCRIPTION Auxiliary Description
ENGINEERING_UNITS Engineering Units description
SET_DESCRIPTION Set state description for digital points
RESET_DESCRIPTIION Reset state description for digital points
SIGNIFICANT_DIGITS Number of decimal places to display
BOTTOM_SCALE Bottom of scale value for display
TOP_SCALE Top of scale value for display
LOW_LIMIT Low limit for alarming purposes
HIGH_LIMIT High limit for alarming purpose
Table 9-5. PT_ATTRIB (Cont’d)
9-5eDB220-70
Emerson Process Management Proprietary Class 2C

9.2 Message Collection Configuration
9.1.5 POINT AUDIT HISTORY TABLE (NOT CURRENTLY IMPLEMENTED)
9.2 MESSAGE COLLECTION CONFIGURATION
The eDB is capable of storing messages originating from the DCS scanners and messagesoriginating locally due to eDB events. Multiple message types are supported including:
■ DCS data messages such as alarms, operator events, ASCII messages
■ DCS event messages such as time shifts or missing data
■ Link messages such as link establish and failure messages
■ Historian event messages such as disk space errors
Table 9-6. PT_CUR_VALUE
Table Name:- PT_CUR_VALUE
Column Name Column Description
ID Unique point ID
TIMESTAMP Oracle Format timestamp in GMT
TIME_NSEC High resolution time stamp in nanoseconds
F_VALUE Floating Point value of sample as appropriate
RAW_VALUE Raw value of sample as appropriate
STS Status and Quality indicators for value fields
Table 9-7. PT_AU_HIST
Table Name:- PT_AU_HIST
Column Name Column Description
MODIFY_TIME Oracle Format timestamp in GMT of modification
ID Unique point ID
TIMESTAMP Oracle Format timestamp in GMT
TIME_NSEC High resolution time stamp in nanoseconds
SAMP_FLAGS Indicates duplicate data, modified data, and soforth
F_VALUE Floating Point value of sample as appropriate
RAW_VALUE Raw value of sample as appropriate
STS Status and Quality indicators for value fields
9-6 eDB220-70
Emerson Process Management Proprietary Class 2C

9.2 Message Collection Configuration
Table 9-8. MSG_ALARM_HIST
Table Name:- MSG_ALARM_HIST
Column Name Column Description
TIMESTAMP Oracle Format timestamp in GMT
TIME_NSEC High resolution time stamp in nanoseconds
MSG_FLAGS Message flags
MSG_TYPE Message type of alarm, for example,cutout, timeout,high, low, return. For additonal information refer to“Ovation Operator Station User Guide” (listed in Table 1-3).
SUB_TYPE Subtype for alarm filtering (see Table 9-9)
SOURCE_ID ID of scanner which sent the message
SYSTEM ID of the system which originated the message
NODE Node or drop that originated the message
PRIM_TEXT 200 character alarm text message storage
ALARM_INFO1 Additional message information (TBD)
Table 9-9. Alarm Subtypes
Subtype Number Definition
0 No entry
1 New Alarm
2 Return
3 Incremental Alarm
4 Status Change
5 Timed Out Drop
6 Spurious Alarm
7 Suppressed Alarm
8 Acknowledged Alarm
9 Released Alarm
9-7eDB220-70
Emerson Process Management Proprietary Class 2C

9.2 Message Collection Configuration
Table 9-10. MSG_SOE_HIST
Table Name:- MSG_SOE_HIST
Column Name Column Description
TIMESTAMP Oracle Format timestamp in GMT
TIME_NSEC High resolution time stamp in nanoseconds
MSG_FLAGS Bit flags
SOURCE_ID ID of scanner which sent the message
SYSTEM ID of the system which originated the message
NODE Node or drop that originated the message
PRIM_TEXT 200 character SOE message storage
SOE_INFO1 Additional message information (TBD)
Table 9-11. MSG_TEXT_HIST
Table Name:- MSG_TEXT_HIST
Column Name Column Description
TIMESTAMP Oracle Format timestamp in GMT
TIME_NSEC High resolution time stamp in nanoseconds
MSG_FLAGS Message flags
MSG_TYPE Text message type, for example, Opevent, Sys-tem, Couerr
SUB_TYPE Sub type category for additional filtering
SOURCE_ID ID of scanner which sent the message
SYSTEM ID of the system which originated the message
NODE Node or drop that originated the message
PRIM_TEXT 200 character text message storage
SUPP_TEXT 100 character optional supplementary messagetext
SUPP_INFO1 Additional message information (TBD)
SUPP_INFO2 Additional message information (TBD)
9-8 eDB220-70
Emerson Process Management Proprietary Class 2C
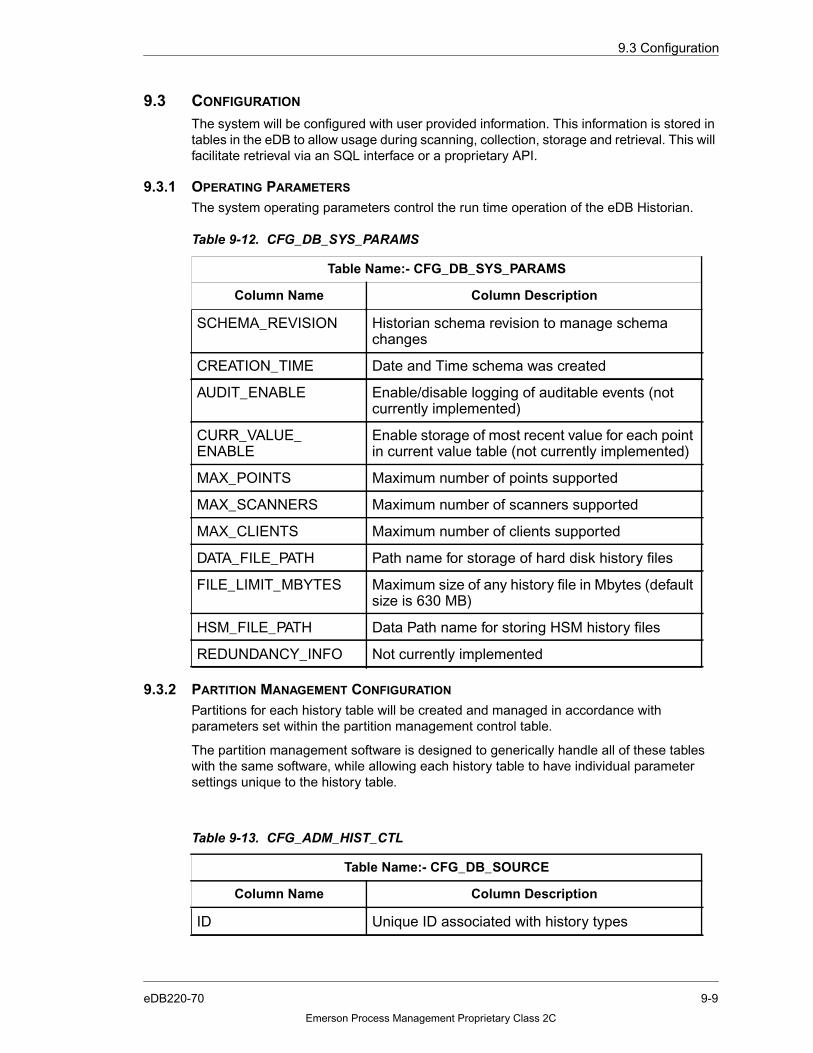
9.3 Configuration
9.3 CONFIGURATION
The system will be configured with user provided information. This information is stored intables in the eDB to allow usage during scanning, collection, storage and retrieval. This willfacilitate retrieval via an SQL interface or a proprietary API.
9.3.1 OPERATING PARAMETERS
The system operating parameters control the run time operation of the eDB Historian.
9.3.2 PARTITION MANAGEMENT CONFIGURATION
Partitions for each history table will be created and managed in accordance withparameters set within the partition management control table.
The partition management software is designed to generically handle all of these tableswith the same software, while allowing each history table to have individual parametersettings unique to the history table.
Table 9-12. CFG_DB_SYS_PARAMS
Table Name:- CFG_DB_SYS_PARAMS
Column Name Column Description
SCHEMA_REVISION Historian schema revision to manage schemachanges
CREATION_TIME Date and Time schema was created
AUDIT_ENABLE Enable/disable logging of auditable events (notcurrently implemented)
CURR_VALUE_ENABLE
Enable storage of most recent value for each pointin current value table (not currently implemented)
MAX_POINTS Maximum number of points supported
MAX_SCANNERS Maximum number of scanners supported
MAX_CLIENTS Maximum number of clients supported
DATA_FILE_PATH Path name for storage of hard disk history files
FILE_LIMIT_MBYTES Maximum size of any history file in Mbytes (defaultsize is 630 MB)
HSM_FILE_PATH Data Path name for storing HSM history files
REDUNDANCY_INFO Not currently implemented
Table 9-13. CFG_ADM_HIST_CTL
Table Name:- CFG_DB_SOURCE
Column Name Column Description
ID Unique ID associated with history types
9-9eDB220-70
Emerson Process Management Proprietary Class 2C
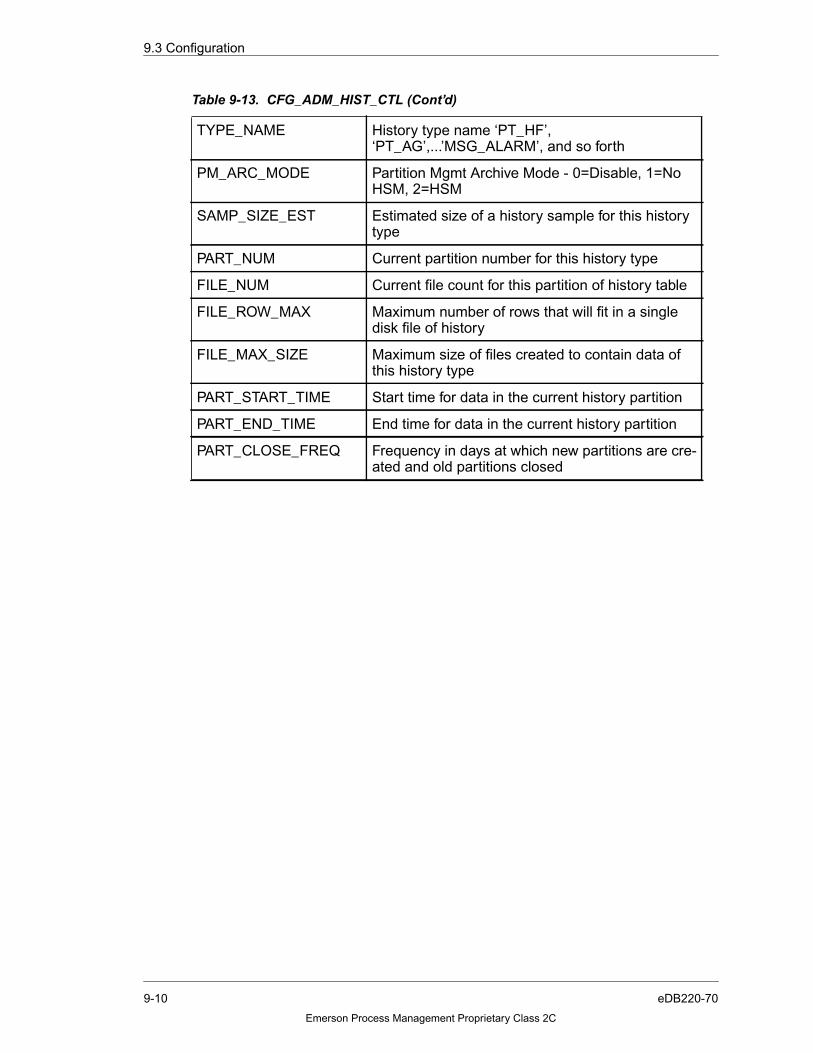
9.3 Configuration
TYPE_NAME History type name ‘PT_HF’,‘PT_AG’,...’MSG_ALARM’, and so forth
PM_ARC_MODE Partition Mgmt Archive Mode - 0=Disable, 1=NoHSM, 2=HSM
SAMP_SIZE_EST Estimated size of a history sample for this historytype
PART_NUM Current partition number for this history type
FILE_NUM Current file count for this partition of history table
FILE_ROW_MAX Maximum number of rows that will fit in a singledisk file of history
FILE_MAX_SIZE Maximum size of files created to contain data ofthis history type
PART_START_TIME Start time for data in the current history partition
PART_END_TIME End time for data in the current history partition
PART_CLOSE_FREQ Frequency in days at which new partitions are cre-ated and old partitions closed
Table 9-13. CFG_ADM_HIST_CTL (Cont’d)
9-10 eDB220-70
Emerson Process Management Proprietary Class 2C
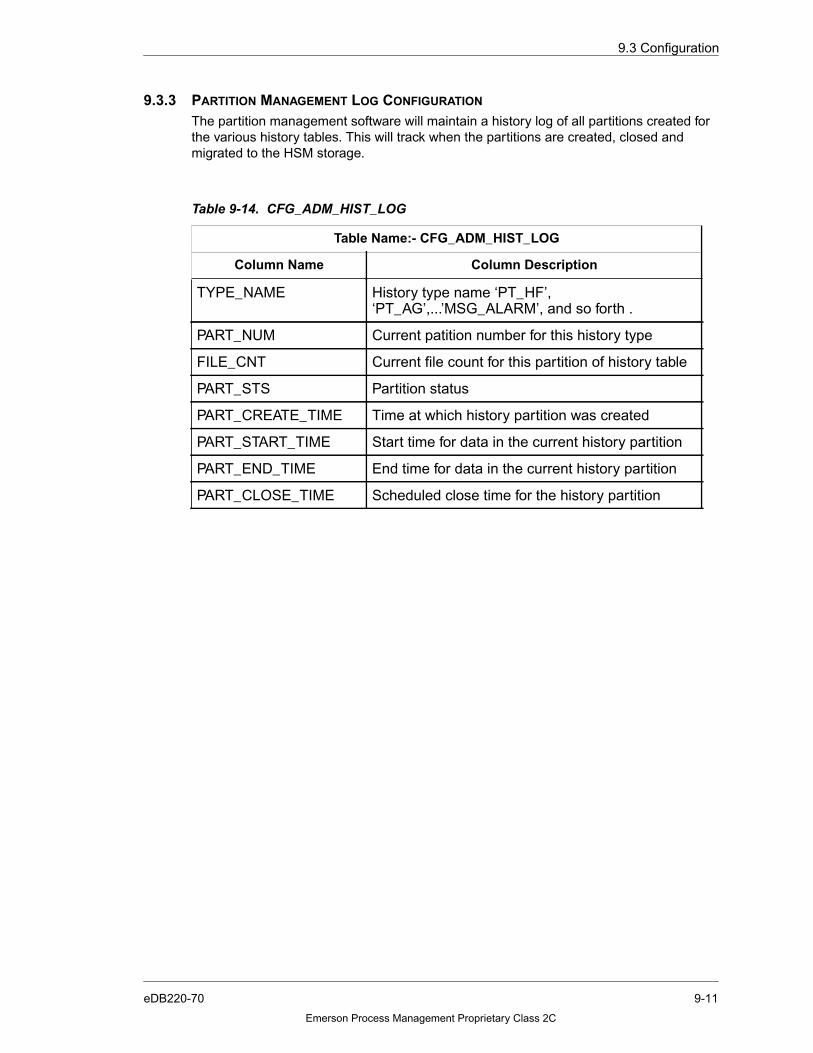
9.3 Configuration
9.3.3 PARTITION MANAGEMENT LOG CONFIGURATION
The partition management software will maintain a history log of all partitions created forthe various history tables. This will track when the partitions are created, closed andmigrated to the HSM storage.
Table 9-14. CFG_ADM_HIST_LOG
Table Name:- CFG_ADM_HIST_LOG
Column Name Column Description
TYPE_NAME History type name ‘PT_HF’,‘PT_AG’,...’MSG_ALARM’, and so forth .
PART_NUM Current patition number for this history type
FILE_CNT Current file count for this partition of history table
PART_STS Partition status
PART_CREATE_TIME Time at which history partition was created
PART_START_TIME Start time for data in the current history partition
PART_END_TIME End time for data in the current history partition
PART_CLOSE_TIME Scheduled close time for the history partition
9-11eDB220-70
Emerson Process Management Proprietary Class 2C

9.3 Configuration
9.3.4 DATA SOURCE CONFIGURATION
The data sources that provide data to the eDB are configured as follows:
Table 9-15. CFG_DB_SOURCE
Table Name:- CFG_ADM_HIST_CTL
Column Name Column Description
NAME Unique name for the data source
ID Unique Source ID
TYPE Type of data source, for example, Pt Scanner,Attribute Scanner
PLATFORM Not implemented
UPDATE_FREQ Not implemented
ACK_FREQ Not implemented
HOLD_PERIOD Not implemented
HOLD_SIZE Not implemented
HOLD_LOCATION Not implemented
DESTINATIONS Not implemented
REDUNDANCY_INFO Not implemented
ADDRESS_A Not implemented
DOWNLOADED_A Not implemented
DOWNLOAD_TIME_A Not implemented
LINK_PARAMS_A Not implemented
ADDRESS_B Not implemented
DOWNLOADED_B Not implemented
DOWNLOAD_TIME_B Not implemented
LINK_PARAMS_B Not implemented
9-12 eDB220-70
Emerson Process Management Proprietary Class 2C

9.3 Configuration
9.3.5 POINT CONFIGURATION
A configuration table is maintained in which every point name in the eDB will be storedalong with the source of the data. Each point is assigned a unique history ID. The historyIDs will not be recycled to ensure that historical data can always be accessed. Point nameswill never be deleted from this table but the point information can be modified. The samehistory ID will always be retained for the same point name, however other point informationmay be modified since it does not compromise data retrieval. This history ID will provide thekey to store and retrieve data to/from the current, history and modify tables. Inactive pointsmay be marked as disabled since they are never deleted from the table. The type of dataassociated with each point is configured so that collection, storage and retrieval know howto handle the data in the historical data tables.
9.3.6 POINT ALIAS TABLE (NOT CURRENTLY IMPLEMENTED)An alias table is maintained which will allow one or more point aliases to be assigned to apoint which is in the eDB. The alias can be used to look up the point name which in turncan be used to look up the unique ID for the point name/alias.
Table 9-16. CFG_PT_NAME
Table Name:- CFG_PT_NAME
Column Name Column Description
NAME ASCII point name
ID Unique integer ID
PT_FLAGS Flags for processing options
SOURCE_ID ID of originating data scanner/source
SOURCE_NAME Name of point in originating system
CATEGORY For example, Temp, Pressure, Boiler, and so forth
IMPORTED Indicates if point is imported
ENABLED Indicates if point is currently enabled
DATA_TYPE Analog (‘R’), Digital (‘D’), Packed (‘P’)
INVERTED Indicates if point values are inverted
SCAN_RESOLUTION Frequency of scanning
COMPRESSION_INFO Compression type, deadband information, and soforth
DEADBAND Compression deadband
PT_INFO Contains DCS specific point parameters
CREATION_TIME Date and Time point was added
MODIFY_TIME Date and Time point was last modified
9-13eDB220-70
Emerson Process Management Proprietary Class 2C
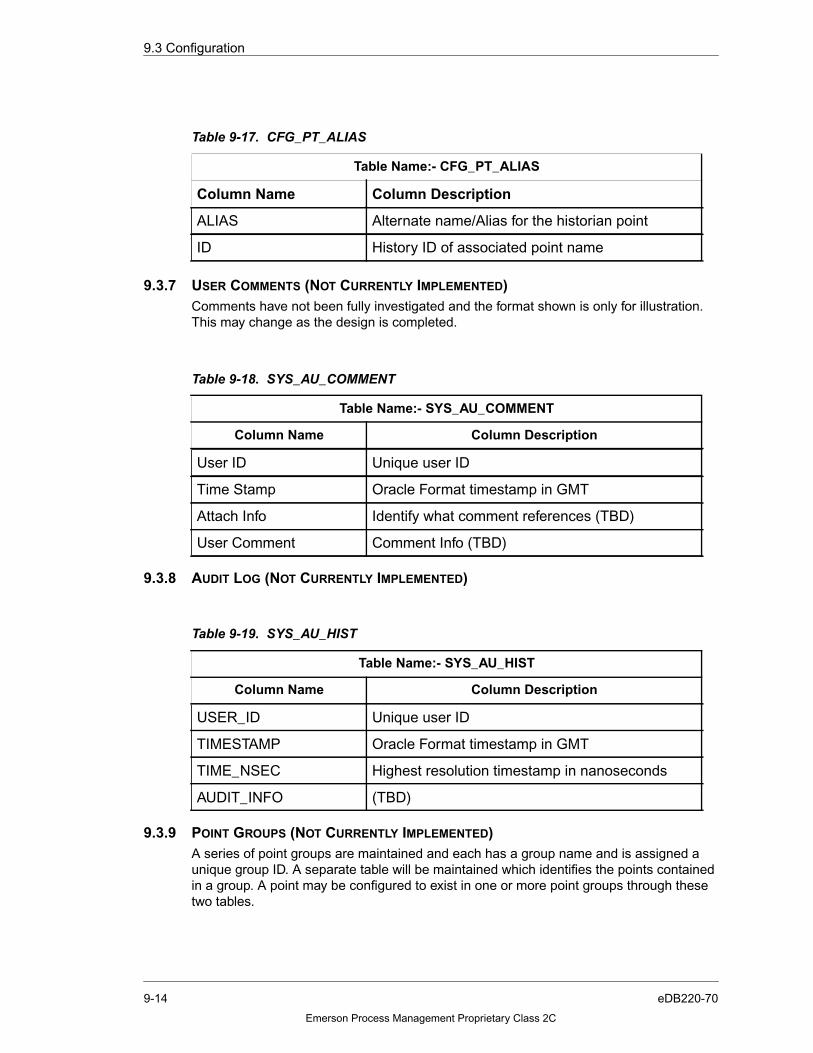
9.3 Configuration
9.3.7 USER COMMENTS (NOT CURRENTLY IMPLEMENTED)Comments have not been fully investigated and the format shown is only for illustration.This may change as the design is completed.
9.3.8 AUDIT LOG (NOT CURRENTLY IMPLEMENTED)
9.3.9 POINT GROUPS (NOT CURRENTLY IMPLEMENTED)A series of point groups are maintained and each has a group name and is assigned aunique group ID. A separate table will be maintained which identifies the points containedin a group. A point may be configured to exist in one or more point groups through thesetwo tables.
Table 9-17. CFG_PT_ALIAS
Table Name:- CFG_PT_ALIAS
Column Name Column Description
ALIAS Alternate name/Alias for the historian point
ID History ID of associated point name
Table 9-18. SYS_AU_COMMENT
Table Name:- SYS_AU_COMMENT
Column Name Column Description
User ID Unique user ID
Time Stamp Oracle Format timestamp in GMT
Attach Info Identify what comment references (TBD)
User Comment Comment Info (TBD)
Table 9-19. SYS_AU_HIST
Table Name:- SYS_AU_HIST
Column Name Column Description
USER_ID Unique user ID
TIMESTAMP Oracle Format timestamp in GMT
TIME_NSEC Highest resolution timestamp in nanoseconds
AUDIT_INFO (TBD)
9-14 eDB220-70
Emerson Process Management Proprietary Class 2C

9.3 Configuration
9.3.10 BATCH RUNS (NOT CURRENTLY IMPLEMENTED)Batch history will be defined as the data for points in the associated batch group during aparticular time interval known as a batch run.
9.3.11 GROUP/BATCH RETRIEVALS (NOT CURRENTLY IMPLEMENTED)A series of batch groups will also be maintained and will have a batch group name and willbe assigned a unique batch group ID. Retrievals can be performed for:
■ All points in a point group
■ All points in a batch group
Table 9-20. CFG_PT_GROUP
Table Name:- CFG_PT_GROUP
Column Name Column Description
NAME Name of Historical Point Group
ID Unique Group ID
TYPE Point Group or Batch Group
Table 9-21. CFG_PT_GROUP_POINTS
Table Name:- CFG_PT_GROUP_POINTS
Column Name Column Description
GROUP_ID Unique Group ID
POINT_ID Unique Point ID contained in group
Table 9-22. CFG_PT_BATCH
Table Name:- CFG_PT_BATCH
Column Name Column Description
NAME Name of the batch run
ID Unique Batch ID
GROUP_ID ID of point group associated with batch production
PRODUCT Product Name/ID
UNIT Production Unit
START_TIME Start time of the batch run
END_TIME End time of the batch run
9-15eDB220-70
Emerson Process Management Proprietary Class 2C

9.3 Configuration
■ All points matching a category
■ All points matching some name criteria
■ All points from a particular source
■ Any mechanism that can be used to generate a list of point IDs from tables in thedatabase
9-16 eDB220-70
Emerson Process Management Proprietary Class 2C

9.3 Configuration
9.3.12 TRIGGER CONFIGURATION
Trigger conditions can be configured in the eDB. These Triggers are changes of state ofdigital points. Trigger configurations are stored in the CFG_PT_TRIG table. The maximumnumber of configured triggers is 300.
HF data from scanners is monitored to be determined if trigger criteria are satisified. Theoccurrence of a trigger is recorded in the PT_TRIG_HIST table. Entries in thePT_TRIG_HIST table are used to trigger execution of reports and may be used to controlexecution of additional applications.
The PT_TRIG_HIST table will store a history for a limited time period determined by diskspace limitations. If the allocated space is consumed, the oldest trigger events will bediscarded.
Table 9-23. CFG_PT_TRIG
Table Name:- CFG_PT_TRIG
Column Name Column Description
ID Unique point ID.
TIMESTAMP Oracle format timestamp in GMT of trigger create.Triggers are considered expired after eight weeks,if not used.
TRIG_FREQ Required time delay between trigger event occur-rences recorded in history (specified in seconds).
TRIG_VAL Value which constitutes trigger occurrence (forexample, 0 or 1). Any other value results in allvalue transitions being recorded.
TRIG_HOST Hostname of the machine that uses trigger.
TRIG_APP Name of application which uses trigger.
9-17eDB220-70
Emerson Process Management Proprietary Class 2C

9.3 Configuration
Table 9-24. PT_TRIG_HIST
Table Name:- PT_TRIG_HIST
Column Name Column Description
ID Unique point ID.
TIMESTAMP Oracle format timestamp in GMT.
TIME_NSEC High resolution time stamp in nanoseconds.
VALUE Floating point value of sample as appropriate.
STS Status and Quality indicators for value field.
9-18 eDB220-70
Emerson Process Management Proprietary Class 2C

SECTION 10. DATABASE MAINTENANCE
10.1 SECTION OVERVIEW
The eDB system contains a number of database maintenance routines which runautomatically, requiring little or no intervention from the end-user. This maintenanceincludes:
■ Database backups
■ Verifying database availability
■ Error detection and reporting
■ Monitoring of space both inside the database and at the file system levels
■ Housekeeping of various log files.
In addition to these automated jobs, some manual attention from the eDB administrator isnecessary.
■ It is important to check for any errors reported by these automatic jobs. In the event ofan error, the source of the error should be determined as soon as possible to preventpossible loss of data. If the error is due to issues of normal maintenance (such asnightly tape backup failed because the tape drive is full), then the appropriatemaintenance actions should be taken. Critical errors such as the Oracle database notbeing functional, should be reported to Emerson support to allow corrective action tobe taken
■ Tapes must be cycled in and out of the tape drive on a regular basis to ensure thebackup routine does not run out of room on a tape.
These duties are described in detail in the following sections.
10-1eDB220-70
Emerson Process Management Proprietary Class 2C
10.2 Checking the System for Errors
10.2 CHECKING THE SYSTEM FOR ERRORS
The eDB system is designed to notify the administrator automatically in the event of an errorvia e-mail. This means that the eDB Historian server must be configured for e-mail. Thereare two types of notification, e-mail, and pager (the pager must be an e-mail type pager).Severe errors are sent to an e-mail pager. Non-severe errors are sent to a regular e-mailaddress.
10.2.1 AUTOMATED ERROR NOTIFICATION
In order to turn on automatic error notification, you must enter your addresses and e-mailserver name into the %EPH_HOME%\bin\keymaster.bat.file. If no e-mail pager is available,use an e-mail address for both.
Use the following procedure to modify the file:
1. Navigate to edbhistorian\bin.
2. Right-click on the keymaster.bat file and choose Edit. A Notepad window appears.
Make the following edits to edbhistorian\bin\keymaster.bat:
set [email protected] (used for low severity messages)
set [email protected] (used for high severity messages)
set esvr=email_server
3. Choose File -> Save.
Once the above file is modified, the user names listed in this file will automatically benotified of errors.
10.2.2 MANUAL ERROR CHECKING
Typically, the eDB Historian server is not setup with e-mail capabilities. In this situation, youwill need to check for errors manually. It is recommended that the error logs be reviewed atleast once a day.
Use the following procedure to check errors manually:
1. Navigate to C:\edblocal\log.
2. Search for error files in the form of *.err.mm_dd_yyyy.
3. Verify that all error files for the date being checked are 0 bytes.
4. Investigate any errors. Take appropriate corrective action in the case of normalmaintenance issues. Contact Emerson in the event of critical errors.
10.3 TAPE POOL MANAGEMENT
Syncsort Backup Express (BEX) is the third-party tool used to manage the tape backups.The following sections are only applicable if your system is configured to use tape backup.
10.3.1 TAPE POOL BACKUP
The database is automatically backed up to tape at 12:30 AM every day. Full backups areperformed on Wednesdays and Sundays. Incremental backups are performed on theremaining days.
Note:
Full backups use more space than Incremental backups.
10-2 eDB220-70
Emerson Process Management Proprietary Class 2C

10.3 Tape Pool Management
It is important to keep tapes from becoming full to avoid a backup failure. Check the spaceon the tape daily until your site’s data volume is determined. When a tape is nearly full,replace it with the next tape in the tape pool. The following sections provide more detailedinformation.
10.3.2 CYCLING TAPES
Tapes should be labeled EDB001 through EDB005, for five tapes in the tape pool. Usetapes in a circular fashion, such as, EDB001, then EDB002 and so on up to EDB005. Startback at EDB001 when you have reached the last tape in the tape pool.
10.3.3 CHECKING SPACE ON TAPE
Check the space left on the tape each day to determine the data volumes. Once the datavolume is determined, place the tape in the tape drive on a regular basis, for example, everyFriday or every Tuesday and Friday.
Use the following procedure to determine when a tape is nearly full:
1. Choose Start -> Programs -> Backup -> Backup Express to start Backup Express.
2. Click on Administrator Login and enter sysadmin for the username and sysadminfor the password. The Administrator Menu appears.
3. Choose Reports.
4. Choose Media.
5. Highlight the tape you are currently checking. This is the tape currently in the tape drive.
6. Scroll to the Capacity column and note the number in the Data on Media column. Ifthe Data on Media column is within five Gbytes of the Capacity column, cycle thecurrent tape with the next tape in the tape pool.
Note:
The Capacity column is in Mbytes and the Data on Media column is inKbytes.
7. Exit Media Report by pressing Ok.
8. Exit BEX by pressing the door icon in the lower right-hand corner.
10.3.4 ADDING TAPES TO THE TAPE POOL
It may become necessary to add tapes to the tape pool. If your site’s data volumes requireyou to switch tapes more than once a week, you will need to increase the size of your tapepool. The standard tape pool size is five tapes, EDB001 through EDB005. A tape pool offive tapes accommodates one tape switch per week.
Multiply the number of tape switches each week by five to determine the number of tapesyou will need in your tape pool. For example, if you switch tapes twice per week, you willneed ten tapes in your tape pool, EDB001 through EDB010. If you switch tapes three timesper week, you will need fifteen tapes in your tape pool, EDB001 through EDB015.
Use the following procedure to add tapes to the tape pool:
1. Choose Start -> Programs -> Backup -> Backup Express to start Backup Express.
2. Click on Administrator Login and enter sysadmin for the username and sysadminfor the password. The Administrator Menu appears.
10-3eDB220-70
Emerson Process Management Proprietary Class 2C

10.3 Tape Pool Management
3. Choose Configure -> Media.
4. Select Media Pool <eDB HOSTNAME>_Tapes.
5. From the Media Pool pull-down menu, choose Add Media.
6. In the Number field, enter the number of tapes you are adding to the tape pool.
7. In the Capacity field, enter 20000MB (Precision) or 40000MB (PowerEdge 4300) or80000MB (PowerEdge 4400/4600).
Max Pass: 32000
Click Ok.
8. The new tapes should appear in the Volser column.
9. For each new tape added, refer to “Loading the eDB Historian” (listed in Table 1-3) forinstructions on initializing tapes in the eDB media pool.
10-4 eDB220-70
Emerson Process Management Proprietary Class 2C
10.4 Expiring Jobs on Tape
10.4 EXPIRING JOBS ON TAPE
A tape cannot be reused until all of the jobs cataloged on that tape have expired. Jobs aredesigned to be maintained on tape for twenty-one days. It is recommended that thisprocedure be done at the same time the tape is changed in the tape drive.
Use the following procedure to change a job’s retention period:
1. Choose Start -> Programs -> Backup Express -> Backup Express to start BackupExpress.
2. Click on Administrator Login and enter sysadmin for the username and sysadminfor the password. The Administrator Menu appears.
3. Select Catalog -> Catalog Job Functions.
4. Find a job that does not have a twenty-one day retention period. Select that job.
5. Press the Retention button.
6. Change number to 21.
7. Press Ok.
8. Repeat steps 2 through 4 for each job with a retention not equal to 21 days.
9. Exit the Catalog Job Screen window by pressing Ok.
10. Exit BEX by pressing the door icon in the lower right-hand corner.
10-5eDB220-70
Emerson Process Management Proprietary Class 2C


11-1eDB220-70
Emerson Process Management Proprietary Class 2C
SECTION 11. LICENSING
11.1 SECTION OVERVIEW
Licensing has been integrated into the eDB Historian software. The number of processpoints that can be collected by the eDB Historian is controlled by the license key.
When the system is first loaded, a trial license is installed. The trial license allows up to20,000 points to be collected and expires after 10 days.
You must submit the appropriate Software Licensing Request Form, which is available fromthe Emerson Intranet page, Crossroads.
11.1.1 OBTAINING LICENSE KEYS
To obtain your license keys, obtain the code that is tied to the disk address, (“locking code”),and submit to the Software Licensing Department via [email protected]. You will need to supply the number of points for yoursystem.
You can obtain the code by doing the following:
On the eDB Historian computer, execute the Historian License Manager program(Historian_LM.exe), which is located in $EPH_HOME\bin.(EPH_HOME is normally D:\eDBHistorian or E:\eDBHistorian. The EPH_HOMEenvironment variable is set up during the installation of the eDB Historian software. You candetermine its value by opening the System icon on the Control Panel and finding thesetting in the Environment Tab.)
The code is located in the Code entry field of the Historian License User Interface window.If a trial license is in place or the license is expired, you will be prompted with a dialog box.
The license keys are installed as follows:
1. On the eDB Historian computer, execute the Historian License Manager program(Historian_LM.exe), which is located in $EPH_HOME$\bin. The Historian LicenseManager window will appear (see Figure 11-1).
2. Enter the keycode in the Key Code entry field.
3. Select Add.
4. The license is now enabled.
If the license is not present, is expired, or the number of points configured in the eDBHistorian exceeds the number allowed in the license, the eDB Historian collection process(ehcollect) will not start and a license error message will be logged in the eDB Historianerror log ($EPH_HOME$\bin\HSR_Msg_Log.0).
Figure 11-1. Historian License Manager Window

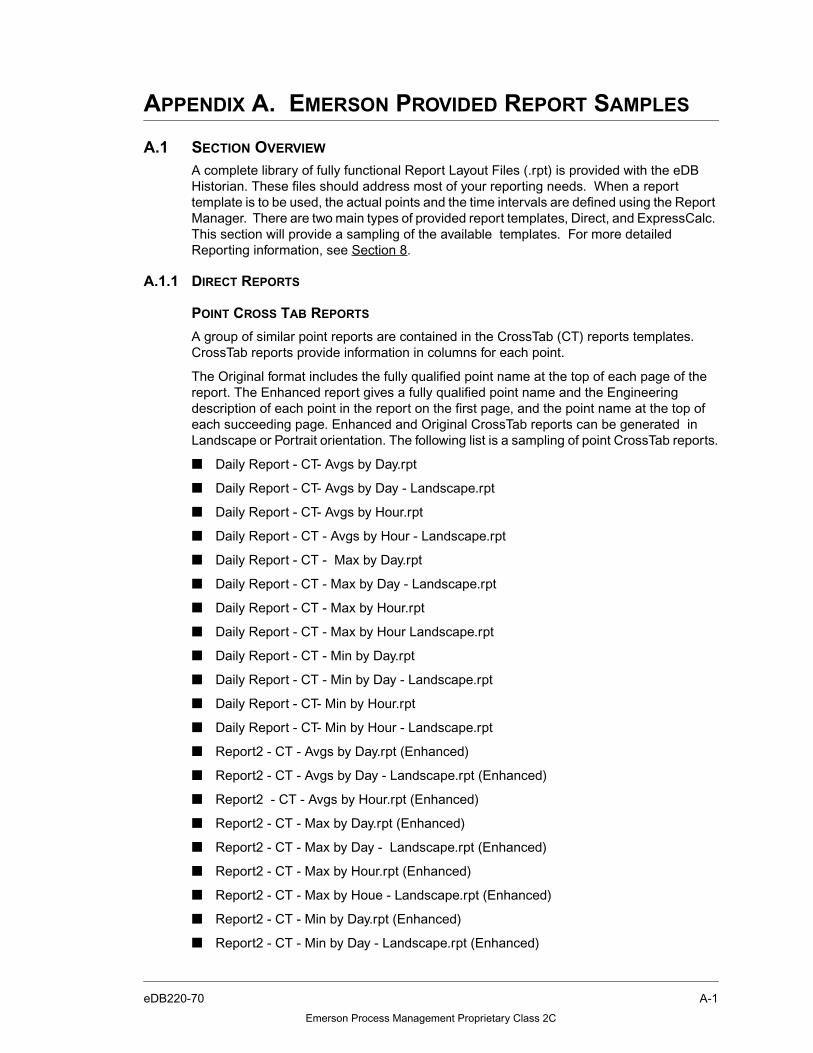
APPENDIX A. EMERSON PROVIDED REPORT SAMPLES
A.1 SECTION OVERVIEW
A complete library of fully functional Report Layout Files (.rpt) is provided with the eDBHistorian. These files should address most of your reporting needs. When a reporttemplate is to be used, the actual points and the time intervals are defined using the ReportManager. There are two main types of provided report templates, Direct, and ExpressCalc.This section will provide a sampling of the available templates. For more detailedReporting information, see Section 8.
A.1.1 DIRECT REPORTS
POINT CROSS TAB REPORTS
A group of similar point reports are contained in the CrossTab (CT) reports templates.CrossTab reports provide information in columns for each point.
The Original format includes the fully qualified point name at the top of each page of thereport. The Enhanced report gives a fully qualified point name and the Engineeringdescription of each point in the report on the first page, and the point name at the top ofeach succeeding page. Enhanced and Original CrossTab reports can be generated inLandscape or Portrait orientation. The following list is a sampling of point CrossTab reports.
■ Daily Report - CT- Avgs by Day.rpt
■ Daily Report - CT- Avgs by Day - Landscape.rpt
■ Daily Report - CT- Avgs by Hour.rpt
■ Daily Report - CT - Avgs by Hour - Landscape.rpt
■ Daily Report - CT - Max by Day.rpt
■ Daily Report - CT - Max by Day - Landscape.rpt
■ Daily Report - CT - Max by Hour.rpt
■ Daily Report - CT - Max by Hour Landscape.rpt
■ Daily Report - CT - Min by Day.rpt
■ Daily Report - CT - Min by Day - Landscape.rpt
■ Daily Report - CT- Min by Hour.rpt
■ Daily Report - CT- Min by Hour - Landscape.rpt
■ Report2 - CT - Avgs by Day.rpt (Enhanced)
■ Report2 - CT - Avgs by Day - Landscape.rpt (Enhanced)
■ Report2 - CT - Avgs by Hour.rpt (Enhanced)
■ Report2 - CT - Max by Day.rpt (Enhanced)
■ Report2 - CT - Max by Day - Landscape.rpt (Enhanced)
■ Report2 - CT - Max by Hour.rpt (Enhanced)
■ Report2 - CT - Max by Houe - Landscape.rpt (Enhanced)
■ Report2 - CT - Min by Day.rpt (Enhanced)
■ Report2 - CT - Min by Day - Landscape.rpt (Enhanced)
A-1eDB220-70
Emerson Process Management Proprietary Class 2C

■ Report2 - CT - Min by Hour.rpt (Enhanced)
■ Report2 - CT - Min by Hour - Landscape.rpt (Enhanced)
Other point reports templates are available. They are as follows:
■ Daily Report - by Hour.rpt
■ Daily Report - by Hour - Attributes.rpt
■ Raw Value Report - CT.rpt
■ Raw Value Report.rpt
■ RawDaily Report - by Hour.rpt
MESSAGE REPORTS
Message Reports report Alarm, SOE, and Text messages from the system. Data can befiltered to provide more a targeted (brief) report. Templates include:
■ Alarm Messages.rpt
■ Alarm Message-Brief.rpt
■ Alarm Messages-Brief-Landscape.rpt
■ Alarm Messages-Landscape.rpt
■ SOE Messages.rpt
■ SOE Messages-Brief.rpt
■ SOE Messages-Brief-Landscape.rpt
■ SOE Messages-Landscape.rpt
■ Text Messages.rpt
■ Text Messages-Brief.rpt
■ Text Messages-Brief-Landscape.rpt
■ Text Messages.rpt
A.1.2 EXPRESSCALC REPORTS
Direct reports have a prespecified layout and content (except for the points to be reported),the ExpressCalc reports provide more flexibility. The sample interval time and total time canbe specified. For each point in the report, the type of processing to be applied can bespecific, such as:
■ No processing
■ Maximum
■ Minimun
■ Average
■ Time of Maximum
■ Time of Minimum
■ Integral (integration constant specific)
■ Toggle
■ Toggle set
A-2 eDB220-70
Emerson Process Management Proprietary Class 2C

■ Toggle reset
■ Time set
■ Time reset
■ Bit value
Several ExpressCalc report templates are provided. The templates have been designed tobe easily edited by the user. You may rearrange the report into customized reports.
■ ExpressCalc 12 point Landscape - reports used specific attributes of up to 12 points inLandscape format.
■ ExpressCalc 8 point - reports used specific attributes of up to 8 points in Portrait format.
The following figures show a sampling of generated reports using the provided templates.
Figure A-1. ExpressCalc 8 point
A-3eDB220-70
Emerson Process Management Proprietary Class 2C

Figure A-2. Alarm Messages-Brief
A-4 eDB220-70
Emerson Process Management Proprietary Class 2C
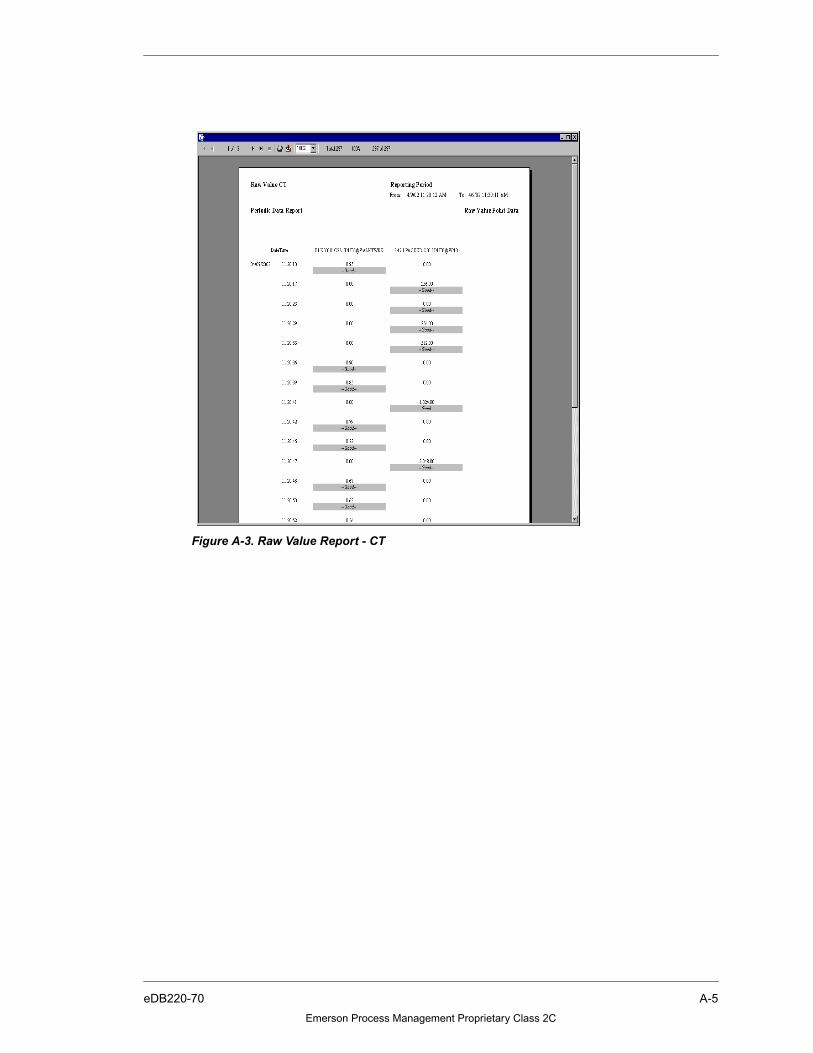
Figure A-3. Raw Value Report - CT
A-5eDB220-70
Emerson Process Management Proprietary Class 2C
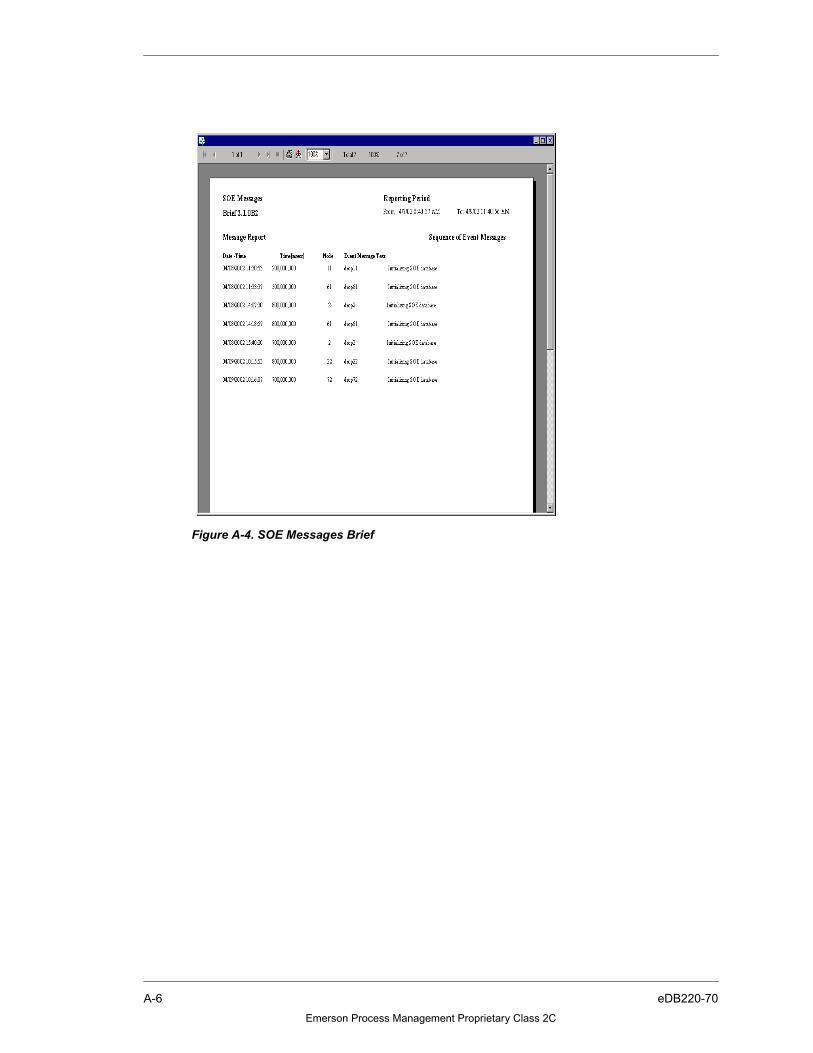
Figure A-4. SOE Messages Brief
A-6 eDB220-70
Emerson Process Management Proprietary Class 2C
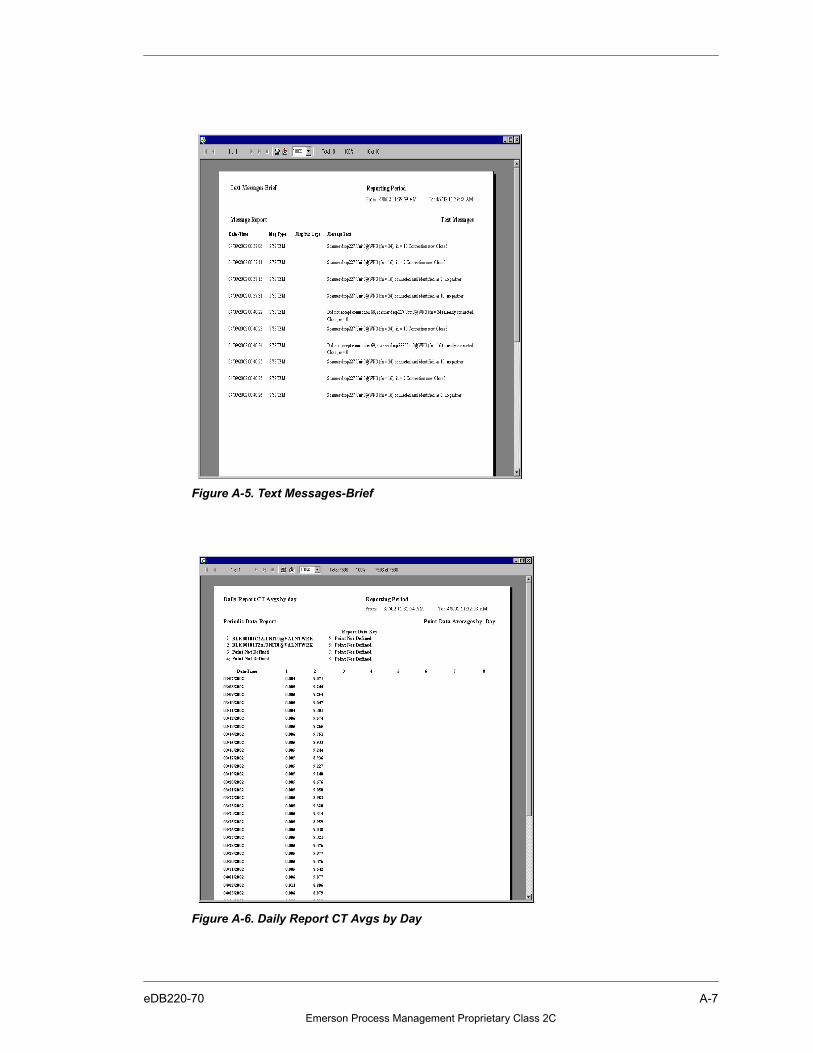
Figure A-5. Text Messages-Brief
Figure A-6. Daily Report CT Avgs by Day
A-7eDB220-70
Emerson Process Management Proprietary Class 2C

Figure A-7. Daily Report CT - Avgs by Hour
A-8 eDB220-70
Emerson Process Management Proprietary Class 2C

Figure A-8. Daily Reprt - CT- Min by Day (Enhanced)
A-9eDB220-70
Emerson Process Management Proprietary Class 2C

Figure A-9. Daily Report - CT - Max by Hour (Enhanced)
A-10 eDB220-70
Emerson Process Management Proprietary Class 2C

B-1eDB220-70
Emerson Process Management Proprietary Class 2C
APPENDIX B. ORACLE CLIENT SOFTWARE INSTALLATION
B.1 INSTALLING ORACLE CLIENT SOFTWARE
The Oracle Client Software may need to be installed on machines other than the eDBHistorian as required.
The Oracle Client software is required if the eDB Report Manager is being installed on amachine that does not have Oracle Server or Client software installed since all DirectReport Layouts will need to connect directly to the eDB Historian Database in order togenerate the reports.
Note:
ExpressCalc Report Layouts do not require the Oracle Client.
The Oracle Client software will also be needed if the user requires ODBC access to theeDB Historian, for example, to use Microsoft Query to generate an SQL Query to retrievedata from the eDB Historian Database.
Note:
The eDB Historian Excel Plug In distributed with the eDB Desktop Suiteuses JDBC and can operate without having Oracle Client Software.
The installation of the Oracle Client software has been scripted to simplify the installationprocedure. The required scripts are provided with the eDB Historian during installation.
B.1.1 INSTALLATION INSTRUCTIONS
Perform the following steps to install the Oracle Client software.
1. Copy the Oracle client install scripts subdirectory from the eDB Historian machine tothe machine where the client software is to be installed. The directory is\eDBHistorian\setup\client.
2. Insert the Oracle 8.1.6 CD provided with the eDB in the CD drive of the machine.
3. Open a DOS command prompt and CD to the location where you put the clientsubdirectory.
4. Execute the Ora_Client.bat file to perform the client install and build the basictnsnames.ora file
5. Edit the tnsnames.ora file to correctly reflect the host name and service name of theeDB Historian machine.
When these steps are completed the Reports package may be installed or an ODBC Datasource may be created using Start -> Control Panel -> Data Sources.

Index
Symbols.rpt 7-7, A-1
AAbsolute Time 1-4, 4-4Admin and Non-admin users 7-12Admin user 7-19Aggregate Values 3-3aggregates 9-3Alarm Review UI
accessing 6-8, 6-16properties 6-17review all points 6-18review specific alarm types 6-19, 6-24, 6-25, 6-
27alias table 9-13Analog Point 2-1Aperiodic 2-3Ascii Review 6-32
all drops 6-33single drop 6-33
attribute collection 9-4audit log 9-14
BBackup 7-61
automatic 7-61Backups 10-2batch groups 9-15batch run 9-15bit number 5-11
Ccollection enabled 2-5Common Review 6-34
Alarm tab 6-37Ascii tab 6-38Common tab 6-35Operator Event tab 6-37Point tab 6-36SOE tab 6-38
config tab 3-17Configuration
general tab 7-13Configure Events Tree 7-55, 7-57Configuring
Alarm Event 3-9Hardware 3-17Op Event 3-6SOE 3-14
ControllerNormal and Expanded 3-15
Controller Parameters TabSave Variables @ Interval (min.) Field 3-16Send Messages To Field 3-16SOE Logger 1 Field 3-16SOE Logger 2 Field 3-16System Memory Field 3-15TimeKeeper Field 3-16
Crystal Reports 7-1current value table 9-5
DData
Backup 7-61Database
checking the system for errors 10-2Database Maintenance 10-1DB_ALG
FLOW 2-15LOG 2-15PCT_RANGE 2-15POWER 2-15RADIATION 2-16RATIO 2-16STANDARD 2-16
DCS 3-1DCS Scanner 9-1DEADBAND Algorithm 2-14DEADBAND Rules 2-15DEADBAND value 2-5Deluxe Analog Point 2-1Deluxe Digital Point 2-1Deluxe Packed Point 2-1Destination Info 7-35Digital Channels 3-19Digital Point 2-1Drop Point 2-1
EeDB
First Pass 3-11eDB Report Application Window 7-21Errors 10-2Event Logger 3-8Event Review UI
filter by point characteristics 6-13filter by specific points 6-9printing 6-39review type definitions 6-11
Expanded Controller 3-15Exporting eDB Report Manager Database 7-63ExpressCalc A-1ExpressCalc Reports 7-5, 7-8
FFast 2-3Filtering
Normal/Priority 3-13Unit 3-14
Frequency 2-3
GGenerator 7-12Grid 5-7
HHistorical
Data Tables 9-1Interval (units) 5-8Interval (value) 5-8Period 5-8Start Time 5-9Start Time Offset (units) 5-7Start Time Offset (value) 5-8, 5-9
6/03 Index-1 eDB220-70Emerson Process Management Proprietary Class 2C

Index
Trends 5-1Type 5-8
Historical Alarm Review 6-16all points 6-18single point 6-19specific alarm types 6-20specific point types 6-21
Historical Point Review 6-8Historical Review
configuring Ovation system 6-2Filter by Specific Points 6-9Filtering by Point Characteristics 6-13Filtering by Point Groups 6-15Menu Bar 6-2Preferences 6-6Print Preview 6-39Printing 6-39Results 6-6Results Display 6-6Review Type 6-11Saving 6-39Status Bar 6-6Toolbar 6-5
Historical Review Window 6-2Historical SOE Review 6-28History Table 9-1
IIcons or Shortcuts 7-24, 7-26, 7-30Importing
NT System 2-17OPC System 2-19Solaris System 2-18WDPF System 2-19
Importing eDB Report Manager Database 7-63Integration Value 5-14IO 3-18
KKey Elements 1-4
LLA, LD, LP 9-1Lab History 8-1
data files 8-2data retrieval 8-4
Licensing 11-1link messages 9-6
MMain Menu 7-21Message Collection 9-6Module Point 2-1Module Tab 3-19MsgReports 7-8
NNode Point 2-1Normal History Priority 3-12Normal List Priority 3-12Normal Unacknowledged Destination 3-13Normal/Priority Mode Destinations 3-13
OODBC Connection 7-12OPC 3-5Operator Event Historical Review 6-23Operator Event Review
all message subtypes 6-24single point 6-27specific event messge subtypes 6-26specific groups of messages 6-25
Options menu 7-52Oracle Client B-1
install B-1
PPacked Point 2-1pic_file_gen utility 2-21Point
creating 2-1types 2-1
Point Builderaccessing 5-5
Point Configuration 9-13Point Group Review UI
filter by point characteristics 6-13filter by specific points 6-9printing 6-39review type definitions 6-11
Point Groups 9-14Point Review UI
accessing 6-8filter by point characteristics 6-13filter by specific points 6-9printing 6-39review type definitions 6-11
Print Setup 7-35Processing Type 5-13PtReports 7-8Pull-down menus 7-18
File 7-18Help 7-20View 7-19
RRange 5-8rank 5-11Relative Time 1-4, 4-4report alias 7-40, 7-45report dates
end date 7-49start date 7-49
report definitions 7-30Report Execution States
Pending 7-22Report Generation Queue 7-23Report Layout File (.rpt) 7-7Report Manager Configuration Database 7-3Report Properties
defining 7-33direct 7-39Indirect or ExpressCalc 7-45point 7-34
Report Samples A-1Report Templates A-1
eDB220-70 Index-2 6/03Emerson Process Management Proprietary Class 2C

Index
Reporting 7-1Reports
crosstab A-1expresscalc A-2message A-2
SSaving Trends 5-4scale limits 5-11Scales
high 5-11low 5-12
scan frequency 2-5Scanners 3-1Scanning
Alarm 3-1Operator Event 3-1Point Attribute 3-1Point Value 3-1SOE 3-1
Scheduler 7-12Send Alarm Message to eDB 3-11Shift Time Intervals 7-16Slow 2-3SOE 7-16SOE enabled 2-9SOE Review
all messages 6-29single drop based messages 6-31single point based messages 6-30
Stand Alone Trends 5-4Status Log File 7-64Syncsort Backup Express (BEX) 10-2System Tray 7-63
TTape Backup 10-2Tape Pool 10-2, 10-3Tapes
adding 10-3expiring jobs on tape 10-5
TermsAlias 1-4BIOS 1-4Browser 1-4configuration 1-6data collection 1-5data flow 1-5data retrieval 1-5data type 1-5DBMS 1-4DCS 1-4FAT 1-4message data 1-5NSECS 1-4NTFS 1-4numerical point data 1-5ODBC 1-4OLAP 1-4OLE 1-4OPC 1-4OS 1-4RAID 1-4
RDBMS 1-4SCSI 1-4SOE 1-4SQL 1-4TCP/IP 1-4
Timeformat 7-36period 7-36
Time Zonedefault 7-15
Transient 5-12Trend Duration 5-8Trend Point Groups 5-10Trends
accessing window 5-2Saving 5-4Stand Alone 5-4trend display window 5-2
trial license 11-1Trigger Conditions 9-17Trigger Configuration 9-17
UUser Function Library (UFL) 7-3
Vview last error 7-62
crystal reports 7-62
WWDPF 3-4WhereClause 7-36, 7-41Wildcards 4-1Windows
Trend Display 5-2
6/03 Index-3 eDB220-70Emerson Process Management Proprietary Class 2C