ed5 im - solutions manual
TRANSCRIPT

Solutions
End-of-Chapter
Questions and Problems
to accompany
Multinational Finance
by Kirt C. Butler
Fifth Edition (2012) John Wiley & Sons

Kirt C. Butler, Solutions for Multinational Finance, 5th edition (2012), John Wiley & Sons, Inc.
1
PART I Overview and Background
Chapter 1 An Introduction to Multinational Finance
Answers to Conceptual Questions
1.1 List the MNC’s key stakeholders. How does each have a stake in the MNC?
Stakeholders narrowly defined include shareholders, debtholders, and management. More broadly defined, stakeholders also would include employees, suppliers, customers, host governments, and residents of host countries.
1.2 In what ways do cultural differences impact the conduct of international business?
Because they define the rules of the game, national business and popular cultures impact each of the functional disciplines of business from research and development right through to marketing, production, and distribution.
1.3 What is country risk? Describe several types of country risk one might face when conducting business in another country.
Country risks refer to the political and financial risks of conducting business in a particular foreign country. Country risks include foreign exchange risk, political risk, and cultural risk.
1.4 What is political risk?
Political risk is the risk that a sovereign host government will unexpectedly change the rules of the game under which businesses operate.
1.5 What is foreign exchange risk?
Foreign exchange risk is the risk of unexpected changes in foreign currency exchange rates.
1.6 What investment opportunities might MNCs enjoy that are not available to local firms?
Operating cash flows can be increased by increasing revenues or decreasing operating expenses. The text mentions revenue enhancing opportunities such as global branding, advantages of size and scope, and flexibility in marketing and distribution; operating cost reductions through access to low-cost labor or raw materials, flexibility in sourcing or production, and economies of scale or vertical integration; and business strategies such as follow the customer, lead the customer, follow the leader, and building capacity directly in a foreign market (going local).
1.7 How can MNCs can reduce operating expenses relative to domestic firms.
MNCs can enjoy several advantages over domestic firms including global brands, size, and flexibility in marketing and distribution. Strategies for enhancing revenues include follow the customer, lead the customer, follow the leader, and establishing local production. Operating costs can be reduced through access to low-cost raw materials and labor, flexibility in sourcing, production, or site selection, and economies of scale or vertical integration.
1.8 What are the perfect financial market assumptions? What is their implication for multinational financial management.
In a perfect market, rational investors have equal access to prices and information in a frictionless market. If financial policy is to increase firm value, it must increase expected cash flows or decrease the discount rate in a way that cannot be replicated by investors. MNCs are in a better position than domestic firms to take advantage of financial market imperfections through financial market arbitrage, hedging policy, access to international sources of capital, and multinational tax strategy.
1.9 Describe the ways in which multinational financial management is different from domestic financial management.
Multinational financial management is conducted in an environment that is influenced by more than one cultural, social, political, or economic environment.

Kirt C. Butler, Solutions for Multinational Finance, 5th edition (2012), John Wiley & Sons, Inc.
2
Chapter 2 World Trade and the International Monetary System
Answers to Conceptual Questions
2.1 List one or more trade pacts in which your country is involved. Do these trade pacts affect all residents of your country in the same way? On balance, are these trade pacts good or bad for residents of your country?
Figure 2.1 lists the major international trade pacts. The World Trade Organization (WTO) is a supranational organization that oversees the General Agreement on Tariffs and Trade (GATT). Important regional trade pacts include the North American Free Trade Agreement (NAFTA includes the U.S., Canada, and Mexico), the European Union (EU), and the Asia-Pacific Economic Cooperation pact (APEC encompasses most countries around the Pacific Rim including Japan, China, and the United States). Trade pacts are designed to promote trade, but industries that have been protected by local governments can find that they are uncompetitive when forced to compete in global markets.
2.2 Do countries tend to export more or less of their gross national product today than in years past? What are the reasons for this trend?
Most countries export more of their gross national product today than in years past. Reasons include: a) the global trend toward free market economies, b) the rapid industrialization of some developing countries, c) the breakup of the former Soviet Union and the entry of China into international trade, d) the rise of regional trade pacts and the General Agreement on Tariffs and Trade, and e) advances in communication and in transportation.
2.3 How has globalization in the world’s goods markets affected world trade? How has globalization in the world’s financial markets affected world trade?
Some of the economic consequences of globalization in the world’s goods markets include: a) an increase in cross-border investment in real assets (land, natural resource projects, and manufacturing facilities), b) an increasing interdependence between national economies leading to global business cycles that are shared by all nations, and c) changing political risk for multinational corporations as nations redefine their borders as well as their national identities. The demise of capital flow barriers in international financial markets has had several consequences including: a) an increase in cross-border financing as multinational corporations raise capital in whichever market and in whatever currency offers the most attractive rates, b) an increasing number of cross-border partnerships including many international mergers, acquisitions, and joint ventures, and c) increasingly interdependent national financial markets.
2.4 What distinguishes developed, less developed, and newly industrializing economies?
Developed economies have a well-developed manufacturing base. Less developed countries (LDCs) lack this industrial base. Countries that have seen recent growth in their industrial base are called newly industrializing countries (NICs).
2.5 Describe the International Monetary Fund’s balance-of-payments accounting system.
The IMF publishes a monthly summary of cross-border transactions that tracks each country’s cross-border flow of goods, services, and capital.
2.6 How would an economist categorize exchange rate systems? How would the IMF make this classification? In what ways are these the same? How are they different?
Economists have traditionally classified exchange rate systems as either fixed rate or floating rate systems. The IMF has adapted this system to the plethora of systems in practice today. The IMF’s classification scheme includes “more flexible,” “limited flexibility,” and “pegged” exchange rate systems.

Kirt C. Butler, Solutions for Multinational Finance, 5th edition (2012), John Wiley & Sons, Inc.
3
2.7 Describe the Bretton Woods agreement. How long did the agreement last? What forced its collapse?
After World War II, representatives of the Allied nations convened at Bretton Woods, New Hampshire to stabilize financial markets and promote world trade. Under Bretton Woods’ “gold exchange standard,” currencies were pegged to the price of gold (or to the U.S. dollar). Bretton Woods also created the International Monetary Fund and the International Bank for Reconstruction and Development (the World Bank). The Bretton Woods fixed exchange rate system lasted until 1970, when high U.S. inflation relative to gold prices and to other currencies forced the dollar off the gold exchange standard.
2.8 What factors contributed to the Mexican peso crisis of 1995 and to the Asian crises of 1997?
In each instance, the government tried to maintain the value of the local currency at artificially high levels. This depleted foreign currency reserves. Local businesses and governments were also borrowing in non-local currencies (primarily the dollar), which heavily exposed them to a drop in the value of the local currency.
2.9 What is moral hazard and how does it relate to IMF rescue packages?
Moral hazard occurs when the existence of a contract changes the behaviors of parties to the contract. When the IMF assists countries in defending their currencies, it changes the expectations and hence the behaviors of lenders, borrowers, and governments. For example, lenders might underestimate the risks of lending to struggling economies if there is an expectation that the IMF will intervene during difficult times.
2.10 What were the causes and consequences of the global financial crisis of 2008?
Securitization of U.S. home loans combined with lax U.S. credit standards to create a subprime crisis in the market for collateralized debt obligations (CDOs). This subprime crisis impaired liquidity in the CDO market and eventually spilled over to other markets including real estate, stocks, bonds, other credit markets. Many governments had budget deficits from the drop in tax revenues and the increase in expenses from fiscal stimulus programs. Some governments (e.g., Greece and Iceland) saw their bond prices fall because of the increased perception of default risk.
Problem Solutions
2.1 This open-ended question is intended to engage the student and bring their knowledge up-to-date. Useful websites are listed on the inside-front cover of the text, and include:
Bank for International Settlements www.bis.org International Monetary Fund (IMF) www.imf.org World Trade Organization (WTO) www.wto.org International Labor Organization www.ilo.org International Chamber of Commerce www.iccwbo.org Michigan State University Global Edge globaledge.msu.edu United Nations www.un.org United Nations’ Commission on International Trade Law www.uncitral.org World Bank www.worldbank.org World Bank’s Multilateral Investment Guarantee Agency www.miga.org World Economic Forum www.weforum.org
Kirt C. Butler, Solutions for Multinational Finance, 5th edition (2012), John Wiley & Sons, Inc.
4
Chapter 3 Foreign Exchange and Eurocurrency Markets
Answers to Conceptual Questions
3.1 Define liquidity.
Liquidity: the ease with which you can exchange an asset for another asset of equal value.
3.2 What is the difference between a money market and a capital market?
Money markets are markets for financial assets and liabilities of short maturity, usually considered to be less than one year. Capital markets are markets for financial assets and liabilities with maturities greater than one year.
3.3 What is the difference between an internal and an external market?
Debt placed in an internal market is denominated in the currency of a host country and placed within that country. Debt placed in an external market is placed outside the borders of the country issuing the currency.
3.4 What is the Eurocurrency market and what is its function?
The Eurocurrency market is an external credit market in bank deposits and loans. Like a national credit market, the Eurocurrency market permits the transfer of value over time in a given currency.
3.5 In what way is the Eurocurrency market different from an internal credit market?
There are typically no reserve requirements, interest rate regulations or caps, withholding taxes, deposit insurance requirements, or regulations influencing credit allocation decisions. There are also less stringent disclosure requirements.
3.6 What is the London Interbank Offer Rate (LIBOR)?
LIBOR is the rate at which a Euromarket bank offers to make a loan to another Euromarket bank.
3.7 What are the Basel Accords? What effects have they had on international banks?
The first Basel Accord – now called Basel I – set out to establish regulations governing the capital adequacy of financial institutions such as commercial banks. Basel I required that banks set aside equity capital as a protection against the credit risk of the banks’ loan portfolios. Basel II further refined this framework by assessing credit risk based on internal or external ratings. This increased capital requirements, and unfortunately contributed to the 2008 global financial crisis and reducing bank lending just at the time that credit was most needed. Basel III responded to the problems of the 2008 crisis by further refining the Basel Accords’ review of bank capital adequacy, leverage, and liquidity, with a focus on creating policies that are countercyclical to economic fluctuations.
3.8 What is the difference between spot and forward markets for foreign exchange?
In the spot market, trades are for immediate delivery. In the forward market, trades are for future delivery according to an agreed-upon delivery date, exchange rate, and amount.
3.9 What is Rule #1 when dealing with foreign exchange? Why is it important?
Rule #1 says to “Keep track of your currency units.” It is important because foreign exchange prices have a currency in both the numerator and the denominator. Most prices (for instance, a $15,000/car price on a new car) have a non-currency asset in the denominator and a currency in the numerator.
3.10 What is Rule #2 when dealing with foreign exchange? Why is it important?
Rule #2 says to “Always think of buying or selling the currency in the denominator of a foreign exchange quote.” The importance of this rule is related to that of Rule #1. Foreign exchange quotes have a currency in both the numerator and the denominator. The rule “buy low and sell high” only works for the currency in the denominator.

Kirt C. Butler, Solutions for Multinational Finance, 5th edition (2012), John Wiley & Sons, Inc.
5
3.11 What are the functions of the foreign exchange market?
Currency markets transfer purchasing power from one currency to another, either today (in the spot market) or at a future date (in the forward market). When used with Eurocurrency markets, foreign exchange markets allow investors to move value both across currencies and over time. Foreign exchange markets also facilitate hedging and speculation.
3.12 Define operational, informational, and allocational efficiency.
Operational efficiency refers to how large an influence transactions costs and other market frictions have on a market’s operation. Informational efficiency refers to whether or not prices reflect value. Allocational efficiency refers to how efficiently a market channels capital toward its most productive uses.
3.13 What is a forward premium? What is a forward discount?
A currency is trading at a forward premium when the nominal value of that currency in the forward market is higher than in the spot market. A currency is trading at a forward discount when the nominal value of that currency in the forward market is lower than in the spot market.
3.14 Describe the empirical behavior of exchange rates.
Over daily intervals, spot rate changes are random with a nearly equal probability of rising or falling. As the forecast horizon is lengthened, the correlation between interest and inflation differentials and nominal spot rate changes rises. Eventually, the international parity conditions exert themselves and the forward rate begins to dominate the current spot rate as a predictor of future nominal exchange rates. Finally, exchange rate volatility is not constant. Instead, volatility comes in waves.
Problem Solutions
3.1 a. The bid is less than the offer, so Citicorp is quoting the currency in the denominator. Citicorp is buying dollars at the DKK5.62/$ bid rate and selling dollars at the DKK5.87/$ offer rate.
b. In American terms, the bid price is $0.1704/DKK and the ask price is $0.1779/DKK. Citicorp is buying and selling the kroner at these quotes.
c. In direct terms, the bid quote for the dollar is $0.1779/DKK and the ask price is $0.1704/DKK. Citicorp is buying dollars at $0.1779/DKK (which is equivalent to DKK5.62/$) and selling dollars at $0.1704/DKK (or DKK5.87/$).
d. The bank will receive the bid-ask spread on each dollar. When buying one million dollars at DKK5.62/$ and selling one million dollars at DKK5.87/$, the bank’s profit on the bid-ask spread will be (DKK5.87/$–DKK5.62/$)($1,000,000) = DKK250,000.
3.2 The ask price is higher than the bid, so these are rates at which the bank is willing to buy or sell dollars (in the denominator). You’re selling dollars, so you’ll get the bank’s dollar bid price. You need to pay SKr10,000,000/(SKr7.5050/$) ≈ $1,332,445.
3.3 The U.S. dollar (in the denominator) is selling at a forward premium, so the Canadian dollar must be selling at a forward discount. Annualized forward premia on the U.S. dollar are:
Bid ($) Ask ($) Six months forward +0.681% +0.761%
Percent per annum on the Canadian dollar from the U.S. perspective are as follows:
Bid (C$) Ask (C$) Six months forward –0.678% –0.758%
The premiums/discounts on the two currencies are opposite in sign and nearly equal in magnitude. Forward premiums and discounts are of slightly different magnitude because the bases (U$ vs. C$) on which they are calculated are different. Forward premiums/discounts are as stated above regardless of where a trader resides.
Kirt C. Butler, Solutions for Multinational Finance, 5th edition (2012), John Wiley & Sons, Inc.
6
3.4 a. The forward premium is equal to (F1$/¥ – S0
$/¥) = ($0.008772945/¥ – $0.009057355/¥) = –$0.000284410/¥, or –2.8441 basis points. As a percentage over the 90-day period, this is
(F1$/¥ – S0
$/¥) / S0$/¥ = –0.031401, or –3.1401 percent.
b. As an annualized forward premium following the U.S. convention, this is equal to (n)(F1
$/¥–S0$/¥)/S0
$/¥ = (4)(–0.031401) = –0.125604, or –12.5604 percent. c. As an APR, the premium is (F1
$/¥/S0$/¥)4–1 = –0.119811, or –11.9811 percent.
3.5 1984 DM1.80/$ or $0.56/DM 1987 DM2.00/$ or $0.50/DM 1992 DM1.50/$ or $0.67/DM 1997 DM1.80/$ or $0.56/DM a. 1984-87 The dollar appreciated 11.1%; ((DM2.0/$)–(DM1.8/$)/(DM1.8/$) = +0.111 1987-92 The dollar depreciated 25%; ((DM1.5/$)–(DM2.0/$)/(DM2.0/$) = –0.25 1992-97 The dollar appreciated 20%; ((DM1.8/$)–(DM1.5/$)/(DM1.5/$) = +0.20 b. 1984-87 The mark depreciated 10.7%; ($0.50/DM)/($0.56/DM)–1= –0.107
1987-92 The mark appreciated 34.0%; ($0.67/DM)/($0.50/DM)–1= +0.340 1992-97 The mark depreciated 16.4%; ($0.56/DM)/($0.67/DM)–1 = –0.164
3.6 a. (PZ5,000,000) / (PZ4.0200/$) = $1,243,781. Warsaw’s bid price for PZ is its ask price for dollars. So, PZ4.0200/$ is equivalent to $0.2488/PZ.
b. (PZ20,000,000) / (PZ3.9690/$) = $5,039,053 PZ3.9690/$ is equivalent to $0.2520/PZ Payment is made on the second business day after the 3-month expiration date.
3.7 You initially receive P0$ = P0
¥/S0¥/$ = (¥104,000,000)/(¥104/$) = $1 million. When you buy back
the yen, you pay P1$ = P1
¥/S1¥/$ = (¥104,000,000)/(¥100/$) = $1.04 million. Your loss is $40,000.
3.8 When buying one currency, you are simultaneously selling another, so a yen bid price is a euro ask price. Yen quotes yield S¥/€ = 1/S€/¥ = 1/(€0.007634/¥) = ¥130.99/€ and S¥/€ = 1/(€0.007643/¥) = ¥130.84/€, so euro quotes (in the denominator) are ¥130.84/€ BID and ¥130.99/€ ASK.
3.9 a. (1+s¥/$) = 0.90 = 1/(1+s$/¥) s$/¥ = (1/0.90)–1 = +0.111, or an 11.1% appreciation. b. (1+sRbl/$) = 11 = 1/(1+s$/Rbl) s$/Rbl = (1/11)–1 = –0.909, or a 90.9% depreciation.
3.10 The 90-day dollar forward price is 33 bps below the spot price: F1SFr/$–S0
SFr/$ = (SFr0.7432/$–SFr0.7465/$) = –SFr0.0033/$. The percentage dollar forward premium is (F1
SFr/$–S0SFr/$)/S0
SFr/$ = (SFr0.7432/$–SFr0.7465/$)/(SFr0.7465/$) = –0.442% per 90 days, or (–0.442%)×4 = –1.768% on an annualized basis.
3.11 Banks make a profit on the bid-ask spread. A bank quoting $0.5841/SFr BID and $0.5852/SFr ASK is buying francs (in the denominator) at $0.5841/SFr and selling francs at $0.5852/SFr ASK. A bank quoting $0.5852/SFr BID and $0.5841/SFr ASK is buying dollars (in the numerator) at $0.5852/SFr BID and selling dollars at $0.5841/SFr ASK. Hence, these are equivalent.
3.12 DKK is at a forward discount 30 day: ($0.18519/DKK–$0.18536/DKK)/$0.18536/DKK = –0.092% 90 day: ($0.18500/DKK–$0.18536/DKK)/$0.18536/DKK = –0.194% 180 day: ($0.18488/DKK–$0.18536/DKK)/$0.18536/DKK = –0.259%
3.13 a. S1$/¥ = S0
$/¥ (1+ s$/¥) = ($0.0100/¥)(1.2586) = ($0.012586/¥) b. (1+ s¥/$) = S1
¥/$/S0¥/$ = (1/S1
$/¥) / (1/S0$/¥) = 1 / (S1
$/¥/S0$/¥) = 1 / (1+ s$/¥)
= 1 / (1.2586) = 0.7945, so s$/¥ = 0.7945 – 1 = –.2055, or = –20.55%
3.14 (Ftd/f–S0
d/f)/S0d/f = [(1/Ft
f/d)–(1/S0f/d)]/(1/S0
f/d) = [(S0f/d/Ft
f/d)–(S0f/d/S0
f/d)]/(S0f/d/S0
f/d) = [(S0
f/d /Ftf/d) – 1] = (S0
f/d – Ftf/d) / Ft
f/d.
3.15 σt2 = (0.0034) + (0.40)(0.05)2 + (0.20)(0.10)2 = 0.0064 σt = 0.08, or 8%.
Kirt C. Butler, Solutions for Multinational Finance, 5th edition (2012), John Wiley & Sons, Inc.
7
Chapter 4 The International Parity Conditions
Answers to Conceptual Questions
4.1 What is the law of one price?
The law of one price states identical assets must have the same price wherever they are bought or sold. The law of one price is enforced by arbitrage activity between identical assets. In a perfect market without transaction costs, the law of one price must hold for there to be no arbitrage opportunities.
4.2 What is an arbitrage profit?
Arbitrage profit is a profit obtained through the simultaneous purchase and sale of the same or equivalent securities such that there is no net investment or risk. Arbitrage will drive the prices of identical assets into equilibrium and enforce the law of one price.
4.3 What is the difference between locational, triangular, and covered interest arbitrage?
Locational arbitrage is conducted between two physical locations, such as between currency prices at two different banks (such that ASf/d BSd/f 1 for banks A and B and currencies d and f). Triangular arbitrage is conducted across three different cross exchange rates (such that Sd/e Se/f Sf/d 1 for currencies d, e, and f). Covered interest arbitrage takes advantage of a disequilibrium in the interest rate parity condition [(Ft
d/ f) / (S0d/ f)] (1+id) / (1+i f)]t between currency and Eurocurrency markets.
4.4 Is interest rate parity a reliable relation in the interbank markets?
Interest rate parity is a reliable relation in the interbank markets. Each of the prices in the IRP relation (Ft
d/f/S0d/ f) = [(1+id)/(1+i f)]t is a traded contract in the interbank markets, and so covered interest
arbitrage is able to enforce the no-arbitrage condition within the bounds of transaction costs (which are small in the interbank market).
4.5 What is relative purchasing power parity?
Relative purchasing power parity is a form of the law of one price in which the expected change in the spot exchange rate is influenced by the difference in expected inflation according to E[St
d/f]/S0d/f =
[(1+E[pd])/(1+E[pf])]t.
4.6 Are forward exchange rates good predictors of future spot rates?
Forward rates are poor predictors of future spot rates over short-term forecast horizons, because exchange rate volatility masks the signal from the international parity condition. Over longer forecast horizons, the signal-to-noise ratio improves and the forecast performance of forward rates (as well as inflation differentials from RPPP) improves.
4.7 What does the international Fisher relation say about interest rate and inflation differentials?
If real interest rates are constant across currencies, nominal interest rates should reflect inflation differentials according to [(1+id) / (1+if)]t = [(1+E[pd]) / (1+E[pf])]t.
4.8 What are real changes in exchange rates?
Real exchange rate changes reflect changes in currencies’ relative purchasing power.
4.9 Are real exchange rates in equilibrium at all times?
Real exchange rates show large and persistent deviations from purchasing power parity. These deviations can last for several years.
4.10 What is the effect of a real appreciation of the domestic currency on the purchasing power of domestic residents?
A real appreciation of the domestic currency increases the wealth and purchasing power of domestic residents relative to foreign residents. It can also hurt the economy by raising the price of domestic goods relative to foreign goods.
Kirt C. Butler, Solutions for Multinational Finance, 5th edition (2012), John Wiley & Sons, Inc.
8
4.11 Will an appreciation of the domestic currency help or hurt a domestic exporter?
A nominal appreciation in the domestic currency is likely to have little effect on domestic importers and exporters. A real appreciation of the domestic currency can hurt domestic exporters by raising the price of domestic goods relative to foreign goods. Domestic importers will see their purchasing power increase relative to foreign competitors, and so are likely to be helped by a real appreciation of the domestic currency.
4.12 Describe the behavior of real exchange rates.
Although real exchange rates revert to their long run average, in the short run there can be substantial deviations from purchasing power parity and the long run average.
4.13 What methods can be used to forecast future spot rates of exchange?
Market-based forecasts are obtained from forward exchange rates or from interest rate parity when forward prices are unavailable. Model-based forecasts can be generated from technical analysis (analyzing patterns in exchange rates) or from fundamental analysis (from a larger set of economic relationships).
4.14 How can the international parity conditions allow you to forecast next year’s spot rate?
In theory, any of the international parity conditions could be used: E[Std/f]/S0
d/f = Ftd/f/S0
d/f = [(1+id)/(1+if)]t = [(1+E[pd])/(1+E[pf])]t. In practice, forward rates are usually used to predict spot rates. At the least, forwards have the advantage of reflecting the opportunity costs of capital through the interest rate parity relation, Ft
d/f/S0d/f = [(1+id)/(1+if)]t.
Problem Solutions
4.1 a. S¥SFr = S¥/$S$/SFr = (¥200/$)($0.50/SFr) = ¥100/SFr b. S¥SFr = S¥/$/SSFr/$ =(¥100/$)/(SFr1.60/$) = ¥62.5/SFr
4.2 SSFr/$ S$/¥ S¥/SFr = 1.0326 > 1. Spot rates are “too high” relative to the parity condition, so you should sell the currencies in the denominators for the currencies in the numerators at the relatively high prices. This means that you should a) sell dollars for francs, b) sell yen for dollars, and c) sell francs for yen. Alternatively, a) buy francs with dollars, b) buy dollars with yen, and c) buy yen with francs. Triangular arbitrage would yield a profit of 3.26 percent of the starting amount. For triangular arbitrage to be profitable, transactions costs on a “round turn” cannot be more than this amount.
4.3 Each of these prices is a traded contract in the interbank forex market, and so arbitrage (either bilateral or triangular) will ensure that the relations Ft
d/f(Y)/Fd/f(X) = 1 and Ftd/eFt
e/fFtf/d = 1 hold within the
bounds of transaction costs.
4.4 The forward price is at a 9 bp discount over six months, or 18 bps on an annualized basis. The six-month percentage premium is (F1
£/$/S0£/$)–1 = (£0.6352/$)/(£0.6361/$)–1 = 0.9986–1 = –0.14%, or a
discount of 0.28% on an annualized basis. Because Ft£/$ = E[St
£/$] according to forward parity (the unbiased forward expectations hypothesis), the spot rate is expected to depreciate by 0.14% over the next six months.
4.5 a. The percentage bid-ask spread depends on which currency is in the denominator. Tokyo quote for the peso: (¥28.77/MXN – ¥28.74/MXN)/(¥28.74/MXN) = 0.00104, or 0.104%. Mexico City quote for yen: (MXN0.03420/¥ – MXN0.03416/¥)/(MXN0.03416/¥) = 0.00117, or
0.117%. b. The Mexican bank’s yen quote can be converted into a quote for the Mexican peso as follows: S¥/MXN = 1/(MXN0.03416/¥) ≈ ¥29.27/MXN bid on the yen and ask on the peso. S¥/MXN = 1/(MXN0.03420/¥) ≈ ¥29.24/MXN ask on the yen and bid on the peso. So “MXN0.03416/¥ BID and MXN0.03420/¥ ASK” on the yen is equivalent to ¥29.24/MXN
BID and ¥29.27/MXN ASK on the Mexican peso. The winning strategy is to buy pesos (and sell yen) from the Tokyo bank at the ¥28.77/MXN ask
Kirt C. Butler, Solutions for Multinational Finance, 5th edition (2012), John Wiley & Sons, Inc.
9
price for pesos and sell pesos (and buy yen) to the Mexican bank at the ¥29.24/MXN bid price for pesos. Buying pesos in Tokyo yields (¥1,000,000)/(¥28.77/MXN) = MXN34,758. Selling pesos in Mexico City yields (MXN34,758)(¥29.24/MXN) = ¥1,016,336. Your arbitrage profit is 16,336 yen, or about MXN559 at the Mexican bank’s ¥29.24/MXN bid price for pesos.
4.6 From the Fisher relation: (1+iCNY) = (1+E[pCNY])(1+E[ʀCNY]) E[ʀCNY]) = (1+iCNY)/(1+ E[pCNY]) – 1 = (1.071/1.05) – 1 = 0.0200, or 2 percent.
4.7 a. From interest rate parity, (¥210/$)/(¥190/$) = (1+i¥)/(1.15) i¥ = 27.11%. b. Because the forward rate of ¥210/$ is greater than the spot rate of ¥190/$, the dollar is at a forward
premium. If forward rates are unbiased predictors of future spot rates, the dollar is likely to appreciate against the yen by (¥210/$)/(¥190/$)–1 = 10.526%.
4.8 a. In this problem, we know the spot and forward rates and U.S. inflation. The real and nominal interest rates are not needed: F1
$/£/S0$/£ = ($1.20/£)/($1.25/£) = 0.96 = E(1+p$)/E(1+p£) =
(1.05)/E(1+p£) => E(p£) = (1.05/0.96)–1 = 9.375% b. From the Fisher equation: i£ = (1+p£)(1+ʀ£)–1 = (1.09375)(1.02)–1 = 11.56%.
4.9 a. E[P1D] = P0
D(1+pD) = D100(1.10) = D110 E[P1
F] = P0F(1+pF) = F1(1.21) = F1.21
E[S1D/F] = E[P1
D] / E[P1F] = D110 / F1.21 = D90.91/F.
b. E[P2D] = P0
D(1+pD)2 = D100(1.10)2 = D121 E[P2
F] = P0F(1+pF)2 = F1(1.21)2 = F1.4641
E[S2D/F] = E[P2
D]/E[P2F] = D121/F1.4641
= S0D/F[(1+pD)/(1+pF)]2 = (D100/F)(1.10/1.21)2 = D82.64/F.
4.10 a. A 7% annualized rate with quarterly compounding is equivalent to 7%/4 = 1.75% per quarter. From interest rate parity, the 3-month MR interest rate is FMR/$/SMR/$ = (MR3.9888/$)/(MR4.0200/$) = (1+iMR)/(1+i$) = (1+iMR)/(1+0.0175) => iMR = 0.009603, or 0.9603% per three months. Annualized, this is equivalent to (0.9603%)×4 = 3.8412% per year with quarterly compounding. Alternatively, the annual percentage rate is (1.009603)4–1 = 0.03897, or 3.897% per year.
b. $10,000,000 invested at the 3-month U.S. rate yields $10,175,000. Changed into MR at the forward rate, this is worth ($10,175,000)(MR3.9888/$) = MR40,586,040. You can finance your $10,000,000 by borrowing MR40,200,000. Your obligation on this contract will be (MR40,200,000)(1.009603) MR40,586,040 which is exactly offset by the proceeds from your forward contract.
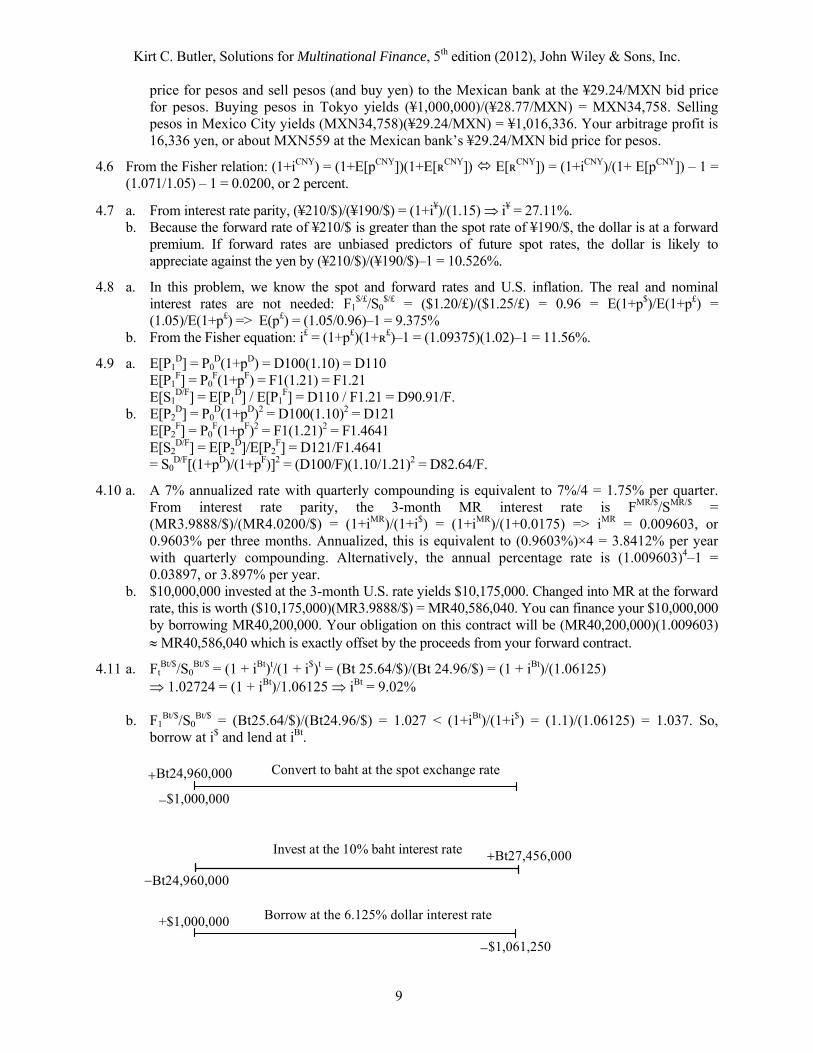
4.11 a. FtBt/$/S0
Bt/$ = (1 + iBt)t/(1 + i$)t = (Bt 25.64/$)/(Bt 24.96/$) = (1 + iBt)/(1.06125) 1.02724 = (1 + iBt)/1.06125 iBt = 9.02% b. F1
Bt/$/S0Bt/$ = (Bt25.64/$)/(Bt24.96/$) = 1.027 < (1+iBt)/(1+i$) = (1.1)/(1.06125) = 1.037. So,
borrow at i$ and lend at iBt.
Bt24,960,000
$1,000,000
Convert to baht at the spot exchange rate
Bt27,456,000
Bt24,960,000
Invest at the 10% baht interest rate
$1,061,250
+$1,000,000 Borrow at the 6.125% dollar interest rate

Kirt C. Butler, Solutions for Multinational Finance, 5th edition (2012), John Wiley & Sons, Inc.
10
This leaves a net gain at time 1 of $1,070,827 – $1,061,250 = $9,577, which is worth
$9,577/1.06125 = $9,024 in present value.
4.12 F1MXN/$/S0
MXN/$=(MXN11/$)/(MXN10/$)=1.1<1.1132=(1.18)/(1.06)=(1+iMXN)/(1+i$). The ratio of interest rates is too high and must fall, so borrow at the relatively low dollar rate and invest at the relatively high peso rate. Similarly, the forward premium is too low and must rise, so buy dollars (and sell pesos) at the relatively low forward rate for the dollar and sell dollars (and buy pesos) at the relatively high dollar spot rate.
- Borrow $1 million so that $1,060,000 is due in six months. - Sell $1 million and buy MXN10,000,000 at the relatively high spot price. - Invest MXN10,000,000 at 18% to yield MXN11,800,000 in six months. - Cover by selling MXN11,800,000 at the MXN11/$ forward rate to yield $1,072,727.
This leaves a profit of $1,072,727–$1,060,000 = $12,727 at time t=1 in six months.
4.13 The Singapore dollar is at a forward premium; F1$/S$/S0
$/S$ = ($0.51/S$)/($0.50/S$) = 1.02, or 2% per year. This is less than is warranted by the difference in interest rates (1+i$)/(1+iS$) = (1.06)/(1.04) = 1.019231, so F1
$/S$/S0$/S$ > (1+i$)/(1+iS$). The forward/spot ratio is too high and must fall, so sell S$
(and buy dollars) at the relatively high S$ forward rate and buy S$ (and sell dollars) at the relatively low S$ spot rate. Conversely, the ratio of interest rates is too low and must rise, so borrow at the relatively low dollar interest rate and invest at the relatively high S$ rate. (Even though S$ interest rates are lower than dollar interest rates in nominal terms, S$ interest rates are high and dollar interest rates are low relative to the forward/spot ratio.) Suppose you borrow ($1,000,000)/(1+i$) = $1,060,000 at i$ = 6.0%.
-$1,060,000
+$1,000,000
Convert to S$2,000,000 = ($1,000,000)/($0.50/S$) at S0$/S$ = $0.50/S$.
-$1,000,000
+S$2,000,000
Invest S$2,000,000 at the Singapore interest rate of iS$ = 4.0%.
-S$2,000,000
+S$2,080,000
Cover this S$ forward obligation by selling S$ in the forward market.
-S$2,080,000
+$1,060,800
The result is a dollar profit of $1,060,800–$1,060,000 = $800. These transactions are worth undertaking only if the costs of executing the four transactions is less than $800.
4.14 a. E[P1F] = P0
F(1+pF) = 1.21 E[P1
D] = P0D(1+pD) = 110
E[S1D/F] = (S0
D/F)(1+pD)/(1+pF) = (D100/F)(1.10/1.21) D90.91/F. b. Because nominal exchange rates should adjust to reflect changes in relative purchasing power, the
expected real exchange rate is 100% of the beginning rate: E[X1D/F] = (E[S1
D/F]/S0D/F)((1+pF)/(1+pD))
Bt27,456,000
$1,070,827Cover baht forward

Kirt C. Butler, Solutions for Multinational Finance, 5th edition (2012), John Wiley & Sons, Inc.
11
= ((D90.91/F)/(D100/F))(1.21/1.10) = 1.00, or 100%. c. E[P2
F]) = P0F(1+pF)2 = F1.4641
E[P2D]) = P0
D(1+pD)2 = D121 E[P2
F]) = P0F(1+pF)2 = F1.4641
E[P2D]) = P0
D(1+pD)2 = D121 E[S2
D/F] = S0D/F((1+pD)/(1+pF))2 = (D100/F)(1.10/1.21)2 D82.64/F
The real exchange rate is not expected to change: E[X2D/F] = (E[S2
D/F]/E[S0D/F]) [(1+pF)/(1+pD)]2
= ((D82.64/F)(D100/F)) / (1.21/1.10)2 = 1.00, or 100%.
4.15 a. s¥/SFr = (S0¥/SFr)/(S–1
¥/SFr) –1 = (¥155/SFr)/(¥160/SFr) – 1 = –3.125%. b. From relative purchasing power parity, the spot rate should have been: E[S0
¥/SFr] = (S–1¥/SFr) [(1+p¥)/(1+pSFr)] = (¥160/SFr) [(1.02)/(1.03)] = ¥158.45.
c. As a difference from the expectation, the real change in the spot rate is: x¥/SFr = (Actual-Expected)/(Expected) = (S0
¥/SFr –E[S0¥/SFr])/E[S0
¥/SFr]) = (¥155/SFr–¥158.45/SFr)/¥158.45/SFr = –2.18%. Alternatively, change in the real exchange rate is equal to: x¥/SFr = ((S0
¥/SFr)/(S–1¥/SFr)) ((1+pSFr)/(1+p¥)) – 1
= ((¥155/SFr)/(¥160/SFr)) ((1.03)/(1.02)) – 1 = –2.18%. d. The franc depreciated by 2.18% in purchasing power. e. In real terms, the yen rose by xSFr/¥ = ((S0
SFr/¥) / (S–1SFr/¥)) ((1+p¥) / (1+pSFr)) – 1
= ((S0¥/SFr)–1 / (S–1
¥/SFr)–1) ((1+p¥) / (1+pSFr)) – 1 = ((¥155/SFr)–1 / (¥160/SFr)–1 ) ((1.02)/(1.03)) – 1 = +2.23% = ((SFr.0064516/¥)/(SFr.00625000/¥)) ((1.02)/(1.03)) – 1 = +2.23%. Because the SFr fell by 2.18% in real terms, the yen rose by 1/(1–0.0218) 2.23%.
4.16 a. technical analysis b. technical analysis c. fundamental analysis d. fundamental analysis e. technical analysis Appendix 4-A Continuous Time Finance
4A.1 Total two-period return is [V2/V0]–1 = [(1+i1)(1+i2)]–1. Mean geometric return is iavg = [(1+i1)(1+i2)]
1/2–1. Total wealth after two periods is the same as beginning wealth; $100(1+1)(1–0.5) = $100. Notice that the order of the rates of return does not matter. A loss of 50% followed by a gain of 100% leaves your initial value unchanged. For the pair of returns (100%,–50%), the average period return is iavg = [(1+1)(1–0.5)]1/2–1 = 0.
With continuously compounded returns, periodic rates are given by i1 = ln(1+i1) = ln(2) = +0.69315 and i2 = ln(1+i2) = ln(0.5) = –0.69315. The (arithmetic) average return using continuously compounded rates is (i1+ i2)/2 = (+0.69315–0.69315)/2 = 0. Either way, your ending value is the same as your beginning value. These methods are equivalent.
4A.2 Inflation rates are pD = ln(1+pD) = ln(1.10) = 9.531% and pF = ln(1+pF) = ln(1.21) = 19.062% in continuously compounded returns. Expected price levels and spot rates are:
E[P1D] = P0
D e(0.09531) = (D100)(1.10) = D110 E[P2
D] = P0D e(2)(0.09531) = (D100)(1.21) = D121
E[P1F] = P0
F e(0.19062) = (F1)(1.21) = F1.21 E[P2
F] = P0F e(2)(0.19062) = (F1)(1.4641) = F1.4641
E[S1D/F] = E[P1
D] / E[P1F] = D110 / F1.21 = D90.91/F
E[S2D/F] = E[P2
D] / E[P2F] = D121 / F1.4641 = D82.64/F

Kirt C. Butler, Solutions for Multinational Finance, 5th edition (2012), John Wiley & Sons, Inc.
12
PART II Derivative Securities for Currency Risk Management
Chapter 5 Currency Futures and Futures Markets
Answers to Conceptual Questions
5.1 How do currency forward and futures contracts differ with respect to maturity, settlement, and the size and timing of cash flows?
Currency forward contracts are traded in an interbank market, have negotiated terms (maturity, amount, and collateral), and are traded with a bid-ask spread. Nearly all forward contracts are held until maturity. Currency futures contracts are exchange-traded, standardized instruments that are traded on a fee basis rather than with a bid-ask spread. Less than 5% of futures contracts are held until maturity.
5.2 What is the primary role of the exchange clearinghouse?
The Chicago Board of Trade Clearing Board’s slogan is “A party to every trade.” This is the primary role of a futures exchange. Users of futures always know the reputation and credit-worthiness of the party on the other side of the trade.
5.3 Draw and explain the payoff profile associated with a currency futures contract.
Payoff profiles for an underlying exposure and for the corresponding futures hedge:
5.4 What is a delta-hedge? a cross-hedge? a delta-cross-hedge?
When there is a maturity mismatch between an underlying transaction exposure and the expiration date of the nearest futures contract, the hedge that minimizes the variance in the hedged position is called a delta-hedge. When there is a currency mismatch but not a maturity mismatch, the variance-minimizing hedge is called a cross-hedge. When there is both a currency mismatch and a maturity mismatch, the variance-minimizing hedge is called a delta-cross-hedge.
5.5 What is the basis? What is basis risk?
The basis is the difference in nominal interest rates, (id–if). The relationship between futures prices and spot prices changes if interest rate levels in the two currencies rise and fall unexpectedly. The risk of unexpected change in the relationship between the futures prices and spot prices is called basis risk.
5.6 How do you measure the quality of a futures hedge?
The quality of a currency hedge is measured by the r-square of a regression of the underlying spot rate change on change in the appropriate futures contract. This measures the percentage variation in one variable that is explained by variation in another variable. If there is both a currency and a maturity mismatch, then hedge quality is measured by the r-square of st
d/f2 on futtd/f1, where d = the
Sd/f
Vd/f
Underlying exposure
Long the foreign currency
Sd/f
Vd/f
Futures hedge
Short the foreign currency
Sd/f
Vd/f
Underlying exposure
Short the foreign currency
Sd/f
Vd/f
Futures hedge
Long the foreign currency
Kirt C. Butler, Solutions for Multinational Finance, 5th edition (2012), John Wiley & Sons, Inc.
13
domestic currency, f2 = the currency in which transaction exposure is denominated, and f1 = the currency used to hedge against st
d/f2. If there is neither a currency nor a maturity mismatch, then futures prices converge to spot prices at expiration and exposure to currency risk can be hedged exactly (an r-square of one) with a futures contract.
Problem Solutions
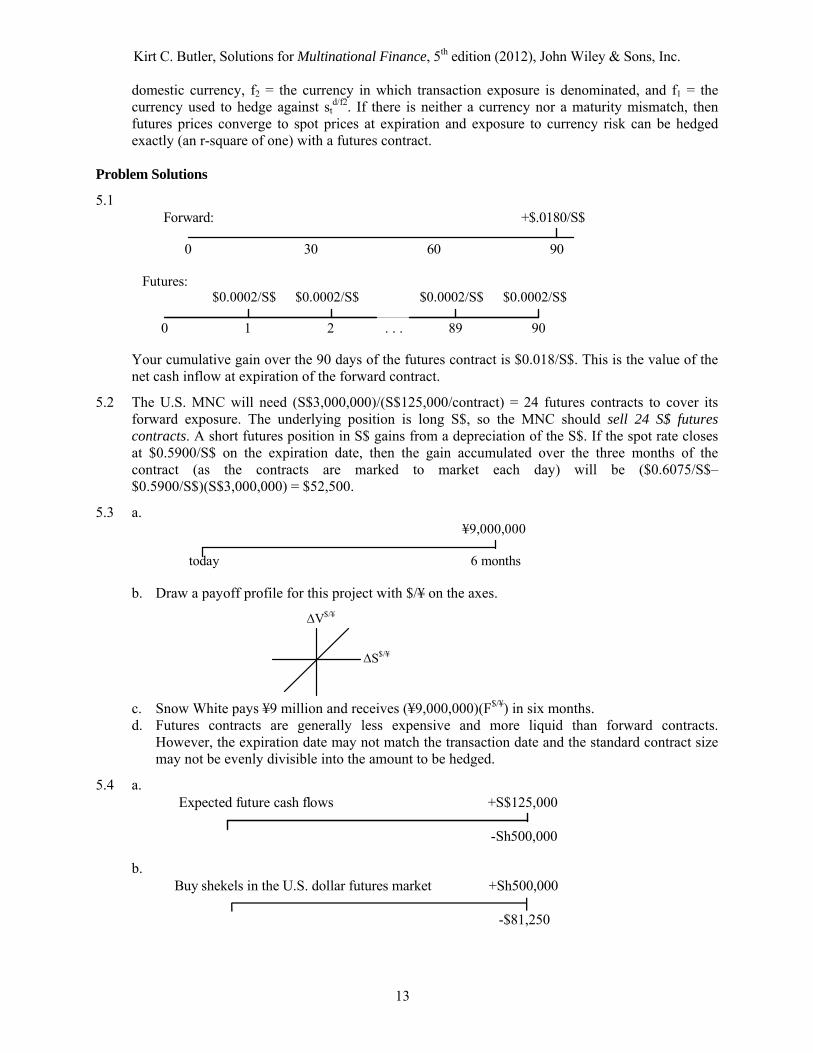
5.1
Forward: +$.0180/S$
0 30 60 90
Futures:$0.0002/S$ $0.0002/S$ $0.0002/S$ $0.0002/S$
0 1 2 . . . 89 90
Your cumulative gain over the 90 days of the futures contract is $0.018/S$. This is the value of the net cash inflow at expiration of the forward contract.
5.2 The U.S. MNC will need (S$3,000,000)/(S$125,000/contract) = 24 futures contracts to cover its forward exposure. The underlying position is long S$, so the MNC should sell 24 S$ futures contracts. A short futures position in S$ gains from a depreciation of the S$. If the spot rate closes at $0.5900/S$ on the expiration date, then the gain accumulated over the three months of the contract (as the contracts are marked to market each day) will be ($0.6075/S$–$0.5900/S$)(S$3,000,000) = $52,500.
5.3 a.
b. Draw a payoff profile for this project with $/¥ on the axes.
c. Snow White pays ¥9 million and receives (¥9,000,000)(F$/¥) in six months. d. Futures contracts are generally less expensive and more liquid than forward contracts.
However, the expiration date may not match the transaction date and the standard contract size may not be evenly divisible into the amount to be hedged.
5.4 a.
Expected future cash flows +S$125,000
-Sh500,000
b.
Buy shekels in the U.S. dollar futures market +Sh500,000
-$81,250
¥9,000,000
today 6 months
V$/¥
S$/¥
Kirt C. Butler, Solutions for Multinational Finance, 5th edition (2012), John Wiley & Sons, Inc.
14
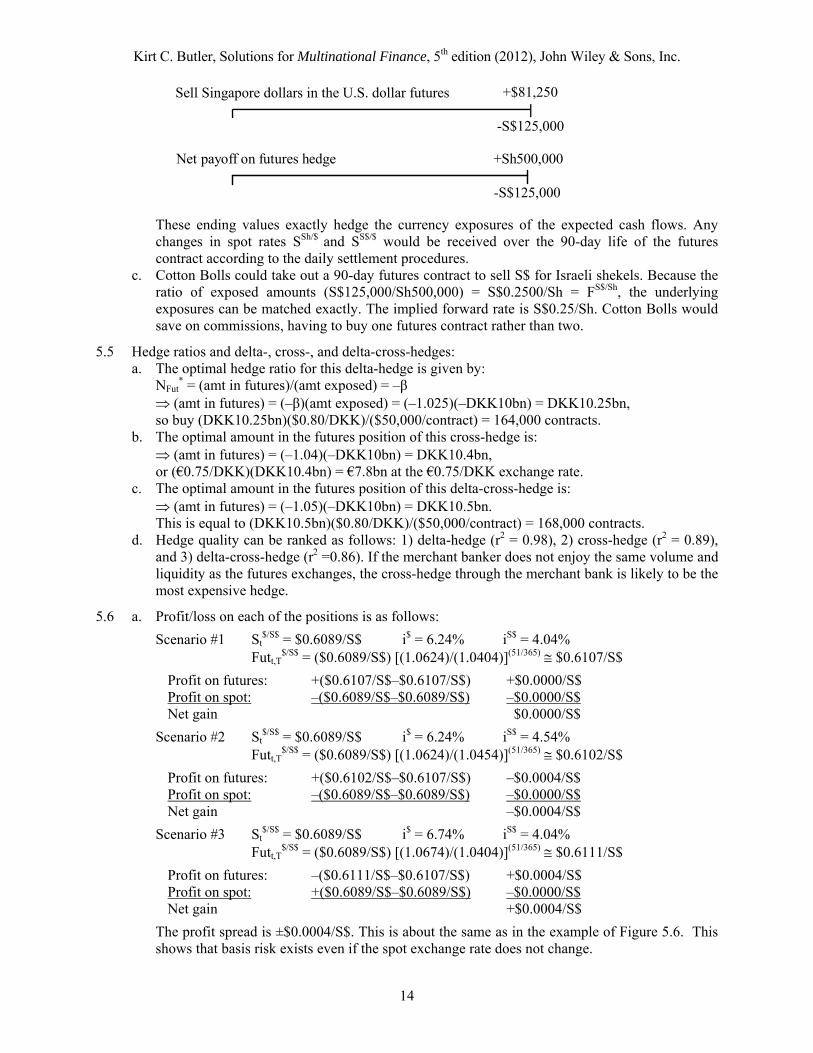
Sell Singapore dollars in the U.S. dollar futures +$81,250
-S$125,000
Net payoff on futures hedge +Sh500,000
-S$125,000
These ending values exactly hedge the currency exposures of the expected cash flows. Any changes in spot rates SSh/$ and SS$/$ would be received over the 90-day life of the futures contract according to the daily settlement procedures.
c. Cotton Bolls could take out a 90-day futures contract to sell S$ for Israeli shekels. Because the ratio of exposed amounts (S$125,000/Sh500,000) = S$0.2500/Sh = FS$/Sh, the underlying exposures can be matched exactly. The implied forward rate is S$0.25/Sh. Cotton Bolls would save on commissions, having to buy one futures contract rather than two.
5.5 Hedge ratios and delta-, cross-, and delta-cross-hedges: a. The optimal hedge ratio for this delta-hedge is given by: NFut
* = (amt in futures)/(amt exposed) = –β (amt in futures) = (–β)(amt exposed) = (–1.025)(–DKK10bn) = DKK10.25bn, so buy (DKK10.25bn)($0.80/DKK)/($50,000/contract) = 164,000 contracts. b. The optimal amount in the futures position of this cross-hedge is: (amt in futures) = (–1.04)(–DKK10bn) = DKK10.4bn, or (€0.75/DKK)(DKK10.4bn) = €7.8bn at the €0.75/DKK exchange rate. c. The optimal amount in the futures position of this delta-cross-hedge is: (amt in futures) = (–1.05)(–DKK10bn) = DKK10.5bn. This is equal to (DKK10.5bn)($0.80/DKK)/($50,000/contract) = 168,000 contracts. d. Hedge quality can be ranked as follows: 1) delta-hedge (r2 = 0.98), 2) cross-hedge (r2 = 0.89),
and 3) delta-cross-hedge (r2 =0.86). If the merchant banker does not enjoy the same volume and liquidity as the futures exchanges, the cross-hedge through the merchant bank is likely to be the most expensive hedge.
5.6 a. Profit/loss on each of the positions is as follows:
Scenario #1 St$/S$ = $0.6089/S$ i$ = 6.24% iS$ = 4.04%
Futt,T$/S$ = ($0.6089/S$) [(1.0624)/(1.0404)](51/365) $0.6107/S$
Profit on futures: +($0.6107/S$–$0.6107/S$) +$0.0000/S$ Profit on spot: –($0.6089/S$–$0.6089/S$) –$0.0000/S$ Net gain $0.0000/S$
Scenario #2 St$/S$ = $0.6089/S$ i$ = 6.24% iS$ = 4.54%
Futt,T$/S$ = ($0.6089/S$) [(1.0624)/(1.0454)](51/365) $0.6102/S$
Profit on futures: +($0.6102/S$–$0.6107/S$) –$0.0004/S$ Profit on spot: –($0.6089/S$–$0.6089/S$) –$0.0000/S$ Net gain –$0.0004/S$
Scenario #3 St$/S$ = $0.6089/S$ i$ = 6.74% iS$ = 4.04%
Futt,T$/S$ = ($0.6089/S$) [(1.0674)/(1.0404)](51/365) $0.6111/S$
Profit on futures: –($0.6111/S$–$0.6107/S$) +$0.0004/S$ Profit on spot: +($0.6089/S$–$0.6089/S$) –$0.0000/S$ Net gain +$0.0004/S$
The profit spread is ±$0.0004/S$. This is about the same as in the example of Figure 5.6. This shows that basis risk exists even if the spot exchange rate does not change.
Kirt C. Butler, Solutions for Multinational Finance, 5th edition (2012), John Wiley & Sons, Inc.
15
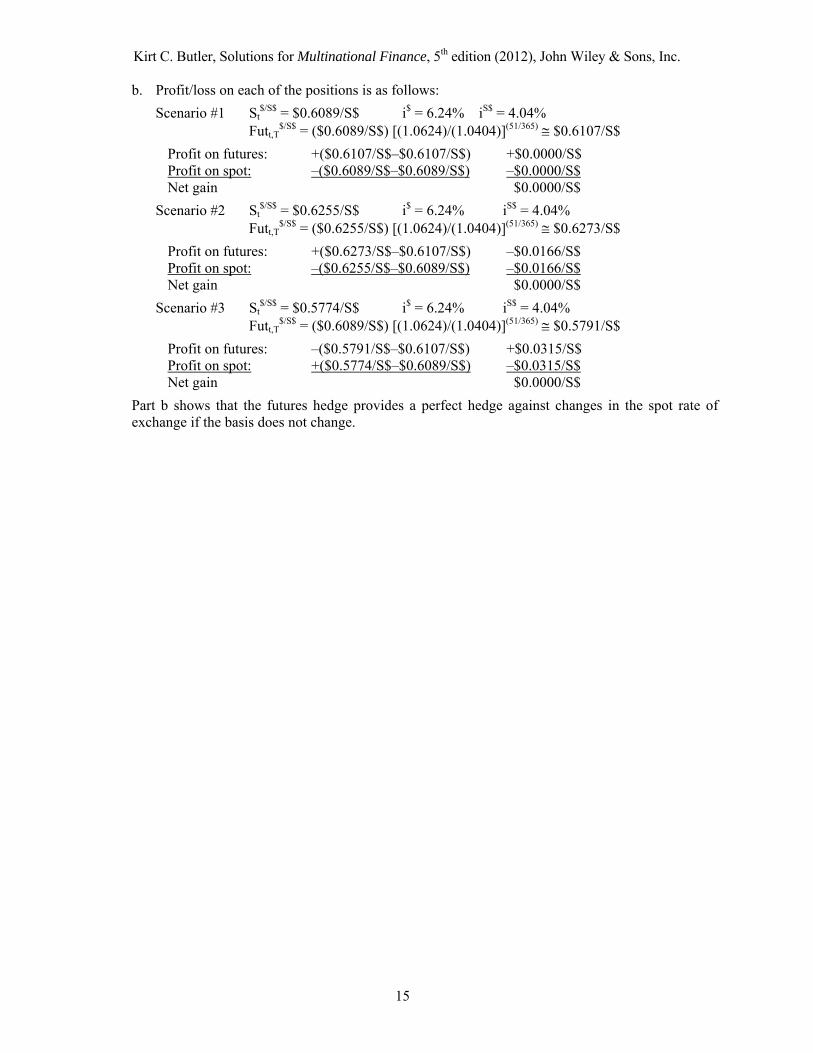
b. Profit/loss on each of the positions is as follows:
Scenario #1 St$/S$ = $0.6089/S$ i$ = 6.24% iS$ = 4.04%
Futt,T$/S$ = ($0.6089/S$) [(1.0624)/(1.0404)](51/365) $0.6107/S$
Profit on futures: +($0.6107/S$–$0.6107/S$) +$0.0000/S$ Profit on spot: –($0.6089/S$–$0.6089/S$) –$0.0000/S$ Net gain $0.0000/S$
Scenario #2 St$/S$ = $0.6255/S$ i$ = 6.24% iS$ = 4.04%
Futt,T$/S$ = ($0.6255/S$) [(1.0624)/(1.0404)](51/365) $0.6273/S$
Profit on futures: +($0.6273/S$–$0.6107/S$) –$0.0166/S$ Profit on spot: –($0.6255/S$–$0.6089/S$) –$0.0166/S$ Net gain $0.0000/S$
Scenario #3 St$/S$ = $0.5774/S$ i$ = 6.24% iS$ = 4.04%
Futt,T$/S$ = ($0.6089/S$) [(1.0624)/(1.0404)](51/365) $0.5791/S$
Profit on futures: –($0.5791/S$–$0.6107/S$) +$0.0315/S$ Profit on spot: +($0.5774/S$–$0.6089/S$) –$0.0315/S$ Net gain $0.0000/S$
Part b shows that the futures hedge provides a perfect hedge against changes in the spot rate of exchange if the basis does not change.
Kirt C. Butler, Solutions for Multinational Finance, 5th edition (2012), John Wiley & Sons, Inc.
16
Chapter 6 Currency Options and Options Markets
Answers to Conceptual Questions
6.1 What is the difference between a call option and a put option?
A call option is an option to buy the underlying asset at a predetermined exercise price. A put option is an option to sell the underlying asset at the exercise price.
6.2 What are the differences between exchange-traded and over-the-counter currency options?
Exchange-traded currency options are standardized as to currencies, maturity, exercise prices, and settlement procedures. Over-the-counter options traded by commercial and investment banks can be tailored to fit the needs of the client.
6.3 In what sense is a currency call option also a currency put option?
Because an option to buy one currency is simultaneously an option to sell another currency, currency options are both a call (on one currency) and a put (on the other currency).
6.4 In what sense is a currency forward contract a combination of a put and a call?
A currency forward contract to buy currency f at a forward price of FTd/f at time T can be replicated
by purchasing a European call option on currency f with the same expiration date and an exercise price Kd/f = FT
d/f and simultaneously selling a put option at the same exercise price and maturity date. Conversely, a short forward contract on currency f is a combination of a written call on f and a purchased put on f with the same expiration date and exercise price.
6.5 What are the six determinants of a currency option value?
The determinants of currency option values are riskless domestic and foreign interest rates, the exercise price, the underlying spot (or futures) price, the expiration date, and the volatility of the underlying exchange rate.
6.6 What determines the intrinsic value of an option? What determines time value of an option?
The intrinsic value is the value if exercised today. For a call on the spot rate Sd/f, intrinsic value is equal to max(Sd/f–Kd/f,0). For a put option, intrinsic value is equal to max(Kd/f–Sd/f,0). Time value is the difference between the market value and the intrinsic value of an option and reflects the additional value of waiting until expiration before exercise. Time value primarily depends on time to expiration and volatility in the underlying exchange rate. Foreign and domestic interest rates play a lesser role for most currency options.
6.7 Currency volatility is a key determinant of currency option value, but it is not directly observable. In what ways can you estimate currency volatility?
The other determinants of option value (foreign and domestic interest rates, exercise price, time to expiration, and underlying exchange rate) are usually observable, but the volatility of the underlying exchange rate is not. Volatility can be estimated in two ways: (a) from historical currency movements (e.g., unconditional standard deviations of return, conditional volatilities such as GARCH, or realized volatilities based on intra-day price movements), or (b) implied volatilities (volatilities implied by the five observable determinants of option values and the observed market price of an option) if the other determinants of option values are observable.
Problem Solutions
6.1 A call option to buy pounds sterling with krone is equivalent to a put option to sell krone for pound sterling. With pounds in the denominator, it is most convenient to think of consider the pound call. Option values at expiration as a function of the krone value of the pound are then:
Spot rate at expiration (DKK/£) 8.00 8.40 8.42 8.44 8.46 8.48 Pound call value at expiration (DKK/£) 0.00 0.00 0.00 0.00 0.01 0.03

Kirt C. Butler, Solutions for Multinational Finance, 5th edition (2012), John Wiley & Sons, Inc.
17
6.2 An exercise price of DKK8.45/£ is equivalent to £0.11834/DKK. The corresponding krone put option values are:
Spot rate at expiration (£/DKK) 0.12500 0.11905 0.11876 0.11848 0.11820 0.11792 Krone put value at expiration (£/DKK) 0.00 0.00 0.00 0.00 0.14 0.42
The profit/loss graph is as follows.
£0.11834/DKK
£0.11834/DKK
PutT£/DKK
ST£/DKK
6.3 A short krone put is equivalent to a short pound call. Here are their payoff profiles.
£0.11834/DKK DKK8.45/£
£0.11834/DKK
CallTDKK/£PutT
£/DKK
ST£/DKK ST
DKK/£
For long option positions, an option to buy pounds at KDKK/£ = DKK8.45/£ is equivalent to an
option sell DKK at K£/DKK = 1/KDKK/£ = 1/(DKK8.45/£) £0.11834/DKK. Conversely, for the short option positions an obligation to sell pounds at KDKK/£ = DKK8.45/£ is
equivalent to an obligation to buy DKK at K£/DKK = 1/KDKK/£ = 1/(DKK8.45/£) £0.11834/DKK.
6.4 Buy a A$ call and sell a A$ put, each with an exercise price of F1$/A$ = $0.75/A$ and the same
expiration date as the forward contract. Payoffs at expiration look like this:
CallT$/A$ FT
$/A$
ST$/A$ ST
$/A$+
PutT$/A$
ST$/A$ =
6.5 The arguments are the same as for call options. As the variability of end-of-period spot rates
becomes more dispersed, the probability of the spot rate closing below the exercise price increases and put options gain value. Here are the three sets of graphs:
Kirt C. Butler, Solutions for Multinational Finance, 5th edition (2012), John Wiley & Sons, Inc.
18
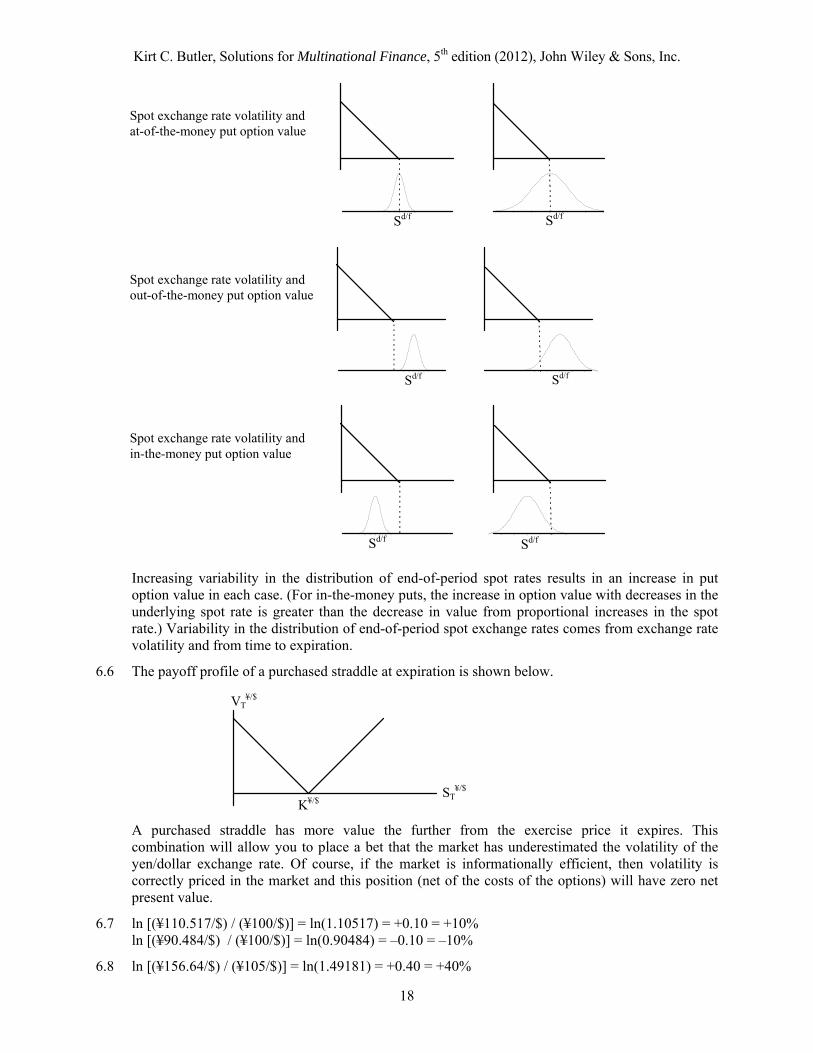
Increasing variability in the distribution of end-of-period spot rates results in an increase in put
option value in each case. (For in-the-money puts, the increase in option value with decreases in the underlying spot rate is greater than the decrease in value from proportional increases in the spot rate.) Variability in the distribution of end-of-period spot exchange rates comes from exchange rate volatility and from time to expiration.
6.6 The payoff profile of a purchased straddle at expiration is shown below.
A purchased straddle has more value the further from the exercise price it expires. This
combination will allow you to place a bet that the market has underestimated the volatility of the yen/dollar exchange rate. Of course, if the market is informationally efficient, then volatility is correctly priced in the market and this position (net of the costs of the options) will have zero net present value.
6.7 ln [(¥110.517/$) / (¥100/$)] = ln(1.10517) = +0.10 = +10% ln [(¥90.484/$) / (¥100/$)] = ln(0.90484) = –0.10 = –10%
6.8 ln [(¥156.64/$) / (¥105/$)] = ln(1.49181) = +0.40 = +40%
-3
-2 -1 0 1 2 3 -3
-2 -1 0 1 2 3
Sd/f Sd/f
-3
-2 -1 0 1 2 3 -3
-2 -1 0 1 2 3
Sd/f Sd/f
-3
-2 -1 0 1 2 3 -3
-2 -1 0 1 2 3
Sd/f Sd/f
VT¥/$
ST¥/$
K¥/$
Spot exchange rate volatility and at-of-the-money put option value
Spot exchange rate volatility and out-of-the-money put option value
Spot exchange rate volatility and in-the-money put option value

Kirt C. Butler, Solutions for Multinational Finance, 5th edition (2012), John Wiley & Sons, Inc.
19
ln [(¥70.38/$) / (¥105/$)] = ln(0.50819) = –0.40 = –40%
6.9 Exchange rate volatility and standard deviations: a. A daily standard deviation of 0.742% measured over 252 trading days implies T = (0.742%)(252) = 11.78% per year. b. +2: e2(+0.1178) = e+0.2356 = 1.2657 (A$1.4/$)(1.2657) = A$1.7719/$ –2: e2(–0.1178) = e–0.2356 = 0.7901 (A$1.4/$)(0.7901) = A$1.1061/$ c. +2: r = ln((A$1.7719/$)/(A$1.4/$)) = ln(1.2657) = +0.2356 0.1178/year –2: r = ln((A$1.1061/$)/(A$1.4/$)) = ln(0.7901) = –0.2356 0.1178/year Alternatively, S$/A$ = 1/SA$/$
= 1/(A$1.4/$) = $0.714285/A$. +2: e2×(+0.1178) = 1.2657 ($0.7143/A$)(1.2657) = $0.9040/A$ A$1.1061/$ –2: e2×(–0.1178) = 0.7901 ($0.7143/A$)(0.7901) = $0.5644/A$ A$1.7719/$ Appendix 6-A Currency Option Valuation
6A.1 Option determinants are as follows: i¥ = i$ = 0.05, T = ½ year = 0.5, S¥/$ = $80, K¥/$ = $100, and σ = 0.10. Assume these are continuously compounded rates calculated from holding period rates according to i = ln(1+i). Then,
d1 = [ln(Sd/f/Kd/f) + (id–if+σ2/2)T] / (σ√T) = [ln((¥80/$)/(¥100/$)) + (0.05–0.05+(0.10)2/2)(0.5)] / (0.10)(0.5)1/2 = –3.120371 => N(d1) = 0.000903 d2 = d1 – σ√T = –3.1204 – (0.10)(0.5)1/2 = –3.191082 => N(d2) = 0.000709
Calld/f = [Sd/f N(d1)] – [Kd/f N(d2)]
= e(–0.05×.5)[(¥80/$)(0.000903)]–e(–0.05×.5)[(¥100/$)(0.000709)] = ¥0.0013/$. This deep-out-of-the-money dollar call has almost no chance of being exercised.
6A.2 Option determinants are as follows: i¥ = i$ = 0.05, T = ½ year = 0.5, S¥/$ = $80, K¥/$ = $100, and σ = 0.20. Assume these are continuously compounded rates calculated from holding period rates according to i = ln(1+i). Then,
d1 = [ln(Sd/f/Kd/f) + (id–if+ σ2/2)T] / (σ√T) = [ln((¥80/$)/(¥100/$)) + (0.05–0.05+(0.20)2/2)(0.5)] / (0.20)(0.5)1/2 = –1.5071 => N(d1) = 0.065886 d2 = d1 – σ√T = –1.5071 – (0.20)(0.5)1/2 = –1.6486 => N(d2) = 0.049617
Calld/f = e(–ifT) [Sd/f N(d1)] – e(–i
dT) [Kd/f N(d2)]
= e(–0.05×.5)[(¥80/$)(0.065886)]–e(–0.05×.5)[(¥100/$)(0.049617)] = ¥0.3015/$. With 10% annual volatility as in Problem 6A.1, the call option pricing model yields a value of
¥0.0013/$. If the true volatility is 20% per year and this option is priced as if the volatility is 10% per year, then the option will be undervalued by (¥0.3015/$–¥0.0013/$) = ¥0.3015/$-¥0.0013/$ =
¥0.3002/$.
6A.3 From the currency option pricing model, the implied volatility (or standard deviation) of S$/¥ is about 0.0296 (or 2.96%) per year. As verification, here are the calculations of call option value:
d1 = [ln(Sd/f/Kd/f) + (id–if+σ2/2)T] / (σ√T) = [ln(($.008345/¥)/($.008400/¥)) + (0.04–0.04+(0.0296)2/2) (2.5/12)] / [(0.0296)(2.5/12)1/2] = –0.1169 d2 = d1 – σ√T = –0.1169 – (0.0296)(2.5/12)1/2 = –0.1637
Calld/f = [Sd/f N(d1)] – [Kd/f N(d2)]
= e(–0.04×2.5/12)[($.008345/¥)(0.5465)]–e(–0.04×2.5/12)[($0.0084/¥)(0.4535)] = $0.000118/¥. This is an unusually low volatility. Annual dollar/yen volatilities are typically between 8% and
- Tfe i - Td
e i
- Tfe i - Td
e i

Kirt C. Butler, Solutions for Multinational Finance, 5th edition (2012), John Wiley & Sons, Inc.
20
16%. Although a variety of factors could lead to inaccurate implied volatilities, most difficulties in volatility estimation are associated with low volume. (Hence the rule: “Beware of prices in thinly traded markets.”) In this problem, it would be wise to calculate implied volatilities from several other yen options with different exercise prices.
6A.4 a. Interest rate parity provides forward rates according to: Ftd/f / S0
d/f = [(1+id)/(1+if)]t. A problem arises because the options are on Danish krone but the krone appears in the numerator
(a violation of Rule #2 from Chapter 3) of the exchange rates. This is not unusual, as the pound is often left in the denominator of a foreign exchange quote. Historically, the pound was composed of shillings and pence rather than decimal units. (Nobody understands cricket, either.) For clarity, the table below includes forward rates in £/DKK and quotes option prices in direct £/DKK terms from a Londoner’s perspective. The current spot rate is S0
£/DKK = 1/(DKK8.4528/£) = £0.11830/DKK and the exercise price is K£/DKK = 1/(DKK8.5/£) = £0.11765/DKK.
1-month 3-month 6-month 1-year Forward rate (DKK/£) 8.4404 8.4157 8.3787 8.3053 Forward rate (£/DKK) 0.11848 0.11883 0.11935 0.12040 Call option value (£/DKK) 0.00180 0.00294 0.00412 0.00583 Put option value (£/DKK) 0.00100 0.00178 0.00247 0.00326 b. Here is a sample calculation for the three-month (= one period) call and put values. d1 = [ln(Sd/f/Kd/f) + (id–if+σ2/2)T] / (σ√T) = [ln((£0.11830/DKK)/(£0.11765/DKK))+(0.0174–0.0130+(0.05)2/2)(1)]/(0.05)(1)1/2 = +0.2244 d2 = d1 – σ√T = +0.2244 – (0.05)(1)1/2 = +0.1744
Calld/f = [Ftd/f N(d1) – Kd/f N(d2)]
= e(–0.0174×1)[(£0.11883)(0.5888)–(£0.11765)(0.5692)] = £0.00294/DKK. c. Here are the call option payoff profiles for the four options prior to expiration. The one-year
option is plotted as the highest line in the graph.. The one-month option is the lowest (curved) line in the graph. The darkened forty-five degree line is the intrinsic value of the option.
d. Here are put option payoff profiles for the options prior to expiration. The one-year option has a
higher value at high spot rates and a lower value at low spot rates. The one-month option has
- Tde i
-0.002
0.000
0.002
0.004
0.006
0.008
0.010
0.012
0.014
0.016
0.018
0.0900 0.0950 0.1000 0.1050 0.1100 0.1150 0.1200 0.1250

Kirt C. Butler, Solutions for Multinational Finance, 5th edition (2012), John Wiley & Sons, Inc.
21
lower value at high spot rates and a higher value at lower spot rates. The darkened 45o line is the intrinsic value of the option. European put option values can be below intrinsic value because they cannot be exercised until expiration.
6A.5 Let’s restate these exercise prices as pound per krone rates before proceeding.
Exercise prices Exercise prices (DKK/£) 8.2000 8.4000 8.6000 8.8000 Exercise prices (£/DKK) 0.12195 0.11905 0.11628 0.11364
Call option value 0.00114 0.00222 0.00377 0.00568 Put option value 0.00421 0.00244 0.00127 0.00058
-0.020
0.000
0.020
0.040
0.060
0.080
0.100
0.120
0.0000 0.0200 0.0400 0.0600 0.0800 0.1000 0.1200 0.1400 0.1600
Kirt C. Butler, Solutions for Multinational Finance, 5th edition (2012), John Wiley & Sons, Inc.
22
Chapter 7 Currency Swaps and Swaps Markets
Answers to Conceptual Questions
7.1 How are swaps related to forward contracts?
A swap is a portfolio of simultaneous forward contracts each with a different maturity date.
7.2 What is a currency coupon swap?
A currency coupon swap is a fixed-for-floating rate non-amortizing currency swap. Currency coupon swaps are primarily traded through international commercial banks.
7.3 What is a fully covered currency coupon swap?
A fully covered currency coupon swap fully covers the customers interest rate obligations on the underlying exposure by adding a premium to both the fixed and the floating rate side of the swap. Interest payments on the fixed-rate side are set equal in present value to the interest payments on the floating rate side of the swap
7.4 What is a coupon swap?
A coupon swap is a fixed-for-floating rate non-amortizing interest rate swap. These swaps are also traded primarily through international commercial banks.
7.5 What is the difference between a bond equivalent yield and a money market yield?
U.S. Treasuries are quoted as a bond equivalent yield (BEY) assuming a 365-day year and semiannual interest payments. Floating rate Eurocurrencies such as those pegged to LIBOR are quoted as a money market yield (MMY) based on a 360-day year and semiannual coupons. The relation between the two is MMY = BEY(360/365).
Problem Solutions
7.1 Little Prince could form a coupon swap (an interest rate swap) of its existing fixed rate debt into floating rate debt. Consider the coupon swap pricing table from the text:
Bank Pays Bank Receives Current Maturity Fixed Rate Fixed Rate TN Rate 2 years 2 yr TN sa + 19bps 2 yr TN sa + 40bps 7.05% 3 years 3 yr TN sa + 24bps 3 yr TN sa + 47bps 7.42% 4 years 4 yr TN sa + 28bps 4 yr TN sa + 53bps 7.85% 5 years 5 yr TN sa + 33bps 5 yr TN sa + 60bps 7.92%
This schedule assumes non-amortizing debt and semiannual rates (sa). All quotes are against 6-month LIBOR flat. TN = Treasury Note rate.
LP would pay LIBOR flat on the floating rate side and receive the 2-year T-note rate of 7.24% (7.05%+19 bp) on the fixed rate side. Because LP is now paying 8.25% on its fixed rate debt, its interest shortfall would be (8.25%–7.24%) = 1.01%. This is equal to 1.01%(360/365) = 0.996% per year in money market yield. LP’s net cost of floating rate funds is then LIBOR + 99.6 bps in money market yield. In this example, the swap just barely beats the market rate on new floating rate debt of LIBOR + 100 bps.
7.2 a. Ford pays fixed-rate zloty interest at a bond equivalent yield of 7.98%+0.78% = 8.76% and receives floating rate zloty interest at the 6-month LIBOR rate. After converting the 45 bps premium above LIBOR to a bond equivalent yield, Ford’s cost of fixed rate zloty debt is 8.76%+0.45%(365/360) 9.22% in semiannually compounded bond equivalent yield.
b. PM receives fixed rate zloty interest from the swap bank at 7.98%+0.24% = 8.22%. PM pays floating rate zloty interest at 6-month LIBOR flat. After converting the difference between PM’s fixed-rate outflows and inflows (9.83%–8.22% = 161 bps) to a money market yield,

Kirt C. Butler, Solutions for Multinational Finance, 5th edition (2012), John Wiley & Sons, Inc.
23
PM’s cost of floating rate zloty debt is LIBOR + (161 bps)(360/365) = LIBOR+159 bps in money market yield.
c. The swap bank pays LIBOR to Ford and receives LIBOR from PM for no net gain or loss in floating-rate zlotys. The swap bank receives 8.76% (sa) from Ford and pays 8.22% (sa) to PM for a net gain of (8.76%–8.22%) = 54 bps in bond equivalent yield on the notional principal.
7.3 a. The 6-month pound interest rate is (4.12%)/2 = 2.06%. The pound is selling at a 6-month forward discount of 0.58%, so the yen rate that corresponds to the 2.06% pound rate in present value is (1+i¥)/(1+i£) = F1
¥/£/S0¥/£ i¥ = (1+i£)(F1
¥/£/S0¥/£)–1 = (1.0206)(1–0.0058)–1 =
0.01468052, or about 1.468 percent per six months. Note in passing that the PV annuity factors that correspond to these interest rates are PVIFA(i¥=1.46805,T=6) = 5.70339081 and PVIFA(i£=2.06%,T=6) = 5.59010642.
b. Step (1): JI’s 105 bps spread to LIBOR translates into a BEY of (1.05%/2)(365/360) = 53.2292 bps per six months.
Step (2): Solving Equation 7.2 for the equivalent semiannual pound spread yields r£ = r¥ PVIFA(i¥=1.46805,T=6)/PVIFA(i£=2.06%,T=6) = (53.2292 bps)(5.70339081/5.59010642) = 54.3079 bps in bond equivalent yield.
Step (3): JI also must pay the fixed rate side of the swap to the swap bank at a rate of 4.12% + 5 bps, or a semiannual rate of 2.085%. JI’s all-in cost of fixed rate pound sterling debt is (2.085% + 0.543079%) = 2.628079 percent (BEY), or 5.256157 percent per year compounded semiannually.
c. Step (1): BD is paying 7.45% over the 4.07 pound swap rate that it receives from the swap bank, for a semiannual premium of (7.45%–4.07%)/2 = 169 bps.
Step (2): The corresponding yen premium to LIBOR is r¥ = r£ PVIFA(i£,6)/PVIFA(i¥,6) = (169 bps)(5.59010642/5.70339081) = 165.6432 bps (BEY).
Step (3): This is equivalent to (165.6432 bps)(360/365) = 163.3741 bps in money market yield. BD’s all-in cost of floating rate yen financing over the LIBOR yen rate is 2(163.3741 bps) = 3.267483% in money market yield, or about 3.27 percent.
d. The swap bank earns a (4.17%–4.07%) = 10 bp spread in bond equivalent yield on the notional principal regardless of whether the bank quotes fully covered rates or uses the swap pricing schedule given in the problem. When the bank quotes fully covered rates, it adds a premium to both the fixed and floating rate sides that leaves its net position unchanged.
7.4 a. The dollar interest rate that corresponds to the zloty swap mid-rate is ((1+iZ)/(1+i$))t = Ft
Z/$/S0Z/$ i$ = (1+iZ)/(Ft
Z/$/S0Z/$)–1 = (1.079)/(1.038)–1 = 0.03949904, or about 3.95 percent.
The corresponding present value annuity factors are PVIFA(iZ=7.9%,5) = 4.00325549 and PVIFA(i$=3.949904%,5) = 4.45809446.
Usually, we know the notional principal and need to calculate payments based on the swap pricing schedule. In this problem, GE knows the payments and needs to calculate the notional principal. GE wants zloty cash outflows of Z5 million per year to hedge one-half of its Z10 million expected after-tax operating cash flow. GE will be paying the fixed zloty cash flow, and so will pay the swap bank’s ask rate of 8.10%. This requires notional principal of PV0
Z = PMTZ PVIFA(iZ=8.1%,5) = (Z5 million)(3.98220886) = Z19,911,044 to generate a 5-year annuity of Z5 million. This is equivalent to $7,111,087 at the Z2.80/$ spot rate.
Step (1): GE’s cost of floating rate dollar debt is at LIBOR + 32 bps, or (32 bps)(365/360) = 32.4444 basis points in (dollar) bond equivalent yield.
Step (2): The zloty spread to LIBOR is rZ = (32.4444 bps)(4.45809446/4.00325549) = 36.1307 bps (BEY).
Step (3): GE’s all-in cost of fixed rate zloty debt is then (8.10% + 36.1307 bps) = 8.461307 percent (BEY).
b. Step (1): SP is paying 10.24% on its existing zloty debt, compared with the 7.70% it’ll receive from the swap bank, for a premium of (10.24%–7.70%) = 254 bps.
Step (2): The equivalent dollar premium is r$ = rZ PVIFA(iZ=7.9%,5)/PVIFA(i$=3.949904%,5)
Kirt C. Butler, Solutions for Multinational Finance, 5th edition (2012), John Wiley & Sons, Inc.
24
= (2.54%)(4.00325549/4.45809446) = 228.0855 bps in bond equivalent yield, or (228.0855 bps)(360/365) = 224.9611 bps in money market yield.
Step (3): SP’s all-in cost of floating rate dollar financing is LIBOR + 224.9611 bps (MMY), or about 2.25 percent over the LIBOR Eurodollar rate.
c. The swap bank earns an (8.10%–7.70%) = 40 bp spread in bond equivalent yield on the notional principal. When the bank quotes fully covered rates, it adds a premium to both the fixed and floating rate sides of its swaps that leaves its net position unchanged.
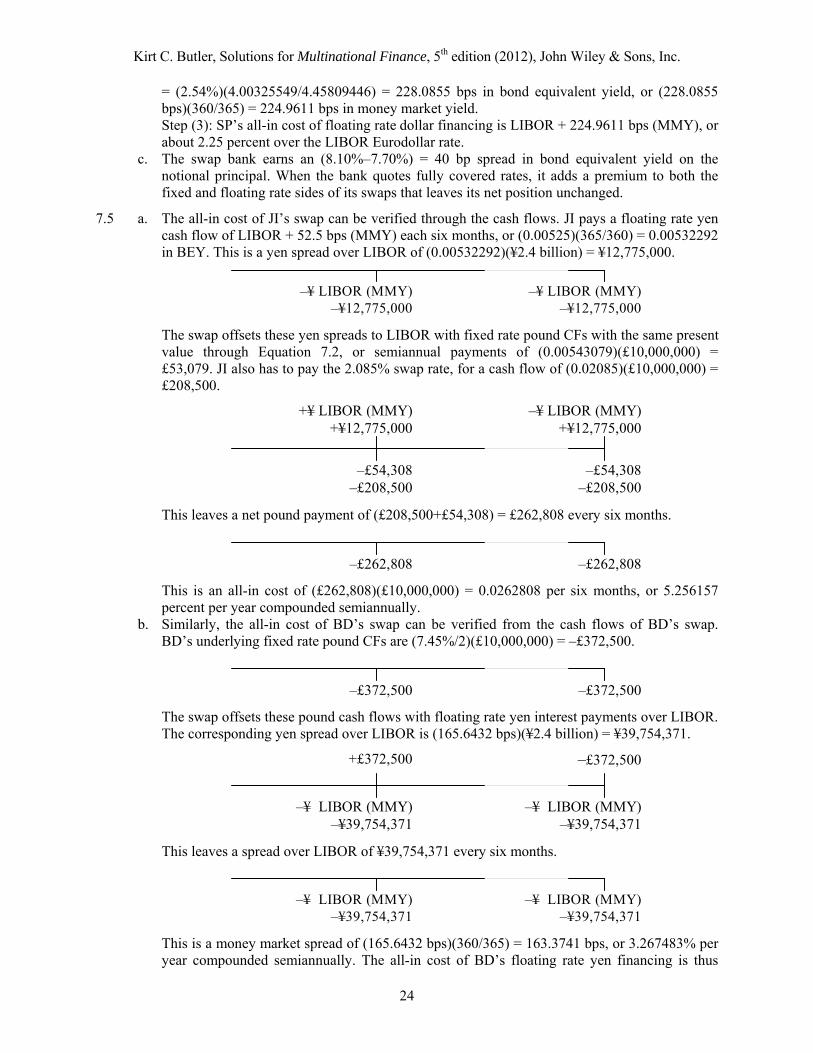
7.5 a. The all-in cost of JI’s swap can be verified through the cash flows. JI pays a floating rate yen cash flow of LIBOR + 52.5 bps (MMY) each six months, or (0.00525)(365/360) = 0.00532292 in BEY. This is a yen spread over LIBOR of (0.00532292)(¥2.4 billion) = ¥12,775,000.
–¥ LIBOR (MMY)
–¥12,775,000–¥ LIBOR (MMY)
–¥12,775,000
The swap offsets these yen spreads to LIBOR with fixed rate pound CFs with the same present value through Equation 7.2, or semiannual payments of (0.00543079)(£10,000,000) = £53,079. JI also has to pay the 2.085% swap rate, for a cash flow of (0.02085)(£10,000,000) = £208,500.
+¥ LIBOR (MMY)+¥12,775,000
–¥ LIBOR (MMY) +¥12,775,000
–£54,308–£208,500
–£54,308 –£208,500
This leaves a net pound payment of (£208,500+£54,308) = £262,808 every six months.
–£262,808 –£262,808
This is an all-in cost of (£262,808)(£10,000,000) = 0.0262808 per six months, or 5.256157 percent per year compounded semiannually.
b. Similarly, the all-in cost of BD’s swap can be verified from the cash flows of BD’s swap. BD’s underlying fixed rate pound CFs are (7.45%/2)(£10,000,000) = –£372,500.
–£372,500 –£372,500
The swap offsets these pound cash flows with floating rate yen interest payments over LIBOR. The corresponding yen spread over LIBOR is (165.6432 bps)(¥2.4 billion) = ¥39,754,371.
+£372,500 –£372,500
–¥ LIBOR (MMY)–¥39,754,371
–¥ LIBOR (MMY) –¥39,754,371
This leaves a spread over LIBOR of ¥39,754,371 every six months.
–¥ LIBOR (MMY)
–¥39,754,371–¥ LIBOR (MMY)
–¥39,754,371
This is a money market spread of (165.6432 bps)(360/365) = 163.3741 bps, or 3.267483% per year compounded semiannually. The all-in cost of BD’s floating rate yen financing is thus

Kirt C. Butler, Solutions for Multinational Finance, 5th edition (2012), John Wiley & Sons, Inc.
25
LIBOR + about 3.27% compounded semiannually.
7.6 a. GE pays a floating rate dollar cash flow of LIBOR + 32.4444 bps (BEY) of the $7,111,087 notional principal on its existing debt, for an annual payment of (0.00324444)($7,111,087) = $23,072 over the 1-year LIBOR Eurodollar rate.
–$ LIBOR (MMY)
–$23,072–$ LIBOR (MMY)
–$23,072
The swap offsets the dollar spread to LIBOR with fixed rate zloty CFs of the same present value through Equation 7.2, or an annual spread of (0.00361307)(Z19,911,044) = Z71,940. GE also has to pay the 8.1% swap rate, for a fixed-rate zloty payment of (0.081)(Z19,911,044) = Z1,612,795.
+$ LIBOR (MMY)+$23,072
–$ LIBOR (MMY) +$23,072
–Z71,940–Z1,612,795
– Z71,940 – Z1,612,795
The total fixed-rate zloty payment is Z1,684,735 each year.
– Z1,684,735 – Z1,684,735
This is indeed an all-in cost (Z1,684,735)/(Z19,911,044) = 0.08461307 per year (or about 8.46 percent) on GE’s fixed-rate zloty debt.
b. SP’s underlying fixed rate zloty payments are (10.24%)(Z19,811,044) = Z2,038,891 per year.
–Z2,038,891 – Z2,038,891
The swap offsets these fixed-rate zloty CFs with floating rate dollar payments over LIBOR. The corresponding $ spread over LIBOR is (0.02280855)($7,111,087) = $162,194 as a BEY.
+Z2,038,891 +Z2,038,891
–$ LIBOR (MMY)–$162,194
–$ LIBOR (MMY) –$162,194
When combined with the underlying zloty obligation, this leaves net cash flows of
–$ LIBOR (MMY)
–$162,194–$ LIBOR (MMY)
–$162,194
This is a money market spread of (228.0855 bps)(360/365) = 224.8611 bps, or about 2.25% over the 1-year LIBOR Eurodollar rate.

Kirt C. Butler, Solutions for Multinational Finance, 5th edition (2012), John Wiley & Sons, Inc.
26
PART III Managing the Risks of Multinational Operations
Chapter 8 Multinational Treasury Management
Answers to Conceptual Questions
8.1 What is multinational treasury management?
Multinational treasury management involves five functions: 1) set overall financial goals, 2) manage the risks of international transactions, 3) arrange financing for international trade, 4) consolidate and manage the financial flows of the firm, and 5) identify, measure, and manage the firm’s risk exposures.
8.2 What function does a firm’s strategic business plan perform?
The strategic business plan performs the following functions: 1) identify the firm’s core competencies and potential growth opportunities, 2) evaluate the business environment within which the firm operates, 3) formulate a comprehensive strategic plan for turning the firm’s core competencies into sustainable competitive advantages, 4) develop robust processes for implementing the strategic business plan.
8.3 Why is international trade more difficult than domestic trade?
International trade is difficult largely because of information costs. Exporters must ensure timely payment from far-away customers. Importers must ensure timely delivery of quality goods or services. Also, dispute resolution is difficult across multiple jurisdictions.
8.4 Why use a freight forwarder?
A freight shipper coordinates the logistics of transportation and documentation, which can be formidable on international shipments.
8.5 Describe four methods of payment on international sales.
The methods are open account, cash in advance, drafts, and letters of credit. In an open account, the seller bills the buyer upon delivery of the goods. In cash in advance, the buyer pays prior to receiving shipment. A draft is used to pay upon delivery and is like a check or money order. A bank letter of credit guarantees payment upon presentation of the specified trade documents.
8.6 What is a banker’s acceptance, and how is it used in international trade?
A banker’s acceptance is a time draft drawn on a commercial bank in which the bank promises to pay the holder of the draft a stated amount on a specified future date. Banker’s acceptances are negotiable and so may be sold by the exporter to finance working capital.
8.7 What is discounting, and how is it used in international trade?
Discounting is the purchase of a promised payment at a discount from face value.
8.8 How is factoring different from forfaiting?
Factoring is the sale of accounts receivable. Forfaiting is a form of factoring involving medium- to long-term receivables with maturities of six months or more.
8.9 What is countertrade? When is it most likely to be used?
Countertrade involves an exchange of goods or services without the use of cash. It is commonly used in countries with inconvertible currencies, currency controls, or limited reserves of hard currency. Large exporters with significant international experience are more likely to use countertrade as a means of entry into new and developing markets.
8.10 What is multinational netting?
In multinational netting, transactions that offset one another are identified within the corporation.

Kirt C. Butler, Solutions for Multinational Finance, 5th edition (2012), John Wiley & Sons, Inc.
27
Once offsetting transactions are identified, only the net amount of funds need be exchanged.
8.11 How can treasury assist in managing relations among the operating units of the MNC?
Treasury can serve as a “corporate bank” satisfying the financing requirements of the operating units. This central role allows Treasury to net transactions within the corporation and thereby minimize the number and size of external market transactions. Treasury can also direct operating units on transfer pricing issues and identify hurdle rates on new investments.
8.12 What are the five steps in a currency risk management program?
1) Identify those currencies to which the firm is exposed and the distribution of future exchange rates for each of these currencies. 2) Estimate the firm’s sensitivity to changes in these currency values. 3) Determine the desirability of hedging, given the firm’s estimated risk exposures and risk management policy. 4) Evaluate the cost/benefit performance of each hedging alternative, given the forecasted exchange rate distributions. Select and implement the hedging instrument or strategy. 5) Monitor the firm’s evolving exposures and revisit these steps as necessary.
8.13 What is the difference between passive and active currency risk management?
Active management selectively hedges FX exposures depending on the manager’s market view. Passive management does not take a view, but applys the same hedging rule to each exposure.
8.14 What is the difference between technical and fundamental analysis?
Technical analysis uses exchange rate history to predict short-term exchange rate movements. Fundamental analysis uses macroeconomic data to forecast long-term exchange rate movements.
8.15 Are small, medium, or large firms most likely to use derivatives to hedge currency risk? How do firms benchmark their hedges?
Derivatives users tend to be large firms, and typically use the forward rate for benchmarking.
Problem Solutions
8.1 a. A 6% interest rate compounded quarterly is the same as a 1.5% quarterly rate. The net amount payable at maturity is $9,990,000 after subtracting Paribas’ acceptance fee. Fruit of the Loom will receive ($9,990,000)/(1.015) = $9,842,365 if it sells the acceptance to its bank.
b. The all-in cost of the acceptance is ($10,000,000)/($9,842,365)–1 = 1.60% per quarter or an effective annual rate of (1.0160)4–1= 0.0656, or 6.56% per year.
8.2 a. The 2%/month factoring fee of ($10 million)(0.02/month)(3 months) = $600,000 is due at the time the receivables are factored. Fruit of the Loom is giving up accounts receivable with a face amount of $10 million due in three months in exchange for a net amount of $9,400,000.
b. The all-in cost to Fruit of the Loom is ($10,000,000)/($9,400,000)–1 = 0.06383 per quarter or an effective annual rate of (1.06383)4–1 = 0.2808, or 28.08% per year. While this all-in cost seems high, note that Fruit of the Loom has no collection expenses or credit risk on this nonrecourse sale of receivables.
8.3 a. The net amount payable at maturity is $998,000 after subtracting the bank’s acceptance fee. A 5% annual rate compounded quarterly is the same as a 1¼% quarterly rate. Savvy Fare will receive ($998,000)/(1.0125)2 = $973,510 if it sells the acceptance to its bank today.
b. The all-in cost of the acceptance to Savvy Fare is ($1,000,000)/($973,510)–1 = 2.72% per six months or an effective annual rate of (1.0272)2–1= 5.52% per year.
8.4 a. Cash flows faced by Savvy Fare include the following: Face amount of receivable $1,000,000 Less 4% nonrecourse fee –$40,000 Less 1% monthly factoring fee over six months –$60,000 Net amount received $900,000
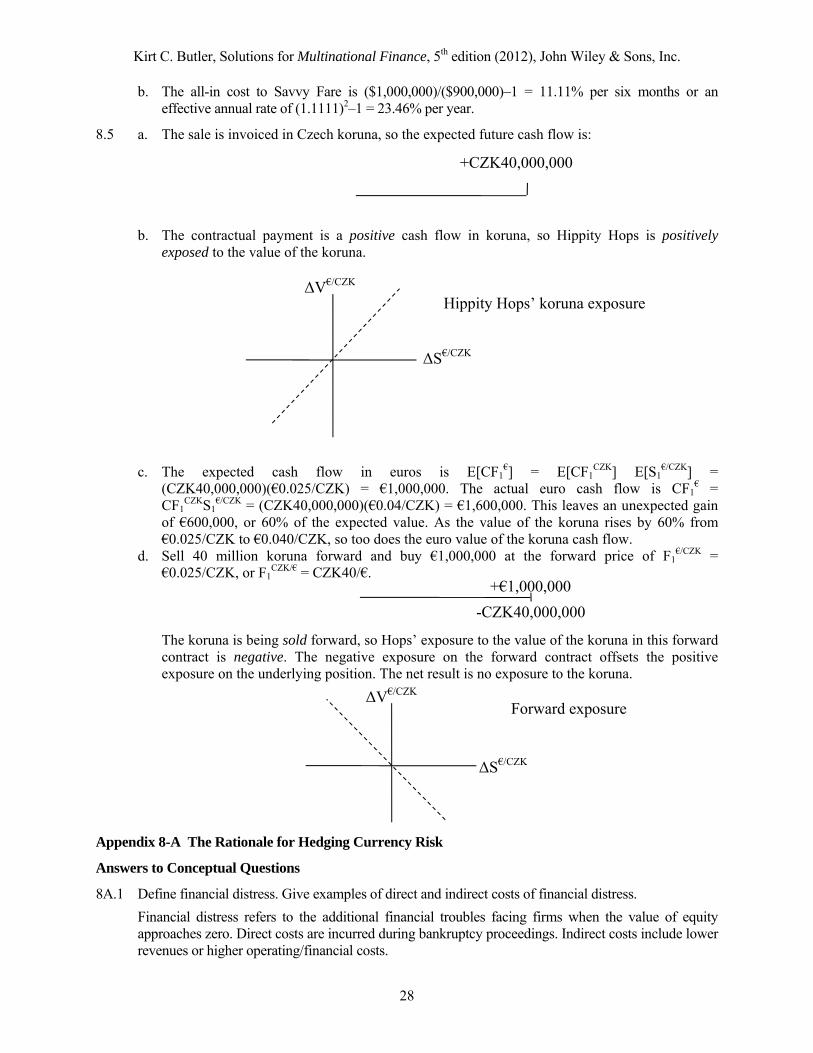
Kirt C. Butler, Solutions for Multinational Finance, 5th edition (2012), John Wiley & Sons, Inc.
28
b. The all-in cost to Savvy Fare is ($1,000,000)/($900,000)–1 = 11.11% per six months or an effective annual rate of (1.1111)2–1 = 23.46% per year.
8.5 a. The sale is invoiced in Czech koruna, so the expected future cash flow is: b. The contractual payment is a positive cash flow in koruna, so Hippity Hops is positively
exposed to the value of the koruna.
c. The expected cash flow in euros is E[CF1
€] = E[CF1CZK] E[S1
€/CZK] = (CZK40,000,000)(€0.025/CZK) = €1,000,000. The actual euro cash flow is CF1
€ = CF1
CZKS1€/CZK = (CZK40,000,000)(€0.04/CZK) = €1,600,000. This leaves an unexpected gain
of €600,000, or 60% of the expected value. As the value of the koruna rises by 60% from €0.025/CZK to €0.040/CZK, so too does the euro value of the koruna cash flow.
d. Sell 40 million koruna forward and buy €1,000,000 at the forward price of F1€/CZK =
€0.025/CZK, or F1CZK/€ = CZK40/€.
The koruna is being sold forward, so Hops’ exposure to the value of the koruna in this forward
contract is negative. The negative exposure on the forward contract offsets the positive exposure on the underlying position. The net result is no exposure to the koruna.
Appendix 8-A The Rationale for Hedging Currency Risk
Answers to Conceptual Questions
8A.1 Define financial distress. Give examples of direct and indirect costs of financial distress.
Financial distress refers to the additional financial troubles facing firms when the value of equity approaches zero. Direct costs are incurred during bankruptcy proceedings. Indirect costs include lower revenues or higher operating/financial costs.
ΔV€/CZK
ΔS€/CZK
Hippity Hops’ koruna exposure
+CZK40,000,000
+€1,000,000
-CZK40,000,000
ΔV€/CZK
ΔS€/CZK
Forward exposure

Kirt C. Butler, Solutions for Multinational Finance, 5th edition (2012), John Wiley & Sons, Inc.
29
8A.2 What is an agency conflict? How can agency costs be reduced?
Agency conflicts arise as managers act in their own interests rather than those of shareholders. Agency costs are the costs of aligning managers’ and shareholders’ objectives. Although currency risk may be diversifiable to shareholders, managers are undiversified and care about currency risk. Allowing managers to hedge exposure to currency risk may reduce agency conflicts.
Problem Solutions
8A.1 a. At $6,000 in taxable income, debt receives $4,000 and equity receives nothing. At $16,000 in taxable income, debt receives $10,000 and equity receives $6,000. b. Firm value as a combination of debt plus equity:
c. Unhedged E[VBonds] = (½)($6,000–$2,000) + (½)($10,000) = $7,000 + E[VStock] = (½)($0) + (½)($6,000) = $3,000 E[VFirm] = (½)($6,000–$2,000) + (½)($16,000) = $10,000 Hedged E[VBonds] = $10,000 + E[VStock] = $1,000 E[VFirm] = $11,000 Firm value rises from $10,000 when unhedged to $11,000 when hedged. Hedging results in a
$3,000 increase in the value of debt and a $2,000 decrease in the value of equity, for a net gain of $1,000. The $1,000 net gain is captured by avoiding the ½ probability of a $2,000 deadweight bankruptcy cost.
Whether equity chooses to hedge in this circumstance depends on whether the gain in firm value is more or less than the shift in value from equity to debt from the reduction in risk.
In this example, debt gains at equity’s expense. The $3,000 shift in value from equity to debt is less than the $1,000 net gain to the firm, so equity bears the $2,000 net loss. In the absence of a renegotiation of the debt contract, equity would choose to leave its currency risk exposure unhedged.
VBonds + VStock = VBonds + Stock
+ =
$10,000 $10,000 $10,000
$6,000 $16,000
Firm value

Kirt C. Butler, Solutions for Multinational Finance, 5th edition (2012), John Wiley & Sons, Inc.
30
8A.2 a.
b. Unhedged E[VBonds] = (½)($4,000–$2,000) + (½)($10,000) = $6,000 + E[VStock] = (½)($0) + (½)($4,000) = $2,000 E[VFirm] = (½)($4,000–$2,000) + (½)($14,000) = $8,000
In this example, hedging can keep the firm solvent and avoid all of the costs of bankruptcy. Hedged value is then $11,000 with certainty as in Problems 9.2 and 9.3. Payoffs are as follows:
Hedged E[VBonds] = $10,000 + E[VStock] = $1,000 E[VFirm] = $11,000
c. Hedging avoids the $2,000 indirect cost as well as the ½ probability of a $2,000 direct cost, resulting in a stakeholder gain of $3,000. Bondholders would prefer to hedge and lock in $10,000, resulting in a gain of $4,000 over the unhedged situation. Equity locks in a value of $1,000, resulting in an expected loss of $1,000 relative to the unhedged situation. If equity is risk neutral, they will prefer to remain unhedged and face a 50 percent chance of having a $4,000 payout.
Equity can gain from hedging in this situation. In particular, if equity can renegotiate the bond contract in these examples, then they can more evenly share the gain in firm value with the debt. Alternatively, equity can pre-negotiate a smaller promised payment to debt (resulting in a lower required return and hence cost of capital) by establishing and maintaining a risk-hedging program. Again, this will allow equity to share in any gain from reducing the probability and costs associated with financial distress.
8A.3 a. If firm value is £9,000, equity will not exercise its option to buy the firm at a price of £10,000. In this case, equity receives nothing and debt receives £9,000. If the firm is worth £19,000, equity pays bondholders £10,000 and retains the residual £9,000. Firm value is E[VFIRM] = E[VBONDS] + E[VSTOCK] = [(½)(£9,000) + (½)(£10,000)] + [(½)(£0)+(½)(£9,000)] = £9,500 + £4,500 = £14,000.
Hedged, firm value is VFIRM = VBONDS + VSTOCK = £10,000 + £4,000 = £14,000. The reduction in the variability of firm value results in a reduction in call option value and a £500 shift in value from equity to debt.
b. Unhedged, firm value is decomposed as: E[VFIRM] = E[VBONDS] + E[VSTOCK] = [(½)(£9,000–£1,000) + (½)(£10,000)] + [(½)(£0) + (½)(£9,000)] = £9,000 + £4,500 = £13,500. With hedging, VFIRM = VBONDS + VSTOCK = £10,000 + £4,000 = £14,000. As in the previous example, there is a reduction in the variability of firm value and an accompanying £500 transfer of wealth from equity to debt. Hedging also avoids the deadweight £1,000 bankruptcy cost and yields a higher expected payoff in the amount of (½)(£1,000) = £500. In this example, debt captures the expected gain of £500. Equity may capture some of the gain if hedging results in lower interest payments
VBonds + VStock = VBonds + Stock
+ =
$10,000 $10,000 $10,000
$4,000 $14,000
Firm value

Kirt C. Butler, Solutions for Multinational Finance, 5th edition (2012), John Wiley & Sons, Inc.
31
on the next round of debt.
c. Unhedged, firm value is E[VFIRM] = E[VBONDS] + E[VSTOCK] = [(½)(£6,000–£1,000) + (½)(£10,000)] + [(½)(£0) + (½)(£8,000)] = £7,500 + £4,000 = £11,500. If the firm hedges, then VFIRM = VBONDS + VSTOCK = £10,000 + £4,000 = £14,000. This is the same as in b after including indirect costs of financial distress with an expected value of [(½)(£9,000–£6,000) + (½)(£19,000–£18,000)] = £1,500+£500 = £2,000.

Kirt C. Butler, Solutions for Multinational Finance, 5th edition (2012), John Wiley & Sons, Inc.
32
Chapter 9 Managing Transaction Exposure to Currency Risk
Answers to Conceptual Questions
9.1 What is transaction exposure to currency risk?
Transaction exposure is change in the value of monetary (contractual) cash flows due to an unexpected change in exchange rates.
9.2 What is a risk profile?
A risk profile graphically displays change in the value of an underlying currency exposure to change in the value of the underlying currency, such as ΔVd/f as a function of ΔSd/f. Risk profiles can be displayed in levels or in changes in levels.
9.3 In what ways can diversified multinational operations provide a natural hedge of transaction exposure to currency risk?
Geographically diversified multinational corporations have relatively low transaction exposure to currency risk when they have cash inflows and outflows in a wide variety of currencies. Geographically diversified operations provide opportunities to reduce the multinational corporation’s currency risk exposures through multinational netting and leading and lagging of intracompany transactions.
9.4 What is multinational netting? Why is it used by multinational corporations?
In multinational netting, a corporation’s exposure to currency risk is found by consolidating and then netting the exposures of individual assets and liabilities. Multinational netting reduces the transactions costs of hedging individual currency risk exposures in external financial markets.
9.5 What is leading and lagging? Why is it used by multinational corporations?
Leading and lagging is a way to reduce the firm’s transaction exposure by altering the timing of cash flows within the corporation. Like multinational netting, leading and lagging works best when the currency needs of the individual units within the corporation offset one another.
9.6 Define each of the following: a) currency forwards, b) currency futures, c) currency options, d) currency swaps, and e) money market hedges.
Currency forwards are contracts for future delivery according to an agreed-upon delivery date, exchange rate, and amount. Exchange-traded currency futures contracts are similar to forwards except that changes in value are settled daily as the two sides of the contract are marked-to-market. A currency option contract gives the option holder the right to buy or sell an underlying currency at a specified price and on a specified date. A currency swap is a contractual agreement to exchange a principal amount of two different currencies and, after a prearranged length of time, to give back the original principal. A money market hedge replicates a currency forward contract through the spot currency and Eurocurrency markets.
9.7 What is a currency cross-hedge? Why might it be used?
A currency cross-hedge uses a currency that is different from, but closely related to, the currency of the underlying exposure. It is used when the underlying exposure is in an illiquid or thinly traded currency.
9.8 Do many firms actively manage their currency risk exposures?
Surveys of financial managers indicate that a majority of managers employ their market view in their currency risk management practices.

Kirt C. Butler, Solutions for Multinational Finance, 5th edition (2012), John Wiley & Sons, Inc.
33
Problem Solutions
9.1. Paying affiliate Total Net Net Receiving affiliate U.S. Can. Mex. P.R. Receipts Receipts Payments United States 0 $300 $500 $600 $1400 $100 $0 Canadian $500 0 $400 $200 $1100 $0 $800 Mexican $400 $700 0 $200 $1300 $0 $0 Puerto Rican $400 $900 $400 0 $1700 $700 $0
Total payments $1300 $1900 $1300 $1000 0 $800 $800
9.2 Paying affiliate Net Net Receiving affiliate U.S. Can. Mex. P.R. Total receipts Receipts Payments United States 0 $800 $300 $400 $1500 $600 $0 Canadian $600 0 $300 $700 $1600 $0 $700 Mexican $100 $900 0 $800 $1800 $600 $0 Puerto Rican $200 $600 $600 0 $1400 $0 $500
Total payments $900 $2300 $1200 $1900 0 $1200 $1200
Here is one possible set of settling transactions.
9.3 a. Underlying long euro exposure
U.S.affiliate
Canadianaffiliate
Mexicanaffiliate
Puerto Ricanaffiliate
$500$100
$600
V$/€
V0$/€
S0$/€
S$/€
v$/€
s$/€

Kirt C. Butler, Solutions for Multinational Finance, 5th edition (2012), John Wiley & Sons, Inc.
34
b. Hedges: i) A short euro forward hedge can exactly offset the underlying exposure.
ii) Short euro futures have the same exposure as the forward, although the gain or loss on the
futures is settled daily whereas the loss or gain on the underlying position accrues at maturity. iii) A money market hedge
Borrow an amount such that €1 million isdue in one period at an interest rate of i€
Convert to dollars at today’s spot rate S0$/€
Invest this amount at i$
+( €1m)/(1+i€)
-( €1 million)
Money market hedge
+($x)/(1+i$)
-($x)/(1+i$)
+($x)
-( €1m)/(1+i€)-( €1 million)
+($x)
In the absence of transactions costs, this money market hedge has the same payoff as a
forward contract according to interest rate parity; F1$/€ = S0
$/€(1+i$)/(1+i€).
Short euro forward contract
S$/€
V$/€
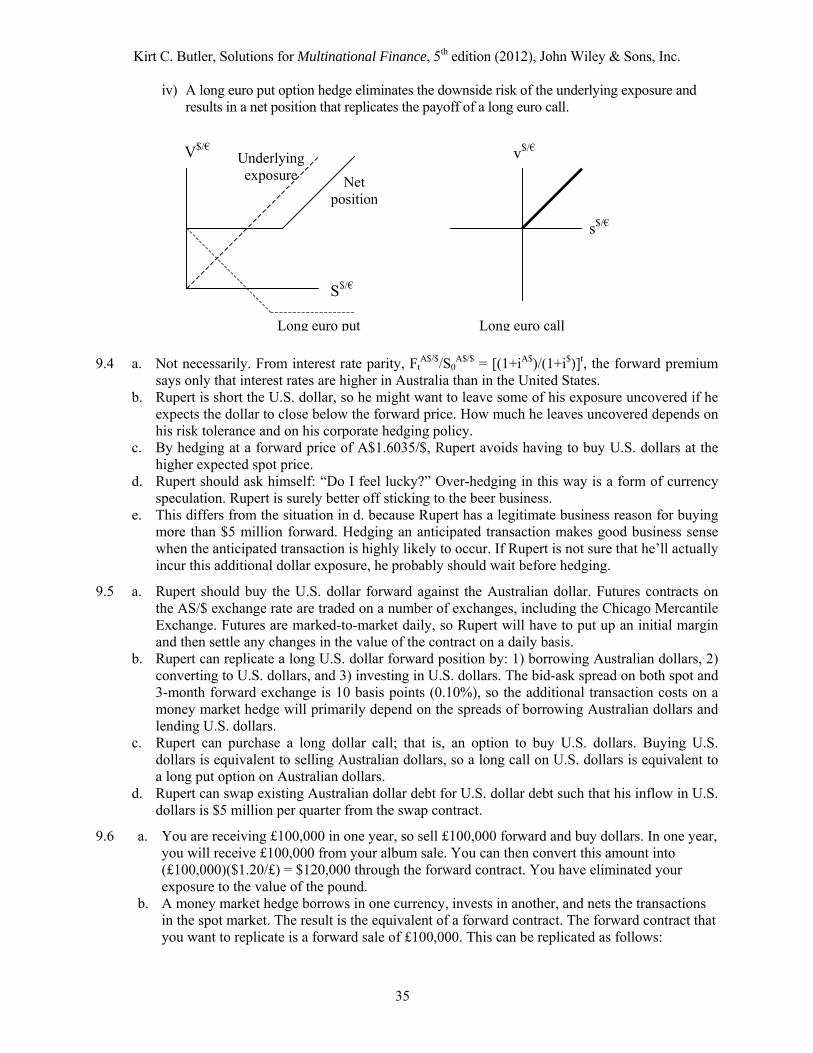
Kirt C. Butler, Solutions for Multinational Finance, 5th edition (2012), John Wiley & Sons, Inc.
35
iv) A long euro put option hedge eliminates the downside risk of the underlying exposure and results in a net position that replicates the payoff of a long euro call.
9.4 a. Not necessarily. From interest rate parity, Ft
A$/$/S0A$/$ = [(1+iA$)/(1+i$)]t, the forward premium
says only that interest rates are higher in Australia than in the United States. b. Rupert is short the U.S. dollar, so he might want to leave some of his exposure uncovered if he
expects the dollar to close below the forward price. How much he leaves uncovered depends on his risk tolerance and on his corporate hedging policy.
c. By hedging at a forward price of A$1.6035/$, Rupert avoids having to buy U.S. dollars at the higher expected spot price.
d. Rupert should ask himself: “Do I feel lucky?” Over-hedging in this way is a form of currency speculation. Rupert is surely better off sticking to the beer business.
e. This differs from the situation in d. because Rupert has a legitimate business reason for buying more than $5 million forward. Hedging an anticipated transaction makes good business sense when the anticipated transaction is highly likely to occur. If Rupert is not sure that he’ll actually incur this additional dollar exposure, he probably should wait before hedging.
9.5 a. Rupert should buy the U.S. dollar forward against the Australian dollar. Futures contracts on the AS/$ exchange rate are traded on a number of exchanges, including the Chicago Mercantile Exchange. Futures are marked-to-market daily, so Rupert will have to put up an initial margin and then settle any changes in the value of the contract on a daily basis.
b. Rupert can replicate a long U.S. dollar forward position by: 1) borrowing Australian dollars, 2) converting to U.S. dollars, and 3) investing in U.S. dollars. The bid-ask spread on both spot and 3-month forward exchange is 10 basis points (0.10%), so the additional transaction costs on a money market hedge will primarily depend on the spreads of borrowing Australian dollars and lending U.S. dollars.
c. Rupert can purchase a long dollar call; that is, an option to buy U.S. dollars. Buying U.S. dollars is equivalent to selling Australian dollars, so a long call on U.S. dollars is equivalent to a long put option on Australian dollars.
d. Rupert can swap existing Australian dollar debt for U.S. dollar debt such that his inflow in U.S. dollars is $5 million per quarter from the swap contract.
9.6 a. You are receiving £100,000 in one year, so sell £100,000 forward and buy dollars. In one year, you will receive £100,000 from your album sale. You can then convert this amount into (£100,000)($1.20/£) = $120,000 through the forward contract. You have eliminated your exposure to the value of the pound.
b. A money market hedge borrows in one currency, invests in another, and nets the transactions in the spot market. The result is the equivalent of a forward contract. The forward contract that you want to replicate is a forward sale of £100,000. This can be replicated as follows:
V$/€ Underlying exposure
S$/€
v$/€
s$/€
Net position
Long euro put Long euro call

Kirt C. Butler, Solutions for Multinational Finance, 5th edition (2012), John Wiley & Sons, Inc.
36
Borrow (£100,000)/(1+i£) = £89,638 at the i£ = 11.56% pound sterling interest rate.
Convert to (£89,638)($1.25/£) = $112,047 at S0
$/£ = $1.25/£.
Invest in dollars at the U.S. dollar rate of i$ = 9.82%.
The net result is a forward contract to buy dollars with pounds.
Note that this is on more favorable terms than the forward contract. Forward prices are not in
equilibrium with the interest rate differential. In this situation, it is cheaper to hedge through the money markets than through the forward market.
c. These markets are not in equilibrium. F1$/£/S0
$/£ = ($1.20/£)/($1.25/£) = 0.96 < =0.98440 = (1.0982)/(1.1156) = (1+i$)/(1+i£), so you should buy pounds at the relatively low forward price, sell pounds at the relatively high spot price, invest in dollars at the relatively high dollar interest rate, and borrow pounds at the relatively low pound interest rate.
£89,638
-£100,000
+$112,047
-£89,638
-$112,047
$123,050
+£100,000
-$123,050
Kirt C. Butler, Solutions for Multinational Finance, 5th edition (2012), John Wiley & Sons, Inc.
37
Chapter 10 Managing Operating Exposure to Currency Risk
Answers to Conceptual Questions
10.1 What is operating exposure to currency risk, and why is it important?
A firm has operating exposure to currency risk when the value of its nonmonetary (real) cash flows changes with unexpected changes in currency values.
10.2 In a discounted cash flow framework, in what ways can operating risk affect the value of the multinational corporation?
Operating exposure (indeed, currency exposure generally) affects value either through the cash flows or the discount rate in the valuation equation Vd = Σt E[CFt
d]/(1+id)t.
10.3 What is an integrated market? a segmented market? Why is this distinction important in multinational financial management?
Purchasing power parity holds in an integrated market for goods, services, or financial assets. This means that equivalent assets trade for the same price. A market is segmented if purchasing power parity does not hold. Companies operating in segmented markets have prices that are locally determined. Companies operating in integrated markets face prices that are globally determined.
10.4 State how each of the following companies are affected by a real depreciation of the domestic currency: a) an importer, b) an exporter, c) a diversified multinational corporation competing in globally competitive goods and financial markets.
a) The classic exporter faces costs that are locally determined in segmented markets and revenues that are globally determined in integrated markets, resulting in a positive exposure to the foreign currency. b) The classic importer buys goods in integrated global markets and sell them in segmented local markets, resulting in a negative exposure to foreign currency values. A real depreciation of the foreign currency hurts the exporter and helps the importer. c) Multinational corporations operating in integrated global input and output markets have foreign currency exposures in both revenues and costs. The net exposure of the multinational corporation depends on the balance between its import and export activities.
10.5 What is meant by the statement “Exposure is a regression coefficient?”
Exposure is measured by the slope coefficient in the regression rtd = αd + βf st
d/f + etd. The
regression coefficient βf captures the sensitivity of an asset (such as a share of common stock) to changes in exchange rates.
10.6 Suppose the correlation of a share of stock with a foreign currency value is +0.10. Calculate the r-square. What does it tell you?
R-square is the square of the correlation coefficient, so (0.10)2 = 0.01. One percent of the variation in share price comes from variation in the foreign currency value.
10.7 Define net monetary assets. Why is this measure important?
Net monetary assets are monetary (or contractual) assets less monetary liabilities. The firm’s net transaction exposure depends on its net monetary assets.
10.8 List several financial market alternatives for hedging operating exposure to currency risk. How effective are these in hedging the nonmonetary cash flows of real assets? Why might firms hedge through the financial markets rather than through changes in operations?
Financial market hedges of operating exposure include: a) foreign borrowings or lendings, b) long-dated forward foreign currency contracts, c) currency swaps, and d) roll-over hedges (a series of short-term forward contracts). Although these contractual hedges are easy to do and undo, contractual cash flows are less than satisfactory in hedging the uncertain cash flows of the firm’s real assets.

Kirt C. Butler, Solutions for Multinational Finance, 5th edition (2012), John Wiley & Sons, Inc.
38
10.9 List several operating strategies for hedging operating risk. What are the advantages and disadvantages of these hedges compared to financial market hedges?
Operating strategies for hedging currency risk exposures include: (a) product sourcing decisions, (b) plant location decisions, and (c) market selection and promotion strategies. Although operating hedges are likely to be more effective than financial market hedges for managing operating exposures, they are also more costly and more difficult to reverse.
10.10 What is the price elasticity of demand, and why is it important?
The price elasticity of demand is defined as minus the percentage change in quantity demanded for a given percentage change in price, –(ΔQ/Q)/(ΔP/P). The price elasticity of demand determines whether and how much revenues will increase or decrease with a given change in price.
10.11 What five steps are involved in estimating the impact of exchange rate changes on the value of the firm’s real assets or on the value of equity?
The five steps are: a) Identify the distribution of future exchange rates, b) estimate the sensitivity of revenues and operating expenses to changes in exchange rates, c) determine the desirability of hedging, given the firm’s risk management policy, d) identify the hedging alternatives and evaluate the cost/benefit performance of each alternative, given the forecasted exchange rate distributions, and e) monitor the position and revisit steps 1 through 4 as necessary.
Problem Solutions
10.1 Operating exposure to currency risk is more difficult to measure than transaction exposure because the values of exposed real assets do not vary one-for-one with exchange rate changes as exposed monetary assets and liabilities do. Weak relations (i.e. low r-squares) between asset and currency values make financial market hedges of operating exposures less than perfect. Operating hedges might be more effective, but they are also more difficult to implement.
10.2 a. Sterling & Co. has exposed monetary assets of $30,000 and exposed monetary liabilities of $45,000+$90,000 = $135,000. Net monetary assets of –$105,000 are exposed to the dollar.
b. A 10 percent dollar appreciation will change the pound value of Sterling & Co. by (0.10)(£0.66667/$)(–$105,000) = –£7,000. Exposed monetary assets and liabilities change in value one-for-one with changes in exchange rates, so the r-square of this relation is +1, or 100 percent.
c. The sensitivity of plant and equipment to the value of the dollar is β$ = ρr,s(σr/σs) = (0.10)(0.20/0.10) = +0.2. A 10 percent appreciation of the dollar is likely to increase the pound value of Sterling’s plant and equipment by 0.2(10%) = 2 percent or $1,600, from £80,000 to £81,600. The relation between real asset value and the exchange rate is not very strong. The r-square is (0.10)2 = 0.01, so 1 percent of the variation in real asset value is explained by variation in the value of the dollar.
d. Equity exposure is equal to the net exposure of monetary assets and liabilities plus the exposure of real assets, or (–£7,000) + £1,600 = –£5,400.
e. Sterling’s use of long-term dollar liabilities tends to offset the positive exposure of its real assets. However, the quality or effectiveness of this hedge is poor because the low r-square on the real asset side does not exactly match the one-for-one exposure on the liability side.
f. The sunk entry costs of this operating hedge are high. Opening a U.S. plant would entail renting or buying a U.S. site, hiring local (U.S.) artisans or bringing U.K. expatriates into the United States, and perhaps moving an existing supervisor from the United Kingdom to the United States as well. It will be difficult for Sterling & Co. to manage its U.S. operations as effectively as it manages its U.K. operations. Sterling should undertake this operating hedge if and only if it makes good business sense. The dollar exposure should not be the deciding factor.

Kirt C. Butler, Solutions for Multinational Finance, 5th edition (2012), John Wiley & Sons, Inc.
39
10.3 a. Monetary assets = Cash ($) + Accts receivable ($) + Accts receivable (€) = $40,000 + $30,000 + $60,000 = $130,000. Monetary liabilities = Wages ($) + Accts payable ($) + Bank note (€) + Bank note (€) = $40,000 + $70,000 + $10,000 + $50,000 = $170,000. Net monetary assets = Monetary assets less monetary liabilities = $130,000 – $170,000 = –$40,000. b. Monetary assets exposed to currency risk = Accts receivable (euros) = $60,000. Monetary liabilities exposed to currency risk = Bank note due (€) + Bank note (€) = $10,000 + $50,000 = $60,000. Net monetary assets exposed to currency risk = Exposed monetary assets less exposed monetary liabilities = $60,000 – $60,000 = $0, so there is no net transaction exposure to the euro. c. The negative euro exposure of the euro bank note offsets the positive exposure of the euro
receivables, and hence reduces the firm’s net exposure to the euro. d. Even though the firm has no net transaction exposure, this exporter’s real assets (i.e. plant and
equipment) are likely to have a positive operating exposure to the euro.
10.4 Low currency risk exposures for U.S. firms means that U.S. investors are more likely than investors in other countries to be able to diversify away currency risk. This also suggests that currency risk management is more important outside the United States than within the United States.
10.5 Figure 10.5 is reconstructed for a ¥50 million forward hedge as follows.
Uncertain yen revenues
Underlying revenues in yen +¥50 million +¥100 million +¥150 million
Cash flows of the forward hedge long dollars +$500,000 +$500,000 +$500,000 short yen –¥50 million –¥50 million –¥50 million
Net position in dollars +$500,000 +$500,000 +$500,000 in yen +¥0 +¥50 million +¥100 million
Exchange rate uncertainty at revenues of ¥50 million
Underlying revenues in yen +¥50 million +¥50 million +¥50 million
Cash flows of the forward hedge long dollars +$500,000 +$500,000 +$500,000 short yen –¥50 million –¥50 million –¥50 million
Net position in dollars +$500,000 +$500,000 +$500,000 in yen ¥0 ¥0 ¥0
Actual exchange rate $0.005/¥ $0.010/¥ $0.015/¥
Actual revenues in dollars +$500,000 +$500,000 +$500,000
Exchange rate uncertainty at revenues of ¥150 million
Underlying revenues in yen +¥150 million +¥150 million +¥150 million
Cash flows of the forward hedge long dollars +$500,000 +$500,000 +$500,000 short yen –¥50 million –¥50 million –¥50 million
Net position in dollars +$500,000 +$500,000 +$500,000 in yen +¥100 million +¥100 million +¥100 million
Actual exchange rate $0.005/¥ $0.010/¥ $0.015/¥
Actual revenues in dollars +$1,000,000 +$1,500,000 +$2,000,000

Kirt C. Butler, Solutions for Multinational Finance, 5th edition (2012), John Wiley & Sons, Inc.
40
The partial hedge of –¥50 million is a perfect hedge when yen revenues are ¥50 million. When yen revenues are ¥150 million, the –¥50 million hedge isn’t nearly large enough and the range of dollar outcomes is twice as large as in the text example.
10.6 Figure 10.6 is reconstructed for this problem as follows.
Twenty percent depreciation of the pound to $1.20/£
Maintain £4 price Maintain $6 price
Sales volume Elastic demand Inelastic demand Base case $1.50/£ remains constant Sell 50% less Sell 10% less
£ $ £ $ £ $ £ $
Price £4.00 $6.00 £4.00 $4.80 £5.00 $6.00 £5.00 $6.00 Cost £2.00 $3.00 £2.50 $3.00 £2.50 $3.00 £2.50 $3.00 Sales volume 20,000 20,000 20,000 20,000 10,000 10,000 18,000 18,000
Revenues £80,000 $120,000 £80,000 $96,000 £50,000 $60,000 £90,000 $108,000 - COGS –40,000 –60,000 –50,000 –60,000 –25,000 –30,000 –45,000 –54,000 Taxable income 40,000 60,000 30,000 36,000 25,000 30,000 45,000 54,000 - Tax (at 50%) –20,000 –30,000 –15,000 –18,000 –12,500 –15,000 –22,500 –27,000
Net cash flow 20,000 30,000 15,000 18,000 12,500 15,000 22,500 27,000
Value of Tao £200,000 $300,000 £150,000 $180,000 £125,000 $150,000 £225,000 $270,000
Percentage change –25% –40% –37.5% –50% 12.5% –10%
a. If Dow maintains its £4 price, value will fall by 25 percent in pounds and by 40 percent in dollars. This sets the benchmark for proposed changes in the pound price.
b. If Dow maintains its $6 price (resulting in a £5 price in the U.K.), value will fall by 37.5 percent in pounds and by 50 percent in dollars. With price elastic demand, Dow should maintain its £4 price to minimize the impact on its dollar value.
c. If Dow maintains its $6 price, value will rise by 12.5 percent in pounds and fall by 10 percent in dollars. With price inelastic demand, Dow should maintain its $6 price to minimize the impact on its dollar value.
Kirt C. Butler, Solutions for Multinational Finance, 5th edition (2012), John Wiley & Sons, Inc.
41
Chapter 11 Managing Translation Exposure and Accounting for Financial Transactions
Answers to Conceptual Questions
11.1 List the translation accounting rules of the U.S. standard FAS #52 “Foreign Currency Translation”.
All assets and liabilities except equity are translated at the current exchange rate. Equity is translated at historical exchange rates. Income statement items are translated at the current exchange rate. Gains or losses caused by translation adjustments are put in a cumulative translation adjustment account in the equity section of the balance sheet.
11.2 For which accounts does FAS #52 do a good job? For which accounts is it less believable?
FAS #52 correctly values monetary assets and liabilities. By translating real assets at the current exchange rate, FAS #52 assumes real assets are exposed one-for-one to the value of the local currency. This is a simplification, because the operating exposure of the foreign subsidiary’s real assets may or may not be exposed one-for-one.
11.3 According to theory, what determines whether an exposure to currency risk should be hedged?
Finance theory states that the firm should only consider hedging risk exposures that are related to firm value. There is no value in hedging noncash transactions that do not cost or risk cash.
11.4 List three information-based reasons for hedging a translation exposure to currency risk.
Information-based reasons include: (a) satisfying loan covenants, (b) meeting profit forecasts, and (c) retaining a credit rating. Each justification relies on informational asymmetries between corporate insiders and outsiders, presumably arising from costly or restricted access to information on the part of investors or information providers.
11.5 How can corporate hedging of translation exposure reduce the agency conflict between managers and other stakeholders? In what other ways can agency conflicts be reduced?
If managers are evaluated based on accounting performance rather than on the value they add to the firm, then allowing them to hedge can remove this source of risk from their deliberations and help align managerial incentives with shareholder objectives.
11.6 Identify several cross-border differences in corporate hedging of translation exposure? What might account for these differences.
Studies document higher derivatives usage as well as a greater willingness to hedge translation exposure to currency risk outside the U.S. than within the United States. It could be that non-U.S. managers are either more exposed to currency risk or more risk averse given their exposures.
11.7 Recommend general policies for deciding whether to hedge a translation exposure to currency risk.
(a) In general, only economic exposures should be hedged. (b) Financing foreign operations with foreign capital can reduce both translation and economic exposures. (c) To the extent possible, insulate managers’ performance evaluations from currency risk. (d) If hedging translation exposure is necessary to align managers with shareholders, then individual units should be charged market prices for these hedges. (e) The treasury should hedge internally whenever possible.
11.8 Describe the rules of FAS #133 “Accounting for Derivative Instruments and Hedging Activities.”
(a) Derivatives should be reported in the financial statements. (b) Market value is the most relevant measure of value. (c) Only assets and liabilities should be reported on the balance sheet. Income and expenses should be reported on the income statement. (d) Special accounting rules should be limited to qualifying hedge transactions.
11.9 What are the advantages and disadvantages of valuing assets and liabilities at historical cost? At market value?
From a financial point of view, assets and liabilities are ideally reported at market values because

Kirt C. Butler, Solutions for Multinational Finance, 5th edition (2012), John Wiley & Sons, Inc.
42
market values reflect true values formed by a consensus of market participants. However, market values are not observable for nontraded assets such as privately held equity. In these cases, historical costs provide reliable, verifiable values that can be consistently applied across business situations.
11.10 How did accounting standard setters react to the derivatives-related failures of the 1990s?
The short-term response was to require increased disclosure of derivative transactions. Most nations are also moving toward market value accounting for derivatives, often with special accounting rules for hedge transactions.
11.11 What is the IASB? Over which organizations does it have jurisdiction?
The IASB is an international committee charged with harmonizing accounting standards. The IASB doesn’t have jurisdiction over any national accounting bodies. It provides a forum where national standard-setting bodies can develop a set of core standards for companies raising capital or listing securities internationally, so that international investors can evaluate the risks and performance of the companies in which they invest. Many multinational corporations use the IASB’s standards to report their financial performance to international investors.
11.12 What is a hedge? Why is it difficult to distinguish a hedge from a speculative position. How does the United States’ FAS #133 qualify a hedge?
Whether a derivatives position is a hedge or a speculative position depends on whether the derivatives position is taken to offset an underlying exposure. The difficulty is that underlying exposures range from clearly exposed positions (such as a foreign currency accounts payables) to less obviously exposed positions (such as an anticipated but still speculative sale denominated in a forward currency). To qualify for hedge accounting treatment under FASB #133 (and the proposed standards of the U.K. and the IASC), a hedge must be clearly defined, measurable, and effective. The linkage between the exposed position and the hedge must then be carefully and fully documented.
Problem Solutions
11.1 Balance sheets Translated value at $0.80/€ Value at Current/ Assets € value $1.00/€ Noncurrent Temporal Current Cash €50,000 $50,000 $40,000 $40,000 $40,000 A/R €30,000 $30,000 $24,000 $24,000 $24,000 Inventory €20,000 $20,000 $16,000 $16,000 $16,000 P&E €900,000 $900,000 $900,000 $900,000 $720,000 Total assets €1,000,000 $1,000,000 $980,000 $980,000 $800,000
Liabilities A/P €125,000 $125,000 $100,000 $100,000 $100,000 ST debt €75,000 $75,000 $60,000 $60,000 $60,000 LT debt €750,000 $750,000 $750,000 $600,000 $600,000 Net worth €50,000 $50,000 $70,000 $220,000 $40,000 Total liabs €1,000,000 $1,000,000 $980,000 $980,000 $800,000
a) Net exposed assets: = ($50,000+$30,000+$20,000+$900,000) – ($125,000+$75,000+$750,000) = $1,000,000–$950,000 = +$50,000.
b) Translation gain or loss (note that the dollar is in the numerator) = (–0.2)(+$50,000) = –$10,000.
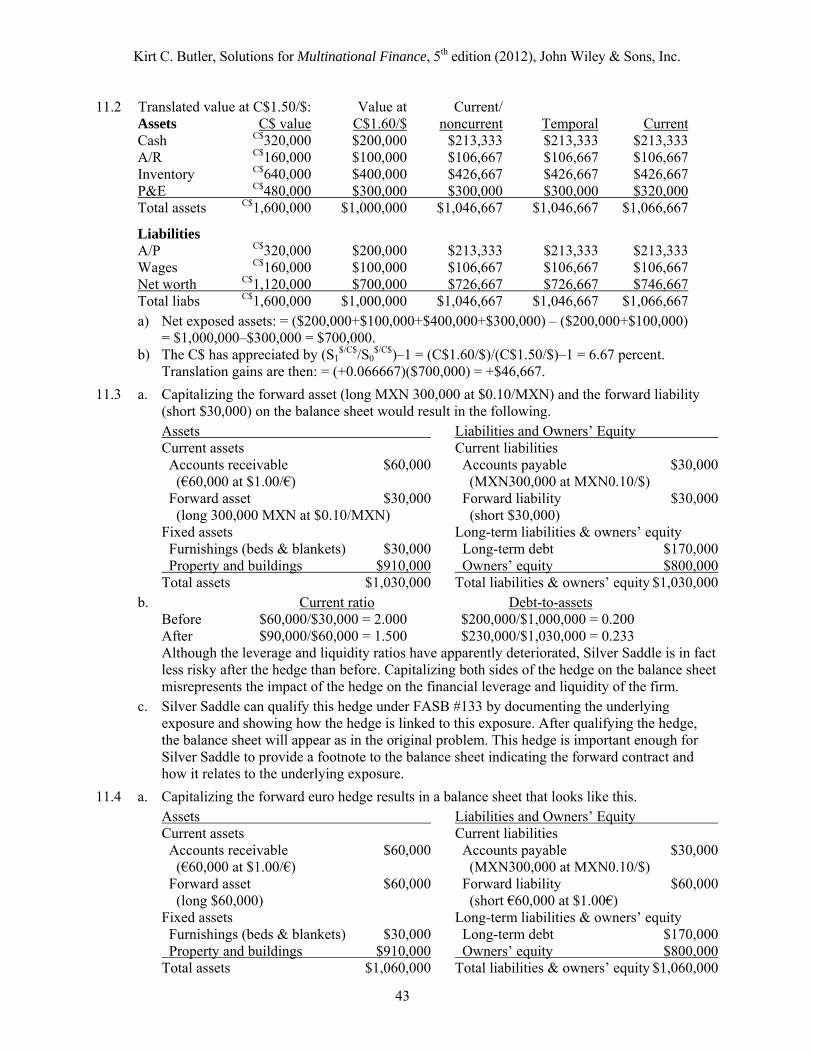
Kirt C. Butler, Solutions for Multinational Finance, 5th edition (2012), John Wiley & Sons, Inc.
43
11.2 Translated value at C$1.50/$: Value at Current/
Assets C$ value C$1.60/$ noncurrent Temporal Current Cash C$320,000 $200,000 $213,333 $213,333 $213,333 A/R C$160,000 $100,000 $106,667 $106,667 $106,667 Inventory C$640,000 $400,000 $426,667 $426,667 $426,667 P&E C$480,000 $300,000 $300,000 $300,000 $320,000 Total assets C$1,600,000 $1,000,000 $1,046,667 $1,046,667 $1,066,667
Liabilities A/P C$320,000 $200,000 $213,333 $213,333 $213,333 Wages C$160,000 $100,000 $106,667 $106,667 $106,667 Net worth C$1,120,000 $700,000 $726,667 $726,667 $746,667 Total liabs C$1,600,000 $1,000,000 $1,046,667 $1,046,667 $1,066,667
a) Net exposed assets: = ($200,000+$100,000+$400,000+$300,000) – ($200,000+$100,000) = $1,000,000–$300,000 = $700,000.
b) The C$ has appreciated by (S1$/C$/S0
$/C$)–1 = (C$1.60/$)/(C$1.50/$)–1 = 6.67 percent. Translation gains are then: = (+0.066667)($700,000) = +$46,667.
11.3 a. Capitalizing the forward asset (long MXN 300,000 at $0.10/MXN) and the forward liability (short $30,000) on the balance sheet would result in the following.
Assets Liabilities and Owners’ Equity Current assets Current liabilities Accounts receivable $60,000 Accounts payable $30,000 (€60,000 at $1.00/€) (MXN300,000 at MXN0.10/$) Forward asset $30,000 Forward liability $30,000 (long 300,000 MXN at $0.10/MXN) (short $30,000) Fixed assets Long-term liabilities & owners’ equity Furnishings (beds & blankets) $30,000 Long-term debt $170,000 Property and buildings $910,000 Owners’ equity $800,000 Total assets $1,030,000 Total liabilities & owners’ equity $1,030,000
b. Current ratio Debt-to-assets Before $60,000/$30,000 = 2.000 $200,000/$1,000,000 = 0.200 After $90,000/$60,000 = 1.500 $230,000/$1,030,000 = 0.233 Although the leverage and liquidity ratios have apparently deteriorated, Silver Saddle is in fact
less risky after the hedge than before. Capitalizing both sides of the hedge on the balance sheet misrepresents the impact of the hedge on the financial leverage and liquidity of the firm.
c. Silver Saddle can qualify this hedge under FASB #133 by documenting the underlying exposure and showing how the hedge is linked to this exposure. After qualifying the hedge, the balance sheet will appear as in the original problem. This hedge is important enough for Silver Saddle to provide a footnote to the balance sheet indicating the forward contract and how it relates to the underlying exposure.
11.4 a. Capitalizing the forward euro hedge results in a balance sheet that looks like this.
Assets Liabilities and Owners’ Equity Current assets Current liabilities Accounts receivable $60,000 Accounts payable $30,000 (€60,000 at $1.00/€) (MXN300,000 at MXN0.10/$) Forward asset $60,000 Forward liability $60,000 (long $60,000) (short €60,000 at $1.00€) Fixed assets Long-term liabilities & owners’ equity Furnishings (beds & blankets) $30,000 Long-term debt $170,000 Property and buildings $910,000 Owners’ equity $800,000 Total assets $1,060,000 Total liabilities & owners’ equity $1,060,000
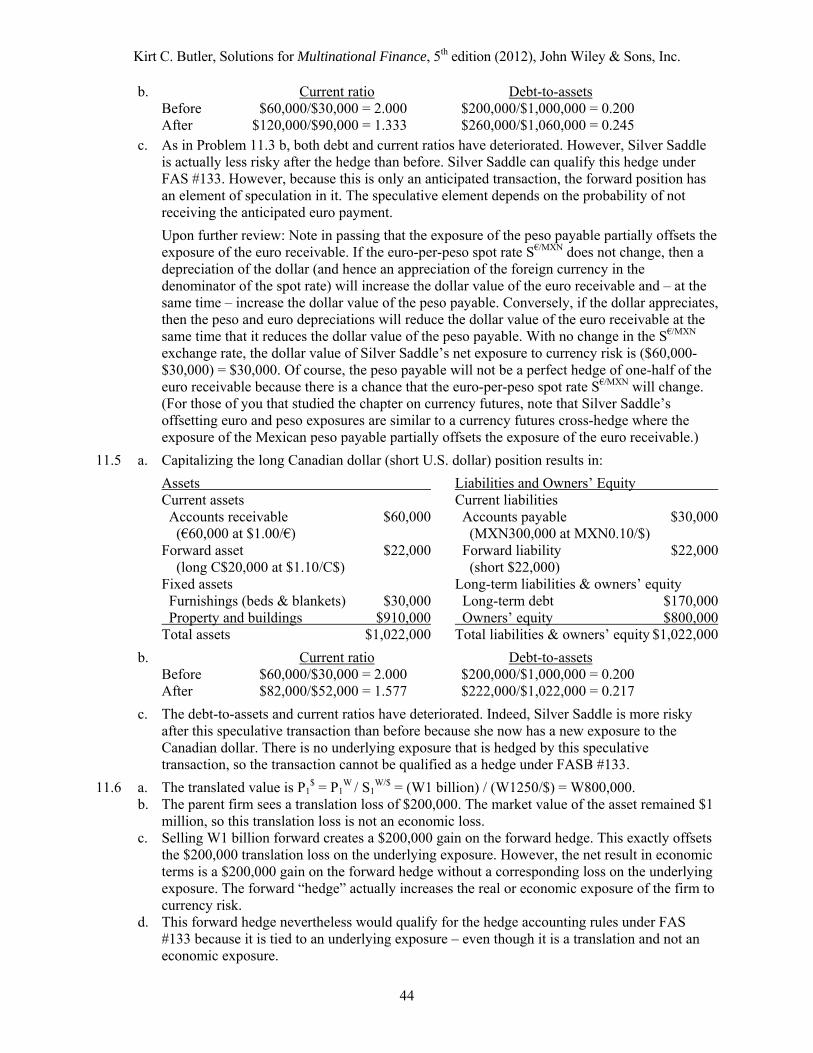
Kirt C. Butler, Solutions for Multinational Finance, 5th edition (2012), John Wiley & Sons, Inc.
44
b. Current ratio Debt-to-assets Before $60,000/$30,000 = 2.000 $200,000/$1,000,000 = 0.200 After $120,000/$90,000 = 1.333 $260,000/$1,060,000 = 0.245
c. As in Problem 11.3 b, both debt and current ratios have deteriorated. However, Silver Saddle is actually less risky after the hedge than before. Silver Saddle can qualify this hedge under FAS #133. However, because this is only an anticipated transaction, the forward position has an element of speculation in it. The speculative element depends on the probability of not receiving the anticipated euro payment.
Upon further review: Note in passing that the exposure of the peso payable partially offsets the exposure of the euro receivable. If the euro-per-peso spot rate S€/MXN does not change, then a depreciation of the dollar (and hence an appreciation of the foreign currency in the denominator of the spot rate) will increase the dollar value of the euro receivable and – at the same time – increase the dollar value of the peso payable. Conversely, if the dollar appreciates, then the peso and euro depreciations will reduce the dollar value of the euro receivable at the same time that it reduces the dollar value of the peso payable. With no change in the S€/MXN exchange rate, the dollar value of Silver Saddle’s net exposure to currency risk is ($60,000-$30,000) = $30,000. Of course, the peso payable will not be a perfect hedge of one-half of the euro receivable because there is a chance that the euro-per-peso spot rate S€/MXN will change. (For those of you that studied the chapter on currency futures, note that Silver Saddle’s offsetting euro and peso exposures are similar to a currency futures cross-hedge where the exposure of the Mexican peso payable partially offsets the exposure of the euro receivable.)
11.5 a. Capitalizing the long Canadian dollar (short U.S. dollar) position results in:
Assets Liabilities and Owners’ Equity Current assets Current liabilities Accounts receivable $60,000 Accounts payable $30,000 (€60,000 at $1.00/€) (MXN300,000 at MXN0.10/$) Forward asset $22,000 Forward liability $22,000 (long C$20,000 at $1.10/C$) (short $22,000) Fixed assets Long-term liabilities & owners’ equity Furnishings (beds & blankets) $30,000 Long-term debt $170,000 Property and buildings $910,000 Owners’ equity $800,000 Total assets $1,022,000 Total liabilities & owners’ equity $1,022,000
b. Current ratio Debt-to-assets Before $60,000/$30,000 = 2.000 $200,000/$1,000,000 = 0.200 After $82,000/$52,000 = 1.577 $222,000/$1,022,000 = 0.217
c. The debt-to-assets and current ratios have deteriorated. Indeed, Silver Saddle is more risky after this speculative transaction than before because she now has a new exposure to the Canadian dollar. There is no underlying exposure that is hedged by this speculative transaction, so the transaction cannot be qualified as a hedge under FASB #133.
11.6 a. The translated value is P1$ = P1
W / S1W/$ = (W1 billion) / (W1250/$) = W800,000.
b. The parent firm sees a translation loss of $200,000. The market value of the asset remained $1 million, so this translation loss is not an economic loss.
c. Selling W1 billion forward creates a $200,000 gain on the forward hedge. This exactly offsets the $200,000 translation loss on the underlying exposure. However, the net result in economic terms is a $200,000 gain on the forward hedge without a corresponding loss on the underlying exposure. The forward “hedge” actually increases the real or economic exposure of the firm to currency risk.
d. This forward hedge nevertheless would qualify for the hedge accounting rules under FAS #133 because it is tied to an underlying exposure – even though it is a translation and not an economic exposure.
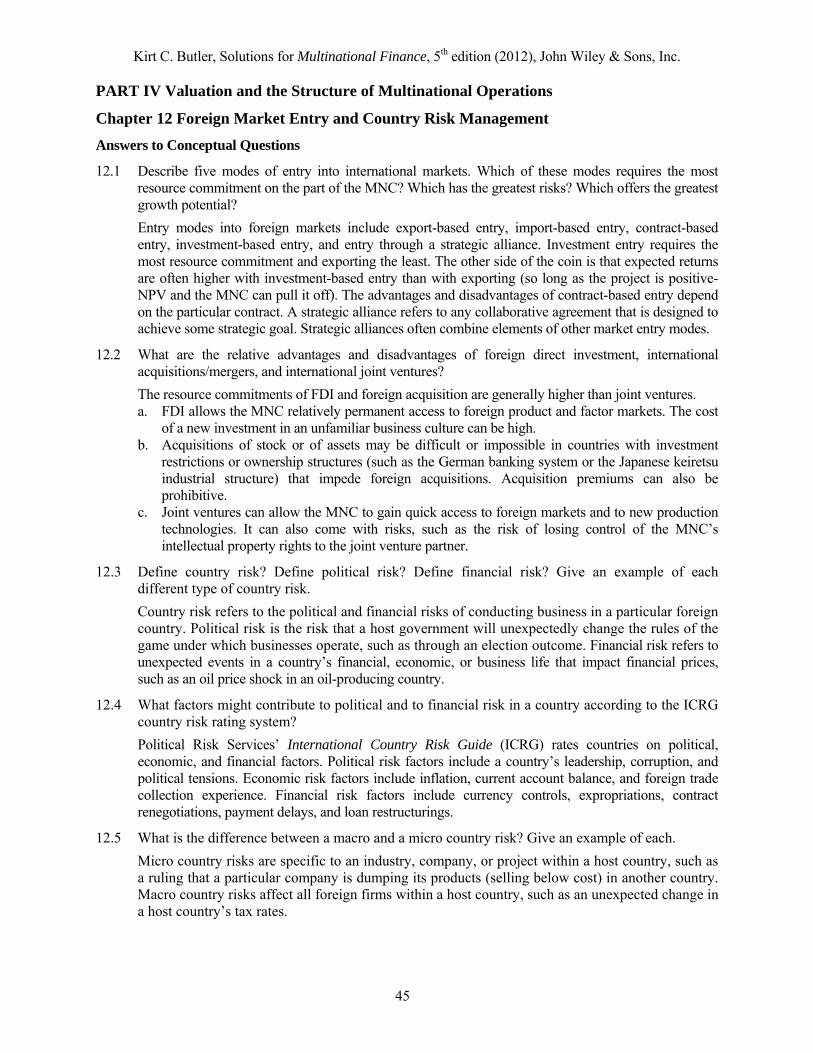
Kirt C. Butler, Solutions for Multinational Finance, 5th edition (2012), John Wiley & Sons, Inc.
45
PART IV Valuation and the Structure of Multinational Operations
Chapter 12 Foreign Market Entry and Country Risk Management
Answers to Conceptual Questions
12.1 Describe five modes of entry into international markets. Which of these modes requires the most resource commitment on the part of the MNC? Which has the greatest risks? Which offers the greatest growth potential?
Entry modes into foreign markets include export-based entry, import-based entry, contract-based entry, investment-based entry, and entry through a strategic alliance. Investment entry requires the most resource commitment and exporting the least. The other side of the coin is that expected returns are often higher with investment-based entry than with exporting (so long as the project is positive-NPV and the MNC can pull it off). The advantages and disadvantages of contract-based entry depend on the particular contract. A strategic alliance refers to any collaborative agreement that is designed to achieve some strategic goal. Strategic alliances often combine elements of other market entry modes.
12.2 What are the relative advantages and disadvantages of foreign direct investment, international acquisitions/mergers, and international joint ventures?
The resource commitments of FDI and foreign acquisition are generally higher than joint ventures. a. FDI allows the MNC relatively permanent access to foreign product and factor markets. The cost
of a new investment in an unfamiliar business culture can be high. b. Acquisitions of stock or of assets may be difficult or impossible in countries with investment
restrictions or ownership structures (such as the German banking system or the Japanese keiretsu industrial structure) that impede foreign acquisitions. Acquisition premiums can also be prohibitive.
c. Joint ventures can allow the MNC to gain quick access to foreign markets and to new production technologies. It can also come with risks, such as the risk of losing control of the MNC’s intellectual property rights to the joint venture partner.
12.3 Define country risk? Define political risk? Define financial risk? Give an example of each different type of country risk.
Country risk refers to the political and financial risks of conducting business in a particular foreign country. Political risk is the risk that a host government will unexpectedly change the rules of the game under which businesses operate, such as through an election outcome. Financial risk refers to unexpected events in a country’s financial, economic, or business life that impact financial prices, such as an oil price shock in an oil-producing country.
12.4 What factors might contribute to political and to financial risk in a country according to the ICRG country risk rating system?
Political Risk Services’ International Country Risk Guide (ICRG) rates countries on political, economic, and financial factors. Political risk factors include a country’s leadership, corruption, and political tensions. Economic risk factors include inflation, current account balance, and foreign trade collection experience. Financial risk factors include currency controls, expropriations, contract renegotiations, payment delays, and loan restructurings.
12.5 What is the difference between a macro and a micro country risk? Give an example of each.
Micro country risks are specific to an industry, company, or project within a host country, such as a ruling that a particular company is dumping its products (selling below cost) in another country. Macro country risks affect all foreign firms within a host country, such as an unexpected change in a host country’s tax rates.

Kirt C. Butler, Solutions for Multinational Finance, 5th edition (2012), John Wiley & Sons, Inc.
46
12.6 How is expropriation included in a discounted cash flow analysis of a proposed foreign investment? Does expropriation impact expected future cash flows? From a discounted cash flow perspective, is it likely to impact the discount rate on foreign investment?
Expropriation occurs when a government seizes foreign assets. This risk clearly affects expected cash flows. It can affect the discount rate when investors cannot diversify their investment portfolios against this risk; that is, when it is a systematic risk.
12.7 What is protectionism and how can it impact the multinational corporation?
Protectionism refers to protection of local industries through tariffs, quotas, and regulations in ways that discriminate against foreign businesses.
12.8 What are blocked funds? How might they arise?
Blocked funds are cash flows generated by a foreign project that cannot be immediately repatriated to the parent firm. They most commonly arise from capital flow restrictions imposed by the host government.
12.9 What are intellectual property rights? How are they at risk when the multinational corporation has foreign operations?
Intellectual property rights include patents, copyrights, and proprietary technologies and processes. Host governments sometimes protect local businesses at the expense of foreign firms. The multinational corporation must work to minimize the exposure of its intellectual property rights to theft or expropriation by foreign firms or governments.
12.10 What is an investment agreement? What conditions might it include?
An investment agreement specifies the rights and responsibilities of a host government and a corporation in the structure and operation of an investment project in the host country. The agreement should specify the investment and financial environments including taxes, concessions, obligations, and restrictions on the multinational corporation’s operations. It also should specify a jurisdiction for the arbitration of disputes.
12.11 What constitutes an insurable risk? List several insurable political risks.
Insurable risks have four elements: (a) The loss is identifiable in time, place, cause, and amount. (b) A large number of individuals or businesses are exposed to the risk, ideally in an independently and identically distributed manner. (c) The expected loss over the life of the contract is estimable, so that reasonable premiums can be set by the insurer. (d) The loss is outside the influence of the insured.
12.12 What operational strategies does the multinational corporation have to protect itself against political risk?
In addition to negotiating the environment (perhaps through an investment agreement), the MNC can (a) limit the scope of technology transfer to foreign affiliates, (b) limit dependence on a single partner, (c) enlist local partners to represent the firm in the local environment, (d) use more stringent investment criteria when appropriate, and (e) plan for disaster recovery.
12.13 How can the MNC protect its competitive advantages in the international marketplace?
The text lists several ways to protect competitive advantages such as the firm’s intellectual property rights. The most important of these protections lies in finding the right partner. Other ways that the MNC can protect itself include: i) limit the scope of the technology transfer to include only non-essential parts of the production process, ii) limit the transferability of the technology by contract, iii) limit dependence on any single partner, iv) use only assets near the end of their product life cycle, v) use only assets with limited growth options, vi) trade one technology for another, vii) remove the threat by acquiring the stock or assets of the foreign partner.

Kirt C. Butler, Solutions for Multinational Finance, 5th edition (2012), John Wiley & Sons, Inc.
47
Problem Solutions
12.1 There is not always a clear distinction between political and financial risks. Indeed, financial risks often result from political decisions. In Russia’s case, the financial risks of investment in Russian have been acerbated by the inability of the Russian government to establish and enforce laws and regulations for the orderly conduct of business. Organized crime and corruption have contributed to poor political, economic, financial country risk ratings in Russia. Governments make a convenient scapegoats, and this hedge fund manager clearly holds the Russian government responsible for his losses.
12.2 Although the most obvious form of expropriation occurs when a host government confiscates a company’s assets, in fact each type of political risk can be thought of as a form of expropriation. Host governments can appropriate foreign assets for themselves or for local companies through actions that differentially impair nonlocal firms, including protectionism, blocked funds, or theft or misappropriation of intellectual property rights.
12.3 a. Total risk is conventionally measured by standard deviation of return. The foreign asset with a standard deviation of σi
’ = 0.3 has greater total risk than the domestic asset with a standard
deviation of σi = 0.2. b. The foreign asset also has greater systematic risk: βi
’ = ρiW’ (σi
’/σW) = (0.3)(0.3/0.1) = 0.9 > βi = ρiW (σi /σW) = (0.4)(0.2/0.1) = 0.8.
12.4 Although the answer to this question will be specific to the chosen country, country risks that turn up usually include factors from the ICRG political risk categories. These factors include political risk (leadership, government corruption, internal or external political tensions), economic risk (inflation, current account balance, or foreign trade collection experience), and financial risk (currency controls, expropriations, contract renegotiations, payment delays, loan restructurings or cancellations). Of course, other political risk information providers use these same types of factors.

Kirt C. Butler, Solutions for Multinational Finance, 5th edition (2012), John Wiley & Sons, Inc.
48
Chapter 13 Multinational Capital Budgeting
Answers to Conceptual Questions
13.1 Describe the two recipes for discounting foreign currency cash flows. Under what conditions are these recipes equivalent?
Recipe #1: Discount foreign currency cash flows at a foreign currency discount rate. Recipe #2: Discount domestic currency cash flows at a domestic currency discount rate. These two recipes are equivalent if the international parity conditions hold and there are no market
frictions such as repatriation restrictions. These recipes can give different values if PPP does not hold or if there are repatriation restrictions.
13.2 Discuss each cell in Figure 13.5. What should (or shouldn’t) a firm do when faced with a foreign project that fits the description in each cell?
Top left: Both NPVs are negative, so reject the foreign project. Top right: Vd|id>0 but Vd|if<0; Reject the project. There must be better alternatives than the proposed
project for speculating on foreign exchange. Bottom left: Vd|id<0 but Vd|if>0; Anticipated changes in exchange rates are likely to hurt the firm.
Financing the project in local currency, hedge forward (with forwards or futures), or swap into foreign currency debt.
Bottom right: There are two possibilities. If Vd|id > Vd|if > 0, then changes in exchange rates are expected to help the parent. The home office may choose to leave the foreign currency cash flows unhedged, although this captures the higher expected value but also exposes the firm to currency risk. If 0 < Vd|id < Vd|if, then the parent can capture a higher expected value and lower currency risk by hedging its expected future foreign currency cash flows and locking in the relatively high local-currency value of the project.
13.3 Why is it important to separately identify the value of any side effects that accompany foreign investment projects?
Separately identifying the value of a project from the value of any side effects (such as blocked funds, subsidized financing, or tax holidays) allows the firm to negotiate with host governments and other parties on a more informed basis.
Problem Solutions
Cross-border capital budgeting when the international parity conditions hold.
13.1 a. Relative purchasing power parity for this risky asset is driven by expected inflation: (1+iILS)/(1+iCNY) = (1.15)/( 1.11745) (1+E[pILS])/(1+E[pCNY]) = (1.06)/(1.03) 1.0291.
Discounting yuan cash flows at the yuan discount rate yields VCNY = –CNY600m+CNY200m/1.11745+CNY500m/(1.11745)2+CNY300m/(1.11745)3 = CNY194.39 million or VILS|iCNY = (CNY194.39m)(ILS 0.5526/CNY) = ILS 107.42 million at the spot rate.
b. Relative purchasing power parity states that the spot rate should change according to E[St
ILS/CNY]/E[S0ILS/CNY] = [(1+E[pILS])/(1+E[pCNY])]t = (1.06/1.03)t = (1.029)t. That is, the yuan
should appreciate by approximately 2.9% per year relative to the shekel because of lower Chinese inflation. Expected future spot rates of exchange are then
E[S1ILS/CNY] = (ILS 0.5526)[(1.06)/(1.03)]1 = ILS 0.5687/CNY
E[S2ILS/CNY] = (ILS 0.5526)[(1.06)/(1.03)]2 = ILS 0.5853/CNY
E[S3ILS/CNY] = (ILS 0.5526)[(1.06)/(1.03)]3 = ILS 0.6023/CNY
Based on these spot exchange rates, expected Israeli shekel cash flows are:
E[CF0ILS] = (CNY600m)(ILS 0.5526/CNY) = ILS 331.56m

Kirt C. Butler, Solutions for Multinational Finance, 5th edition (2012), John Wiley & Sons, Inc.
49
E[CF1ILS] = (CNY200m)(ILS 0.5687/CNY) = ILS 113.74m
E[CF2ILS] = (CNY500m)(ILS 0.5853/CNY) = ILS 292.63m
E[CF3ILS] = (CNY300m)(ILS 0.6023/CNY) = ILS 180.69m
The project should be accepted because
V$|i$ = –$331.56m+$113.74m/(1.15)+$292.63m/(1.15)2+$180.69m/(1.15)3 = $107.42 million > $0
13.2 a. Expected future cash flows in euros are as follows:
Investment cash flows 0 1 2 Land –100000 121000 grows at 10% inflation rate tax on capital gain –8400 Plant –50000 25000 market value at t=2 tax on capital gain –10000 NWC –50000 60500 grows at 10% inflation rate tax on capital gain –4200
Operating cash flows 0 1 2 Rev (Price=100, Q=5,000) 550000 605000 grows at 10% inflation rate Variable cost (20%) –110000 –121000 FC (20,000 at t=0) –22000 –24200 grows at 10% inflation rate Depreciation –25000 –25000 Earnings before tax 393000 434800 Tax (at 40%) –157200 –173920 Net income 235800 260880 Net cash flow (euros) 260800 285880 CF = NI + Depreciation
Sum of investment/disinvestment and operating cash flows Total net CFs –200000 260800 469780 V€ at i€ = 20% +€343,569.4
b. If the international parity conditions hold, then 20% interest rates in both the foreign and domestic currencies imply that forward (and expected future spot) exchange rates will equal the current spot rate of $10/€. So,
Sum of investment/disinvestment and operating cash flows Expected dollar CFs –2000000 2608000 4697800 V$|i€ at i$ = 20% $3,435,694
13.3 a. iW = (1+pW)(1+ʀW) – 1 = (1.50)(1.10)–1 = 65% iL = (1+pL)(1+ʀL) – 1 = (1.00)(1.10)–1 = 10% b. E[S1
W/L] = (S0W/L) [(1+pW) / (1+pL)]t = (W100/L) [(1.50) / (1.00)] = W150/L
E[S2W/L] = (S0
W/L) [(1+pW) / (1+pL)]t = (W100/L) [(1.50) / (1.00)]2 = W225/L
c. All cash flows in work-units:
Investment cash flows 0 1 2 Land –200,000 450,000 grows at 50% inflation rate tax on capital gain –125,000 Plant –200,000 0 market value at t=2 tax on capital gain 0
Operating cash flows 0 1 2 Rev (P0
W=W200, Q=2,000) 600,000 900,000 grows at 50% inflation rate Variable cost (20%) –120,000 –180,000 Fixed cost (W30,000 at t=0) –45,000 –67,500 grows at 50% inflation rate Depreciation –100,000 –100,000 Earnings before tax 335,000 552,500

Kirt C. Butler, Solutions for Multinational Finance, 5th edition (2012), John Wiley & Sons, Inc.
50
Tax (at 50%) –167,500 –276,250 Net income 167,500 276,250 Net operating CFW 267,500 376,250 CF = NI + Depreciation Sum of investment/disinvestment and operating cash flows Net CFt
W –400,000 267,500 701,250 VW at iW = 65% W19,697 VL|iW = VW / S0
W/L = L197
d. E[CFtL] = E[CFt
W] / E[StW/L] E[CF0
L] = (–W400,000) / (W100/L) = –L4,000 E[CF1
L] = (W267,500) / (W150/L) = L1,783 E[CF2
L] = (W701,250) / (W225/L) = L3,117 VL|iL = –L4,000 + (L1,783) / (1.10) + (L3,117) / (1.1)2 = L197 This is the same as in part c because the international parity conditions hold.
13.4 a.
Initial outlay = Bt4m at time t = 1 After-tax cash flows over t=2,…,5 =(Bt100m–Bt90m–Bt5m)(1–0.40)+(Bt1m×(0.4))=Bt3,400,000 Terminal CF= (Bt4m×(1.10)4) – {[(Bt4m×(1.10)4) – 0]×(0.4)} = Bt3,513,840 VBt = Bt5,413,548 b. (1+iBt) = (1+ʀBt)(1+pBt) ʀBt = (1.20/1.10)–1=0.0909091 ʀBt = 9.09091% = ʀ¥ i¥ = (1+ʀ¥)(1+p¥) – 1 = (1.0909091)(1.05) – 1 = 0.1454545, or 14.54545% Alternatively, i¥ = (1+iBt)(1+p¥)/(1+pBt)–1 = 1.20(1.05/1.10)–1 i¥ = 14.54545% c. E(S1
Bt/¥) = (Bt0.25/¥)(1.20/1.1454545) = Bt.2619048/¥ E(S2
Bt/¥) = (Bt0.25/¥)(1.20/1.1454545)2 = Bt.2743764/¥ E(S3
Bt/¥) = (Bt0.25/¥)(1.20/1.1454545)3 = Bt.2874420/¥ E(S4
Bt/¥) = (Bt0.25/¥)(1.20/1.1454545)4 = Bt.3011297/¥ E(S5
Bt/¥) = (Bt0.25/¥)(1.20/1.1454545)5 = Bt.3154692/¥ d. Recipe #1: V¥|iBt = (VBt)/(S0
Bt/¥) = (Bt5,413,548)/(Bt0.25/¥) = ¥21,654,192 Recipe #2:
V¥|i¥ = ¥21,654,192 at i¥ = 14.54545%
The answers are the same because the international parity conditions hold.
Cross-border capital budgeting when the international parity conditions do not hold.
13.5 a. Interest rate parity requires a 2.913 percent forward premium according to FtILS/CNY/S0
ILS/CNY =
(1+iFILS)t/(1+iF
CNY)t = (1.0812)t/(1.0506)t = (1.02913)t. Forward rates are as follows: F1
ILS/CNY = (ILS 0.5526)[(1.0812)/(1.0506)]1 = ILS 0.5687/CNY F2
ILS/CNY = (ILS 0.5526)[(1.0812)/(1.0506)]2 = ILS 0.5853/CNY F3
ILS/CNY = (ILS 0.5526)[(1.0812)/(1.0506)]3 = ILS 0.6023/CNY V(Hedged) = t { Ft
ILS/CNY E[CFtCNY]) / (1+iILS)t }
= [(–CNY600m)(ILS 0.5526/CNY) + (CNY200m)(ILS 0.5687/CNY)/(1.15) + (CNY500m)(ILS 0.5853/CNY)/(1.15)2 + (CNY300m)(ILS 0.6023/CNY)/(1.15)3 ]
t=1 Bt3.4m Bt3.4m Bt3.4m Bt6,913,840
Bt4m t=2 t=3 t=4 t=5
iBt = 20%
t=1 ¥12,391,736 ¥11,828,475 ¥11,290,817 ¥21,916,055
¥15,272,727 t=2 t=3 t=4 t=5

Kirt C. Butler, Solutions for Multinational Finance, 5th edition (2012), John Wiley & Sons, Inc.
51
= ILS 107.42 million b. Relative purchasing power parity states E[St
ILS/CNY] = S0ILS/CNY [(1+iILS)/(1+iCNY)]t, so…
E[S1ILS/CNY] = (ILS 0.5526)[(1.15)/(1.13)]1 = ILS 0.5624/CNY
E[S2ILS/CNY] = (ILS 0.5526)[(1.15)/(1.13)]2 = ILS 0.5723/CNY
E[S3ILS/CNY] = (ILS 0.5526)[(1.15)/(1.13)]3 = ILS 0.5825/CNY
V(Unhedged) = t {E[StILS/CNY]E[CFt
CNY] / (1+iILS)t } = [(–CNY600m)(ILS 0.5526/CNY) + (CNY200m)(ILS 0.5624/CNY)/(1.15) + (CNY500m)(ILS 0.5723/CNY)/(1.15)2 + (CNY300m)(ILS 0.5825/CNY)/(1.15)3 ] = ILS 97.52 million c. V(Hedged) > V(Unhedged) > 0, so the project is worth pursuing. Project cash flows should be
hedged (e.g., with currency forwards) because hedging yields a larger NPV with less risk. d. Shekel (yuan) borrowing costs are low (high) relative to risk-free forward premium;
(1+iBILS)/(1+iB
CNY) = (1.09/1.07) ≈ 1.019 < 1.029. This firm should borrow in shekels and hedge the project’s operating cash flows with currency forwards or a currency swap. (Currency futures also would work in theory, although the market for long-term currency futures is less liquid than markets for long-term currency forwards and swaps.)
13.6 a. Interest rate parity requires a 2.913 percent forward premium according to FtILS/CNY/S0
ILS/CNY = (1+iF
ILS)t/(1+iFCNY)t = (1.0812)t/(1.0506)t = (1.02913)t. Forward rates are as follows:
F1ILS/CNY = (ILS 0.5526)[(1.0812)/(1.0506)]1 = ILS 0.5687/CNY
F2ILS/CNY = (ILS 0.5526)[(1.0812)/(1.0506)]2 = ILS 0.5853/CNY
F3ILS/CNY = (ILS 0.5526)[(1.0812)/(1.0506)]3 = ILS 0.6023/CNY
V(Hedged) = t { FtILS/CNY E[CFt
CNY]) / (1+iILS)t } = [(–CNY600m)(ILS 0.5526/CNY) + (CNY200m)(ILS 0.5687/CNY)/(1.16) + (CNY500m)(ILS 0.5853/CNY)/(1.16)2 + (CNY300m)(ILS 0.6023/CNY)/(1.16)3 ] = ILS 99.72 million b. Relative purchasing power parity states E[St
ILS/CNY] = S0ILS/CNY [(1+iILS)/(1+iCNY)]t, so…
E[S1ILS/CNY] = (ILS 0.5526)[(1.16)/(1.12)]1 = ILS 0.5723/CNY
E[S2ILS/CNY] = (ILS 0.5526)[(1.16)/(1.12)]2 = ILS 0.5928/CNY
E[S3ILS/CNY] = (ILS 0.5526)[(1.16)/(1.12)]3 = ILS 0.6139/CNY
V(Unhedged) = t {E[StILS/CNY]E[CFt
CNY] / (1+iILS)t } = [(–CNY600m)(ILS 0.5526/CNY) + (CNY200m)(ILS 0.5723/CNY)/(1.16) + (CNY500m)(ILS 0.5928/CNY)/(1.16)2 + (CNY300m)(ILS 0.6139/CNY)/(1.16)3 ] = ILS 105.38 million c. V(Unhedged) > V(Hedged) > 0, so the project is worth pursuing. Hedging the project results in a
lower expected value, albeit with less risk. The hedging decision will depend on the firm’s risk management policy.
d. Shekel (yuan) borrowing costs are high (low) relative to the risk-free forward premium; (1+iB
ILS)/(1+iBCNY) = (1.10/1.06) ≈ 1.0377 > 1.029. This firm should borrow in yuan and use the
yuan interest payments to reduce the project’s exposure to currency risk.
13.7 a. Discount in yuan: VCNY = [t E[CFtCNY] / (1+iCNY)t ]
= [–CNY600m + CNY200m/(1.1175) + CNY500m/(1.1175)2 + CNY300m/(1.1175)3] = CNY194.39 VILS|iCNY = (S0
ILS/CNY) (VCNY) = (ILS 0.5526/CNY)(CNY194.39m) = ILS 107.42 million
Discount in shekels: VILS|iILS = t {E[StILS/CNY]E[CFt
CNY] / (1+iILS)t } = [(–CNY600m)(ILS 0.5526/CNY) + (CNY200m)(ILS 0.5801/CNY)/(1.15) + (CNY500m)(ILS 0.6089/CNY)/(1.15)2 + (CNY300m)(ILS 0.6392/CNY)/(1.15)3 ] = ILS 125.61 million > ILS 107.42 million
Although the project has a positive NPV regardless of the perspective, the project has more value from the parent’s perspective than from the project perspective. This is because the expected future value of the shekel (yuan) is less (more) than under the equilibrium conditions. The parent company may choose to leave its cash flows from the project unhedged in the

Kirt C. Butler, Solutions for Multinational Finance, 5th edition (2012), John Wiley & Sons, Inc.
52
hopes of benefiting from the expected higher-than-equilibrium future exchange rates. This does expose the parent to currency risk.
b. Discount in yuan: VCNY = [t E[CFtCNY] / (1+iCNY)t ]
= [–CNY600m + CNY200m/(1.1175) + CNY500m/(1.1175)2+CNY300m/(1.1175)3] = CNY194.39 VILS|iILS = (S0
ILS/CNY) (VCNY) = (ILS 0.5526/CNY)(CNY194.39m) = ILS 107.42 million
Discount in ILS: VILS|iILS = t {E[StILS/CNY]E[CFt
CNY] / (1+iILS)t } = [(–CNY600m)(ILS 0.5526/CNY) + (CNY200m)(ILS 0.5575/CNY)/(1.15) + (CNY500m)(ILS 0.5625/CNY)/(1.15)2 + (CNY300m)(ILS 0.5676/CNY)/(1.15)3 ] = ILS 90.04m < ILS 107.42 million
Although the project has a positive NPV from each perspective, the project has more value in the local currency than it does in shekels. The parent should hedge the yuan cash flows either directly in the forward market, by borrowing a part of the project in yuan, or by swapping shekel debt for yuan debt to hedge its expected future yuan cash flows from the project.
Cross-border capital budgeting in the presence of investment or financial side effects.
13.8 The funds are invested with the China Construction Bank, so the appropriate opportunity cost of capital is the (risky) bank rate of 6.09 percent. It is easiest to focus on the funds that are blocked and exclude other cash flows (in particular, the initial investment) from the analysis. The after-tax cost of debt is 6.09%(1-0.25) = 4.5675%. The after-tax opportunity cost of blocked funds is as follows.
a) The present value of blocked funds assuming they are not blocked is CNY200m(1.045675)–1 + CNY500m(1.045675)–2 + CNY300m(1.045675)–3 = CNY910.92 million.
b) Blocked funds will delay the receipt of the project cash flows for a year, so the present value of blocked funds is really only CNY200m(1.045675)–2 + CNY500m(1.045675)–3 + CNY300m(1.045675)–
4 = CNY871.13 million. c) The opportunity cost of the blocked funds is the difference between project value with and
without the blocked funds: VSIDE EFFECT = VPROJECT WITH SIDE EFFECT – VPROJECT WITHOUT SIDE EFFECT = CNY871.13 million – CNY910.92 million = –CNY39.79 million. At the ILS0.5526/CNY spot rate, this is worth ILS21.99 million.
Alternatively, incremental cash flows can be valued directly. Yuan flows in years 1-4 in the original case are (200,500,300,0). In the alternative case with blocked funds, yuan cash flows in years 1-4 are (0,200,500,300). The change in cash flow created by the blockage of funds is then (actual – expected) = (0–200,200–500,500–300,300–0) = (–200,–300,+200,+300). The present value of incremental cash flows at the after-tax cost of debt is equal to (–CNY200m)(1.045675)–1 + (–CNY300m)(1.045675)–2 + (+CNY200m)(1.045675)–3 + (+CNY300m)(1.045675)–4 = –CNY39.79 million, or ILS21.99 million at the ILS0.5526/CNY spot rate of exchange.
13.9 China Construction Bank’s after-tax cost of yuan debt is (6.09%)(1–0.25) = 4.5675%. Your after-tax cost of yuan debt is (8.15%)(1–0.25) = 6.11%. Your annual savings in after-tax interest expense will be (6.11%–4.57%) = 1.5450%, or (CNY600m)(0.015450) = CNY9.27 million. The present value of a three-year annuity of CNY9.27 million discounted at the 6.11% after-tax yuan discount rate is CNY24.73 million, or CNY13.66 million at the ILS0.5526/CNY spot rate.
13.10 VCNY = CNY194.39 million without the side effect. The airport project reduces this value by CNY100 million, but the NPV with the side effect is still positive. You should accept the project, even if the Chinese authorities are not willing to renegotiate.
13.11 The expropriation risk in this problem differs from that in the chapter’s Neverland project because there is a probability of expropriation in each year, rather than just at the end of the project. Once expropriated, you will not receive any later cash flows from your investment. This can be represented with a decision tree.

Kirt C. Butler, Solutions for Multinational Finance, 5th edition (2012), John Wiley & Sons, Inc.
53
The sum of the probabilities of the possible states of nature is 0.100 + 0.090 + 0.081 + 0.729 = 1.000. The probability of receiving the cash flow in year t is (0.9)t. The expected cash flow in the presence of expropriation risk is this probability times the expected cash flow from Problem 13.1. The NPV in yuan is then VCNY = –CNY600m + CNY200m(0.9)1/(1.11745) + CNY500m(0.9)2/(1.11745)2 + CNY300m(0.9)3/(1.11745)3 = CNY42.15 million, or VILS|iCNY = (CNY42.15)(ILS 0.5526/CNY) = ILS 23.29 million at the spot exchange rate. The value of the expropriation side effect is thus V(Side effect) = V(Project with side effect) – V(Project without side effect) = (CNY42.15–CNY194.40) = –CNY152.24, or (ILS 23.29m – ILS 107.42m) = –ILS 84.13million.
Alternatively, the side effect can be valued explicitly as follows. There is a 0.1 chance of losing the first and all later cash flows, an additional (0.1)(0.9) = 0.09 risk of losing the 2nd year cash flow given the 1st year cash flow was received, and an additional (0.1)(0.9)2 = 0.081 risk of losing the 3rd year cash flow given the 2nd year cash flow was received. Hence, the probability of not receiving CFt is (1–(0.9)t):
P[losing CF1CNY] = 1–(.9)1 = 0.100
P[losing CF1CNY] = 1–(.9)2 = 0.100 + 0.090 = 0.190
P[losing CF1CNY] = 1–(.9)3 = 0.100 + 0.090 + 0.081 = 0.271
The expected loss in present value due to expropriation risk is then (0.10)CNY200m/(1.11745) + (0.19)CNY500m/(1.11745)2 +(0.271)CNY300m/(1.11745)3 = CNY152.24 million, or (CNY152.24)(ILS 0.5526/CNY) = ILS 84.13 million.
13.12 Step 1: Calculate the value of blocked funds assuming they are not blocked. If blocked funds had been invested at the risky after-tax croc rate of 40%(1-0.5) = 20% per year,
they would have grown in value to Cr8,000(1.20)3 + Cr13,819.5(1.20)2 + Cr19,573.5(1.20) Cr57,212. Discounted at the 20% after-tax croc rate, this would have been worth Cr27,591 in present value. This is equivalent to discounting blocked funds back to the beginning of the project at the 20% risky after-tax croc discount rate, so this is a zero-NPV investment at the 20% after-tax croc interest rate.
Step 2: Calculate the opportunity cost of blocked funds. With blocked funds earning no interest, the accumulated balance of Cr41,393 has an after-tax
present value of (Cr41,393) / (1.20)4 = Cr19,962. The opportunity cost of blocked funds is (Cr19,962 – Cr27,591) = –Cr7,629.
Step 3: Calculate project value including the opportunity cost of blocked funds. Vproject with side effect = Vproject without side effect + Vside effect = –Cr137 – Cr7,629 = –Cr7,766.
The opportunity cost of blocked funds at the 20% (forgone) risky after-tax discount rate is even higher than the Cr7,410 value in the text example using a iF
Cr(1–T) = (37.5%)(1–0.5) = 18.75% risk-free after-tax discount rate. Blocked funds make the Neverland project look even worse than when Hook’s treasure chest is riskless.
P[expropriation in year 1] = 0.1000.1
0.9 0.1
0.9 0.1
0.9
P[expropriation in year 2] = (0.9)(0.1) = 0.090
P[expropriation in year 3] = (0.9)2(0.1) = 0.081
P[no expropriation] = (0.9)3 = 0.729

Kirt C. Butler, Solutions for Multinational Finance, 5th edition (2012), John Wiley & Sons, Inc.
54
Chapter 14 Multinational Capital Structure and Cost of Capital
Answers to Conceptual Questions
14.1 Does corporate financial policy matter in a perfect financial market?
In a perfect financial market, investors can replicate any action that the firm can undertake. Hence, corporate financial policy is irrelevant in a perfect financial market.
14.2 What distinguishes an integrated from a segmented capital market?
In an integrated market, real after-tax required returns on equivalent assets are the same everywhere the assets are traded. If real after-tax rates of return are different in a particular market, then that market is at least partially segmented from other markets.
14.3 What factors could lead to capital market segmentation?
Violations of any of the perfect market conditions can lead to capital market segmentation. These factors include prohibitive transactions costs, differing legal and political systems, regulatory interference (e.g., barriers to financial flows or to financial innovation), differential taxes or tax regimes, informational barriers such as disclosure requirements, home asset bias, and differential investor expectations.
14.4 Does the required return on a project depend on who is investing the money or on where the money is being invested?
The required return on an investment project should be an asset-specific discount rate that reflects the opportunity cost of capital on the project. That is, it depends on where the money is going and not from where it came.
14.5 Does the value of a foreign project depend on the way it is financed?
Yes. Additional debt brings additional tax shields from the tax deductibility of interest payments as well as additional costs of financial distress. The adjusted present value approach to project valuation attempts to separate the value of the unlevered project from the value of these financial side-effects.
14.6 An important input into the required return on equity in the security market line is the market risk premium. How much is the market risk premium?
This is difficult to say, as there is no easy way to identify the exact number. Indeed, the market risk premium is likely to change over time. A recent survey of academic financial economists by Ivo Welch (“The Equity Premium Consensus Forecast Revisited,” September 2001, available at www.ssrn.com) produced an estimate of 5 to 5.5 percent.
14.7 When is the adjusted present value approach to project valuation most useful?
When the financial side-effects are easy to separate from the project. This includes many of the special circumstances listed in the chapter on “Cross-Border Capital Budgeting” including blocked funds, subsidized financing, negative-NPV tie-in projects, expropriation risk, and government-sponsored tax holidays.
14.8 What is the usual consequence of an increase in country risk on a national stock market? Do stock markets in high-risk countries have higher or lower volatility than other markets? Do they have higher or lower betas relative to a world stock market index?
Erb, Harvey, and Viskanta (“Political Risk, Financial Risk and Economic Risk,” Financial Analysts Journal 1996) found a) local stock markets usually fall when country risk rises, and 2) high-risk countries tend to have high stock market volatilities and lower betas βi = ρi,M (σi / σM) because of their relatively low correlations with other markets.
14.9 What is a stock market liberalization? What are the effects of liberalizations on (a) emerging market correlations with the world stock returns, (b) local market volatility, and (c) the local cost of capital?

Kirt C. Butler, Solutions for Multinational Finance, 5th edition (2012), John Wiley & Sons, Inc.
55
Liberalizations are decisions by governments to allow foreigners to purchase local assets. Bekaert and Harvey (“Foreign Speculators and Emerging Equity Markets,” Journal of Finance, April 2000) found that liberalizations tend to (a) increase the correlation of emerging and world market returns, (b) have little impact on return volatility, and (c) decrease local firms’ cost of capital by up to one percent.
14.10 What is a targeted registered offering and why is it useful to the corporation?
Targeted registered offerings are securities sold to foreign financial institutions that then make a market in the corporation’s securities in the foreign market. They are useful for gaining access to foreign investors and their capital.
14.11 What is project financing, and when is it an appropriate source of funds?
Project financing is a way of unbundling a project from the firm’s other assets and liabilities. A separate legal entity is created that is heavily financed with debt. Project financing is appropriate for real assets that generate a steady stream of cash flows that can be used to service the debt.
14.12 What evidence is there on the international determinants of corporate capital structure? How is the international evidence similar to the domestic U.S. evidence?
Rajan and Zingales (1995) find that leverage is positively related to the tangibility of firm assets (i.e. the proportion of fixed assets) and firm size. Leverage is negatively related to profitability and the presence of growth options (i.e. the asset market-to-book ratio). Several national markets including the domestic U.S. market share these characteristics.
Problem Solutions
14.1 a. r = rF + β (E[rW] – rF) = 5% + (1.2)(12%–5%) = 13.4% b. r = rF + β (E[rM] – rF) = 5% + (1.4)(11%–5%) = 13.4%
14.2 a. r = rF + β (E[rW] – rF) = 5% + (0.8)(10%–5%) = 9% b. r = rF + β (E[rM] – rF) = 5% + (1.2)(10%–5%) = 11%
14.3 a. The required return on Oilily’s equity within the French market is rF+β(E[rM]–rF) = 5% + (1.4)(11%–5%) = 13.4%. Oilily’s weighted average cost of capital is iWACC = (B/VL)iB(1–TC)+(S/VL)iS = (0.4)(7%)(1–0.33)+(0.6)(13.4%) = 9.916%.
b. Required return on Oilily’s stock is r = 5%+(1.2)(12%–5%) = 13.4% for an international investor. Using international sources, Oilily’s cost of capital is iWACC = (B/VL)iB(1–TC) + (S/VL)iS = (½)(6%)(1–0.33) + (½)(13.4%) = 8.710%.
c. The operating cash flow is before interest expense. In France, Oilily’s value is V = CF1/(i–g) = (€10million)/(0.09916–0.04) = €169,033,130. In the global market, Oilily’s value is V = CF1/(i–g) = €10,000,000/(0.08710–0.04) = €212,314,225. Oilily can increase its value by over 25% by financing in international markets because of this market’s higher tolerance for debt and lower required returns.
14.4 a. Grand Pet’s debt ratio is (B/VL) = 33/(33+100) = 0.25. The required return on Grand Pet’s equity is rF = + β(E[rM]–rF) = 5%+(1.2)(15%–5%) = 17%. Grand Pet’s weighted average cost of capital is iWACC = (B/VL)iB(1–TC)+(S/VL)iS = (0.25)(6%)(1–0.33)+(0.75)(17%) = 13.755%.
b. The debt-to-equity ratio is 0.50 (one part debt to two parts equity), so (B/VL) = 1/(1+2) = 0.33. Equity required return is r = rF+β(E[rW]–rF) = 5%+(0.8)(15%–5%) = 16%, and the cost of capital is iWACC = (B/VL)iB(1–TC)+(S/VL)iS = (0.33)(6%)(1–0.33) + (0.67)(16%) = 12.007%.
c. In the U.K. market, Grand Pet’s value is V = CF1 / (i–g) = (£1 billion)/(0.13755–0.03) = £9.298 billion. If Grand Pet raises funds in the global market, Grand Pet’s value is V = CF1 / (i–g) = (£1 billion)/(0.12007–0.03) = £11.103 billion. Grand Pet can increase its value nearly 20% by raising funds internationally.

Kirt C. Butler, Solutions for Multinational Finance, 5th edition (2012), John Wiley & Sons, Inc.
56
14.5 a. All-equity value is APV = VU–CF0 = (CF1 )/(1+iU)–Initial investment = (BFr112 million/1.10)–BFr100 million = BFr1,818,182. b. Borrowing €50 million at 6% results in an interest payment of iBB = €3 million. The present
value of the tax shield is (TCiBB)/1+iB) = (€990,000/1.06) €933,962. The APV of the investment is then €1,818,182 + €933,962 = €2,752,144.
c. All-equity value is APV = VU–CF0 = €12 million/0.10–€100 million = €20,000,000. The value of the perpetual tax shield is TCB = (0.33)(€50 million) = €16,500,000. The levered firm worth €36,500,000.
14.6 a. All-equity value is APV = VU–CF0 = (CF1 )/(1+iU)–Initial investment = (£108 million/1.08)–£100 million = £0. b. APV = VU + PV(financing side effects)–Initial investment. Borrowing £25 million at 6% results in interest of iBB = £1.5 million. The annual tax shield is
TCiBB = £500,000. The PV of the tax shield is (TCiBB)/(1+iB) £467,000. Since the unlevered investment has zero value, £467,000 is the APV of the 1-year investment after including the interest tax shield from the debt.
c. As a perpetuity, the all-equity value is still £0. The levered value is: APV = VU + (TCiBB)/iB–CF0 = VU + TCB–CF0 = £100,000,000 + £8,250,000 – £100,000,000 = £8,250,000. The value continues to arise solely from the interest tax shield.
14.7 a. The required return should depend on the use and not on the source of funds. Firms should use an asset-specific discount rate that reflects the opportunity cost of capital. The government’s borrowing cost has little relevance toward how these funds are used. Riskier projects should have higher required returns.
b. In the CAPM, the security market line (SML) identifies the required return as a function of the systematic risk of an asset. Consider the two investments L (low risk) and H (high risk) below. Each has an expected return of 10 percent, although their required returns from the security market line are 7.50 percent at β = 0.5 and 12.5 percent at β = 1.5, respectively.
On a risk-adjusted basis, project L should be accepted and project H should be rejected. Using a 5 percent hurdle rate for both low-risk and high-risk projects will inappropriately favor projects with high expected returns whether or not they are low-risk or high-risk projects. Over time, the asset portfolios of Chinese companies using the CD rate as their hurdle rate will tilt toward high-return, high-risk projects. From a capital markets perspective, some of these risky projects (such as project H) will be value-destroying.
c. At the government’s 5 percent hurdle rate, this investment has an “apparent” NPV of (0.1m)/0.05 – 1.5m = 0.5 million yuan. However, this fails to account for the investment’s risk. At the market required return of 10 percent (with β = 1), this asset’s value is (0.1m)/0.1 = 1 million yuan at a cost of 1.5 million yuan, for a risk-adjusted loss in value of NPV = –
E[r]
0.5 Beta
1.0 1.5
5%
10%
SML
HL

Kirt C. Butler, Solutions for Multinational Finance, 5th edition (2012), John Wiley & Sons, Inc.
57
500,000 yuan. d. Without close monitoring of the returns on investment, the manager has an incentive to
accept the government’s funds on this negative-NPV project because it increases the market value of her division by 1 million yuan. With a larger empire, the manager might be able to justify a higher salary.
14.8 a. E[r] = rF + β(E[rW]–rF) = 3% + 1.2(5%) = 9% b. E[r] = rF + β(E[rW]–rF) + δ(E[rRegion]–E[rW]) = 3% + 1.2(5%) + 1.5(4%) = 15% c. E[r] = E[rW] + CR = {rF+(E[rW]–rF)} + CR = (3%+5%) + 4% = 12% d. E[r] = E[rW] + S = {rF+(E[rW]–rF)} + S = (3%+5%) + 2% = 10% e. E[r] = rF + S (σBr-stocks/σBr-bonds) = 3% + 2% (30%/10%) = 9%

Kirt C. Butler, Solutions for Multinational Finance, 5th edition (2012), John Wiley & Sons, Inc.
58
Chapter 15 Taxes and Multinational Corporate Strategy
Answers to Conceptual Questions
15.1 What is tax neutrality? Why is it important to the multinational corporation? Is tax neutrality an achievable objective?
A neutral tax is one that does not interfere with the natural flow of capital toward its most productive use. Domestic tax neutrality is intended to ensure that incomes arising from operations (whether foreign or domestic) are taxed similarly by the domestic government. Foreign tax neutrality is intended to ensure that taxes imposed on the foreign operations of domestic companies are similar to those facing local competitors in the host countries.
15.2 What is the difference between an implicit and an explicit tax? In what way do before-tax required returns react to changes in explicit taxes?
Explicit taxes are taxes that are explicitly assessed on income of various forms. Examples include corporate and personal income taxes, dividend taxes, interest taxes, sales and property taxes, and so forth. Implicit taxes come in the form of higher pre-tax required returns in higher tax jurisdictions. An increase in an explicit tax tends to be associated with an implicit tax in the form of an increase in pre-tax required return.
15.3 How are foreign branches and controlled foreign corporations taxed in the United States?
Income from foreign branches is taxed as it is earned. Income from a controlled foreign corporation (a subsidiary that is incorporated in a foreign country and more than 50% owned by a U.S. parent) is taxed only when funds are repatriated to the U.S. parent. Income from foreign corporations that are between 10% and 50% owned by a U.S. parent is called Subpart F income and is taxed as it is earned on a pro rata basis according to sales or gross profit.
15.4 How does the U.S. Internal Revenue Code limit the ability of U.S.-based multinational corporations to reduce taxes through multinational tax planning and management?
There are two principal limitations on multinational tax planning: the overall foreign tax credit (FTC) limitation and the use of income baskets for active and passive income. The overall FTC limitation is equal to total foreign-source income times the U.S. tax rate. Excess foreign tax credits may be carried one year back or 10 years forward. Income baskets limit the usefulness of excess FTCs, because FTCs from one income basket may not be used to reduce taxes in another income basket.
15.5 Are taxes the most important consideration in global location decisions? If not, how should these decisions be made?
Global location decisions are an investment decision like any other, and must be evaluated on their opportunities, costs, and risks. Taxes are but one of a host of considerations in such a decision. Locations that are tax-advantaged usually come with disadvantages in other areas. For example, low explicit tax rates generally result in low pre-tax rates of return because investors’ demand for high after-tax rates imposes an implicit tax on income from low-tax jurisdictions. Governments also use low tax rates to overcome locational disadvantages such as a poor physical, legal or telecommunication infrastructure, an uneducated workforce, or high political risk.
Problem Solutions 15.1 From Equation 15.1, pre-tax interest rates in Costa Rican colons (CRC) relative to Chilean pesos
(CLP) are iCRC = (iCLP)(1–tCRC)/(1–tCLP) = (7%)(1–0.20)/(1–0.30) = 8%. After-tax returns are then 5.6 percent in both countries; iCRC(1–tCRC) = 8%(1-0.30) = (iCLP)(1–tCLP) = (7%)(1-0.20) = 5.6%.
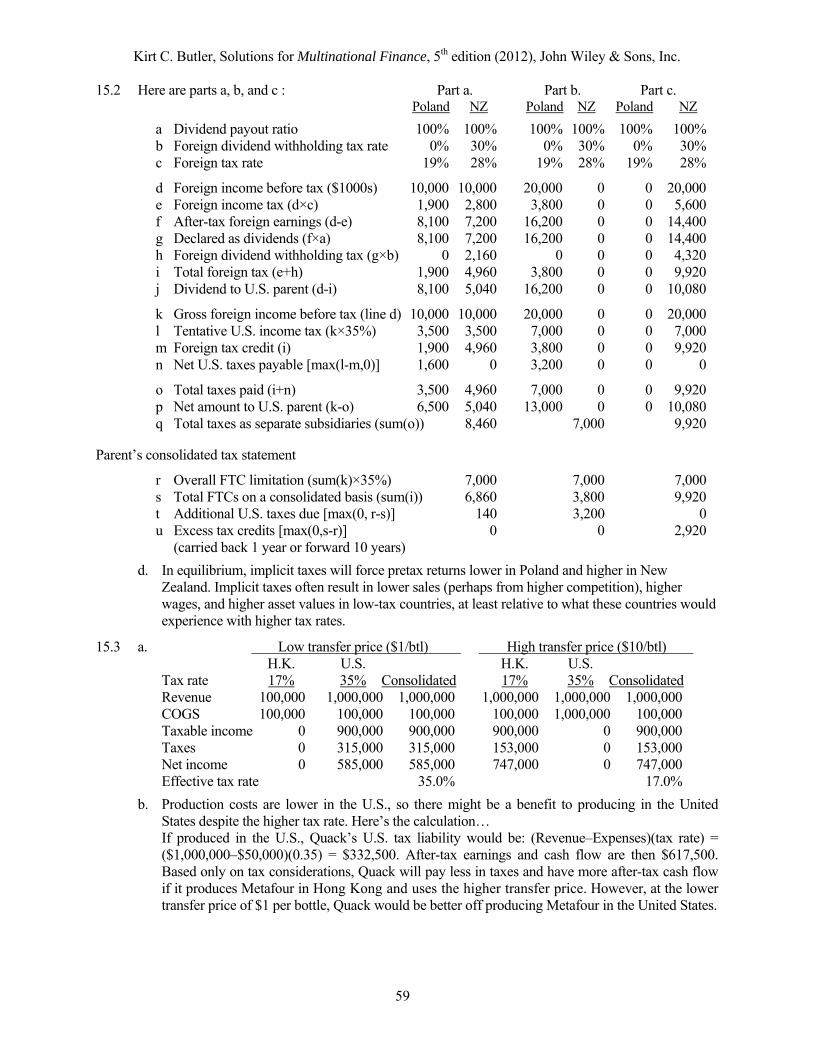
Kirt C. Butler, Solutions for Multinational Finance, 5th edition (2012), John Wiley & Sons, Inc.
59
15.2 Here are parts a, b, and c : Part a. Part b. Part c. Poland NZ Poland NZ Poland NZ
a Dividend payout ratio 100% 100% 100% 100% 100% 100% b Foreign dividend withholding tax rate 0% 30% 0% 30% 0% 30% c Foreign tax rate 19% 28% 19% 28% 19% 28%
d Foreign income before tax ($1000s) 10,000 10,000 20,000 0 0 20,000 e Foreign income tax (d×c) 1,900 2,800 3,800 0 0 5,600 f After-tax foreign earnings (d-e) 8,100 7,200 16,200 0 0 14,400 g Declared as dividends (f×a) 8,100 7,200 16,200 0 0 14,400 h Foreign dividend withholding tax (g×b) 0 2,160 0 0 0 4,320 i Total foreign tax (e+h) 1,900 4,960 3,800 0 0 9,920 j Dividend to U.S. parent (d-i) 8,100 5,040 16,200 0 0 10,080
k Gross foreign income before tax (line d) 10,000 10,000 20,000 0 0 20,000 l Tentative U.S. income tax (k×35%) 3,500 3,500 7,000 0 0 7,000 m Foreign tax credit (i) 1,900 4,960 3,800 0 0 9,920 n Net U.S. taxes payable [max(l-m,0)] 1,600 0 3,200 0 0 0
o Total taxes paid (i+n) 3,500 4,960 7,000 0 0 9,920 p Net amount to U.S. parent (k-o) 6,500 5,040 13,000 0 0 10,080 q Total taxes as separate subsidiaries (sum(o)) 8,460 7,000 9,920
Parent’s consolidated tax statement
r Overall FTC limitation (sum(k)×35%) 7,000 7,000 7,000 s Total FTCs on a consolidated basis (sum(i)) 6,860 3,800 9,920 t Additional U.S. taxes due [max(0, r-s)] 140 3,200 0 u Excess tax credits [max(0,s-r)] 0 0 2,920 (carried back 1 year or forward 10 years)
d. In equilibrium, implicit taxes will force pretax returns lower in Poland and higher in New Zealand. Implicit taxes often result in lower sales (perhaps from higher competition), higher wages, and higher asset values in low-tax countries, at least relative to what these countries would experience with higher tax rates.
15.3 a. Low transfer price ($1/btl) High transfer price ($10/btl) H.K. U.S. H.K. U.S. Tax rate 17% 35% Consolidated 17% 35% Consolidated
Revenue 100,000 1,000,000 1,000,000 1,000,000 1,000,000 1,000,000 COGS 100,000 100,000 100,000 100,000 1,000,000 100,000 Taxable income 0 900,000 900,000 900,000 0 900,000 Taxes 0 315,000 315,000 153,000 0 153,000 Net income 0 585,000 585,000 747,000 0 747,000 Effective tax rate 35.0% 17.0%
b. Production costs are lower in the U.S., so there might be a benefit to producing in the United States despite the higher tax rate. Here’s the calculation…
If produced in the U.S., Quack’s U.S. tax liability would be: (Revenue–Expenses)(tax rate) = ($1,000,000–$50,000)(0.35) = $332,500. After-tax earnings and cash flow are then $617,500. Based only on tax considerations, Quack will pay less in taxes and have more after-tax cash flow if it produces Metafour in Hong Kong and uses the higher transfer price. However, at the lower transfer price of $1 per bottle, Quack would be better off producing Metafour in the United States.
Kirt C. Butler, Solutions for Multinational Finance, 5th edition (2012), John Wiley & Sons, Inc.
60
Chapter 16 Real Options and Cross-Border Investment Strategy
Answers to Conceptual Questions
16.1 What is a real option?
A real option is an option on a real asset.
16.2 In what ways can managers’ actions seem inconsistent with the “accept all positive-NPV projects” rule? Are these actions truly inconsistent with the NPV decision rule?
The text discusses several apparent violations of the NPV rule such as: 1) use of inflated hurdle rates, 2) failure to abandon investments that are losing money, and 3) entry into new or emerging markets and technologies. Each of these apparent violations arises when the NPV decision rule is applied without considering all of the opportunity costs of investing and without considering managerial flexibility in the face of high uncertainty and changing market conditions. The inconsistencies arise from a failure to take into account all of the opportunity costs of investing. Once all opportunity costs are included, managers’ actions are less likely to be inconsistent with the NPV rule.
16.3 Are managers who do not appear to follow the NPV decision rule irrational?
Managers must consider how they might respond to future events. Managers are not acting irrationally if, through attempting to value their flexibility in responding to an uncertain world, their actions appear to be inconsistent with the NPV decision rule. They are irrational (or at least near-sighted) if they apply the NPV decision rule in an inflexible way that does not take into account all of the opportunity costs of investing.
16.4 Why is the timing option important in investment decisions?
Investments must compete not only with other projects but with versions of themselves initiated at each future date.
16.5 What is exogenous uncertainty? What is endogenous uncertainty? What difference does the form of uncertainty make to the timing of investment?
Exogenous uncertainty is outside the control of the firm. Endogenous uncertainty exists when the act of investing reveals information about price or cost. Exogenous uncertainty creates an incentive to delay investment whereas endogenous uncertainty creates an incentive to speed up investment.
16.6 In what ways are the investment and abandonment options similar?
The abandonment option is the flip side of the investment option. Each entails an upfront investment that changes the stream of future cash flows.
16.7 What is a switching option? What is hysteresis? Is hysteresis a switching option?
A switching option is a sequence of alternating puts and calls. For example, hysteresis occurs when firms fail to enter apparently profitable markets and, once entered, persist in operating at a loss. Hysteresis is a combination of an option to invest and an option to abandon and as such is a form of switching option.
16.8 What are assets-in-place? What are growth options?
Assets-in-place are those assets in which the firm has already invested. Growth options are the firm’s opportunities to lever its existing assets-in-place (including human assets and core competencies) into new products and markets.
16.9 Why does the NPV decision rule have difficulty in valuing managerial flexibility?
The biggest difficulty lies in identifying the appropriate discount rate on investment. The discount rate is difficult to determine because: a) options are always more volatile than the asset or assets on which they are based; b) the volatility of an option changes with change in the value(s) of the underlying asset(s); and c) returns on options are not normally distributed.

Kirt C. Butler, Solutions for Multinational Finance, 5th edition (2012), John Wiley & Sons, Inc.
61
16.10 What are the shortcomings of option pricing methods for valuing real assets?
Difficulties include: a) identifying the underlying asset or assets; b) specifying the return-generating process of the underlying asset(s); and c) the fact that the values of real options are not directly observable in the marketplace.
Problem Solutions
16.1 a. A decision tree represents possible paths to future states of the world as branches on a tree. For Grolsch’s invest in Dubiety, the decision tree looks like:
Invest today
Invest in one year
Invest at Pbeer = D75
Invest at Pbeer = D25
VD = ?
VD(Pbeer=D75) = ?
VD(Pbeer=D25) = ?
b. Equation (16.2) from the text must be modified to include fixed costs:
INVEST TODAY: V = [(P–VC)Q–FC]/i – I0
V(invest today) = [((D50/btl–D10/btl)(1,000,000 btls) – D10,000,000)/0.10] – D200,000,000 = D100,000,000 invest today?
c. Equation 16.3 from the text must be modified to include fixed costs:
WAIT ONE YEAR: V = [[(P–VC)Q–FC]/i] / (1+i) – I0
V|Pbeer=D75 = [(((D75/btl–D10/btl)(1,000,000 btls)–D10,000,000)/0.10)/(1.10)]–D200,000,000
= D300,000,000 invest
V|Pbeer=D25 = [(((D25/btl–D10/btl)(1,000,000 btls)–D10,000,000)/0.10) / (1.10)]–D200,000,000
= –D154,545,455 < $0 don’t invest
V(wait one year) = [Prob(P1=D75)](V|P1=
D75)+[Prob(P1=D25)](V|P1=
D25) = (½) (D300,000,000) + (½)(D0) = +D150,000,000 > V(invest today) > D0
d. Option Value = Intrinsic Value + Time Value V(wait one year) = V(invest today) + Opportunity cost of investing today D150,000,000 = D100,000,000 + D50,000,000
e. Wait one period before deciding to invest.
16.2 We know from Problem 16.1 that investment in a single brewery today has value. The issue is whether to invest in all five breweries today or invest in a single exploratory brewery and then make a decision on the four additional breweries in one year after receiving information about the price of beer produced by the exploratory brewery.
a. Decision tree:
Invest in all five breweries today
Invest in one brewery
Invest in 4 more if Pbeer = D75
Don’t invest if Pbeer = D25
VD = D500 million
VD(Pbeer=D75) = ?
VD(Pbeer=D25) = ?
b. At the expected end-of-year price of D50/btl, the NPV of a single brewery is D100m as in Problem 16.1. The PV of the perpetual stream of cash inflows is either [(D75–D10)(1m)–D10m)/0.10] = D550m or [((D25–D10)(1m)–D10m)/0.10] = D50m with equal probability, for an expected value of D300m. Net of the required D200m investment, this has a net present value of D100m. Therefore,
V(invest in all 5 breweries today) = 5×V(invest in 1 today) = D500 million.

Kirt C. Butler, Solutions for Multinational Finance, 5th edition (2012), John Wiley & Sons, Inc.
62
c. If Grolsch management waits one year before making its investment decision, beer prices will be either D25 or D75 with certainty in this problem. Of course, it won’t know this until it invests in the first, exploratory brewery. The NPV of each of the four additional breweries at a price of D75/bottle is D300,000,000, as in Problem 16.1. At a price of D25/bottle, the optimal strategy is to forgo further investment. The NPV of sequential investment is then:
V(invest in exploratory brewery and continue to invest if it is positive-NPV) = V(invest in one brewery today) + 4 [Prob(Pbeer=
D75)] (V|invest in 1 year if Pbeer=D75)
= D100m + 4 (½) (D300m) = +D700 million > D0 Invest in an exploratory brewery
Alternatively, V (invest in exploratory brewery) = [Prob(Pbeer=$25)](V|Pbeer=$25) + [Prob(Pbeer=$75)](V|Pbeer=$75) = (½) [(D25–D10)(1m)–D10m)/(0.1)–D200m] + (½) [ (((D75–D10)(1m)–D10m)/(0.1)–D200m) + (4)(D300m) ] = (½) [–D150m] + (½)[(D350m) + (4)(D300m)] = D700 million > D0 Invest in an exploratory brewery
d. Option Value = Intrinsic Value + Time Value V(wait one year) = V(invest today) + Opportunity cost of investing in four additional breweries today D700,000,000 = D500,000,000 + D200,000,000
The NPV of investing in all five breweries today is –D200,000,000. By investing today, Grolsch would forgo the flexibility provided by the timing option on this sequential investment.
e. Invest in an exploratory brewery today and continue to invest if warranted by the quality (and hence market price) of the output. Endogenous uncertainty has created an incentive to hasten the first investment.
16.3 a. V(invest today) = [((R18,000/car–R15,000/car)(10,000cars))/0.20] – R100 million = R50 million invest today? If you wait one year before deciding, then NPV will be either: V|C1=R12,000 = [((R18,000/car–R12,000/car)(10,000cars)/0.20]/1.20] – R100 million = R150 million invest, or V|C1=R18,000 = [((R18,000/car–R18,000/car)(10,000cars)/0.20]/1.20] – R100 million = –R100 million do not invest (so that V = R0). V(wait one year) = [Prob(C1=R12,000)](V|C1=R12,000) + [Prob(C1=R18,000)](V|C1=R18,000) = (½)(R150,000,000) + (½)(R0) = R75,000,000 > V(invest today) =R50,000 > R0 The time value of this real option reflects the opportunity cost of investing today: Time value = option value – intrinsic value = R75 million – R50 million = R25 million.
b. V(invest in 10 plants today) = 10×V(invest in one plant today) = R500 million
V(invest in an exploratory plant and then invest in 9 additional plants if V>0) = [Prob(C1=R12,000)](V|C1=R12,000) + [Prob(C1=R18,000)](V|C1=R18,000) = (½)[(R200 million)+(9)(R150 million)] + (½)(–R100 million) = +R725 million > V(invest in all ten today) = R500 million > R0
The opportunity cost of investing in all 10 plants today equals the time value of this real option: Time value = Option value – Intrinsic value = R725 million – R500 million = R225 million.
Alternatively, V(invest in an exploratory plant and then invest in 9 additional plants if NPV>0) = V(invest in one plant today) + 9 [Prob(C1=R12,000)] (V|invest in 1 year if C1=R12,000) = R50m + 9 (½) (150m) = +R725 million > R0 Invest in an exploratory plant
16.4 a. At expected production of 150 oz, the NPV of investment in a single mine is V(now-or-never) = [(¥5,000/oz–¥1,000/oz)(150 oz)] – ¥600,000 = ¥0. The NPV of investing in all five mines as a now-or-never decision is also ¥0.
b. If you invest in an exploratory mine and then reconsider based on the revealed information about

Kirt C. Butler, Solutions for Multinational Finance, 5th edition (2012), John Wiley & Sons, Inc.
63
yield, then the NPV of the first mine is ¥0. The NPV of each additional mine can be calculated conditional on the yield of the first mine:
V|(Q=200 oz) = [(¥5,000/oz–¥1,000/oz)(200 oz)] – ¥600,000 = ¥200,000 V|(Q=100 oz) = [(¥5,000/oz–¥1,000/oz)(100 oz)] – ¥600,000 = –¥200,000
so don’t invest at the lower guano yield. Then,
V(sequential investment) = V (exploratory mine) + Prob(Q=200 oz)×(4)×V| (Q=200 oz) = ¥0 + (½)[(4)(¥200,000)] = ¥400,000.
c. The best strategy is to invest in an exploratory mine today and continue to invest if yield is high.
16.5 a. At expected production of 150 oz, the NPV of investment in a single mine is
V(now-or-never) = [(¥5,000/oz–¥1,000/oz)(150 oz)(1–0.3)+¥600,000(0.3)]/(1.10) – ¥600,000 ≈ –¥54,545
The NPV of investing in all 5 mines as a now-or-never decision is –¥272,727
b. If you invest in an exploratory mine and then reconsider based on the revealed information about yield, then the NPV of the first mine is –¥54,545. The NPV of each additional mine can be calculated conditional on the yield of the first mine:
V|(Q=200 oz) = [(¥5,000/oz–¥1,000/oz)(200 oz)(1–0.3)+¥600,000(0.3)]/(1.10)2 – ¥600,000/(1.10) ≈ ¥66,116 V|(Q=100 oz) = [(¥5,000/oz–¥1,000/oz)(100 oz)(1–0.3)+¥600,000(0.3)]/(1.10)2 – ¥600,000/(1.10) ≈ –¥165,289
You won’t invest at the lower guano yield. Then,
V(sequential investment) = V (exploratory mine) + Prob(Q=200 oz)×(4)×V| (Q=200 oz) ≈ –¥54,545 + (½)[(4)(¥66,116)] ≈ ¥77,686
c. Although taxes reduce the value of this real option, the optimal strategy is still to invest in an exploratory mine and continue to invest if yield is high.
16.6 a.
Abandon today
Decide in one year
Don’t abandon at Pbeer = D35
Abandon if Pbeer = D15
VD = ?
VD(Pbeer=D35) = ?
VD(Pbeer=D15) = ?
b. If the project is abandoned today at a cost of D10,000,000, cash flows from the project will be
forgone and there will be a minus sign on operating cash flow in the NPV equations that follow. At the expected end-of-year price of ½(D15/btl+D35/btl) = D25/btl, the NPV of the “abandon
today” alternative is: V(abandon today) = –[((D25/btl–D20/btl)(1,000,000 btls)–D10,000,000)/0.10]–D10,000,000 = D40,000,000 > D0 abandon today?
c. If Grolsch management waits one year before making its abandonment decision, beer prices will be either D15 or D35 with certainty.
V|P1=D35 = –[(D35/btl–D20/btl)(1,000,000 btls)–D10,000,000) /0.10)/(1.10)]–D10,000,000
= –D55,454,545 don’t abandon if price rises to D35
V|P1=D15 = –[(D15/btl–D20/btl)(1,000,000 btls)–D10,000,000) /0.10)/(1.10)]–D10,000,000
= D126,363,636 abandon if price falls to D15
V(wait 1 year) = [Prob(P1=D35)](V|P1=
D35)+[Prob(P1=D15)](V|P1=
D15)

Kirt C. Butler, Solutions for Multinational Finance, 5th edition (2012), John Wiley & Sons, Inc.
64
= (½) (D126,363,636) + (½)($0) = D63,181,818 > V(abandon today) > D0
d. Option Value = Intrinsic Value + Time Value V(wait one year) = V(abandon today) + Opportunity cost of abandoning today +D63,181,818 = +D40,000,000 + D23,181,818
e. Wait one year before making the abandonment decision.
16.7 a. There are 22 = 4 equally-likely price paths in the price lattice, resulting in three possible outcomes.
Expected revenue = (KS20m)(0.25)+(KS40m)(0.5)+(KS80m)(0.25) = KS 45 million Expected variable production costs are (KS10k)[(1k+2k)/2] = KS 15m V(all 5 mines now-or-never) = 5×[KS45m–KS15m–KS20m] = 5×[KS10m] = KS 50m Alternatively, V(all 5 mines now-or-never) = 5[[¼(20k–10k)(1k)+¼(20k–10k)(2k)+¼(40k–10k)(1k)+¼(40k–10k)(2k)]–20m] = 5×[KS 10m] = KS 50 million
b. If you invest in an exploratory mine and then reconsider your investment decision based on the revealed information, then the NPV of the first mine is KS 10 million. The NPV of each additional mine is then one of the following:
V|(Q=1k oz and P=20k) = [(20k/ct–10k/ct)(1k ct)] – 20m = –10m so don’t invest V|(Q=2k oz and P=20k) = [(20k/ct–10k/ct)(2k ct)] – 20m = 0m so don’t invest V|(Q=1k oz and P=40k) = [(40k/ct–10k/ct)(1k ct)] – 20m = +10m so invest V|(Q=2k oz and P=40k) = [(40k/ct–10k/ct)(2k ct)] – 20m = +40m so invest V(sequential investment) = 10m + 4×[(0.25)(10m)+(0.25)(40m)] = KS 60 million
c. The NPV of immediate investment in all 5 mines is KS 50 million. This is KS 10 million less than the NPV of the sequential investment opportunity. The forgone time value of KS 10 million is the opportunity cost of investing in all 5 mines today.
16.8 This provocative question goes well beyond the material in the chapter. It turns out that the impact of a real investment opportunity depends on whether it is firm-specific or shared with other firms in an industry. If a firm has a real investment option that only it can exercise, such as a patent-protected drug that effectively combats prostate cancer, then the analysis in this chapter is appropriate. There will be an optimal time to invest and perhaps to exit, and it might pay to make a sequential investment to gain more information.
In a situation in which the entire industry shares an investment option (such as Grolsch’s proposed investment in Eastern Europe), investment returns are sensitive to competitors’ actions. When exit costs are zero, the effect of a shared investment opportunity is spread across all firms in the industry and results in a lower value to each firm. When there are exit costs, competitive response to uncertainty is asymmetric and firms must be more cautious in their investment decisions. As in the case of hysteresis, firms might stay invested in unprofitable situations in the hope that other less-profitable firms will exit first.
=> KS80,000,000 with p=0.25
KES40k/ct
Quality Quantity
2k cts
KES40k/ct
KES20k/ct
KES20k/ct => KS40,000,000 with p=0.50
=> KS20,000,000 with p=0.25
1k cts

Kirt C. Butler, Solutions for Multinational Finance, 5th edition (2012), John Wiley & Sons, Inc.
65
Chapter 17 Corporate Governance and the International Market for Corporate Control
Answers to Conceptual Questions
17.1 Define corporate governance. Why is it important in international finance?
Corporate governance refers to the way in which major stakeholders influence and control the modern corporation. Typically, there is a supervisory board (e.g., the Board of Directors in the U.S.) that represents the most influential stakeholders (debtholders in bank-based systems and equity in market-based systems). The supervisory board monitors the management team which manages the day-to-day operations of the corporation. The form of corporate governance determines the particular stakeholders that are represented on the board and has a major influence on top executive turnover and the market for corporate control.
17.2 In what ways can one firm gain control over the assets of another firm?
Direct means of acquiring control over another firm’s assets include an outright purchase of those assets, a purchase of equity, and through merger or consolidation. Indirect means include joint ventures or other collaborative alliances.
17.3 What is synergy?
When the whole is greater than the sum of the parts in a corporate acquisition.
17.4 Describe several differences in the role of commercial banks in corporate governance in China, Germany, Japan, and the United States.
The largest commercial banks in China are partially-privatized state owned enterprises (SOEs) in which the Chinese government maintains a controlling interest. The four largest banks account for nearly half of Chinese banking assets, and these banks and the government have a strong voice in the boardrooms of other partially privatized SOEs. Firms in China’s private sector are less reliant on the government and on the large state-owned commercial banks. Banks in Germany have few constraints on their participation in corporate boardrooms. They are major investors of equity capital, and also serve as brokers and investment bankers. Banks in Japan cannot own more than 5% of the equity of any single company, but are in a prominent role in corporate boardrooms through their interactions with other keiretsu members. Commercial banks in the U.S. have a more limited role in corporate boardrooms than in many other countries because of historical constraints on their banking activities including equity ownership, brokerage, and investment banking activities.
17.5 Describe four ways that banks can influence corporate boardrooms in countries – such as Germany – that offer universal banking?
Universal banking refers to a financial system in which banks offer a full range of banking and financial services. They can influence corporate boardrooms in four ways: 1) supply debt capital via commercial loans, 2) invest in equity, 3) actively vote the shares of their trust (pension fund) and brokerage customers, and 4) serve as investment bankers for debt and equity issues to the public.
17.6 How does the legal environment affect minority investors? Include a description of tunneling n your answer.
Minority investors in countries with poor legal protections are exposed to tunneling, which is the expropriation of corporate assets from minority shareholders by controlling shareholders, management, or both. Because of this risk, countries with poor legal protections for minority investors experience lower industrial growth and less efficient capital allocation than countries with enforceable legal protections.
17.7 Why are hostile acquisitions less common in Germany and Japan than in the United Kingdom and the United States?
Corporate governance in Germany and Japan is characterized by debt and equity ownership that is concentrated in the hands of one or more major stakeholders. Management in Germany and Japan is
Kirt C. Butler, Solutions for Multinational Finance, 5th edition (2012), John Wiley & Sons, Inc.
66
much more closely tied to this major stakeholder than their counterparts in the U.K. and the U.S. Consequently, acquisitions in Germany and Japan are difficult to accomplish without the consent and cooperation of this major stakeholder or stakeholders. The relatively dispersed equity ownership in the U.K. and U.S. allow hostile suitors to appeal directly to the public markets through a tender offer. Tender offers in the U.K. and U.S. may or may not be in cooperation with current management.
17.8 How is turnover in the ranks of top executives similar in China, Germany, Japan and the United States? How is it different?
The why and when of top executive turnover is similar in these countries. Top executives in non-performing companies are likely to be replaced. The how of top executive turnover differs, however. Top executive turnover is initiated and executed by the lead bank in Germany, by the keiretsu (perhaps by the main bank) in Japan, and by the public market for corporate control in China and the United States. State-owned companies in China are an exception, in that politically-connected CEOs in state-owned enterprises are more entrenched than similar CEOs in the private sector.
17.9 Who are the likely winners and losers in domestic mergers and acquisitions that involve two firms incorporated in the same country? How are the returns to acquiring firm shareholders related to the method of payment (cash versus stock) and the acquiring firm’s free cash flow or profitability?
In the United States, target shareholders gain while acquiring firm shareholders may or may not win. Acquiring shareholders are more likely to win than lose in non-U.S. domestic markets. Bidding firm shareholders are more likely to win: a) when cash is offered rather than stock, and b) when the firm does not have a lot of free cash flow
17.10 In what ways are the winners and losers in cross-border mergers and acquisitions different than in domestic U.S. mergers and acquisitions?
Shareholders of the bidding firm are more likely to win in a cross-border merger or acquisition. Target firm shareholders win in either case.
17.11 How is M&A activity related to real exchange rates?
Empirical studies find that a strong domestic currency leads to both more foreign acquisitions and to higher bidder returns.
Problem Solutions
17.1 a. E b. D c. F d. A e. B f. G g. C
17.2 The pre-acquisition value of the two firms is $3 billion + $1 billion = $4 billion. Synergy is 10% of this value, or (0.1)($4 billion) = $400 million. After subtracting the (0.2)($1 billion) = $200 million acquisition premium, Agile shareholders are likely to see a $200 million appreciation in the value of their shares.
17.3 Managers like free cash flow because it makes expansion possible without resort to external capital markets for financing. Unfortunately, the existence of free cash flow also makes it more likely that management will waste resources on new ventures in which it has no business (Jensen [1986]). When cash flow is scarce, managers are more likely to pick winning ventures.
17.4 A real increase in the value of the domestic currency increases the purchasing power of domestic residents. When the domestic currency is strong, domestic firms are more likely to acquire foreign targets, and shareholders of the acquiring firm are more likely to benefit from the acquisition.
17.5 Non-performing loans in Japan forced consolidation of Japanese banking in the 2000s. The three largest financial institutions in Japan at the time of this writing were Mitsubishi UFJ Financial Group (including the former Bank of Tokyo-Mitsubishi, UFJ, Sanwa Bank, Tokai Bank, & Tokyo Trust), Sumitomo Mitsui Banking Corp (Sumitomo Bank and Sakura Bank), and Mizuho Holding Financial Group (Fuji Bank, Dai-Ichi Kangyo Bank, and Industrial Bank of Japan).

Kirt C. Butler, Solutions for Multinational Finance, 5th edition (2012), John Wiley & Sons, Inc.
67
PART V International Portfolio Investment and Asset Pricing
Chapter 18 International Capital Markets
Answers to Conceptual Questions
18.1 What are the characteristics of a domestic bond? an international bond? a foreign bond? a Eurobond? a global bond?
Domestic bonds are issued and traded within a single country’s internal market and are denominated in that country’s currency. International bonds are traded outside the country of the issuer. The two kinds of international bonds are foreign bonds and Eurobonds. Foreign bonds are issued in a domestic market by a foreign borrower, denominated in domestic currency, marketed to domestic residents, and regulated by the domestic authorities. Eurobonds are denominated in one or more currencies but are traded in external markets outside the borders of the countries issuing those currencies. A global bond trades in the Eurobond market as well as in one or more national bond markets.
18.2 What are the benefits and drawbacks of offering securities in bearer form relative to registered form?
Bearer bonds retain the anonymity of the owner. Owners of bearer bonds must ensure that they do not lose the bonds or the bond coupons since the bearer is assumed to be the legal owner of the bond.
18.3 What is the difference between a continuous quotation system and a periodic call auction?
In a continuous quotation system, buy and sell orders are matched as they arrive with market-makers assuring liquidity in individual shares. In a periodic call auction, shares are bought and sold only at pre-specified times. Continuous quotation systems are more appropriate for actively traded shares. Periodic call auction systems are frequently used for thinly traded shares.
18.4 What is the difference between a spot and a forward stock market?
Spot (or cash basis) stock markets settle trades immediately (typically within a few days). Forward (or futures) stock markets settle trades on a specified future date.
18.5 What is the EU’s “single passport”? How can a financial market or institution qualify?
The “single passport” of the EU Investment Securities Directive of 1993 provides EU investment firms a “passport” to operate in other EU countries if they have the approval of regulatory authorities in their home country. Firms must satisfy three conditions.
1. The firm must meet the EU’s capital adequacy requirements. 2. The firm’s directors must be sufficiently experienced. 3. The firm must appropriately safeguard their clients’ funds.
18.6 Describe the characteristics of futures, options, and swaps.
A futures contract is a commitment to exchange a specified amount of one asset for a specified amount of another asset on a specified future date. An option is a contract that gives the option holder the right to buy or sell an underlying asset at a specified price and on a specified date. A swap is an agreement to exchange two assets or liabilities and, after a prearranged length of time, to re-exchange the assets or liabilities.
18.7 List the various ways in which you might invest in foreign securities.
a) investment in MNCs, b) direct investment in individual foreign securities (through direct purchase in the foreign market, direct purchase in the domestic market through ADRs or American shares, globally diversified mutual funds or funds specializing in international securities such as closed-end country funds), hedge funds, equity-linked Eurobonds (convertibles or warrants), or index futures, options or swaps.
18.8 Do MNCs provide international portfolio diversification benefits? If so, do they provide the same diversification benefits as direct ownership of companies located in the countries in which the MNC does business?
Owning shares in an internationally diversified MNC provides indirect diversification benefits. Unfortunately, MNC share prices move more with the home market than with foreign markets, so

Kirt C. Butler, Solutions for Multinational Finance, 5th edition (2012), John Wiley & Sons, Inc.
68
MNCs do not provide the same diversification benefits as direct investment in foreign shares.
18.9 What is the difference between a passive and an active investment philosophy?
Passive strategies do not try to shift assets in anticipation of market shifts. Rather, they follow a ‘buy-and-hold’ philosophy that identifies the types of assets that are to be held and then take advantage of diversification to achieve optimal performance. Active strategies try to shift between asset classes or between individual securities in an effort to anticipate changes in market values.
18.10 What makes cross-border financial statement analysis difficult?
Differences in language, accounting measurement (such as accounting for cash, goodwill, discretionary reserves, pension liabilities, and inflation), and financial disclosure requirements.
18.11 What alternatives does a multinational corporation have when investors in a foreign country demand accounting and financial information?
The MNC can (1) do nothing, (2) prepare convenience translations, (3) prepare supplementary financial statements using different accounting principles, such as U.S. GAAP or the IAS.
Problem Solutions
18.1 No interest accrues on the 31st of the month with the 30/360 convention.
18.2 With the actual/365 convention, 31 days out of 182.5 days would have accrued by July 31. This is (31/182.5) ≈ 16.986% of the semiannual interest payment.
18.3 Three days of interest accrue on February 28 during years that are not leap years. During leap years, one day of interest accrues on February 28 and two days of interest accrue on the 29th of February.
18.4 a. According to the U.S. bond equivalent yield convention, the yield of a bond selling at par is equal to the coupon yield; that is, 8½% compounded semiannually (or 4.25% semiannually).
b. According to the effective annual yield quotation used in Europe, the yield to maturity is the solution to (1.0425)2–1 ≈ 8.6806%.
18.5 a. The yield on a semiannual basis is the solution to: 105.66 = (4.25)/(1+i) + (4.25)/(1+i)2 + … (4.25)/(1+i)59 + (104.25)/(1+i)60 for an effective semiannual yield of i = 4 percent. The U.S. bond equivalent yield convention
would quote this as 8 percent compounded semiannually. b. The effective annual yield is (1.04)2–1 = 8.16 percent.
18.6 Countries with large stock markets tend to have large domestic bond markets as well. However, there are exceptions. For example, stock markets in China and India are large relative to their bond markets.
18.7 a. NAV = (CNY 20 billion) / (CNY 6.25/$) = $3.2 billion NAV, or $32.00/share. b. The fund is worth ($30/share)(100,000,000 shares) = $30 billion in the U.S., or a 6.25 percent
discount to NAV in China. As to whether this is a good investment, the answer is “it depends.” If it were possible to buy the depository receipts in New York and sell the corresponding A-shares in China, then an arbitrage profit could be earned. The China Securities Regulatory Commission has announced its intention to integrate these markets, but as of 2011 this goal had not yet been accomplished. In the long term, these prices will converge. In the short term, the A-share premium could get bigger or smaller. Let the buyer beware.
18.8 a. The major argument for regulation of hedge funds is that they are exerting an increasing influence over financial markets and should be regulated to avoid a situation in which they precipitate or acerbate a market collapse. The major argument against regulation is that they are private investment partnerships and should not be subject to public disclosure requirements.
b. The arguments for and against public disclosure are the same as those for and against increased regulation. The Securities and Exchange Commission was established to protect investors from fraud and misrepresentation in public securities issues. The legal rules could be loosened to include hedge funds in the definition of a public issue. Ultimately, a line must be drawn to distinguish private from public investment funds.

Kirt C. Butler, Solutions for Multinational Finance, 5th edition (2012), John Wiley & Sons, Inc.
69
Chapter 19 International Portfolio Diversification
Answers to Conceptual Questions
19.1 How is portfolio risk measured? What determines portfolio risk?
Portfolio risk is measured by the standard deviation (or variance) of return. Portfolio risk depends on the variances and covariances of the assets in the portfolio.
19.2 What happens to portfolio risk as the number of assets in the portfolio increases?
As the number of assets held in a portfolio increases, the variance of return on the portfolio becomes more dependent on the covariances between the individual securities and less dependent on the variances of the individual securities.
19.3 What happens to the relevant risk measure for an individual asset when it is held in a large portfolio rather than in isolation?
The risk of an individual asset in a large portfolio depends on its return covariance with other assets in the portfolio and not on its return variance. This is called systematic risk.
19.4 In words, what does the Sharpe Index measure?
Sharpe’s measure captures the ex post return/risk performance of an asset by dividing return in excess of the riskfree rate by the asset’s standard deviation of return. In other words, it measures the asset’s “bang for the buck.”
19.5 Name two synonyms for “systematic risk.”
Systematic risk is the same as non-diversifiable risk. In the context of the CAPM, the only systematic risk is market risk (that is, risk related to the market factor).
19.6 Name two synonyms for “unsystematic risk.”
Diversifiable risk is asset-specific (company- or country-specific) or unique risk. In the context of the CAPM, diversifiable risk includes only non-market risk (i.e., risk unrelated to the market factor).
19.7 Which portfolio has the most to gain from currency hedging - a portfolio of international stocks or a portfolio of international bonds? Why?
Nearly all of the variation in bond returns within a country come from changes in interest rates in that country. Stocks have a much larger random component. Without the additional security-specific variability of stocks, the percentage of currency risk in the return variance of an international bond portfolio is much higher than in an international stock portfolio. Currency risk hedging is much more effective in reducing the variability of foreign bond investments than of foreign stock investments.
19.8 Is international diversification effective in reducing portfolio risk? Why?
International portfolio diversification can reduce portfolio risk in two ways: 1) national stock markets are only loosely linked, and 2) the correlation between exchange rates and national market returns is very low, so domestic-currency returns on foreign investments are further isolated from returns elsewhere in the domestic market.
19.9 What is a perfect financial market?
The perfect market assumptions include frictionless markets, rational investors, equal access to market prices, and equal access to costless information.
19.10 Are real world financial markets perfect? If not, in what ways are they imperfect?
Following the definition of a perfect financial market, financial market imperfections can be categorized as market frictions (government controls, taxes, transactions costs), investor irrationality, and unequal access to market prices or information.
Kirt C. Butler, Solutions for Multinational Finance, 5th edition (2012), John Wiley & Sons, Inc.
70
19.11 Describe some of the barriers to international portfolio diversification.
Barriers include a) market frictions such as government controls, taxes, and transactions costs, b) unequal access to market prices in foreign markets, and c) unequal access to information on foreign assets. Investor irrationality also can be a barrier to international portfolio diversification.
19.12 What is home asset bias? What might be its cause?
Home asset bias is the preference of investors for local assets. Some international asset pricing models suggest that domestic assets are preferred because they serve as a hedge against domestic inflation. Other explanations revolve around market imperfections (frictions, irrationality, or unequal access).
19.13 What is “free float”?
Free float cap refers to the market value of shares that are available for trade; that is, adjusted for controlling shareholders (e.g., founding families) or other investors that do not trade their shares.
Problem Solutions
19.1 E[rP] = (½)(0.129)+(½)(0.130) = 0.1295, or 12.95% Var(rP) = (½)2(0.282)2+(½)2(0.300)2 + 2(½)(½)(0.717)(0.282)(0.300) = 0.0727 σP = (0.0727)1/2 = 0.2696, or 26.96% SI = (rP – rF)/σP = (0.1295–0.061)/(0.2696) = 0.254, which is superior in return/risk performance to
either the French (0.241) or Germany (0.230) markets alone.
19.2 E[rP] = (½)(0.139)+(½)(0.130) = 13.45% Var(rP) = (½)2(0.300)2+(½)2(0.337)2 + 2(½)(½)(0.402)(0.300)(0.337) = 0.0712 σP = (0.0712)1/2 = 0.2669, or 26.69% SI = (0.1345–0.061)/(0.2669) = 0.2754, which is superior in return/risk performance to either the
German (0.230) or Japan (0.231) markets alone.
19.3 E[rP] = (½)(0.104)+(½)(0.084) = 0.094, or 9.4% Var(rP) = (½)2(0.183)2+(½)2(0.108)2 + 2(½)(½)(0.360)(0.183)(0.108) = 0.0148 σP = (0. 0148)1/2 = 0.1218, or 12.18% SI = (0.094–0.061)/(0.1218) = 0.271, which is superior to the performance of globally diversified
stocks (0.235) or bonds (0.213) alone.
19.4 E[rP] = (⅓)[(0.139)+(0.134)+(0.102)] = 0.125, or 12.5% Var(rP) = (⅓)2[(0.337)2+(0.283)2+(0.180)2] +2(⅓)2[(0.403)(0.337)(0.283)+(0.355)(0.337)(0.180)+(0.582)(0.283)(0.180)] = 0.0450 σP = (0. 0450)1/2 = 0.2122, or 21.22% SI = (0.1257–0.061)/(0.2122) = 0.302, which is superior in return/risk performance to the Japanese
(0.231), U.K. (0.258), and U.S. stocks (0.228) alone.
19.5 U.S.G = +1: σP = (XU.S.σU.S. + XGσG) = (0.5)(0.1) + (0.5)(0.2) = 0.15 U.S.G = –1: σP = | XU.S.σU.S. – XGσG | = |(0.5)(0.1) – (0.5)(0.2)| = 0.05 U.S.G = 0: σP = (XU.S.
2σU.S.2 + XG
2σG2)½ = [(0.5)2(0.1)2 + (0.5)2(0.2)2] ½ = 0.11
U.S.G = 0.3: σP = (XU.S.2σU.S.
2 + XG2σG
2 + 2XU.S.XGσU.S.σGU.S.G) ½
= [0.520.12 + 0.520.22 + 2(0.5)(0.5)(0.1)(0.2)(0.3)] ½ = 0.1245
19.6 E[rp] = XAE[rA] + XBE[rB] + XCE[rC] = 0.2(0.08) + 0.3(0.1) + 0.5(0.13) = 11.1%
19.7 At least some individual stocks will have return/risk performance above the market portfolio just by chance. Similarly, in any given period individual country indices will surpass the world market portfolio when returns are measured ex post.
19.8 sd/f = (Std/f/St–1
d/f)–1= (€0.7182/$)/(€0.7064/$)–1 = 1.0168–1 = 1.68% r€ = r$ + s€/$ + rfs€/$ = 0.1600 + 0.0168 + (0.1600)(0.0168) = 17.94%
Kirt C. Butler, Solutions for Multinational Finance, 5th edition (2012), John Wiley & Sons, Inc.
71
19.9 (1+r$) = (1+rPeso)(1+s$/Peso ) r$ = (1.12 )[($.0440/Peso)/($.0425/Peso)]–1 = (1.12)(1.0353)–1 = 15.95%.
19.10 Var(r$) = Var(rPeso) + Var(s$/Peso) = (0.248)2 + (0.327)2 = 0.1684, so the standard deviation of dollar return on the Philippine stock market is (0.1684)1/2 = 0.4104, or 41.04 percent.
19.11 From Figure 19.5, about 88 percent of the return variance on foreign stocks is likely to come from variation in the foreign stock market and the rest from currency risk. Another 17 percent of the return variance comes from currency volatility. Relatively little variation (about -5 percent) comes from the interaction of foreign market returns and exchange rates. In contrast, about 32 percent of the return variance on a foreign bond investment is likely to come from variation in the foreign bond market and about 63 percent from the variation in the exchange rate.
19.12 Because the Greenland economy has less industrial diversification than the United States economy, stocks in Greenland are relatively highly correlated with other domestic stocks. Hence, more of the total risk (variance) of individual stocks within Greenland will be systematic and less will be diversifiable. The extent to which international diversification can eliminate diversifiable risk depends on the correlation of Greenland stocks with the rest of the world.
19.13 As a start, you should collect data on mean returns, variances, and covariances in the world’s major national debt and equity markets. Keep in mind that past performance is no guarantee of future investment success. Expected returns, variances and covariances of international debt and equity returns are variable, especially over the short run.
19.14 First of all, your historical return statistics will have a great deal of statistical precision in the sense that you’ll have a large number of observations. However, these statistics won’t be very timely in the sense that they’ll be estimated over periods (of war, rapid economic expansion, depression, oil crisis, etc.) that might not match the current period. Market returns vary with inflation, the business cycle, and return statistics (correlations in particular) markedly fluctuate over time. In addition, past performance is no guarantee of future results. Even if your return statistics are accurate, your performance over the coming year will have a large element of chance and will surely diverge from the past.

Kirt C. Butler, Solutions for Multinational Finance, 5th edition (2012), John Wiley & Sons, Inc.
72
Chapter 20 International Asset Pricing
Answers to Conceptual Questions
20.1 What is the capital market line? Why is it important?
The capital market line describes the most efficient combination of risky and riskless assets.
20.2 What is the security market line? Why is it important?
The security market line describes a linear relation between systematic risk and required return.
20.3 What is beta? Why is it important?
Beta measures an asset’s sensitivity to changes in the market portfolio.
20.4 Does political risk affect required returns?
If political risk is country-specific, then it is diversifiable and does not affect required return. If political risk is related to returns on the relevant (domestic or international) market portfolio, then it does affect required returns.
20.5 What assumptions must be added to the traditional CAPM in order to derive the international version of the CAPM?
Two additional assumptions are necessary: a) investors in each country have the same consumption basket so that inflation is measured against the same benchmark in every country, and b) purchasing power parity holds so that both real prices and real interest rates are the same in every country and for every individual.
20.6 What is the hedge portfolio in the IAPM?
The hedge portfolio in the international version of the CAPM is a combination of domestic T-bills and a hedge against the currency risk of the world market portfolio. (While the text does not go into detail, one way to construct the currency hedge is through forward currency contracts.)
20.7 What is the difference between an integrated and a segmented capital market?
An integrated capital market is one in which the law of one price holds. Some sort of market imperfection is necessary for there to be segmented capital markets.
20.8 What is the APT? In what ways is it both better or worse than the IAPM?
The arbitrage pricing model assumes that individual security returns are related to K factors according to the linear relationship rj = μj + β1jF1 + ... + βKjFK + ej. The good news is that APT is not a tautology like the CAPM and hence is not subject to Roll’s Critique. The bad news is that APT says nothing about what systematic risk factors are priced. (The CAPM is constructed such that the only relevant systematic risk factor is the return on the market portfolio.)
20.9 What four APT factors did Roll and Ross (1995) identify in their study of the U.S. stock market?
The four factors are unexpected components of: inflation, industrial production, the term premium (long-term government – T-bill yield), and risk premia (measured by the spread between corporate and government bond yields).
20.10 Are individual stock returns more closely related to national or industry factors? What implication does this have for portfolio diversification?
Cross-country correlations typically are lower than cross-industry correlations. This means that diversifying across countries usually brings greater diversification benefits than diversifying across industries. However, there are times when industry diversification is more important. Ideally, diversification is accomplished across both dimensions.
20.11 What is the value premium? What is the size effect? Do international stocks exhibit these

Kirt C. Butler, Solutions for Multinational Finance, 5th edition (2012), John Wiley & Sons, Inc.
73
characteristics? Are these factors evidence of market inefficiency?
The value premium refers to the tendency of value (high equity book-to-market) stocks to outperform growth (low equity book-to-market) stocks. The size effect refers to the tendency of small stocks to outperform large stocks. Fama and French [1998] found that these factors are present in a study of 13 national stock markets. Size and value premiums are not necessarily evidence of informational inefficiency, as they could reflect systematic (nondiversifiable) risks such as relative financial distress.
20.12 What is momentum? Can it lead to profitable investment opportunities for international investors?
Momentum refers to the tendency of recent winners (stocks with positive returns over a recent period) to outperform recent losers. Momentum effects have been found in U.S. (Jegadeesh and Titman, 1992) and European (Rouwenhorst, 1998) stock markets. In particular, recent winners outperform recent losers for about one year, after which time the winners tend to underperform losers. Because of the curious reversal of fortunes after one year, momentum effects are harder to reconcile with the efficient market hypothesis. If momentum effects persist in the future, they offer the possibility of positive risk-adjusted investment opportunities.
20.13 Are individual stocks exposed to currency risk? Does currency risk affect required returns?
Individual stocks (especially firms with international operations) are often exposed to currency risk. Jorion’s and De Santis and Gérard’s studies (presented in the text) suggest that currency risk is not priced in the U.S. stock market, but does appear to be priced in non-U.S. stock markets. In any case, managers will continue to care about currency risk because - as employees of the firm - they cannot diversify their wealth in the same way that outside shareholders can.
Problem Solutions
20.1 a. rS = rF + βS (rM – rF) = 8% + [16.5% – 8%] (1.5) = 20.75%. b. rS = rF + βS (rM – rF) = 4% + [12.5% – 4%] (1.2) = 14.2%.
20.2 a. ßBMW = BMW,DAX (BMW/DAX) = (0.44)(0.105/0.046) 1.00 relative to the DAX index. b. rBMW = rF + βBMW (E[rM]–rF) = 0.05 + (1.00)(0.06) 0.110, or 11.0% c. ßDAX,World = DAX,World (DAX/World) = (0.494) (0.0413/0.0526) = 0.3879 relative to the world.
20.3 a. According to BP’s factor sensitivities, BP shares should rise with an increase in world industrial production, a decrease in the price of oil, or an increase in the value of currencies in BP’s trading basket in the denominator of the spot rate.
b. E(r) = μ + βProdFProd+βOilFOil+βSpotFSpot = 14%+(1.5)(2%)+(–0.80)(10%)+ (0.01)(–5%) = 14% + 3% – 8% – 0.05% = 8.95%. c. With an expectation of 8.95% and an actual return of only 4%, BP underperformed its
expectation by 4.95% during the period.
20.4 a. According to Elf’s factor sensitivities, Elf shares should rise with an increase in industrial production or with an increase in the price of oil. Share price should fall with an increase in the term premium, the risk premium, or the value of the foreign currencies in Elf’s trading basket in the denominator of the foreign exchange quote. (Conversely, the negative sign on this last factor means that Elf is likely to rise with an appreciation of the euro in the numerator of the spot rate quote.)
b. E(r) = μ + βProd FProd + βOil FOil + βTerm FTerm + βRisk FRisk + βSpot FSpot
= 12% + (1.10)(10%)+(0.60)(10%)+(–0.05)(10%)+(–0.10)(10%)+(–0.02)(10%) = 12% + 11% + 6% – 0.5% – 1% – 0.2% = 27.3%.

Kirt C. Butler, Solutions for Multinational Finance, 5th edition (2012), John Wiley & Sons, Inc.
74
c. With an expectation of 27.3% and an actual return of –12%, Elf underperformed its expectation by 39.3% during the period.
20.5 a. E(r) = μ + βMFM + βSMBFSMB + βHMLFHML = 10% +(1.0)(–1%)+(0.1)(–1%)+(0.05)(–1%) = 10.00% – 1.00% – 0.10% – 0.05% = 8.85%.
b. With an expectation of 8.85% and an actual return of 12%, Amazon.com outperformed its expectation by 3.15% during the period.
20.6 a. Over a single year, it is difficult to say which manager is likely to see higher returns. Returns to value (and other) investment strategies vary from year to year.
b. If the value premium persists over the next ten years as it has in the past, then the value-oriented strategy of investing in stocks with high equity book-to-market value ratios is likely to lead to higher returns over 10-year investment horizons.
c. It is difficult to say whether higher returns to value strategies are truly superior risk-adjusted returns or merely a systematic risk for which investors demand compensation, such as a premium for relative financial distress.
20.7 a. Momentum strategies invest in recent winners (stocks with high returns over a recent period) and avoid or short-sell recent losers. In Jegadeesh and Titman’s [1992] study of U.S. stocks, the return difference between winner and loser portfolios was 9.5 percent over the year following formation of the winner and loser portfolios. During the second year after portfolio formation, U.S. winners lost about one-half of this accumulated gain.
b. In Rouwenhorst’s [1998] study of 12 European markets, winners beat losers by 12 percent over the first year after portfolio formation. As in the U.S., winners lost some of their accumulated gain during the subsequent year. Momentum strategies hold promise for international markets.
c. Momentum appears to have a strong international component in Rouwenhorst’s study, so there is a strong possibility that momentum would be found in Latin American stock markets.
d. It would not be a surprise if momentum gradually disappeared as financial markets pursue momentum-based strategies and learn from their past pricing errors. Many other financial anomalies have disappeared once they were identified. Hedge funds in particular are well-positioned to take advantage of momentum-based trading strategies. The more liquid the market, the more likely that anomalies such as momentum will disappear.
20.8 a. By placing an equal weight on each asset, smaller cap firms will receive a larger weight. Smaller firms have higher expected returns, so this will increase the expected portfolio return. The equal-weighted portfolio also will benefit from the value premium (the higher expected return of firms with high equity book-to-market ratios) to the extent that value firms also tend to be smaller firms.
b. The answer is “it depends” on whether the investor believes that size and value premiums reflect compensation for bearing higher systematic risks.
c. Performance should be benchmarked to a similarly constructed equal-weighted portfolio. Otherwise, the comparison would be “apples and oranges.”