ecopetrol group announces its results for the fourth ... · pdf file26.03.2016 ·...
TRANSCRIPT

MATERIAL INFORMATION
Ecopetrol Group Announces Its Results for the Fourth Quarter of 2015 and the Year Ended December 31, 20151
Amid a challenging environment, the Corporate Group´s production reached
761 mboed, a 5 mboed increase compared with 2014.
Annual savings of COP$2.8 trillion help mitigate the impact of falling prices.
Refining Margin increased by 16% in 2015 vs 2014.
In line with the industry trend, the lower oil prices and impairments
(accounting adjustment under IFRS) led to the recording of a net loss of
COP$3.9 trillion pesos in 2015. Without impairments, the net income would
have been COP$2.4 trillion pesos.
Bogota, March 6, 2016. Ecopetrol S.A. (BVC: ECOPETROL; NYSE: EC) announced today
Ecopetrol Group’s financial results for the fourth quarter and full year 2015, prepared and
filed in Colombian pesos (COP$) and under International Financial Reporting Standards (IFRS)
applicable in Colombia.
Table 1: Summary of the Group’s Consolidated Financial Results
* According to IAS-1, “Presentation of financial statements”, paragraph 83, the company must include in the statement of comprehensive results the results attributable to non-controlling interest (minority interest) and the results attributable to
shareholders of the controlling company.
1 The Corporate Group adopted IFRS since January 1, 2015, with transition date on January 1, 2014. Hence, the first audited consolidated financial statements under
IFRS are hereby presented.
As indicated in paragraphs 9 and 18 of International Accounting Standard 27 “Consolidated and Separated Financial Statements,” Ecopetrol and its corporate group
must present their financial information on a consolidated basis, combining the financial statements of the parent company and its subsidiaries line by line, adding assets, liabilities, shareholder equity, revenues and expenses of a similar nature, removing the reciprocal items between the corporate group and recognizing the non-
controlling interest.
The financial results in this report are not comparable line by line with the previously issued financial results in the report for the fourth quarter of 2014, which were prepared in accordance with the Public Accounting Regime (Régimen de Contabilidad Pública) as adopted by the Colombian National Accounting Office. For the sake of
comparison, the previously issued financial results for the fourth quarter and full year 2014 are presented in this report under IFRS.
Some figures in this release are presented in U.S. dollars (US$) as indicated. The exhibits in the main body of this report have been rounded to one decimal. Figures expressed in billions of COP$ are equal to COP$1 thousand million. All financial information in this report is unaudited.
A B C D E F G H I J
(COP$ Billion) 4Q 2015 4Q 2014 ∆ ($) ∆ (%) 3Q 2015 2015 2014 ∆ ($) ∆ (%)
Total sales 12,777 14,255 (1,478) (10.4%) 13,003 52,091 65,972 (13,881) (21.0%)
Operating profit (7,301) (1,171) (6,130) 523.5% 2,850 1,456 14,449 (12,993) (89.9%)
Net Income Consolidated (6,021) (2,360) (3,661) 155.1% 887 (3,083) 6,349 (9,432) (148.6%)
Non-controlling interest (287) (131) (156) 119.1% (233) (905) (623) (282) 45.3%
Equity holders of Ecopetrol* (6,308) (2,491) (3,817) 153.2% 654 (3,988) 5,726 (9,714) (169.6%)
Other comprenhensive income attributable to shareholders of Ecopetrol* 1,456 3,412 (1,956) (57.3%) 2,203 4,791 4,332 459 10.6%
EBITDA 3,083 3,268 (185) (5.7%) 4,698 18,087 24,509 (6,422) (26.2%)
EBITDA Margin 24.1% 22.9% 36.1% 34.7% 37.2%

2
MATERIAL INFORMATION
In the opinion of Ecopetrol’s CEO Juan Carlos Echeverry G.:
“2015 was one of the most challenging years for the oil industry. As many other oil and gas
companies, Ecopetrol undertook profound adjustments on its operations to be more efficient and
face lower crude prices. The Company intensified the interaction between operational and financial
excellence to generate and protect its cash flow, secure its sustainability and, when price
environment permits, be prepared to grow. In addition to prices other challenges were added:
attacks on oil infrastructure, El Niño phenomenon, the closing of Venezuelan border, the completion
of key Midstream and Downstream projects and the devaluation of the exchange rate.
In the midst of this defying environment, the Company maintained a solid operational performance
while advancing the transformation of all of its business lines to increase its structural efficiency. It
reduced operational costs without affecting reliability and safety of its operations, and strengthened
an organizational culture based on integrity, cooperation and creativity. This change process has
been led by a new management team that has leveraged Ecopetrol’s strengths to introduce new
and more efficient ways to conduct operations throughout its entire value chain.
As of the second half of 2015, Ecopetrol began to adjust its investment plan without sacrificing
production and progress in important projects; to increase its efficiency levels and reduce costs and
expenses; and established a savings target of COP$1.6 trillion for the year.
As of December 31, 2015, Ecopetrol’s savings totaled COP$2.2 trillion, above the initially defined
target. This achievement was possible thanks to renegotiation strategies in contracts (COP$0.98
trillion) and supply (COP$0.50 trillion), and higher operational efficiencies (COP$0.72 trillion). In
addition, affiliates and subsidiaries contributed with COP$0.6 trillion, for overall total savings within
the Group of COP$2.8 trillion. The company is working towards making these savings structural and
supportive in securing its sustainability and competitiveness in the long term.
The higher efficiency achieved in 2015 enabled Ecopetrol to partially offset the impact of lower
crude prices on the balance of proven reserves, which was 1,849 billion of oil equivalent barrels,
11% lower as compared to 2014. The 45% drop in prices used in reserves valuation led to an
estimated reduction of 404 million of barrels of oil equivalent, which was offset by lower costs and
higher efficiencies, which added approximately 275 million barrels of oil equivalent.
At the operational level, the company presented solid results, starting with the best historic
industrial safety performance, measured by the Recordable Incident Frequency Rate and the
Accident Frequency Index, which were 0.96 and 0.49, respectively. This is the result of a
permanent and systematic effort to achieve industry standards and a strong indication of
Ecopetrol’s commitment for people´s well-being.
In 2015, the Group slightly surpassed the 760 thousand barrels per day production goal, despite
the low price environment, operational challenges and public order disruptions. As compared to
2014, production grew by 5 thousand barrels per day, mainly driven by the production increase at
the Castilla (+17.4%) and Chichimene (+38.9%) fields, due to the entrance of new wells into
production.
With regards to recovery factor increase, during 2015 eight pilot projects were initiated in water
injection, solvent injection and improved water injection technologies, achieving the established
goal. It´s important to highlight the implementation of water injection pilot projects in fields with
heavy crude, such as Castilla and Chichimene, with positive results in the intervened areas.
Additional cumulative production represents a 1.2% increase in the recovery factor in the pilot area
of Chichimene and 0.15% in the pilot area of Castilla.

3
MATERIAL INFORMATION
The improvement in the recovery factor, mainly through infill drilling, will continue to be the main
source of reserves growth in producing fields in coming years. Hence, it is necessary to increase
well drilling efficiency, as has been done among different fields. For example, between 2014 and
2015, in Castilla, the average drilling days per well went from 34 to 26 and in Chichimene from 36
to 26.
In exploration, the discovery in May of the Kronos well in the Caribbean offshore area is considered
one of the 20 largest discoveries worldwide in 2015. The exploratory campaign also included the
drilling of the Calasú well (geological success) in the Caribbean Sea, and three additional wells:
Muérgana Sur (sealed and abandoned), located at Llanos Orientales, Bullerengue (geological
success), in the Lower Magdalena Valley, and Sea Eagle (dry well) in the US Gulf of Mexico.
By the end of 2015, the Leon 2 appraisal well was being drilled in the Gulf of Mexico deep waters,
operated by Repsol, who has a 60% share, and Ecopetrol America Inc., with 40%. The well reached
its final depth on February 2, 2016, and is currently under assessment.
As compared to 2014, during 2015 a growth of 2% in the transported volume was evidenced,
mainly due to higher availability over the course of the year of the Caño Limón – Coveñas and
Transandino systems, caused by a lower number of oil infrastructure attacks, which went from 130
in 2014 to 80 in 2015.
Tests to verify the performance of transportation systems with higher viscosity crudes through
Oleoducto de los Llanos, Oleoducto de Colombia and Ocensa were successful, opening the
possibility to decrease diluent consumption in 2016. This is a key aspect in increasing heavy oil
production profitability, which today represents 57% of the Group’s total production. The tolerance
increase in transportation systems from 220 centi stocks (CST) to 300 CST of viscosity allowed a
decrease of US$0.75/Bl in dilution cost. The 2016 goal is to transport at 400 CST.
For refining, the major achievement was the startup of the Crude Unit at the Cartagena Refinery,
which led the sequential entry of the plants comprising the new refinery. On February 24 the
Delayed Coking Unit started its operations, which allows reaching a 97% conversion factor. By the
end of February two more plants started up: the Catalytic Cracking Unit, that takes diesel fuels
from the Crude Unit and produces selectively streams of higher value, and the Naphtha
Hydrotreater Unit which main function is to remove sulphur from gasolines to deliver clean fuels,
with less than 50 parts per million of sulphur.
Ecopetrol expects to have all the plants in operation during the second quarter of 2016, and
stabilize gradually the refinery to take it to full capacity by the third quarter of the year. It´s worth
highlighting that the refinery made its first fuel export in November 2015 with destination to the
United States and the Caribbean, with a total of 200 thousand barrels of virgin naphtha and 50
thousand barrels of JET A1 aviation fuel.
Other important result was achieved at the Barrancabermeja Refinery, which reported a gross
margin of US$16.8/Bl in 2015, as compared to US$14.6/Bl in 2014, due to a higher performance of
medium distillates, the implementation of initiatives to enhance the value of LPG and residual
streams, and price behavior of refined products.
2015 also included the consolidation of a new management team, with the renewal of half of the
positions with top qualified and expert personnel on their knowledge fields, with distinguished
experience in the oil and gas industry. Leadership style, in line with cultural transformation, is
based on knowledge, trust, communication, and teamwork. In 2016, the company will deepen its
work with mid-level management and will aim for the development of future leaders with high
potential, who are prepared to assume the challenges of Ecopetrol.
4
MATERIAL INFORMATION
The Company ended the year with a loss of COP$3.9 trillion, mainly due to accounting effects on
the presentation of the financial statements caused by IFRS implementation. Excluding the
impairment effect, the Company would have reported a net income of COP$2.4 trillion. This
accounting effect, as well as the exchange rate difference, constitute an impact on the expenses
account that affects the financial outcome, but that does not imply a cash outflow. Impairment
expenses can be reverted once market conditions turn more favorable, except in the case of
goodwill impairments. Nonetheless, despite the adverse price environment and strong impact on
results, the Company kept its EBITDA margin at 35%, close to last year´s level, and continued
having in its internal cash flow generation, the main source to fund its operations.
Savings aren´t the foundation for the future. Investment quality is the other key factor.
We are currently strengthening the exploration and production portfolio, through an institutional
change oriented to align incentives to identify the best prospectuses and place them under rigorous
scrutiny and competition. A targeted and effective investment, and at lower costs, should redound
in higher future reserves.
2016 is a transition year for the businesses of the Group. We will end relevant investments in
refining and transport segments. In these segments we have enough installed capacity for the
Company´s mid-term growth. Finalizing the meaningful investments in refinery and transport
means, that from 2017 onwards, close to US$1 billion of annual investments will be freed and 90%
of total investment capacity will be allocated to exploration and production, while in the past 5
years we have dedicated only near 60%.
Breakeven prices have decreased and technical risk has been mitigated. As a result, the recognition
of additional projects should improve the Company´s growth potential.
Finally, 2016 will be a financial excellency year focused on cash generation and preservation. The
divestment process, which was analyzed and structured during 2015, will be dynamic. These will
strengthen the focus on financial sustainability and will pursue protecting the company´s credit
rating by keeping adequate indebtedness levels.
The 2016 investment plan for US$4.8 billion implies a decrease of 26% as compared to the
execution in 2015. This reinforces capital expenditure discipline and focus on profitable
investments, as well as the opportunity to achieve higher efficiencies without affecting Ecopetrol´s
operation. We will manage the CAPEX depending on the crude oil price, just like a stream whose
flow is regulated by locks.
The company will continue promoting its 2016-2017 assets divestment program to obtain resources
between US$400 and US$900 million, out of a potential pool of assets of US$1.4 billion. Within this
phase, the company will pursue the divestment of non-strategic assets and stock holdings, such as
Propilco, EEB, ISA and some others under current analysis.
It is a priority for Ecopetrol to maintain its investment grade rating, as well as access to capital
markets. Adjustments made in 2016 imply financing needs between US$1.5 and US$1.9 billion, out
of which US$475 million were already obtained through loans from local and international banks.
The confidence in the Company and the appetite for Ecopetrol´ s credit has been ratified. This
estimation does not include resources resulting from the divestment program, which in case of
positive results, would strengthen the company´s cash flow.
With regards to Reficar and the concerns expressed by the different control entities, it is important
to note that all investigations are still at a preliminary stage. The Office of the General Comptroller
initiated a review of Reficar in 2015, which was completed and disclosed in 2016. This report does
not point to any conclusive findings on Reficar's finances. However, it has led to the

5
MATERIAL INFORMATION
commencement of specific investigations into the EPC contract for the project. Meanwhile, the
Prosecutor’s Office currently has two investigations underway: one which began in 2012 involving
members of the board of directors of Reficar on such date and a more recent one, regarding delays
in the completion of the project, into current and former officers of Ecopetrol as well as current and
former members of the board of directors of Ecopetrol, including me. Meanwhile, the General
Attorney's Office, in early February, began collecting and reviewing information about Reficar.
All the investigations are still at preliminary stages and I want to emphasize that Ecopetrol and
Reficar are giving due importance to these processes through exhaustive cooperation with the
control entities. Finally, I would like to highlight that, to date, none of the investigations allege any
violations to the Code of Ethics nor do they affect the integrity of Ecopetrol's businesses.
Ecopetrol has rapidly and decisively responded to the challenges imposed by the price environment,
with an internal deep transformation and management based on financial discipline, the search for
increasing efficiencies, and improving quality and active rotation of its portfolio. The Company will
continue seeking alternatives to confront the current scenario and prepare the exploration and
production portfolio to take advantage of a future rise in oil prices. In addition, the Company will
pursue value generation for its shareholders, prioritizing sustainability and long-term financial
stability.”

6
MATERIAL INFORMATION
Ecopetrol Group Announces Its Results for the Fourth Quarter and Full Year 2015
Table of Contents
I. Consolidated Financial Results ............................................................................................. 7
a. Sales Volume ........................................................................................................................... 7
b. Crude, Refined Products, and Gas Prices ..................................................................... 9
c. Financial Results ................................................................................................................... 10
d. Balance Sheet ........................................................................................................................ 12
e. Impairment of Long Term Assets .................................................................................. 14
f. Cash flow hedge for future Company exports .......................................................... 15
g. Credit Rating .......................................................................................................................... 15
h. Results by Business Segment ......................................................................................... 16
i. Results of Cost and Expense Reduction Initiatives ................................................. 19
II. Operating Results .................................................................................................................... 21
a. Investments ........................................................................................................................... 21
b. Exploration .............................................................................................................................. 21
c. Reserves .................................................................................................................................. 23
d. Production ............................................................................................................................... 24
e. Transport ................................................................................................................................. 27
f. Refining .................................................................................................................................... 30
III. Organizational Consolidation, Corporate Responsibility and Corporate Governance (Ecopetrol S.A.).......................................................................................................... 32
a. Organizational Consolidation ........................................................................................... 32
b. Corporate Social Responsibility ...................................................................................... 33
IV. Presentation of Fourth Quarter and Full Year 2015 Results ................................... 34
V. Ecopetrol´s Group Exhibits ................................................................................................ 35
VI. Exhibits of Subsidiary Results and Shareholder Interest ......................................... 41
VII. Corporate Group´s Financial Indebtedness .................................................................. 48
7
MATERIAL INFORMATION
I. Consolidated Financial Results
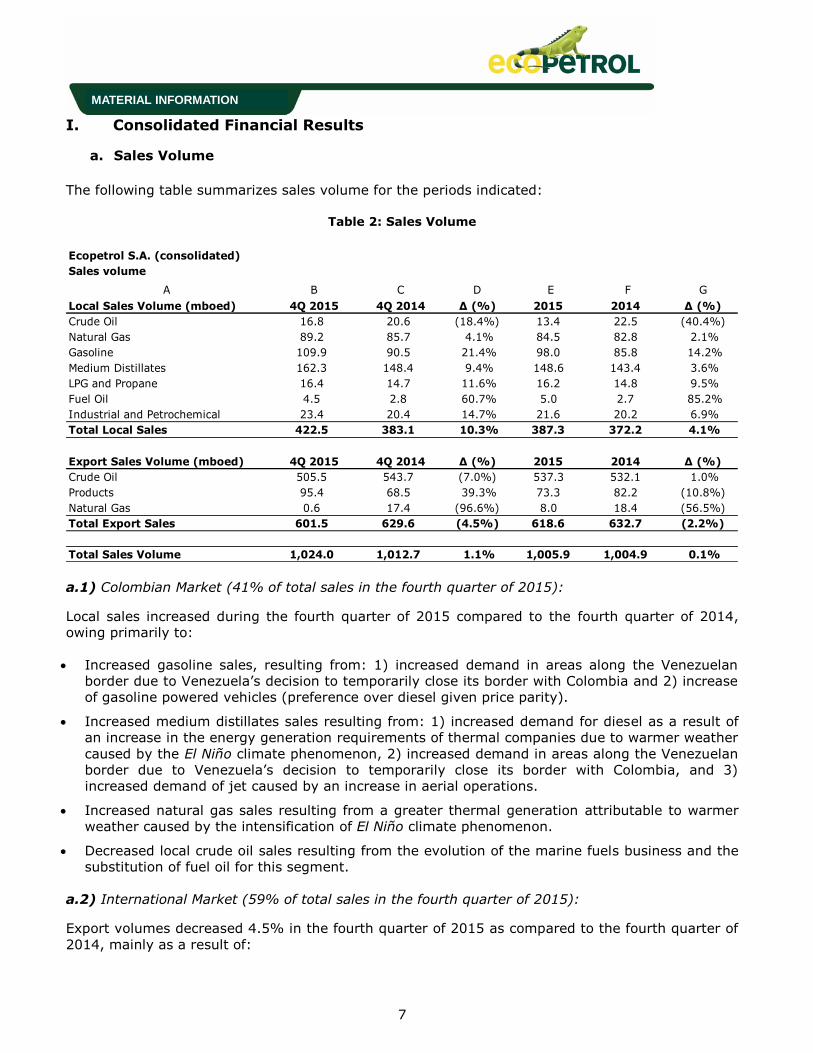
a. Sales Volume
The following table summarizes sales volume for the periods indicated:
Table 2: Sales Volume
a.1) Colombian Market (41% of total sales in the fourth quarter of 2015):
Local sales increased during the fourth quarter of 2015 compared to the fourth quarter of 2014,
owing primarily to:
Increased gasoline sales, resulting from: 1) increased demand in areas along the Venezuelan
border due to Venezuela’s decision to temporarily close its border with Colombia and 2) increase
of gasoline powered vehicles (preference over diesel given price parity).
Increased medium distillates sales resulting from: 1) increased demand for diesel as a result of
an increase in the energy generation requirements of thermal companies due to warmer weather
caused by the El Niño climate phenomenon, 2) increased demand in areas along the Venezuelan
border due to Venezuela’s decision to temporarily close its border with Colombia, and 3)
increased demand of jet caused by an increase in aerial operations.
Increased natural gas sales resulting from a greater thermal generation attributable to warmer
weather caused by the intensification of El Niño climate phenomenon.
Decreased local crude oil sales resulting from the evolution of the marine fuels business and the
substitution of fuel oil for this segment.
a.2) International Market (59% of total sales in the fourth quarter of 2015):
Export volumes decreased 4.5% in the fourth quarter of 2015 as compared to the fourth quarter of
2014, mainly as a result of:
Ecopetrol S.A. (consolidated)
Sales volume
A B C D E F G
Local Sales Volume (mboed) 4Q 2015 4Q 2014 ∆ (%) 2015 2014 ∆ (%)
Crude Oil 16.8 20.6 (18.4%) 13.4 22.5 (40.4%)
Natural Gas 89.2 85.7 4.1% 84.5 82.8 2.1%
Gasoline 109.9 90.5 21.4% 98.0 85.8 14.2%
Medium Distillates 162.3 148.4 9.4% 148.6 143.4 3.6%
LPG and Propane 16.4 14.7 11.6% 16.2 14.8 9.5%
Fuel Oil 4.5 2.8 60.7% 5.0 2.7 85.2%
Industrial and Petrochemical 23.4 20.4 14.7% 21.6 20.2 6.9%
Total Local Sales 422.5 383.1 10.3% 387.3 372.2 4.1%
Export Sales Volume (mboed) 4Q 2015 4Q 2014 ∆ (%) 2015 2014 ∆ (%)
Crude Oil 505.5 543.7 (7.0%) 537.3 532.1 1.0%
Products 95.4 68.5 39.3% 73.3 82.2 (10.8%)
Natural Gas 0.6 17.4 (96.6%) 8.0 18.4 (56.5%)
Total Export Sales 601.5 629.6 (4.5%) 618.6 632.7 (2.2%)
Total Sales Volume 1,024.0 1,012.7 1.1% 1,005.9 1,004.9 0.1%
8
MATERIAL INFORMATION
Lower crude exports due to decreased export capacity in transportation systems, especially in
the southern part of the country.
Decreased natural gas exports due to the termination of the Venezuela sale contract, which
expired in June 30, 2015.
Higher exports of refined products, especially diesel and fuel oil, as a result of Reficar’s crude
unit start-up.
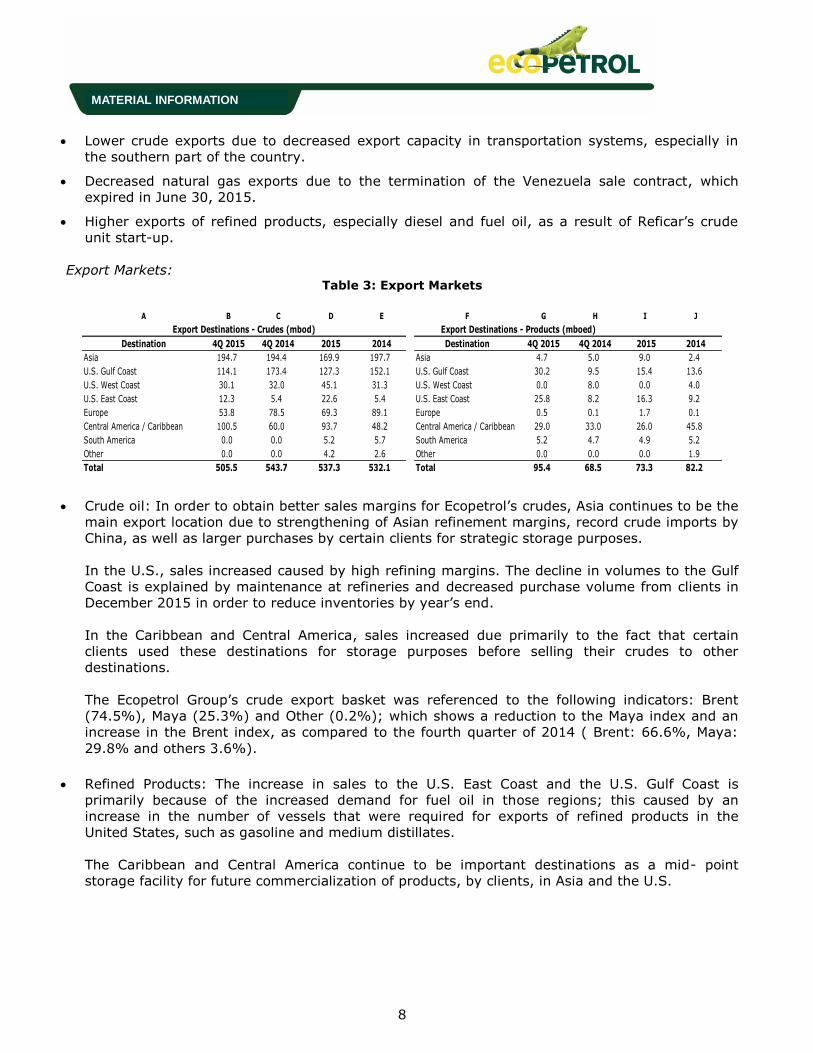
Export Markets: Table 3: Export Markets
Crude oil: In order to obtain better sales margins for Ecopetrol’s crudes, Asia continues to be the
main export location due to strengthening of Asian refinement margins, record crude imports by
China, as well as larger purchases by certain clients for strategic storage purposes.
In the U.S., sales increased caused by high refining margins. The decline in volumes to the Gulf
Coast is explained by maintenance at refineries and decreased purchase volume from clients in
December 2015 in order to reduce inventories by year’s end.
In the Caribbean and Central America, sales increased due primarily to the fact that certain
clients used these destinations for storage purposes before selling their crudes to other
destinations.
The Ecopetrol Group’s crude export basket was referenced to the following indicators: Brent
(74.5%), Maya (25.3%) and Other (0.2%); which shows a reduction to the Maya index and an
increase in the Brent index, as compared to the fourth quarter of 2014 ( Brent: 66.6%, Maya:
29.8% and others 3.6%).
Refined Products: The increase in sales to the U.S. East Coast and the U.S. Gulf Coast is
primarily because of the increased demand for fuel oil in those regions; this caused by an
increase in the number of vessels that were required for exports of refined products in the
United States, such as gasoline and medium distillates.
The Caribbean and Central America continue to be important destinations as a mid- point
storage facility for future commercialization of products, by clients, in Asia and the U.S.
A B C D E F G H I J
Destination 4Q 2015 4Q 2014 2015 2014 Destination 4Q 2015 4Q 2014 2015 2014
Asia 194.7 194.4 169.9 197.7 Asia 4.7 5.0 9.0 2.4
U.S. Gulf Coast 114.1 173.4 127.3 152.1 U.S. Gulf Coast 30.2 9.5 15.4 13.6
U.S. West Coast 30.1 32.0 45.1 31.3 U.S. West Coast 0.0 8.0 0.0 4.0
U.S. East Coast 12.3 5.4 22.6 5.4 U.S. East Coast 25.8 8.2 16.3 9.2
Europe 53.8 78.5 69.3 89.1 Europe 0.5 0.1 1.7 0.1
Central America / Caribbean 100.5 60.0 93.7 48.2 Central America / Caribbean 29.0 33.0 26.0 45.8
South America 0.0 0.0 5.2 5.7 South America 5.2 4.7 4.9 5.2
Other 0.0 0.0 4.2 2.6 Other 0.0 0.0 0.0 1.9
Total 505.5 543.7 537.3 532.1 Total 95.4 68.5 73.3 82.2
Export Destinations - Products (mboed)Export Destinations - Crudes (mbod)
9
MATERIAL INFORMATION
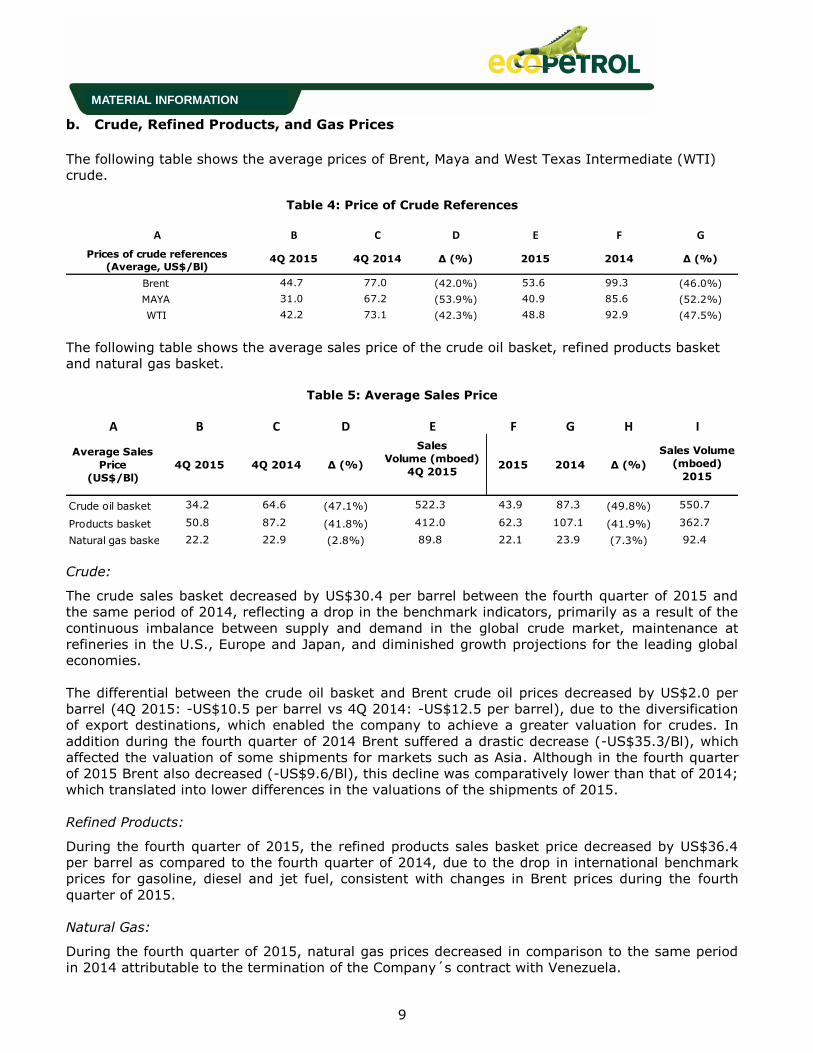
b. Crude, Refined Products, and Gas Prices
The following table shows the average prices of Brent, Maya and West Texas Intermediate (WTI)
crude.
Table 4: Price of Crude References
The following table shows the average sales price of the crude oil basket, refined products basket
and natural gas basket.
Table 5: Average Sales Price
Crude:
The crude sales basket decreased by US$30.4 per barrel between the fourth quarter of 2015 and
the same period of 2014, reflecting a drop in the benchmark indicators, primarily as a result of the
continuous imbalance between supply and demand in the global crude market, maintenance at
refineries in the U.S., Europe and Japan, and diminished growth projections for the leading global
economies.
The differential between the crude oil basket and Brent crude oil prices decreased by US$2.0 per
barrel (4Q 2015: -US$10.5 per barrel vs 4Q 2014: -US$12.5 per barrel), due to the diversification
of export destinations, which enabled the company to achieve a greater valuation for crudes. In
addition during the fourth quarter of 2014 Brent suffered a drastic decrease (-US$35.3/Bl), which
affected the valuation of some shipments for markets such as Asia. Although in the fourth quarter
of 2015 Brent also decreased (-US$9.6/Bl), this decline was comparatively lower than that of 2014;
which translated into lower differences in the valuations of the shipments of 2015.
Refined Products:
During the fourth quarter of 2015, the refined products sales basket price decreased by US$36.4
per barrel as compared to the fourth quarter of 2014, due to the drop in international benchmark
prices for gasoline, diesel and jet fuel, consistent with changes in Brent prices during the fourth
quarter of 2015.
Natural Gas:
During the fourth quarter of 2015, natural gas prices decreased in comparison to the same period
in 2014 attributable to the termination of the Company´s contract with Venezuela.
A B C D E F G
Brent 44.7 77.0 (42.0%) 53.6 99.3 (46.0%)
MAYA 31.0 67.2 (53.9%) 40.9 85.6 (52.2%)
WTI 42.2 73.1 (42.3%) 48.8 92.9 (47.5%)
Prices of crude references
(Average, US$/Bl)2015 2014 ∆ (%)4Q 2015 ∆ (%)4Q 2014
A B C D E F G H I
Sales Volume
(mboed)
2015
Crude oil basket 34.2 64.6 (47.1%) 522.3 43.9 87.3 (49.8%) 550.7
Products basket 50.8 87.2 (41.8%) 412.0 62.3 107.1 (41.9%) 362.7
Natural gas basket 22.2 22.9 (2.8%) 89.8 22.1 23.9 (7.3%) 92.4
Average Sales
Price
(US$/Bl)
Sales
Volume (mboed)
4Q 20152014 ∆ (%)4Q 2015 4Q 2014 ∆ (%) 2015
10
MATERIAL INFORMATION
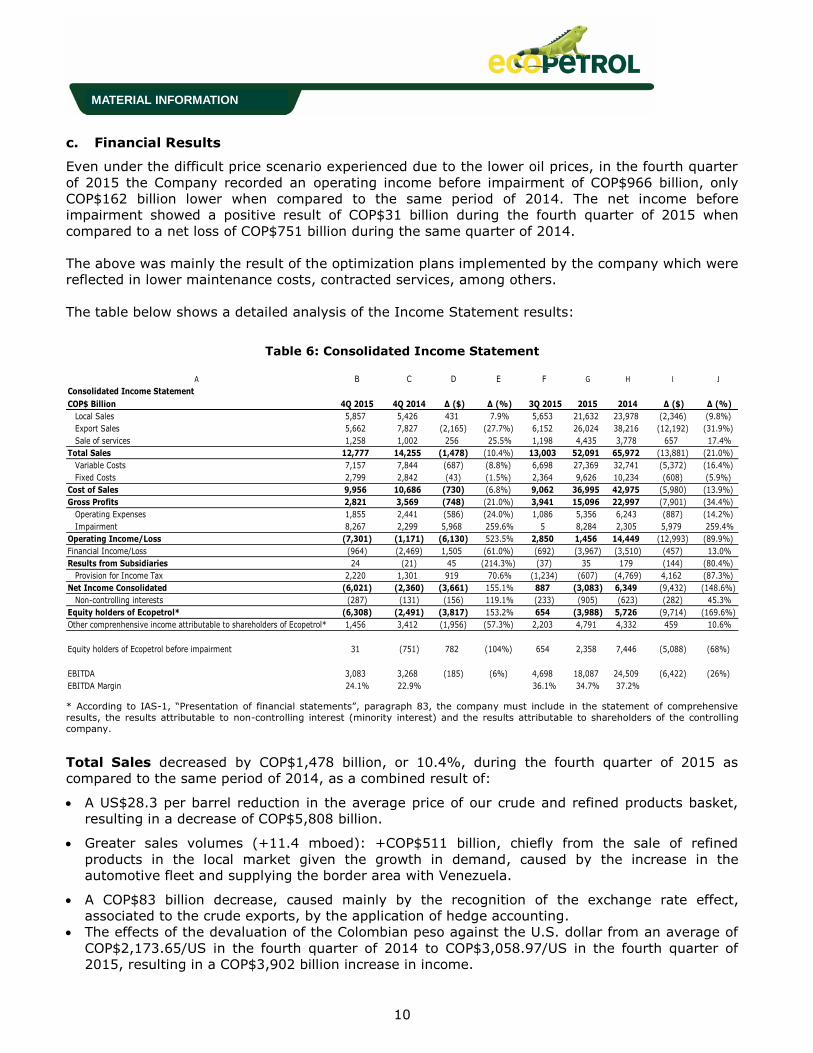
c. Financial Results
Even under the difficult price scenario experienced due to the lower oil prices, in the fourth quarter
of 2015 the Company recorded an operating income before impairment of COP$966 billion, only
COP$162 billion lower when compared to the same period of 2014. The net income before
impairment showed a positive result of COP$31 billion during the fourth quarter of 2015 when
compared to a net loss of COP$751 billion during the same quarter of 2014.
The above was mainly the result of the optimization plans implemented by the company which were
reflected in lower maintenance costs, contracted services, among others.
The table below shows a detailed analysis of the Income Statement results:
Table 6: Consolidated Income Statement
* According to IAS-1, “Presentation of financial statements”, paragraph 83, the company must include in the statement of comprehensive
results, the results attributable to non-controlling interest (minority interest) and the results attributable to shareholders of the controlling company.
Total Sales decreased by COP$1,478 billion, or 10.4%, during the fourth quarter of 2015 as
compared to the same period of 2014, as a combined result of:
A US$28.3 per barrel reduction in the average price of our crude and refined products basket,
resulting in a decrease of COP$5,808 billion.
Greater sales volumes (+11.4 mboed): +COP$511 billion, chiefly from the sale of refined
products in the local market given the growth in demand, caused by the increase in the
automotive fleet and supplying the border area with Venezuela.
A COP$83 billion decrease, caused mainly by the recognition of the exchange rate effect,
associated to the crude exports, by the application of hedge accounting.
The effects of the devaluation of the Colombian peso against the U.S. dollar from an average of
COP$2,173.65/US in the fourth quarter of 2014 to COP$3,058.97/US in the fourth quarter of
2015, resulting in a COP$3,902 billion increase in income.
A B C D E F G H I J
Consolidated Income Statement
COP$ Billion 4Q 2015 4Q 2014 ∆ ($) ∆ (%) 3Q 2015 2015 2014 ∆ ($) ∆ (%)
Local Sales 5,857 5,426 431 7.9% 5,653 21,632 23,978 (2,346) (9.8%)
Export Sales 5,662 7,827 (2,165) (27.7%) 6,152 26,024 38,216 (12,192) (31.9%)
Sale of services 1,258 1,002 256 25.5% 1,198 4,435 3,778 657 17.4%
Total Sales 12,777 14,255 (1,478) (10.4%) 13,003 52,091 65,972 (13,881) (21.0%)
Variable Costs 7,157 7,844 (687) (8.8%) 6,698 27,369 32,741 (5,372) (16.4%)
Fixed Costs 2,799 2,842 (43) (1.5%) 2,364 9,626 10,234 (608) (5.9%)
Cost of Sales 9,956 10,686 (730) (6.8%) 9,062 36,995 42,975 (5,980) (13.9%)
Gross Profits 2,821 3,569 (748) (21.0%) 3,941 15,096 22,997 (7,901) (34.4%)
Operating Expenses 1,855 2,441 (586) (24.0%) 1,086 5,356 6,243 (887) (14.2%)
Impairment 8,267 2,299 5,968 259.6% 5 8,284 2,305 5,979 259.4%
Operating Income/Loss (7,301) (1,171) (6,130) 523.5% 2,850 1,456 14,449 (12,993) (89.9%)
Financial Income/Loss (964) (2,469) 1,505 (61.0%) (692) (3,967) (3,510) (457) 13.0%
Results from Subsidiaries 24 (21) 45 (214.3%) (37) 35 179 (144) (80.4%)
Provision for Income Tax 2,220 1,301 919 70.6% (1,234) (607) (4,769) 4,162 (87.3%)
Net Income Consolidated (6,021) (2,360) (3,661) 155.1% 887 (3,083) 6,349 (9,432) (148.6%)
Non-controlling interests (287) (131) (156) 119.1% (233) (905) (623) (282) 45.3%
Equity holders of Ecopetrol* (6,308) (2,491) (3,817) 153.2% 654 (3,988) 5,726 (9,714) (169.6%)
Other comprenhensive income attributable to shareholders of Ecopetrol* 1,456 3,412 (1,956) (57.3%) 2,203 4,791 4,332 459 10.6%
Equity holders of Ecopetrol before impairment 31 (751) 782 (104%) 654 2,358 7,446 (5,088) (68%)
EBITDA 3,083 3,268 (185) (6%) 4,698 18,087 24,509 (6,422) (26%)
EBITDA Margin 24.1% 22.9% 36.1% 34.7% 37.2%

11
MATERIAL INFORMATION
Cost of Sales decreased by 6.8% (-COP$730 billion) in the fourth quarter of 2015 as a result of:
Variable Costs: 8.8% (-COP$687 billion) decrease resulting from:
a) A COP$441 billion reduction in the purchase prices of crude, gas and refined products due
to the net effect of:
o Reduced average purchase price given international benchmark prices: -COP$2,774
billion.
o An increase in volumes purchased (+44 mboed) of COP$920 billion, chiefly because
of the combined effect of: 1) higher imports of refined products (gasoline and diesel)
+36 mboed by COP$774 billion due to the rise in internal demand and provision of
supply in border areas attributable to the closing of the border with Venezuela, 2)
greater purchases of diluent in the amount of +COP$209 billion due to operational
requirements, 3) imports of crude carried out by Reficar at the start-up of the
refinery’s operations +COP$200 billion; offset by 4) lower purchases of crude by
third parties (–COP$329 billion), taking into account effects on transport systems in
the southern part of the country (OTA), owing to matters of a public order, and lower
production in the country, and 5) other minor variations (+COP$66 billion).
o Devaluation of the Colombian peso against the U.S. dollar: +COP$1,413 billion.
b) Variation of inventories went down COP$221 billion, chiefly due to 1) the accumulation of
inventories of refined products at Ecopetrol S.A. because of larger purchases of fuel and
naphtha owing to operational requirements, and 2) at Reficar, due to the accumulation
of inventories because of the start-up of the refinery’s operations.
c) Other minor variable items: -COP$25 billion.
Fixed Costs: a 1.5% (-COP$43 billion) decrease as a result of:
a) A COP$121 billion decline in maintenance and contracted services, mainly caused by: 1)
cost optimizations achieved in carrying out the business transformation plan, 2)
operating cost optimizations in partnership contracts in the Rubiales, Nare and Quifa
fields, 3) lower costs in the Cravo Norte field, whose portion was lower in 2014, owing to
the application of the high price clause, and 4) restructuring of services, quantities, and
renegotiation of fees in field maintenance framework contracts.
b) A COP$94 billion increase in depreciation, primarily from higher asset capitalizations of
the transport segment and increased maintenance at the Barrancabermeja refinery.
c) Other minor items: -COP$16 billion.
Attacks to infrastructure negatively impacted results during 2015 in the amount of COP$98 billion,
including costs associated with repairs of the South (OTA and Caño Limon systems), dismantling of
illicit connections, resumption of pipeline operations, and area decontamination.
Gross margin in the fourth quarter of 2015 was 22.1% compared to 25.0% for the same period last
year.
Operating Expenses, which include exploratory expenses, decreased 24% (-COP$486 billion),
mainly as a result of: 1) optimizations under the headings of commissions, fees, services and
agreements and 2) decreased exploratory campaign carried out in 2015 despite recognition of the
Calasú dry well and the bond for acquisition of the Caño Sur rights.
12
MATERIAL INFORMATION
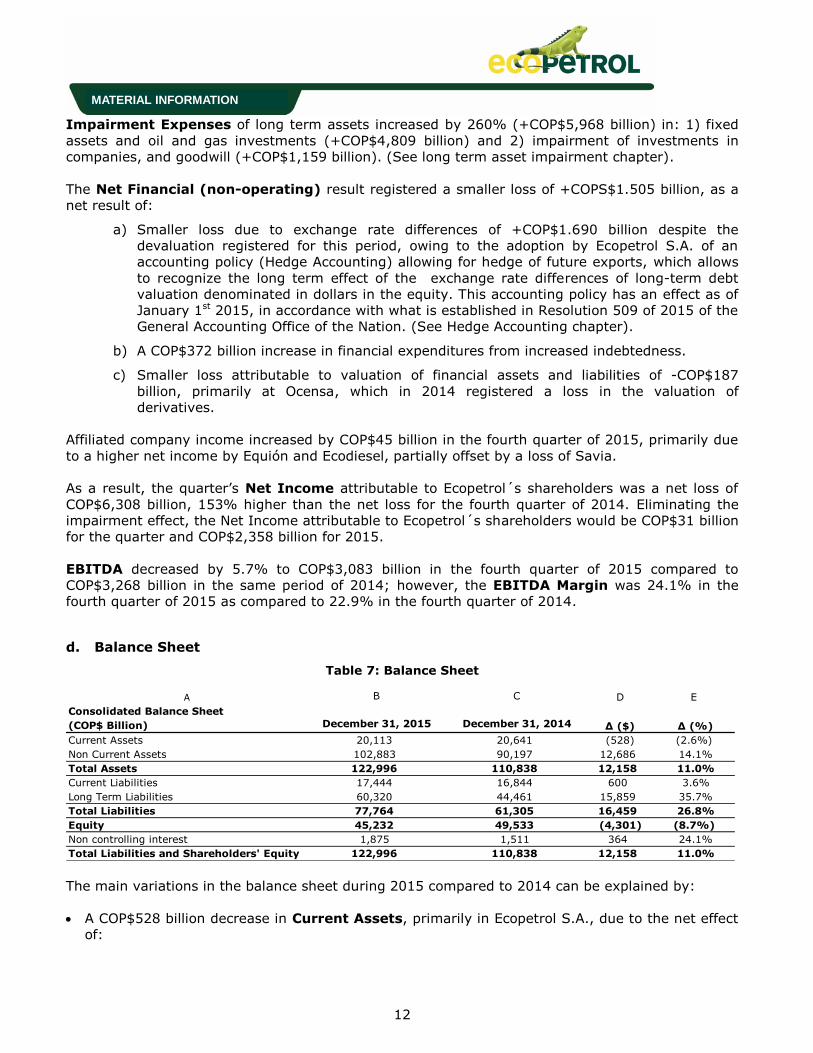
Impairment Expenses of long term assets increased by 260% (+COP$5,968 billion) in: 1) fixed
assets and oil and gas investments (+COP$4,809 billion) and 2) impairment of investments in
companies, and goodwill (+COP$1,159 billion). (See long term asset impairment chapter).
The Net Financial (non-operating) result registered a smaller loss of +COPS$1.505 billion, as a
net result of:
a) Smaller loss due to exchange rate differences of +COP$1.690 billion despite the
devaluation registered for this period, owing to the adoption by Ecopetrol S.A. of an
accounting policy (Hedge Accounting) allowing for hedge of future exports, which allows
to recognize the long term effect of the exchange rate differences of long-term debt
valuation denominated in dollars in the equity. This accounting policy has an effect as of
January 1st 2015, in accordance with what is established in Resolution 509 of 2015 of the
General Accounting Office of the Nation. (See Hedge Accounting chapter).
b) A COP$372 billion increase in financial expenditures from increased indebtedness.
c) Smaller loss attributable to valuation of financial assets and liabilities of -COP$187
billion, primarily at Ocensa, which in 2014 registered a loss in the valuation of
derivatives.
Affiliated company income increased by COP$45 billion in the fourth quarter of 2015, primarily due
to a higher net income by Equión and Ecodiesel, partially offset by a loss of Savia.
As a result, the quarter’s Net Income attributable to Ecopetrol´s shareholders was a net loss of
COP$6,308 billion, 153% higher than the net loss for the fourth quarter of 2014. Eliminating the
impairment effect, the Net Income attributable to Ecopetrol´s shareholders would be COP$31 billion
for the quarter and COP$2,358 billion for 2015.
EBITDA decreased by 5.7% to COP$3,083 billion in the fourth quarter of 2015 compared to
COP$3,268 billion in the same period of 2014; however, the EBITDA Margin was 24.1% in the
fourth quarter of 2015 as compared to 22.9% in the fourth quarter of 2014.
d. Balance Sheet
Table 7: Balance Sheet
The main variations in the balance sheet during 2015 compared to 2014 can be explained by:
A COP$528 billion decrease in Current Assets, primarily in Ecopetrol S.A., due to the net effect
of:
A B C D E
Consolidated Balance Sheet
(COP$ Billion) December 31, 2015 December 31, 2014 ∆ ($) ∆ (%)
Current Assets 20,113 20,641 (528) (2.6%)
Non Current Assets 102,883 90,197 12,686 14.1%
Total Assets 122,996 110,838 12,158 11.0%
Current Liabilities 17,444 16,844 600 3.6%
Long Term Liabilities 60,320 44,461 15,859 35.7%
Total Liabilities 77,764 61,305 16,459 26.8%
Equity 45,232 49,533 (4,301) (8.7%)
Non controlling interest 1,875 1,511 364 24.1%
Total Liabilities and Shareholders' Equity 122,996 110,838 12,158 11.0%

13
MATERIAL INFORMATION
o A decline in cash and cash equivalents of COP$1,068 billion, mainly by: 1) lower cash
flows derived from operational activities as a result of the oil and gas price scenario, 2)
dividend payment to the Nation, 3) Capex investments and 4) financial and commercial
obligations.
o Reduction in commercial accounts receivable in the amount of COL$860 billion, chiefly
due to the net effect of: 1) lower sales taking into account the drop in international crude
prices, 2) lower accounts receivables from the stabilization fund of oil prices given that in
the last quarter of 2015 resources were received as a result of the differential in fuel
prices.
o A decline in other assets of COP$784 billion, principally resulting from the Ecopetrol S.A.
decline of COP$720 billion from redemption of securities with financial institutions, and
lower advances in partnership contracts.
o A COP$427 billion decrease in Assets Maintained for Sale mainly due to the sale of
shares in Empresa de Energía de Bogotá.
o A COP$2,483 billion increase in Current Tax Assets, owing to balances in favor of VAT
declarations and income tax.
o Inventory increase in the amount of COP$128 billion, principally at the Cartagena
Refinery from accumulation of inventories caused by the startup of operations at the new
refinery.
Non-Current Assets increased by COP$12,686 billion, mainly due to increases in:
o Property, Plant and Equipment increased by COP$9,366 billion, due principally to: 1)
investments in assets associated with companies in the refining and transport segments of
+COP$8,549 billion, 2) exchange rate effect on affiliated companies with a functional
currency that is different from the Colombian peso (+COP$7,429 billion), 3) capitalization
of interest on credits associated with Capex investment of +COP$553 billion, offset by 4)
depreciation and impairment for the year in the amount of -COP$7,067 billion and 5) lesser
variations –COP$98 billion.
o Deferred Income Tax increased by COP$3,870 billion, generated mainly by Ecopetrol
S.A., taking into account the differences in the determination of the tax provision among
fiscal and accounting items.
o Natural resources decreased COP$77 billion, mainly because of the net effect of 1)
impairment of oil company investments of –COP$2,865 billion, 2) amortization for the
period of -COP$3,725 billion, 3) investments made during the year of +COP$6,857 billion
and 4) other lesser variations of –COP$344 billion.
o Other minor variations of -COP$473 billion.
Current Liabilities increased COP$600 billion in comparison to December of 2014, mainly
because of: 1) an increase in short-term financial obligations mainly due to the exchange rate
effect and the increase of indebtedness of +COP$1,056 billion, 2) an increase in the income tax
allowance for transport companies, given the higher results for their operations of +COP$907
billion, 3) a reduction in accounts payable due to fulfillment of commercial obligations and fewer
purchases during the period of –COP$1,042 billion, 4) a decline in provisions and contingencies
chiefly due to the recovery from the Garcero lawsuits, and self-generation of energy in the
amount of –COP$189 billion and 5) lesser variations of –COP$132 billion.
Long-term Liabilities increased by COP$15,859 billion, due mainly to the increase in
indebtedness and the effects of exchange rate valuation of debts in foreign currencies. Total
Ecopetrol Group amounts to COP$53,223 billion, out of which 87% is denominated in dollars and
14
MATERIAL INFORMATION
13% in Colombian pesos. During 2015 the dollar denominated debt increased by US$3,425
million given the borrowing of an international loan for US$1,925 million and an international
bond issuance for US$1,500 million in February and June 2015, respectively. Of the total debt in
foreign currency, US$5,376 million is the hedge financial instrument for future exports.
Shareholders’ Equity was COP$45,232 billion, out of which COP$43,357 billion are attributable
to Ecopetrol shareholders, a COP$4,665 billion decrease with respect to the close of December
2014, mainly due to the Group’s lower results.
e. Impairment of Long Term Assets
At least once a year, the Company should ascertain whether there are signs of impairment to its
assets or cash-generating units. For 2015, for the first time, the method established under
International Financial Reporting Standards (IFRS) is being applied, which, in contrast to US GAAP
and COL GAAP standards, entails discounting the present value of future cash flows that assets
generate.
The concept of impairment seeks to reflect in accounting terms the difference between the book
value of an asset or cash-generating unit as opposed to its theoretical valuation, and this valuation
uses particular assumptions that should reflect market conditions. The valuation is done based on
the free cash flow method, discounted at a certain rate as the weighted average capital cost
(WACC). When impairment is generated, an expense is recognized that affects a company’s result
for the period but which does not involve cash outlays. This impairment is susceptible to
reversion when the valuation of the asset exceeds its book value, except for that which has been
recognized as goodwill.
In 2015 the following types of impairment were recognized:
Impairment of property, plant and equipment, and natural resources
Impairment of investments and goodwill
1) Impairment of property, plant and equipment, and natural resources
Based on impairment tests conducted by the Company, the book value of certain assets exceeds
their valuation, which led to recognition of an expense for impairment in the statement of results of
COP$7.01 billion in 2015, and of COP$2.19 billion in 2014.
2) Impairment of investments and goodwill
For those affiliates, joint ventures and subsidiaries that were acquired with goodwill, Ecopetrol
checks for the existence of possible impairment in the value of the investment, using the
discounted free cash flow method.
Accordingly, impairment to the value of investments was recognized due to the current adverse
economic outlook for the hydrocarbon sector, which brings as a consequence a reduction in the oil
price forecast, and an increase in market and country risk, reflected in the discount rate of
COP$1,274 billion in 2015 and COP$115 billion in 2014.
The impairments registered are an accounting effect that corresponds to an expenditure that has
not been made, and therefore do not involve any disbursement of resources.
15
MATERIAL INFORMATION
f. Cash flow hedge for future Company exports
Ecopetrol S.A. finds itself exposed to foreign currency risk, considering that a substantial
percentage of its revenues from crude exports is in U.S. dollars.
Furthermore, in recent years the Company has taken on long-term debt in dollars for investment
activities. This creates a natural hedge, due to the fact that risks owing to the emergence of
differences in exchange rates for export revenues are naturally covered with the risks of long-term
debt valuation denominated in dollars.
In line with the Company’s risk management strategy of the company, and with the aim of
expressing in the Financial Statements the natural hedge effect existing between exports and
indebtedness, on September 30, 2015, the Board of Directors set aside the sum of US$5,440
million of the debt of Ecopetrol S.A. (49% of the debt) as hedge instrument to cover its future
export revenues for the 2015-2023 period, in accordance with IAS 39 – Financial instruments:
recognition and measurement.
With the adoption of this standard, the effect of exchange rate volatility on the hedged portion of
the debt is transferred to Equity, in the entry for Other Comprehensive Income (OCI), eliminating
the effect from the Income Statement. This effect will be reflected periodically as sales are made
abroad, with the understanding that the exchange rate risk emerges when exports are transacted.
The effects of the adoption of this policy, as reflected in the results for 2015, are net revenues of
COP$2.4 trillion, resulting from a positive effect on the financial result of COP$4.1 trillion, minus
COP$1.7 trillion in deferred tax, having an effect on revenues through exports made during the
period.
It is important to emphasize that the application of the policy does not have any effect on cash or
the payment of taxes. For tax purposes, differences in exchange rates have their treatment
established in the tax regulations themselves, and accordingly, changes generated by the
accounting policy do not have an effect on fiscal balances.
Pursuant to Resolution 509 of 2015 of the General Accounting Office of the Nation, this accounting
policy that has been adopted will be applicable to the entire accounting period of 2015, starting on
January 1st.
g. Credit Rating
The ratings in effect at December 31, 2015 were as follows:
Moody’s Investors Service: Baa2 with a stable outlook.
Standard and Poor’s: BBB with a stable outlook.
Fitch Ratings: international rating BBB, local BBB+, both ratings with a stable outlook.
In its report of December 17, 2015 Fitch Ratings underscored Ecopetrol’s financial solidity, stating
that “Ecopetrol's reserves, stable production levels, competitive cost structure and dominant
domestic market share allow the company to generate consistently strong cash flows from
operations and meet its obligations in a timely manner”.
On January 18, 2016 the rating agency Moody’s Investors Service reduced the international rating
of Ecopetrol S.A. from Baa2 to Baa3 and placed its outlook under revision. The resulting rating
means that Ecopetrol S.A. maintains its investment grade rating. Its base rating, which does not
include the implicit support of the government, fell from baa3 to ba3.

16
MATERIAL INFORMATION
Despite the effects that have brought about the fall in oil prices for the majority of oil companies,
Moody’s highlights in its report the efforts made by Ecopetrol S.A. to improve operating efficiencies
as well as adjustments in its investment plan aimed at protecting liquidity. It underscores the fact
that Ecopetrol has no significant corporate debt falling due until 2019.
The agency also emphasizes the support by the Republic of Colombia and the Company’s position
of leadership as Colombia’s leading producer of oil and gas, along with the stability of revenues
coming from other business segments such as transport.
On the other hand, on January 29, 2016, Standard and Poor’s reaffirmed Ecopetrol’s corporate
rating at BBB, with a revision of its outlook from stable to negative, owing to the drop in the price
of oil on the international market. Furthermore, its individual rating, which does not take into
account the implicit support of the government, declined from bbb- to bb.
Standard and Poor’s mentions Ecopetrol’s efforts to reduce its investments, to achieve cost savings
by renegotiating with suppliers, supply chain interventions and the renegotiation of contracts. It
also emphasizes processes for selling non-core assets as part of a divestments plan to improve its
cash flow and to focus on the upstream sector.
The agency recognizes Ecopetrol’s strategic role in the Colombian oil industry and its “very strong
link” with the Colombian Government.
h. Results by Business Segment
The following table presents business segment results for the periods indicated:
Table 8: Quarterly Results by Segment
A B C D E F G H I J K
E&P Refining & Petrochem. Transportation and Logistics Eliminations Ecopetrol Consolidated
COP$ Billion 4Q 2015 4Q 2014 4Q 2015 4Q 2014 4Q 2015 4Q 2014 4Q 2015 4Q 2014 4Q 2015 4Q 2014
Local Sales 2,481 2,069 5,107 4,970 79 85 (1,810) (1,698) 5,857 5,426
Export Sales 4,942 6,933 1,009 970 - - (289) (76) 5,662 7,827
Sales of services 40 44 66 24 2,944 2,325 (1,792) (1,391) 1,258 1,002
Total Sales 7,463 9,046 6,182 5,964 3,023 2,410 (3,891) (3,165) 12,777 14,255
Variable Costs 4,756 5,041 5,385 5,210 140 121 (3,124) (2,528) 7,157 7,844
Fixed Costs 2,063 1,770 552 508 1,035 1,165 (851) (601) 2,799 2,842
Cost of Sales 6,819 6,811 5,937 5,718 1,175 1,286 (3,975) (3,129) 9,956 10,686
Gross profit 644 2,235 245 246 1,848 1,124 84 (36) 2,821 3,569
Operating Expenses 1,246 1,668 598 515 62 286 (51) (28) 1,855 2,441
Operating Profit (602) 567 (353) (269) 1,786 838 135 (8) 966 1,128
Financial Income - Loss (888) (2,172) (80) (203) 98 (13) (94) (81) (964) (2,469)
Results from Subsidiaries 15 (23) 8 2 1 0 - - 24 (21)
Income tax benefits (expense) 371 473 555 463 (634) (194) - - 292 742
Net Income Consolidated (1,104) (1,155) 130 (7) 1,251 631 41 (89) 318 (620)
(Minus) Non-Controlling interests - - 3 0 (290) (131) - - (287) (131)
Equity Holders of Ecopetrol before impairment (1,104) (1,155) 133 (7) 961 500 41 (89) 31 (751)
Impairment expenses (net taxes) (3,472) (592) (2,817) (1,147) (50) (1) - - (6,339) (1,740)
Equity Holders of Ecopetrol (4,576) (1,747) (2,684) (1,154) 911 499 41 (89) (6,308) (2,491)
EBITDA 897 2,150 7 56 2,044 1,069 135 (7) 3,083 3,268
EBITDA Margin 12.0% 23.8% 0.1% 0.9% 67.6% 44.4% (3.5%) 0.2% 24.1% 22.9%

17
MATERIAL INFORMATION
Table 9: Annual Results by Segment
Exploration and production
Revenues for the fourth quarter of 2015 fell by 17% (-COP$1,580 billion) compared to the same
period of the year before, mainly due to:
Reduction of prices in Ecopetrol’s crude export basket by 48%
41% growth in the average rate of exchange, offset by
A reduction in volume exported, primarily caused by the unavailability of the Caño Limón
Coveñas pipeline owing to illegal valves in the department of Arauca.
The cost of sales for the segment has held steady compared to the fourth quarter of the previous
year, exhibiting a variation of 0.1% (COP$8 billion), as a result of: 1) efforts to optimize costs,
managing to renegotiate rates for contracts, 2) implementation of strategies for optimization of
dilution, and 3) cost reduction for purchasing of crudes from the ANH and third parties owing to the
drop in international prices. However, such efforts at optimization have been impacted by rising
rates for pipeline transport.
Operating expenses fell 25% (-COP$422 billion) chiefly in: 1) commissions, fees, charters and
services (-COP$155 billion) as a result of the optimization plan underway at the company, 2)
recovery of provisions for lawsuits (-COP$115 billion), mainly for Garcero, and self-generation of
energy at Occidental, 3) project expenses (-COP$103 billion) due to lower recognition for
environmental allowances associated to a diminished activity in the segment, 4) exploration costs
(-COP$49 billion) in view of lower seismic activity and the exploratory drilling campaign, despite the
recognition of the dry well Calasú and the exploratory rights of the Caño Sur block.
The net financial result reflects lower expenditures for the fourth quarter of 2015 in the amount of
COP$1,284 billion, as compared to the same period of the year before, because of the adoption of
the hedge accounting policy in 2015.
A B C D E F G H I J K
E&P Refining & Petrochem. Transportation and Logistics Eliminations Ecopetrol Consolidated
COP$ Billion 2015 2014 2015 2014 2015 2014 2015 2014 2015 2014
Local Sales 8,544 11,401 19,592 21,646 313 243 (6,817) (9,312) 21,632 23,978
Export Sales 22,814 33,509 3,536 5,432 - - (326) (725) 26,024 38,216
Sales of services 119 246 118 95 10,532 8,101 (6,334) (4,664) 4,435 3,778
Total Sales 31,477 45,156 23,246 27,173 10,845 8,344 (13,477) (14,701) 52,091 65,972
Variable Costs 18,500 21,139 18,856 23,649 440 402 (10,427) (12,449) 27,369 32,741
Fixed Costs 7,209 6,789 1,903 1,889 3,305 3,539 (2,791) (1,983) 9,626 10,234
Cost of Sales 25,709 27,928 20,759 25,538 3,745 3,941 (13,218) (14,432) 36,995 42,975
Gross profit 5,768 17,228 2,487 1,635 7,100 4,403 (259) (269) 15,096 22,997
Operating Expenses 3,301 4,338 1,729 1,406 575 686 (249) (187) 5,356 6,243
Operating Profit 2,467 12,890 758 229 6,525 3,717 (10) (82) 9,740 16,754
Financial Income - Loss (3,032) (2,830) (703) (502) (96) (86) (136) (93) (3,967) (3,511)
Results from Subsidiaries 11 168 23 11 1 - - - 35 179
Income tax benefits (expense) (312) (4,458) 204 253 (2,437) (1,148) - - (2,545) (5,353)
Net Income Consolidated (866) 5,770 282 (9) 3,993 2,483 (146) (175) 3,263 8,069
(Minus) Non-Controlling interests - - 5 4 (910) (627) - - (905) (623)
Equity Holders of Ecopetrol before
impairment(866) 5,770 287 (5) 3,083 1,856 (146) (175) 2,358 7,446
Impairment expenses (net taxes) (3,470) (568) (2,827) (1,153) (49) 1 - - (6,346) (1,720)
Equity Holders of Ecopetrol (4,336) 5,202 (2,540) (1,158) 3,034 1,857 (146) (175) (3,988) 5,726
EBITDA 8,494 18,710 1,907 1,367 7,696 4,514 (10) (82) 18,087 24,509
EBITDA Margin 27.0% 41.4% 8.2% 5.0% 71.0% 54.1% 0.1% 0.6% 34.7% 37.2%

18
MATERIAL INFORMATION
As a net result, the segment showed a loss attributable to Ecopetrol´s shareholders before
impairments of COP$1,104 billion in the fourth quarter of 2015, as opposed to a loss of COP$1,155
billion for the same period in 2014.
Refining and petrochemicals
Revenues for the fourth quarter of 2015 increased 4% (COP$218 billion) compared to the same
period of the previous year, owing mainly to greater demand for fuels at the national level,
supplying the border with Venezuela and the entry into service of the Cartagena Refinery, which
made it possible to increase exports of products such as fuel oil, diesel and gasolines; offsetting the
drop in international indicators for product prices.
Similarly, sales costs for this segment went up by 4% (COP$219 billion) as a consequence of: 1)
purchases of raw materials for operation of the Cartagena Refinery; offset by 2) lower cost of crude
at the Barrancabermeja Refinery, in keeping with lower international prices, and 3) lower operating
costs for contracted services, materials and supplies, as a result of optimization strategies carried
forward by Group companies.
Gross sales margin held steady at 4% with respect to the same quarter of the year before.
Expenses went up by 16% (COP$83 billion) compared with the same quarter of the year before,
mainly due to impairment registered at the Cartagena and Barrancabermeja Refineries.
Net financial expenses fell by 61% (-COP$123 billion) caused by lower devaluation presented in the
fourth quarter of 2015 with respect to the same period of 2014.
As a net result, the consolidated segment showed a net income attributable to Ecopetrol´ s
shareholders, before impairments, of COP$133 billion in the fourth quarter of 2015, as opposed to a
loss of COP$7 billion for the same period in 2014.
Transport and Logistics
Revenues for the fourth quarter of 2015 went up by 25% (+COP$613 billion), due mainly to the
devaluation of exchange rates for charges denominated in dollars.
Costs of sales for this segment fell 9% (-COP$111 billion), mainly due to lower costs for contracted
services and materials used in the operation, as a result of management by companies in this
segment, in the context of the Group’s transformation program.
Operating expenses fell by 78% (COP$224 billion) compared to the same period of the year before,
which is explained by impacts generated in the business transformation program, and by a
reduction in expenses associated with reparations for theft and assaults.
The net financial (non-operating) result shows an improved outcome of COP$111 billion, generated
mainly at Ocensa, which in the fourth quarter of 2014 registered a loss in the valuation of exchange
rate derivatives versus the same period of 2015.
As a final result, the segment reported net profits attributable to Ecopetrol´ s shareholders, before
impairments, of COP$961 billion, compared to COP$500 billion for the same period of 2014.
19
MATERIAL INFORMATION
i. Results of Cost and Expense Reduction Initiatives
In line with steps taken by the oil and gas industry worldwide to address the drop in crude prices
that began in the second half of 2014, Ecopetrol has undertaken austerity and cost optimization
measures that have allowed it to partially mitigate the impact of lower crude prices.
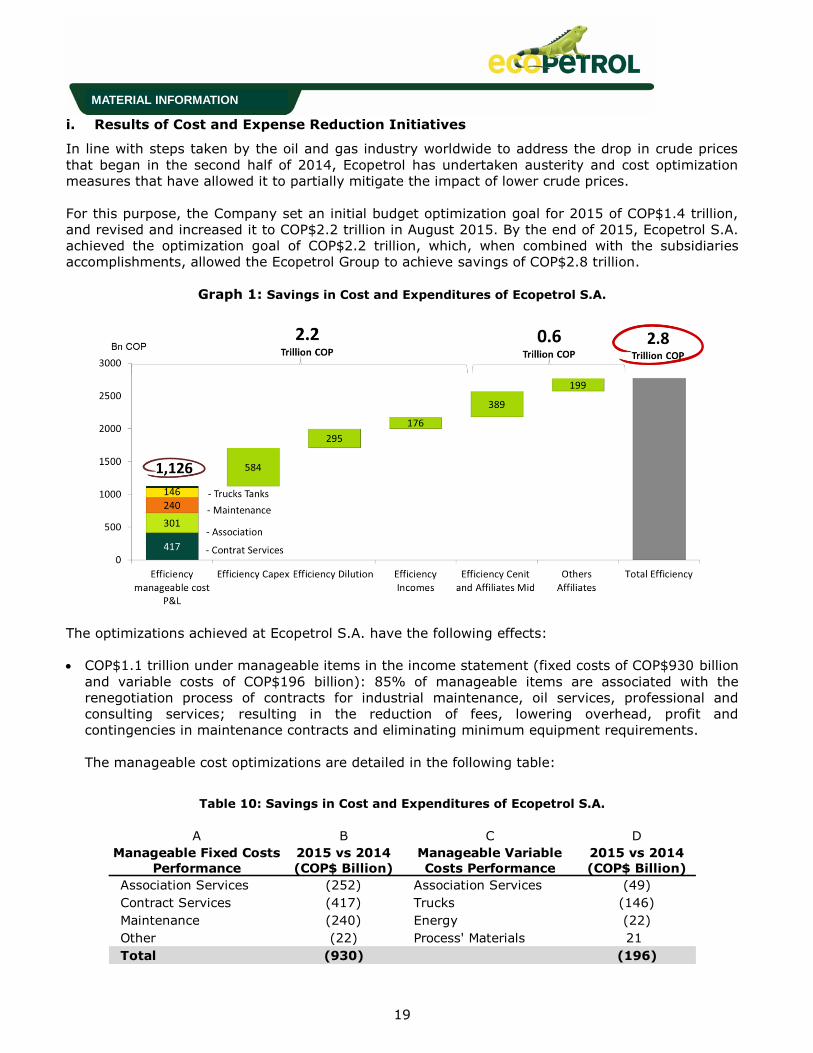
For this purpose, the Company set an initial budget optimization goal for 2015 of COP$1.4 trillion,
and revised and increased it to COP$2.2 trillion in August 2015. By the end of 2015, Ecopetrol S.A.
achieved the optimization goal of COP$2.2 trillion, which, when combined with the subsidiaries
accomplishments, allowed the Ecopetrol Group to achieve savings of COP$2.8 trillion.
Graph 1: Savings in Cost and Expenditures of Ecopetrol S.A.
The optimizations achieved at Ecopetrol S.A. have the following effects:
COP$1.1 trillion under manageable items in the income statement (fixed costs of COP$930 billion
and variable costs of COP$196 billion): 85% of manageable items are associated with the
renegotiation process of contracts for industrial maintenance, oil services, professional and
consulting services; resulting in the reduction of fees, lowering overhead, profit and
contingencies in maintenance contracts and eliminating minimum equipment requirements.
The manageable cost optimizations are detailed in the following table:
Table 10: Savings in Cost and Expenditures of Ecopetrol S.A.
A B C D
Manageable Fixed Costs
Performance
2015 vs 2014
(COP$ Billion)
Manageable Variable
Costs Performance
2015 vs 2014
(COP$ Billion)
Association Services (252) Association Services (49)
Contract Services (417) Trucks (146)
Maintenance (240) Energy (22)
Other (22) Process' Materials 21
Total (930) (196)
20
MATERIAL INFORMATION
COP$584 billion in investments, caused by: 1) a 21% reduction in cost per drilled foot with a
total impact of COP$433 billion; 2) a 37% decline in administrative staff and overhead for
projects generating savings of COP$60 billion; and 3) COP$91 billion in reductions of engineering
fees, facilities studies, cost and time reductions for location engineering through in-house
designs.
COP$295 billion in the dilution initiative: in unit terms, a diluted cost reduction of US$0.75/Bl
was achieved through an increase in transport system tolerance from 220 CST to 300 CST.
COP$176 billion for operational efficiencies with an impact on revenues, due to: 1) recognition of
logistics costs, working capital and ICA in the importation of diesel and gasoline (resulting in
savings of COP$74 billion), 2) initiatives for greater product yields at the refinery (resulting in
savings of COP$95 billion), and 3) upstream energy sales (resulting in savings of COP$7 billion).
Subsidiaries’ savings of COP$588 billion due to savings by Cenit and transport subsidiaries of
COP$389 billion, with efficiencies mainly in contract renegotiation strategies. The other
subsidiaries achieved savings of COP$199 billion, with a reduction in operating expenses
primarily at upstream subsidiaries.
With the above mentioned measures the company will not only foresee to have a more profitable
operation but also generate a more robust cash flow to finance its organic investments; aiming
for an indebtness that affects to the lesser extent possible the financial metrics and the credit
rating of Ecopetrol Group.
The optimizations achieved by Ecopetrol Group are in line, and sometimes exceed, the measures
that the oil and gas industry has adopted worldwide.
21
MATERIAL INFORMATION
II. Operating Results
a. Investments
Table 11: Investments* by Ecopetrol’s Corporate Group
*Figures on this table differ from the capital expenditure figures presented in the Consolidated Statement of Cash Flows on page 39 because
the figures on this table include both operating expenditures and capital expenditure outflows of investment projects, while the investment line of the Consolidated Statement of Cash Flows only includes capital expenditures.
** Investments were converted using the average representative Market Exchange Rate for 2015: COL$2,743.39/US
***Prorated according to Ecopetrol’s stake.
**** Corresponds to the new organizational structure and refers to investments approved for the New Business segment. These assets were
part of the Corporate segment until 2014.
Investments during 2015 were US$6,470.8 million (Ecopetrol S.A. itself accounting for 52% of that
amount while affiliates and subsidiaries accounted for 48%). These investments were distributed as
follows:
Production (50%): The drilling campaign, especially in the Castilla, Chichimene and Rubiales
fields.
Refining, Petrochemicals and Biofuels (27.2%): The Industrial Services Master Plan, which
provides energy, water, air and steam to the processes executed in the Barrancabermeja
refinery.
Transport (12.7%): The Cartagena refinery logistics project, which was aimed at ensuring the
supply of crude and liquid products for the Refinery, the Ocensa P135 project and the higher
viscosity crude transportation initiative.
Exploration (8.8%): Drilling of five exploratory wells and six appraisal wells.
b. Exploration
Exploration in Colombia:
The following table summarizes the results of the exploration activities in Colombia for the fourth
quarter of 2015 and year ended December 31, 2015:
A B C D E
Segment Ecopetrol S.A.Affiliates and
Subsidiaries***Total
Allocation by
segment
Production 2,725.5 508.8 3,234.3 50.0%
Refining, Petrochemicals and Biofuels 145.4 1,615.9 1,761.2 27.2%
Exploration 341.1 229.5 570.6 8.8%
Transportation 37.6 781.3 818.9 12.7%
Corporate 78.0 0.0 78.0 1.2%
New Businesses**** 6.4 0.0 6.4 0.1%
Supply and Marketing 1.3 0.0 1.3 0.0%
Total 3,335.3 3,135.5 6,470.8 100.0%
2015 (US$ million) **

22
MATERIAL INFORMATION
Table 12: Wildcats in Colombia
*Geological Success.
During the fourth quarter of 2015, the exploratory well Calasú located in the deep waters of the
Colombian Caribbean (operated by Anadarko, which holds a participation of 50%, while Ecopetrol
S.A. holds the remaining 50%), reached its final depth. The well proved the presence of dry gas;
although considered a geological success, this is not economically viable. The well was plugged and
abandoned.
Furthermore, during the fourth quarter of 2015 the drilling of the Muérgana Sur well, located in the
Llanos Orientales (operated by Ecopetrol S.A.) was completed. The well was plugged and
abandoned.
As for stratigraphic wells, in November 2015 the drilling of the Nogal Est1 ST well was concluded by
the Emerald company, operator of the Nogal block located in the Putumayo basin.
On December 8, 2015, our affiliate Hocol began the drilling of the Payero 1 exploratory well in the
Niscota block, located in the Piedemonte Llanero basin, (Hocol holds a participation of 20%, Total
50% and Repsol 30%). This well is operated by Equión and is currently in the process of drilling.
Below is a breakdown of the exploratory wells with geological success drilled in 2015:
Table 13: Exploratory Wells with geological success
International Exploration:
During the fourth quarter of 2015, Ecopetrol America, Inc. continued drilling the Leon 2 appraisal
well in deep waters off the Gulf of Mexico (operated 60% by Repsol and 40% by Ecopetrol America,
Inc.). The well reached its final depth on February 2, 2016, and is currently under evaluation.
Finally, and as a result of Ecopetrol America, Inc.’s participation in the Lease Sale 235, in October
2015, the U.S. Bureau of Ocean Energy Management (BOEM) awarded the Atwater Valley 009 and
the Mississippi Canyon 978 blocks. In addition, in November 2015 the BOEM awarded the East
Breaks 685 block from Lease Sale 246. Including these three blocks, during the year ended
December 31, 2015 the BOEM awarded to Ecopetrol America, Inc. a total of 10 blocks located in the
Gulf of Mexico.
A B C D E F G H I
Company DrilledHydrocarbon
Presence*
Under
EvaluationDry Drilled
Hydrocarbon
Presence*
Under
EvaluationDry
Ecopetrol S.A. 2 1 0 1 3 2 0 1
Hocol S.A. 0 0 0 0 1 1 0 0
Total 2 1 0 1 4 3 0 1
20154Q 2015
A B C D E
Quarter Basin Operator Block Well
1 VIM Hocol SSJN-1 Bullerengue-1
3 Offshore Caribe Anadarko Fuerte Sur Kronos
4 Sin Off Anadarko Fuerte Norte Calasú

23
MATERIAL INFORMATION
c. Reserves
The Company announced its proven reserves (1P, according to the international designation) of
crude oil, condensate and natural gas owned by the company, including its interest in affiliates and
subsidiaries, as of December 31, 2015. The reserves were estimated based on the U.S. Securities
and Exchange Commission (SEC) standards and methodology. 99% of them were audited by two
well-known specialized independent companies (Ryder Scott Company and DeGolyer and
MacNaughton).
Ecopetrol´s Proven net hydrocarbon reserves were 1,849 million barrels of oil equivalent (mmboe)
at the close of 2015, an 11% reduction compared with 2,084 mmboe at the end of 2014. The
reserve replacement ratio was 6%, and the reserves/production ratio (average life of reserves) was
7.4 years.
The reduction in proved reserves was mainly driven by the plunge of hydrocarbon prices. In 2015,
SEC price for Brent was US$55.57 per barrel compared to US$101.80 per barrel in 2014.
Ecopetrol estimates that the price effect implies a decrease of 404 mmboe in reserves during 2015
compared with those from the end of 2014. This decrease was largely offset by the addition of 275
mmboe, attributable to cost optimizations and higher efficiencies achieved by the Company as well
as by the addition of 67 mmboe as a result of the new drilling campaigns in Castilla and Rubiales
fields, and the positive revisions of some fields like Chichimene, due to good production
performance. Another positive effect came from the inclusion of natural gas self-consumption on
proved reserves (+47 mmboe).
The highest contributions to the reserve balance were from Castilla and Chichimene fields, both
directly operated by Ecopetrol, and from Rubiales field, which will be operated by Ecopetrol as of
July 2016.
95% of our proved reserves belong to Ecopetrol S.A., while Hocol, Ecopetrol America, Inc. and the
participation in Equion and Savia Peru contribute with 5%.
Table 14: Ecopetrol´s proven reserves as of December 31 of 2015
A B
Proved Reserves (1P)Oil Equivalent
(MBPE)
Proved Reserves as of Dic 31 of 2014 2,084
Revisions of previous estimates (25)
Purchases in minerals in place 0
Imporoved recovery 16
Extensions and discoveries 24
Sales of minerals in place 0
Production (251)
Proved Reserves as of Dic 31 of 2015 1,849

24
MATERIAL INFORMATION
d. Production
The following table summarizes the results of our oil and gas production activities for the periods
indicated:
Table 15: Ecopetrol Group’s Gross* Oil and Gas Production**
Table 16: Net* Oil and Gas Production** – Ecopetrol’s Net Interest
The year ended December 31, 2015 shows a positive balance because the Ecopetrol Group’s
production goal was met, despite the declining global price environment, the operating challenges
and the attacks to transportation infrastructure. Production increased about 5.3 mboed (+0.7%) as
compared to 2014, mainly caused by the production increase of Ecopetrol’s direct operation of the
Castilla (+17.4%) and Chichimene (+38.9%) fields, due to the entrance of new production wells in
those fields.
Moreover, it is important to emphasize: 1) the effect of the resumption of activity in the Rubiales
field, which has managed to stop the production decline it had observed since the end of 2013 and
A B C D E F G H I
Ecopetrol S.A. (mboed) 4Q 2015 4Q 2014 ∆ (%) ∆ bls 2015 2014 ∆ (%) ∆ bls
Crude Oil 583.4 588.6 (0.9%) (5.2) 586.2 579.7 1.1% 6.5
Natural Gas*** 123.9 124.3 (0.3%) (0.4) 121.2 125.4 (3.3%) (4.2)
Total 707.3 712.9 (0.8%) (5.6) 707.4 705.1 0.3% 2.3
Hocol (mboed) 4Q 2015 4Q 2014 ∆ (%) ∆ bls 2015 2014 ∆ (%) ∆ bls
Crude Oil 22.4 20.1 11.4% 2.3 21.4 21.2 0.9% 0.2
Natural Gas 0.5 0.1 400.0% 0.4 0.2 0.1 100.0% 0.1
Total 22.9 20.2 13.4% 2.7 21.6 21.3 1.4% 0.3
Savia (mboed)**** 4Q 2015 4Q 2014 ∆ (%) ∆ bls 2015 2014 ∆ (%) ∆ bls
Crude Oil 4.5 5.3 (15.1%) (0.8) 4.8 5.3 (9.4%) (0.5)
Natural Gas 1.2 1.1 9.1% 0.1 1.2 1.2 0.0% 0.0
Total 5.7 6.4 (10.9%) (0.7) 6.0 6.5 (7.7%) (0.5)
Equion (mboed)**** 4Q 2015 4Q 2014 ∆ (%) ∆ bls 2015 2014 ∆ (%) ∆ bls
Crude Oil 12.6 9.3 35.5% 3.3 11.6 9.2 26.1% 2.4
Natural Gas 9.4 8.6 9.3% 0.8 9.0 8.6 4.7% 0.4
Total 22.0 17.9 22.9% 4.1 20.6 17.8 15.7% 2.8
Ecopetrol America-K2
(mboed) 4Q 2015 4Q 2014 ∆ (%) ∆ bls 2015 2014 ∆ (%) ∆ bls
Crude Oil 1.4 4.3 (67.4%) (2.9) 2.5 2.6 (3.8%) (0.1)
Natural Gas 2.0 3.4 (41.2%) (1.4) 2.6 2.1 23.8% 0.5
Total 3.4 7.7 (55.8%) (4.3) 5.1 4.7 8.5% 0.4
Ecopetrol Corporate
Group (mboed) 4Q 2015 4Q 2014 ∆ (%) ∆ bls 2015 2014 ∆ (%) ∆ bls
Crude Oil 624.3 627.6 (0.5%) (3.3) 626.5 618.0 1.4% 8.5
Natural Gas 137.0 137.5 (0.4%) (0.5) 134.2 137.4 (2.3%) (3.2)
Total Group's Production 761.3 765.1 (0.5%) (3.8) 760.7 755.4 0.7% 5.3
* Gross production includes royalties and prorated according to Ecopetrol s stake in each company.
*** Gas production includes white products.
** Figures for Equion and Savia are not consolidated within the Ecopetrol Group.
**** The production breakdown of crude oil and gas for 2014 was modified in order to reflect the production of white products in the production of gas.
A B C D E F G H I
Ecopetrol Group (mboed) 4Q 2015 4Q 2014 ∆ (%) ∆ (bls) 2015 2014 ∆ (%) ∆ (bls)
Crude Oil 548.1 548.5 (0.1%) (0.4) 549.5 539.1 1.9% 10.4
Natural Gas*** 125.0 124.0 0.8% 1.0 121.8 121.0 0.7% 0.8
Total Group's Production 673.1 672.5 0.1% 0.6 671.3 660.1 1.7% 11.2
* Net production does not includes royalties and prorated according to Ecopetrol s stake in each company.
** Equion and Savia do not consolidate within the Group.
*** Gas production includes white products.
25
MATERIAL INFORMATION
2) the production increase of the subsidiary Equión (+15.7%). These increases made possible to
offset the wells natural declines, the modification of partnership participation in certain fields due to
the current level of prices, reduction in activity by some partners, environmental licensing
restrictions, and the effect of the attacks on oil infrastructure during the third quarter of 2015.
In the fourth quarter of 2015, Ecopetrol Group’s production improved as compared to the third
quarter of 2015, and decreased only 0.5% as compared to the same period in 2014. The
improvement during the fourth quarter of 2015 was due mainly to the normalization of operations
in the Caño Limón and Gibraltar fields after the attacks on the Caño Limón – Coveñas oil pipeline
that occurred during the third quarter of 2015, and to the record production of 126 mbod achieved
at the Castilla field during the fourth quarter of 2015.
As compared to the fourth quarter of 2014, the lower figures are explained by the production
decline of some assets such as Guajira and Casabe, and by Ecopetrol’s reduced share in the
production of the La Cira, Quifa and Caño Limón fields due to the application of the high price
clause under current price conditions. These reductions were mainly offset by a nearly 10%
increase in the Orinoquia region assets: production of the Castilla (+16.7%), Chichimene (+14.2%)
and Cupiagua (+8.5%) fields.
Projects to Increase the Recovery Factor:
During the year ended December 31, 2015, eight pilot projects were launched with the aim of
increasing the recovery factor by using the following techniques: water injection, solvent injection
and improved water injection, meeting the goal that was originally set. Among the key results of
the pilot projects, the implementation of the water injection pilots into fields of heavy crude such as
Castilla and Chichimene is highlighted, with positive results in areas where interventions took place,
which reported an increase of around 1.8 mbod up as of December, 2015. This cumulative
additional production currently represents an increase in the recovery factor of 1.2% in the area of
the Chichimene field pilot, and of 0.15% in the area of the Castilla field pilot.
In addition, the air injection pilot project in Chichimene field reached 94% completion on
construction of surface facilities, thereby completing most of the project’s main works. Connectivity
tests were also concluded with positive results, demonstrating the continuity in the sands and the
connection between the injection well and production wells. The start of air injection is planned for
the fourth quarter of 2016.
Including the pilot projects started in 2015, the Company currently has 29 recovery pilots
underway, of which 22 have shown positive results in increasing pressure and 15 have shown an
increase in crude production in the areas impacted.
Production of Main Fields:
The following table summarizes the average production of our main fields by region for the periods
indicated:

26
MATERIAL INFORMATION
Table 17: Gross Average Production Main Fields by Region (mboed) – Ecopetrol’s Net Interest
The following table summarizes the results of our crude oil production by type of crude for the
periods indicated:
A B C D E F G
4Q 2015 4Q 2014 ∆ (%) 2015 2014 ∆ (%)
Central Region 98.0 96.6 1.4% 97.8 95.5 2.4%
1) La Cira-Infantas 21.7 25.0 (13.1%) 23.0 24.8 (7.0%)
2) Casabe 20.3 22.4 (9.4%) 21.9 22.0 (0.7%)
3) Yarigui 19.7 16.5 19.1% 18.4 17.2 7.2%
4) Other 36.3 32.7 11.1% 34.5 31.6 9.3%
Orinoquía Region 264.1 240.4 9.8% 260.8 227.2 14.8%
1) Castilla 126.0 108.0 16.7% 122.5 104.4 17.4%
2) Chichimene 76.6 67.1 14.2% 78.0 56.2 38.9%
3) Cupiagua 41.8 38.5 8.5% 38.1 38.9 (2.2%)
4) Other 19.7 26.9 (26.9%) 22.2 27.7 (19.9%)
South Región 31.3 33.6 (7.0%) 32.6 35.0 (6.7%)
1) Huila Area 8.5 9.3 (8.8%) 8.7 9.4 (7.7%)
2) San Francisco Area 7.6 8.9 (15.0%) 8.1 9.3 (12.6%)
3) Tello Area 4.8 4.6 6.1% 4.9 4.5 6.8%
4) Other 10.4 10.8 (4.4%) 11.0 11.8 (6.6%)
Associated Operations* 313.9 342.2 (8.3%) 316.2 347.4 (9.0%)
1) Rubiales 94.6 96.3 (1.8%) 94.3 104.3 (9.6%)
2) Guajira 39.6 47.1 (15.9%) 42.7 50.1 (14.8%)
3) Caño Limón 28.0 36.8 (23.8%) 25.6 30.1 (14.9%)
4) Cusiana 31.3 33.1 (5.4%) 32.2 33.5 (4.0%)
5) Quifa 23.4 32.5 (28.0%) 24.2 33.0 (26.6%)
6) Other 97.0 96.5 0.6% 97.2 96.4 0.8%
Total Ecopetrol S.A. 707.3 712.9 (0.8%) 707.4 705.1 0.3%
Direct Operation 397.1 375.3 5.8% 395.6 361.8 9.3%
Associated Operation 310.2 337.7 (8.1%) 311.7 343.3 (9.2%)
Hocol
1) Ocelote 15.0 14.5 3.4% 14.4 14.6 (1.4%)
2) Other 7.9 5.7 38.6% 7.2 6.7 7.5%
Equión**
1) Piedemonte 16.0 12.0 33.8% 14.7 11.7 25.4%
2) Tauramena / Chitamena 3.5 4.6 (23.9%) 4.2 4.7 (10.4%)
3) Other 2.5 1.3 92.3% 1.7 1.4 21.4%
Savia**
1) Lobitos 2.2 2.9 (24.1%) 2.5 2.9 (13.8%)
2) Peña Negra 2.3 2.2 4.5% 2.3 2.2 4.5%
3) Other 1.2 1.3 (7.7%) 1.2 1.4 (14.3%)
Ecopetrol America Inc.
1) Dalmatian 2.8 6.4 (56.5%) 4.0 3.4 17.6%
2) k2 0.6 1.3 (53.8%) 1.1 1.3 (15.4%)
**Figures for Equion and Savia are not consolidated within the Ecopetrol Group.
*Fields previously classified as minor fields belong to the Associated Operation Vicepresidency regardless the type of operation.

27
MATERIAL INFORMATION
Table 18: Gross Ecopetrol’s Corporate Group Production per Type of Crude (mbod)
Lifting Cost
The lifting cost per barrel produced by the Ecopetrol Group, not including production corresponding
to royalties, was US$7.67 per barrel for the fourth quarter of 2015, representing a reduction of
US$4.38 per barrel as compared to the US$12.05 for the same period of 2014. This reduction was
primarily due to:
A cost effect resulting in a US$1.34 per barrel decrease due to lower cost per barrel in
Ecopetrol’s operations derived from the following cost optimization strategies: 1) fewer number
of well interventions due to subsoil strategies, 2) improvements in maintenance routines and
equipment reliability, 3) lower costs for entry of facilities projects, which reduced equipment
rental (well testing), 4) reduction of energy costs by optimizing electrical systems, and 5) lower
costs resulting from contract renegotiations.
A decrease of US$3.13 per barrel in lifting costs caused by the conversion of peso-denominated
cost in U.S. dollars at a higher exchange rate, which increased in COP$885.32 per dollar as
compared to the fourth quarter of 2014 (COP$3,058.97/US in the fourth quarter of 2015 versus
COP$2,173.65/US in the same quarter of 2014).
Volume effect resulting in a US$0.09 per barrel increase in lifting costs due to lower production
volumes.
The lifting cost per barrel produced by the Ecopetrol Group, not including production corresponding
to royalties, was US$7.39 per barrel for 2015, representing a reduction of US$3.84 per barrel as
compared to the US$11.23 for the same period of 2014. This reduction was primarily due to:
A cost effect resulting in a US$1.06 per barrel decrease due to lower cost per barrel in
Ecopetrol, its affiliates and subsidiaries’ operations derived from the following cost optimization
strategies: 1) fewer number of well interventions due to subsoil strategies, 2) improvements in
maintenance routines and equipment reliability, 3) lower consumption of chemicals by
increasing process efficiency, 4) reduction of energy costs by optimizing electrical systems, and
5) lower costs resulting from contract renegotiations.
A decrease of US$2.75 per barrel in lifting costs caused by the conversion of peso-denominated
cost in U.S. dollars at a higher exchange rate, which increased in COP$743.06 per dollar as
compared to 2014 (COP$2,743.39/US in 2015 versus COP$2,000.33/US in 2014).
Volume effect resulting in a decrease of US$0.03 per barrel in lifting costs due to higher
production volumes.
The portion of the lifting cost in U.S. dollars is 14%.
e. Transport
The following table summarizes our volumes transported for the periods indicated:
A B C D E F G
4Q 2015 4Q 2014 ∆ (%) 2015 2014 ∆ (%)
Light 65.1 62.6 4.0% 63.5 61.7 2.9%
Medium 206.3 221.2 (6.7%) 208.5 219.7 (5.1%)
Heavy 352.9 343.8 2.6% 354.5 336.6 5.3%
Total 624.3 627.6 (0.5%) 626.5 618.0 1.4%

28
MATERIAL INFORMATION
Table 19: Volumes Transported (mbod)
Note: figures correspond to volumes transported by the Ecopetrol Group and by third parties.
The volume of crude transported by the main Cenit S.A.S. system and those of its affiliates
decreased 1.2% in the fourth quarter of 2015, compared to the same period of 2014, primarily
caused by operating restrictions on the transportation systems associated with repairs to the
damage from the attacks on the infrastructure in the Caño Limón–Coveñas and Transandino
systems. Ecopetrol S.A. crude accounted for approximately 72% of the total volume of crude
transported by Cenit oil pipelines.
During the year ended December 31, 2015 the volume of crude transported increased 2.5%
compared to the year ended December 31, 2014 primarily due to the greater availability of the
Caño Limón–Coveñas and Transandino systems, which were less affected by the attacks on the oil
infrastructure.
The volumes of refined products transported through the main Cenit S.A.S systems decreased
2.9% in the fourth quarter of 2015 compared to the same period of 2014 due to: 1) a greater use
of the Galán-Bucaramanga and Cartagena-Barranquilla systems to ensure fuel supply to the interior
parts of Colombia and to the Venezuelan border zone and 2) a greater use of the Buenaventura–
Yumbo system for fuel importation to generate energy. Of the total volume of products transported
through Cenit pipelines, about 16% corresponds to products owned by Ecopetrol.
During the year ended December 31, 2015 the volume of refined products transported increased
1% compared to the year ended December 31, 2014, due to an increased volume transported
through the Cartagena–Barranquilla system for fuel importation to supply fuel to the interior parts
of Colombia.
Projects:
SAN FERNANDO – MONTERREY: Transportation capacity between Castilla field and Monterrey
increased by 40 thousand barrels per day, reaching a total capacity of 300 thousand barrels per
day. This project ensures the evacuation of the Castilla, Chichimene and Apiay fields, avoiding
deferred production and/ or the use of trucks to evacuate the production of those fields.
NORTH COAST OF COLOMBIA – GALÁN: The first module was completed, which demanded
increasing capacity by 130,000 bpd. This project allows the supply of refined products and
nafta for the country, avoiding transportation of nafta in trucks.
MAGDALENA MEDIO 100: Construction of the Coveñas storage facilities and certain necessary
replacements of piping were completed. This project ensures a crude oil storage capacity and
management of fuel oil through the Coveñas port facility.
OCENSA P135: This Project achieved progress of 80.8%. It is expected that an additional
capacity of 135 mbod will be reached in the third quarter of 2016. This project will ensure
capacity for transporting crude from Los Llanos to the ports where it will be exported.
Initiative for transport of higher viscosity crudes: At the close of 2015, testing was conducted
successfully on various systems, and additional information was gathered to move ahead with
analyses that will allow for savings of diluent.
A B C D E F G
4Q 2015 4Q 2014 ∆ (%) 2015 2014 ∆ (%)
Crude 963.9 975.5 (1.2%) 978 954.2 2.5%
Refined Products 264.5 257.1 2.9% 253.8 251.2 1.0%
Total 1,228.4 1,232.6 (0.3%) 1,231.8 1,205.4 2.2%
29
MATERIAL INFORMATION
The main modifications will be made on: the Los Llanos Pipeline (ODL - Oleoducto de los
Llanos; Rubiales – Cusiana), on OCENSA Segment I (Cusiana –Porvenir), Segments II & III (El
Porvenir – Vasconia – Coveñas), and on the Colombia Pipeline (ODC – Oleoducto de Colombia).
This Project, combined with the expansion of capacity on Ocensa (P-135), will make it possible
to transport higher viscosity crudes, reducing dilution costs for the transport of crude.
Cost Per Barrel Transported2
The cost per barrel transported for the Ecopetrol Group during the fourth quarter of 2015 was
US$1.88/Bl, representing a US$0.36 per barrel decrease as compared to US$2.24 per barrel for the
same period of 2014. This result was primarily due to the following factors:
Expenditure effect: +US$0.40 per barrel:
o +US$0.70 per barrel increase in tax expenditures attributable to increased revenues
during the fourth quarter of 2015.
o -US$ 0.30 product of the efficiencies achieved in operating costs primarily under the
headings of maintenance materials, physical security, attention of contingencies and
administrative costs.
TRM effect: -US$0.76 cost per barrel decrease resulting from the devaluation of the Colombian
peso from COP$885.32 per dollar compared to the same quarter of 2014 (COP$3,058.97/US in
the fourth quarter of 2015 vs COP$2,173.65/US in the fourth quarter of 2014).
The cost per barrel transported for the Ecopetrol Group, during the year ended December 31, 2015,
was US$3.37/Bl, representing a US$0.66 per barrel decrease as compared to US$4.03 per barrel
for the same period of 2014. This result was primarily due to the following factors:
Expenditure effect: +US$0.77 per barrel:
o +US$0.97 per barrel increase in tax expenditures as a result of the increased
revenues during 2015.
o -US$ 0.20 product of the efficiencies achieved in operating costs primarily under the
headings of maintenance materials, physical security, attending to contingencies and
administrative costs.
TRM effect: US$1.28 cost per barrel decrease resulting from the devaluation of the Colombian
peso from COP$743.06 per dollar compared to 2014 (COP$2,743.39/US in 2015 vs
COP$2,000.33/US in 2014).
Volume effect: -US$0.15 per barrel as a result of the higher transported volumes in the period
2015 versus 2014.
The portion in U.S. dollars of the cost per barrel transported to the Ecopetrol Group is 8.3%.
2 In 2014, Ecopetrol S.A. reported its results individually and it calculated its transportation cost by taking into account all payments made to
affiliates for crude transport, transport by truck, and all costs incurred by Ecopetrol S.A. in the operation and maintenance of some of its own
crude systems. These costs were divided by the crude barrels sold by Ecopetrol S.A.
In 2015, all financial information and volumes for the business group is reported under IFRS, eliminating out all transactions between
Ecopetrol S.A. and its transport affiliates; hence, the cost is calculated as follows: total costs and expenses of each transport company from
the group, plus Ecopetrol S.A. costs in the operation and maintenance of some of its own systems; divided by the total volumes transported
by all the affiliates (crude and refined products).
30
MATERIAL INFORMATION
f. Refining
f.1) Reficar (Cartagena Refinery):
The new Cartagena refinery reached a key milestone on October 21, 2015: the start-up of the
Crude Unit, the backbone of the refining process. During its initial phase, since November 2015 this
unit has been producing fuels at half of its capacity, processing daily between 80 and 90 mbd of
crude oil, a volume that will gradually increase until it reaches its maximum processing capacity.
It is estimated that all of the plants comprising the new Cartagena refinery, will be jointly operating
during the second quarter of 2016. A stable start-up process is expected to reach an average
estimated load of 150 mbd in the second semester of 2016, as well as perform maximum capacity
acceptance tests.
The Cartagena Refinery will produce low-sulphur products, which quality will make it possible to
reach high standard markets. The refinery counts with units that will allow loading heavy crude oil
with a high sulfur and acidity content.
The first fuel export took place in November 2015 going to the United States and the Caribbean, for
a total of 200 thousand barrels of virgin naphtha and 50 thousand barrels of JET A1 aviation fuel.
Last February 24, the Delayed Coking Unit commenced operations. This is the unit that enables us
to reach a conversion factor of 97%. It produces fuel gas, LPG (liquefied petroleum gas), naphtha,
diesel and petcoke, or petroleum coke. Production of Petcoke is estimated at 75,000 tons per
month, which will be exported.
In addition to the deep conversion Delayed Coking unit, at the end of February two more plants
came into operation: the Cracking unit and the Naphtha Hydrotreater plant. The Cracking unit has
a capacity to process 35 thousand barrels of gasoil and transform them in LPG (Liquefied Petroleum
Gas), Propane-Propylene, naphtha which are gasoline components, light cycle oil (LCO) and Arotar
(raw material for tire production).
The Naphtha Hydrotreater has a processing capacity of 20 mbd, and is the one in charge of
removing the sulphur from gasoline, to deliver ultra-low sulphur fuels with less than 50 parts per
million.
With this group of plants, the new Cartagena refinery will have the capacity to transform 97% of
the crude into valuable products. Prior to modernization, this conversion only came to 75%.
f.2) Barrancabermeja Refinery:
The following table summarizes the results of our refining activities for the periods indicated:
Table 20: Refinery Runs, Utilization Factor and Production
* Includes volumes loaded in the refinery, not total volumes received.
The crude load increased in the fourth quarter of 2015 due to the operational availability of the
units. In 2015 the refinery runs and utilization factor were reduced due to the scheduled
A B C D E F G
4Q 2015 4Q 2014 ∆ (%) 2015 2014 ∆ (%)
Refinery Runs* (mbod) 229.0 227.2 0.8% 221.9 226.9 (2.2%)
Utilization Factor (%) 81.0% 76.8% 5.5% 79.6% 80.1% (0.6%)
Production (mboed) 230.2 228.3 0.8% 223.2 230.5 (3.2%)
31
MATERIAL INFORMATION
maintenance of a crude unit (U200) in August 2015.
The Industrial Services Master plan achieved 99.32% physical progress, achieving the goal of
starting up the turbogenerator boiler, scheduled for the last quarter of 2015.
Costs and Margins of the Refining Segment
The cash operating cost for the segment (includes the operation of the Barrancabermeja refinery
and Propilco) in the fourth quarter of 2015 was US$4.0/Bl, US$5.51/Bl lower (including US$0.21/Bl
from Propilco) compared to the same period in 2014 (US$9.51/Bl) due to:
Cost effects: -US$3.79/Bl: due to the net effects of:
o A -US$4.81/Bl: lower fixed costs associated with strategies for optimization in
maintenance and support services.
o A +US$1.02/Bl: higher operating costs of Propilco associated with a larger volume
sold.
TRM effect: -US$1.63 cost per barrel decrease resulting from the devaluation of the Colombian
peso from COP$885.32 per dollar compared to the same quarter of 2014 (COP$3,058.97/US in
the fourth quarter of 2015 vs COP$2,173.65/US in the fourth quarter of 2014).
A volume effect due to higher recorded throughput resulting in a US$0.09 per barrel decrease.
The cash operating cost for the segment (includes the operation of the Barrancabermeja refinery
and Propilco) in the year ended December 31, 2015 was US$4.37/Bl, US$2.85/Bl lower (including
US$0.07/Bl from Propilco) compared to the year ended December 31, 2014 (US$7.22/Bl) due to:
Cost effects: -US$1.29/Bl as a result of the net effects of:
o A -US$2.38/Bl: lower fixed costs associated with strategies for optimization in
maintenance and support services.
o A +US$1.09/Bl: higher operating costs of Propilco associated with a larger volume
sold.
TRM effect: US$1.62 cost per barrel decrease resulting from the devaluation of COP$743.06
per dollar of the Colombian peso (COP$2,743.39/US in 2015 vs COP$2,000.33/US in 2014).
A volume effect due to lower recorded throughput resulting in a US$0.06 per barrel increased
in cash operating costs.
The portion in U.S. dollars corresponding to the refining cost is 17%.
The following table summarizes the results of the refining margin for the periods indicated:
Table 21: Refining Margin
The decline in gross refining margin at Barrancabermeja in the fourth quarter of 2015 versus the
fourth quarter of 2014 is due to the lower price of medium distillates, despite the greater yield of
the latter. During the year ended December 31, 2015, there was a 15.6% increase with respect to
the year ended December 31, 2014, mainly in response to: 1) a greater yield of medium distillates,
2) a better behavior of prices for LPG, Gasoline and Fuel Oil, and 3) implementation of operating
initiatives to increase the value of LPG and residual streams.
A B C D E F G
4Q 2015 4Q 2014 ∆ (%) 2015 2014 ∆ (%)
Refining Margin (USD/bl) 15.0 15.8 (5.1%) 16.8 14.6 15.6%
32
MATERIAL INFORMATION
III. Organizational Consolidation, Corporate Responsibility and Corporate
Governance (Ecopetrol S.A.)
a. Organizational Consolidation
Health, Safety and the Environment (HSE):
The following table summarizes our HSE record for the periods indicated:
Table 22: Health, Safety and the Environment (HSE)
*Results are subject to revision due to the fact that some figures may be reclassified, depending on the final results of the respective
investigations.
For the year ended December 31, 2015, Ecopetrol achieved the best industrial safety performance
in its history, as measured by the Recordable Incident Frequency Rate and the Accident Frequency
Index. Furthermore, the best performance in process safety was achieved, measured as the
frequency of Level 1 incidents as per API-754 due to loss of primary containment.
Key milestones
Best HSE performance for Ecopetrol in its entire history, no fatalities that can be attributed
to work accidents. These accomplishments place Ecopetrol within the average for the global
industry.
More than 100 million hours without an incapacitating accident in Reficar.
Reduction of environmental incidents, from an average of 4,500 barrels spilled in the past
five years to 207 barrels in 2015.
Economic benefits from US$27.8 million in projects to reduce emissions, tied to reductions in
energy consumption and recovery of hydrocarbons, which were vented or burned.
Revenues of COP$8.6 billion pesos for exploitation and sale of residues, improvements in
sludge management practices and recovery of its related hydrocarbons.
Reduction of 590,211 tons of greenhouse gases exceeding the goal set by 243%.
Science and Technology:
In the fourth quarter of 2015, six patents were granted to the Company in Colombia, each with
duration of 20 years:
• Hydrate inhibitor with product fluid separator: This is a system that prevents the formation
of hydrates in the gas injection system in the well, by changes of temperature or high flow
pressure.
• Inflow nozzles on sedimentation device for separation processes: These make it possible to
reduce the amount of crude dragged across the bottom of sedimentation devices in the
deasphalting process, reducing turbulence due to inflows, and achieving high stream
velocities to prevent accumulation of solids and facilitate separation of liquids.
A B C D E
HSE* 4Q 2015 4Q 2014 2015 2014
Accident Frequency Index
(accidents per million labor hours)0.60 0.75 0.49 0.92
Environmental Incidents (operational cause) 5 8 11 29

33
MATERIAL INFORMATION
• Device for containment of piping system flow with conical double plug system: Double plug
valve that makes it possible to block, detour and take in fluids through a sector of the piping
system to facilitate cleaning, and thus avoid product leaks into the atmosphere. The system
functions with any kind of fluid at any temperature range.
• Modular and reusable eco-desander and eco-skimmer for oil production and processing
facilities: Systems made of polymers with lifting points that facilitate its transport and reuse
for the removal of grease and sand in crude production fields.
• Process for biodiesel stabilization: Procedure for the processing of biodiesel through
absorption of contaminants that leads to the formation of a precipitate known as haze, which
affects the performance of biodiesel as a fuel.
• Process for conversion of diesel fuels and/or distillate bottoms through integration of
catalytic cracking and hydrocracking: Technology that enables increasing production of
diesel through processing of diesels and bottom flows at the refinery.
With these patents, Ecopetrol had a total of 10 patents in the year ended December 31, 2015, and
69 active patents, and thus maintaining its status as the national Company that takes out the most
patents in Colombia.
Awards:
Ecopetrol was one of the companies to win the MAKE award (Most Admired Knowledge
Enterprise), Americas edition; out of 57 companies nominated, Ecopetrol was the only non-
U.S. Company to be a winner.
In the year ended December 31, 2015 Ecopetrol was recognized once again at the national
level with the award for innovation of the Colombian Association of Petroleum Engineers
(ACIPET - Asociación Colombiana de Ingenieros de Petróleos), winning in the category for
Technological Innovation with the work “Test for Improving the Mobility of Heavy Crude
under Deposit Conditions Based on Nanotechnology: Castilla Field Pilot.”
The Company’s first Industrial Secret was created: GEOPANTRO – “Palynological and
Biostratigraphic Database purged, standardized and interpreted from surface sections and
Colombian Wells,” which makes Ecopetrol an attractive partner for Exploration and
Production drawing on exclusive information.
b. Corporate Social Responsibility
Social Investment:
During the year ended December 31, 2015, the Company invested COP$34,305 million in regional
competitiveness programs, COP$17,424 million in education and cultural programs and COP$6,776
million for citizenship and democracy programs, amounting to a total investment of COP$58,505
million.

34
MATERIAL INFORMATION
IV. Presentation of Fourth Quarter and Full Year 2015 Results
Ecopetrol’s management will host two conference calls to review our results for the fourth quarter
and the full year 2015:
Spanish English
March 7, 2016 March 7, 2016
8:00 a.m. Bogota/New York/Toronto 10:00 a.m. Bogota/New York/Toronto
The webcast will be available on Ecopetrol’s website: www.ecopetrol.com.co
Please log on in advance to download the necessary software and check the proper operation of the
webcast in your browser. We recommend using the latest versions of Internet Explorer, Google
Chrome or Mozilla Firefox.
About Ecopetrol S.A.
Ecopetrol S.A. (BVC: ECOPETROL; NYSE: EC) (“Ecopetrol” or the “Company”) is the largest
company in Colombia based on revenue, profit, assets and net worth. Ecopetrol is the only
vertically integrated Colombian oil and gas company with stakes in operations in Colombia, Brazil,
Peru and the United States (Gulf of Mexico).
Its subsidiaries include the following companies: Andean Chemicals Limited, Bioenergy S.A.,
Bionergy Zona Franca S.A.S., Black Gold Re Ltd, Cenit Transporte y Logística de Hidrocarburos
S.A.S., Ecopetrol America, Inc., Ecopetrol del Perú S.A., Ecopetrol Oleo e Gas do Brasil Ltda,
Ecopetrol Germany GmbH, Ecopetrol Capital AG, Ecopetrol Global Energy S.L.U., Ecopetrol Global
Capital S.L.U., Equion Energía Limited, Hocol Petroleum Limited, Hocol S.A., Oleoducto de los
Llanos Orientales S.A., Propilco S.A., Compounding and Masterbatching Industry Ltda - COMAI,
Oleoducto Bicentenario de Colombia S.A.S., Oleoducto Central S.A. - OCENSA, Oleoducto de
Colombia S.A. - ODC, Refinería de Cartagena S.A., Santiago Oil Company, Colombia Pipelines
Limited, SENTO S.A.S. y PROYECTOS ODC N1 S.A.S.
Ecopetrol S.A. is one of the 50 largest oil companies in the world and one of the four main oil
companies in Latin America. Ecopetrol is majority-owned by the Republic of Colombia (88.5%) and
its shares are traded on the Colombian Stock Exchange (Bolsa de Valores de Colombia S.A.) under
the ticker symbol ECOPETROL, and on the New York Stock Exchange under the ticker symbol EC.
Ecopetrol has three business segments: 1) exploration and production, 2) transport and logistics
and 3) refining, petrochemicals and biofuels.
Forward-looking Statements
This release may contain forward-looking statements related to the prospects of the business,
estimates of operating and financial results, and growth forecasts for Ecopetrol. These are
projections, and, as such, are based solely on the expectations of management with regard to the
future of the company and its continuous access to capital to finance the company’s business plan.
Such forward-looking statements depend essentially on changes in market conditions, government
regulations, competitive pressures, and the performance of the Colombian economy and industry,
among other factors. Therefore, they are subject to change without prior notice.
Contacts:
Director of Corporate Finance and Investor Relations Maria Catalina Escobar Telephone: +571-234-5190 E-mail: [email protected]
Media Relations (Colombia) Jorge Mauricio Tellez
Telephone: + 571-234-4329 E-mail: [email protected]

35
MATERIAL INFORMATION
V. Ecopetrol´s Group Exhibits Table 1 – Local Purchases and Imports
A B C D E F G
Ecopetrol S.A. (consolidated)
1) Local Purchases (mboed) 4Q 2015 4Q 2014 ∆ (%) 2015 2014 ∆ (%)
Crude* 157.9 182.4 (13.4%) 167.8 181.8 (7.7%)
Gas** 1.8 2.2 (22.0%) 1.8 2.3 (20.3%)
Refined Products 11.4 12.4 (7.4%) 5.8 5.6 4.1%
Diluent*** 3.2 4.5 (27.6%) 2.2 6.1 (63.4%)
Total 174.3 201.5 (13.5%) 177.6 195.7 (9.2%)
2) Imports (mbded) 4Q 2015 4Q 2014 ∆ (%) 2015 2014 ∆ (%)
Crude 14.4 0.0 4.9 0.0
Refined Products 159.0 117.7 35.0% 137.0 108.1 26.7%
Diluent 75.8 60.1 26.2% 64.8 58.5 10.8%
Total 249.1 177.8 40.1% 206.7 166.6 24.0%
* Includes purchases of royalties and purchases from third parties.
** Does not include purchses of royalties due to a regulatory change.
*** Includes products used as diluent and diluent own production.
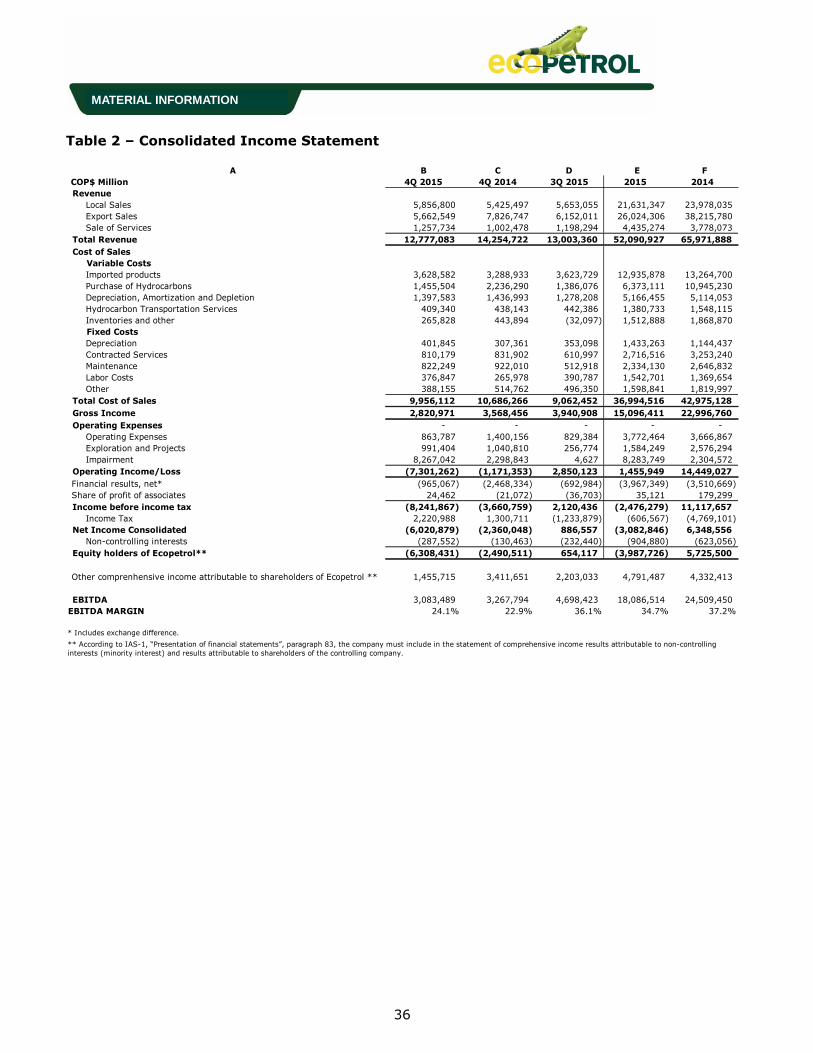
36
MATERIAL INFORMATION
Table 2 – Consolidated Income Statement
A B C D E F
4Q 2015 4Q 2014 3Q 2015 2015 2014
Revenue
Local Sales 5,856,800 5,425,497 5,653,055 21,631,347 23,978,035
Export Sales 5,662,549 7,826,747 6,152,011 26,024,306 38,215,780
Sale of Services 1,257,734 1,002,478 1,198,294 4,435,274 3,778,073
Total Revenue 12,777,083 14,254,722 13,003,360 52,090,927 65,971,888
Cost of Sales
Variable Costs
Imported products 3,628,582 3,288,933 3,623,729 12,935,878 13,264,700
Purchase of Hydrocarbons 1,455,504 2,236,290 1,386,076 6,373,111 10,945,230
Depreciation, Amortization and Depletion 1,397,583 1,436,993 1,278,208 5,166,455 5,114,053
Hydrocarbon Transportation Services 409,340 438,143 442,386 1,380,733 1,548,115
Inventories and other 265,828 443,894 (32,097) 1,512,888 1,868,870
Fixed Costs
Depreciation 401,845 307,361 353,098 1,433,263 1,144,437
Contracted Services 810,179 831,902 610,997 2,716,516 3,253,240
Maintenance 822,249 922,010 512,918 2,334,130 2,646,832
Labor Costs 376,847 265,978 390,787 1,542,701 1,369,654
Other 388,155 514,762 496,350 1,598,841 1,819,997
Total Cost of Sales 9,956,112 10,686,266 9,062,452 36,994,516 42,975,128
Gross Income 2,820,971 3,568,456 3,940,908 15,096,411 22,996,760
Operating Expenses - - - - -
Operating Expenses 863,787 1,400,156 829,384 3,772,464 3,666,867
Exploration and Projects 991,404 1,040,810 256,774 1,584,249 2,576,294
Impairment 8,267,042 2,298,843 4,627 8,283,749 2,304,572
Operating Income/Loss (7,301,262) (1,171,353) 2,850,123 1,455,949 14,449,027
Financial results, net* (965,067) (2,468,334) (692,984) (3,967,349) (3,510,669)
Share of profit of associates 24,462 (21,072) (36,703) 35,121 179,299
Income before income tax (8,241,867) (3,660,759) 2,120,436 (2,476,279) 11,117,657
Income Tax 2,220,988 1,300,711 (1,233,879) (606,567) (4,769,101)
Net Income Consolidated (6,020,879) (2,360,048) 886,557 (3,082,846) 6,348,556
Non-controlling interests (287,552) (130,463) (232,440) (904,880) (623,056)
Equity holders of Ecopetrol** (6,308,431) (2,490,511) 654,117 (3,987,726) 5,725,500
Other comprenhensive income attributable to shareholders of Ecopetrol ** 1,455,715 3,411,651 2,203,033 4,791,487 4,332,413
EBITDA 3,083,489 3,267,794 4,698,423 18,086,514 24,509,450
EBITDA MARGIN 24.1% 22.9% 36.1% 34.7% 37.2%
** According to IAS-1, “Presentation of financial statements”, paragraph 83, the company must include in the statement of comprehensive income results attributable to non-controlling
interests (minority interest) and results attributable to shareholders of the controlling company.
* Includes exchange difference.
COP$ Million
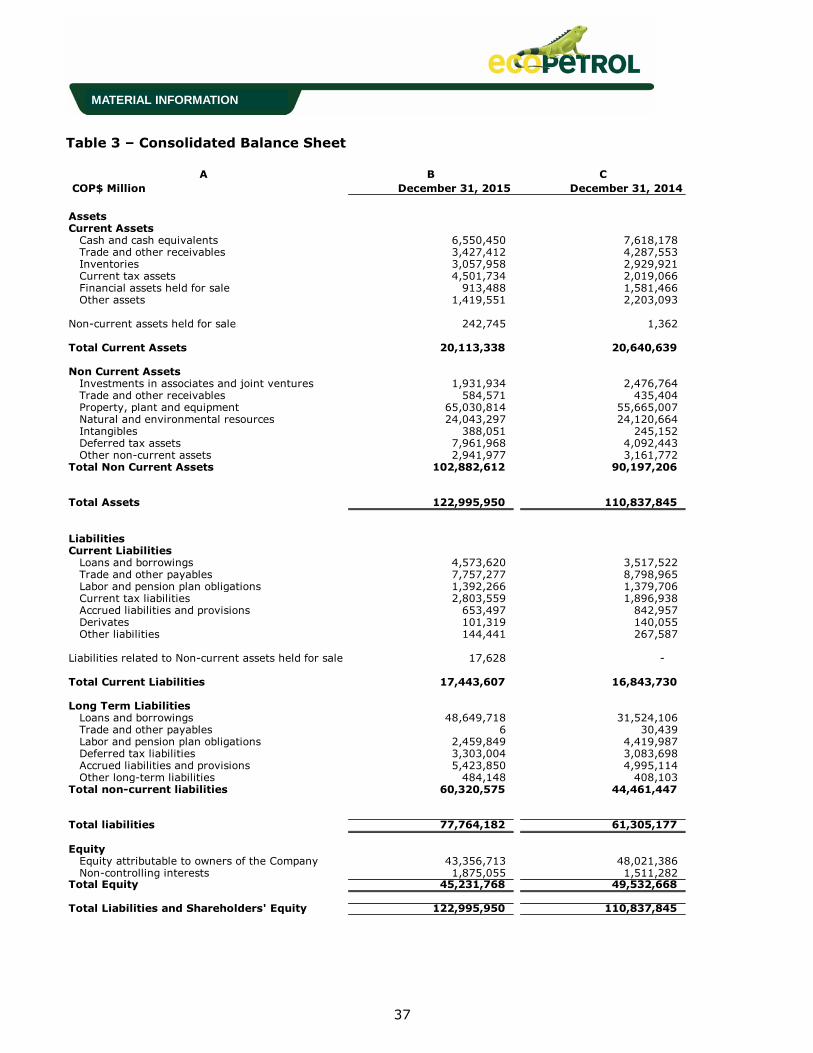
37
MATERIAL INFORMATION
Table 3 – Consolidated Balance Sheet
A B C
December 31, 2015 December 31, 2014
AssetsCurrent Assets Cash and cash equivalents 6,550,450 7,618,178 Trade and other receivables 3,427,412 4,287,553 Inventories 3,057,958 2,929,921 Current tax assets 4,501,734 2,019,066 Financial assets held for sale 913,488 1,581,466 Other assets 1,419,551 2,203,093
Non-current assets held for sale 242,745 1,362
Total Current Assets 20,113,338 20,640,639
Non Current Assets Investments in associates and joint ventures 1,931,934 2,476,764 Trade and other receivables 584,571 435,404 Property, plant and equipment 65,030,814 55,665,007 Natural and environmental resources 24,043,297 24,120,664 Intangibles 388,051 245,152 Deferred tax assets 7,961,968 4,092,443 Other non-current assets 2,941,977 3,161,772 Total Non Current Assets 102,882,612 90,197,206
Total Assets 122,995,950 110,837,845
LiabilitiesCurrent Liabilities Loans and borrowings 4,573,620 3,517,522 Trade and other payables 7,757,277 8,798,965 Labor and pension plan obligations 1,392,266 1,379,706 Current tax liabilities 2,803,559 1,896,938 Accrued liabilities and provisions 653,497 842,957 Derivates 101,319 140,055 Other liabilities 144,441 267,587
Liabilities related to Non-current assets held for sale 17,628 -
Total Current Liabilities 17,443,607 16,843,730
Long Term Liabilities Loans and borrowings 48,649,718 31,524,106 Trade and other payables 6 30,439 Labor and pension plan obligations 2,459,849 4,419,987 Deferred tax liabilities 3,303,004 3,083,698 Accrued liabilities and provisions 5,423,850 4,995,114 Other long-term liabilities 484,148 408,103 Total non-current liabilities 60,320,575 44,461,447 Total Long Term Liabilities
Total liabilities 77,764,182 61,305,177 Total LiabilitiesEquity Equity attributable to owners of the Company 43,356,713 48,021,386 Non-controlling interests 1,875,055 1,511,282 Total Equity 45,231,768 49,532,668
Total Liabilities and Shareholders' Equity 122,995,950 110,837,845
COP$ Million
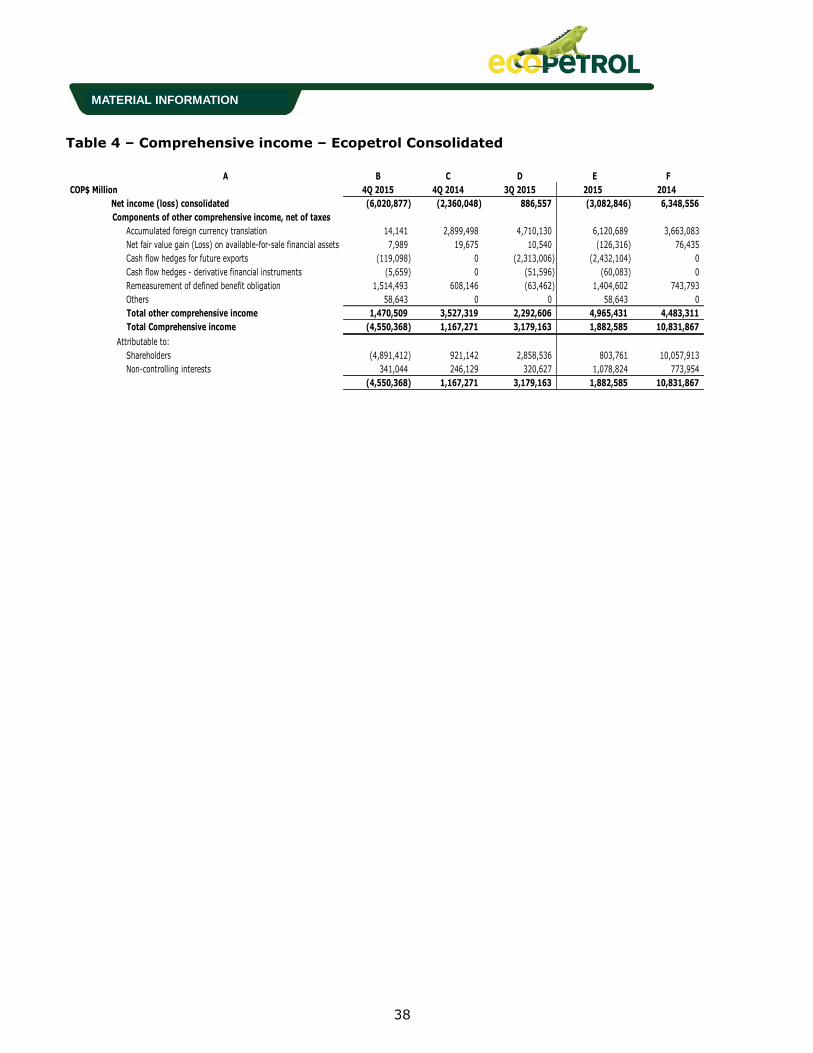
38
MATERIAL INFORMATION
Table 4 – Comprehensive income – Ecopetrol Consolidated
A B C D E F
4Q 2015 4Q 2014 3Q 2015 2015 2014
Net income (loss) consolidated (6,020,877) (2,360,048) 886,557 (3,082,846) 6,348,556
Components of other comprehensive income, net of taxes
Accumulated foreign currency translation 14,141 2,899,498 4,710,130 6,120,689 3,663,083
Net fair value gain (Loss) on available-for-sale financial assets 7,989 19,675 10,540 (126,316) 76,435
Cash flow hedges for future exports (119,098) 0 (2,313,006) (2,432,104) 0
Cash flow hedges - derivative financial instruments (5,659) 0 (51,596) (60,083) 0
Remeasurement of defined benefit obligation 1,514,493 608,146 (63,462) 1,404,602 743,793
Others 58,643 0 0 58,643 0
Total other comprehensive income 1,470,509 3,527,319 2,292,606 4,965,431 4,483,311
Total Comprehensive income (4,550,368) 1,167,271 3,179,163 1,882,585 10,831,867
Attributable to:
Shareholders (4,891,412) 921,142 2,858,536 803,761 10,057,913
Non-controlling interests 341,044 246,129 320,627 1,078,824 773,954
(4,550,368) 1,167,271 3,179,163 1,882,585 10,831,867
COP$ Million
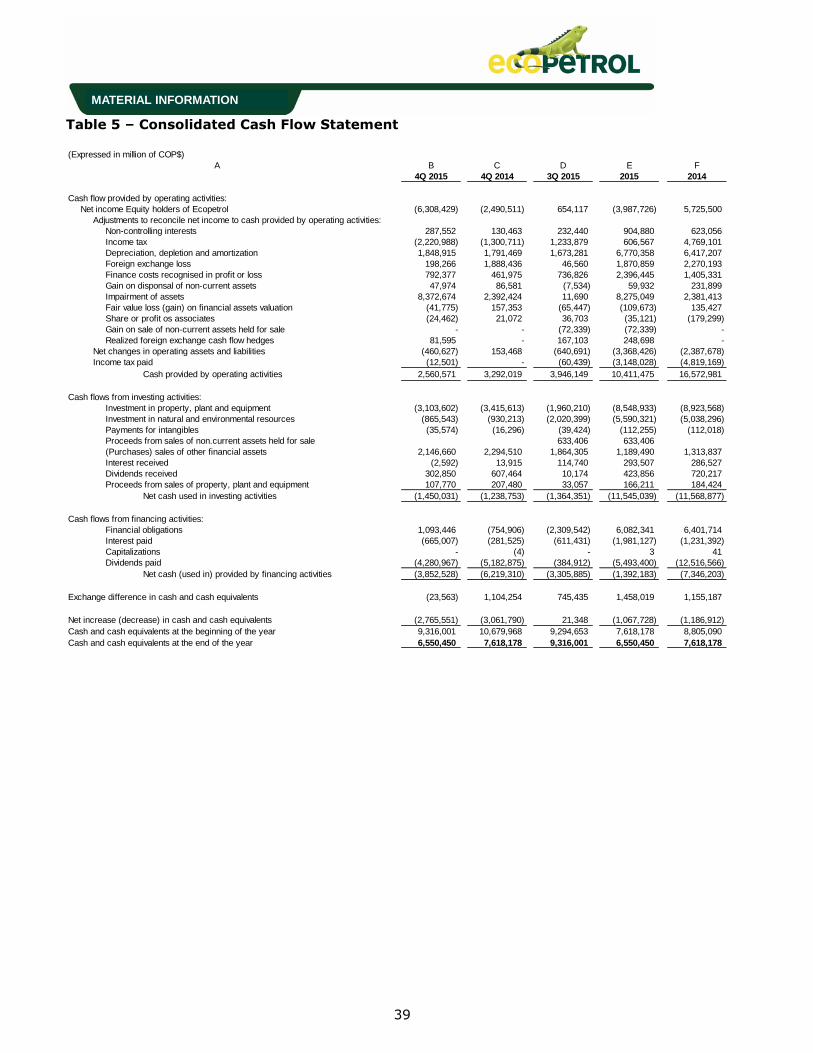
39
MATERIAL INFORMATION
Table 5 – Consolidated Cash Flow Statement
(Expressed in million of COP$)
B C D E F
4Q 2015 4Q 2014 3Q 2015 2015 2014
Cash flow provided by operating activities:
Net income Equity holders of Ecopetrol (6,308,429) (2,490,511) 654,117 (3,987,726) 5,725,500
Adjustments to reconcile net income to cash provided by operating activities:
Non-controlling interests 287,552 130,463 232,440 904,880 623,056
Income tax (2,220,988) (1,300,711) 1,233,879 606,567 4,769,101
Depreciation, depletion and amortization 1,848,915 1,791,469 1,673,281 6,770,358 6,417,207
Foreign exchange loss 198,266 1,888,436 46,560 1,870,859 2,270,193
Finance costs recognised in profit or loss 792,377 461,975 736,826 2,396,445 1,405,331
Gain on disponsal of non-current assets 47,974 86,581 (7,534) 59,932 231,899
Impairment of assets 8,372,674 2,392,424 11,690 8,275,049 2,381,413
Fair value loss (gain) on financial assets valuation (41,775) 157,353 (65,447) (109,673) 135,427
Share or profit os associates (24,462) 21,072 36,703 (35,121) (179,299)
Gain on sale of non-current assets held for sale - - (72,339) (72,339) -
Realized foreign exchange cash flow hedges 81,595 - 167,103 248,698 -
Net changes in operating assets and liabilities (460,627) 153,468 (640,691) (3,368,426) (2,387,678)
Income tax paid (12,501) - (60,439) (3,148,028) (4,819,169)
Cash provided by operating activities 2,560,571 3,292,019 3,946,149 10,411,475 16,572,981
Cash flows from investing activities:
Investment in property, plant and equipment (3,103,602) (3,415,613) (1,960,210) (8,548,933) (8,923,568)
Investment in natural and environmental resources (865,543) (930,213) (2,020,399) (5,590,321) (5,038,296)
Payments for intangibles (35,574) (16,296) (39,424) (112,255) (112,018)
Proceeds from sales of non.current assets held for sale 633,406 633,406
(Purchases) sales of other financial assets 2,146,660 2,294,510 1,864,305 1,189,490 1,313,837
Interest received (2,592) 13,915 114,740 293,507 286,527
Dividends received 302,850 607,464 10,174 423,856 720,217
Proceeds from sales of property, plant and equipment 107,770 207,480 33,057 166,211 184,424
Net cash used in investing activities (1,450,031) (1,238,753) (1,364,351) (11,545,039) (11,568,877)
Cash flows from financing activities:
Financial obligations 1,093,446 (754,906) (2,309,542) 6,082,341 6,401,714
Interest paid (665,007) (281,525) (611,431) (1,981,127) (1,231,392)
Capitalizations - (4) - 3 41
Dividends paid (4,280,967) (5,182,875) (384,912) (5,493,400) (12,516,566)
Net cash (used in) provided by financing activities (3,852,528) (6,219,310) (3,305,885) (1,392,183) (7,346,203)
Exchange difference in cash and cash equivalents (23,563) 1,104,254 745,435 1,458,019 1,155,187
Net increase (decrease) in cash and cash equivalents (2,765,551) (3,061,790) 21,348 (1,067,728) (1,186,912)
Cash and cash equivalents at the beginning of the year 9,316,001 10,679,968 9,294,653 7,618,178 8,805,090
Cash and cash equivalents at the end of the year 6,550,450 7,618,178 9,316,001 6,550,450 7,618,178
A
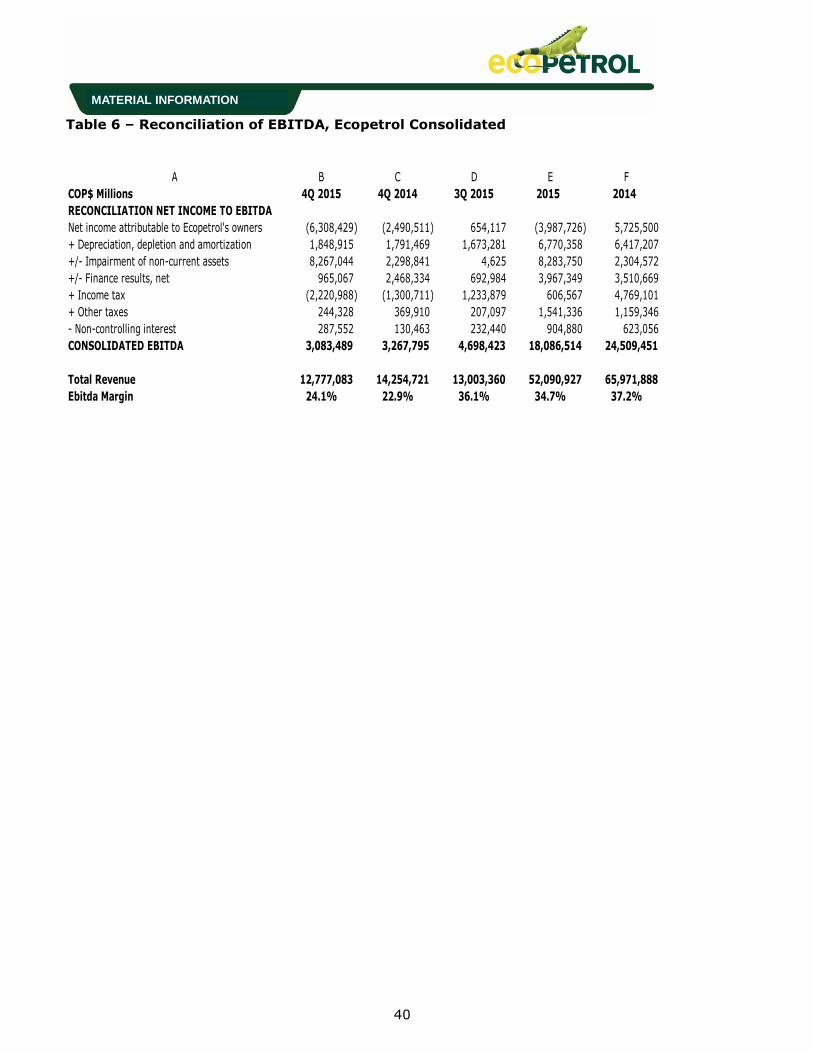
40
MATERIAL INFORMATION
Table 6 – Reconciliation of EBITDA, Ecopetrol Consolidated
A B C D E F
COP$ Millions 4Q 2015 4Q 2014 3Q 2015 2015 2014
RECONCILIATION NET INCOME TO EBITDA
Net income attributable to Ecopetrol's owners (6,308,429) (2,490,511) 654,117 (3,987,726) 5,725,500
+ Depreciation, depletion and amortization 1,848,915 1,791,469 1,673,281 6,770,358 6,417,207
+/- Impairment of non-current assets 8,267,044 2,298,841 4,625 8,283,750 2,304,572
+/- Finance results, net 965,067 2,468,334 692,984 3,967,349 3,510,669
+ Income tax (2,220,988) (1,300,711) 1,233,879 606,567 4,769,101
+ Other taxes 244,328 369,910 207,097 1,541,336 1,159,346
- Non-controlling interest 287,552 130,463 232,440 904,880 623,056
CONSOLIDATED EBITDA 3,083,489 3,267,795 4,698,423 18,086,514 24,509,451
Total Revenue 12,777,083 14,254,721 13,003,360 52,090,927 65,971,888
Ebitda Margin 24.1% 22.9% 36.1% 34.7% 37.2%
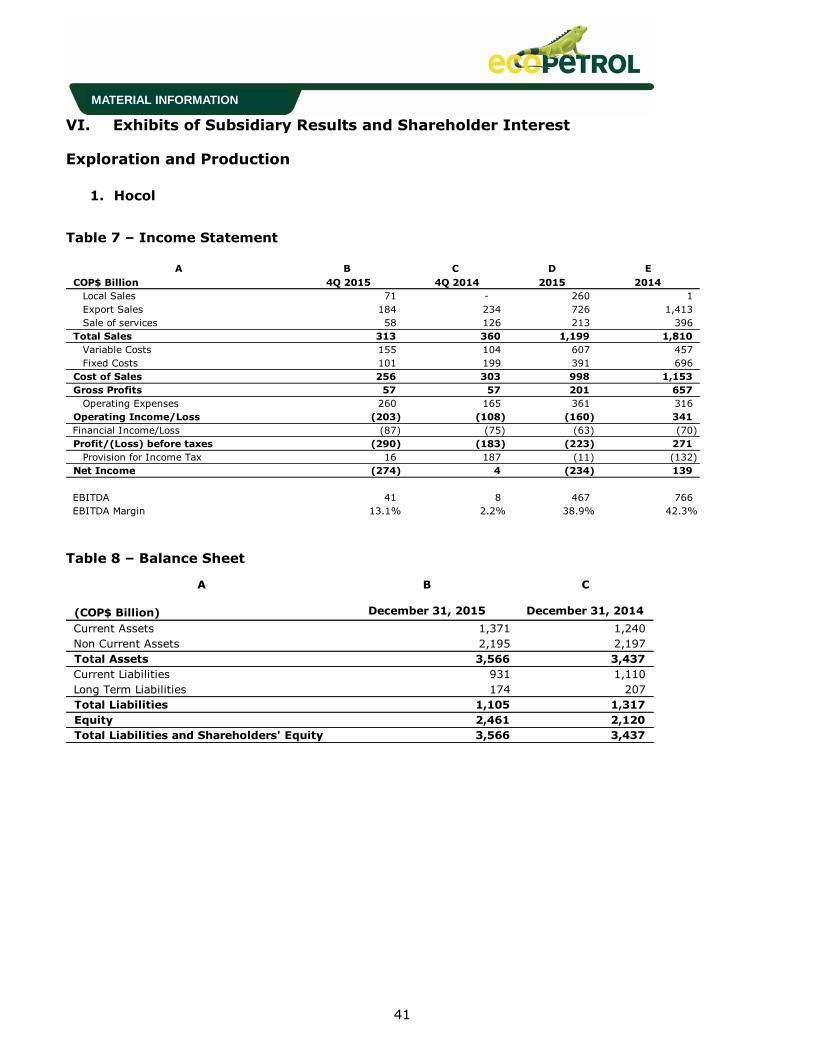
41
MATERIAL INFORMATION
VI. Exhibits of Subsidiary Results and Shareholder Interest
Exploration and Production
1. Hocol
Table 7 – Income Statement
Table 8 – Balance Sheet
A B C D E
COP$ Billion 4Q 2015 4Q 2014 2015 2014
Local Sales 71 - 260 1
Export Sales 184 234 726 1,413
Sale of services 58 126 213 396
Total Sales 313 360 1,199 1,810
Variable Costs 155 104 607 457
Fixed Costs 101 199 391 696
Cost of Sales 256 303 998 1,153
Gross Profits 57 57 201 657
Operating Expenses 260 165 361 316
Operating Income/Loss (203) (108) (160) 341
Financial Income/Loss (87) (75) (63) (70)
Profit/(Loss) before taxes (290) (183) (223) 271
Provision for Income Tax 16 187 (11) (132)
Net Income (274) 4 (234) 139
EBITDA 41 8 467 766
EBITDA Margin 13.1% 2.2% 38.9% 42.3%
A B C
(COP$ Billion) December 31, 2015 December 31, 2014
Current Assets 1,371 1,240
Non Current Assets 2,195 2,197
Total Assets 3,566 3,437
Current Liabilities 931 1,110
Long Term Liabilities 174 207
Total Liabilities 1,105 1,317
Equity 2,461 2,120
Total Liabilities and Shareholders' Equity 3,566 3,437

42
MATERIAL INFORMATION
2. Savia Peru
Table 9 – Income Statement
Table 10 – Balance Sheet
A B C D E
US$ million 4Q 2015 4Q 2014 2015 2014
Local Sales 30.3 65.1 161 355
Total Sales 30.3 65.1 161.4 355.0
Variable Costs 8.1 37.3 80.8 111.3
Fixed Costs 28.2 28.6 87.7 108.5
Cost of Sales 36.3 65.9 168.5 219.8
Gross Profits (6.0) (0.8) (7.1) 135.2
Operating Expenses (68.5) (45.4) (104.2) (117.7)
Operating Income/Loss (74.5) (46.2) (111.3) 17.5
Financial Income/Loss (0.5) (1.8) (2.7) (1.5)
Profit/(Loss) before taxes (75.0) (48.0) (114.0) 16.0
Provision for Income Tax 22.2 19.4 31.3 (9.0)
Net Income (52.8) (28.6) (82.7) 7.0
EBITDA (10.9) (8.9) 27.7 132.4
EBITDA Margin -36.0% -13.7% 17.2% 37.3%
A B C
(COP$ Billion) December 31, 2015 December 31, 2014
Current Assets 98.6 146.7
Non Current Assets 663.6 791.4
Total Assets 762.2 938.1
Current Liabilities 151.6 213.9
Long Term Liabilities 130.2 159.1
Total Liabilities 281.8 373.0
Equity 480.4 565.1
Total Liabilities and Shareholders' Equity 762.2 938.1

43
MATERIAL INFORMATION
3. Equion
Table 11 – Income Statement
Table 12 – Balance Sheet
A B C D E
COP$ Billion 4Q 2015 4Q 2014 2015 2014
Local Sales 74 68 354 291
Export Sales 222 194 865 971
Total Sales 296 262 1,219 1,262
Variable Costs 217 112 763 401
Fixed Costs 56 67 196 203
Cost of Sales 273 179 959 604
Gross Profits 23 83 260 658
Operating Expenses (57) (25) (74) (17)
Operating Income/Loss (34) 58 186 641
Financial Income/Loss 2 16 38 35
Profit/(Loss) before taxes (32) 74 224 676
Provision for Income Tax 192 (101) (49) (393)
Net Income 160 (27) 175 283
EBITDA 196 175 891 980
EBITDA Margin 66% 67% 73% 78%
A B C
(COP$ Billion) December 31, 2015 December 31, 2014
Current Assets 854 1,053
Non Current Assets 2,261 2,029
Total Assets 3,115 3,082
Current Liabilities 549 816
Long Term Liabilities 110 92
Total Liabilities 659 908
Equity 2,456 2,174
Total Liabilities and Shareholders' Equity 3,115 3,082
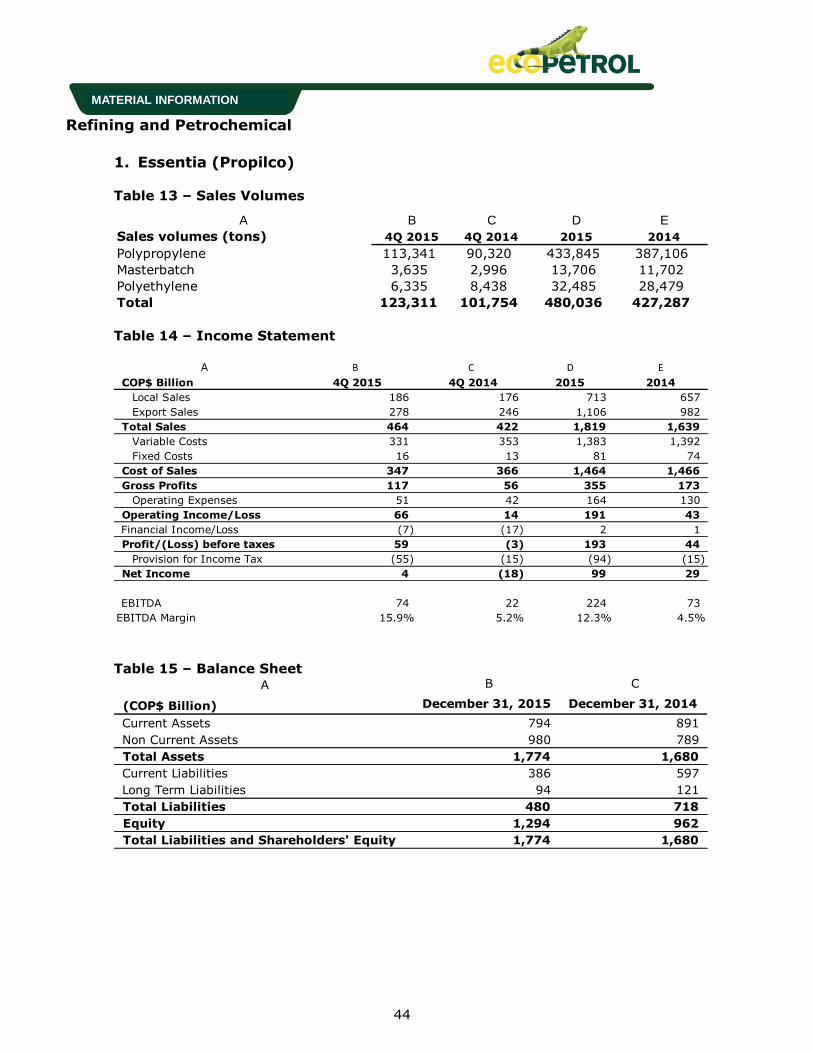
44
MATERIAL INFORMATION
Refining and Petrochemical
1. Essentia (Propilco)
Table 13 – Sales Volumes
Table 14 – Income Statement
Table 15 – Balance Sheet
A B C D E
Sales volumes (tons) 4Q 2015 4Q 2014 2015 2014
Polypropylene 113,341 90,320 433,845 387,106
Masterbatch 3,635 2,996 13,706 11,702
Polyethylene 6,335 8,438 32,485 28,479
Total 123,311 101,754 480,036 427,287
A B C D E
COP$ Billion 4Q 2015 4Q 2014 2015 2014
Local Sales 186 176 713 657
Export Sales 278 246 1,106 982
Total Sales 464 422 1,819 1,639
Variable Costs 331 353 1,383 1,392
Fixed Costs 16 13 81 74
Cost of Sales 347 366 1,464 1,466
Gross Profits 117 56 355 173
Operating Expenses 51 42 164 130
Operating Income/Loss 66 14 191 43
Financial Income/Loss (7) (17) 2 1
Profit/(Loss) before taxes 59 (3) 193 44
Provision for Income Tax (55) (15) (94) (15)
Net Income 4 (18) 99 29
EBITDA 74 22 224 73
EBITDA Margin 15.9% 5.2% 12.3% 4.5%
A B C
(COP$ Billion) December 31, 2015 December 31, 2014
Current Assets 794 891
Non Current Assets 980 789
Total Assets 1,774 1,680
Current Liabilities 386 597
Long Term Liabilities 94 121
Total Liabilities 480 718
Equity 1,294 962
Total Liabilities and Shareholders' Equity 1,774 1,680
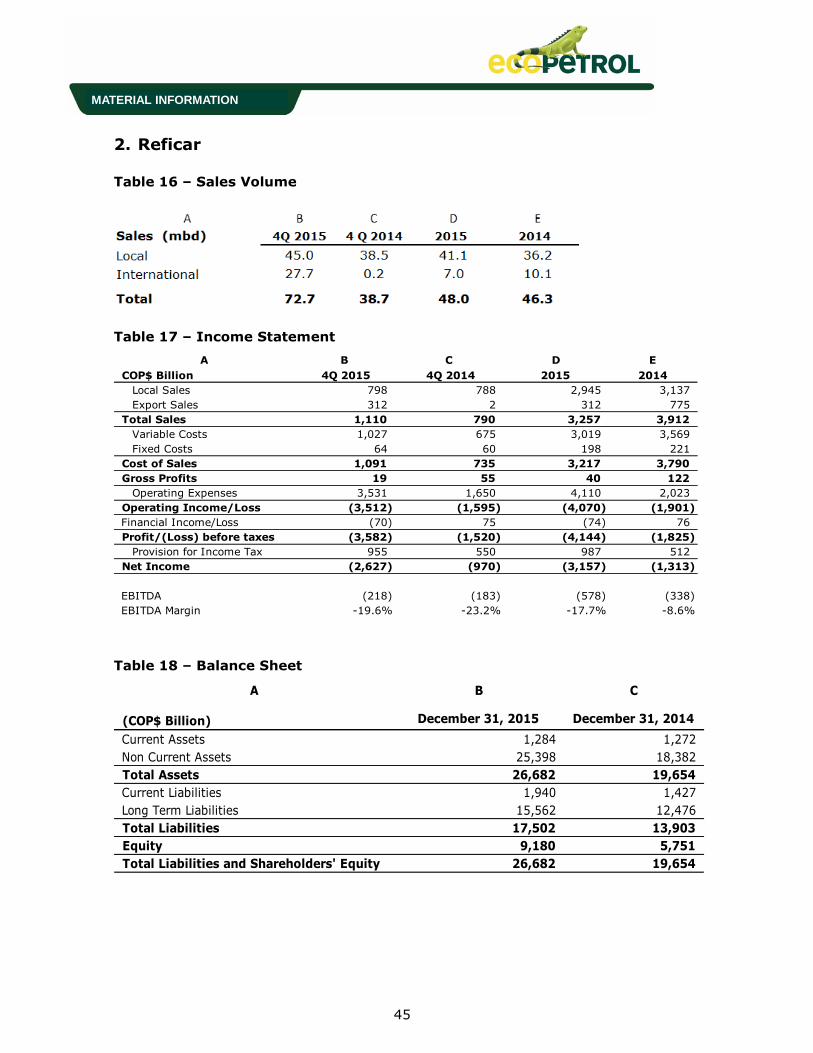
45
MATERIAL INFORMATION
2. Reficar
Table 16 – Sales Volume
Table 17 – Income Statement
Table 18 – Balance Sheet
A B C D E
COP$ Billion 4Q 2015 4Q 2014 2015 2014
Local Sales 798 788 2,945 3,137
Export Sales 312 2 312 775
Total Sales 1,110 790 3,257 3,912
Variable Costs 1,027 675 3,019 3,569
Fixed Costs 64 60 198 221
Cost of Sales 1,091 735 3,217 3,790
Gross Profits 19 55 40 122
Operating Expenses 3,531 1,650 4,110 2,023
Operating Income/Loss (3,512) (1,595) (4,070) (1,901)
Financial Income/Loss (70) 75 (74) 76
Profit/(Loss) before taxes (3,582) (1,520) (4,144) (1,825)
Provision for Income Tax 955 550 987 512
Net Income (2,627) (970) (3,157) (1,313)
EBITDA (218) (183) (578) (338)
EBITDA Margin -19.6% -23.2% -17.7% -8.6%
A B C
(COP$ Billion) December 31, 2015 December 31, 2014
Current Assets 1,284 1,272
Non Current Assets 25,398 18,382
Total Assets 26,682 19,654
Current Liabilities 1,940 1,427
Long Term Liabilities 15,562 12,476
Total Liabilities 17,502 13,903
Equity 9,180 5,751
Total Liabilities and Shareholders' Equity 26,682 19,654

46
MATERIAL INFORMATION
Transportation
1. Cenit
Table 19 – Income Statement
Table 20 – Balance Sheet
A B C D E
COP$ Billion 4Q 2015 4Q 2014 2015 2014
Local Sales 3 5 12 20
Sale of services 1,047 823 3,835 3,036
Total Sales 1,050 828 3,847 3,056
Variable Costs 40 28 143 136
Fixed Costs 693 800 2,087 2,225
Cost of Sales 733 828 2,230 2,361
Gross Profits 317 - 1,617 695
Operating Expenses 140 171 350 300
Operating Income/Loss 177 (171) 1,267 395
Financial Income/Loss 505 500 2,173 1,524
Profit/(Loss) before taxes 682 329 3,440 1,919
Provision for Income Tax (129) (51) (734) (241)
Net Income 553 278 2,706 1,678
EBITDA 364 (68) 1,872 749
EBITDA Margin 34.7% -8.2% 48.7% 24.5%
A B C
(COP$ Billion) December 31, 2015 December 31, 2014
Current Assets 1,392 2,649
Non Current Assets 16,205 15,541
Total Assets 17,597 18,190
Current Liabilities 1,516 1,110
Long Term Liabilities 814 1,240
Total Liabilities 2,330 2,350
Equity 15,267 15,840
Total Liabilities and Shareholders' Equity 17,597 18,190

47
MATERIAL INFORMATION
Biofuels
1. Ecodiesel
Table 21 – Sales Volume
Table 22 – Income Statement
Table 23 – Balance Sheet
A B C D E
Sales volume (mboed) 4Q 2014 4Q 2013 2015 2014
Biodiesel 2.4 2.0 2.4 2.2
Glycerin 0.2 0.2 0.2 0.2
Total 2.6 2.2 2.6 2.4
A B C D E
COP$ Billion 4Q 2015 4Q 2014 2015 2014
Local Sales 101.88 71.25 380.37 302.39
Total Sales 101.88 71.25 380.37 302.39
Variable Costs 89.38 62.41 329.51 263.24
Cost of Sales 89.38 62.41 329.51 263.24
Gross Profits 12.50 8.84 50.86 39.15
Operating Expenses 2.63 2.97 12.45 10.77
Operating Income/Loss 9.87 5.87 38.41 28.38
Financial Income/Loss (2.82) (3.85) (5.15) (5.74)
Profit/(Loss) before taxes 7.05 2.02 33.26 22.64
Provision for Income Tax (1.91) (0.18) (6.20) (3.74)
Net Income 5.14 1.84 27.06 18.90
EBITDA 11.74 7.47 44.97 34.59
EBITDA Margin 11.5% 10.5% 11.8% 11.4%
A B C
(COP$ Billion) December 31, 2015 December 31, 2014
Current Assets 73.25 62.19
Non Current Assets 68.66 74.18
Total Assets 141.91 136.37
Current Liabilities 57.09 44.79
Long Term Liabilities 10.50 31.79
Total Liabilities 67.59 76.58
Equity 74.32 59.79
Total Liabilities and Shareholders' Equity 141.91 136.37
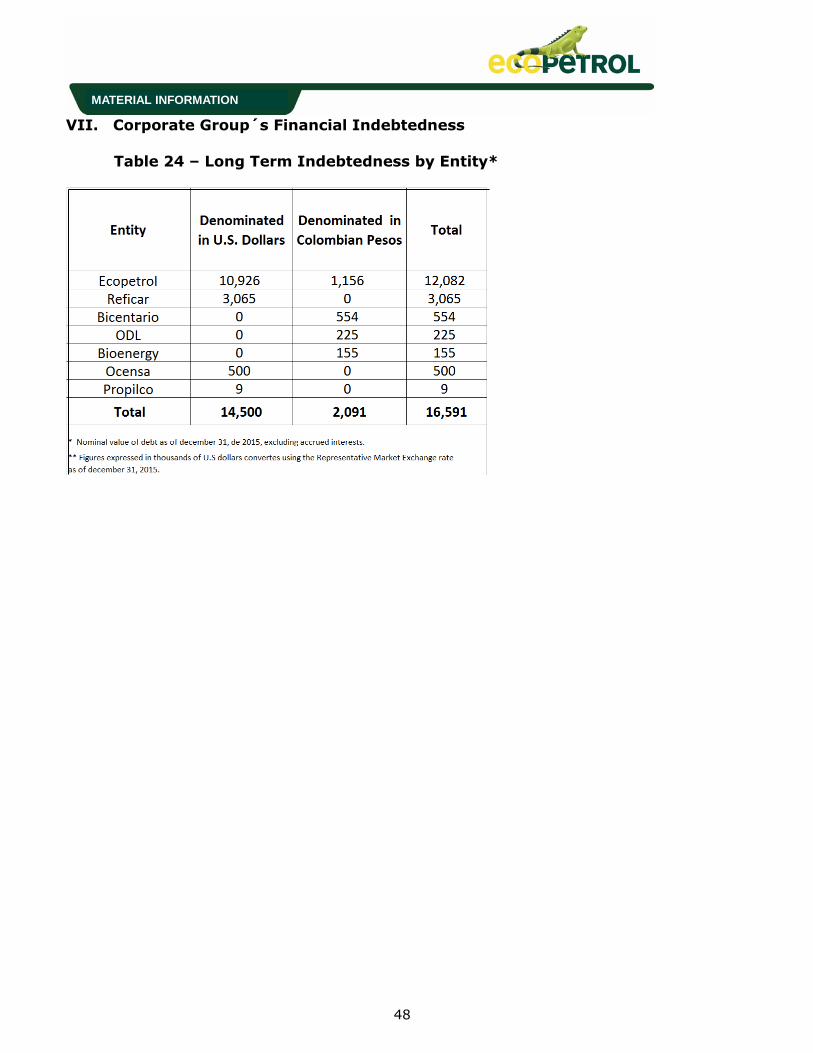
48
MATERIAL INFORMATION
VII. Corporate Group´s Financial Indebtedness
Table 24 – Long Term Indebtedness by Entity*