econs summary
TRANSCRIPT

1
No.
Title Page No.
1 Chapter 1: Scarcity, Choice and Opportunity Cost 2-3
2 Explain two ways in which an economy might move from a point within its PPC to a point on it.
4
3 Discuss the most effective economic policies to move the PPC outwards.
5
4 What is meant by the basic economic problem of scarcity?
6
5 Discuss whether economic growth solves the problem of scarcity.
7
6 Chapter 2: Resource Allocation in Competitive Markets I
8-9
7 A manufacturer wishes to sell more of his product. How may he try to achieve his aim?
10
8 Chapter 3: Resource Allocation in Competitive Markets II
11-13
9 Explain price elasticity of demand and income elasticity of demand.
14
10 A government is proposing to increase the tax on petrol. Examine the relevance of price elasticity of demand and income elasticity of demand for this proposal.
14
11 Assess the relevance of elasticity concepts in explaining the effects of the worldwide recession caused by the 911 terrorist attacks on the airline industry.
15-16
12 Chapter 4: Microeconomic Problems: Market Failure 17-18
13 Policies on Pollution and Evaluation Summary 19-21
14 Policies on Pollution and Congestion caused by Cars Summary
22-23
15 Chapter 5: Government Intervention in the Market I 24
J1 Topics

2
16 Chapter 6: Firms and How They Operate I 25-30
17 Discuss whether rising costs limit the size of firms over time.
31
18 Banking Merger in Singapore Analysis 31
19 Chapter 7: Firms and How They Operate II 32-38
20 Discuss the view that the profit motive will always lead to a few large firms dominating the market for each and every type of product.
39
21 Explain what is meant by productive and allocative efficiency.
40-41
22 ‘A firm should be encouraged to maximize profits because this makes it efficient.’ Discuss whether this argument is true for a firm operating in an imperfect market.
42
23 Distinguish between monopolistic competition and oligopoly.
43
24 Explain why oligopoly is a common market structure in many economies.
44
25 Explain why governments throughout the world have been involved in the supply of services such as electricity.
45
26 Chapter 8: Government Intervention in the Market II 46-48

3
Chapter 1: Scarcity, Choice and Opportunity Cost 1. Introduction Study of the use of scarce resources to satisfy unlimited human
wants Wants: things people would consume if they had unlimited
income Resources: inputs to produce goods and services Scarcity exists due to unlimited wants + worn out goods +
newer goals Positive (can be checked by facts) vs. normative (statement of
value) 2. Factors of Production Land: productive resources supplied by nature Labour: human effort directed to the production of goods and
services Supply: number of workers + average number of hours
each worker is prepared to offer Specialisation
Dexterity, greater use of machinery and more sophisticated production techniques
Monotony, loss of craftsmanship, increased risk of structural unemployment
Capital: man-made resource used in further production Involves postponing present consumption
Entrepreneurship: takes risk of being in business Information: data for the basis of knowledge-based economy 3. Opportunity Cost Real cost in terms of the next best alternative foregone Calculating opportunity cost requires time and information Opportunity cost may vary with circumstance

4
Economic rent: difference between what is earned and what could have been earned
Used in specialization and trade 4. Production Possibility Curve Maximum attainable combination of two goods and services
that can be produced in an economy, when all available resources are used fully and efficiently, at a given state of technology
Assumptions: fixed amount of resources, factors fully and efficiently employed, technology fixed, time period give, 2-product model
Fully: using all resources available Efficiently: do as many things you can with the resources used Scarcity: unattainable combinations outside PPC + society has
to choose among combinations of 2 goods Shift: quantity and quality of resources (think FOP) +
technology – skewed? Choice between instant gratification and improving economy in
the future

5
5. The Marginalist Principle Consume till MPB = MPC: cost of producing an additional unit
of good = benefit of consuming an additional unit of good For the price mechanism to work, information need not be
known with perfect accuracy by every individual acting in the marketplace: dependent on marginal buyers who keep suppliers on their toes
6. Efficiency Static efficiency: how much output can be produced now from
a given stock of resources at a given point in time Dynamic efficiency: changes in the amount of consumer choice
available in markets together with the quality of goods and services available
Productive efficiency: absence of waste in the production process = minimizing the opportunity costs for a given value of output
Allocative efficiency: society produces and consumes a combination of goods and services that maximizes its welfare
Wheat
Cloth 0
*Draw dotted line to show comparison between 2 countries with a common yardstick

6
Distributive efficiency: goods and services produced to those who want or need them

7
Explain two ways in which an economy might move from a point within its PPC to a point on it. [10m] Introduction Define PPC Body A. Increase employment of resources Lower wages to be more competitive – may be enticed to
produce more goods Fiscal policy: increase government spending eg. circle line –
multiplier effect Monetary policy: lower interest rate – firms borrow more,
increase investment B. Increase efficiency in use of resources Pay based on productivity: but only for jobs where output
can be measured (factory workers) Reallocate resources to more efficient uses Retraining
A
B
Good X
Good Y O
A: resources not fully utilized – underemployment and unemployment B: efficient use of resources – full employment
8
Discuss the most effective economic policies to move the PPC outwards. [15m] Introduction Outward shift: increase in productive capacity – sustain economic growth over long run Body A. Labour Increase birth rate but difficult to do so in developed
countries – female labour force participation + need lots of incentives
Education and training but takes long time and does not necessarily yield results
Foreign talent through tax incentives B. Capital MNCs – investment (machines) + learn their technological
knowledge Invest in r+d
C. Entrepreneurship Incentives and subsidies to start businesses
D. Land Reclamation
Conclusion Depends on which country Eg. For USA: encourage capital goods, less consumption goods. For China: entrepreneurship

9
What is meant by the basic economic problem of scarcity? [12m] Introduction Scarcity – scare resources, unlimited wants Body Scarcity – choice – opportunity cost 1) Individual: time; consumer; how to maximize use of limited resources – more labour / more machines 2) Firm: least-cost combination of resources in order to maximize profits 3) Government: choice between competing projects; cost-benefit analysis 4) Economy: problem of how to allocated scare resources efficiently best illustrated by the PPC (Brief) Implications: Trade as a solution to alleviate scarcity
E
Good X
Good Y O
6
4
5 6

10
Trade-off between consumer goods and capital goods What (how scarcity affects decision-making of an economy),
how much, for whom and what to produce (market system)
11
Discuss whether economic growth solves the problem of scarcity. [13m] Introduction Economic growth – increase in national income – generally get to consume more goods and services Body 1) Increase in quantity and quality of resources – increase in productive capacity Labour: due to reduction in unemployment and
underemployment Skills and educational level Land Capital stock: most effective way to alleviate problem of
scarcity – more capital economy produces in one period, more output capital can produce in the next to satisfy wants in society
2) Technological improvement – increase in productive capacity: better and new methods of producing goods R + d – technological breakthrough – new products – create
more wants 3) Increase in income – consumers able to satisfy wants But with greater affluence, people have more wants due to
advertising and promotions – luxury goods of the past may become necessities
4) Supply limited Demand accelerating – China / India economic growth Crude oil important as it is a source of fuel Eg. land in Singapore

12
But technological improvements allow society to make use of renewable resources as sources of energy
But more wants created 5) Equity in distribution Economic growth does not guarantee a reduction in income
gap Corruption, food shortages
13
Chapter 2: Resource Allocation in Competitive Markets I *Assumption: Many buyers and sellers such that no single buyer / seller can exert control over market price (price takers) 1. Demand Theory Demand: amount that consumers are willing and able to
purchase at each given price over a given period of time Demand curve slopes downwards
Income effect: effect of change in real income resulting from change in price of good
Substitution effect: effect of change in price on quantity demanded arising from consumer switching to, or from, alternating products
Determinants Price Taste: education, culture, age group, health scares Interrelated goods: substitute vs. complement Population: absolute change, change in composition Seasonal changes: climate, festival Expectations of the future: future changes in price /
income Real disposable income: changes in taxes / money income Redistribution of income
Consumer surplus: difference between maximum amount consumers willing to pay for a given quantity of good and what they actually pay
2. Supply Theory Supply: quantity of a good or service producers are willing and
able to offer for sale at each given price over a given period of time
Determinants Price

14
COP: change in price of factor inputs Other prices: joint / competitive supply Innovation: lower production costs Natural factors: climate, unexpected events Government policies: indirect taxes, subsidies Number of sellers
Producer surplus: difference between amount received by producers and minimum amount they are willing and able to accept for the supply of a commodity
3. Market Equilibrium Buyers and sellers satisfied with current combination of price
and quantity bought or sold, and are under no incentive to change their present economic actions
15
Adjustment to equilibrium Below equilibrium
Shortage – consumers compete for goods, bidding up prices – price increases, quantity supplied increases – shortage eliminated – market settles at equilibrium
Above equilibrium Surplus - producers reduce prices to get rid of
stocks – increase sales and decrease production – price falls, quantity demanded increases, surplus eliminated – market settles at equilibrium
Shifts in supply and demand: consider individual effects on price and quantity then sum up
Interrelated demand and surplus Joint / competitive / derived demand Joint / competitive supply
4. Case Study When asked to explain how a group of people intend to affect
a certain market, bring in limitations Elasticity of demand Responses of other firms / groups of people
Analyse theoretically first, then see how and why the data fits / does not fit the theory
Desirability: consider for whom: producer, consumer, society Effectiveness: limitations, long run vs. short run

16
A manufacturer wishes to sell more of his product. How may he try to achieve his aim? [12m] Introduction Sell more – only considering equilibrium quantity – increase demand / supply Effect: long run vs. short run Body 1) Increase demand: explain effect on quantity demanded Advertising and promotion: create product differentiation and brand loyalty Competitive market: other firms will do likewise as they
fear losing market share Huge funds need to be devoted – increase COP – reduce
profits If firm passes cost increase to consumers in terms of
higher prices – fall in quantity sold – assuming demand elastic – total revenue falls
But unable to increase price in competitive market – firms may engage in price wars
But in long run if campaign successful in altering people’s taste and preference – rise in quantity sold
Expanding number of markets: go regional / global Easier to penetrate markets where demand for product
more price elastic Increase supply – fall in price – more than
proportionate rise in quantity demanded Improve quality of product / increase product differentiation
through better sales service / improved packaging Effect of money spent for r+d on
Costs then price of product Market share in long run (increase)

17
Deliberate attempt to reduce price of good through discounts Price elasticity of demand How long discount can be sustained without eroding
profits 2) Increase supply: explain effect on quantity demanded Investment in r+d Lower COP, more efficient production methods, better
quality products Raising productivity through greater specialization and
better labour-capital combination Sourcing cheaper sources of raw materials Evaluation Reduces price – may conflict with profit maximization More effective strategy if selling product that is price
demand elastic – mass produce – reap EOS – lower prices – increase sales volume more than proportionately

18
Chapter 3: Resource Allocation in Competitive Markets II 1. Price Elasticity of Demand Measure of degree of responsiveness of quantity demanded of
good to a change in its price, ceteris paribus Coefficient: sensitivity of consumers to price changes Negative: inverse relationship between price and quantity
demanded Determinants
Availability of substitutes Necessities vs. luxuries Proportion of income Time period: longer – switch to substitutes – more price
elastic Usefulness
Government taxation policies: raise revenue, discourage consumption
Firms’ pricing policy Effectiveness of trade unions: can ask for higher wages if
demand for product is price inelastic Price stability: prices more volatile if demand more price
inelastic when supply shock
2. Income Elasticity of Demand Measure of degree of responsiveness of demand of good to
change in consumers’ income, ceteris paribus Coefficient
Negative: inferior good Positive: normal good
Less than one: necessities More than one: luxuries
Usefulness Production plans: boom vs. recession

19
Targetting different income groups: segment market 3. Cross Elasticity of Demand Measure of degree of responsiveness of demand of good to
change in price of another good, ceteris paribus Coefficient
Negative: complement Positive: substitute
Usefulness Effects on products’ demand when faced with change in
price of rival’s product Strong complements – can sell jointly

20
4. Price Elasticity of Supply Measure of degree of responsiveness of quantity supplied of
good to a change in its price, ceteris paribus Positive: direct relationship between price and quantity
supplied Determinants
Time period: longer – supply more price elastic because possible to change anything
Factor mobility Number of firms: more – supply more price elastic Stocks and spare capacity: more – can produce more –
supply more price elastic Length of production period: shorter – supply more price
elastic Usefulness
Taxation: incidence Price stability
5. Government Policies Taxation / subsidies
Demand more price inelastic – higher incidence Incidence: distribution of burden between
consumers and sellers Minimum price
Protect income of producers Creates surplus for future shortages Financing annual surpluses – burden on taxpayers – not
good in long run Cushion inefficiency New producers attracted – increase surpluses unless
government has measures to increase demand Maximum price
Lower-income consumers to afford necessities

21
Protect consumers Allocation of goods may be biased Black market, especially during war time Government can encourage supply by drawing on past
surpluses, giving subsidies and tax relief, reducing demand by controlling income
6. Case Study Note difference between elasticity of the product and the
elasticity of the final product (which involves the use of the product)
Note difference between less inelastic and more elastic When asked how a strategy might affect a company, consider
effect on total revenue then profits

22
7. Essay Limitations to using elasticity concepts to explain price changes
Elasticity concepts are static – need to relax ceteris paribus assumption in reality – simultaneous changes occur – need to consider relative magnitudes of changes in demand and supply
Coefficients of elasticity mere estimates Consumers not homogenous group
Among high-income earners, there are the yuppies seeking the high life and are likely to be more price and income sensitive compared to foreign investors who would consider socio-political factors
May not consider some goods as substitutes

23
Explain price elasticity of demand and income elasticity of demand. [10m] Definition Formula Sign Coefficients: range of values for elastic / inelastic Examples with their estimated values A government is proposing to increase the tax on petrol. Examine the relevance of price elasticity of demand and income elasticity of demand for this proposal. [15m] Introduction Assume specific tax for simplicity Uses of petrol: firms’ and commuters’ transportation Normal good: income increase – demand for cars increase – demand for petrol increase Body 1) Demand for petrol price inelastic: explain why Increase in indirect tax – supply falls at given price – supply
curve shifts vertically upwards by amount of tax Demand for petrol inelastic – fall in quantity demanded less
than proportionate Relevance: need high tax if government wants to reduce
consumption to desired level 2) Income elasticity of demand less relevant because it is due to changes in income – tax on petrol affects price directly, not income Government likely to be less successful if they increase tax
on petrol in period of economic boom
24
Boom: incomes rise – demand for cars (luxury good) – increase by more than proportionately – derived demand – increase demand for petrol
25
The terrorist attack on New York on 11 September 2001 caused a worldwide recession and an increased fear of flying, both of which severely affected the demand for travel by air. This led to the closure of some of the major airlines in the world. Assess the relevance of elasticity concepts in explaining the effects of these events on the airline industry. [15m] Body 1) Price elasticity of demand Definition When supply of airlines fell due to closure of major airlines –
price expected to increase – quantity demanded fall by more than proportionate – total revenue fall
Relevance Airlines should expect that reducing supply causing a rise
in price can lead to a fall in total revenue But the demand for travel for business is likely to be
inelastic. So price increase – less than proportionate fall in quantity demanded – total revenue increase
Effect on total revenue depends on size of business market vs. holiday makers
Due to the ceteris paribus assumption, the above will only take place if other factors remain constant. In this context, incomes have changed causing demand curve to shift – total revenue fall
2) Income elasticity of demand Definition Air travel luxury good for most, necessity for business
travelers Relevance

26
Recession – fall in income – fall in demand – fall in total revenue
Implication: individual airlines need to reduce price / engage in non-pricing strategies to increase market share
3) Cross elasticity of demand Definition Potential substitutes: train / coach / ship Degree of substitutability depends on the length of flight
Long haul flights: weak substitutes especially for business travelers
Short distance: stronger substitutes If another airline (eg. Qantas) reduces price to increase
market share – fall in demand for a particular airline (eg. SIA) – SIA reduces price – price war – may not cover costs – erode profits Budget airlines also pose as competition

27
Airlines close down routes / less schedules – fall in supply – increase price Demand inelastic: long haul flights – no close substitutes
– total revenue increase Demand elastic: short distance flights – switch to trains /
coaches – total revenue falls 4) Price elasticity of supply Definition Fall in price – fall in quantity supplied But short run: supply price inelastic – less than
proportionate fall in quantity supplied Reasons Labour: need time to retrench / reallocate labour to other
departments Flight schedule / routes: need time to deliberate which
routes / schedules to close – choose the unprofitable / lowest passenger volume
Conclusion Cannot look at each value separately because in real world many variables change at the same time

28
Chapter 4: Microeconomic Problems: Market Failure 1. Market Failure Scarce resources – need to allocate resources efficiently –
objective: maximize society’s welfare (social optimality) MSB = MSC: benefit to society from one additional unit of
good = cost to society of producing one extra unit of good Ways to allocate resources
Total government intervention Free market (based on price mechanism) Mixed economy (free market with some government
intervention) Free market economy
Private ownership of resources + individual decision-making guided by self-interest
Price serves as signal for resource allocation Automatic working of supply and demand – spontaneity –
allocative efficiency Equilibrium where demand = supply: maximization of
consumer and producer surplus Assumes no externalities + perfect competition
Market failure occurs when Allocative inefficiency: externalities / public goods,
imperfect competition Inability of market to achieve social objective eg. income
equity 2. Externalities Cost / benefit on a third party not involved in the consumption
/ production of good Negative
Types: industrial pollution, pollution and congestion from vehicles, demerit goods eg. cigarettes

29
External cost: second-hand smoke – health problems, fire hazard, environmental cost – littering, anti-smoking campaigns – money comes from taxpayers who largely do not smoke
To tabacco company: profit-maximising private producer: MPB = MPC
To society: to attain social optimality: equilibrium level MSB = MSC = MPC + MEC
Overproduction: deadweight loss Positive
Types: merit goods eg. healthcare, education External benefit: higher standard of living of
everyone because of highly-skilled jobs Under-production by free market: deadweight loss
Because of partial market failure, government intervention comes in
30
3. Public Goods Non-excludable: impossible / costly to exclude non-paying
consumers from receiving the good Non-rivalrous: consumption by one person does not reduce
amount available to others Eg. National defense Free rider – conceal demand – private producer cannot gauge
demand – will not produce – non-production in free market – total market failure
Government provision necessary since public goods are socially desirable and largely indivisible
4. Inequality Represented by the Lorenz Curve / Gini coefficient Singapore: 0.485 in 2007 European countries: 0.25 – 0.3 Latin America and the Caribbean: 0.6 Average worldwide: 0.4 5. Essay When asked to suggest new policies, consider whether it is
possible / practical to enact them Policies may be difficult to administer, and policing expensive Opportunity costs involved in attempted to control negative
externalities Political implications eg. public satisfaction

31
Policies on Pollution and Evaluation Summary 1) Identify: Taxation Explain: Tax polluters per unit of MEC – COP increases for
private firms – supply falls from MPC to MSC by amount of MEC
Evaluate: * Negative externality internalized by firm: incentive
for firm to be more -cost-effective to maximize profits / reduce pollution
* Provides revenue for government to finance other social and community development projects
* Able to allow market to continue operating according to market forces and reach state of equilibrium
x Requires accurate valuation of MEC / amount of pollution
- Over-valuation: output below socially optimal level, reducing society’s welfare / deters production – affects economic growth - Under-valuation: output still not brought to socially optimal level
x Difficult to apportion blame x Effectiveness dependent on price elasticity of
demand: if highly price inelastic, effect of tax on output ineffective unless tax very large / firm able to move burden to consumers and get away scot-free
2) Identify: Quotas Explain: Ban production if pollution exceeds a certain limit –
limits MEC by restricting output at socially optimal level

32
Clearly defined amount of pollution each firm can have Evaluate: * Able to control level of pollution in the country as a
whole X Does not allow price to equilibrate quantity
demanded to quantity supplied: firms may decide to produce less so they do not exceed the maximum amount of pollution they can have (compare this to taxation)
X Difficult and tedious to gauge how much pollution each firm produces: waste of resources and time on inspection
X Need vigilance and commitment of government 3) Identify: Legislation Explain: Force producers to bear costs of more proper disposal
of industrial wastes eg. antipollution equipment

33
Evaluate: x Difficult and costly: spend resources on inspection X If chances of being caught and penalties are small,
legislation ineffective X Need vigilance and commitment of government X Not immediately effective because of bureaucracy
involved in establishing laws X Lose voters leading to loss in power 4) Identify: Nationalisation Explain: Government takes over the polluters’ firms and
ensures production at socially optimal output Evaluate: x Waste of resources: opportunity cost to other
projects because less funds available X Difficult to accurately valuate quantity demanded X No competition: inefficient, no innovation 5) Identify: Campaign / advertisements to educate public Explain: Raise awareness of pollution situation to public in hope
they might do something to curb problem Evaluate: x Costs of these measures might outweigh benefits X Duration needed before effects can be felt and there
is no guarantee that the campaign will be effective X May be effective for only a short period of time
because the public is constantly bombarded by such campaigns that it is starting to lose its intended effect
6) Identify: Subsidies

34
Explain: Subsidise purchase of antipollution equipment so that firms’ COP does not increase that much by purchasing these equipment – firms more likely to buy the equipment than before
Evaluate: x Opportunity cost to other public projects X No guarantee that firms will buy the equipment X Firms need time to incorporate use of new
equipment: but in the long run probably mitigates the problem of pollution if firms use the equipment

35
7) Identify: Urban planning Explain: Locate factories away from residential areas eg. Jurong
Island Greenery (to reduce impact) Evaluate: x Merely shifting the pollution to another area – does
not solve the root of the problem but reduces external cost since less people affected by pollution
X Contentious as to whether greenery helps to reduce impact
Summation: Air pollution may not be due to the country itself,
so need international / regional cooperation Can integrate a few policies for better results

36
Policies on Pollution and Congestion caused by Cars Summary 1) Identify: ERP per tax unit Explain: Restricts car usage (nowadays rely more on this policy) Increases cost of car journey – quantity demanded for car travel falls Evaluate: x Congestion in other areas / small roads X Increase business cost – pass to consumers 2) Identify: COE Explain: Restricts car ownership Evaluate: x Increasing affluence – income elasticity of demand for cars X Cannot stem people’s aspirations
X Needs vigilance and political will (in other countries, government might not be able to have COE)
3) Identify: Efficient and affordable public transport Explain: Less pollution and congestion on roads Evaluate: x Not all countries have resources to build an effective
public transport system – LDCs: no money, DCs: complex commuting patterns
X For it to be affordable, possibly need government to finance. Otherwise if left to the private firm, they would want to charge more to maximize profits.
4) Identify: Registration tax, annual road license

37
Explain: Restricts car usage Evaluate: *May work if there is vigilance and commitment by
government 5) Identify: Rebates for green vehicles eg. 20% off purchase price Explain: Lower price – quantity demanded higher Evaluate: x Still not widely advocated X May still be too expensive to afford

38
6) Identify: Weekend cars Explain: Restricts car usage Evaluate: x Still not widely advocated X People associate cars with prestige (eg. Americans love for SUVs)

39
Chapter 5: Government Intervention in the Market 1. Tacking Externalities Negative externalities [details on page 21-23] Positive externalities
Subsidies: external benefit internalized (works like the tax) Can be easily implemented to bring about increase
in production and consumption Difficult to valuate external benefit generated High government expenditure – high tax rates can
subsequently discourage investment in country Firms lose incentive to be more productively
efficient – inefficient firms may survive Direct provision of merit goods
Social justice: merit goods should be accessible to all and not provided according to ability to pay
Large positive externalities: eg. free healthcare combats spread of disease
Dependants: eg. free education to protect children from irresponsible parents who fail to provide children quality education
Ignorance: consumers may not realize how much they will benefit and if they had to pay, they would rather go without it
2. Government Failure Allocative efficiency reduced following government
intervention to correct market failure Problem of incentives
Imposition of high taxes can distort incentives High marginal tax removes incentive for people to
work harder to earn more

40
Disincentive to produce and consume Desire by politicians to get elected: popular policies
introduced (eg. minimum wage law) Profit motive of private sector largely removed
Problem of information Difficult to valuate external cost / benefit Difficult to accurately estimate level of consumer demand
for product Problem of distribution
Increase inequity Eg. tax on use of domestic fuel (kerosene in Indonesia) –
low income households may feel greatest effect as tax on fuel oil may make life of poor worse since they use proportionately more domestic fuel than others
Bureaucracy and inefficiency: administrative costs; time lags Shifts in government policy: too frequent changes – difficult for
firms to plan ahead

41
Chapter 6: Firms and How They Operate I 1. Production in the Short Run Short run: at least one fixed factor Long run: period of time long enough for all factors to vary,
except level of technology, which varies in the very long run LDMR: as more units of a variable factor are applied to a given
quantity of a fixed factor, there comes a point beyond which the extra output from additional units of the variable factor will eventually diminish Stage 1: TP increases at an increasing rate, MP rises – due
to specialization of labour Stage 2: TP increases at a decreasing rate, MP falls, LDMR
sets in – due inefficient use of fixed factor Stage 3: TP falls, MP falls MP = change in TP / change in L
2. Theory of Costs in the Short Run

42
Factor Total Fixed Cost Total Variable Cost Marginal Cost
Definition Sum of all costs of production do not vary with the level of output aka overhead costs Must be paid even without production
Costs incurred for use of variable factors like labour Varies directly with output level
Additional cost incurred in producing an extra unit of output in the short run while some inputs remain fixed MC = change in TC / change in Q
Examples Rent of factory building, interest on capital invested in equipment
Raw materials, labour
Graph
Average curves ATC = AVC + AFC
AFC: amount of fixed costs per unit of output AFC = TFC / Q
AVC: total variable costs per unit of output AVC = TVC / Q

43
Stage 1: AVC falls, AFC falls. Since AFC and AVC fall, ATC also falls
Stage 2: AVC rises, AFC falls. Since fall in AFC > rise in AVC, ATC still falls
Stage 3: AVC rises, AFC falls: Since fall in AFC < rise in AVC, ATC rises

44
3. Objectives of Firms Profit-maximisation: equilibrium level of output since there is
no tendency to change Before equilibrium level, MR > MC so firms want to
produce more After equilibrium level, MR < MC and rational firms will
not produce at this output level Firm continues production as long as it can cover variable
costs Motivation of owners vs. motivation of managers: separation
of control and ownership – principal-agent problem: managers tend to pursue their alternative goals while maintaining minimum level of profits to appease shareholders
Revenue maximization: managers aim to maximize firm’s short run total revenue
Long-run profit maximization: managers aim to shift cost and revenue curves so as to maximize profits over some longer time period
Growth maximization: managers may aim for expansion to maximize growth in sales volume over time
4. Theory of Costs in the Long Run Returns to scale: measure of resulting change in output when
all inputs are changed in the same proportion (can be increasing, decreasing or constant)
LRAC: lowest average cost for given level of output when all inputs are variable
Minimum efficient scale: smallest plant size beyond which no significant additional IEOS can be achieved
IEOS: savings in costs that occur to a firm due to the firm’s expansion, and have been created by firm’s own policies and actions Technical: concerned with production process

45
Factor indivisibility economies: larger plant size makes it possible to effectively use indivisible factors (combine harvesters, power transmission: large and costly) – raises average output and reduces LRAC
Specialisation of labour: simpler and repetitive jobs which require less training + more efficient eg. car manufacturing
Managerial: functional specialization by employing experts to increase efficiency as a whole Greater use of existing staff Decentralisation of decision-making: increasing
efficiency of management because of faster flow of information within firm – distortions and delays of information avoided
Commercial Bargaining advantage and accorded preferential
treatment by suppliers because they buy raw materials in bulk
Bulk sales from bulk advertising and large-scale promotion
46
Financial Easier and cheaper to raise funds: given lower
interest rate and larger loans because better credit ratings and more collateral
Raise capital through issue of shares to public who has more confidence in reputed firms
Risk-bearing Advantage in bearing non-insurable risks eg.
conditions of demand for final products and supply of raw materials
Diversification of products and markets Diversification in sources of supply
R+d Better quality products – increased market share
and demand Better methods of production – more productively
efficient – lower average cost Welfare: making workers feel they belong to the
company – more apt to increase efficiency and productivity of company
IDOS Complexity of management
Principal-agent problem Bureaucracy
Strained relationships: impersonal – no loyalty to firm – apathy, strikes
EEOS: savings in costs that occur to all firms in an industry due to the expansion of the industry Economies of concentration
Availability of skilled labour: demand for labour large enough – special educational institutions / firms can collaborate to develop training facilities

47
No lack of labour to employ because experts want to migrate there eg. Silicon Valley
Well-developed infrastructure to cater to that industry
Reputation: builds up name which consumers associate with quality – encourages brand loyalty and steady clientele
Economies of disintegration Subsidiary industries developed to cater to needs of
major industry
Eg. car industry in Japan: range of firms specialize in production of different inputs for car manufacturing – provide output at lower prices to main industry because specialization allows subsidiary firms to produce at large scale – enjoy EOS
Process waste products into useful products and sell them to cover COP
Economies of information: publications help improve productivity of firms (research and expertise)

48
EDOS Increased strain on infrastructure: taxed to limits eg.
congestion – loss of time and increased fuel consumption Rising costs of FOP: growing shortage of specific raw
materials / skilled labour 5. Growth of Firms Methods of growth
Internal expansion: make more of existing product or extending range of product when it builds a new bigger plant
Merger Vertical integration: firms engaged in different
stages of productive process
Backward integration vs. forward integration
Eg. Starbucks merge with firm producing coffee beans – wants guaranteed access to raw materials
Horizontal integration: firm takes over similar firm at same stage of production in the same industry
Eg. Coffee Bean and Starbucks merge
Eg. DBS and POSB
Market domination Conglomeration
Eg. bank taking over developing firm to build properties
Diversify output 6. Survival of Small Firms Demand-side factors
Nature of product
49
Bulky and perishable goods: small, localized markets eg. fresh fish
Variety preferred to standardization eg. fashion Specialised products: limited markets eg. highly
specialized machines Prestige markets: limited by price eg. sports cars, luxury
yachts Direct and personalized services eg. lawyers, doctors Geographical limitations: high transport costs for bulky
products – local market rather than national market Supply-side factors
DEOS set in early: optimum size of firm small Vertical disintegration: entire production process broken
into series of separate processes and different small firms perform each process
Low BTE Lack of capital

50
Unwillingness to take greater risks Larger firm – higher expenditure – greater risk of
investment Fear of future fall in price of final product:
expansion of output – increase market supply – excess supply – lower prices and lower profits
Banding: small firms may band to gain advantages of bulk buying while still retaining their independence
Profit cycles: early stage of product cycle – total demand for product low
Non-profit maximization attitudes Owner values independence or wants to maintain
control among family members Contented with reasonable income from domestic
market Unwilling to take increased risks associated with
expanding into foreign market 7. Case Study Factors: think long run vs. short run, demand-side vs. supply-
side EOS – lower LRAC – able to reduce price
Profits plough to r+d – better quality products + further reduction in AC
Block new entrants due to enormous FC – less existing competitors – increase market share
Always end EOS with AC If a particular industry is stated in the extract, try to give egs of
EOS specific to the industry 8. Essay Survival of small firms: for conclusion, use banding / small firms
may want to merge in the face of globalisation

51
Discuss whether rising costs limit the size of firms over time. [15m] Introduction Size: sales revenue / turnover, level of output, market share Over time – long run – firm no longer constrained by fixed
factor Body 1) Can limit Short run cost Reason: over-use of fixed factor, inefficient labour-capital
combination – increase MC – eventual increase in AC Increase costs – fall in profits if total revenue is constant –
constrain firm’s ability to expand 2) Will not limit Long run All inputs can vary – firm can expand – enjoy fall in LRAC
due to internal EOS (list 2 egs) Fall in LRAC – fall in price to ward off competitors
(erecting barriers to entry) – increase profits – plough into r+d – better quality products + if yields results – further fall in AC due to better production methods
Size of firm determined by demand for firm’s product – if firm making supernormal profits – can still expand in size even if cost increases eg. monopoly selling unique products
Conclusion: However, size of firm over time constrained by MES (list 1 eg of internal DOS). MES huge eg. electricity / water compared to MES limited eg. fashion.

52
Banking Merger in Singapore Analysis Why merge? Face competition from foreign banks – Singapore wants to
expand beyond our shores: big – enjoy EOS – fall in AC – can compete with foreign banks
Core part of Singapore economy – 1997 Asian financial crisis – big stable
Why should not merge? Possible monopoly power Increase price Quality of service
Reduction / removal of familiar products and services – affects consumer satisfaction
Neglect lower-income group Retrenchment
53
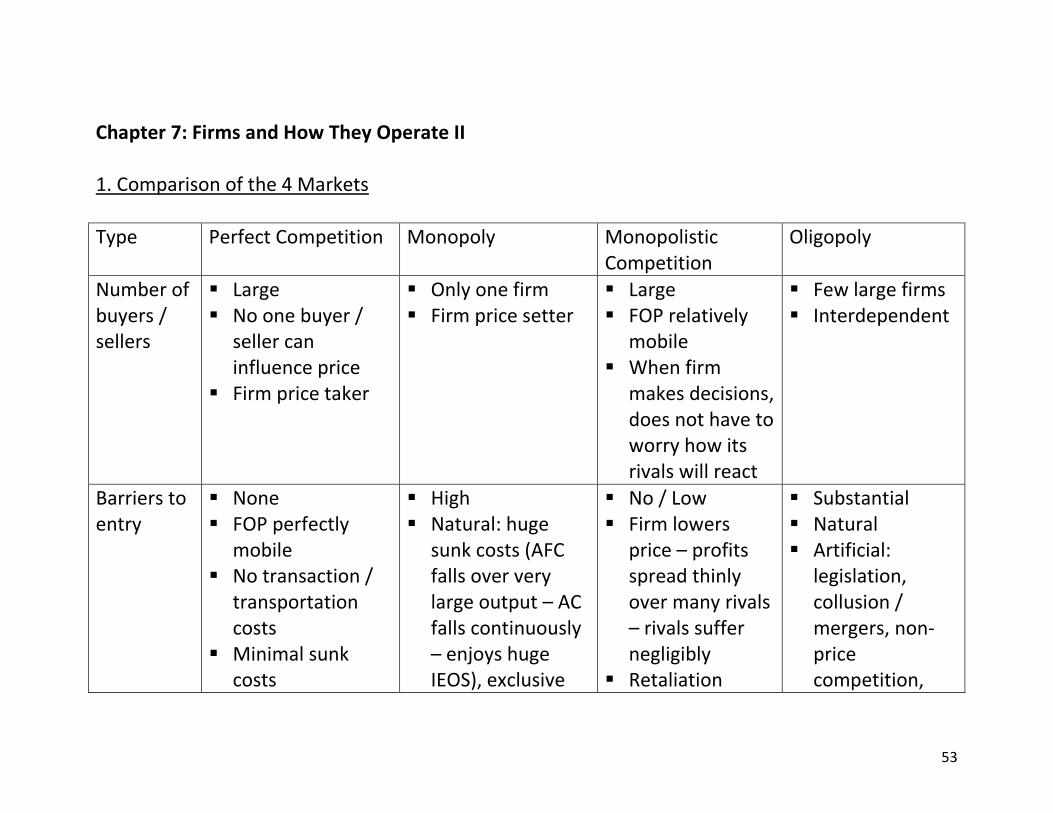
Chapter 7: Firms and How They Operate II 1. Comparison of the 4 Markets
Type Perfect Competition Monopoly Monopolistic Competition
Oligopoly
Number of buyers / sellers
Large No one buyer /
seller can influence price
Firm price taker
Only one firm Firm price setter
Large FOP relatively
mobile When firm
makes decisions, does not have to worry how its rivals will react
Few large firms Interdependent
Barriers to entry
None FOP perfectly
mobile No transaction /
transportation costs
Minimal sunk costs
High Natural: huge
sunk costs (AFC falls over very large output – AC falls continuously – enjoys huge IEOS), exclusive
No / Low Firm lowers
price – profits spread thinly over many rivals – rivals suffer negligibly
Retaliation
Substantial Natural Artificial:
legislation, collusion / mergers, non-price competition,

54
ownership of essential raw materials
Artificial: non-price competition, contrived barriers (cartel), legal protection: exclusive rights (patents, tariffs to block foreign firms)
unlikely No collusion –
keen competition
advertising
Nature of products
Homogeneous Buyers no
preference for any firm
No close substitutes
CED and PED very low
Differentiated: quality, design, location, promotion
Demand price elastic
Homogeneous / differentiated

55
Knowledge Perfect Seller knows
rivals’ prices, market costs and available technology
Buyers know all sellers’ prices, quality and availability of products – will not purchase at a higher price than equilibrium price
Imperfect Consumers not
fully aware of COP
Imperfect Production
methods and prices
Cost structures differ as some firms enjoy more favourable locations / rentals
Imperfect
Firm’s curve
P > MR

56
P = AR = MR P > MR Cannot increase
both output and price at the same time as curve is downward sloping
Some degree of control over own prices
No single equilibrium price in market – no market demand curve
P > MR Firm increases
price – other firms will not
Firm decreases price – other firms follow – may lead to price war
Price rigidity: menu costs, fear of harming firm’s image (fall in price – fall in quality)
Examples Stock market Forex market Agricultural
products: many farmers in LDCs
Utilities Starhub’s EPL
coverage SMRT for NS and
EW lines
Bubble tea UK brewery industry
Taxi companies OPEC Mobile service
provision

57
Firm’s SR equilibrium
Supernormal, normal / subnormal profits MC = MR and MC must be rising
Firm’s LR equilibrium
Normal profits New firms will
enter industry to erode supernormal profits
Normal / supernormal profits
Firm will shut down if subnormal profits
Normal profits Normal / supernormal
LR equilibrium curve
Productive efficiency
Efficient Firm produces at
MES
Inefficient unless by coincidence
Inefficient Will settle at
LRAC that is not necessarily at MES
Inefficient unless by coincidence
Firm’s POV: all points on LRAC Society’s POV: MES

58
Allocative efficiency
Efficient P = MC
Inefficient P > MC
Could be seen as premium society pays for product differentiation

59
2. Analysis of Imperfect Market Structures
Type Monopoly Monopolistic Competition Oligopoly
Economic efficiency
Allocative inefficiency: P > MC, output below optimum
Productive inefficiency X-inefficiency but
increasingly reduced due to globalisation, reduced customs duties and barriers to trade
Dynamic efficiency: r+d
Allocative inefficiency: P > MC
Productive inefficiency: do not utilise optimal plant capacity, do not exhaust potential for further EOS because all small firms
Dynamic inefficiency: no r+d
Allocative inefficiency: P > MC, output below optimum
Productive inefficiency Dynamic efficiency: r+d
Variety of products
Unique Possible innovation and
new products: BTE stimulus to the creativity required to destroy barriers – monopoly profits stimulates new entrants producing new and competing products
Large variety – increase in consumer welfare
Differentiated

60
R+d and new profits
Profits lead to unequal income distribution: dollar votes + shift of consumer surplus to producer
Supernormal profits – plough into r+d – better quality products + better methods of production – lower AC but there is no guarantee that monopolies will do this
More equity: no redistribution of income from consumers to shareholders
Normal profits: no additional profits to plough into r+d
Supernormal profits ploughed into r+d

61
Theory vs empirical evidence
MES high – IEOS – lower MC than PC industry – lower P and higher o/p but monopolies charge high prices by restricting output
Practise price
discrimination [has both costs and benefits]
Natural monopolies Perfectly contestable
markets: costs of entry and exit by potential
Wasteful competition Advertising provides
better consumer information which helps move market structure closer to PC model but loss of consumer sovereignty
High price rigidity: price stability
Wasteful competition: more likely to engage in extensive advertising – encourages price competition, with increased sales volume and reaping of EOS, price reduce further
But possible monopoly power through collusion
But multiple branding gives consumers misguided information in thinking products are from different firms
P/R/C
Q
AR
MCm
MR
MCpc
Pc
Pm
0 Qc
Qm

62
rivals are zero, and when such entries can be made very rapidly eg. deregulation of airline industry in 1978
Hit and run competition: market contestable for certain seasons eg. parcels service during festivals
Reduces wasteful competition (instead of extensive advertising, money can be spent to produce more goods)
63
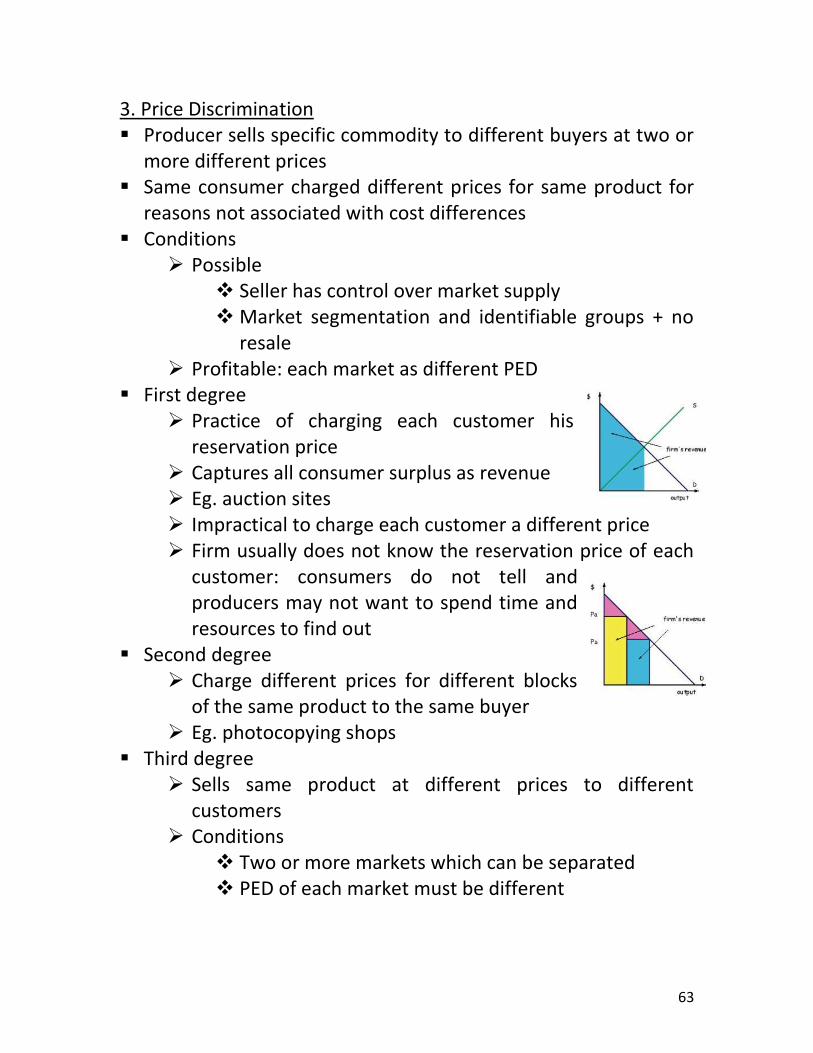
3. Price Discrimination Producer sells specific commodity to different buyers at two or
more different prices Same consumer charged different prices for same product for
reasons not associated with cost differences Conditions
Possible Seller has control over market supply Market segmentation and identifiable groups + no
resale Profitable: each market as different PED
First degree Practice of charging each customer his
reservation price Captures all consumer surplus as revenue Eg. auction sites Impractical to charge each customer a different price Firm usually does not know the reservation price of each
customer: consumers do not tell and producers may not want to spend time and resources to find out
Second degree Charge different prices for different blocks
of the same product to the same buyer Eg. photocopying shops
Third degree Sells same product at different prices to different
customers Conditions
Two or more markets which can be separated PED of each market must be different

64
Higher price charged in market with more price inelastic demand
Cost: loss of consumer surplus Benefits
Firm: higher profits and may use these profits from one market to withstand possible price war in breaking into another market
Consumer Consumer may not have been able to afford good
otherwise Higher profits may be reinvested into r+d – better
quality products + better methods of production Provision of goods that would otherwise not be
produced due to high costs if production and consumption of good is one that confers positive externalities on society
Additional profits might exceed losses such that firm will still continue producing the good

65
Discuss the view that the profit motive will always lead to a few large firms dominating the market for each and every type of product. [15m] 1) Barriers to entry Few large firms merge – greater market share – reap EOS –
fall in LRAC – fall in price – ward off rivals / block new entrants (natural BTE) – able to maintain supernormal profits
If plough into r+d – better methods of production – further fall in AC - make more profits
But some industries have low BTE (technology easily replicated) – low sunk cost eg. retail, grocery
2) Market size Small: eg. Singapore television broadcasting Mediacorp vs.
Mediaworks Firms will eat into each other’s market share – erode
profits – so to keep profits just let one firm dominate Market big: eg. US then can afford to have few large firms
3) Nature of product Large firms: unique products with no close substitutes Small firms: availability of substitutes, prestige market /
services, localized demand, perishables, limited MES – fashion, specialization, personalized services
4) Government Intervention / public’s desire Few large firms will help to reduce price – increase in
consumer surplus – increase in consumer welfare Supernormal profits – plough into r+d to produce better
quality products

66
Will still have competition unlike monopoly – still have the incentive to be more cost-efficient / innovative

67
Explain what is meant by productive and allocative efficiency. [10m] 1. Allocative efficiency Definition: situation in which it is impossible to change the
allocation of resources in such a way as to make someone better off without making someone else worse off
Assumption: no externalities / public goods – P = MC – right amount + type of good produced to maximize societal welfare
If MB < MC, last unit of good less than opportunity cost of
producing that unit – society benefits from not producing that last unit
If MB > MC, last unit of good more than opportunity cost of producing that unit – society benefits from producing that last unit
Assumption aside, MSB = MSC Perfect competition: firm price taker MR = MC = P – allocatively efficient
Price
Quantity 0
S (MC)
D (MB)

68
2. Productive efficiency Long run concept Firm’s POV Any given level of firm’s output produced at lowest
possible AC – all points on LRAC curve are productively efficient
Society’s POV LRAC minimum – firm is at optimum size / MES – all IEOS
exploited
P/R/C
Quantity
MR
MC
Q1 0
P1
P/R/C
Quantity
MR
LRAC
Q1 0
P1

69
‘A firm should be encouraged to maximize profits because this makes it efficient.’ Discuss whether this argument is true for a firm operating in an imperfect market. [15m] *When comparing efficiency, only talk about long run 1) Allocative efficiency: P > MC true for all imperfect markets because they are price setters – deadweight loss to society – allocatively inefficient 2) Productive efficiency: Not operating at MES (where LRAC cuts MC) – not fully exploited all IEOS – productively inefficient
PC industry needs to be at MES because it needs to be as cost-effective as possible – price taker – cannot pass cost increase to consumers
Vs. imperfect market need not be at MES because price setter – can pass cost increase to consumers
3) X-inefficiency Monopoly: lax in cost control – no existing competition – can
pass cost increase as price increase
P/R/C
Quantity
AR MR
MC
LRAC Pm
Pc
Qc Qm 0
Triangle = DWL
70
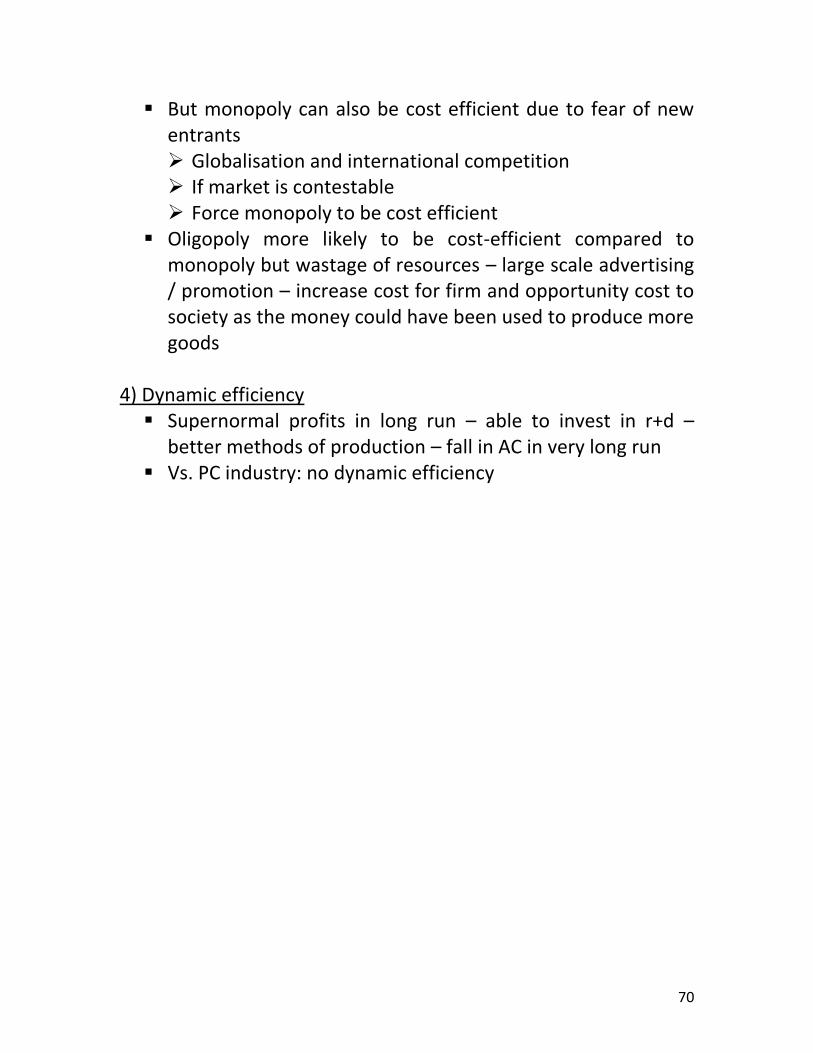
But monopoly can also be cost efficient due to fear of new entrants Globalisation and international competition If market is contestable Force monopoly to be cost efficient
Oligopoly more likely to be cost-efficient compared to monopoly but wastage of resources – large scale advertising / promotion – increase cost for firm and opportunity cost to society as the money could have been used to produce more goods
4) Dynamic efficiency Supernormal profits in long run – able to invest in r+d –
better methods of production – fall in AC in very long run Vs. PC industry: no dynamic efficiency

71
Distinguish between monopolistic competition and oligopoly. [10m] Type Monopolistic
competition Oligopoly
Number of sellers
Many – one firm’s action less likely to affect others
A few large firms – interdependence – one firm’s action likely to evoke responses from rivals
Nature of product
Differentiated eg. retail: restaurants – affect demand curve – demand price elastic
Homogeneous / differentiated eg. mobile service provision, petrol companies / taxi companies, OPEC – kinked demand curve
Firm increase price: rivals
will not follow – quantity demanded for firm’s product falls more than proportionately – demand price elastic
Firm reduces price: rivals likely to follow – price war +
P/R/C
Quantity 0
AR
P/R/C
Quantity 0
AR
Pe

72
quantity demanded for firm’s product increases less than proportionately – demand price inelastic
Non-pricing competition
Smaller scale Larger scale
Likelihood of colluding
Less More: large market share
BTE Low / no – low sunk cost + technology easily replicated – long run normal profits
High – natural: high sunk cost eg. utilities, telecomm – TFC very huge – LRAC keeps falling – enjoys huge EOS – very low LRAC– new entrants cannot produce at such low LRAC
Artificial: patents Ensure supernormal profits
in long run

73
Explain why oligopoly is a common market structure in many economies. [15m] 1) Firms want to be big to maximize profits Merger of small firms – EOS – fall in LRAC – fall in price –
ward off rivals + block new entrants Monopoly – attracted by supernormal profits – monopoly
loses its power 2) Society may desire oligopolies Oligopoly – competition – greater innovation through r+d
which monopolistic competition cannot afford since it only makes normal profits
Vs. monopoly – lax – X-inefficiency 3) Government’s intervention Singapore government – face of international competition in
a free market, local firms have to be big eg. banking – go regional – liberalization and deregulation of industries: mobile service industry, taxi companies
Firms prefer operate in oligopolistic structure rather than monopolistic: monopolies more closely watched by government vs. oligopolies harder to observe whether they are colluding
4) Some industries due to huge sunk cost – oligopolistic / even natural monopoly eg. utilities, telecommunications, transport, TV broadcasting in Singapore since market size is too small – one single player most efficient

74
Explain why governments throughout the world have been involved in the supply of services such as electricity. [12m] Introduction Government – social benefits + social costs which private
firms unlikely to take into account Electricity – essential good for households and businesses
Body 1) Could be a natural monopoly Market size cannot operate with more than one player at
MES: huge sunk cost – AC keeps falling – private firms likely to be monopolistic – charge very high prices – need for regulation
2) Private – does not cater to lower income group vs. government more likely to do so
P/R/C
Quantity 0
AR MR MC
Pm
Pc
Qm Qc
AC

75
3) Huge initial investment – private firm likely to charge higher price to cover costs vs. government can subsidise from revenue / taxes 4) If there is competition among a few private firms – wastage + duplication of resources vs. government: save costs for advertising 5) Earns revenue for government since it is essential Conclusion Main point is that government does not want to risk anything because electricity and similar services are so essential

76
Chapter 8: Government Intervention in the Market II 1. Regulation of Natural Monopolies MC pricing: monopoly charge a price that is equal to MC in
order to achieve allocative efficiency But monopoly incurs a loss – shut down – public deprived
of vital service Need to be supplemented with government subsidies:
costly to government, burden on taxpayers 2-tier pricing: consumers pay a fixed sum of money for
access to service and price per unit consumed to cover marginal cost Eg. electricity, gas Producer meets all COP and minimizes loss of social
welfare AC pricing: monopoly charge a price equal to AC – lower
price and greater output – increase in society’s welfare Normal profits – viable in long run Still not allocatively efficient Firms no incentive to keep costs low since price is at
whatever AC they are at Problems Difficult to obtain accurate information on demand and
cost estimates: firms tend to overstate cost, market conditions change constantly, costly to acquire new information
Regulatory lag: firms may have to operate at a loss during time lag
Costly to administer 2. Taxation Lump-sum tax on monopolist’s excessive profits – shifts AC
curve upwards – profits reduced – normal profits
77
Redistribute income from producer to consumer Use tax revenue to subsidise welfare schemes / production
of merit goods May create disincentive for monopolist to be cost-efficient Monopoly can pass burden to consumers due to price
inelastic demand Dynamic efficiency compromised
3. Legislation Anti-trust laws: Anti-trust Act (US) / Competition Law
(Singapore): break up monopoly Eg. Microsoft Corporation: one firm own Windows
operating system, the other will own applications May not be applicable to natural monopoly / monopolies
with great incentives to undertake r+d Forbidding certain practices: eg. predatory pricing: setting
price below COP to eliminate competition Imposing standards of provision eg. Public Transport
Authority in Singapore governs standards of public transportation to ensure guaranteed quality of product
Insisting on certain levels of competition in industry: Singapore government increasingly deregulates monopoly
4. Nationalisation Growth Industries with major investment eg. steel and coal
industry, large spending on r+d required Unfair competition of state-owned enterprises with
private sector Efficiency Natural monopoly, presence of positive externalities,
eliminate wasteful duplication

78
Lack of competition pressure – lack of incentive – X-inefficiency
Bureaucracy – heavier burden on tax payers Sunset industry Decision may be made for political rather than economic
reasons eg. just to keep employment figures high Equity Special pricing policies eg. free bus rides for pensioners Service which would otherwise not be provided eg. bus
route to remote areas State monopoly no less disadvantageous to consumer
than private one – no higher authority to maintain checks and balances
Stability For strategic reasons eg. national defence Seen as a move towards communism
5. Privatisation Competition Increased competition – cost efficiency + benefits for
consumers eg. lower prices, wider choice, improved quality
Unfair competition of state-owned enterprises with private sector
Could be worse outcome If state monopoly replaced with private monopoly,
possibly lower output and higher price If high BTE

79
Efficiency Greater efficiency
Commercially sounder decision making eg. higher returns on investments
Greater accountability to public – constantly need to perform well or risk takeover by another firm
Natural monopolies, externalities, equity issues Revenue Revenue from selling state assets Higher corporate tax receipts if privatized company is
profitable Long term loss of revenue had the privatized firm been
profitable

80
No.
Title Page No.
29 Chapter 9: Key Economic Indicators 50-51
30 How far can this information lead you to conclude that there is a rising standard of living in Singapore?
52-53
31 Discuss the factors that contribute to economic growth in a country.
54
32 Chapter 10: Income and Employment Determination 55-58
33 Explain what information an economist would require to decide whether the US needed ‘an economic stimulus’.
59
34 Explain what is meant by the equilibrium level of national income.
59
35 Analyse the effect on the equilibrium level of income of an increase in the level of savings and an increase in the level of exports.
60
36 Discuss the extent to which the US fiscal stimulus might lead to a sustained increase in national income.
61
37 What are the main causes of Singapore’s recessions? 62
38 Chapter 11: International Economics 63-66
39 Explain the theory of comparative advantage. 67
40 To what extent does the theory of comparative advantage explain the pattern of trade between Singapore and the rest of the world?
68-69
41 Discuss whether protection offers any advantages over specialization.
70-71
42 Explain the rationale for free trade and discuss the extent to which FTAs are beneficial.
72-74
43 To what extent can economies benefit from globalisation?
75-76
44 Discuss the opportunities and threats of globalisation for Singapore and other Asian economies.
77
J2 Topics

81
45 Consider the effects, other than on the general price level, of Singapore’s changing tax structure.
78
46 Policies to remedy Singapore’s recession 79
47 Evaluate methods the Malaysian government might use to slow down import growth and increase new export business.
80
48 “To be considered successful, an economy needs to achieve low unemployment, low inflation and stable economic growth.” How far do you agree with the statement?
81
49 “To be considered successful, an economy needs to achieve low unemployment, low inflation and stable economic growth.” Explain this statement.
81
50 Discuss whether fiscal policy is the most effective way for Singapore to sustain a successful economy.
82
51 In the fourth quarter of 2004, Singapore’s unemployment rate rose to 3.7%. Discuss whether supply-side policies are the best way of achieving full employment in Singapore.
83
52 Why Singapore does not use interest rate policy 84
53 Problems with exchange rate instability 84

82
Chapter 9: Key Economic Indicators 1. Key Macroeconomic Aims Strong sustained economic growth Low inflation Low unemployment rate Healthy BOP 2. National Income Statistics Gross domestic product: value of all final goods and services
produced within a given country during a given period of time Measure economic growth Limitations
Understate nation’s output: omission of non-market activities (voluntary welfare services) and underground economy
Difficulties in measuring SOL
Leisure time
Externalities
Production does not equal consumption: expenditure could be for potential growth
Income distribution
Other social factors: eg. crime rates, freedom International comparisons
Difference in account procedures and items included
Exchange rates: need to use PPP
Population: need GDP per capita
Difference in climate and culture: different needs – different costs
Difference in underground economy: Sweden’s underground economy 13% of GDP

83
Alternative measures of SOL HDI: life expectancy, education, GDP per capita at
PPP rates MEW: leisure, GDP per man hour
Gross national product: value of all final goods and services produced by residents of a country, regardless of the location of production, during a given period
Net national product: GNP – depreciation Nominal: at current prices vs. real: at constant prices
84
3. Inflation Rate CPI: measures change in price of fixed basket of goods and services
commonly purchased by households in a specified time period Limitations
Not an accurate measure of COL Substitution bias: consumers substitute toward goods that
have become relatively cheaper – overstates COL Quality adjustment: CPI increase might be due to quality
adjustments – overstate inflation New products: price declines sharply a few years after
introduction – not added to market basket until years after introduction – price declines not recorded
4. Unemployment Rate Unemployed: people aged 15 and over who are without work but
were available for work and were actively looking for a job Frictional unemployment: unemployment because time taken for
workers to search jobs and for firms to search for suitable workers Structural unemployment: workers do not have the skills needed to
obtain long-term employment Cyclical unemployment: unemployment during recession 5. Balance of Payments Record of country’s international transactions Current account
Visible: imports and exports of goods and services – BOT Invisible: profit repatriation, interest, dividends, unilateral
transfers Capital account
Portfolio: bonds, shares, money in banks Direct: FDI
Financial account: something like bank reserves
85
Singapore has enjoyed another year of robust growth in 2007, and the real GDP growth was 7.5% for the year. A record 172000 jobs were created in the first 3 quarters. However, in recent months, inflation has picked up and the inflation rate for the month of November alone was 4.2%. How far can this information lead you to conclude that there is a rising standard of living in Singapore? [25m] Introduction SOL – material and non-material well being of each citizen Body A) Material well being Real GDP per head: on average how much goods / services
each citizen gets to consumer Real: adjusted for inflation as converted to constant
prices High for a developed country Limitation: does not show effect of changes in population
size Per head: effect of population size eg. if GDP increases by
7.5% but population increases by 9%, GDP per head falls Singapore: over 1 year: changes in population size little
but could have been some increase due to open-door policy
Income gap – Gini coefficient Gini coefficient globally used as a measure of income
disparity, with 0 indicating perfect equality and 1 perfect inequality
Singapore: 0.52 in 2006

86
Increasing gap in Singapore due to globalisation: displaced by machines, structural changes, influx of foreign workers, outsourcing
Type of spending Capital vs. consumption goods Government spending Defence vs. spending that directly increases SOL
172000 jobs High incomes – increase consumer spending which
increases demand for goods and services, generating more jobs and employment
Due to investments by foreign companies eg. in 2007 plant specializing in harnessing solar energy set up in Singapore – indicates investor confidence
Limitations: 60% jobs went to foreigners, number of jobs destroyed vs. number of jobs created, size of labour force may have changed so it is not that unemployment rates fell, composition of jobs (for lower-skilled workers?), ratio of dependants to working population

87
Inflation rate Real: adjusted for inflation Cause: mainly cost factors like high imported oil price,
imported food shortages, partly GST Lower-income group suffers more in the face of further
increase in prices / income gap B) Non-material well being Education – literacy rate
Singapore: high literacy rate due to compulsory primary education, heavily subsidized
Government emphasis on upgrading of skills and training subsidies to firms for such purposes
Healthcare – infant mortality rate / life expectancy Singapore: individual responsibility + government
spending – 3M framework – Medisave, Medishield, Medifund
Avoid excessive burden on state and tax payers With increasing medical costs + ageing population, QOL of
some (lower-income group?) may be affected Means-testing
Leisure: GDP per man hour Others: negative externalities eg. pollution Conclusion Other indicators: HDI, MEW, GNP
88
Discuss the factors that contribute to economic growth in a country. [12m] Introduction Economic growth measured by GDP growth rate and is the
means to improve living standards Body 1) Quantity and quality of resources Quantity and availability enhance growth potential
Land: includes natural resources like mineral deposits and oil eg. oil-rich Saudi Arabia
Labour – labour-abundant countries like China and India Entrepreneurship – availability of talents and risk-taking
individuals eg. self-made entrepreneurs in Hong Kong Quality can be enhanced through government effort and
policies Increase labour productivity through training and
education Entrepreneurship Capital – government efforts to make it more conducive
for fixed capital formation 2) Role of government Augment quality of labour through education and training Strategise economic direction eg. change structure of economy
in face of loss of comparative advantage and nurture comparative advantage in new areas
Conducive environment for business Political stability Price stability: reflection of good macroeconomic
management by government, competitive price and lowered COP – ability to attract FDI due to lower wages

89
Efficient infrastructure Attractive corporate taxes Less bureaucracy and red tape Ability to explore new markets / help businesses go global
3) Level of consumption, investment and government spending in economy High consumption conducive when economy has unutilized
resources while high savings conducive when economy near or at full employment
Savings provide investment funds necessary for growth Government fiscal and interest rate policies High export revenue due to competitiveness
90
Chapter 10: Income and Employment Determination 1. Aggregate Demand Total level of spending in an economy AD curve slopes downwards because
Wealth / real balance effect: GPL higher – purchasing power of financial assets falls – discourages domestic consumption – lower level of output
Interest rate effect: higher GPL – increase demand for money from households and firms + might shift wealth out of financial assets – decreasing supply of loanable funds – increase in interest rates – more expensive to purchase goods and services on credit – households purchase less goods + businesses invest less – lower national output
International substitution effect: higher GPL – locals buy more foreign goods + foreigners buy less domestic goods – net exports fall – lower national output
Factors that cause a shift Changes in expectations: income and profits, real wealth,
inflation Changes in government policies Changes in world economy: income abroad, foreign price
level, exchange rates 2. Aggregate Supply Total output of goods and services that firms as a whole would
like to produce and sell at each possible price level Shape
Horizontal: producers can produce all they want due to abundant resources
Upward sloping: output rises but pressure on prices Vertical: need time to adjust to new cost structures

91
Factors that cause a shift Change in input prices Change in quality of labour input Change in expected rate of inflation Change in technology Government policies (local and foreign)

92
3. Consumption Function Act of using income for the purchase of goods and services to
satisfy current wants C = a+bY
a represents autonomous consumption: level of consumption that does not vary with income – still need to consume even though no income
bY represents induced consumption: household expenditures that vary directly with income
b: MPC = change in C / change in Y Non-income determinants
Wealth: amount of money, fixed assets and financial assets households have
Expectations of future prices and income Distribution of income Interest rate and availability on credit
Consumption
Income
Y = C
C = a + bY
W
X
Z
W = dissavings, X = breakeven point, Z = savings

93
Tastes and attitudes 4. Investment Act of acquiring new fixed capital assets and accumulating
stocks and inventories Autonomous: not influenced by national income vs. induced Expected rate of return > rate of interest – will invest Factors that cause shift
Business confidence and expectations Cost and availability of capital goods Rate of change of income: accelerator effect Government policies Change in technology

94
5. Equilibrium Level of Income
Interest rate
Investment
AE
National output
Y = AE
Y2
c
d
b
a
Autonomous consumption
Y0
A
B
95
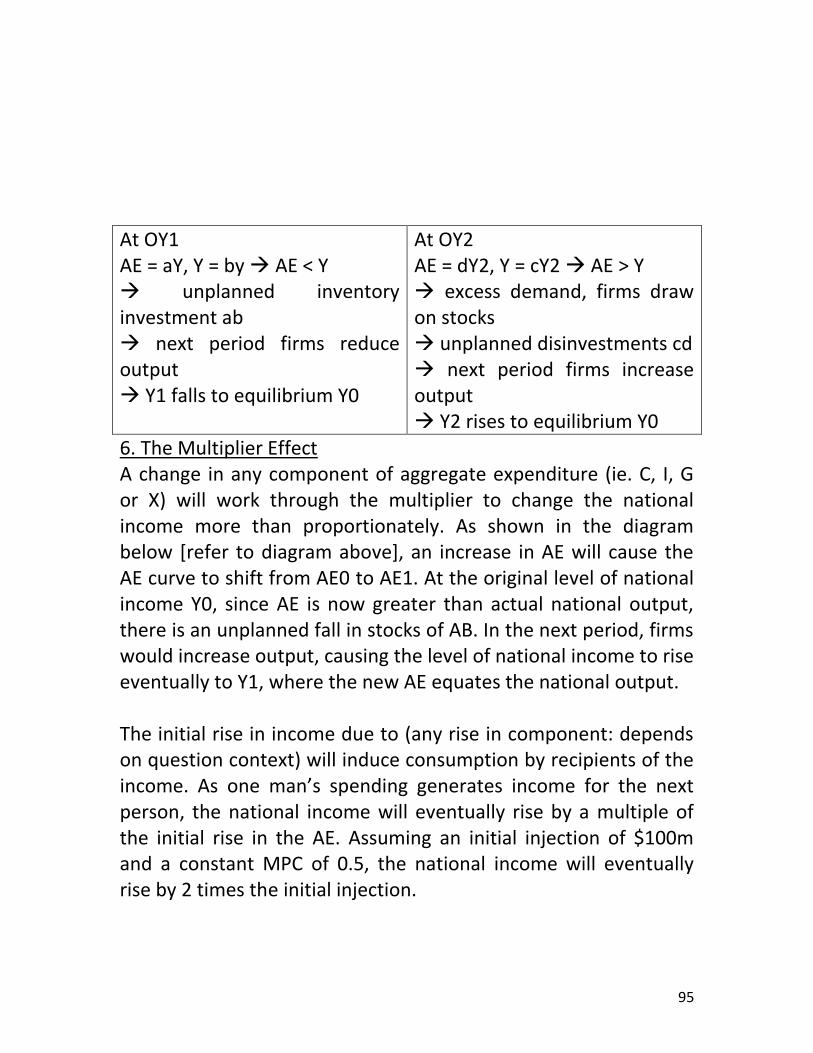
At OY1 AE = aY, Y = by AE < Y unplanned inventory investment ab next period firms reduce output Y1 falls to equilibrium Y0
At OY2 AE = dY2, Y = cY2 AE > Y excess demand, firms draw on stocks unplanned disinvestments cd next period firms increase output Y2 rises to equilibrium Y0
6. The Multiplier Effect A change in any component of aggregate expenditure (ie. C, I, G or X) will work through the multiplier to change the national income more than proportionately. As shown in the diagram below [refer to diagram above], an increase in AE will cause the AE curve to shift from AE0 to AE1. At the original level of national income Y0, since AE is now greater than actual national output, there is an unplanned fall in stocks of AB. In the next period, firms would increase output, causing the level of national income to rise eventually to Y1, where the new AE equates the national output. The initial rise in income due to (any rise in component: depends on question context) will induce consumption by recipients of the income. As one man’s spending generates income for the next person, the national income will eventually rise by a multiple of the initial rise in the AE. Assuming an initial injection of $100m and a constant MPC of 0.5, the national income will eventually rise by 2 times the initial injection.

96
In short, the multiplier measures the change in national income as a result of the change in AE. It has a direct relationship with the MPC, expressed as k=1/(1-MPC). Evaluation Magnitude of increase in NY depends on size of multiplier Larger the MPW, smaller the multiplier May lead to demand-pull inflation if near or at full employment BOP – inflation affects price of exports and may have adverse
effect on BOT 7. Inflationary / Deflationary Gap Amount of AE that falls short of (cd)/ exceeds (ab) the level
necessary to achieve FE

97
Explain what information an economist would require to decide whether the US needed ‘an economic stimulus’. [10m] Introduction Weak economy – assume pending recession – fall in GDP for 2 consecutive quarters (negative GDP growth) Development Fall in real GDP Components of AD: fall in AD – fall in GDP
Consumption level of households: due to fall in income / saving in fear of retrenchment
Fall in investment: business pessimism, induced: fall in GDP – fall in investment
Inflation: fall in GDP – fall in AD – fall in GPL / fall in inflation rate Need inflation rate to arrive at real GDP
Firms and bankruptcy, firms and decreasing profits Stock markets: indices fall – confidence fall OR Fall in real GDP What causes fall: C/I/G/X-M: BOT: more relevant for Singapore
since Singapore’s recession mainly due to BOT GDP – income, wages and profits, bankruptcy Inflation: fall in GPL but stagflation (economy weakening but
price increasing) – price increase in US not due to recession: not AD factors but AS factors
Unemployment rate – rough guide: 4% - cyclical – no job – demand deficient unemployment
Explain what is meant by the equilibrium level of national income. [10m]
98
NY: as measured by GDP (definition)
Equilibrium: no tendency to move from that equilibrium Describe briefly components of AE
C (households): shape of AE follows shape of consumption function C=a+by
Simple explanation of components Sign of 45 degree line: every point is an equilibrium point
where AE=Y Equilibrium level of NY: planned AE = Y. AE curve cuts 45
degree line Adjustment to equilibrium Conclusion: when economy is in equilibrium, may not be at full
employment / recession

99
Analyse the effect on the equilibrium level of income of an increase in the level of savings and an increase in the level of exports. [15m] A. Savings Y = C + S Increase in S – fall in C – AE falls – AE curve shifts from AE1 to
AE2 Show adjustment to equilibrium Summation: increase savings – fall in C – works through
multiplier – fall in NY by a few multiples Evaluation
Savings can be good for economic growth – increase supply of loanable funds – interest rate falls – cost of borrowing falls – increase I – increase productive capacity – increase AS – increase NY
Summation: S decreases actual growth but increases potential growth
B. Exports Increase X – increase AE – AE curve shifts from AE2 to AE1 Show adjustment to equilibrium Evaluation
Increase X – if have unemployed resources – increase NY Increase X – if near / at FE – NY may not increase as fast /
demand-pull inflation Discuss multiplier process in detail Conclusion Magnitude of change in national income depends on size of
multiplier Larger MPW, smaller K Eg. Singapore

100
Discuss the extent to which the US fiscal stimulus might lead to a sustained increase in national income. [15m] Introduction Fiscal: increase G, decrease T Sustained: actual + potential growth Development How fiscal stimulus works: lower taxes (increase C/ increase I) +
increase G – increase AD – increase NY: actual growth, cannot sustain
Multiplier in detail Evaluation: depends on size of multiplier
USA – MPM could be high because hug e trade deficit – may reduce size of k
Crowding out effect: increase in G if borrowed from public – decrease in supply of loanable funds – increase in interest rate – crowd out C/I – cannot sustain
Effects of taxes on C and I unpredictable due to pessimism
Reaches FE: cannot sustain Therefore need supply-side measures to increase AS for
sustained growth – potential growth / increase in productive capacity
Increase in G on infrastructure – facilitates business – increase AS
Tax – increase NY (potential) Decrease personal taxes – increase incentive to work –
increase AS Decrease corporate taxes – increase I – increase LRAS Condition: if rebates are permanent but according to
preamble, rebates seem to be one-off
101
Conclusion More policies to boost AS – education and training – increase
productivity – increase LRAS What are the main causes of Singapore’s recessions? [10m] 1) Factors leading to fall in AD External factors – pessimism eg. 911, SARS (only caused a
slowdown in Singapore’s economy), 1997 Asian crisis – C/I fall Trade deficit: value of X fell due to 911
Lose CA – goods more expensive Fall in income of trading partner
2) External recessions US recession – US GDP fall – buy less Singapore goods –
Singapore’s X falls – AD falls – GDP falls (multiplier effect) Singapore may not be that affected – can ride on growth of
China / India But China huge trade partner of USA Singapore: international momentum
Extension of MRT – increase G – k – increase NY IR: increase I – increase NY + tourist revenue YOG: tourist revenue Cannot sustain since k is small
3) Supply-side factors Supply shocks: 1973 oil crisis – increase COP – fall in AS But overwhelming cause is due to AD, but recognize that fall in AS can also create a recession

102
Chapter 11: International Economics 1. Theory of International Trade Exchange of goods and services between countries, involving
the use of different currencies and crossing international borders
Theory of comparative advantage: produce good at lower opportunity cost than another country Sources
Differences in factor endowments that can change over time
Differences in technology Dynamic comparative advantage
Advantages of trade Greater world output and higher consumption of goods
and services (possible at previously unattainable levels) Reduction in unit cost of production: EOS, countries gain
experience over time Stimulate economic development and growth: enlarge
market, increase competition in home market Facilitate transfer of technology and ideas: increase
efficiency of production – economic growth, help developing countries leap frog stages
Promotes beneficial political links Benefits consumers: more choice and higher satisfaction
levels, lower prices compared with local products, better quality products
Dynamic gains from trade: gains grow larger over time Disadvantages of trade
Unfair competition and dumping / unnecessary government subsidies
Over dependence on other countries Import harmful goods

103
Terms of trade: rate at which country exchanges its exports for imports Factors
Change in demand conditions: population, income, availability of substitutes
Change in supply conditions: technology, depletion of natural non-renewable resources
Consequences of change in TOT Change in BOT and SOL: dependent on PED of
exports and imports, cause of change, responses that follow
Reallocation of resources Change in consumption patterns
104
2. Barriers to Trade Natural
High transport costs – raises COP and lowers relative efficiency
Lack of mobility of factors Increasing COP due to LDMR beyond certain level of
output Other market imperfections: imperfect information and
market conditions – may not specialize to extent that theory suggests
Artificial: protectionism Tariff: custom duties imposed on imports of goods and
services by government Depends on PED of imports and how much foreign
suppliers are willing to absorb – may not protect domestic producers, just a source of government revenue
Cuts volume of imports – improve BOT – exchange rate appreciates – exports more expensive abroad – reduce exports in the long run
Non-tariff: import quotas Greater certainty of protection since revenue
earned by foreign suppliers may not be as badly affected as tariff
Export subsidies: cash grants by government to local producers Reduces COP – sell more of good at prevailing price May induce complacency Drain on government funds
Foreign exchange control: government control over sale and purchase of foreign exchange Financial quotas, charges made on people
purchasing foreign currencies

105
Malaysia used this method to recover from 1997 Asian financial crisis
Difficult to enforce and might result in black market for foreign exchange
Works best in communist countries because government monopolises money conversion
Others: embargo, trade agreements, international cartels New protectionist measure: technical specifications
and standards which discriminate in favour of domestic producers
Administrative regulations regarding import procedures to delay and reduce volume of imports
Voluntary export restraints (VER): exporting country voluntarily reduces its exports under threats of all-round trade restrictions eg. US automobile industry vs. Japan’s

106
3. Arguments for Protectionism Economic
Protect infant industry eg. Singapore had protective duties covering ~300 items in 1960s Difficult to identify currently unprofitable industries
that might acquire comparative advantage in the long run
Difficult to decide when industry can be independent of protection
Encourage inefficiency Reduce BOP deficits
Dependent on PED of imports and exports Need to look at root causes Invite retaliation – reduced exports – reduced total
volume of world trade Prevent unfair trade practices
Dumping – distorts market – justifiable If consumers benefit in the long run from lower
import prices – not justified Diversify economic structure
May not support theory of comparative advantage Pattern of comparative advantage can change over
time naturally (discovery of new raw materials) / through deliberate policies
Protect mature industries Trade unions Misuse of resources since protectionism will not
increase total employment Retaliation
Protect against low-wage foreign labour Rejection of theory of comparative advantage Could shut down industries and divert resources to
more productive ones

107
Consumers denied opportunity to buy from cheaper source – benefits of trade lost
Increase domestic production: counter-cyclical measure Increase government revenue
To be effective, should be imposed on goods which are price inelastic
Retaliation Retaliation
Unhealthy for word trade and ineffective Distort and reduce differences in comparative
advantage Welfare loss Misallocation of resources: firms unnecessarily
retained Difficult to remove protectionist measures once in
place Other industries may demand for protectionism Better alternative: stimulate export competitiveness
by increasing AS Political
Essential to produce on military weapons in case of crisis – subsidies industry to ensure continuous supply eg. US 1980s semiconductor industry for high-tech weaponry vs. Japan’s
Nation poorer but value of national security higher Trade as weapon of foreign policy eg Gulf war: US
imposed trade sanctions against Iraq Social
Subsidise agricultural sector to avoid further depletion of population in rural areas / prevent further rural-urban migration to overpopulated cities
Restrict import of harmful goods
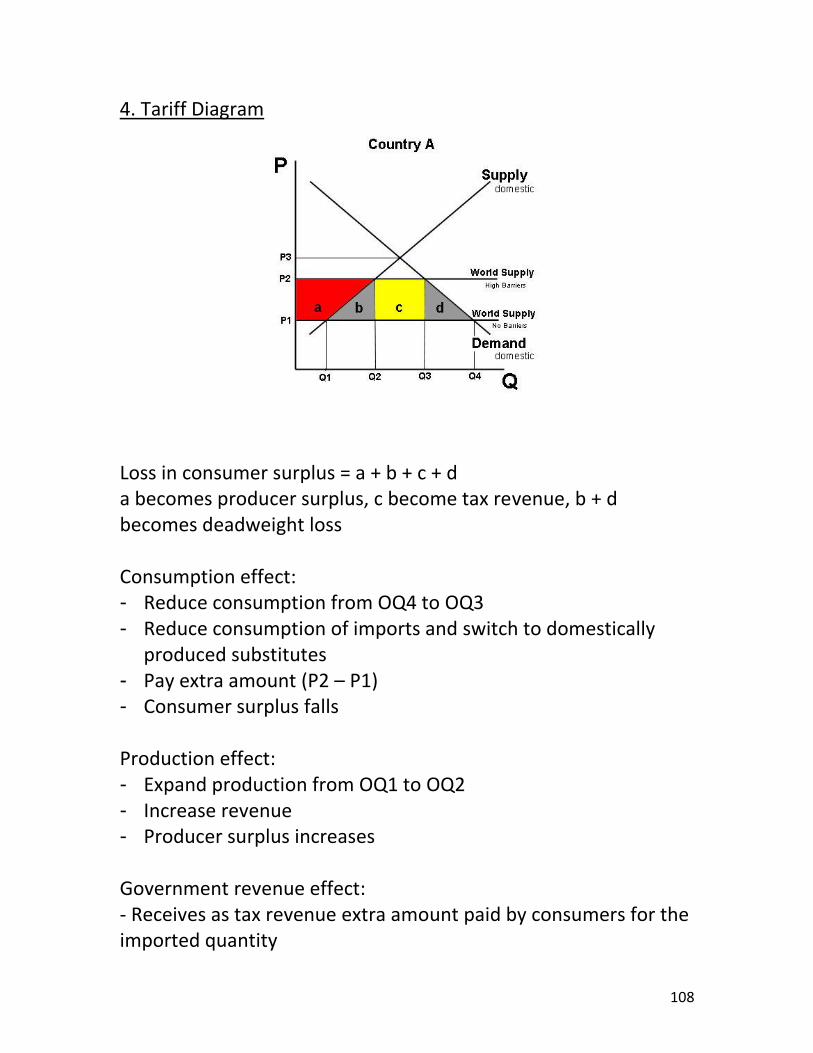
108
4. Tariff Diagram Loss in consumer surplus = a + b + c + d a becomes producer surplus, c become tax revenue, b + d becomes deadweight loss Consumption effect: - Reduce consumption from OQ4 to OQ3 - Reduce consumption of imports and switch to domestically
produced substitutes - Pay extra amount (P2 – P1) - Consumer surplus falls Production effect: - Expand production from OQ1 to OQ2 - Increase revenue - Producer surplus increases Government revenue effect: - Receives as tax revenue extra amount paid by consumers for the imported quantity

109
Explain the theory of comparative advantage. [10m] Introduction Comparative advantage: specialize based on lower opportunity
cost – less of the other good foregone Body Assumptions: 2 countries 2 goods, no transport costs, constant
returns to scale: LRAC remains constant Assume USA and China each has 20 units of resources, initially use 10 units to produce each good Table 1: Before specialization
Cars Textiles Opportunity Cost
USA 100 60 1C: 0.6T China 5 10 1C: 2T
Total 105 70
USA: CA in production of cars – give up less textile China: CA in textile – give up less cars USA devotes 1/10 more to car, China complete specialization. Table 2: After specialization
Cars Textiles
USA 110 54
China 0 20
Total 110 74
World output increases

110
Terms of trade: mutually beneficial 0.6T < 1C <2T – 1C traded for 1T USA exports 10 cars, gets 10 textiles Table 3: After trade
Cars Textiles
USA 100 64
China 10 10
Total 110 75
Gains from trade: higher level of consumption Conclusion Comparative advantage – gains from trade, more choices,
increase growth Limitations of CA: relax assumptions

111
To what extent does the theory of comparative advantage explain the pattern of trade between Singapore and the rest of the world? [15m] Introduction Singapore’s constraints – lack of natural resources; small
geographical size and population – human capital our only resource
Singapore’s relative strengths – good geographical location Our constraints and strengths determine where our CA lies Pattern of trade: type of exports and imports of goods and
services Body A) Yes Type of exports
CA
1970s Textiles and simple manufactured products
Labour-intensive industries: Cheap, unskilled and surplus labour
1980s Move towards higher-end products and electronic products; moving towards services like banking and finance, tourism
Capital-intensive industries: More educated workforce and improved technology Loss of CA in labour-intensive industries to countries like Malaysia and Indonesia which have huge labour force
1990s and
Electronics, pharmaceuticals,
High value-added, knowledge-intensive,
112
beyond telecommunication equipment, disk drives, integrated circuits Services: banking and finance, tourism, educational hub, medical hub
technology-intensive industries: Highly qualified labour force, r+d infrastructure Continue to lose CA in manufacturing industries to countries like China and India
Type of imports
Lack of CA
Imports: consumer items, food, raw materials, capital goods for development and infrastructure building
Lack of natural resources especially lack of land for agriculture and to support huge export base

113
B) No, there are other factors Trade based on world demand
CA only gives rationale for trade but countries try to augment and develop CA in industries with world demand
For country to develop and provide opportunities for its population of diverse talents, needs to have spectrum of industries
Diversification to reduce negative consequences of over-dependence
Desire not to rely on foreign supplier for essential goods National pride / security eg. Newater Re-exports

114
Discuss whether protection offers any advantages over specialization. [13m] Introduction Protectionist measures Advantages of specialization based on CA: gains from trade,
increase X – economic growth, wider choice, EOS – fall in LRAC – competitive prices, efficiency in resource allocation in the world, welfare gain if world price cheaper than domestic price
Body Infant industries
Rationale: NIE, reasons of economic diversification – impose quotas / tariffs – allow new industries to grow and develop EOS
SR implications: applies for all reasons to protect as long as use quotas / tariffs Society: DWL Consumers: increase price Other firms (some extent): increase COP if good
protected is important input eg. steel LR implications
Grow – enjoy EOS – lower LRAC – lower price of exports – able to compete internationally – BOT improves if demand is price elastic – increase in total revenue from exports – increase exports – increase NY/N
If do not grow If government subsidizing – waste of resources –
could have been used elsewhere – education / healthcare / develop infrastructure
Consumers and society continue to suffer from inefficiency – higher prices

115
Shut down – massive retrenchment Summation: To the extent that infant industries grow.
However, the infant industries normally do not grow and may become inefficient due to government subsidies. Protectionism cannot be long term.
Inefficient industries Eg. US steel industry, textile: ‘slap’ tariffs / quotas on
Chinese textiles / imported steel – allow inefficient firms to eventually be able to be more efficient – develop new technology / adjust cost structures
Eg. steel – affects COP in many other industries eg. housing, cars – cost-push inflation – affects domestic market and erodes export competitiveness
Summation: protect jobs in inefficient industries but more jobs lost elsewhere eg. car industry
Alternative solution: develop CA in new industries: capital-intensive, technology-intensive, services, training

116
Dumping Foreign country selling goods below its actual COP – local
firms driven out – eventually foreign country gains monopoly power
Difficult to ascertain if it is dumping / country really has CA in production of these goods – Chinese textile + abundance of cheap labour
Could be baseless accusation Solution: force firms to be more cost-efficient (don’t
protect), training (subsidise firms for training), subsidise r+d
Economic diversification Reduce over-dependence on a few key products /
industries Eg. Zambia: copper exports – what if world demand falls
Balance of trade deficit – value of imports > value of exports Eg. US huge trade deficit – USA consumes a lot, including
on imports – breed further inefficiency Alternative solution: increase interest rates – encourage
people to save + discourage consumption LR: high C – low S – low investment – affects productive
capacity – low LRAS (inefficiency) National security
Eg. steel – war weapons Conclusion If country protects, other countries retaliate – world
inefficiency

117
Explain the rationale for free trade and discuss the extent to which FTAs are beneficial. [25m] Introduction Free trade – based on CA – lower opportunity cost ratio – gains
from trade FTA – remove tariff and non-tariff barriers – in theory – in
practice eg Singapore’s FTAs – also include investment Development A) Expounding theory of CA – difference in factor endowments Assumptions 3 tables Summation: gains from trade, increase choice / increase
society’s welfare, increase economic growth and SOL B) Are FTAs beneficial On trade
Increase X – k – increase NY / N – associated benefit of large-scale production – EOS – fall in LRAC – able to price goods more competitively – may improve BOT
Singapore: small domestic market China: may not be as dependent on X revenue because
people are getting more affluent. C increase can sustain itself based on internal economy
Cambodia / Vietnam: NIEs because people are poor But increase X – demand-pull inflation when near / at FE –
price of exports increase – volume of exports – may affect BOT – NY falls affects economic growth
Inflation Access to cheaper consumer goods + raw materials /
inputs – fall in COP – fall in price of exports – X increase – may increase BOT

118
Fall in COL – extra savings can be used to buy domestic goods – increase C / NY
Price of consumer goods
Quantity of consumer goods
Sdom
Ddom
Pw
P c
10 0 30 50
a b

119
a+b = welfare gain a: production effect, inefficient domestic firms forced to
reduce output from 30 to 10 b: consumption effect: increase C from 30 to 50 From diagram, firms forced to be more cost-efficient – cut
costs in order for profits not to be eroded since P is at Pw Trade creation / diversion
Creation: increase volume of trade – from high-cost producer to low-cost producer – increase welfare of people
Diversion: from low-cost non-member to high-cost member – away from optimum allocation of resources
Draw diagram to illustrate effects Jobs: increase in X – increase N
But loss of CA – forced to restructure – move towards CA – structural unemployment
Outsourcing – firms benefit by relocating – increase BOT – increase GNP
But cost jobs in previous country On FDI
Outward investment to China from Singapore Increase investment – increase productive capacity –
increase AS Increase investment – increase AD – increase N / NY Transfer of technology Useful for NIEs – lack wealth / local entrepreneurs eg.
Singapore depends on MNCs But footloose But local firms cannot compete
Others Vulnerability to external shocks due to over-dependence
– recession / imported inflation
120
Interdependence: economies become intertwined eg. USA recession – Singapore recession, worldwide food prices increase
Conclusion Possibility of unequal gains
Singapore More ST capital outflow to China but LT profits –
increase GNP Loss of jobs as companies go to China Shifted focus to capital-intensive / technology-
intensive – focus on services Gain – education: Chinese students come here to
study

121
USA USA spend a lot because lost CA in lots of goods –
need to buy more imports – worsen trade deficit – less savings – less investment – reduced productive capacity
India Demand for capital goods
Summation FTA: macroobjective – increase NY – increase SOL, fall in
price – increase BOT Trade creation > trade diversion
*FTA means freer trade – no restrictions among countries vs. free trade, so arguments similar, only difference is trade creation / diversion

122
To what extent can economies benefit from globalisation? [25m] Introduction Globalisation – free movement of goods and services, capital,
labour Economic integration: FTA, customs union Development A) Goods and services Trade based on CA – gains + EOS Poor – NIEs + Singapore (small domestic market) – increase X –
increase NY / N – increase SOL Access to cheaper goods
Consumer goods – lower COL Raw materials – Singapore / Hong Kong Capital goods for infrastructure – Cambodia / Vietnam –
increase societal welfare + potential growth Draw in free trade diagram and illustrate gains Trade diversion vs. trade creation: diagram Loss of CA eg. USA steel and textile industry, Europe car
industry – but restructure and move towards new CA Inter-dependency eg. USA affect China / India Over-dependency due to CA and complete specialization –
that’s why countries tend to partially specialize / diversify their economies
Effect on prices – imported inflation Tariffs due to protectionism: draw in diagram B) Capital (associated technology) – FDI (inward and outward) Receiving country
Increase inward investment – increase AS / AD – increase NY / N
Growth of local supporting industries

123
Transfer of technology Footloose – may cause massive retrenchment if suddenly
leaves Local industries cannot compete – lack of SMEs
Source country SR: loss of jobs SR: outflow of capital LR: restructuring LR: More companies internationally – increase GNP LR: Create jobs

124
C) Labour For LDCs, provide jobs for labour – cheap
May be SR exploitation – but vs. no jobs Eg. Vietnam – inflation ~19% - lower income wage rise <
price rise Free flow of labour – influx of foreign workers – depress wages
in jobs where supply elastic (abundant supply of manual workers) – no skills Eg. Singapore / EU – influx of workers into UK Solution: provide training Brain drain
Inequity issue Manual workers wages fall Skills demanded globally – increase demand for work –
increase wages for skilled jobs Dual economy
Caters to international market – people grow richer Caters to domestic market – people do not really
get richer
125
Discuss the opportunities and threats of globalisation for Singapore and other Asian economies. [12m] Globalisation: high degree of freedom of movement of goods and services (trade), capital, technology (MNCs) and talent (labour) 1) Globalisation and free trade Opportunities
Export revenue and higher rate of economic growth Increase in X – k – increase N / NY Increase M of capital goods / raw materials eg. Vietnam /
Cambodia / Singapore Threats
Competition causes countries to lose CA Singapore lost CA in labour-intensive industries in
mid-80s to NIEs like China and Indonesia SR: structural unemployment LR: efforts may pay off if country realizes CA in new
industries Singapore shifted to capital-intensive then
knowledge-intensive Specialisation and over-dependency on few major
products If some countries adopt protectionist measures,
trading partners could be adversely affected Interdependency of countries
Economies of major trading partners take a slide, countries will be affected eg. 911, US recession
2) Presence of MNCs and out-sourcing Opportunities
Influx of MNCs in Asian countries helped their economies grow

126
Creation of jobs and contribution to GDP Transfer of technical know-how
Outsourcing eg. UK IT companies phone service operations to India
Threats Fear of over-dependency: MNCs footloose – if pull out,
adverse effect on jobs and economic growth Dearth of local firms
3) Influx of talent Increase quantity of resources – shift PPC outwards But cheap foreign labour – wages in city fall – lower income
127
Consider the effects, other than on the general price level, of Singapore’s changing tax structure. A) Inflation Effect of increased reliance on indirect taxes – definite inflation
– shift in SRAS Increase indirect taxes – increase COP for all firms – fall in
AS – fall in NY (contractionary) + rise in GPL – cost-push inflation – BOT may worsen (depending on PED)
Effect of decreased reliance on direct taxes – may or may not have inflation – shift in LRAS and AD Fall in direct taxes – C/I increase – AD increase – NY
increase (growth) / N increase – if near / at FE: demand-pull inflation (a little may be desirable because increase output) – BOT worsen (depending on PED)
Lower income taxes – income / substitution effect – may increase incentive to work – increase AS – increase NY – fall in GPL – BOT improves
Lower corporate taxes – increase I – increase NY – fall in GPL – BOT improves
Singapore: keep / attract talent – increase efficiency Attract MNCS – increase FDI – increase AD (increase N) and
increase AS (increase productive capacity) B) Equity Income taxes (direct) – progressive – higher the income, the
higher the percentage to tax – reduce income gap Indirect taxes – regressive – lower the income, the higher
percentage to tax – increase income gap – affects poor more Cost-push inflation – increase COL – affects poor more Lower direct taxes – increase income gap because rich pay
proportionately less (usually reduce the percentage tax of rich more)
128
Corporate taxes fixed at 18%: neither progressive or regressive C) Tax base Increase indirect taxes – widens tax base – better to rely on
due to ageing population – increase number of dependants / decrease in size of labour force
Decrease direct taxes: on working population and firms D) Ability to evade Indirect taxes: difficult to evade Direct taxes: can evade but not in Singapore (jailed) – can
under-declare

129
Policies to remedy Singapore’s recession Recession in Singapore: externally induced: fall in X 1. Fiscal Policy Increase G to reduce business costs + training – need to
subsidise firms and training grants Fall in COP + increase productivity – increase LRAS – fall in
GPL – price of exports fall – volume of exports increase Evaluation: buy only if they recover from recession
But increase G to boost increase in NY limited effect in Singapore Small k – need huge increase in G Prudent
Why not increase G on public works Limited land
2. Monetary Policy Why not policies to directly increase X with exchange rate
management Short run solution: depreciation of S$ - price of exports
fall in foreign dollars – volume of X increase Government prefers soft option Price of imports increase in S$ - import all raw materials –
COP increase – goods more expensive Long term policy stance: gradual and modest appreciation of S$
- price of imports lower for S$ - import raw materials more cheaply – COP falls – prices more competitive Modest: small increments – export competitiveness not
drastically eroded in the immediate period Gradual: firms can have time to adjust their cost
structures – find ways to be more cost-efficient Deals with cost-push inflation

130
3. Other Ways Explore new markets through trade missions and signing of
FTAs – reduce over dependence on a few trading partner Long term measure Conclusion Fall in X is beyond our control Measures can only be long run or interim ones

131
Evaluate methods the Malaysian government might use to slow down import growth and increase new export business. A. Slow down import growth Devaluation – weaken ringgit
Price of exports fall in foreign currency – volume of exports increase – total revenue from exports increase
Price of imports in ringgit increase – volume of imports fall – total expenditure on imports fall
BOT improves Depends on price elasticity of demand for X and M –
Malaysia demand for imports of capital goods could be price inelastic – COP rises
Can only be short term if Malaysia needs to import capital goods and raw materials
Persistent devaluation can lead to loss of confidence in economy
Tariff – tax on imports – price of imports rise – volume of imports fall – total expenditure on imports fall Increase in COL Deadweight loss to society Retaliation
Contractionary policies: interest rate rise – investment and consumption falls – AD falls – k – fall in NY – fall in demand for imports Malaysia may have small multiplier Malaysian firms may want to buy capital goods Malaysia still developing, cannot afford to have fall in rate
of growth Use only if overheating
B. Increase new export business Subsidies to export firms

132
COP falls – increase AS – GPL falls – price of exports fall Inefficiency, burden on government and taxpayers
FTA / Trade missions to new countries – increase X – k – increase NY Reduce over dependence on just a few major trading
partners Takes time – long term Firms may not want to take the risk – uncharted territory
– businessmen may be risk averse Supply-side
Education and training – increase productivity – increase LRAS – fall in GPL – price of exports fall
Best measure, yield results in the long run

133
“To be considered successful, an economy needs to achieve low unemployment, low inflation and stable economic growth.” How far DYA with the statement? [12m] Anti-thesis Healthy BOPs – especially open economy – macro objective Equity in distribution – micro objective Efficiency in resource allocation – micro objective “To be considered successful, an economy needs to achieve low unemployment, low inflation and stable economic growth.” Explain this statement. [12m] A) Low unemployment – success [any 2 well-discussed] Maximise use of resources – reduces loss of potential output
due to unemployment Burden on government
Less tax revenue collected More unemployment benefits Increase budget deficit, opportunity cost – less for other
areas – healthcare, education Singapore: GST offset package, growth dividends,
Singapore shares, one-off rebates Low unemployment – people have jobs – higher C – fuels
growth Social problems – crime rates – social unrest – loss of man
hours + deters investment (confidence) B) Low inflation – success [internal and external] Internal: stimulates output, induces confidence, increase
investment due to certainty, increase FDI, encourages savings – increase investment in the long run
External: BOT improves [PED]

134
C) Stable economic growth – success [any 2 well-discussed] Sustained growth: actual and potential growth: increase AD
and As – continual increase in SOL Confidence – increase investment + FDI – good macroeconomic
management of government Why unstable growth undesirable
AD keeps increase may cause overheating – demand –pull inflation – increase COL + affects BOT – instability
If economy lapses into recession: negative growth – hardship – fall in SOL
Conclusion Brief mention of other criteria for success Conflict between growth and inflation: relentlessly pursues
growth – demand-pull inflation: stable growth vs low inflation Which criteria most important: low inflation – price stability –
Singapore

135
Discuss whether fiscal policy is the most effective way for Singapore to sustain a successful economy. [13m] Introduction Sustainable + stable growth + low inflation – one of the keys to
sustainable growth Development A) How FP works to attain growth Increase G + decrease T – increase AD – k – increase NY K brief + diagram Evaluation
Size of k – small k – huge leakages – high savings / M – need huge increase in G – prudent: budget surplus
Small C / I by domestic firms – need export revenue – policies should target X
Crowding out: increase G financed by borrowing from public – increase interest rate – crowd out C/I/X May not need to borrow – huge reserves – reserves
can be depleted More concerned about fall in X
Time lag: recognition, implementation, response Small – shorter time lag
Taxes – unpredictable effect on C/I – k works only on the extra disposable income that is spent Expectations: pessimism / optimism Fall in direct taxes – rely more on indirect taxes
(GST) (increase COL) – regressive – increase income gap
B) Summation: FP in Singapore – limited role

136
If economy weakens (fall in GDP) – usually due to external factors like fall in X eg. 911 US recession – policies should target X
Policy exchange rate management – sustainable growth Gradual and modest appreciation of S$ Price of imports fall in S$ - check imported inflation (low
inflation) + Singapore depends a lot on imported raw materials – lower COP – LT able to price competitively – stable growth – BOT increase (PED)
Price of X increases in immediate period Gradual: Singapore firms to find other ways to reduce
cost Modest: not to totally erode export competitiveness
Supply-side policy: education and training, welfare benefits, taxation incentives
Conclusion FP in Singapore limited effect on Ad, serves as supply-side
measure to increase NY over long term + exchange rate management – to boost long term export competitiveness
137
In the fourth quarter of 2004, Singapore’s unemployment rate rose to 3.7%. Discuss whether supply-side policies are the best way of achieving full employment in Singapore. [25m] Introduction Full employment: natural (frictional) rate of unemployment
(some structural) Cause for concern (very briefly): if structural severe, if cyclical Development A) Supply-side Education and training – Budget 08
Schools and vocational institutes gear Singapore workers for the challenges of new economy – grants, scholarships, places in university – focus: biomedical – increase employability
Subsidise firms for workers training – Skills Development Fund – upgrade skills – reduce structural unemployment
Life-long learning – knowledge can become obselete – constant upgrading of skills – reduces prospect of being structurally unemployed
Long term and may not yield results Increase employability and attracts MNCs
Welfare benefits Singapore no unemployment benefits – reduce frictional
unemployment Forced to upgrade skills – reduce structural
unemployment Reduce power of trade unions
NTUC: government body – harmonious relations – no labour unrest: attracts investment (FDI)
NWC: wage recommendations – wage increase < productivity increase – keep COP low

138
Increase employability of workers B) Policies to deal with cyclical unemployment: fall in AD Supply-side – structural, cannot solve cyclical FP: increase G, decrease T but small k, external factors Exchange rate management
Recession due to fall in X: depreciation / appreciation Depreciation: price of exports fall – immediate solution
but Singapore cannot afford to – price of imports increase – COP increase – later price of exports increase (growth cannot sustain)
Singapore’s choice: gradual and modest appreciation (long term solution)
Conclusion Increase G on education and training + taxation incentives –
supply-side policies – effect on AD and some effect on cyclical unemployment – limited role in Singapore due to small k

139
Why Singapore does not use interest rate policy Very dependent on overseas funds – small Eg. if Singapore’s interest rate falls to curb recession – ‘hot’
money outflow - $ in Singapore banks fall – MS falls – interest rate increase – no control
Discuss interest rate only if not Singapore Problems with exchange rate instability Exchange rates determined by Trade and investment between trading partners Speculation Government management / manipulation of exchange rate eg.
buy US bonds to keep USD up 1) Trade Affects business planning: need for certainty to forecast profits Eg. If S$ depreciates
Price of Singapore exports fall in foreign currency – volume of exports increase
Price of imports increase in S$: dependent on raw materials (same for developing countries which need capital goods)
Eg. If S$ appreciates – price of exports increase in foreign currency – affects export earnings
2) Investment Persistent depreciation – loss of confidence in economy – fall in
investment 3) Developing countries Foreign loans in US$ denomination – if your currency
depreciates – pay back more in your country’s $