economies of scale
DESCRIPTION
Economies of scale. Average total costs changes as the output of a firm changes Increasing, decreasing or constant economies of scale. Short run cost curve (SRATC) Long run cost curve (LRATC). Constant economies of scale. Cost. SRATC 1. SRATC 2. LRATC. Q 2. Q. Q 1. - PowerPoint PPT PresentationTRANSCRIPT

Economies of scaleEconomies of scale
Average total costs changes as Average total costs changes as the output of a firm changesthe output of a firm changes
Increasing, decreasing or Increasing, decreasing or constant economies of scale.constant economies of scale.
Short run cost curve (SRATC)Short run cost curve (SRATC) Long run cost curve (LRATC)Long run cost curve (LRATC)

Constant economies of scaleConstant economies of scale
LRATC
SRATC1 SRATC2
Q
Cost
Q1Q2

Increasing economies of scaleIncreasing economies of scale
SRATC1
SRATC2
Q
Cost
LRATC
Q2Q1

Decreasing economies of scaleDecreasing economies of scale
SRATC1
SRATC2
Q
Cost
LRATC
Q1 Q2

US Pork Sector Study US Pork Sector Study Financial results for 2000Financial results for 2000
Net ProfitNet Profit BreakevenBreakeven Net LossNet Loss
1-21-2 65%65% 24%24% 11%11%2-32-3 77%77% 15%15% 8%8%3-53-5 79%79% 16%16% 5%5%5-105-10 78%78% 13%13% 9%9%10-5010-50 77%77% 12%12% 11%11%50-50050-500 90%90% 5%5% 5%5%500+500+ 95%95% 5%5% 0%0%

US Pork Sector StudyUS Pork Sector StudyStay in price until 2003 (%)Stay in price until 2003 (%)
1000 hd1000 hd $36$36 $39$39 $42$42 $45$45 $48$481-21-2 1616 3636 6969 8686 90902-32-3 1818 4242 7171 8787 97973-53-5 1818 3939 7070 9090 94945-105-10 1616 3939 7575 9292 989810-5010-50 2222 4949 7474 9191 969650-50050-500 44 6161 8888 9797 9999500+500+ 2828 5050 8989 9494 100100

Processing cost curvesProcessing cost curves
Specialized plantsSpecialized plants
High fixed costHigh fixed cost
SRATC
Q
Cost
So what???So what???
Short run price implicationsShort run price implications Supply chain managementSupply chain management Open market or contractOpen market or contract
• Packing plantsPacking plants• Ethanol plantsEthanol plants• Soybean processingSoybean processing• BiodieselBiodiesel

Weekly Prices and Slaughter, 1998-99
1.2
1.4
1.6
1.8
2.0
2.2
1 14 27 40 53 66 79 92 105
$10
$15
$20
$25
$30
$35
$40
$45Price
Slaughter
Million

Externalities and cost curvesExternalities and cost curves
Q
CostCost curve exhibiting increasing economies of scale

Externalities and cost curvesExternalities and cost curves
Cost curve with external cost internalized to the firm
Cost
Q

Supply and Demand summarySupply and Demand summary
Demand originates with Demand originates with individual consumer’s utility and individual consumer’s utility and budget constraintbudget constraint
Supply originates with individual Supply originates with individual firm’s marginal cost curvefirm’s marginal cost curve

Consumption is not demandConsumption is not demand
Consumption =Consumption =• Beginning stocks + production + Beginning stocks + production +
importsimports• – – exports – ending stocksexports – ending stocks• Government reports of inventoryGovernment reports of inventory
Per capita consumption =Per capita consumption =• consumption / populationconsumption / population

Percapita Boneless Meat Consumption
0
10
20
30
40
50
60
70
80
90
100
1970 1975 1980 1985 1990 1995 2000
Beef Pork Poultry

Equilibrium P and QEquilibrium P and Q
Q
P S
D
Qe
Pe
Equilibrium price is where Qs = Qd.

Supply and Demand AnalysisSupply and Demand Analysis
Pe
Qe

Price elasticityPrice elasticity
A measure of responsiveness of A measure of responsiveness of the quantity supplied or the quantity supplied or demanded to changes in prices.demanded to changes in prices.
Percentage change in quantity Percentage change in quantity for a 1% change in price.for a 1% change in price.
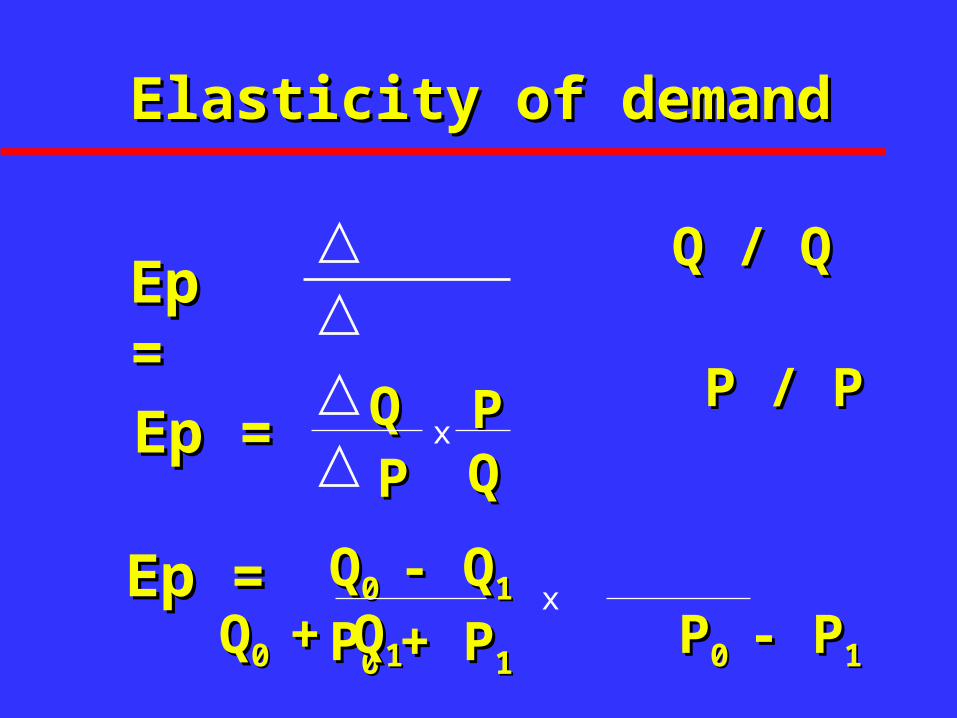
Elasticity of demandElasticity of demand
Q / Q Q / Q
P / PP / PEp =Ep =
Ep =Ep = QQ
PPPPQQ
x
Ep =Ep = QQ0 0 - Q- Q1 1 P P0 0 + P+ P11
QQ0 0 + Q+ Q1 1 P P0 0 - P- P11
x

Price elasticity and curvesPrice elasticity and curves
Ep changes along a sloping Ep changes along a sloping demand or supply curvedemand or supply curve
Special exceptionsSpecial exceptions

Relative measuresRelative measures
|Ep| > 1 elastic|Ep| > 1 elastic |Ep| = 1 unitary elastic|Ep| = 1 unitary elastic |Ep| < 1 inelastic|Ep| < 1 inelastic

Price elasticity & total revenuePrice elasticity & total revenue
TR = P x QTR = P x QElastic demandElastic demand
• P and TR inversely relatedP and TR inversely related
Inelastic demandInelastic demand• P and TR directly relatedP and TR directly related

Price elasticity & total revenuePrice elasticity & total revenue
PP
Elastic
Inelastic

So what????So what????
PP
QQ6 10
20
6055
7 11
15
Where are you on the demand curve?

Income elasticityIncome elasticity
Percentage change in quantity Percentage change in quantity for a 1% change in incomefor a 1% change in income
Positive for most food itemsPositive for most food itemsRelatively small i.e., 0.2Relatively small i.e., 0.2
Ei =Ei = QQ
IIIIQQ
x

Cross-price elasticityCross-price elasticity
Percentage change in quantity for a 1% Percentage change in quantity for a 1% change in price of a substitute or change in price of a substitute or complementcomplement
Positive or negativePositive or negative Much smaller than EpMuch smaller than Ep
EpEpjj = =QQkk
PPjj
PPjj QQkk
x

Examples of Ag elasticitiesExamples of Ag elasticities
EpEp EiEiBeefBeef -.62-.62 .45.45PorkPork -.73-.73 .44.44ChickenChicken -.53-.53 .36.36MilkMilk -.26-.26 -.22-.22GrapesGrapes -1.38-1.38 .44.44LettuceLettuce -.14-.14 .23.23
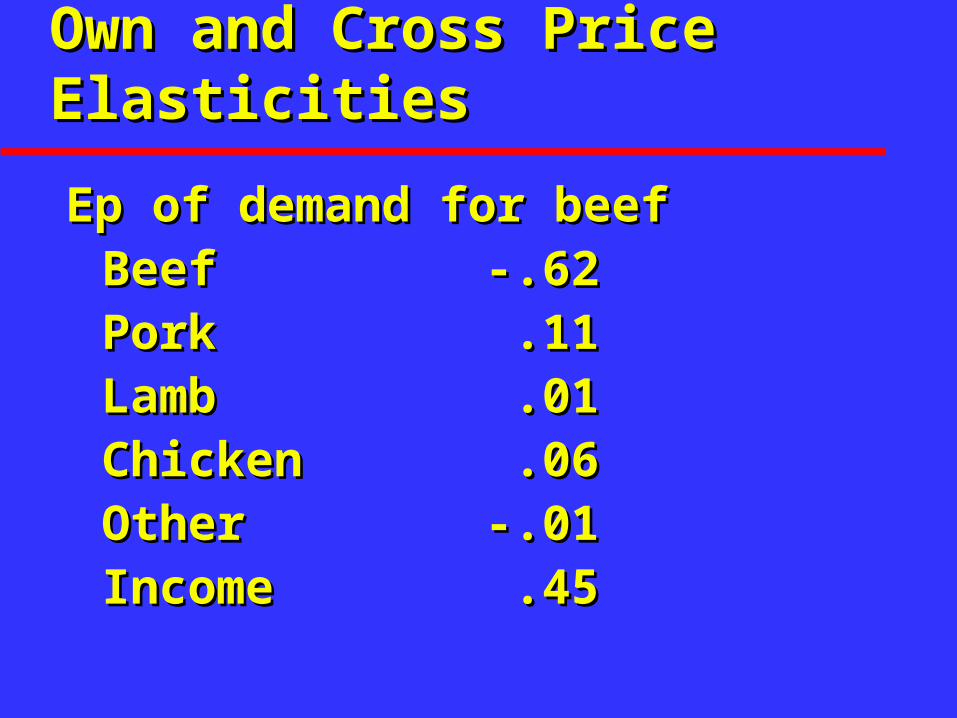
Own and Cross Price ElasticitiesOwn and Cross Price Elasticities
Ep of demand for beefEp of demand for beefBeefBeef -.62-.62PorkPork .11 .11LambLamb .01 .01ChickenChicken .06 .06OtherOther -.01-.01IncomeIncome .45 .45

Net change in quantityNet change in quantity
Net effect of changes in own Net effect of changes in own price, cross price, and income price, cross price, and income multiplied by the appropriate multiplied by the appropriate elasticities.elasticities.
Addresses the fact that Addresses the fact that not all not all else is equal. else is equal.

Elasticities at various marketsElasticities at various markets
The greater the number of The greater the number of substitutes the more elastic the substitutes the more elastic the demand.demand.
For a given Q, look at % PFor a given Q, look at % PMore elastic at retail levelMore elastic at retail level

Elasticities at market levelsElasticities at market levels
P
Q
All food All meat All beef
All T-bone
Hy-Vee T-bone
Hy-Vee T-bone in Ames

Derived DemandDerived Demand
The demand for inputs that are The demand for inputs that are used to produce the final used to produce the final products.products.
Examples:Examples:• Flour => wheatFlour => wheat• Soybean meal => soybeansSoybean meal => soybeans• Fed cattle => feeder cattleFed cattle => feeder cattle

Derived DemandDerived Demand
P
Q
Retail pork chop demand
Wholesale pork demand
Farm level demand for hogs
Demand for corn to feed hogs
Demand for inputs to produce corn

Elasticities at retail and farmElasticities at retail and farm
S
DRetail = Primary
P
Q
PR
Qe
DFarm = Derived
PF
M
Dd = f (Dd, M)

Elasticity SummaryElasticity Summary
Relationship between Q and PRelationship between Q and PChanges along demand curveChanges along demand curveElasticity and total revenueElasticity and total revenueCross-price and income elasticitiesCross-price and income elasticitiesRelative sizeRelative size
• Own, cross, and incomeOwn, cross, and income• Farm v. retailFarm v. retail