economics what does it mean to me? part ii: scarcityscarcity opportunity costopportunity cost supply...
TRANSCRIPT
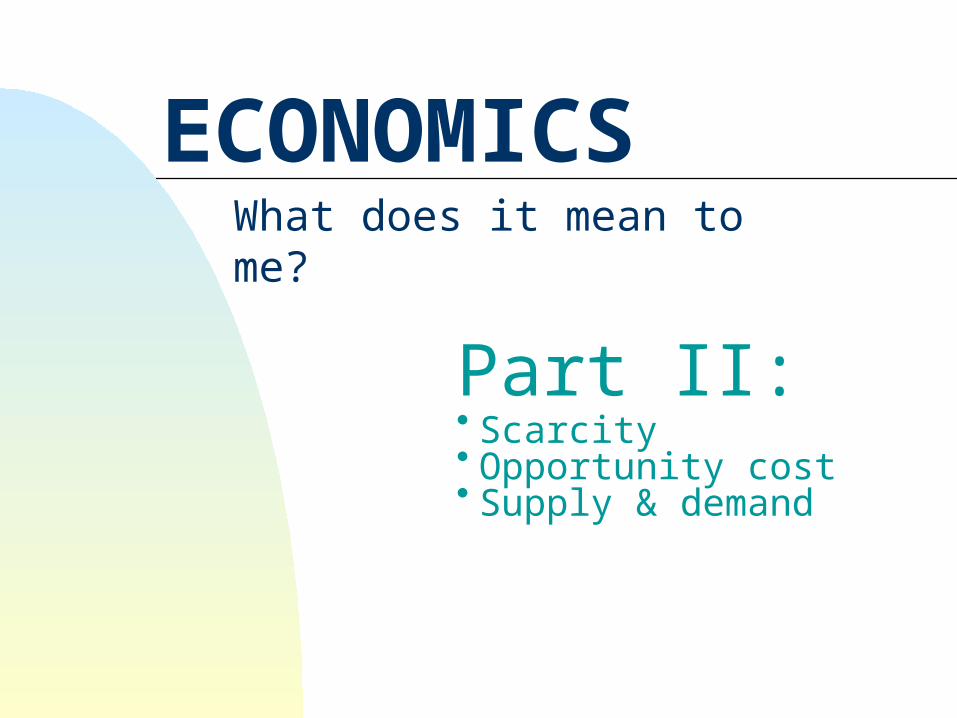
ECONOMICSWhat does it mean to me?
Part II:• Scarcity• Opportunity cost• Supply & demand
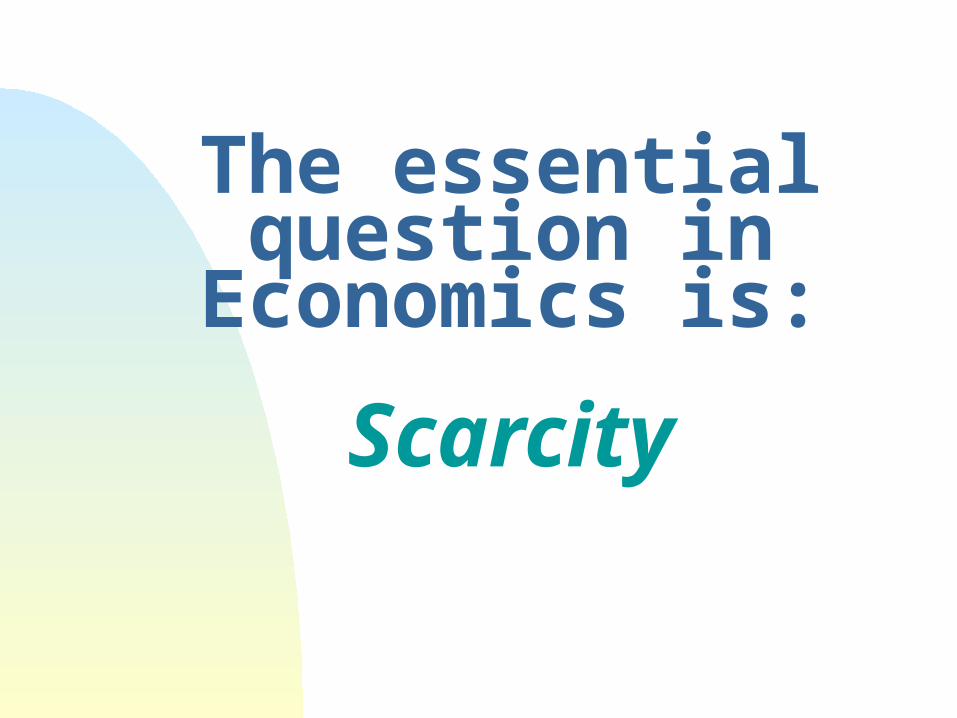
The essential question in
Economics is:
Scarcity
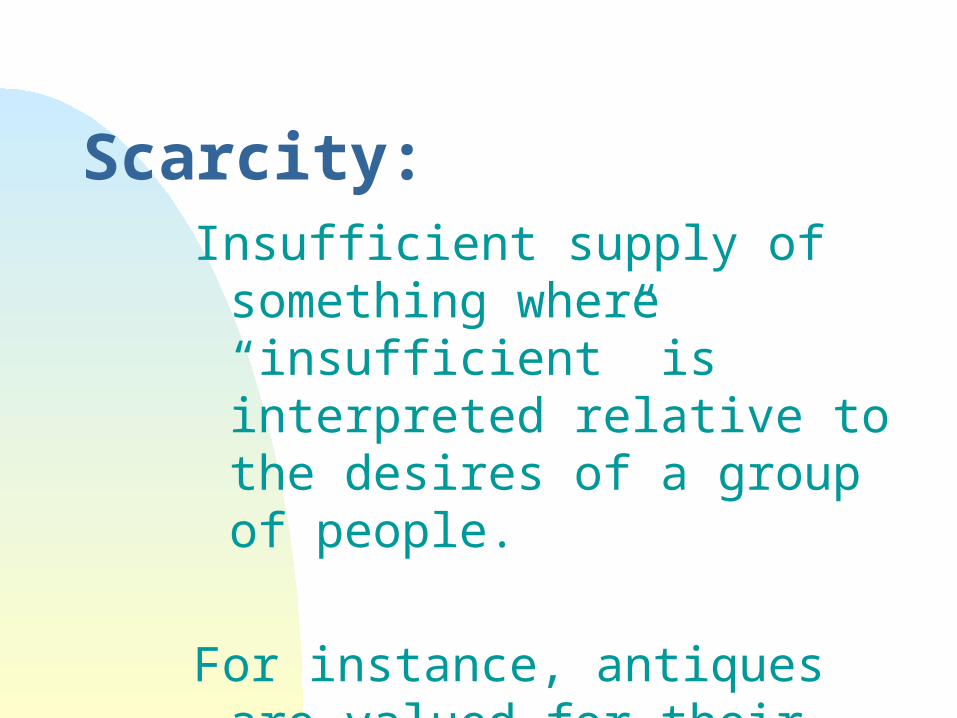
Scarcity:Insufficient supply of something
where “insufficient” is interpreted relative to the desires of a group of people.
For instance, antiques are valued for their scarcity….
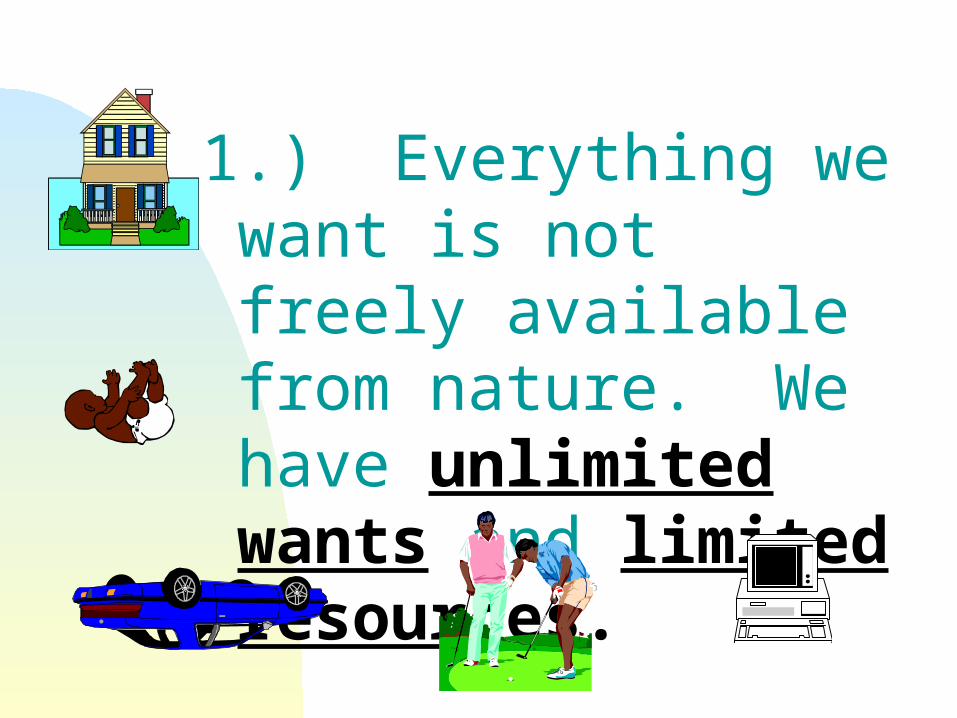
1.) Everything we want is not freely available from nature. We have unlimited wants and limited resources.
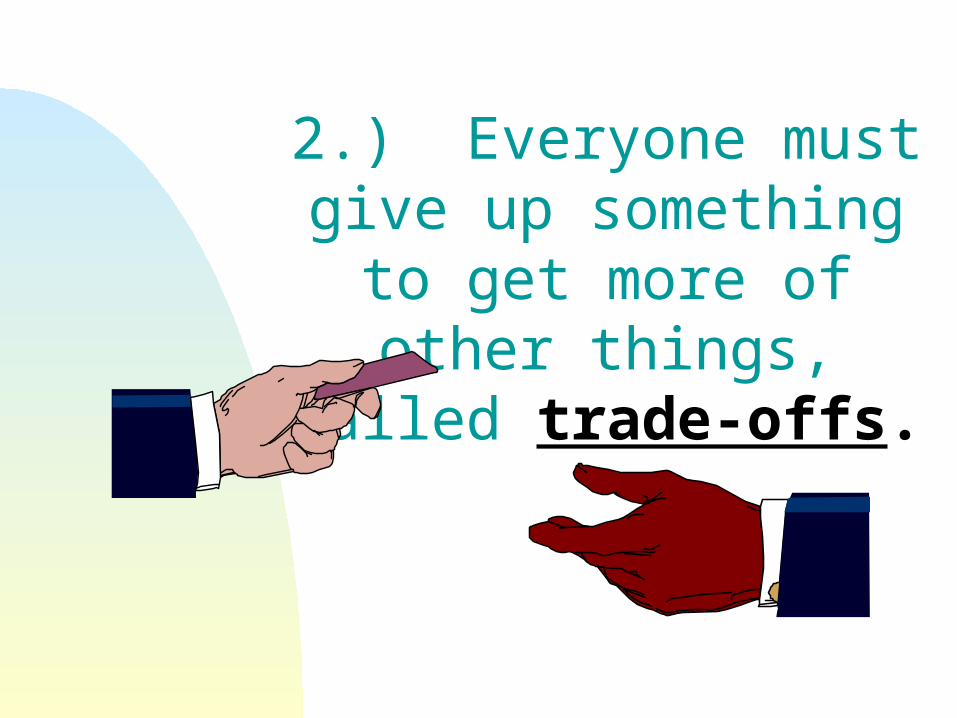
2.) Everyone must give up something to get more of other things, called trade-
offs.
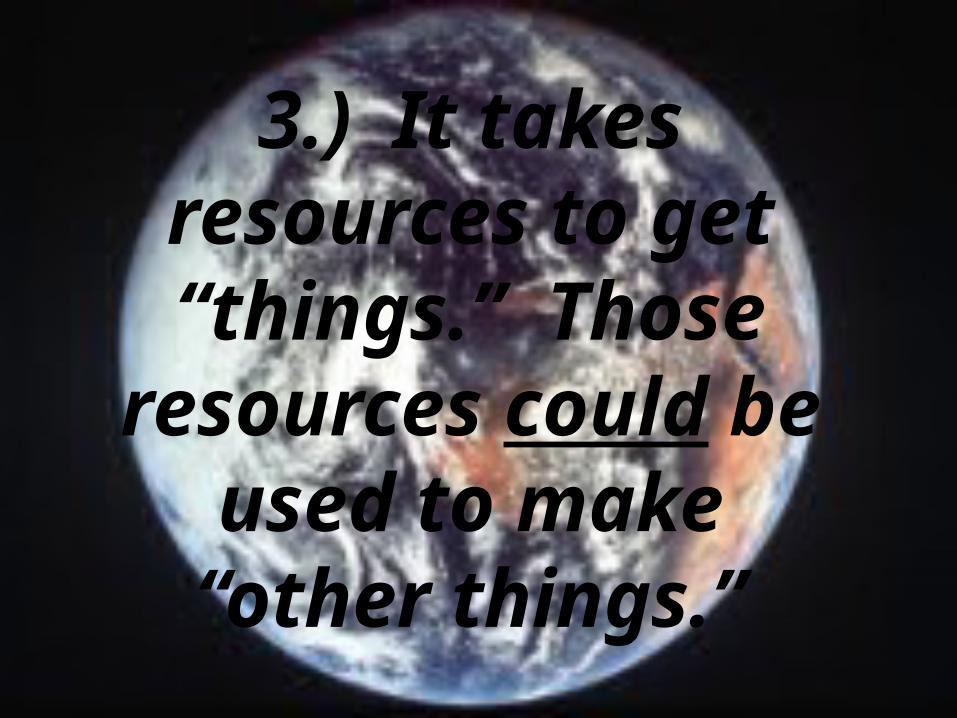
3.) It takes resources to get “things.” Those resources could be used to make “other
things.”
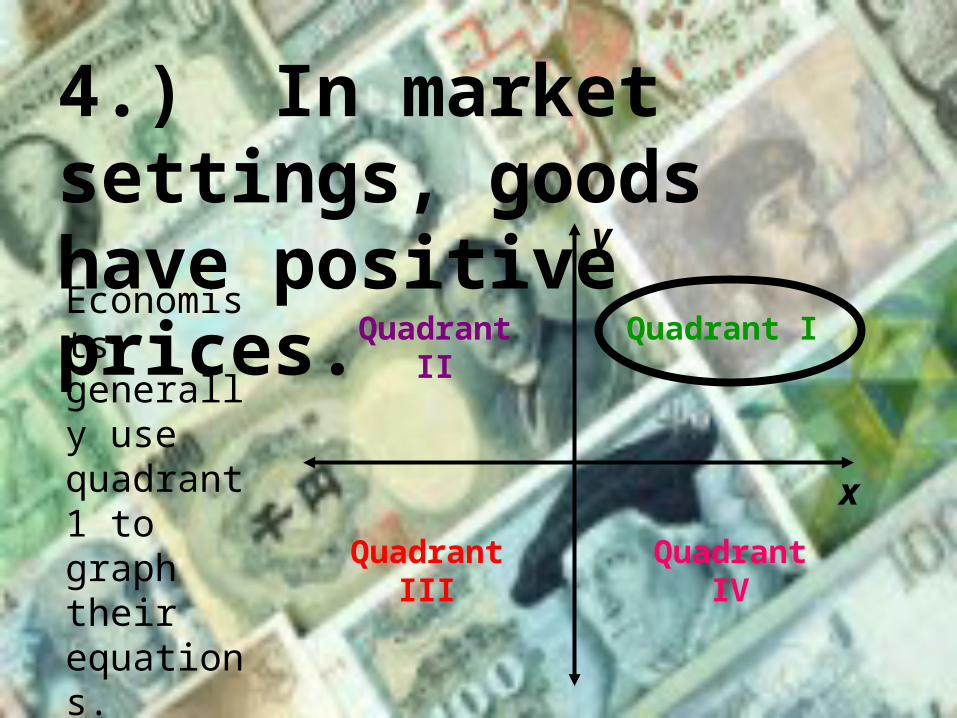
4.) In market settings, goods have positive prices.
x
Quadrant I
y
Quadrant IV
Quadrant II
Quadrant III
Economists generally use quadrant 1 to graph their equations.

5.) For public policies as well as private decisions, there can be NO benefits without
costs.
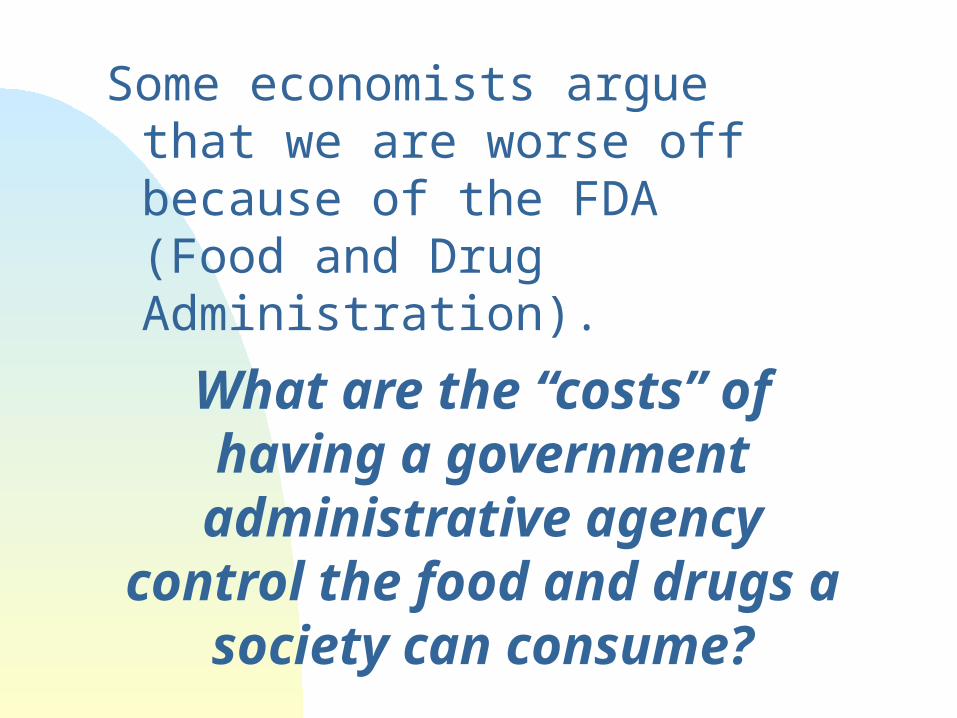
Some economists argue that we are worse off because of the FDA (Food and Drug Administration).
What are the “costs” of having a government administrative agency control the food and
drugs a society can consume?

What are the advantages of government imposed speed limits on public highways?
What are the “costs” to you of having your speed
limited?
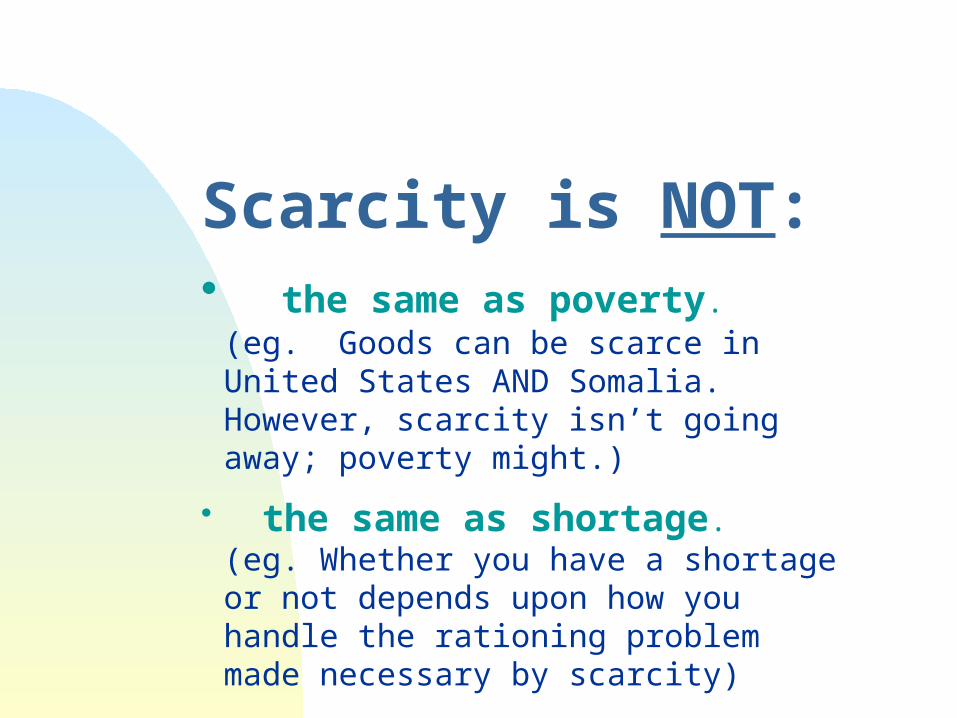
Scarcity is NOT:• the same as poverty. (eg. Goods can be
scarce in United States AND Somalia. However, scarcity isn’t going away; poverty might.)
• the same as shortage. (eg. Whether you have a shortage or not depends upon how you handle the rationing problem made necessary by scarcity)
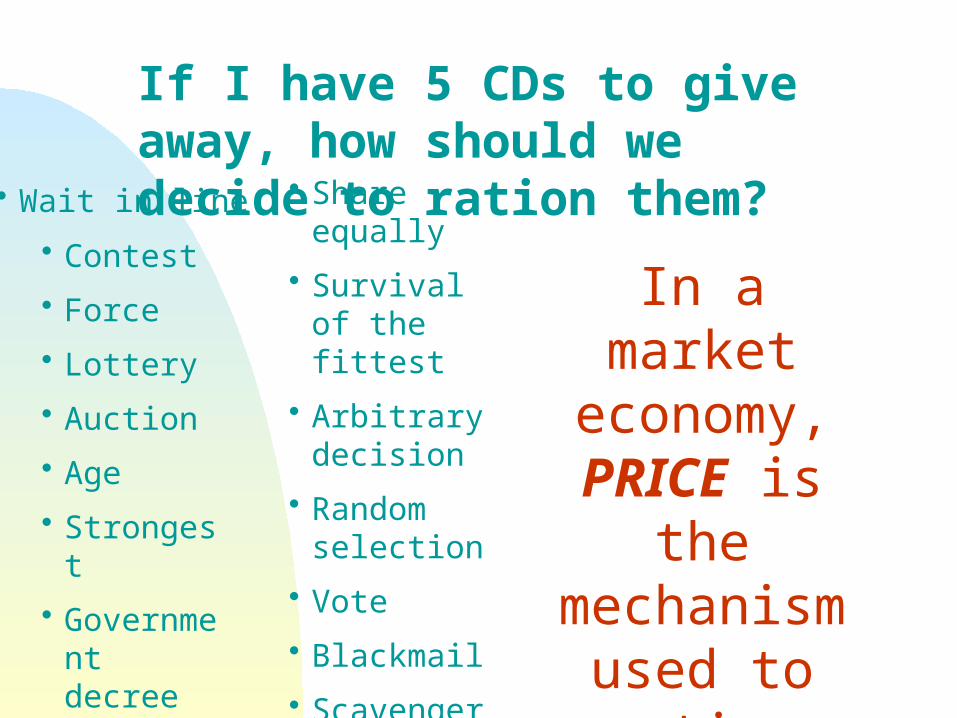
If I have 5 CDs to give away, how should we decide to ration them?
• Contest
• Force
• Lottery
• Auction
• Age
• Strongest
• Government decree
• Barter
In a market economy, PRICE is
the mechanism used to ration goods.
• Share equally
• Survival of the fittest
• Arbitrary decision
• Random selection
• Vote• Blackmail• Scavenger Hunt
• Wait in line
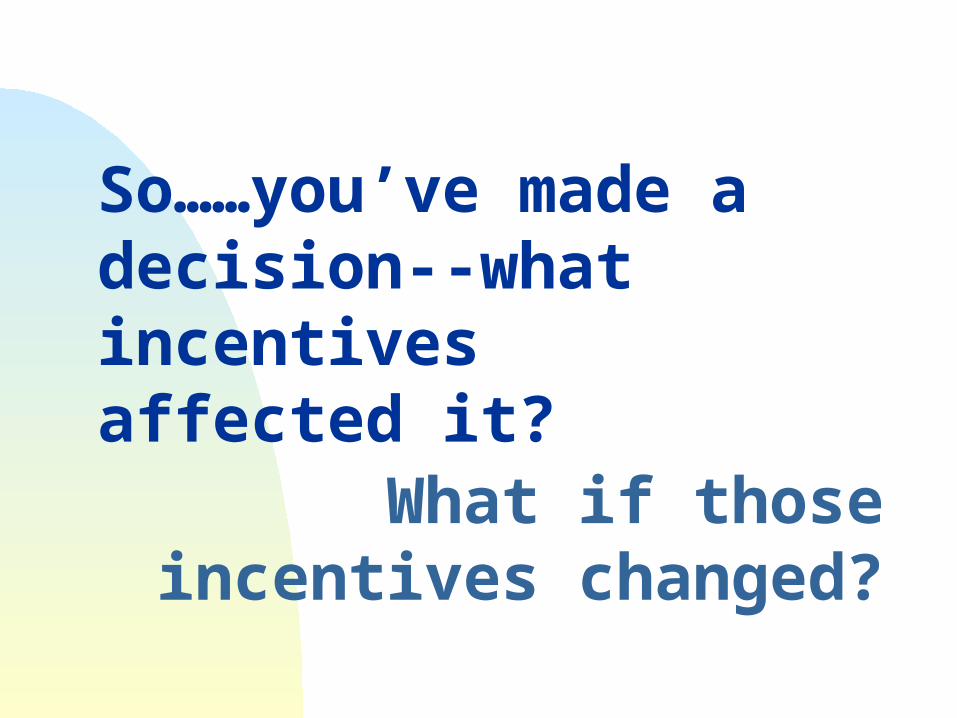
What if those incentives changed?
So……you’ve made a decision--what incentives affected it?
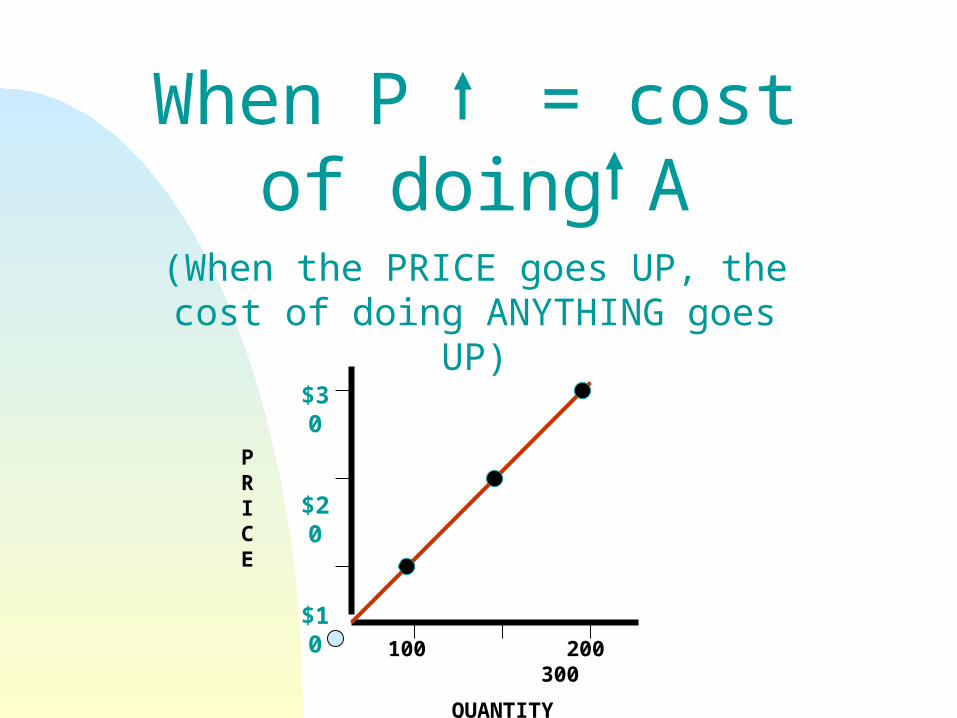
When P = cost of doing A
(When the PRICE goes UP, the cost of doing ANYTHING goes
UP)
100 200 300
QUANTITY
PRICE
$30
$20
$10
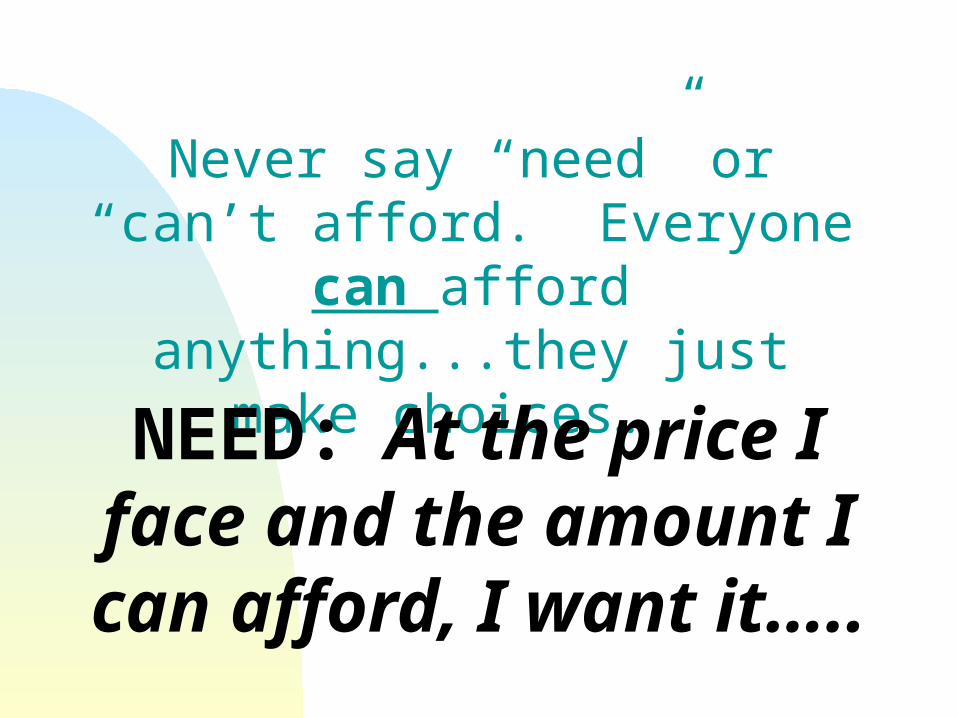
Never say “need” or “can’t afford. Everyone
can afford anything...they just
make choices…..NEED: At the price I face and the amount I can afford, I want
it…..
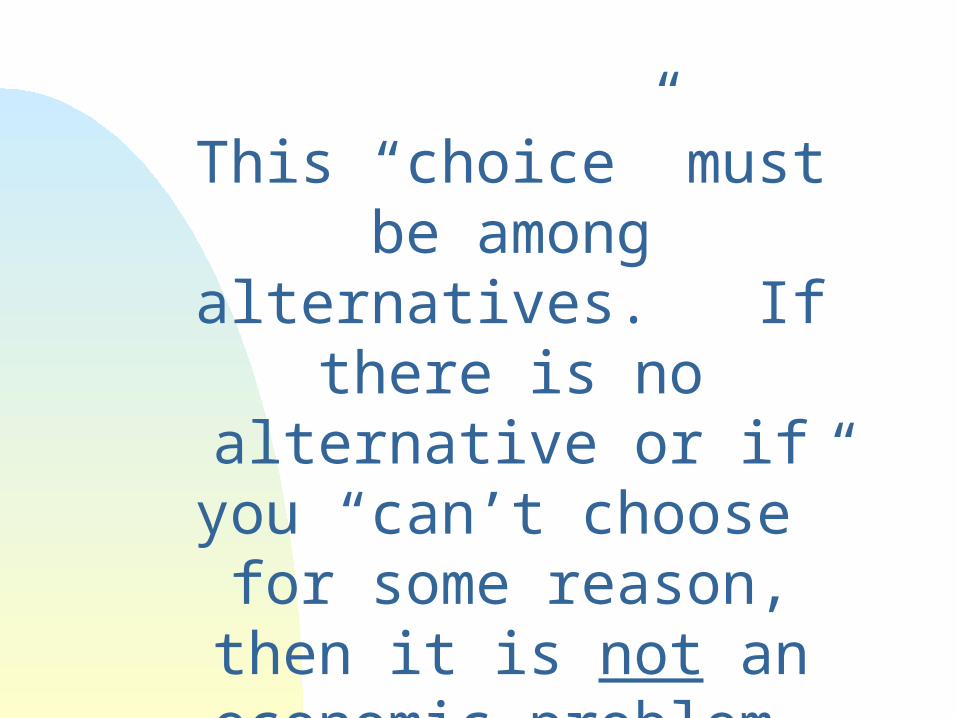
This “choice” must be among alternatives. If
there is no alternative or if you “can’t choose” for
some reason, then it is not an economic problem.
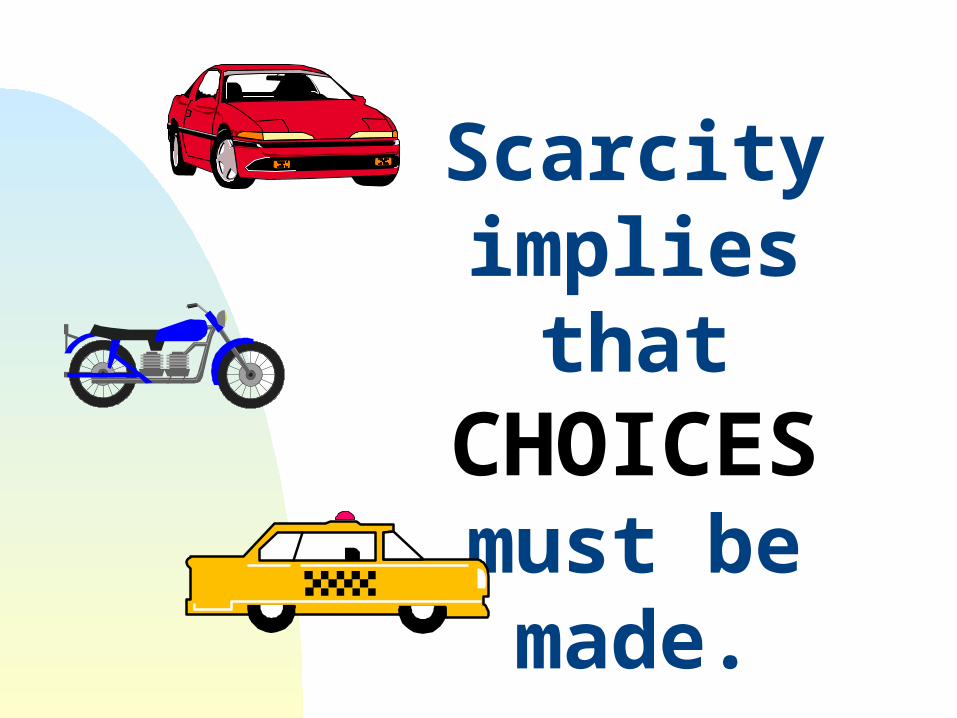
Scarcity implies that
CHOICES must be made.
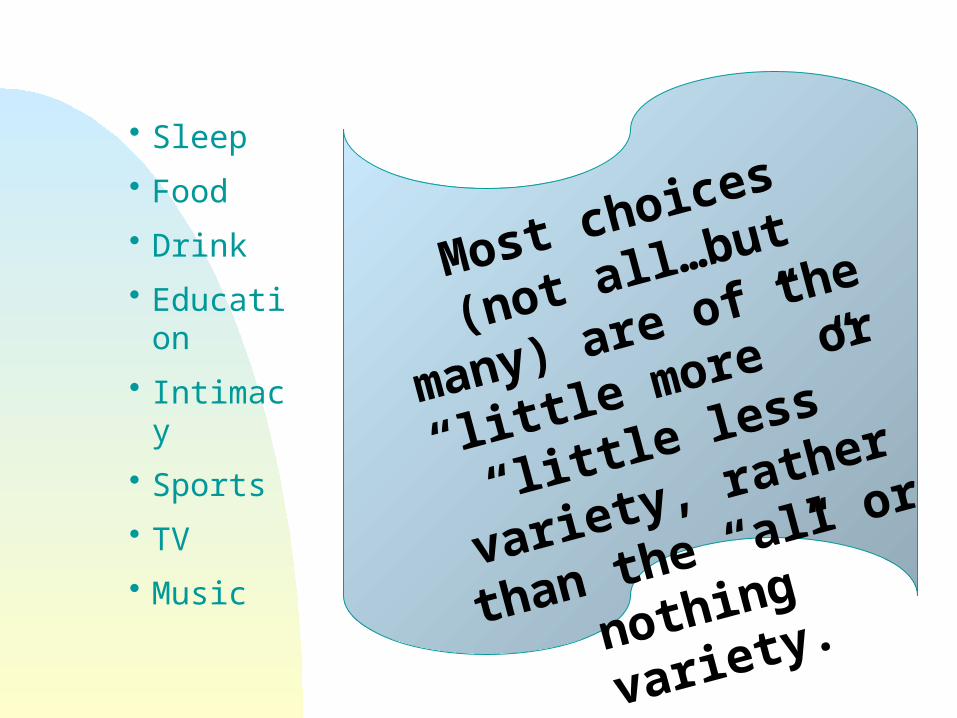
• Sleep• Food• Drink• Education
• Intimacy
• Sports• TV• Music
Most cho
ices
(not all
…but
many) ar
e of the
“little
more” or
“little
less”
variety,
rather
than the
“all or
nothing”
variety.
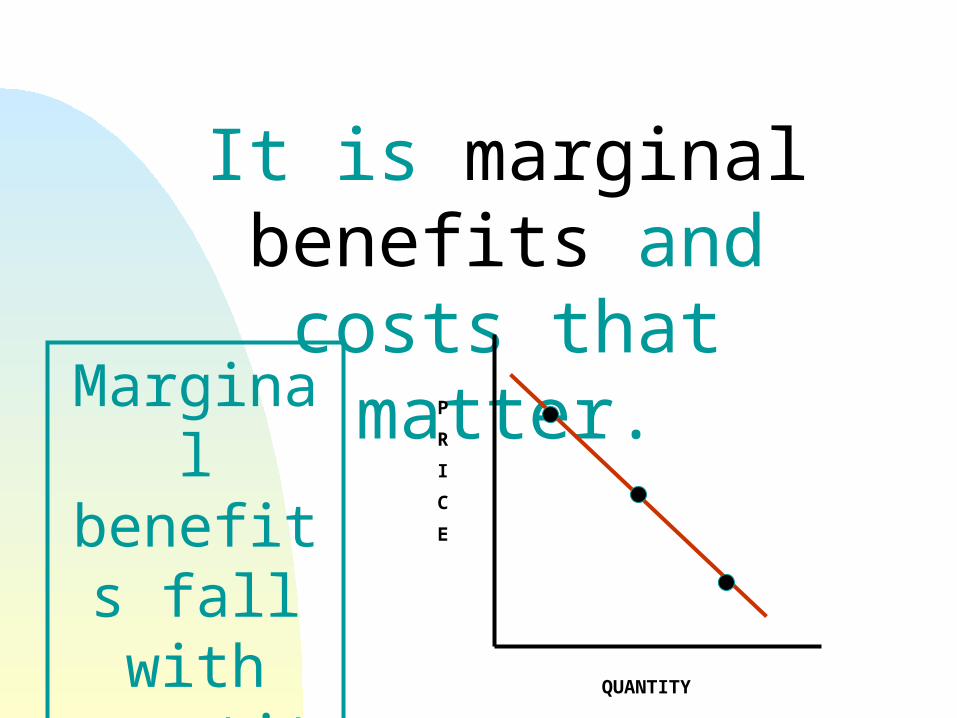
It is marginal benefits and costs that matter.Margina
l benefits fall with
quantity.
QUANTITY
P
R
I
C
E

Opportunity Cost:
The next best alternative given up to
get something.

Things haveprices...
Decisions have costs…..
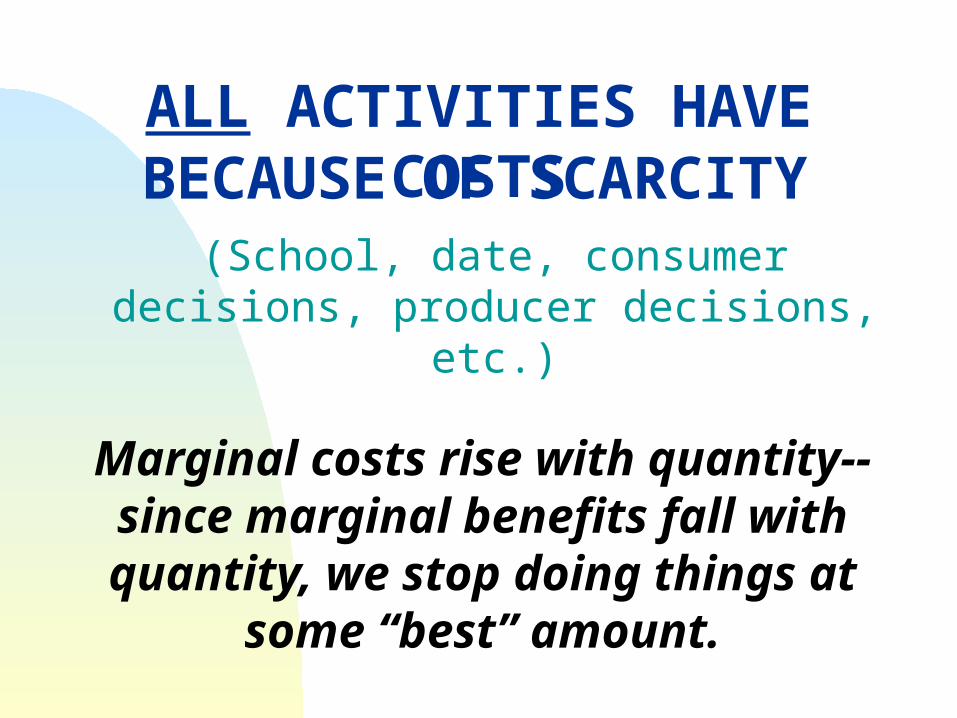
ALL ACTIVITIES HAVE COSTS
(School, date, consumer decisions, producer decisions,
etc.)
BECAUSE OF SCARCITY
Marginal costs rise with quantity--since marginal
benefits fall with quantity, we stop doing things at some
“best” amount.
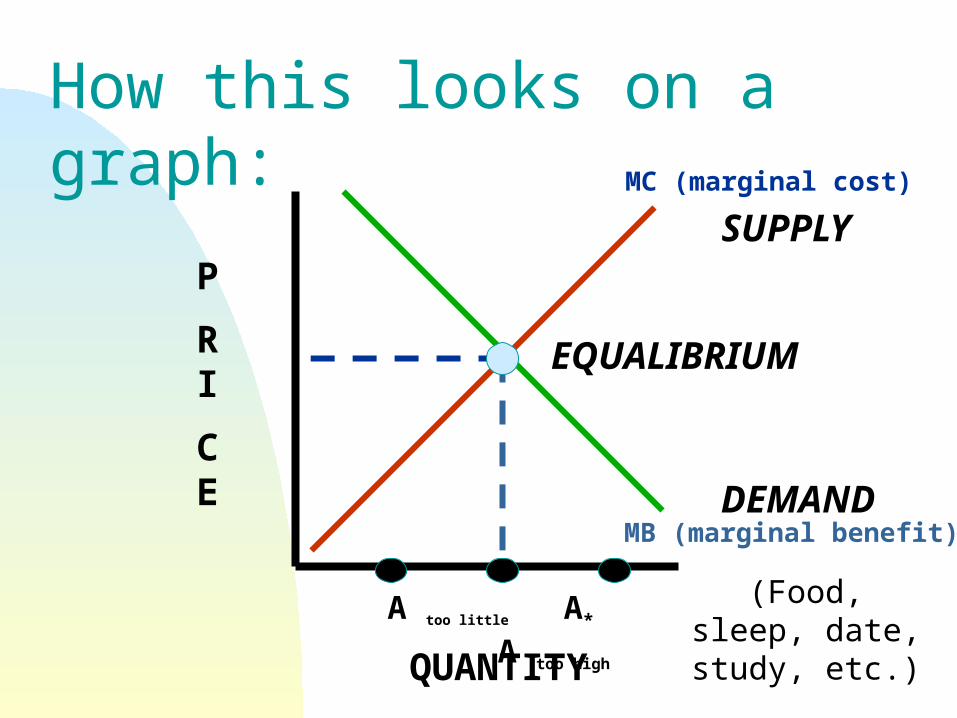
How this looks on a graph: MC (marginal cost)
MB (marginal benefit)
(Food, sleep, date, study, etc.)
A too little A* A too highQUANTITY
P
RI
CE
SUPPLY
DEMAND
EQUALIBRIUM
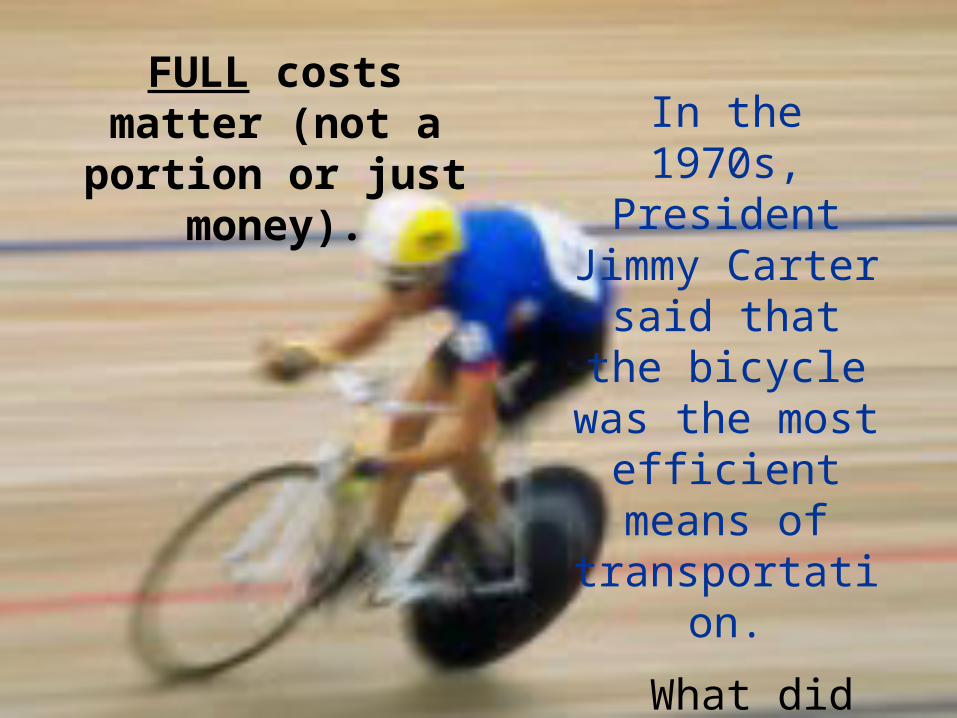
In the 1970s,
President Jimmy Carter said that
the bicycle was the most efficient means of
transportation.
What did he mean?
FULL costs matter (not a
portion or just money).
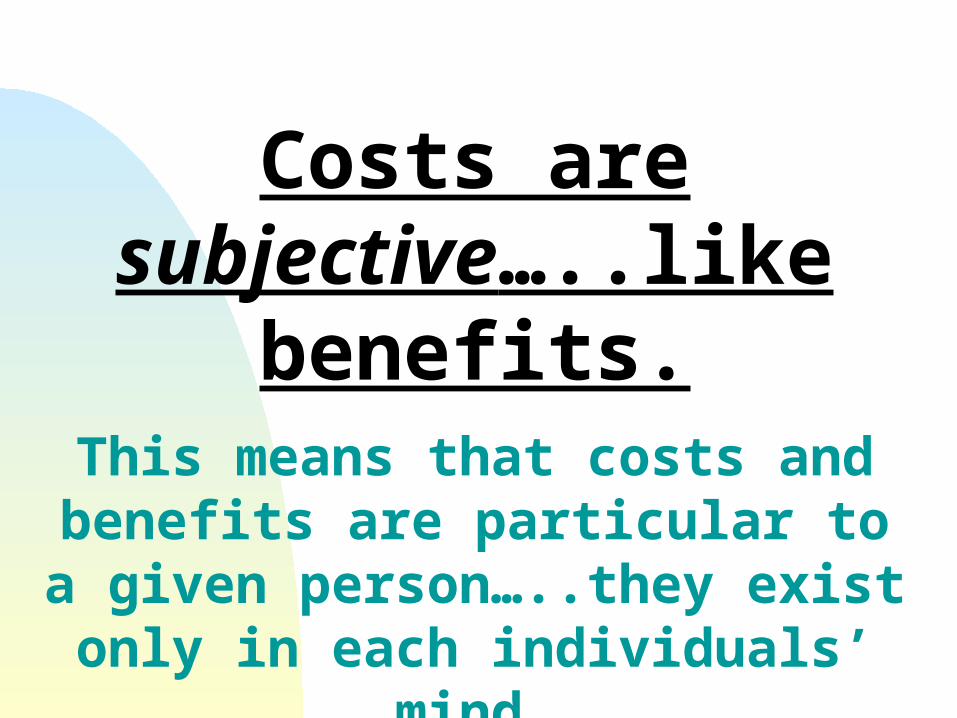
Costs are subjective…..like
benefits.This means that costs and benefits are particular to a given person…..they exist only in each individuals’
mind.

Jodi Foster went to Yale
University at a time when she had a big movie career.
What were her costs? benefits?
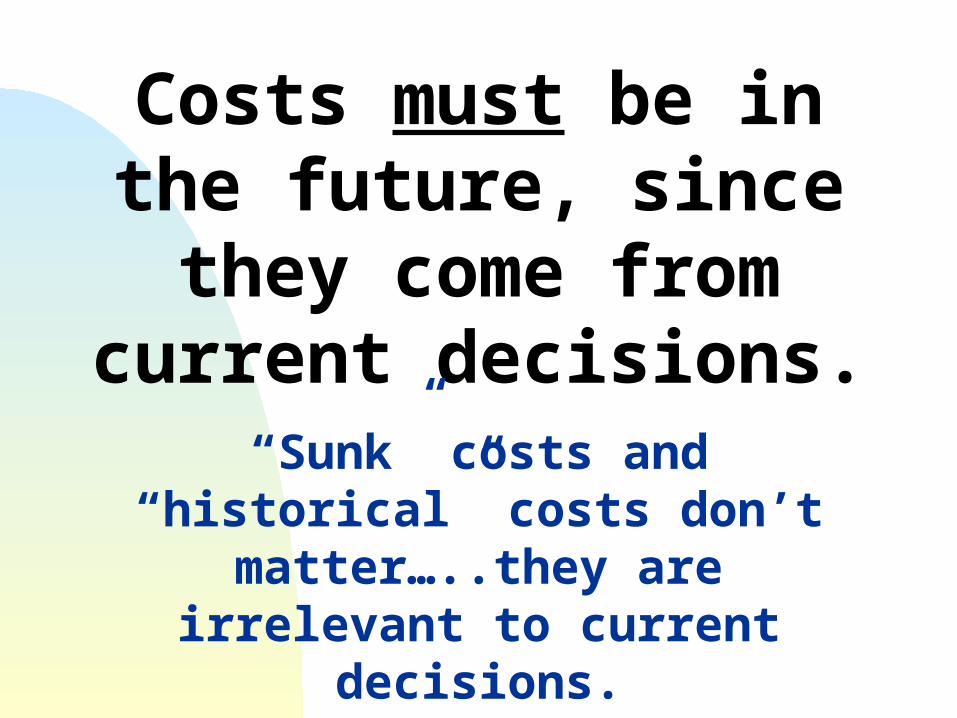
Costs must be in the future, since they come from
current decisions.“Sunk” costs and
“historical” costs don’t matter…..they are
irrelevant to current decisions.
For example: Those who died in Vietnam are “sunk” costs.
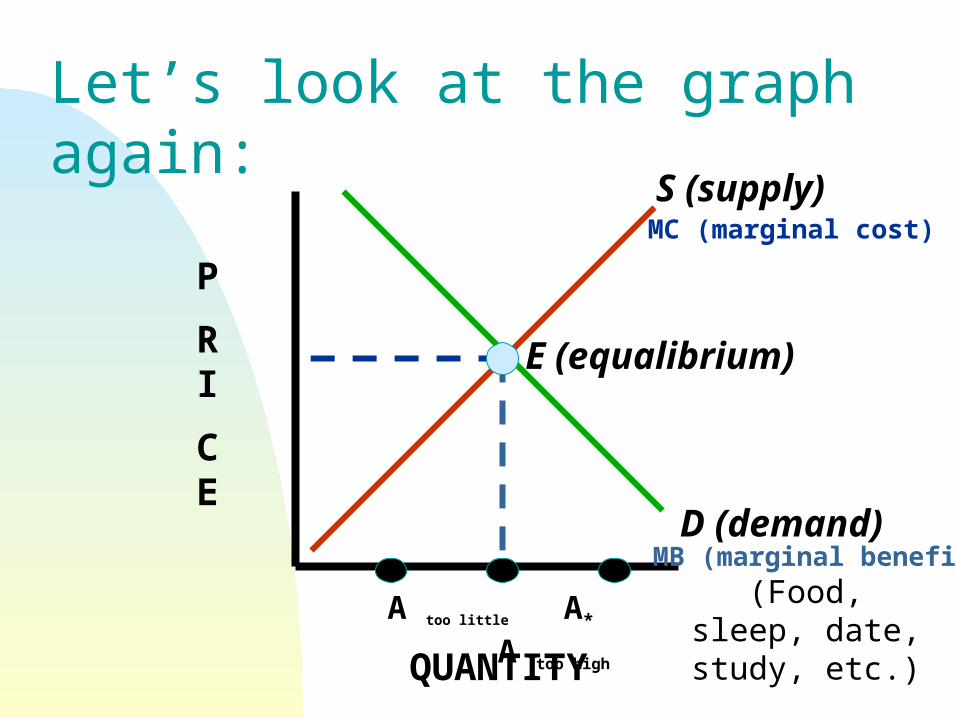
Let’s look at the graph again:
MC (marginal cost)
MB (marginal benefit)(Food,
sleep, date, study, etc.)
A too little A* A too highQUANTITY
P
RI
CE
S (supply)
D (demand)
E (equalibrium)
This graph also illustrates two economic laws:
LAW of SUPPLY
LAW of DEMAND
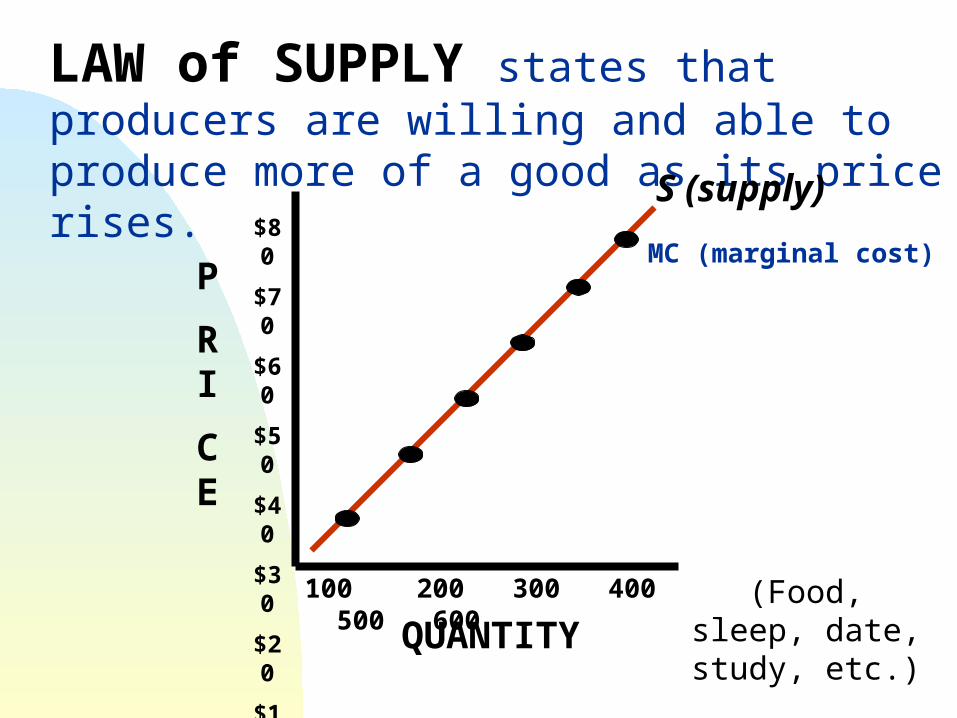
LAW of SUPPLY states that producers are willing and able to produce more of a good as its price rises.
MC (marginal cost)
(Food, sleep, date, study, etc.)
QUANTITY
P
RI
CE
S (supply)$8
0
$70
$60
$50
$40
$30
$20
$10
0
100 200 300 400 500 600
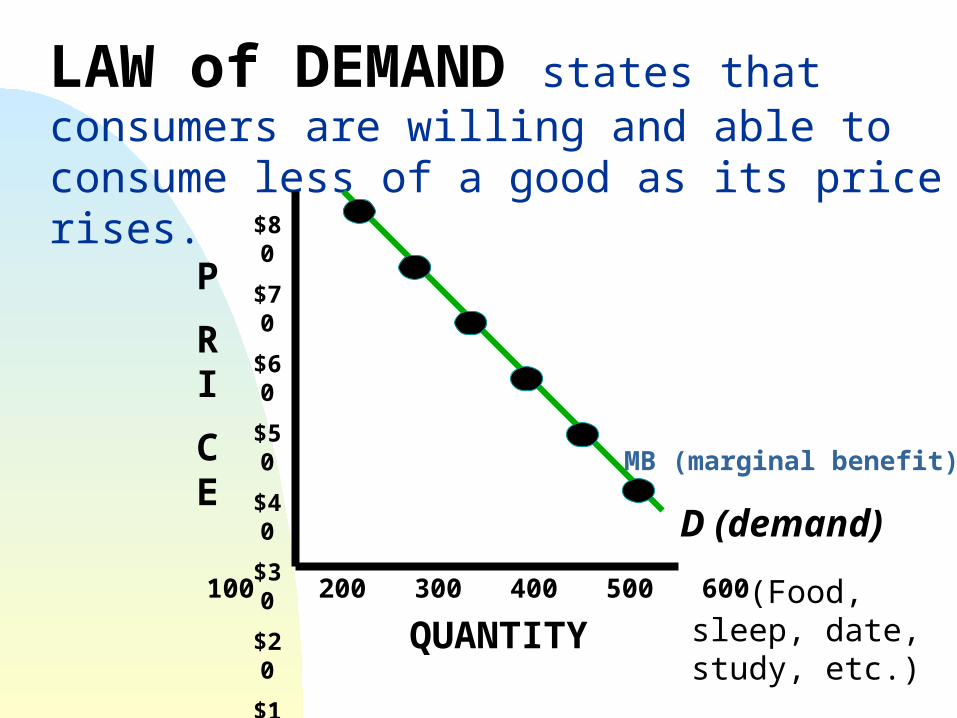
LAW of DEMAND states that consumers are willing and able to consume less of a good as its price rises.
MB (marginal benefit)
(Food, sleep, date, study, etc.)
QUANTITY
P
RI
CE
D (demand)
$80
$70
$60
$50
$40
$30
$20
$10
0
100 200 300 400 500 600
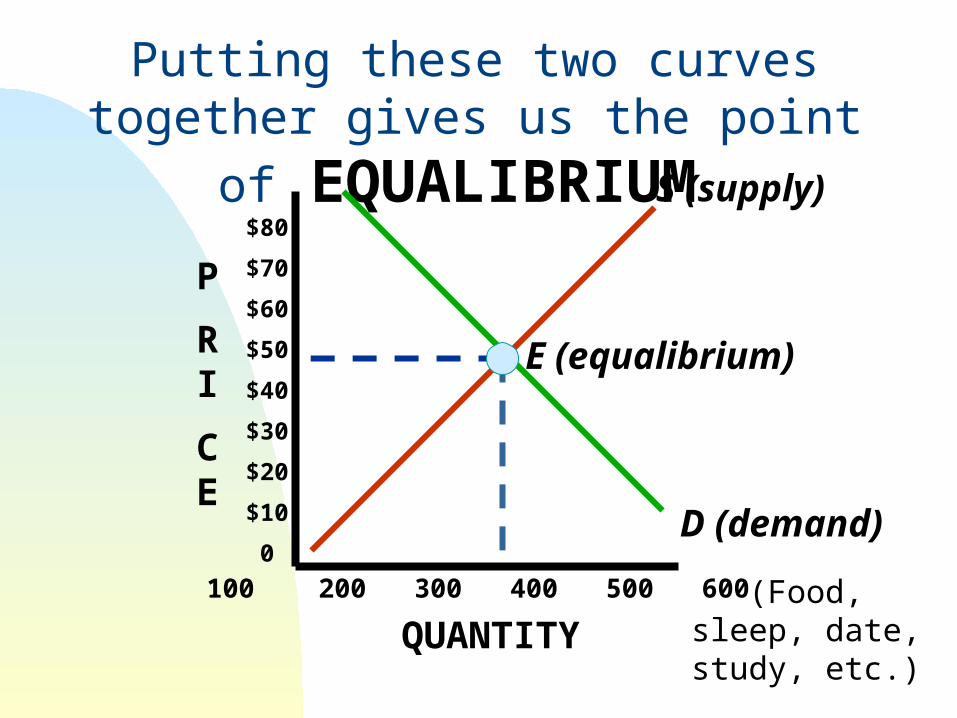
Putting these two curves together gives us the point
of EQUALIBRIUM
(Food, sleep, date, study, etc.)
QUANTITY
P
RI
CE
S (supply)
D (demand)
E (equalibrium)
$80
$70
$60
$50
$40
$30
$20
$10
0
100 200 300 400 500 600
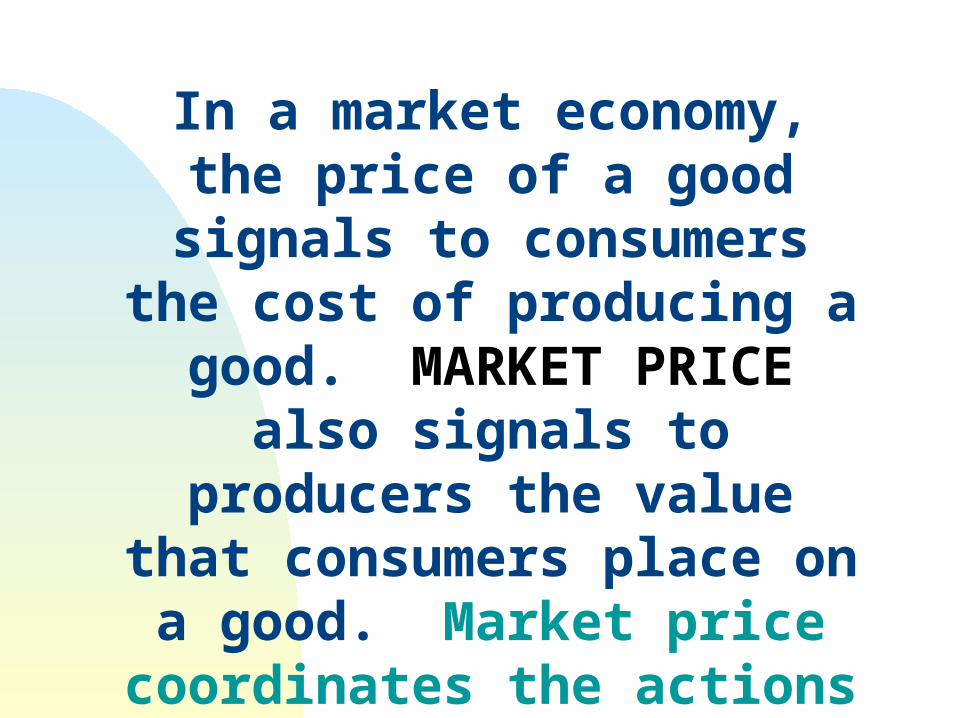
In a market economy, the price of a good signals to consumers the cost of producing a good.
MARKET PRICE also signals to producers the value that
consumers place on a good. Market price coordinates the
actions of consumers (demand) and producers (supply).
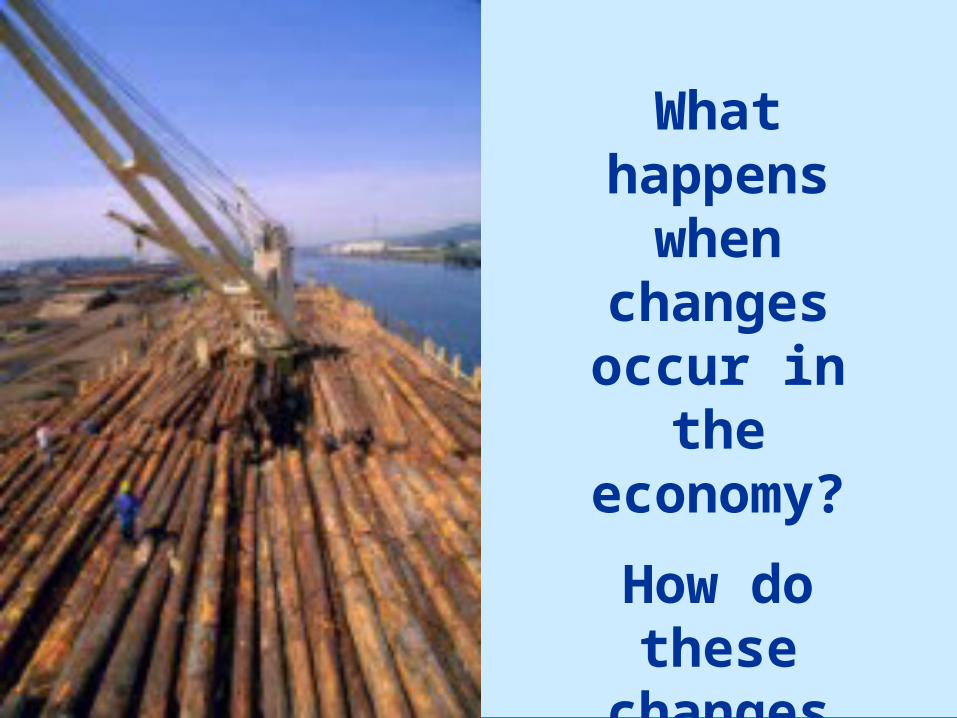
What happens when
changes occur in
the economy?
How do these changes affect
supply and demand?
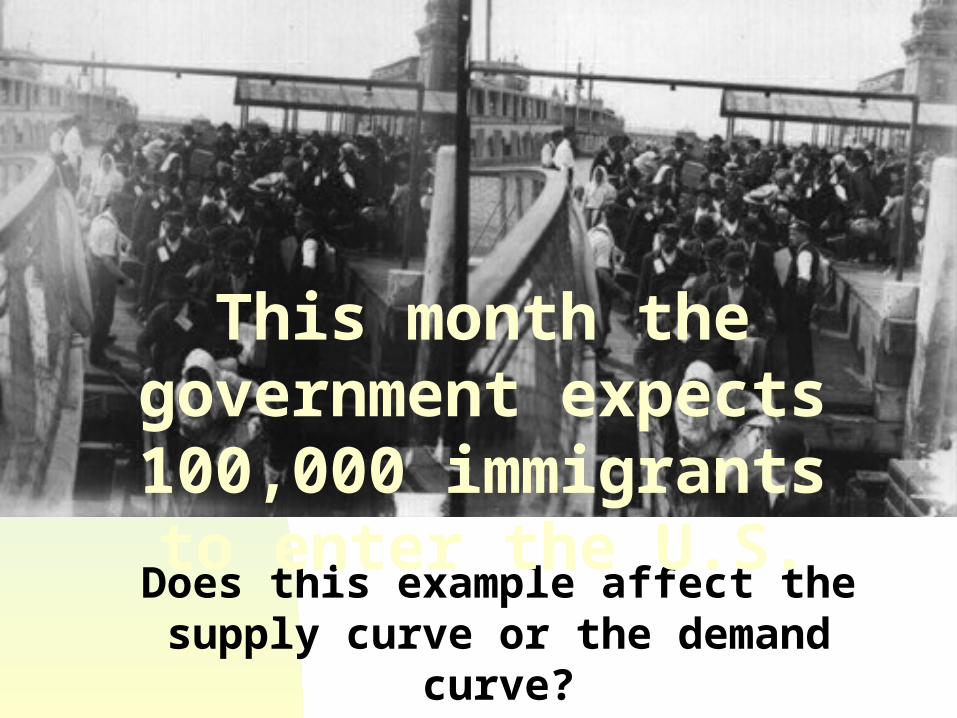
Does this example affect the supply curve or the demand
curve?
This month the government expects 100,000 immigrants to enter the U.S.
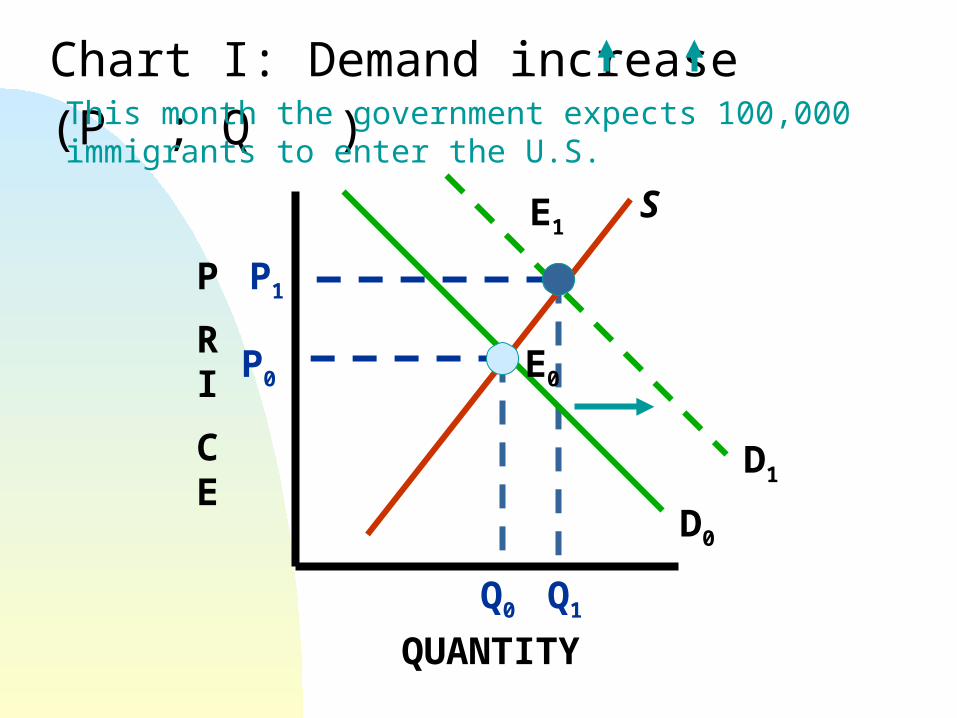
Chart I: Demand increase (P ; Q )
QUANTITY
P
RI
CE
S
D0
E0 P0
Q0
P1
E1
This month the government expects 100,000 immigrants to enter the U.S.
D1
Q1
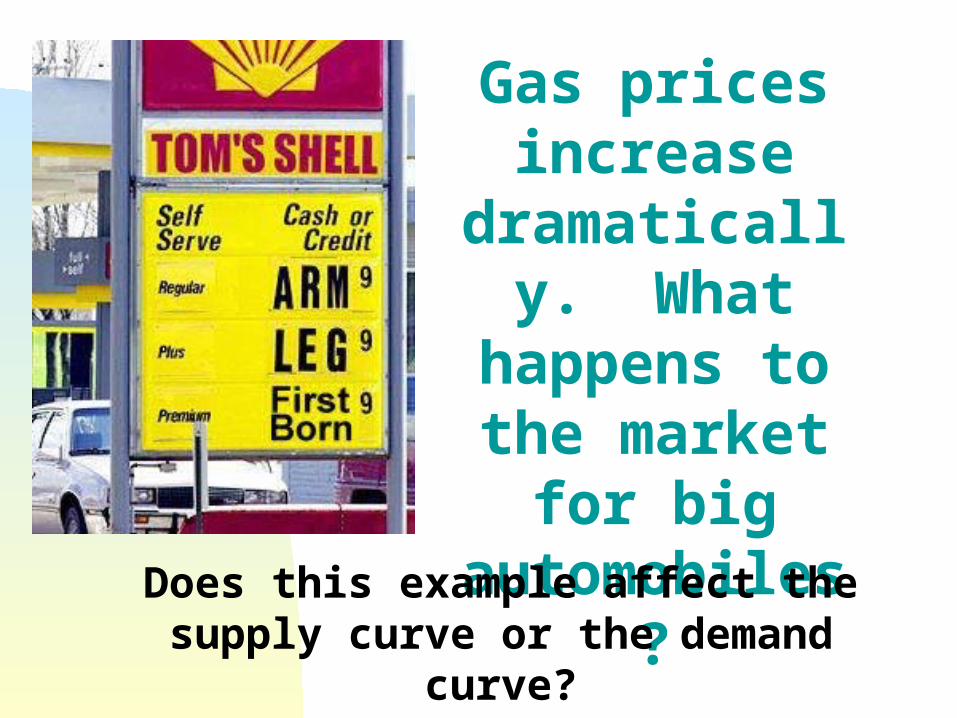
Gas prices increase
dramatically. What
happens to the market for big
automobiles?
Does this example affect the supply curve or the demand
curve?
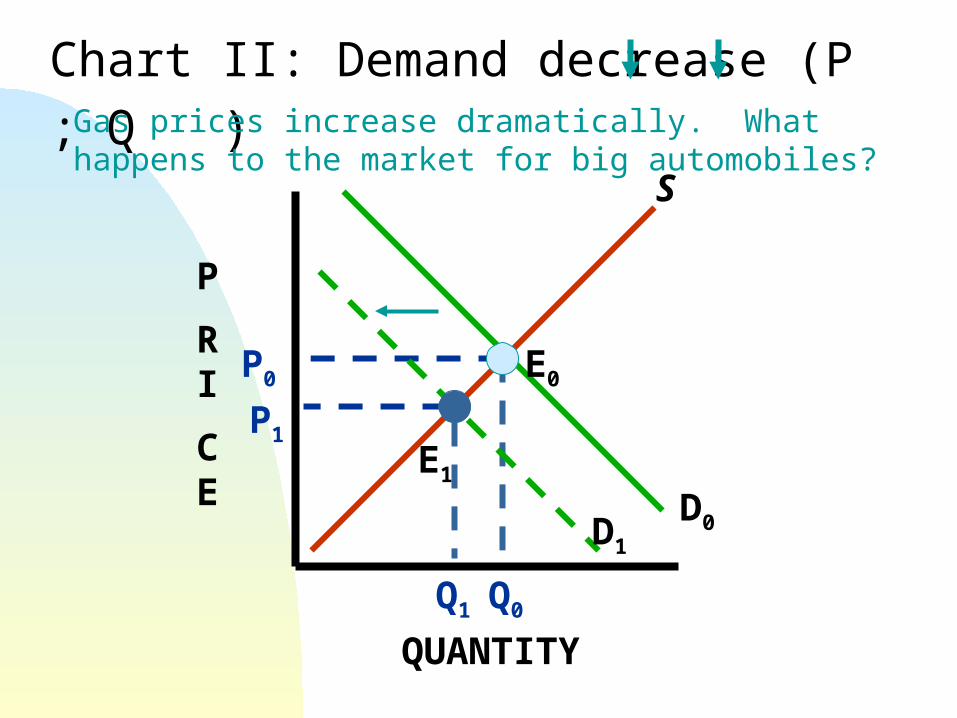
Chart II: Demand decrease (P ; Q )
QUANTITY
P
RI
CE
S
E0 P0
Q0
P1
Q1
E1
Gas prices increase dramatically. What happens to the market for big automobiles?
D0 D1
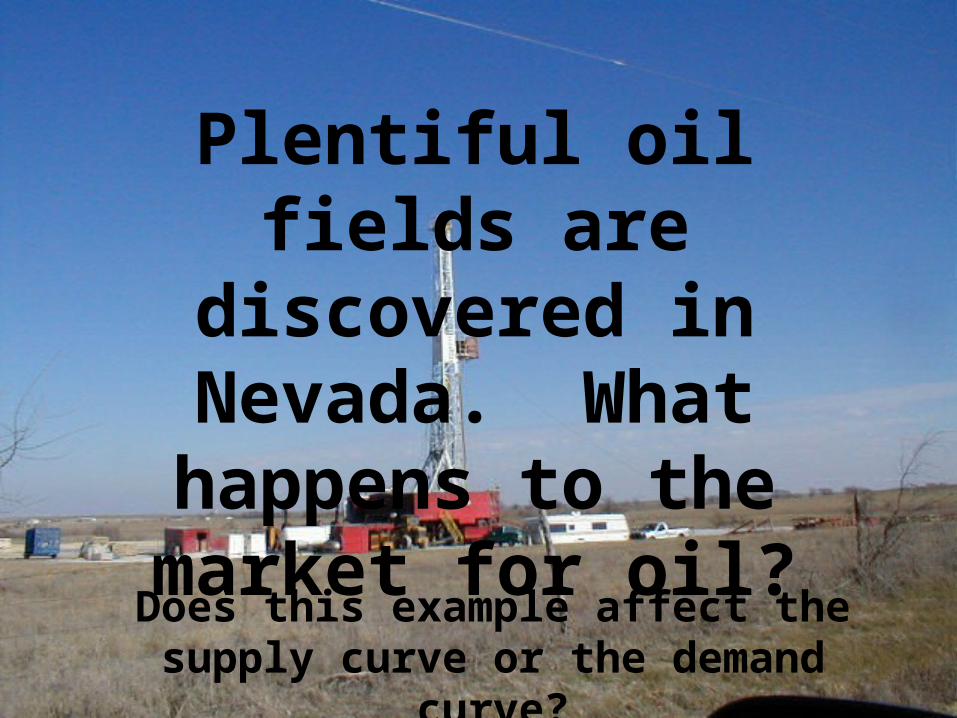
Plentiful oil fields are
discovered in Nevada. What happens to the market for oil?Does this example affect the supply curve or the demand
curve?
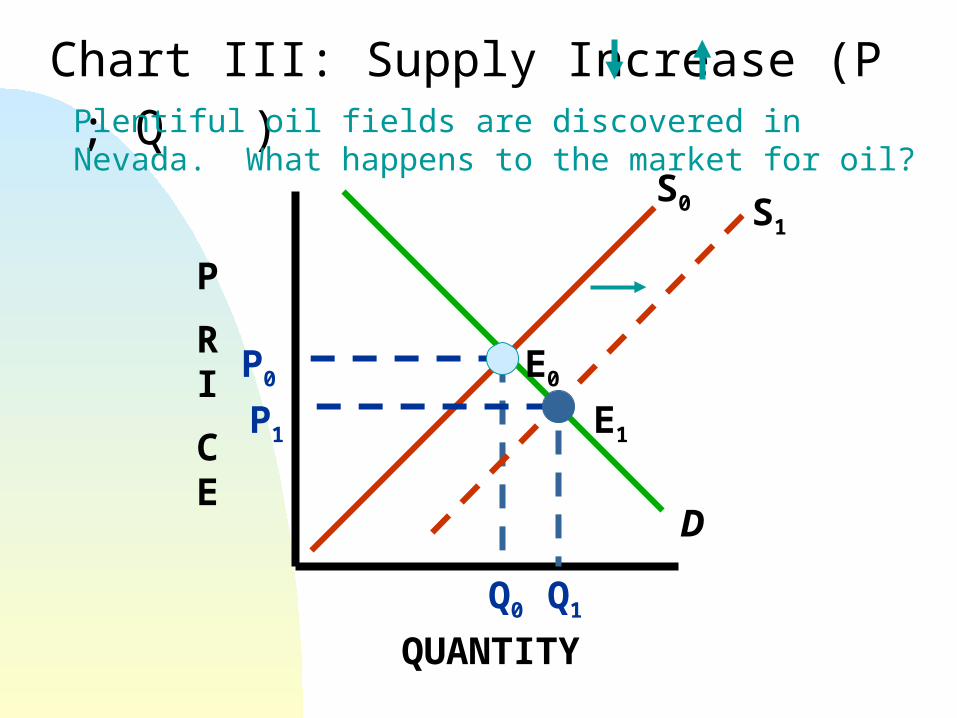
Chart III: Supply Increase (P ; Q )
QUANTITY
P
RI
CE
S0
D
E0 P0
Q0
P1
Q1
E1
Plentiful oil fields are discovered in Nevada. What happens to the market for oil?
S1
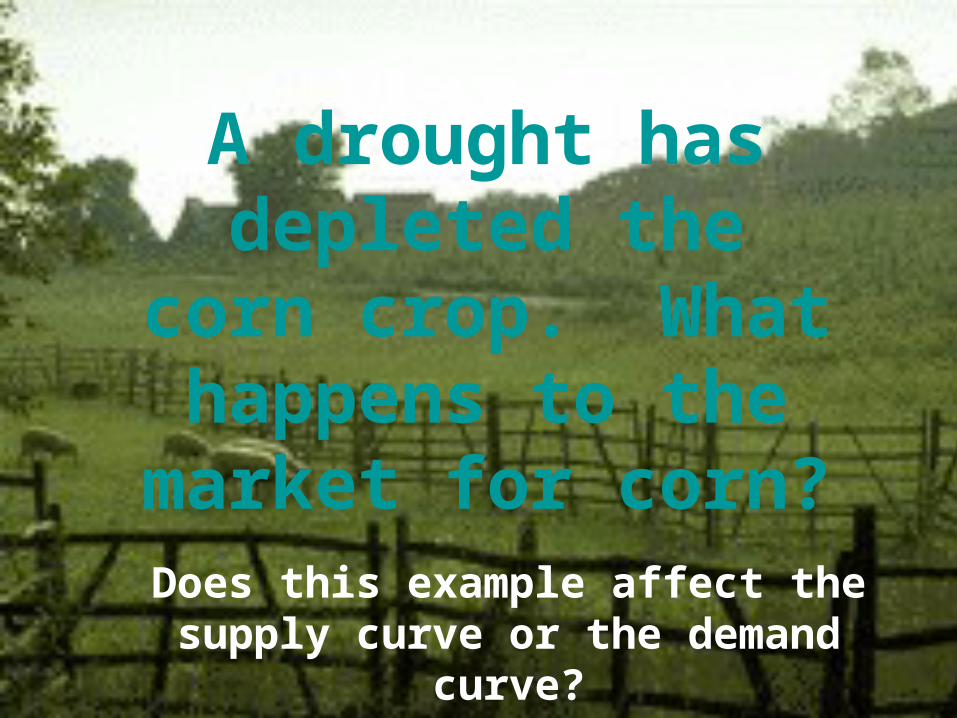
A drought has depleted the
corn crop. What happens to the
market for corn?Does this example affect the supply curve or the demand
curve?
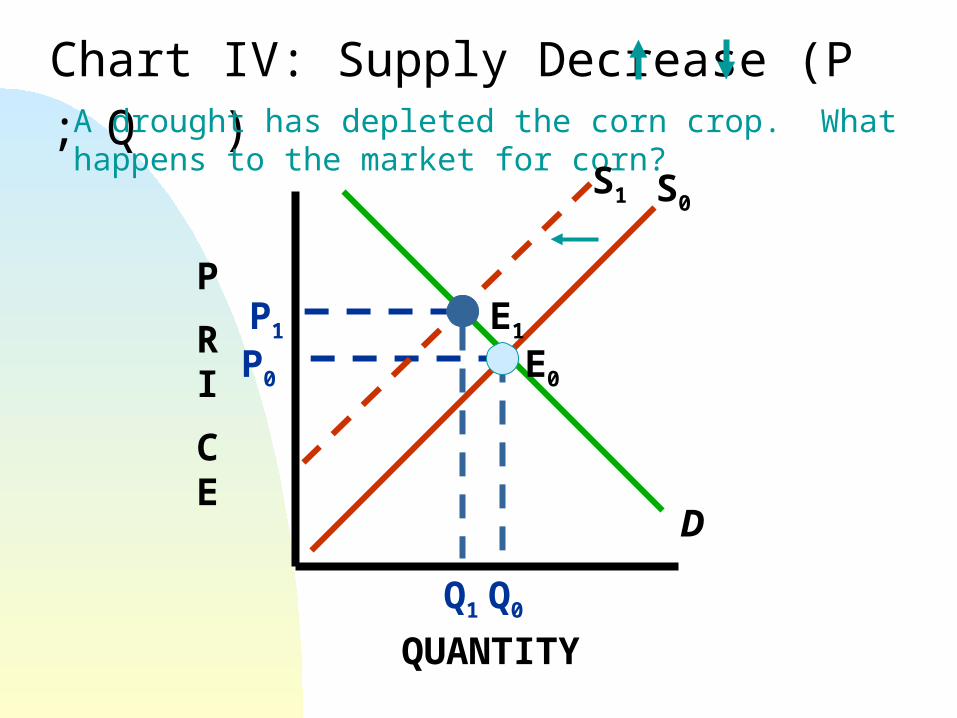
Chart IV: Supply Decrease (P ; Q )
QUANTITY
P
RI
CE
S0
D
E0 P0
Q0
P1
Q1
E1
A drought has depleted the corn crop. What happens to the market for corn?
S1

The End
Compiled by Virginia H. Meachum Coral Springs
High School