economics of the firm: identifying factors affecting …
TRANSCRIPT

Southern Illinois University CarbondaleOpenSIUC
Research Papers Graduate School
2016
ECONOMICS OF THE FIRM: IDENTIFYINGFACTORS AFFECTING THEPERFORMANCE OF AGRIBUSINESSCORPORATIONSCasey [email protected]
Follow this and additional works at: http://opensiuc.lib.siu.edu/gs_rp
This Article is brought to you for free and open access by the Graduate School at OpenSIUC. It has been accepted for inclusion in Research Papers byan authorized administrator of OpenSIUC. For more information, please contact [email protected].
Recommended CitationEngel, Casey. "ECONOMICS OF THE FIRM: IDENTIFYING FACTORS AFFECTING THE PERFORMANCE OFAGRIBUSINESS CORPORATIONS." ( Jan 2016).

ECONOMICS OF THE FIRM: IDENTIFYING FACTORS AFFECTING THE
PERFORMANCE OF AGRIBUSINESS CORPORATIONS
by
Casey Engel
B.S., Southern Illinois University, 2015 B.S., Southern Illinois University, 2015
A Research Paper Submitted in Partial Fulfillment of the Requirements for the
Master of Science Degree
Department of Agribusiness Economics in the Graduate School
Southern Illinois University Carbondale May, 2016

RESEARCH PAPER APPROVAL
ECONOMICS OF THE FIRM: IDENTIFYING FACTORS AFFECTING THE PERFORMANCE OF AGRIBUSINESS CORPORATIONS
By
Casey Engel
A Research Paper Submitted in Partial
Fulfillment of the Requirements
for the Degree of
Master of Science
in the field of Agribusiness Economics
Approved by:
Dr. Wanki Moon, Chair
Graduate School Southern Illinois University Carbondale
04/01/2016
i
AN ABSTRACT OF THE RESEARCH PAPER OF
CASEY ENGEL, for the Master of Science degree in AGRIBUSINESS ECONOMICS, presented on APRIL 1st, 2016 at Southern Illinois University Carbondale. TITLE: ECONOMICS OF THE FIRM: IDENTIFYING FACTORS AFFECTING THE PERFORMANCE OF AGRIBUSINESS CORPORATIONS MAJOR PROFESSOR: Dr. Wanki Moon
This paper is about identifying the factors that affect firm performance. Many
economists have attempted to explain how to define an economy based off of many
different aspects, but the focus of this paper is to find out what factors affect the
performance of a company. This paper discusses different economic theories, and
research which is related to the topic. Then I show a few factors that I found in my
research regarding how a firm performs, and finish by interpreting and discussing those
factors.

ii
TABLE OF CONTENTS
CHAPTER PAGE
ABSTRACT ...................................................................................................................... i
LIST OF FIGURES .......................................................................................................... iii
LIST OF TABLES ............................................................................................................ iv
CHAPTERS
CHAPTER 1 – Introduction ................................................................................... 1
CHAPTER 2 - Economic Theories of the Firm...................................................... 2
CHAPTER 3 – Related Literature ....................................................................... 10
CHAPTER 4 – Methods ...................................................................................... 18
CHAPTER 5 – Results ....................................................................................... 36
CHAPTER 6 – Summary and Conclusion .......................................................... 43
BIBLIOGRAPHY ........................................................................................................... 45
VITA ........................................................................................................................... 46

iii
LIST OF FIGURES
FIGURE PAGE
2.1 A model explaining Economic Base Theory. ............................................................. 4
2.2 An example of a production function. ........................................................................ 6
2.3 Barney’s Conceptual Model for RBV ......................................................................... 7
3.1 Structure-Conduct-Performance Paradigm ............................................................. 12
3.2 Structure-Conduct-Performance Paradigm-Updated Version ................................. 13
4.1 Dependent Variable Correlation Matrix ................................................................... 19
4.2 Operating Cash Flow to Sales Ratio ....................................................................... 22
4.3 Dividend Payout Ratio ............................................................................................. 23
4.4 Accounts Receivable Turnover Ratio ...................................................................... 28

iv
LIST OF TABLES
TABLE PAGE
1 Panel Data Analysis. ............................................................................................. 41-42

1
CHAPTER 1
INTRODUCTION
The main objective of this paper is to find factors which affect firm performance.
To begin my paper, I will discuss some related literature, including some of the works of
Michael Porter, which mention some industry and firm variables that effect firm
performance. I will also discuss different economic theories of the firm. Then, using
financial data found in the Bloomberg terminal, I will be able to show which variables
have significant effects on the performance of a firm, and I will also be able to see which
ones don’t have an effect.
Using the financial data along with TSP (a statistics program), I will be able to run
a regression model that will better show my findings. The regression model that I will
run is called a Panel Data Regression Model. This model is explained in more detail in
the chapters to follow. With that said, the main focus is to find what factors truly affect
firm performance, and how companies use those factors to make more strategic
decisions.

2
CHAPTER 2
ECONOMIC THEORIES OF THE FIRM
2.1 Introduction to Managerial Economics
In this section we introduce managerial economics, and explain how useful it is in
analyzing the performance of a firm.
Many economists have attempted to explain how to define an economy based off
of many different aspects, but very few have looked at the economy to see if
management played a key role in the performance of a company. Managerial
economics is useful to managers in making decisions relating to a firm’s customer’s
base competitors, and strategic future decisions. A lot of mathematical concepts
including statistics are required because of the probabilistic nature of future decisions
that the firm wants to make. The big difference between managerial economics and
macro- and microeconomics is that microeconomics involves the allocation of scarce
resources at the household level, and macroeconomics involve the study of economics
as a whole. Managerial economics, on the other hand, applies the tools that are taught
in these branches to come up with viable business plans. Managerial economics is very
broad and is used to not only make the decisions for profit making organizations, but
have also been used in non-profit making organizations by properly utilizing their scarce
resources. The concept of this type of economics is very useful in price determination,
long term capital budgeting, and insights into the demands of commodities. One of the
biggest key areas of managerial economics is the theory of the firm that entails the best
mix of the scarce resources to maximize profits within the firm.

3
By learning some of the main economic theories (as described later in this
chapter), we are able to use the knowledge of those theories to make decisions at the
management level in a firm. It helps managerial economists be able to have a much
clearer idea of what the other firms are going to do, what the markets are going to do, it
helps the management of the firm make short run and long run decisions, and it helps
with much more beyond that.
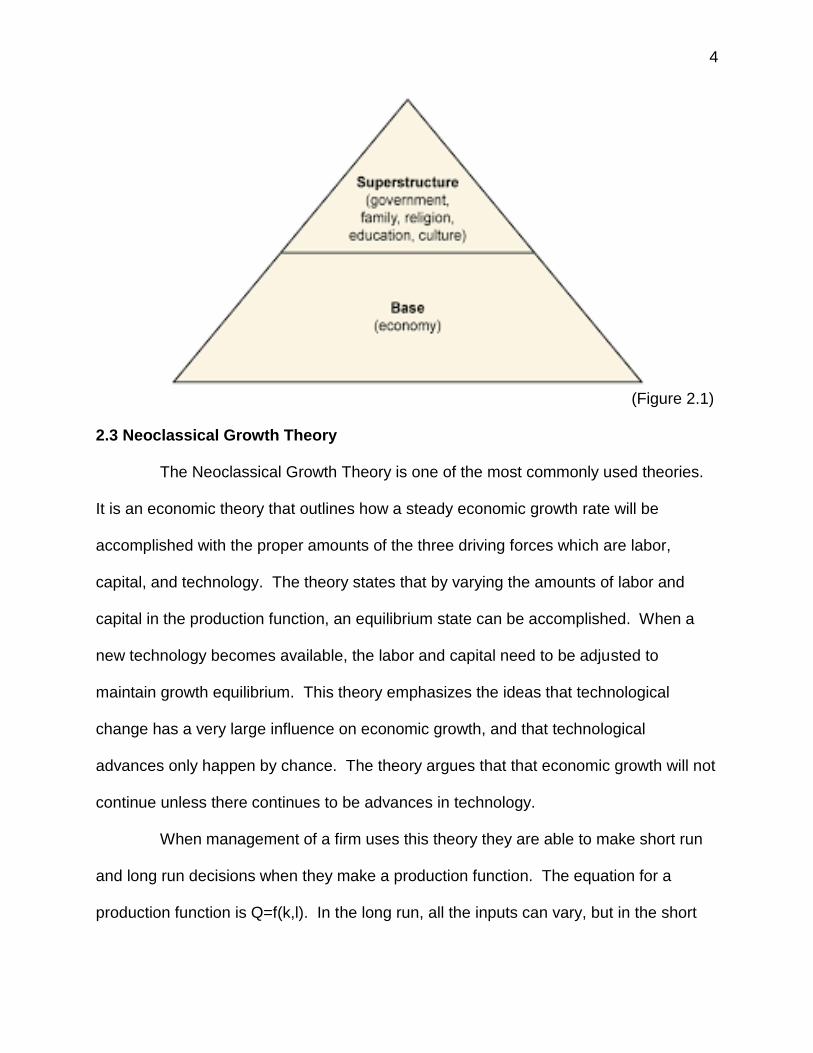
2.2 Economic Base Theory
The Economic Base Theory divides the economy into two economic sectors
which are the basic or export sector and the non-basic or non-export sectors. The
difference between growth and development in this model are shown by saying that
economic growth is measured by quantity, and economic development is measured by
their qualitative features such as structure changes. Examples of structure changes
would be market changes or technological changes. In this theory however,
development does mean growth will occur. The key to growth is from the export sector
through the economic multiplier. The units of measure used to determine whether
growth is happening are from sales revenue, production, and employment. This theory
is quite popular and simple to understand, but it doesn’t lead to deep understanding of
development. It is very easy to apply to an economy, but it tends to just recommend
more industrial requirements of industries with the highest multiplier. In their modern
form, they are in the tradition of Keynesian macroeconomics. Figure 2.1 explains the
theory in simpler terms.
4
(Figure 2.1)
2.3 Neoclassical Growth Theory
The Neoclassical Growth Theory is one of the most commonly used theories.
It is an economic theory that outlines how a steady economic growth rate will be
accomplished with the proper amounts of the three driving forces which are labor,
capital, and technology. The theory states that by varying the amounts of labor and
capital in the production function, an equilibrium state can be accomplished. When a
new technology becomes available, the labor and capital need to be adjusted to
maintain growth equilibrium. This theory emphasizes the ideas that technological
change has a very large influence on economic growth, and that technological
advances only happen by chance. The theory argues that that economic growth will not
continue unless there continues to be advances in technology.
When management of a firm uses this theory they are able to make short run
and long run decisions when they make a production function. The equation for a
production function is Q=f(k,l). In the long run, all the inputs can vary, but in the short

5
run one input is fixed (usually capital). Once you make the firms production function,
then you can find out the marginal product of labor which brings up the law of
diminishing returns. You can also find the marginal product of capital.
Definition: The marginal product of labor tells the extra output each unit of labor
produces. We can find that by taking the change in output divided by the change in
labor.
Definition: The Law of Diminishing Returns happens in the short run. If capital is fixed,
at some point, the marginal product of labor will decrease and the workers will be less
and less productive because the workers will run out of capital to use.
Definition: The marginal product of capital tells the extra output each unit of capital
produces. We can find it by taking the change in output divided by the change in
capital.
Just from making a production function, management can learn a lot about the firm
which helps them make their decisions. The key cause of growth in the Neoclassical
Growth Theory is an increase in savings, an increase in investment, and an increase in
capital. This theory is pretty complex, but it has strong mathematical models that lend
themselves to testing. Figure 2.2 shows an example of a production function.

6
(Figure 2.2) 2.4 Entrepreneurship Theories An entrepreneur is someone who puts together a business and accepts the
associated risk to make a profit. The entrepreneur is commonly seen as a business
leader and innovator of new ideas and business processes. Entrepreneurs say changes
in firms and industries imply improved local economies. The key cause of growth is from
the innovation of entrepreneurs because they cause the changes in firms and industries
for local economy benefits. There are many different entrepreneurship theories, but they
all fall into one of the following categories: economic theories, resource-based theories,
psychological theories, sociological/anthropological theories, and opportunity-based
theories.
Economic theories of entrepreneurship date way back to the first half of the 1700s
where the idea of entrepreneurs were introduced as risk takers. These economic theories
all pose explanations for entrepreneurship that focus, for the most part, on economic

7
conditions and the opportunities that they create. The economic theories tend to receive
some pretty harsh criticism for failing to recognize the open nature of markets, ignoring
the unique nature of entrepreneurial activity and downplaying the diverse contexts in
which entrepreneurship happens.
The Resource-based view of the firm is one of the most widely accepted in the
strategic management field of study. In an article written by Scott Newbert called
“Empirical Research on the Resource-based View of the Firm: An Assessment and
Suggestions for Future Research”, Newbert discusses a few scholars (Barney and
Arikan) who did research on the RBV of the firm. Below is a figure of showing Barney’s
conceptual model:
(Figure 2.3)
Resource-based theories focus on the way individuals leverage different types of
resources to get entrepreneurial efforts off the ground. Access to capital improves the
chances of getting a new venture off the ground, but entrepreneurs often start ventures
with little ready capital. Other types of resources entrepreneurs might leverage include
human resources, such as education, and social networks and the information they
provide. Sometimes leadership of the entrepreneur operates as a resource which a
business just can’t replace. Newbert claimed that “despite the overwhelming appreciation
Valuable, Rare
Resource/Capability
Competitive
Advantage
Performance
Valuable, Rare,
Inimitable, Non-
substitutable
Resource/Capability
Sustained
Competitive
Advantage
Sustained
Performance
8
for the RBV’s central tenets, no systematic assessment of the RBV’s level of support had
been conducted”, but with increased attention to the recent extensions of RBV there will
most likely be an increase in the precision with which the theory will be tested and in turn
help our understanding of how and to what degree resources, core competencies, and
capabilities smooth the way for sustainability and attainment of a firm’s competitive
advantage and subsequent level of performance (p122).
Psychological theories of entrepreneurship focus on the individual and the mental
or emotional elements that drive entrepreneurial individuals. One theory claimed that
entrepreneurs possess a need to achieve which drives their activity. Another approach
suggested that personality traits ranging from optimism to creativity drive their
entrepreneurial behavior. The sociological theory, on the other hand, centers its
explanation for entrepreneurship on the various social contexts that enable the
opportunities that entrepreneurs leverage. Some of the factors include social networks,
a desire for a meaningful life, ethnic identification, and social-political environment factors
all help shape the entrepreneur. The anthropological theory asks the question of
entrepreneurship by placing it within the context of culture and examining how cultural
forces, like social attitudes, shape both the perception and the behaviors of the
entrepreneurs.
Lastly, the opportunity-based theory suggests that entrepreneurs take advantage
of possibilities created by social, cultural, and technological changes. All of these different
theories make up the entrepreneurship theories. These theories are very accurate
because people make the development happen, but they are difficult to apply consistently
since they aren’t general. Strategic entrepreneurship theory shows how having an

9
entrepreneurial mindset, managing the resources strategically, applying creativity and
innovation, and having the internal environment and the managements’ vision can lead
to a competitive advantage in the marketplace. No matter which theory you choose to go
with out of all the different entrepreneurship theories, they can all lead to a competitive
advantage in the market.
10
CHAPTER 3
RELATED LITERATURE
3.1 Five Forces of Competition
When studying managerial economics, an important person to look into is
Michael Porter. Michael Porter is the leading authority on competitive strategy. His
ideas are known globally. In the article he wrote called “The Five Competitive Forces
That Shape Strategy” he discusses what the job of a strategist is. He states that their
job is to “understand and cope with competition”, but that often “managers define
competition too narrowly” (p25). It is important to include suppliers, customers, potential
entrants, and substitute products along with the direct competitors when trying to define
competition. According to Porter, “The extended rivalry that results from all five forces
defines an industry’s structure and shapes the nature of competitive interaction within
an industry” (p25). So it is important to know what makes up the industry’s structure in
order to see the underlying drivers of profitability. All companies have the same
underlying drivers of profitability. Although many factors can affect a company in the
short run, in the long run, “industry structure, manifested in the competitive forces, sets
industry profitability” (p26). Porter shows just how important the five forces that shape
competition are.
To go into further explanation of what the five forces that shape competition are
we will start with the threat of entry. When there are new entrants to an industry, the
new entrants will try to gain market shares and will then put a lot of pressure on costs,
prices, and the rate of investments which is necessary for them to compete. A lot of
times when there are new entrants they are just diversifying from other markets which

11
makes it easier for those entrants to make good deals by leveraging some of their other
products. Porter mentions, “The threat of entry in an industry depends on the height of
entry barriers that are present” (p26). What holds down profitability is the threat of the
entrant. Another one of the five forces is the power of suppliers. Suppliers can keep
more of the value by charging high prices, limiting the quality of service, or shifting the
costs to industry participants. In some cases, suppliers can take profitability out of an
industry that is unable to pass on the cost increases in their own price. On the opposite
end of the spectrum is the power of buyers. Big customers can keep more value by
forcing down prices, demanding a better service or better quality, and playing industry
participants against one another. Next is the threat of substitutes. Porter says, “A
substitute performs the same or a similar function as an industry’s product by a different
means” (p31). Sometimes the threat of a substitute is indirect, and sometimes they are
overlooked because they seem to be much different than an industries product.
However, they are always present. Lastly is the most obvious force of competition and
that is from the direct competition. This can be seen in the form of lowered prices, new
products, advertising, and improvements in service or quality. Porter claims, “Rivalry is
especially destructive to profitability if it gravitates solely to price because price
competition transfers profits directly from an industry to its customers” (p32). Michael
Porter shows how important it is to know your competition because as long as you know
your competition then you also know the underlying factors of profitability. This in turn
leads to how well the firm is performing.

12
3.2 Industrial Organization to Strategic Management
Michael Porter wrote another article called “The Contributions of Industrial
Organization to Strategic Management” which was published in the Academy of
Management Review. This article is based off of the traditional Bain/Mason paradigm of
IO which offered strategic management a systematic model for reviewing competition
within an industry. The IO model was rarely used in the business policy field though
because they differed in many ways. However, the IO theory has developed quite a bit
since the 70s and seems to have gradually narrowed the gap between the two fields to
the extent that scholars should be more focused on the IO theory because it can offer
so much to the analysis of strategic management by firms within different industries.
Porter talks about the promise of the industrial organization paradigm, and that it is “the
essence of this paradigm is that a firm’s performance in the marketplace depends
critically on the characteristics of the industry environment in which it competes” (p610).
They expressed that is the popular structure-conduct-performance framework model
shown below:
Industry Structure Conduct Performance
(Figure 3.1)
Industry structure explained the behavior or conduct of the firms. The definition of
performance was defined broadly including the “sense of social performance,

13
encompassing dimensions such as allocative efficiency, technical efficiency, and
innovativeness” (p611). Lastly, conduct was known as the firm’s choice of key variables
such as advertising, price, and quality. However there were limitations to the
Bain/Mason paradigm. So Porter went on to discuss the new promise of industrial
organization. Earlier I showed the structure-conduct-performance paradigm, well below
is the updated version of it.
Industry Structure Conduct Performance
(Figure 3.2)
They switched to this new version because they decided that it is now recognized that
there is feedback effects of firm conduct on market structure. Industrial organization
has developed a lot since the 70s, and it seems like economist/researchers will continue
to make new developments.
3.3 Determinants of Firm Performance
Gary Hansen, a macroeconomist at UCLA is known for creating the theory of
indivisible labor. Hansen and a fellow colleague, Birger Wernerfelt, were also known for
an article called “Determinants of Firm Performance: The Relative Importance of
Economic and Organizational Factors” which was published in the Strategic
Management Journal. It’s a great article to read when trying to learn more about
managerial economics. The article is primarily about what determines firm performance
when emphasizing external market factors, as well as building on the behavioral and
sociological paradigm to see what factors determine success. According to Hansen and

14
Wernerfelt, they “construct and test three models of firm performance, first an example
from an economic perspective, second an example from an organizational perspective,
and the third an integration of the other two” (p399). So starting with the first model they
discuss what the major determinants of firm level profitability are. They are as follows:
characteristics of the industry in which the firm competes, the firm’s position relative to
its competitors and the quantity or quality of the firm’s resources. They used many
models at the firm and industry levels. The industry variables they found included:
growth concentration, capital intensity, and advertising intensity. Hansen and
Wernerfelt said, “A recent study by Schmalensee (1985) shows that differences
between industries as measured by average industry return on assets account for
almost all the explained variance in business unit performance” (p400). The remaining
variables that show firm performance are from the firm. One of the variables they used
was firm size.
Next they discussed the organizational model of firm performance. Many studies
have shown how changes in organizational structures and systems have altered
individual performance. The traditional model of an organizational climate is made up of
environmental, social, and organizational factors. The organizational climate then
results in how individuals behave/perform, and from that companies can see the
organizational performance.
In the organizational model, they found the same industry variables such as
growth rate, concentration, and barriers. To figure out the firms competitive position
they used the firms market share, and at the firm level they used the firm size so it was
pretty similar to the first model. After they integrated the two models of firm

15
performance, they were able to confirm the importance and independence of both
factors affecting firm performance.
3.4 The Economics of Managing
Roy Radner, a micro-economic theorist who is known for the Radner equilibrium,
wrote an article called “Hierarchy: The Economics of Managing” which was published in
the Journal of Economic Literature. This article talks about how important managing
has become in society. Radner mentioned at the beginning that back when Alfred
Marshall wrote the Principles of Economics that the typical firm in the United States was
small and was ran by an owner and maybe a few assistants whereas today we have
businesses like General Motors which have about a third of their employees in
management positions. This shows just how important the concept of management has
gotten over that period of time. Radner discusses “the sense in which the large
business enterprise is a small economy (and sometimes not so small), and the central
role of managing in that economy” (p1383). He says how important it is for
management to become an activity worthy of economic analysis. Since the
management sector of the firm makes so many different decisions it is important for the
information to be decentralized. Decentralized information allows for all the decisions to
be made to be based on all the observations. To put it simply, different decision makers
will usually have different information and therefore will make different decisions. So
the efficient decentralization of information is important. In a large firm, it is useful to
divide activities between managing and doing. Radner used the term managing instead
of management because they mean different things.

16
Definition: Management: (1) The act of managing, and (2) the collection of persons in
the firm called ‘managers’.
Definition: Managing: (1) Observe the environment and results of previous actions, (2)
make decisions, (3) process and communicate information, (4) monitor the actions of
other members, (5) train and teach, (6) hire and fire, (7) plan, (8) solve problems, and
(9) persuade, set goals, and set values.
A lot of times managers actually engage in other activities that look a lot like ‘doing’.
Since managers usually get help from staff, clerks, and assistants, they are all dong
activities known as managing. This is what Radner called the “decentralization of
managing” (p1389). This just shows how important the idea of managing is and how
much it plays a role in firm performance.
3.5 Theory and Research in Strategic Management
Robert Hoskisson, Michael Hitt, William Wan, and Daphne Yiu all wrote an article
called “Theory and Research in Strategic Management: Swings of a Pendulum” that
was published in the Journal of Management. The development of the field of strategic
management has dramatically increased within the last two decades. Because of the
recent rise of the resource-based view, the knowledge-based view, and strategic
leadership caused attention to get returned to the internal aspects of a firm. Early
researchers were mainly concerned with identifying the best strategies that would
contribute to the firm’s success. The authors go on to say, “In between the early
development of the field in the 60s and the rise of RBV in the 80s, however, the
pendulum had swung to the other extreme and only recently has started to return.
Developments in the field beginning in the 70s fostered a move toward industrial

17
organization economics” (p419). Thanks to Michael Porter, economists begin looking
into the structural aspects of the industry. However, it looks like now there is a
reemergence of internal firm characteristics. Because of the increased globalization,
and the rapid technological changes, researchers and economists will be struck with
many new problems that they will have to try to find answers for. The authors claim that
“because of the practical nature of the field, strategic management is likely to continue
to flourish by using a wide variety of theoretical perspectives and methodologies in
order to help explain firm performance” (p444). This article helps to show which
direction they think that economic research is heading.

18
CHAPTER 4
METHODS
4.1 Measures of Firm Performance- Dependent Variables
Before I begin talking about my dependent variables that I used in my regression
model, I want to first give you the definitions of firm performance and profitability.
Definition: Firm Performance: a relevant construct in strategic management research
and frequently used as a dependent variable. It is also the action or process of carrying
out or accomplishing an action, task, or function.
Definition: Profitability: the ability of a business to earn a profit. A profit is what is left of
the revenue a business generates after it pays all expenses directly related to the
generation of the revenue, such as producing a product, and other expenses related to
the conduct of the business activities.
There are many measures that can determine how a firm performs. In my
research I used return on assets, return on equity, and return on capital as my three
dependent variables to see how they relate to my independent variables which are
described later on in this chapter.
ROA (return on assets), ROE (return on equity), and the ROC (return on capital)
are all measures which help to show how profitable a company is. Beginning with ROA,
it is a measure of a company's profitability, equal to a fiscal year's earnings divided by its
total assets, expressed as a percentage. ROE is a measure of how well a company used
reinvested earnings to generate additional earnings, equal to a fiscal year's after-tax
income divided by book value, expressed as a percentage. It is used as a general
indication of the company's efficiency. In other words, it shows how much profit a

19
company is able to generate given the resources provided by its stockholders. Investors
usually look for companies with a high ROE and growing. Then there is the ROC which
is a measure of how effectively a company uses the money (owned or borrowed) invested
in its operations. The equation is as follows:
ROC= Net Operating Income after Taxes / [Total Assets - Cash and Investments - Non-
Interest-Bearing Liabilities]
If the ROC of a company exceeds its Weighted Average Cost of Capital, then the
company created value. If the ROC is less than the WACC, then the company destroyed
value.
Since ROA, ROE, and ROC are all measures of profitability, I began my research
by seeing if they were correlated or not. If the three variables were correlated it would
mean that throughout my research I would get similar output when using each as the
dependent variable in regards to the independent variables. After I ran my output I could
see that they were in fact correlated. The correlation matrix is shown below:
ROA ROE ROC
ROA 1.000 - -
ROE 0.53579 1.000 -
ROC 0.87922 0.64267 1.000
(Figure 4.1)
Since they are correlated 1:1:1, they had similar output when it came to running them
individually against the independent variables. So when viewing my results in Chapter

20
5, I will only use ROE as my dependent variable to report my findings since ROA and
ROC look very similar.
4.2 Determinants of Profitability- Independent Variables
There are many measures used to show how profitable a firm is. The first one that
we will talk about is the earnings before interest, taxes, depreciation and amortization.
The EBITDA is an approximate measure of a company's operating cash flow based on
information obtained from the company's income statement. It is calculated by looking at
earnings before the deduction of interest expenses, taxes, depreciation, and amortization.
The formula is as follows:
EBITDA = Revenue – Expenses (excluding interest, taxes, depreciation and amortization)
This earnings measure is of particular interest in cases where companies have large
amounts of fixed assets which are subject to heavy depreciation charges, or in the case
where a company has a large amount of acquired intangible assets on its books and is
thus subject to large amortization charges.
Next is a company’s earnings before interest and taxes, or better known as EBIT.
EBIT is a measure of a firm's earning power from ongoing operations, equal to earnings
before the deduction of interest payments and income taxes. EBIT excludes income and
expenditure from any unusual, non-recurring or discontinued activities. In the case of a
company with minimal depreciation and amortization activities, EBIT is watched closely
by creditors. The reason for that is because it represents the amount of cash that a
company will be able to use to pay off creditors which is also called operating profit.

21
On a similar note, operating profit margin is also a big indicator to how profitable a
company is. It indicates how effective a company is at controlling the costs and expenses
associated with their normal business operations. The operating profit margin gives the
business owner a lot of important information about the firm's profitability, especially with
regard to cost control. It shows how much cash is thrown off after most of the expenses
are met. When an operating profit margin is high it means that the company has good
cost control and/or that sales are increasing faster than costs, which is the favorable
situation for the company. Operating profit will be a lot lower than the gross profit since
selling, administrative, and other expenses are included along with cost of goods sold.
Then as the company grows and sales revenue grows, fixed costs, should become a
smaller and smaller percentage of total costs and with that the operating profit margin
should increase. A high operating profit margin usually means that the business firm has
a low-cost operating model.
The last measure that we are going to look at is the asset turnover ratio. The ratio
of the value of a company’s sales or revenues generated relative to the value of its assets.
The asset turnover ratio can often be used as an indicator of the efficiency with which a
company is deploying its assets in generating revenue. The formula is:
Asset Turnover = Sales or Revenues / Total Assets
In general, the higher the asset turnover ratio, the better the company is performing, since
higher ratios imply that the company is generating more revenue per dollar of assets. Yet,
this ratio can vary widely from one industry to the next. As such, considering the asset

22
turnover ratios of an energy company and a telecommunications company will not make
for an accurate comparison. Comparisons are only meaningful when they are made for
different companies within the same sector.
4.3 Determinants of Cash Flow- Independent Variables
There are also many ratios that help us analyze a cash flow. The first thing that
helps us analyze the cash flow is the operating cash flow divided by the net sales. This
ratio, which is shown as a percentage, compares a company's operating cash flow to its
net sales or revenues, which gives investors an idea of the company's ability to turn sales
into cash. It would be bad to see a company's sales grow without a parallel growth in
operating cash flow. Positive and negative changes in a company's terms of sale and/or
the collection experience of its accounts receivable will show up in this indicator.
The formula is as follows:
(Figure 4.2)
The next ratio we will discuss is the Operating Cash Flow to Net Income which is
used to analyze the earnings quality. This ratio can be used against the income statement
to determine the quality of a firm’s reported earnings. As the name implies, the ratio is
calculated by dividing a company's operating cash flow by its net income. Operating cash
flow is an item found on the Statement of Cash Flows, and is often labeled "Cash from
Operating Activities". Basically, all business activities are placed in one of the three
following categories: Operating, Investing, and Financing. Operating activities are the
core business activities. For instance, a company like ADM buys grain from farmers and
23
transports it as its core operating activity; if ADM sold a piece of land it owned, that cash
increase would not appear as cash provided by operating activities. Once you've located
your CFFO number, move over to the income statement and find net income. Make sure
you use the after tax figure, and then you just have to divide the two. After that is done
then you have your ratio.
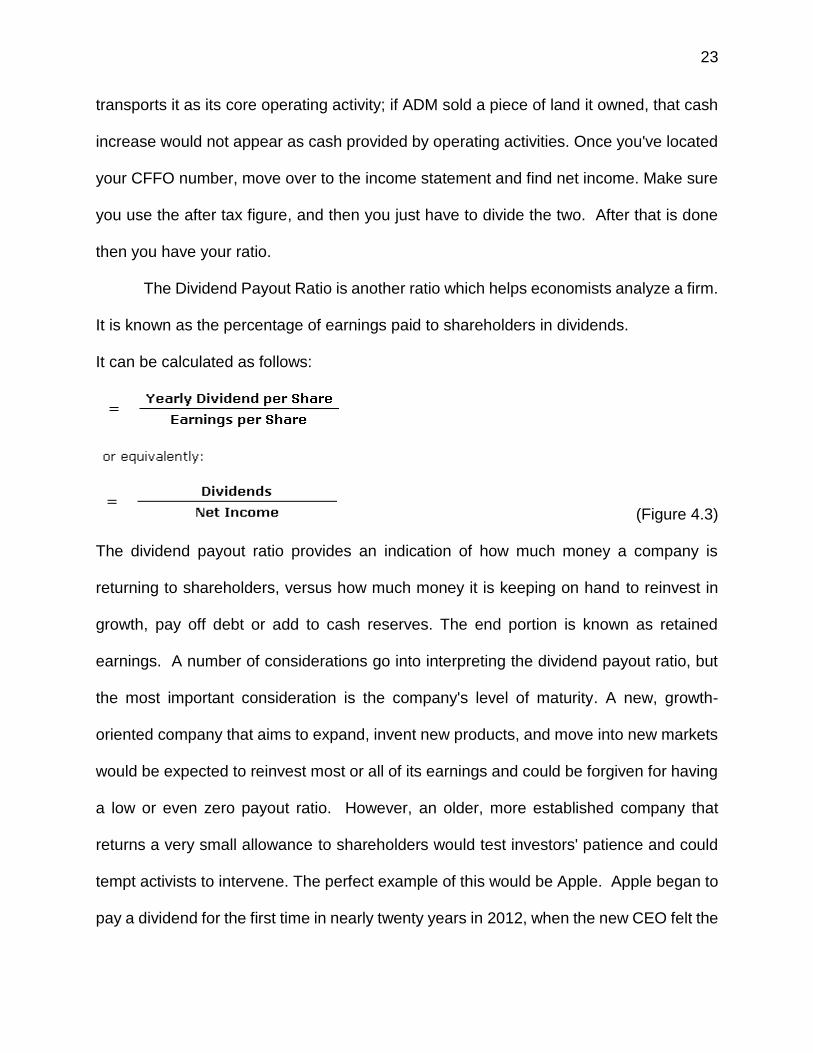
The Dividend Payout Ratio is another ratio which helps economists analyze a firm.
It is known as the percentage of earnings paid to shareholders in dividends.
It can be calculated as follows:
(Figure 4.3)
The dividend payout ratio provides an indication of how much money a company is
returning to shareholders, versus how much money it is keeping on hand to reinvest in
growth, pay off debt or add to cash reserves. The end portion is known as retained
earnings. A number of considerations go into interpreting the dividend payout ratio, but
the most important consideration is the company's level of maturity. A new, growth-
oriented company that aims to expand, invent new products, and move into new markets
would be expected to reinvest most or all of its earnings and could be forgiven for having
a low or even zero payout ratio. However, an older, more established company that
returns a very small allowance to shareholders would test investors' patience and could
tempt activists to intervene. The perfect example of this would be Apple. Apple began to
pay a dividend for the first time in nearly twenty years in 2012, when the new CEO felt the

24
company's enormous cash flow made a 0% payout ratio hard to justify. Since it implies
that a company has moved past its initial growth stage, a high payout ratio means share
prices are unlikely to appreciate rapidly.
The payout ratio is also useful for other reasons. It helps assess a dividend's
sustainability. Companies are extremely hesitant to cut dividends because it can drive the
stock price down and reflect poorly on the management's abilities. If a company's payout
ratio is over 100%, it is returning more money to shareholders than it is earning and will
probably be forced to lower the dividend or in some cases to stop paying it altogether.
However, that result is not certain to happen. A company can pull through a bad year
without suspending payouts, and it is often in their best interest to do so. Therefore, it is
very important to consider future earnings expectations. Long-term trends in the payout
ratio also matter. A gradual increase in this ratio could indicate a healthy and maturing
business, but one that spikes could mean the dividend is heading into an unsustainable
territory.
The Dividend Coverage Ratio is used to analyze a cash flow because it states the
number of times an organization is capable of paying dividends to shareholders from the
profits earned during an accounting period. The formula is as follows:
Dividend Coverage Ratio = (Profit after tax - Dividend paid on Irredeemable Preference
Shares) / Dividend paid to Ordinary Shareholders
This ratio indicates the capacity of an organization to pay dividends out of profit
attributable to the shareholders. For example, a dividend cover of 3 implies that a

25
company has sufficient earnings to pay dividends amounting to 3 times of the present
dividend payout during the period. When calculating dividend coverage for ordinary share
capital, it is necessary to deduct any dividend paid on irredeemable preference shares
from the net profit earned during the accounting period in order to arrive at the earnings
attributable to ordinary shareholders. A dividend on redeemable preference shares is
already deducted from the income statement as interest expense, and with that no further
adjustment is required in its respect in the dividend cover calculation.
4.4 Determinants of Structure- Independent Variables
Just like when looking at a firm’s profitability and cash flow analysis, there are also
many ratios that help determine how good the structure of a firm is. The current ratio is
an indication of a company's ability to meet short-term debt obligations. With that said,
the higher the ratio, the more liquid the company is. The formula is as follows:
Current ratio = current assets / current liabilities.
If the current assets of a company are more than twice the current liabilities, then that
company is generally considered to have good short-term financial strength. If current
liabilities exceed current assets, then the company may have problems meeting its short-
term obligations.
The quick ratio is the next ratio that helps us analyze the structure of a firm. It is a
measure of a company's liquidity and ability to meet its obligations. The quick ratio, often
referred to as acid-test ratio, is obtained by subtracting inventories from current assets
and then dividing by current liabilities. Quick ratio is viewed as a sign of company's

26
financial strength or weakness. The higher number means financial strength, and the
lower number means financial weakness.
The next ratio is the debt to asset ratio. The debt to assets ratio indicates the
proportion of a company's assets that are being financed with debt, rather than equity.
The ratio is used to determine the financial risk of a business. A ratio greater than 1 shows
that a pretty big proportion of assets are being funded with debt, while a low ratio indicates
that the bulk of asset funding is coming from equity. A ratio greater than 1 also indicates
that a company may be putting itself at risk of not being able to pay back its debts, which
can turn out to be a big problem. A company may also be at risk of nonpayment if its debt
is subject to sudden increases in interest rates, as is the case with variable-rate debt.
Some lenders may make requirements to counteract this problem. For example, Banterra
Bank would make restrictive covenants that would force excess cash flow into the debt
repayment, they would restrict alternative uses of cash, and they might even require
investors to put more equity into the company. To calculate the debt to assets ratio, divide
total liabilities by total assets. The formula is:
Debt to Asset Ratio = Total liabilities / Total assets
A variation on the formula is to subtract intangible assets from the denominator, to be
able to focus on the tangible assets that were more likely acquired with debt.
The next ratio we use to determine how the well the financial structure of a firm is
doing is the Debt to Equity Ratio. The Debt/Equity Ratio is a debt ratio used to measure
a company's financial leverage, and is calculated by dividing a company’s total liabilities

27
by its stockholders' equity. The D/E ratio indicates how much debt a company is using to
finance its assets relative to the amount of value represented in shareholders’ equity. The
formula is as follows:
Debt to Equity Ratio = Total Liabilities / Shareholders' Equity
The result may often be expressed as a number or as a percentage. This ratio can be
applied to personal financial statements as well as corporate ones, in which case it is also
known as the Personal Debt to Equity Ratio. Here, “equity” refers not to the value of
stakeholders’ shares but rather to the difference between the total value of a corporation
or individual’s assets and that corporation or individual’s liabilities. The formula for this
form of the D/E ratio is as follows:
D/E = Total Liabilities / (Total Assets - Total Liabilities)
This equation is not used nearly as often as the first equation is used.
The next ratio discussed is the Receivables Turnover Ratio. It is an accounting
measure used to quantify a firm's effectiveness in extending credit and in collecting debts
on that credit. The receivables turnover ratio is an activity ratio measuring how efficiently
a firm uses its assets. Receivables turnover ratio can be calculated by dividing the net
value of credit sales during a given period by the average accounts receivable during the
same period. Average accounts receivable can be calculated by adding the value of

28
accounts receivable at the beginning of the desired period to their value at the end of the
period and dividing the sum by two.
The method for calculating receivables turnover ratio can be represented with the
following formula:
(Figure 4.4)
The receivables turnover ratio is most often calculated on an annual basis. However, this
can be broken down to find quarterly or monthly accounts receivable turnover as well.
The last measure we will look at to analyze the financial structure of a firm is the
Inventory Turnover Ratio. Inventory turnover is a measure showing how many times a
company's inventory is sold and replaced over a period. The days in the period can then
be divided by the inventory turnover formula to calculate the days it takes to sell the
inventory on hand or "inventory turnover days."
Generally it is calculated as:
Inventory Turnover = Sales / Inventory
Or as:
Inventory Turnover = Cost of Goods Sold / Average Inventory
Although the first calculation is more frequently used, costs of goods sold may be
substituted because sales are recorded at market value, while inventories are usually
recorded at cost. Also, average inventory may be used instead of the ending inventory

29
level to minimize seasonal factors. This ratio should be compared against industry
averages. A low turnover implies poor sales and, therefore, excess inventory. A high ratio
implies either strong sales or ineffective buying. High inventory levels are unhealthy
because they represent an investment with a rate of return of zero. It also opens the
company up to trouble should prices begin to fall.
4.5 Descriptions of Agribusinesses Used
Using the Bloomberg Database I was able to find a lot of financial information for
many agribusinesses in regards to profitability, cash flow, and financial structure. In this
section I’ll talk to you about the different types of agribusinesses used in my research.
The first group of companies I’m going to talk about is Caterpillar Incorporated,
Deere & Company, AGCO Corporation, and Tractor and Supply Company. Caterpillar
Inc. designs, manufactures and markets construction, mining and forestry machinery.
The Company also manufactures engines and other related parts for its equipment, and
offers financing and insurance. Caterpillar distributes its products through a worldwide
organization of dealers. Deere & Company manufactures and distributes a range of
agricultural, construction and forestry, and commercial and consumer equipment. The
Company supplies replacement parts for its own products and for those of other
manufacturers. Deere also provides product and parts financing services. Deere and
Company extends its services and products worldwide. AGCO Corporation
manufactures and distributes agricultural equipment throughout the world. The
Company sells a range of agricultural equipment and related replacement parts,
including tractors, combines, hay tools, sprayers, and forage equipment. AGCO markets
its products under a variety of brand names, including Massey Ferguson,

30
AGCO, Tye, GLEANER, and Hesston. Tractor and Supply Company is a similar
company to Deere and Company, Caterpillar Incorporated, and AGCO Corporation.
Tractor Supply Company operates a retail farm store chain in the United States. The
Company provides farm maintenance products, animal products, general maintenance
products, lawn and garden products, light truck equipment, work clothing, and other
products. Customers include hobby, part-time, and full-time farmers and ranchers, as
well as rural customers, contractors, and tradesman.
The next group of companies I’m going to discuss are as follows: Berkshire
Hathaway Company, Dow Chemical, BASF, Bunge, Sumitomo Chemical, CF Industries
Holdings Incorporated, and Mosaic. These are all similar companies because they
either deal with chemical or fertilizer. Berkshire Hathaway Inc. is a holding company
owning subsidiaries in a variety of business sectors. The Company's principal
operations are insurance business conducted nationwide on a primary basis and
worldwide on a reinsurance basis. Berkshire's other operations include a railway
company, a specialty chemical company, and an international association of diversified
businesses. The Dow Chemical Company is a diversified chemical company that
provides chemical, plastic, and agricultural products and services to various essential
consumer markets. The Company serves customers in countries around the world in
markets such as food, transportation, health and medicine, personal care, and
construction. Suimitomo Chemical Company LTD manufactures chemical products.
The Company specializes in basic chemicals, petrochemicals, fine chemicals such as
photoresists, pharmaceutical intermediates, and agrochemicals. Sumitomo Chemical
operates manufacturing plants and sales offices worldwide. CF Industries Holdings,

31
Inc. manufactures and distributes nitrogen and phosphate fertilizer products globally.
The Company's principal products in the nitrogen segment are ammonia, urea, urea
ammonium nitrate solution, ammonium nitrate, diesel exhaust fluid and aqua ammonia.
The principal products in the phosphate segment are diammonium phosphate and
monoammonium phosphate. The Company has operations in pharmaceutical, animal
health, and consumer care. The Mosaic Company produces and distributes crop
nutrients to the agricultural communities located in North America and other countries.
The Company's principal products include concentrated phosphates, and potash.
Bunge Limited is a global agribusiness and food company. The Company buys, sells,
stores, transports and processes oilseeds and grains to make protein meal for animal
feed and edible oil products for commercial customers and consumers. Bunge also
produces sugar and ethanol from sugarcane, mills wheat and corn, and sells fertilizer.
Those are all the chemical, fertilizer, and pharmaceutical companies I looked at for my
research.
The next three companies make mostly pharmaceutical products. They are Eli
Lilly and Company, Merck & Company, and Bayer. Eli Lilly and Company discovers,
develops, manufactures, and sells pharmaceutical products for humans and animals.
The Company's products are sold in countries around. Eli Lilly's products include
neuroscience products, endocrine products, anti-infectives, cardiovascular agents,
oncology products, and animal health products. Merck & Company, Incorporated is a
global health care company that delivers health solutions through its prescription
medicines, vaccines, biologic therapies, animal health, and consumer care products,
which it markets directly and through its joint ventures. Bayer AG produces and

32
markets healthcare and agricultural products, and polymers. The Company
manufactures products that include aspirin, antibiotics, and cardiovascular, oncology,
and central nervous system drugs, over-the-counter medications, diagnostics, animal
health products, crop protection products, plastics, and polyurethanes.
Another group of companies that are similar are Coca Cola, PepsiCo, Hershey,
and J.M. Smucker. These companies all produce sugary related products. The Coca-
Cola Company manufactures, markets, and distributes soft drink concentrates and
syrups. The Company also distributes and markets juice and juice-drink products.
Coca-Cola distributes its products to retailers and wholesalers in the United States and
internationally. PepsiCo, Inc. operates worldwide beverage, snack and food
businesses. The Company manufactures or uses contract manufacturers, markets and
sells a variety of grain based snacks, carbonated and non-carbonated beverages and
foods in countries throughout the world. The Hershey Company manufactures
chocolate and sugar confectionery products. The Company's principal products include
chocolate and sugar confectionery products; gum and mint refreshment products; and
pantry items, such as baking ingredients, toppings and beverages. The JM Smucker
Company manufactures and markets food products on a worldwide basis. The
Company's principal products include peanut butter, shortening and oils, fruit spreads,
canned milk, baking mixes and ready-to-spread frostings, flour and baking ingredients,
juices and beverages, frozen sandwiches, dessert toppings, syrups, pickles and
condiments, and potato side dishes.
ConAgra, General Mills, Dean Foods, Kraft Foods, Kellogg, Smithfield Foods,
Campbell Soup, Tyson Foods, and US Foods are all companies that manufacture and
33
market different kinds of foods. ConAgra Foods, Inc. manufactures and markets
packaged foods for retail consumers, restaurants and institutions. The Company offers
a wide range of food products, including meals, entrees, condiments, sides, snacks,
specialty potato products, milled grain ingredients, dehydrated vegetables and
seasonings, and blends and flavors. General Mills, Inc. manufactures and markets
branded and packaged consumer foods worldwide. The Company also supplies
branded and unbranded food products to the foodservice and commercial baking
industries. Dean Foods Company is a food and beverage company that produces a full
line of Company-branded and private label dairy and dairy-related products. The
Company provides products such as milk and milk-based beverages, ice cream, half
and half, whipping cream, sour cream, cottage cheese, yogurt, dips, and soy milk. Dean
Foods also supplies pickles, juice, juice drinks, and water. Kraft Foods Group, Inc. is a
food company. The Company is focused on consumer packaged food and beverages
for North American Grocery stores. Kraft Foods offers a wide range of branded
beverages, cheese, grocery products and convenient meals. Kellogg Company
manufactures and markets ready-to-eat cereal and other convenience foods. The
Company's products include cereals, cookies, crackers, toaster pastries, cereal bars,
fruit snacks, frozen waffles and veggie foods. Kellogg markets its products in the United
States, Canada, and other countries throughout the world. Campbell Soup Company,
with its subsidiaries, manufactures and markets branded convenience food products.
The Company's core divisions include soups and sauces, biscuits and confectionery,
and foodservice. Campbell's distributes its products worldwide. Smithfield Foods, Inc.
processes pork and produces hogs through its meat processing and hog production

34
groups. The Company also produces and markets a range of branded food products
such as frozen barbecues and chilies, peanuts, and pork products. Smithfield's products
are sold on a wholesale basis, through catalogs, through its retail stores, and via the
Internet. US Foods, Inc. distributes food products. The Company offers fresh meats,
appetizers, prepared meals, and frozen foods. US Foods serves educational
institutions, restaurants, healthcare, hospitality, and government sectors. Tyson Foods,
Inc. produces, distributes, and markets chicken, beef, pork, prepared foods and related
allied products. The Company's products are marketed and sold to national and regional
grocery retailers, regional grocery wholesalers, meat distributors, warehouse club
stores, military commissaries, and industrial food processing companies.
The next two companies, Monsanto and Agrium Incorporated, are two pretty
large companies that produce many different agriculture products. Monsanto Company
provides agricultural products for farmers. The Company's business segments are
seeds and genomics. Monsanto produces a wide range of seeds and develops
biotechnology traits that assist farmers in controlling insects and weeds as well as
provides other seed companies with genetic material and biotechnology traits for their
seed brands. Agrium Incorporated is a major retail supplier of agricultural products and
services in North America, South America, and Australia. They are a wholesale
producer and marketer of all three major agricultural nutrients and a supplier of specialty
fertilizers in North America. And the last two that I’ll discuss are ADM and The
Andersons. Both of these companies are both large processors. The Andersons, Inc.
merchandises grain, operates grain elevator facilities, distributes wholesale agricultural
fertilizer, and distributes agricultural inputs to dealers and farmers. The Company also

35
manufactures lawn fertilizer and corncob-based products, and purchases, sells, repairs,
and leases railcars. In addition, The Andersons operates retail stores and a distribution
center. ADM is one of the world’s leading agricultural processors. They produce the
food ingredients, animal feeds and feed ingredients, biofuels and other products that
manufacturers around the world use to provide wholesome food and a better life to
millions of people around the globe.
All of these companies have one main thing in common and that is that they are
a part of the agriculture sector. Between them all there is quite the range of agricultural
products produced.
4.6 Methods of Research
Using TSP (a statistical program), I identified some factors which significantly
affected performance. I used return on assets, return on equity, and return on capital as
my three dependent variables. As mentioned earlier on in the chapter, I will only use
ROE to show my results since ROE, ROA, and ROC are all so strongly correlated. All
other variables listed in 4.2-4.5 were the independent variables used in the regression
model. I used the Bloomberg terminal at Southern Illinois University, and I collected the
financial data for 32 agribusinesses over a time period of 5 years. That financial
information allows me to do a cross sectional analysis over the 32 businesses. I was
able to do a panel data regression to compare all 32 companies over their course of 5
years. So using the data collected from Bloomberg, and using tsp software, I identified
some variables that affect firm performance.

36
CHAPTER 5
RESULTS
5.1 Panel-Data Results for 2011-2015
Before I begin explaining what I have found in my research I want to define a few
important statistical words for you.
Definition: Dummy Variable: an artificial variable created to represent an attribute with
two or more distinct categories/levels.
Definition: Panel-Data Analysis: (also known as longitudinal or cross- sectional time-
series data) is a dataset in which the behavior of entities are observed across time.
These entities could be states, companies, individuals, countries, etc.
Definition: Cross-Sectional Analysis: a type of observational study that involves the
analysis of data collected from a population, or a representative subset, at one specific
point in time
Definition: Time-Series Analysis: a sequence of numbers collected at regular intervals
over a period of time
My panel data is the most important set of data I have because there is
heterogeneity in these units and panel data models take that heterogeneity into account
by allowing for subject-specific variables. Panel data gives more informative data, more

37
variability, less collinearity, more degrees of freedom, and more efficiency. By studying
the repeated cross section of observations, panel data are better suited to study the
dynamics of change. It is better suited to measure the effects that you can’t really
measure with just cross sectional models or just time series models. Therefore, it
allows economists to look at more complex models and get more information out of
what they are looking at.
Looking through my panel-data results, I chose 3 models to show what I found to be
important. Model A includes dummy variables for each agricultural business. When
using a dummy variable in a regression model, you leave one of them out. In this case,
I left out U.S. Foods. Since I left that company out, I am able to look at the beta
coefficients and compare other companies to U.S. Foods as well as to one another to
show which company is doing the best in regards to the dependent variable, return on
equity, as well as in regards to the other independent variables listed. Model B shows
the dependent variable, return on equity, in regards to all of the independent variables.
Lastly, Model C shows the results of the mean correlation model. Each model is a
different form of panel data.
Just to remind you what return on equity is so you can easily understand what I am
saying, below is the definition:
Definition: Return on Equity: it shows how much profit a company is able to generate
given the resources provided by its stockholders. Investors usually look for companies
with a high ROE and growing. It is used to show a company’s efficiency.
First let’s look at Model B since it is the most basic model. Model B is just the
dependent variable (ROE) with all of the independent variables. There were a few

38
significant independent variables that affected ROE. They were the operating profit
margin, asset turnover ratio, cash flow of operations to sales, cash flow to net income,
dividend payout, quick ratio, debt to asset, debt to equity, and account receivable
turnover. So when operating profit is equal to 1, return on equity actually increases by
.579683%. This makes sense because the operating profit margin is used to measure a
company’s pricing strategy and operating efficiency. If the company is operating
efficiently then the return on equity will go up due to a higher profit. When the asset
turnover ratio is 1, ROE increases by 7.13197%. If sales are profitable, the higher the
asset turnover ratio, the greater the profits and the higher the ROE. When cash flow of
operations to sales is 1, ROE increases by .180911%. This is true because cash flow of
operations to sales shows how quickly a company can generate cash from the sales it
makes, so the more cash a company gets from sales, the higher the return on equity will
be. If the cash flow to net income is 1 then ROE will decrease by .310319%. Since the
cash flow from operations to net income ratio reveals the percentage of a company's
total net income that is available as cash for investing and financing ongoing operations,
the return on equity will decrease because this money isn’t part of the profit. When the
dividend payout ratio is 1, ROE decreases by .067463%. Since dividend payout is the
percentage of money that is being paid out to stockholders, it only makes sense that the
ROE would decrease. When the quick ratio is 1, ROE increases by .00484947%. The
quick ratio measures the dollar amount of liquid assets available for each dollar of
current liabilities. So it causes an increase in ROE because if a company needed to
then it could easily liquidate enough assets to pay any costs. When debt to asset is 1,
ROE increases by .451146%. This makes sense because a low debt to asset would

39
mean that a company owns most of its assets. It would increase the ROE because the
more assets a company owns, the more profitable it is. When debt to equity is 1, ROE
increases by .0000113807%. The debt to equity ratio indicates how much debt a
company is using to finance its assets relative to the amount of value represented in
stockholders' equity. If debt to equity is small then that means that a company isn’t
using as much money to finance its assets compared to how much is represented by
stockholders which could cause the ROE to increase. Lastly, when accounts receivable
turnover is 1, ROE decreases by .725539%. This ratio is used to show how quickly a
company can turnover its receivables. A higher ratio shows that a company can collect
its money quickly. It decreases the return on equity though because it is money that is
invested and doesn’t actually earn a return until the company does turn it over. So after
going over Model B, we saw that every value that was significant in the regression
model actually did make sense. Now that Model B has been explained we will move to
Model A.
Model A, like Model B, shows return on equity as the dependent variable, and it
shows all the same independent variables. The only change is that all of the companies
are listed as dummy variables. With this model we are actually able to see which
variables are significant, and we can compare each company to one another in regards
to ROE, the independent variables, and U.S. Foods (the dummy variable that was left
out). The significant variables in this model are operating profit margin, cash flow of
operations to sales, dividend payout, quick ratio, debt to asset, account receivable
turnover, and inventory turnover. Since I already explained earlier for Model B how the
variables can be significant, I’ll just discuss which companies are worse off and which
40
are better off than U.S. Foods. Looking through the list of beta coefficients, you can see
that only Dean Foods is actually better off than U.S. Foods in regards to ROE and the
independent factors. All the other companies are worse off than U.S. Foods. Berkshire,
Tyson Foods, and Campbell Soup all come in close to U.S. Foods. The rest of the
companies are all in the 100s with Monsanto doing the worst of all with a beta
coefficient of -190.732. However it does make sense that Monsanto has the farthest off
ROE compared to U.S. Foods because Monsanto (although a large company) has a
negative public image in many countries so it makes sense that they aren’t given the
same amount of resources from stockholders in comparison to the other agriculture-
related companies. Of course, it is noted that if I split the companies up into smaller
groups such as all of the chemical companies in one, all of the retail companies in one,
all of the equipment sales companies in one, and so on then I would better be able to
see who had the best return on equity out of the individual groups of companies.
Below is Table 1 which contains all of the panel data that I discussed.

41
Table 1: Panel-Data Analysis
Variable Model A Model B
Constant
208.615 (5.36376)
6.18499 (.453466)
EBITDA
-0.578430E-09 -.347319E-09 (-0.084977) (-.429925)
EBIT
0.185308E-09 -.191915E-09 (.027805) (-.114844)
Operating Profit Margin
0.971002 .579683
(3.94430) (2.52345)
Asset Turnover
-0.498714 7.13197 (-.051956) (1.83751)
CFO/Sales
0.324424 .180911 (1.87410) (1.38432)
Cash Flow/Net Income
0.058649 -.310319
(.250515) (-1.14423)
Dividend Payout
-0.050657 -.067463 (-.771324) (-1.06130)
Cash Dividend Payout
-0.219121 -.286541 (-.404300) (-.480162)
Current Ratio
2.19938 -1.22027 (.439392) (-.307687)
Quick Ratio
0.16642E-02 .484947E-02
(.775279) (1.76643)
Debt to Asset
-0.293316 .451146
(-1.15298) (2.40568)
Debt to Equity
-0.259583E-05 .113807E-04 (-.341461) (1.16577)
Account Receivable Turnover
1.66385 -.725539 (2.25477) (-2.08358)
Inventory Turnover
-13.4618 .161125 (-6.77330) (.281987)
Archer Daniel Midland -129.986
(-5.19499)
AGCO -161.166 (-5.63672)
Agrium -137.082 (-4.72975)
BASF -140.346 (-4.93111)
Bayer -158.272 (-5.18728)
Berkshire -38.7251 (-1.34605)

42
Bevo -119.923 (-5.13346)
Bunge -113.070
(-4.93806)
Campbell -88.1596 (-3.44627) Caterpillar -146.552 (-5.02825) CF Industries -136.505 (-4.58496) Coca Cola -135.370 (-4.96522) ConAgra -156.377 (-6.02296) Dean Foods 164.121 (10.5812) Deere and Company -123.133 (-4.86603) Dow Agrosciences -141.768 (-5.27236) Eli Lilly -196.074 (-5.75232) General Mills -126.877 (-5.02707) Hershey -118.186 (-4.58569) J.M. Smucker -186.447 (-6.21284) Kellogg -90.5048 (-4.01906) Kraft Food -129.570 (-5.23887) Merck -188.370 (-5.20487) Monsanto -190.732
(-5.45497) Mosaic -172.518 (-5.55377) Pepsi -90.6323 (-3.76238) Smithfield Foods -155.750
(-6.17918)
Sumitomo Chemical -134.120 (-.659389) Anderson -116.763 (-4.40359) Tractor Supply Company
-151.437
(-4.40234) Tyson Foods -77.7159 (-3.87233) Number of Observations 159 160 Log Likelihood -646.917 -727.059 F Value 5.59778 2.48506 R-Squared .690326 .193507 Std. Error of Regression 16.7849 23.9124
T-Values are in Parenthesis.

43
CHAPTER 6
SUMMARY AND CONCLUSION
The main purpose of this research paper was to find factors which affect firm
performance and to look at the economics of the firm. I discussed managerial
economics and how important it is for management to know about different factors that
affect firm performance so that they would be able to make strategic decisions based off
of that knowledge. I discussed the economic base theory, the neoclassical growth
theory, and different entrepreneurship theories which included the resource based view
of the firm.
After looking at the economics of the firm, I was able to find related literature
written by different economists such as Michael Porter and Roy Radner which helped to
expand my view of different industry factors which could affect the firm. The related
literature also expanded my view on competition and strategic management.
Then after collecting my own data on different financial measures for 32 different
agribusinesses, I was able to see which financial measures significantly affected firm
performance. As mentioned in Chapter 5, the results were that the operating profit
margin, cash flow of operations to sales, dividend payout, quick ratio, debt to asset,
debt to equity, account receivable turnover, and inventory turnover were all significant
measures that affected firm performance. I was also able to compare the 32
agribusinesses with one another to see which company had the best return on equity
compared to the other firms. Of course, it was also noted that if I split the companies up
into smaller groups such as all of the chemical companies in one, all of the retail
companies in one, all of the equipment sales companies in one, and so on then I would

44
better be able to see who had the best return on equity out of the individual groups of
companies.
There will always be many factors which affect firm performance. Understanding
these factors, and learning about these factors will help companies to make better
business decisions based on the economics of the firm. It will help management to be
able to look at things in a more strategic manner. So the variables that affect firm
performance are important in order for the company to perform at its best.

45
BIBLIOGRAPHY Financial Data for 2011-2015. Bloomberg database. Southern Illinois University-Collage
of Business, Carbondale, IL. Accessed November 12, 2015. Hansen, Gary S., and Birger Wernerfelt. "Determinants of Firm Performance: The
Relative Importance of Economic and Organizational Factors." Strat. Mgmt. J. Strategic Management Journal 10.5 (1989): 399-411. Web.
Hirsch, Stefan, Jan Schiefer, Adelina Gschwandtner, and Monika Hartmann. "The
Determinants of Firm Profitability Differences in EU Food Processing." Journal of Agricultural Economics 65, no. 3 (2014): 703-21.
Hoskisson, R. E. "Theory and Research in Strategic Management: Swings of a
Pendulum." Journal of Management 25.3 (1999): 417-56. Web. “Investopedia-Educating the World about Finance.” Investopedia. Accessed December,
06, 2015. http://www.investopedia.com/. Mahoney, Joseph T., and J. Rajendran Pandian. "The Resource-based View within the
Conversation of Strategic Management." Strat. Mgmt. J. Strategic Management Journal 13.5 (1992): 363-80. Web.
Newbert, Scott L. "Empirical Research on the Resource-based View of the Firm: An
Assessment and Suggestions for Future Research." Strat. Mgmt. J. Strategic Management Journal 28.2 (2006): 121-46. Web.
Porter, Michael E. "The Contributions of Industrial Organization to Strategic
Management." Academy of Management Review 6.4 (1981): 609-20. Web. Porter, Michael E. "The Five Competitive Forces That Shape Strategy." Harvard
Business Review (2008): 25-41. Print. Radner, Roy. "Hierarchy: The Economics of Managing." Journal of Economic Literature
30 (September 1992): 1382-415.

46
VITA
Graduate School Southern Illinois University
Casey Engel [email protected] Southern Illinois University Carbondale Bachelor of Science in Agribusiness Economics, May 2015 Southern Illinois University Carbondale Bachelor of Science in Crop, Soil, and Environmental Management, May 2015 Research Paper Title: Economics of the Firm: Identifying Factors Affecting the Performance of Agribusiness Corporations Major Professor: Dr. Wanki Moon