economics of reproduction efficiency in beef cow
TRANSCRIPT

Economics of Reproduction Efficiency in Beef Cow Herds
Harlan Hughes Extension Livestock Economist North Dakota State University Fargo, North Dakota
Introduction
As of January 1, 1990 the nation's cattle herd was made up of 43.854 million beef and dairy cows. The nation's cow herd is currently down 13.1 million head from the peak in 1975 of 56.9 million head. The total number of cows and replacement heifers projected to calve in 1990 is 51.2 million head. These 51.2 million bred cows and heifers, however, are projected to have 40.7 million calves in 1990. This suggests a 79.5 percent calf crop based on calves weaned divided by cows and heifers exposed to bulls.
North Dakota financial records indicate that participants are experiencing a calf death rate from birth to weaning of 3.7 - 5.0 percent. If this death rate is indicative of the national death rate, the national percent calf crop based on calves born, to the number of cows and heifers exposed is 84.5 percent. This percentage is based on live calves born, divided by cows and heifers exposed. I believe that an 85 percent live calf crop would be typical for North Dakota.
Using percent calf crop weaned as a proxy for "reproductive efficiency" suggests that the nation's beef farmers and ranchers somehow are losing out on the potential production of 10.5 million calves in 1990. At today's projected fall 1990 prices of $95 per hundred weight, this suggests that beef farmers and ranchers will lose a potential $4 billion due to reproduction efficiencies in 1990.
One set of scientists suggests that the problem is man-agement.
Stated simply, development and adoption of management technology has not kept pace with scientific knowledge. This has occurred because of our chronic inability to link scientific strategy to economic reality. (Williams & Harms, pg 50)
They go on to say: Most technology is targeted for technically complex production systems, but these systems do not predominate in the cow-calf industry.
Are they suggesting many of our technologies are not applicable at the on-farm level? Or, could it be that the economic reality is that many of the technologies are not economically viable on the farm?
The national data suggests that percent calf crop is affected, to some extent, by management as the nation's
62
percent calf crop goes up when beef prices go up (see Figure 1 ). Changing percent calf crop in response to changing calf prices suggests that beef farmers and ranchers change their reproduction practices in response to economic stimuli. This even suggests that beef farmers' and ranchers' economic reality is that they use some technologies when prices are high and do not use some technologies when prices are low. This suggests that the economic reality might be that beef farmers will use more veterinary services when calf prices are high and they will use less veterinarian services when calf prices are low.
Figure 1. National Percent Calf Crop
Beef Cows Percent 'E
ffi~ffi~ronnn~~~n~~oo&~~~~~~~~oo~~ Years
Objective
The objective of this presentation is to suggest how a practicing veterinarian can go about integrating economic reality into his client services. I will concentrate on projecting the increased economic revenue associated with increasing your clients' beef herd's reproductive efficiencies. Other speakers at this conference will cover how reproductive efficiency can be increased and what it might cost to get the increased efficiencies. It will be left up to the con-
THE BOVINE PROCEEDINGS-No. 2:
0 "'O (D
~
~ (") (D 00 00
0.. ...... 00 ,-+-'"i
~ ~ ...... 0 p

ference participants to compare my projected increased revenues to the other speaker's projected cost increases.
Economic Reality
Whether the farm or ranch operation is entirely dependent on cattle or is diversified into crops, wildlife, or recreation, just being a top beef producer in the 1990's will no longer guarantee economic survival. Continued profitability during the 90's as beef prices start to decrease will require that careful economic consideration be given to the interactions of production and resource utilization. In the decade of the '90's, everything must count and everything must pay.
In light of the financial stress of the early 1980's, astute beef farmers and rancers are asking animal scientists and production economists to identify those management factors that will help ensure their economic survival in the 1990's. This necessitates that applied beef research not only focus on the biological aspects of beef production, as has frequently been done in the past, but future applied research will need to focus on the value of products produced and the costs of the resources consumed. Beef farmers and ranchers are insisting that researchers conduct an economic analysis of each and every applied production technology recommended.
An example of where technology evaluation has to go beyond the traditional biological analysis could be in comparative feeding trials. Evaluating one feeding program against another based on feed efficiency (pounds of feed/pound of gain) does not necessarily measure profitability. Feeding efficiency is an even poorer proxy for cost of gain.
While profits may be correlated with feed efficiency, the correlation is not 1.0 as is frequently implied. In addition to the correlation between production and profit not being 1.0, the incremental gains from new technologies tend to be smaller and smaller. All of the easy research has been done. Rather than being able to make general recommendations based solely on biological response, researchers now need to determine the economic response associated with the biological response before production recommendations are made.
Economics has always played an important role in technology adoption. As calf prices go up, more technology becomes profitable and as beef prices start down in the 1990's, more technology will become economically infeasible as gross margins in the beef cow enterprise narrow.
Beef farmers and ranchers decisions to adopt new technologies and/or to adopt Recommended Best Management Practices (RBMP) have now to be based on two conditions. First, there has to be a positive biological response and, second, there has to be a favorable economic response.
Today, not all new technologies and RBMP's enhance profits. Examples are creep feeding and preconditioning
JANUARY, 1991
calves. It is clear that these two RBMP's will generate a biological response. It is not at all clear that these practices will generate a positive economic response. This is especially true if calf prices are adjusted downward because of additional weight.
As economic conditions change during the cattle cycle, the profitability of new technologies and RBMP's will change. This implies that beef farmers have to continuously evaluate the economics of production technologies and RBMP's. Just because a given technology or RBMP's was not profitable at a given point in time does not mean that it will always remain unprofitable. Just because a technology was profitable at the time it was adopted, does not guarantee it is still profitable. Astute beef farmers need to continuously be evaluating new and old technologies and RBMP's in an attempt to increase beef farm profits. Economics will dictate which technologies and which RBMP's are and are not profitable at any point in time. This evaluation, however, takes considerable on-farm data to properly evaluate.
Herd performance records are currently being used to document the on-farm biological response of new technologies and RBMP's. Financial management records are being used to document the on-farm economic response. The problem is that many of today's beef farm managers lack one or both of these management information systems. In addition, most herd performance records and financial management record systems do not collect data on resources consumed. We simply do not know what it costs to produce beef on most of the nation's beef farms and ranches.
Linking Your Scientific Services to Your Clients' Economic Reality
In order to demonstrate how veterinarians might go about studying the economics of reproductive efficiency on their clients' farms or ranches, I will first present a written production plan for John Rancher, a typical North Dakota beef cow farmer. I will utilize the John Rancher's written production plan to illustrate how veterinarians can "link their scientific services with a client's economic reality". I am also suggesting that astute practicing veterinarians might even want to help their leading clients prepare these written production plans for a fee.
John Rancher's Written Production Plan
I will quickly describe some of the key input/output coefficients representing John's production technology. Dollar values are attached to each product produced and to each resource consumed. Preparing this complete written production plan forced John to write down on paper all of the important production and economic factors that affect the profitability of his beef cow herd. This written pro-
63
0 "'O (D
~
~ (") (D 00 00
0.. ...... 00 ,-+-'"i
~ ~ ...... 0 p

duction plan serves as John's blue print for operating his cow-calf herd.
Writing down these input/output coefficients made John think about each and every coefficient. Even more importantly, writing down the coefficients plants these coefficients firmer in John's mind.
I want to demonstrate how John's practicing veterinarian can utilize this written production plan for linking his "scientific services to John's economic reality". But first, I need to be sure that each of you understands what I mean by a written production plan. Let's look in detail at John's production plan.
Opportunity Costs
The Appendix Tables present John Rancher's 1990 complete written production plan. The business summary is presented in Table 1 and the cash flow summary is presented in Table 2 . A business summary values all resources consumed at their opportunity costs. If the local elevator will pay $1.80 for a bushel of barley, then John's beef cow herd has to pay this $1.80 for each bushel of barley consumed. Costs of all resources consumed by the cow herd are based on this opportunity cost concept. Market prices detemine the opportunity costs for most of the re-
Table 1. John Rancher's Beef Cow Budget
------------------------------------------------------------------------------------------------------------------------------------------------BEEF COW BUDGET SUMMARY
100 COWS 0% IN DEBT
GROSS INCOME PER COW:
FEED COSTS: SUMMER AFTERMATH WINTER
LIVESTOCK EXPENSE: VET & MED FLY TAGS WORMER UTILITIES & GEN FARM POWER & FUEL MISC MARKETING BREEDING BEDDING
INTEREST ON FEED & L.S. EXP
FIXED EXPENSE:
$88 $3
$123
$8 $4 $7
$9
$9 $7 $8 $9 $2
BLD, FAC, COWS & HEIFERS INTEREST ON BORROWED CAP
TOTAL COSTS
RETURNS TO OPERATOR AND UNPAID FAMILY LABOR, MANAGEMENT AND EQUITY CAPITAL
OPPORTUNITY COST
$411
$215
$63
$0
$26 $0
$304
$107
YOUR FARM
------------------------------------------------------------------------' ------------------------------------------------------------------------,
64 THE BOVINE PROCEEDINGS-No. 23
0 "'O (D
~
~ (") (D 00 00
0.. ...... 00 ,-+-'"i
~ ~ ...... 0 p
Amoxi-Mast" amoxicillin BRIEF SUMMARY
.. , ... ·, ..
~ ·; --:~~ >){(· ~-. ·tt
Before prescribing AMOXI-MASP (amoxic 1ll in), please consu lt Complete Product Information, a summary of which follows:
AMOXI-MAST (amoxici llin) is specially prepa red for the treatment of bovine mast1t1s du ring the lactating period.
INDICATIONS-AMOXI-MAST (amox1cillin) is 1nd1cated 1n the treatment of subcllnical 1nfect1ous bovine mastit1s 1n lactating cows due to Streptococcus agalactiae and Staphylococcus aureus (penicillin sens1t1ve). Early detection and treatment of mast1t1s are advised.
WARNING-Milk that has been taken from animals during treatment and for 60 hours (five m1lk1ngs)
Supporting The Veterinarian
Use Amoxi-Mast® (amoxicillin) to treat mastitis.
M astitis steals milk and profits. t can be a stubborn infection
that often strikes your top producers, causing even more frustration and "spilled milk'.'
Amoxi-Mast works fast to end the misery of mastitis. As soon as it's infused into the udder, Amoxi-Mast® starts killing Staph 1 and Strep1, the organisms that cause 95% of all mastitis. Antibiotics such as novobiocin and erythromycin inhibit bacterial growth and depend on the cow's natural defenses to kill the bacteria.
A 60-hour milkout means less spilled milk. With just a 60-hour milkout, Amoxi-Mast saves you from one to three milkings. Which makes it more economical than drugs with 72 or 96 hour milkouts.
Reach for the box with the blue top. Ask your veterinarian about Amoxi-Mast. It's the box with the blue top available at your veterinary clinic. The
sooner you start Amoi"'i-Masf
1 using Amoxi-Mast,
arnoxicillin the sooner your top producers will be putting milk in the tank-where it belongs.
©1990, SmithKline Beecham Animal Health
SD Sm,thKl,ne Beecham Animal Health
1Amoxicillin sensitive Staphylococcus aureus and Streptococcus agalactiae bacteria.
after the last treatment should not be used for food. Animals treated should not be slaughlered for food pu rposes w1th1n 12 days after the last treatment. PRECAUTION-Because it 1s a der1vat1ve of 6-am1no-penic1llanic acid, AMOXI-MAST (amox1c1ll1n) has the potential for producing allergic reactions. Such reactions are rare ; however, should they occur, the sub1ect should be treated with the usual agents (a nt1h1stam1nes, pressor amines).
CAUTION-Federal law restricts this drug to use by or on the order of a licensed veterina rian .
HOW SUPPLIED-AMOXI-MAST (amox1c1ll1n) 1s supplied 1n cartons of twelve 10 ml single-dose disposable plastic syringes with twelve alcohol swabs. Each disposable syringe contains amox1c1ll1n trihyd rate equ1valen1 to 62.5 mg of amox1c1ll1n act1v1ty.
•""""·- • 1s a registered trademark of Sm1thKhne Beecham Animal Health .
© n 0
"O '-< 1-i .....
(IQ µ ,-t-
► s ('T) 1-i ..... 0 ~ µ
► rJ). rJ).
0 0 ..... ~ ,-t-o· µ 0 i--+i
co 0 < ..... µ ('T)
1-tj 1-i ~ 0 ,-t-..... ,-t-o· µ ('T) 1-i rJ).
0 "O
('T) µ ~ 0 0 (D en en 0.. ..... rJ). ,-t-1-i ..... r:::r g ..... 0 ~
. t'

(Q)
n 0
"'d '-< '"i ,.....
00 g ► 8 (D '"i ,_.. r:) ~ ~
► r./) r./)
0 r:) ,_.. a ,..... 0 ~ 0 1-+i
to 0 < 5· (D
1-"d '"i ~ r:)
) enzathine cloxacill in)__) I:
GIVES DRY·COW ■ISTITIS NO QUARTER!
Mastitis is a tough disease that requires an even tougher dry cow treatment-Orbenin-DC® (benzathine cloxacillin). Orbenin-DC (pronounced OR-BEN~IN) contains one of the longest acting dry cow antibiotics available. This extended activity is crucial, since 40-50%of all mastitis cases originate during the dry period.
Because Orbenin-DC is longer lasting, it continues to kill Staph and Strep bacteria 1 (the major causes of mastitis) long after the antibiotic has been
ORBENIN-DC® benzathine cloxacillin BRIEF SUMMARY Before prescribing ORBENIN-DC® (benzathine cloxacillin) , please consult Complete Product Information, a summary of which follows: INDICATIONS-ORBENIN-DC is indicated in the treatment and prophylaxis of bovine mastitis in non-lactating cows due to Staphylococcus aureus and Streptococcus agalactiae. CONTRAINDICATIONS-Since benzathine cloxacillin is relatively insoluble, ORBENIN-DC's activity will be prolonged. Therefore, ORBENIN-DC should not be used for the occasional cow which may have a dry period of less than 4 weeks. This precaution will avoid residues in the milk following removal of the colostrum. WARNING-1. For use in dry cows only. 2. Not to be used within 4 weeks (28 days) of calving.
infused. This makes Orbenin-DC an excellent dry cow treatment.
But the proof is in the performance in your herd. You'll never know ~ howwellOrbenin-DC ~ works until yo~ try_it. ~afhine:x!F Ask your vetennanan
in for Orbenin-DC. You'll save a lot of quarters.
SD Sm,thKl,ne Beecham Animal Health
'Due to susceptible organisms.
3. Treated animals must not be slaughtered for food within 4 weeks (28 days) of treat ment .
PRECAUTION-Because it is a derivative of 6-amino-penicillanic acid, ORBENIN-DC (benzat h ine cloxacillin) has the potential for producing allergic reactions. Such reactions are rare; however should they occur, the subject should be treated with the usual agents (antihistamines, presser amines). CAUTION- Federal law restricts this drug to use by or on the order of a licensed veterinarian. HOW SUPPLIED-ORBENIN-DC is supplied in cartons of 12 syringes with
;} Jb~~~?il1i~~ asbtshig~~i!~~l~~~ij 1~s~~~~f~~~:g1~0~:~~s 500 mg
© 1990, SmithKline Beecham Animal Health
(D r./) r./)
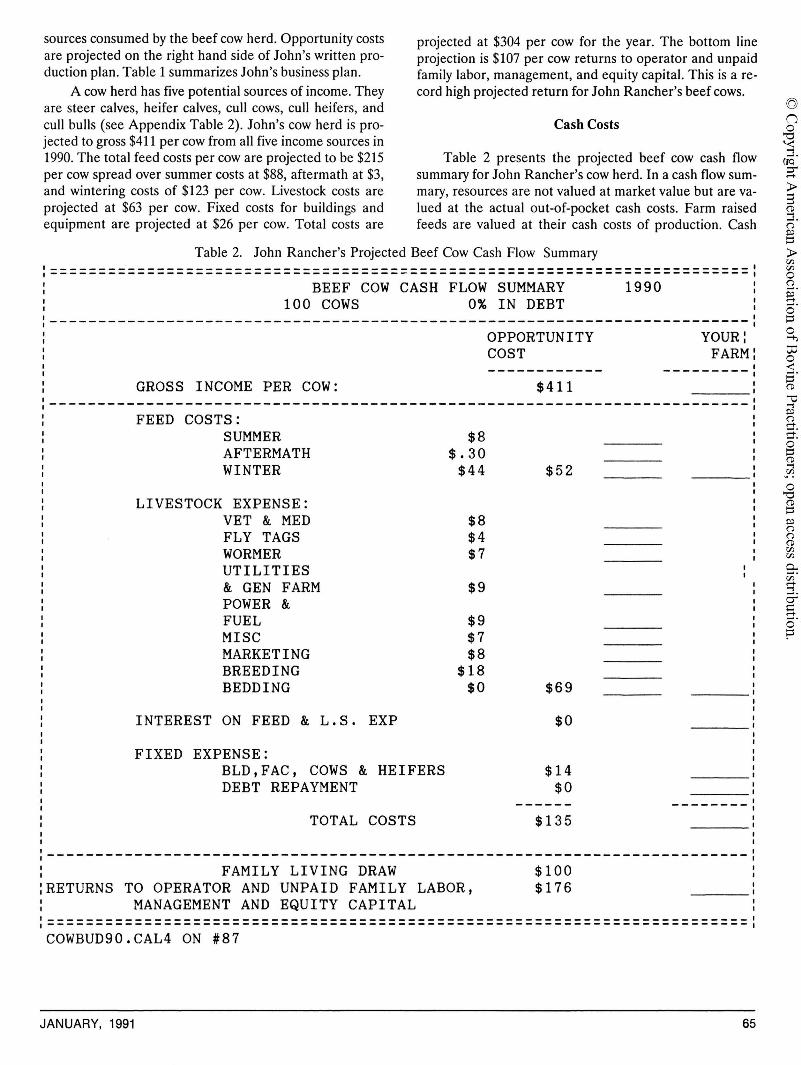
sources consumed by the beef cow herd. Opportunity costs are projected on the right hand side of John's written production plan. Table 1 summarizes John's business plan.
A cow herd has five potential sources of income. They are steer calves, heifer calves, cull cows, cull heifers, and cull bulls (see Appendix Table 2). John's cow herd is projected to gross $411 per cow from all five income sources in 1990. The total feed costs per cow are projected to be $215 per cow spread over summer costs at $88, aftermath at $3, and wintering costs of $123 per cow. Livestock costs are projected at $63 per cow. Fixed costs for buildings and equipment are projected at $26 per cow. Total costs are
projected at $304 per cow for the year. The bottom line projection is $107 per cow returns to operator and unpaid family labor, management, and equity capital. This is a record high projected return for John Rancher's beef cows.
Cash Costs
Table 2 presents the projected beef cow cash flow summary for John Rancher's cow herd. In a cash flow summary, resources are not valued at market value but are valued at the actual out-of-pocket cash costs. Farm raised feeds are valued at their cash costs of production. Cash
Table 2. John Rancher's Projected Beef Cow Cash Flow Summary
------------------------------------------------------------------------' ------------------------------------~-----------------------------------, BEEF COW CASH FLOW SUMMARY 1990
100 COWS 0% IN DEBT I ------------------------------------------------------------------------,
GROSS INCOME PER COW:
FEED COSTS: SUMMER AFTERMATH WINTER
LIVESTOCK EXPENSE: VET & MED FLY TAGS WORMER UTILITIES & GEN FARM POWER & FUEL MISC MARKETING BREEDING BEDDING
INTEREST ON FEED & L.S. EXP
FIXED EXPENSE: BLD,FAC, COWS & HEIFERS DEBT REPAYMENT
TOTAL COSTS
$8 $.30
$44
$8 $4 $7
$9
$9 $7 $8
$18 $0
FAMILY LIVING DRAW RETURNS TO OPERATOR AND UNPAID FAMILY LABOR,
MANAGEMENT AND EQUITY CAPITAL
OPPORTUNITY COST
$411
$52
$69
$0
$14 $0
------$135
$100 $176
YOUR: FARM
------------------------------------------------------------------------------------------------------------------------------------------------COWBUD90.CAL4 ON #87
JANUARY, 1991 65
0 "'O (D
~
~ (") (D 00 00
0.. ...... 00 ,-+-'"i
~ ~ ...... 0 p

costs reflect the rancher's actual cash outlay and are totally independent of market prices. Individual rancher's cash costs of production of feeds consumed by the beef cow herd can be either above or below market prices.
If hay is produced on owned land with owned equipment, then the only cash costs in producing hay are for twine, preservatives, fuel, repairs, and land taxes. In my example, $15 per ton cash costs were used. If hay is produced on land financed and/or machinery financed by the bank, principle and interest payments are added to the $15 per ton hay costs. Debt can quickly cause cash costs to be greater than market price. Since every producer's debt structure is different, every producer's cash costs are different.
Cash costs of all resources consumed are tracked on
the left-hand side of John's written production plan. John Rancher has his land, cows, and machinery paid for; therefore, his cash costs do not include principle or interest charges. John's cash costs of feeding his beef cow herd is $52 per cow (see Table 2).
As indicated in the cash flow summary presented in Table 2, John's projected cash income to the beef cow herd is $411 per cow. Cash feed costs total $52 per cow made up of mostly wintering feed costs. Summer costs for owned pasture covers the cash costs of fence repair, pasture land taxes, and providing water. Livestock cash costs total $69 and fixed costs are projected at $14 per cow. Since John owns all of the resources, there is no bank interest charge in the plan. Note that return to equity capital is included in the bottom line. Total cash costs are projected at $135 per
Table 3. Beef Cow Summary for 90% Calf Crop
------------------------------------------------------------------------------------------------------------------------------------------------BEEF COW BUDGET SUMMARY
100 COWS 0% IN DEBT
GROSS INCOME PER COW:
FEED COSTS: SUMMER AFTERMATH WINTER
LIVESTOCK EXPENSE: VET & MED FLY TAGS WORMER UTILITIES & GEN FARM POWER & FUEL MISC MARKETING BREEDING BEDDING
INTEREST ON FEED & L.S. EXP
FIXED EXPENSE:
$88 $3
$123
$~ $4 $7
$9
$9 $7 $8 $9 $2
BLD, FAC, COWS & HEIFERS INTEREST ON BORROWED CAP
TOTAL COSTS
RETURNS TO OPERATOR AND UNPAID FAMILY LABOR, MANAGEMENT AND EQUITY CAPITAL
OPPORTUNITY COST
$43.4
$215
$63
$0
$26 $0
$304
$131
YOUR FARM
------------------------------------------------------------------------------------------------------------------------------------------------
66 THE BOVINE PROCEEDINGS-No. 23
0 "'O (D
~
~ (") (D 00 00
0.. ...... 00 ,-+-'"i
~ ~ ...... 0 p

cow. While family living draw is a family cost and not a
business cost, a full time beef farmer or rancher normally needs to generate his family's living from the farm business. John Rancher needs to pull a family living draw of $100 per cow out of his herds cash flow. This, then, leaves a projected $176 per cow left over as the net Gash flow returns to operator and unpaid family labor, management, and equity capital.
This $176 net cash flow can be used for what ever purpose John and his family so desires. It could be used for savings, retirement, capital investment in more cows or machinery, off-farm investment or etc. This also is record net cash flow from beef cows for John Rancher.
Asking "What if' Questions
The availability of portable micro computers now offer veterinarians a unique opportunity to demonstrate economic reality for their leading clients. Please envision what I am about to describe as happening at one of your client's kitchen table.
Let's now change the percent calf crop, holding everything else constant, and see what happens to John's projected bottom line by making this one and only one change. Let's change the percent calf crop from 85 percent to 90 percent. Table 3 present the new projected bottom line.
The five percent change in percent calf crop lead to a $24 projected increase in the bottom line. This suggests that each one percent increase in calf crop that John's veterinarian can accomplish for John Rancher leads to a $4.80 increase per cow in his bottom line. John Rancher's economic reality is that he can increase his net returns by $4.80/per point per cow by improving his calving percentage. In John Rancher's 100 cow herd, each one-percent improvement in reproductive efficiency is projected to net him $480 per year. A five percent improvement is projected to generate $2400 increase in bottom line returns per year. Note that any additional costs associated with the increased calf crop have not been taken into account.
This $4.80 per cow returns to improved reproductive efficiency per percentage point assumes that the increased calving percentage is accomplished by improved management and does not require any additional resources. This further suggests that John Rancher could pay up to $4.80 per cow per year per percentage point for improved reproductive efficiency. This includes herd health, nutrition, labor and management advice from his veterinarian that would result in improved reproductive efficiency.
Can John's herd be improved 5 percent in reproductive efficiency? I suggest that his veterinarian is in the best position to answer this question. Can his veterinarian do it at a profit to John? I do not know, but John and his local veterinarian now have a projection of the "economic reality of selling his scientific services" to John Rancher.
JANUARY, 1991
Simulation Study of Reproductive Efficiency Let's now expand the "what if' section and make 40
different runs with John Rancher's written production plan varying the percent calf crop, weaning weight, calf prices, culling rates, amount of hay fed in the winter feeding program, the price of hay, pasture costs, and price of bulls purchased in a scientific designed manner. Selected input/output coefficients from each simulated run were extracted and summarized in a working table. This table of numbers were then subjected to statistical analysis relating economic reality back to the value of the physical production and the value of the resources consumed. The purpose of this formal statistical analysis is to mathematically relate herd performance variables with John's profitability projections. One of these variables is reproductive efficiency measured by percent calf crop.
The beef cow projected profit or loss (P&L) is projected as a function of: (1) steer price, (2) % calf crop, (3) steer weaning weight, ( 4) % cows culled, (5) tons of hay fed in the wintering program, ( 6) cost of hay fed, (7) cost of pasture, and (7) price paid for bulls.
The regression equation estimated is:
Table 4. Regression Results Intercept -69249.90 Steer Price 435.97604 % Calf Crop 45795.208 Steer Weight 41.220586 % Cows Culled -4119.098 Qnt Hay Fed 0.0771246 (not significant) $/ Ton of Hay -1.001714 Pasture Cost -1.155867 Price Of Bulls -0.3480417
Adjusted R squared 0.9998 F Value 32.56
Percent calf crop was expressed in decimal form so the 45795 coefficient can be divided by 100 to express the coefficient in percent terms ( 457.95). Since total profits (P&L) was used for the 100 cows, the coefficient has to again be divided by 100 to express the increase in P&L per cow; therefore, the coefficient per cow is $4.58. This suggests that over the 40 different simulation runs, that each percentage point increase in calf crop increased P&L by $4.58 per cow. A five percent increase in percent calf crop is projected to increase the P&L $22.85 per cow. If the total 100 cow herd is taken into account, a five percent increase in percent calf crop is projected to have a $2285 impact on P&L.
Table 5. Summary of Selected Regression Coefficients
% Cal f Cr op Steer Pr i ce Wea ni ng Weig h t % Cu lling Rate Hay Fed (to n s) $ Total Hay Cost $ Tota l Past u re Cost $ Cost Of Bull s
$ 4 . 58/po in t/co \,; $4 . 36/cow/$ p r ice change $0 . 4 1 /cow/pound additional weig h t - $4 1 . 1 2/point/h e r d not significantly di ff erent f r c m zeru
-$ 1. 00/cow herd - $1. 16/c ow h e r d -$0 . 35/cow h erd
67
0 "'O (D
~
~ (") (D 00 00
0.. ...... 00 ,-+-'"i
~ ~ ...... 0 p

Economic Reality of Marketing Heavier Feeder Calves
One of the most surprising regression coefficients in the above list is the $0.41 value for steer weight. This coefficient suggests that the economic value of adding one additional pound to weaning weight adds only 41 cents to P&L. Why would an additional pound of weight marketed only add $0.41 per pound? Why is there so much slippage from the 96 cents average market price for each pound of steer calf marketed?
The answer, while not immediately obvious, is that slippage comes from at least four sources. First, heifer calves were priced at a $6 per hundred weight discount to steer calves. Second, replacement heifers for 17 percent of the cows were held back and not marketed. It is projected that these two factors are projected to account for approximately 38 percent of the slippage.
The third source of slippage comes from the 85 percent calf crop. The 85 percent calf crop suggests that "economic reality" of an average 96 cent price averaged over all cows is only 81.6 cents (.85 times 96) per additional pound marketed. It is projected that twenty-five percent of the slippage came from the percent calf crop.
The remaining 37 percent of the slippage is projected to come from the marketing side. Marketing slippage stems from the fact that the "value of additional weight" sold is considerably less than market price. An example should help clarify marketing slippage.
Let's look at October 1989 feeder calf prices for Fargo, North Dakota. Four hundred pound calves sold for $99.22 per hundred weight and totaled to $396.88 per head. Five hundred pound steers sold for $94.50 per hundred weight and totaled to $472.50 per head. On a per head basis, the value of the extra 100 pounds of weight was $75.62 ($472.50-$396.88). While the average market price was well over $95 per hundred weight, the value of additional weight was only 76 cents per pound ($75.62/100); therefore, considerable slippage comes on the marketing side.
The "value of additional weight" is equivalent to the economist's "marginal price" or "marginal revenue" taught in Agricultural Economics 101 classes. Since the market price versus increasing market weights is normally downward sloping, marginal price is normally less than average price. Many scientists forget to include this marketing slippage in their recommendations and they end up making some recommendations that are not profitable.
This marketing slippage can be graphed against calf weight (see Figure 2). As weaning weights are increased, the marginal price per pound (MP) of the additional weight is normally less than average price (AP) (see Figure 2). Whenever the average price-weight relationship for feeder cattle is downward sloping, marginal price is always below the average price. This proven geometric theorem and its related economic price theorem is generally ig-
68
nored in technology Recommended Best Management Practice (RBMP's) evaluations. This can lead to over estimation of the economic rewards from adoption of new technology and RBMP's (Wholgemuth ).
Figure 2. Average (AP) & Marginal (MP) Market Prices for Feeder Cattle (Oct. 1989). PA
West Fargo Large Framed Steer Prices Oct. Monthly Average
Feeder Weights in CWTS
Conclusion -- costs of weight increasing technologies have to be evaluated against the value of additional weight and not against average market price. It is extemely important that veterinarians take into account this marketing slippage in their production recommendations. Your clients' bottom lines depend on your putting a proper marginal value on weight increasing technologies and Recommended Best Management Practices.
Economics of Changing Calving Distribution
Another frequently used indicator of reproductive efficiency is the percent of calves born in cycle 1. One researcher (Fitzgerald, 1989) suggests -that a reproductive efficiency goal should be to have 60 percent of the calves born in the first 21 days of the calving season. He suggests that the second cycle goal should be 50 percent of the remaining calves, the third cycle goal should be 50 percent of the remaining, etc. I will first look at North Dakota's average calving distribution and then compare it, economically, to the above recommended calving distribution.
Based on 66,000 cow records currently in North Dakota's Cow Herd Appraisal Program (CHAPS) database, the average calving distribution in North Dakota is 4.3% early, 43.0% in cycle 1, 35.1 % in cycle 2, 11. 7% in cycle 3, 4.3% in cycle 4 and 1.6% late (Ringwall & Berg). The average calving season starts on March 9 and calves are weaned on the average on October 25 at 203 day average age. The average birth weight is 84 pounds for those herds that collect birth weight. The average actual weaning
THE BOVINE PROCEEDINGS-No. 23
0 "'O (D
~
~ (") (D 00 00
0.. ...... 00 ,-+-'"i
~ ~ ...... 0 p

weight is 498 pounds. weight per day of age is 2.47 pounds and the 205 day sex adjusted weaning weight is 532 pounds (Ringwall & Berg).
North Dakota's average calving distribution and average weaning weights were built into a simulation model along with fall 1989 market prices to calculate the gross income per cow from a typical 100 cow herd (see Table 6). The purpose of the simulation model is to study the economics of calving a higher percent of the calf crop in earlier cycles compared to the market price drops associated with heavier weaned calves. Steer market prices are for Fall 1989 adjusted for average weaning weight of each calving cycle. These adjustments come from a regression equation of USDA actual market price quotes for different weights of feeder steer calves reported by USDA Marketing Service, Fargo, North Dakota. Market price is expressed as a function of the weight of the feeder steer.
The values in the top of Table 6 describe the herd. The weaning weights for each cycle are based on North Dakota's Herd Performance Averages (Ringwall & Berg). The percentages for the calving intervals are also based on North Dakota averages. The simulation model calculates the gross income for each cycle group in the herd and uses these numbers to generate an average gross income per cow. The gross income for this average North Dakota herd is $408 per cow (see bottom right hand corner of Table 6).
The simulation model was again run with a recommended new calving distribution (see Table 7). The 17 percent more calves born in cycle 1 and the 1.8 percent reduction in the early group resulted in a biological response of weaning weight averaging 2 pounds per calf higher but producing 317.7 less total pounds of calf. The net
result was both a negative biological response and a negative economic response. The projected gross income per cow is projected at $404 per cow. The current North Dakota average, coupled with 1989 North Dakota calf prices, appears to be more optimum than the recommended 60 percent calf crop in cycle 1 coupled with North Dakota's 1989 calf prices. Our current research plans are to re-confirm these simulation results with actual herd data. This does suggest, however, once again that maximum is not optimum.
A third simulation was run with only 20 percent of the calves being born in the first cycle. Fifty percent of the remaining calves were born in cycle 2, fifty percent of those still remaining born in cycle 3, same for cycle 4, and the remaining split between the early and late cycles. This worse case scenario resulted in 1,677 less pounds ( 4.3% less) of calf produced and a gross income of $393 per cow or 2.7 percent less than the recommended distribution (see Table 8).
A comparison of the worse case scenario and the recommended 60 percent of calves born in cycle 1, projects a $11 difference per cow in favor of the 60 percent calves in cycle 1. The moving from a 20 percent calving rate in cycle 1 with a 511 pound average weaning weight to a 60 percent calving rate with a 530 pound average weaning weight in cycle 1 generated an additional 19 pounds of weaning weight resulting in a $11 per cow increase in gross income. In economic terms, this calculates out to $0.58 per cow per additional pound average weaning weight associated with the early cycle calving.
In terms of the economic benefit of changing the percent calves born in cycle 1, this also suggests that each ad-
Table 6. Distribution of Calving Interval & Impact on Average Weaning Weight
NUMBER OF % HFRS =
100 50.00%
CALVING PERCENT= HFR MKT DISCOUNT=
85.00% $6.00 /CWT
--------------------------------------------------------------------------------------------------------------- ---------------------------------BREEDING
CYCLE
EARLY CYCLE 1 CYCLE 2 CYCLE 3 CYCLE 4 LATE
ACTUAL WEANING
WEIGHT
562 550 525 485 449 418
WDA_a/
2.35 2.48 2.53 2.53 2.53 2.56
%AGE OF
TOTAL
4.30% 43.00% 35.10% 11.70%
4.30% 1.60%
NUMBER POUNDS OF OF CALF
CALVES PRODUCED
4 2247 37 20358 30 15745 10 4846
4 1795 1 418
STEER MARKET
PRICE
$91.26 $91. 82 $93.05 $95.06 $96.91 $98.52
GROSS REVENUE
$1,984 $18,081 $14,178
$4,461 $1,685
$399 ------------------------------------------------------------------------------------------------------------------------------------------------AVERAGE 534 2.50 $94.44 TOTAL 100.00% 85 45409.06 $40,789
GROSS INCOME/ COW= $408 ------------------------------------------------------------------------------------------------------------------------------------------------DISTCALF/CAL4 ON 88
JANUARY, 1991 69
0 "'O (D
~
~ (") (D 00 00
0.. ...... 00 ,-+-'"i
~ ~ ...... 0 p

Table 7. Distribution of Calving Interval & Impact on Average Weaning Weight
NUMBER OF % HFRS =
100 50.00%
CALVING PERCENT= HFR MKT DISCOUNT=
85.00% $6.00 /CWT
------------------------------------------------------------------------------------------------------------------------------------------------BREEDING ACTUAL
CYCLE WEANING WEIGHT
EARLY 562 CYCLE 1 550 CYCLE 2 525 CYCLE 3 485 CYCLE 4 449 LATE 418
WDA_a/
2.35 2.48 2.53 2.53 2.53 2.56
%AGE OF
TOTAL
2.50% 60.00% 20.00% 10.00%
5.00% 2.50%
NUMBER POUNDS OF OF CALF
CALVES PRODUCED
2 1194 51 28061 17 8922
9 4119 4 1907 2 888
STEER GROSS MARKET REVENUE
PRICE
$91. 26 $1,054 $91.82 $24,923 $93.05 $8,034 $95.06 $3,792 $96.91 $1,791 $98.52 $848
------------------------------------------------------------------------------------------------------------------------------------------------AVERAGE 2.50 $94.44 TOTAL 100.00% 85 45091. 36 $40,442 AVERAGE 530 GROSS INCOME/ COW= $404 ------------------------------------------------------------------------------------------------------------------------------------------------DISTCAL3/CAL4 ON 88
Table 8. Distribution of Calving Interval & Impact on Average Weaning Weight
NUMBER OF % HFRS =
100 50.00%
CALVING PERCENT= HFR MKT DISCOUNT=
85.00% $6.00 /CWT
------------------------------------------------------------------------------------------------------------------------------------------------BREEDING ACTUAL
CYCLE WEANING WEIGHT
EARLY 562 CYCLE 1 550 CYCLE 2 525 CYCLE 3 485 CYCLE 4 449 LATE 418
WDA_a/
2.35 2.48 2.53 2.53 2.53 2.56
%AGE OF
TOTAL
5.00% 20.00% 40.00% 20.00% 10.00%
5.00%
NUMBER POUNDS OF OF CALF
CALVES PRODUCED
4 2388 17 9354 34 17844 17 8238
9 3813 4 1776
STEER GROSS MARKET REVENUE
PRICE
$91.26 $2,108 $91.82 $8,308 $93.05 $16,069 $95.06 $7,584 $96.91 $3,581 $98.52 $1,697
------------------------------------------------------------------------------------------------------------------------------------------------AVERAGE 2.51 $94.44 TOTAL 100.00% 85 43413.98 $39,346 AVERAGE 511 GROSS INCOME/ COW= $393 ------------------------------------------------------------------------------------------------------------------------------------------------DISTCAL3/CAL4 ON 88
ditional percent of calves born in cycle 1 adds $0.28 per percentage point per cow. Adding a 40 percent increase in calves born in cycle 1 is projected to add $11.20 per cow.
Summary
USDA data suggests that the nation's 1990 beef and dairy cow herd will produce a 79-80 percent calf crop. Based on current market prices this suggests a potential loss of over $4 billion dollars to reproductive inefficiency.
70
Is this low national calving percentage a health problem, nutrition problem, a management problem, or an economic problem?
This same national data suggests that cattlemen do adjust their calving percentages to cattle prices. When prices are high, they seem to produce more calves. When prices are low, they back off on some production practices. I sure don't need to remind veterinarians about how beef cow farmers and ranchers backed off on veterinarian services during the low prices of the mid '80's.
THE BOVINE PROCEEDINGS-No. 23
0 "'O (D
~
~ (") (D 00 00
0.. ...... 00 ,-+-'"i
~ ~ ...... 0 p

A written production plan for a typical North Dakota rancher was used to conduct a case study of the econo_mics of increasing reproductive efficiency. It was projected that John Rancher could increase his herd's profits by $4.57 per cow for each percentage point increase in calving percentage.
Reproductive efficiency expressed in calving distribution was also simulated for the average North Dakota herd. Herd performance records for 66,000 cows were used to generate the typical herd calving distribution. Based on this typical calving distribution, the projected gross income from calf sales per cow was $408.
A second simulation was done by changing the calving distribution to 60 percent of the calves born in the first cycle as recommended by a specific researcher. Projected gross income from the recommended calving distribution decreased the gross income projections of the herd. Both the biological response and the economic response were negative; however, some of the negative biological response was reduced by the economic reponse. The net results is that the current North Dakota average, coupled with 1989 North Dakota calf prices, appears to be more optimum than the recommended 60 percent calf crop in cycle 1 coupled with North Dakota's 1989 calf prices. It appears under the 1989 price relationships, North Dakota producers may be close to the optimum calving distribution.
Additional simulation work looked at the economics of extreme calving distributions suggest that the economic returns from changing the percentage of calves born in cycle 1 is $0.28 per percentage point per cow. Adding a 40 percent increase in calves born in cycle 1 is projected to add $11.20 gross income per cow.
Due to considerable slippage from the percent calf crop and the lower market value of additional weaning weight per animal, the projected economic value of increasing weaning weight was $0.41 per pound. Costs of weight increasing technologies and RBMP's have to be evaluated against the value of additional weight and not against average market price.
Clearly, before a Recommended Best Management Practice (RBMP) is promoted, it has to have both a positive biological response and a positive economic response. Not all technologies and RBMP enchance profits.
Economics will dictate which technologies and which RBMP's are profitable at any point in time. As this decade's beef prices move down from the current 1990 record high price peak, the profitability of various technologies and RBMP's will change. This suggests that production recommendations will have to also change during this decade. Astute veterinarians will constantly be aware of the changing economic reality of their clients and will offer services to their clients for a fee that help determine the "economic reality of their scientific services".
JANUARY, 1991
Bibliography
1. Harlan Hughes, "Financial Performance Of North Dakota's Beef Cow Enterprise -- The Critical Success Factors", Proceedings, Beef Cow Calf Conference, Bismarck North Dakota, Dec. 1989. 2. Harlan Hughes, "Integrating Business Management And Herd Performance Production and Efficiency Measures Into A Total Cow/Calf Management System", A Grant Proposal submitted to and funded by USDA, Extension Seivice 88-EXTA-2-0921, Dated September 29, 1988. 3.Clement Ward, "Performance Indicators For Stocker And Feeder Cattle", Western Livestock Round-Up, August 1989, pg 2. 4. Daryl Strohbehn, "Iowa State University Records Explain Difference In Herd Profitability", Drover Journal, June 19, 1989, ps 19. 5. K.A. Ringwall and P.M. Berg, "The Critical Success Factors Commercial Beef Cattle Production", Proceedings, North Dakota Cow/Calf Conference, Bismarck, North Dakota, Dec. 2, 1989, pg 75-80. 6. Kevin K. Sedivec, "Forage Performance - The Critical Success Factors", Proceedings, North Dakota Cow/Calf Conference, Bismarck, North Dakota, Dec. 2, 1989, pg 81-93. 7. Less Manske, "Grasslands Suffering Under Drought Stress", NDSU News Release, Nov. 2, 1989. 8. Wholgemuth, Melancon, Hughes, and Biondini, "Treatment Of North Dakota Beef Cows And Calves With Ivennectin: Some Economic Considerations", Bovine Practitioner, Nov. 1989, pp 61-66. 9. G.A.Mumey, "Improving On-Farm Financial Management", Canadian Journal of Agricultural Economics, Dec. 1987, pp 735-740. 10. Debra Pankow and Harlan Hughes, "Taking Charge Of Farm Family Finances", forthcoming Extension Circular, NDSU Extension Seivice. 11. Debra Pankow and Harlan Hughes, "Farm Family Living Trends In North Dakota", forthcoming Extension Circular, NDSU Extension Seivice. 12. Kris Ringwall, "CHAPS Cow Herd Appraisal Performance Software", Software User Guide 6, NDSU Extension Seivice, Aug. 1988, 46 pages. 13. "The Business Committee's Report", Drovers Journal, Aug. 17. 14. Danny Fox, "Improving Your Ability To Compete With A Beef Herd Enterprise", Animal Science Dept. Cornell University. Paper presented at the 1988 Kentucky Beef Cattle Roundup. "Choices For The Future". 15. Caroline Rasmussen, Stuart Smith, and Danny Fox, "Beef Farm Business Summary", Cornell University, New York. AS. Mimeo 111 & A.E. Ext. 88-26, November 1988. 16. Harlan Hughes, "What's Being Done At The National Level? Suivey Of Business Record Keeping System", Proceedings, National Integrated Resource Management Leadership Conference, November 9-11, 1988, Denver, Colorado, pp 54-55. 17. Harlan Hughes, "Integrating Business Management And Herd Performance Production and Efficiency Measures Into A Total Cow/Calf Management System". A project proposal submitted to and funded by ES-USDA, September 1988. 18. Frank Baker, Editor, "BIF Guidelines For Uniform Beef Improvement Programs", Beef Improvement Federation, Fifth Edition, April 1986. 19. G.L. Williams and P.G. Hanns, "Only A Live Calf Counts", Beef, Spring 1990, pp 50-55. 20. Mike Fitzgerald, "Tum Reproductive Efficiency Key For Lower-Cost Production", Drovers Journal, Sept. 7, 1989, pg 12.
This paper was written as part of a USDA-ES funded project entitled "Designing An Integrated Financial And Herd Performance Business Analysis And Databasing System For The Nation's Integrated Resource Management Demonstration Herds --A Pilot Program".
71
0 '"O (D
~
~ ('") (D 00 00
0.. ...... 00 ,-+-'"i
~ ~ ...... 0 p

Appendix Tables
John Rancher's Written Production Plan
Table 1. Production Technology Assumed
:------------------------------------------------------------------------: 1990 BEEF COW HERD SELLING WEANED CALVES IN FALL
DATE: 8/28/90 0% IN DEBT : •------------------------------------------------------------------------· ,------------------------------------------------------------------------,
DESCRIPTION
A spring calving 100-cow herd weaning 85% calf crop. Hfr calves weigh 498 lbs. & steer calves weigh 528 lbs. Cow death loss of 1% rate and 15% cow culling rate. Suggested heifer conception 87%.Actual conception 85% Feed requirements include 100 cows and 19 replacement hfrs.
3 bulls. Calves sold in the fall at 5-8 months old with a 4% transit shrink. Cows on pasture 180 days with 30 days addition on aftermath.
1 Code 1 for raised or 2 for purchased replacement heifers. '-----------------------------------------------------------------------,------------------------------------------------------------------------
Table 2. Projected Receipts
Steers 43 head 522 pounds $.96 /lb = $21,293 Heifers 24 head 493 pounds $.90 /lb = $10,500 Cull cows 14 head 900 pounds $.47 /lb = $5,922 Cull Hfrs 4 head 875 pounds $.74 /lb = $2,476 Cull Bull 1 head 1700 pounds $.53 /lb = $893
- - - - - - - - - - - - - - - - - - - - - - - - - - - ---------Total Income Per Herd $41,083 Total Income Per Cow $411
------------------------------------------------------------------------------------------------------------------------------------------------
CASH FLOW
$372 $8
$395
$218 $400
$3,375 $0 $0
$406 $30
Heifer
$5,203 $52
Table 3. Projected Feed Expense
OPPORTUNITY COST 180 Summer Pasture Program
$.50 Pasture $.50 Rpl Hfrs
$400.00 Min&salt
743 AUMs .9 AUM/HD
.99 ton
$10.00/AUM = $10.00/AUM =
$400.00/ton =
155 Day Winter Feeding Program
$1.00 Oats 218.0 bushels $160.00 Protein 2.5 ton
$15.00 Hay 225.0 ton $10.00 Corn Sil .0 ton
$5.00Oat Straw .0 ton 400 Min&salt 1.01 ton
$.0lAftermath 30 days Feed included 14.25 Lbs DMI
(BEEF GROWER DATA) Total Feed Cost Per Feed Cost Per Cow
$1.20/bu = $160.00/ton = $50.00/ton = $14.00/ton = $20.00/ton =
$400.00/ton = $.10/day =
$3.65$/Cwt Dry
Herd
$7,434 $1,016
$395
$262 $400
$11,250 $0 $0
$406 $300, xxxx:
$21,462: $215:
------------------------------------------------------------------------' ------------------------------------------------------------------------,
72 THE BOVINE PROCEEDINGS-No. 23
0 "'O (D
~
~ (") (D 00 00
0.. ...... 00 ,-+-'"i
~ ~ ...... 0 p

:cASH FLOW
$808 $350
$60
$713 $868 $906 $701 $800
$5,206
Loan Pmt $0
$53 $1,750
$0 $0
$7,009 $70
CASH FLOW
$100 $300 $800 $113
$53 xxxxx
Loan Pmt
$0 $0 $0 $0
xxxxx
$1,365 $14
Table 4. Projected Livestock Expenses
Vet and Medicine $8.08 Fly Tags $3.50 Bull Semen Check $20.00
Worm Cows & Heifers $6.00 Utilities & Gen farm $8.68 Power and Fuel $9.06 Miscellaneous $7.01 Marketing $8.00
Bull Depreciation Loan
$0 total a: purchase price $1,750 13% APR b: salvage value $893
1 yrs c: years of use 3.00 d: insurance 1%
xxxx xxxxxx e: cash pmt for new bulls
I I I
I I I I I
I
OPPORTUNITY COST:
cow cow bull
head cow cow cow cow
bull
$808: $350:
$713 $868 $906 $701 $800
$5,206
$857 $53,
xxxxx
$.00 0%
Bedding Interest Feed & Lvsk
$2.00 I cow .00%@ 6 Mo
$200 $0
Total Livestock Costs Livestock Costs Per Cow
Table 5. Projected Fixed Expenses
Depreciation, Repairs, Taxes & Insurance 2% Total Bldg Invest $5,000 7% 3% Total Eqpt Invest $10,000 13% 1% Investment /cow $800 1% 1% Heifer investment $750 1% 1% Bull Investment $5,251 1%
Total Inv/Cow $1,144 xxxx
$6,315 $63
OPPORTUNITY COST
$350 $1,300
$800 $141
$53 xxxxx
Interest on Investment Capital At Int Rate Years Dollars
$0 Total Bldg Invest $0 Total Eqpt Invest $0 Investment/Cow $ $0 Investment/Heifer
xxxx Average Bull Valu
$5,000 $10,000
$800 $750
$1,322
Total Fixed Cost Per Herd Total Fixed Costs Per Cow
12% 12% 12% 12% 12%
15 10
7 1
xxxx
xxxx xxxx xxxx xxxx xxxx
$2,644 $26
------------------------------------------------------------------------------------------------------------------------------------------------
JANUARY, 1991 73
0 "'O (D
~
~ (") (D 00 00
0.. ...... 00 ,-+-'"i
~ ~ ...... 0 p

CASH FLOW
$41,083 $12,212
$28,871 $1,365
$27,506
$410.83 $135.77 $275.06
Table 6. Cost/Return Summary
Receipts Less Feed and Livestock Expenses
Returns Above Variable Costs Less Fixed Expenses
OPPORTUNITY COST
$41,083 $27,777
$13,306 $2,644
Returns to Labor & Mgt, & Equity Capital Per Herd
Total Receipts Per Cow
$10,662
$410.83 $304.21 $106.62
Total Expenses Per Cow Returns to Labor & Mgt, & Equity Capital Per Cow
------------------------------------------------------------------------------------------------------------------------------------------------
CASH FLOW
427.95 $96.00 $31. 73
xxxxx $10,000 $17,506 $175.06
Table 7. Adjustments For Multiple Products
Cwts of steer equivalents sold Receipts Per Steer Equivalent Cost Per Hundred Weight Sold (All Costs) Retur~s To Labor, Mgt, & Eq. Cap/Steer Eq. Family Living To Be Supported From Cow Herd Cash Available To Pay Debt From Herd Cash Available To Pay Debt Per Cow
OPPORTUNITY COST
427.95 $96.00 $71.09 $24.91 xxxxxx xxxxxx xxxxxx
------------------------------------------------------------------------------------------------------------------------------------------------SOURCE: COWBUD90.CAL ON DISK #87. ------------------------------------------------------------------------------------------------------------------------------------------------
74 THE BOVINE PROCEEDINGS-No. 23
0 "'O (D
~
~ (") (D 00 00
0.. ...... 00 ,-+-'"i
~ ~ ...... 0 p