economics of manure logistics, separation and land application
TRANSCRIPT
Baltic Forum for Innovative Technologies for Sustainable Manure Management
By Kässi Pellervo, Lehtonen Heikki, Rintamäki Heidi, Oostra Huibert & Erik Sindhöj
WP3 Innovative technologies for manure handling
October 2013
Economics of manure logistics, separation and land application
KNOWLEDGE REPORT
The project is partly financed by the European Union - European Regional Development Fund
1
Baltic MANURE WP3 Innovative technology for animal feeding and housing, processing, storage and spreading of manure
Economics of manure logistics, separation and land application
Kässi Pellervo, Lehtonen Heikki, Rintamäki Heidi, Oostra Huibert & Sindhöj Erik

2
The project is partly financed by the European Union - European Regional Development Fund
Preface Baltic Manure (The Baltic Forum for Innovative Technologies for Sustainable Manure Management) is a Flagship Project in the Action Plan of the EU Strategy for the Baltic Sea Region (BSR), which is co-funded by the Baltic Sea Region Programme of the European Union. The work described in this report was performed within Work Package 3 (WP3) “Innovative technology for animal feeding and housing, processing, storage and spreading of manure” within Baltic Manure. The overall aim of WP3 is to identify innovative and economically viable technologies for handling and processing manure in an environmentally friendly and user-friendly way on large-scale livestock farms in the BSR. In this study we evaluate possibilities for manure nutrient utilization under changing market conditions, different techniques and agri-environmental legislation. We apply a method for valuing manure in terms of money, from farmers’ point of view. We utilize opportunity cost theory and market value of the main competing input, chemical fertilizer products. Implications of different manure application methods on manure logistics and farm economy are described and calculated on anonymous case study farms. According to our experiences in this project we feel there is an obvious need for profitability calculations of different manure application and processing on large livestock farms which spend a lot of time and money on manure logistics and application. Since there is probably not a single profitability calculation framework easily applicable to all cases and conditions, we hope this report helps farmers and other agricultural professionals in constructing the necessary models and calculations to be used in different local and farm specific circumstances as well as in changing market conditions, environmental legislation and technological options. The researchers responsible for this study were Pellervo Kässi and Heikki Lehtonen at MTT Agrifood Research Finland who conducted development of the profitability calculations and applied the model for 2 case study farms in Finland. Heidi Rintamäki at MTT provided valuable help with the model application. The profitability calculations were applied to a Swedish case study farm by Huibert Oostra & Erik Sindhöj, who also made useful suggestions for improvements of the model. The authors are indebted to Lena Rodhe for many useful discussions and hints concerning data material and the calculation method. The authors would also like express their special thanks to the anonymous farmers who generously contributed valuable data material, time and assistance, making this report possible. August 2013 The authors
3
The project is partly financed by the European Union - European Regional Development Fund
Table of Contents
1 Introduction ........................................................................................................................ 4
1.1 Value of manure and nutrient use restrictions ........................................................................ 5
2 Material and methods ........................................................................................................ 6
2.1 Model for manure processing and logistics profitability calculation ......................................... 6 2.1.1 Nutrient value assessment based on market prices of inorganic fertilizer products ................................. 6 2.1.2 Manure opportunity value assessment ...................................................................................................... 8 2.1.3 Manure separation model .......................................................................................................................... 9 2.1.4 Manure land application ........................................................................................................................... 10 2.1.5 Investment profitability calculation methods ........................................................................................... 10
2.2 Parameters for separation comparison ................................................................................. 12
2.3 Description of the farms ....................................................................................................... 14 2.3.1 Finnish farms ............................................................................................................................................. 14 2.3.2 Swedish farm example .............................................................................................................................. 15
3 Results .............................................................................................................................. 19
3.1 Manure land application and transportation cost model ....................................................... 19 3.1.1 Effect of manure land application method on manure transportation break-even cost ......................... 19 3.1.2 Effect of dilution on manure opportunity value with different land application methods ...................... 20
3.2 Results on applications of the separation model on example farm cases ............................... 21
3.3 Sensitivity analysis ............................................................................................................... 23 3.3.1 Specification of sensitivity analysis ........................................................................................................... 23 3.3.2 Results on sensitivity analysis ................................................................................................................... 25 3.3.3 Discussion and possible improvements .................................................................................................... 26
4 Conclusions ....................................................................................................................... 28
5 Recommendations ............................................................................................................ 29
6 References ........................................................................................................................ 31
4
The project is partly financed by the European Union - European Regional Development Fund
1 Introduction
Economics of manure application is an issue which has been and still is a simple and easy for many farmers. What could be simpler than fertilizing the plants with appropriate organic fertilizer? However, in reality, manure management has become an increasingly difficult issue for farmers, due to regulations, constraints, market and policy incentives which affect costs of manure management. While farmers seek efficient operations and search for cost reducing ways of manure management their decisions are affected by a large number of interconnected variables. Efficient and profitable utilization of manure nutrients is influenced by the varying nutrient content of manure (due to animal feeding and manure handling), legislation concerning manure use as fertilizer, various technologies available for handling and processing manure, and the current price of inorganic chemical fertilizers. In this study we describe and apply a method for valuing manure in terms of money, from the farmers’ point of view. We utilize opportunity cost theory and market value of the main competing input, chemical fertilizer products. Implications of different manure application methods on manure logistics and farm economy are also described and calculated on anonymous case study farms Environmental legislation steering manure utilization is incorporated into our model with restrictions that limit the use of manure nutrient use per hectare, depending on the nutrient status (of phosphorous, in particular) of each field parcel. This paper is organized as follows. First, we take a brief look at the historical value development of manure nutrients and at the tightening restrictions on the use of manure nutrients. In chapter 2 we present a farm level calculation model for profitability of manure processing, taking into account manure logistics. This turned out to be a challenging task since many parameters related to farm operations as well as to the manure use legislation need to be accounted for. The empirical application of the model with results for given example farms (presented in chapter 2.3) is given in chapter 3. The main benefit with such models, even if their application to real farm cases requires some effort and data availability, is that sensitivity analyses of various kinds can be consistently performed. The model can be useful for evaluating the effect of various parameter changes (technical and farm level characteristics, or manure use legislation / agri-environmental support schemes) on the profitability of manure processing. A relevant question for livestock farmers is if investments in manure processing technologies could become more profitable after changes in key parameters, including changes in farm operations, nutrient prices and legislation. Main conclusions for further work in this area are presented in chapter 4.
5
The project is partly financed by the European Union - European Regional Development Fund
1.1 Value of manure and nutrient use restrictions
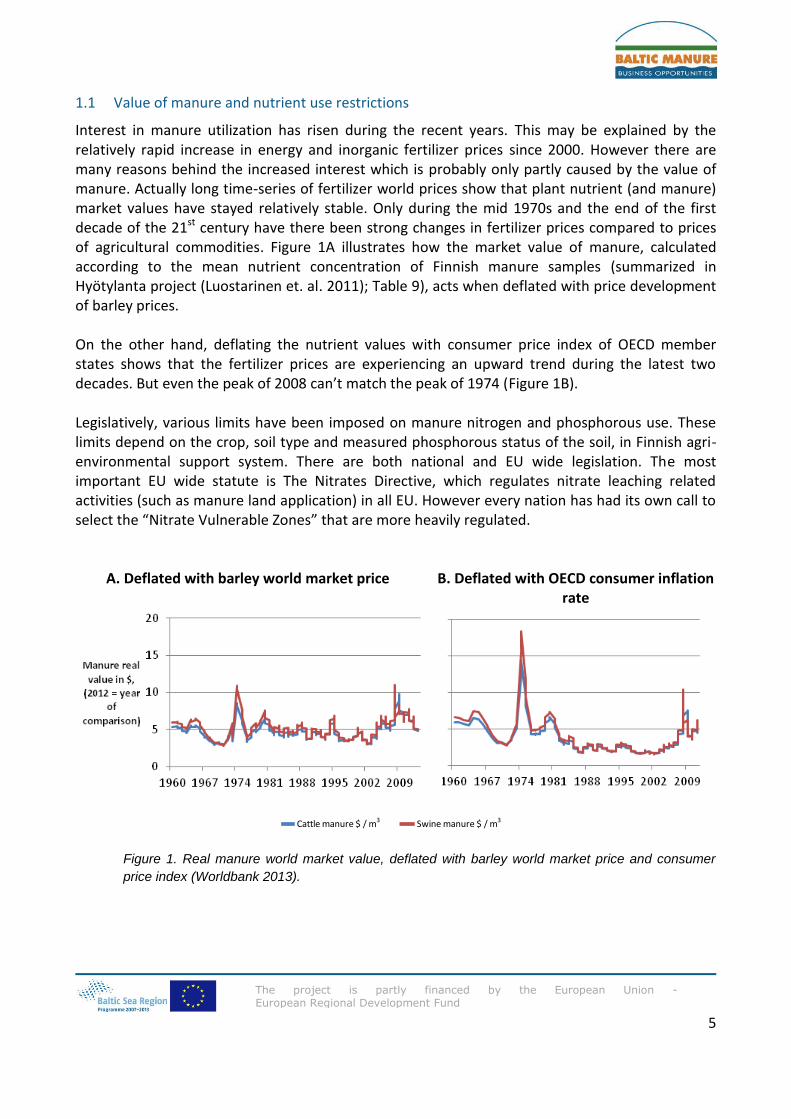
Interest in manure utilization has risen during the recent years. This may be explained by the relatively rapid increase in energy and inorganic fertilizer prices since 2000. However there are many reasons behind the increased interest which is probably only partly caused by the value of manure. Actually long time-series of fertilizer world prices show that plant nutrient (and manure) market values have stayed relatively stable. Only during the mid 1970s and the end of the first decade of the 21st century have there been strong changes in fertilizer prices compared to prices of agricultural commodities. Figure 1A illustrates how the market value of manure, calculated according to the mean nutrient concentration of Finnish manure samples (summarized in Hyötylanta project (Luostarinen et. al. 2011); Table 9), acts when deflated with price development of barley prices. On the other hand, deflating the nutrient values with consumer price index of OECD member states shows that the fertilizer prices are experiencing an upward trend during the latest two decades. But even the peak of 2008 can’t match the peak of 1974 (Figure 1B). Legislatively, various limits have been imposed on manure nitrogen and phosphorous use. These limits depend on the crop, soil type and measured phosphorous status of the soil, in Finnish agri-environmental support system. There are both national and EU wide legislation. The most important EU wide statute is The Nitrates Directive, which regulates nitrate leaching related activities (such as manure land application) in all EU. However every nation has had its own call to select the “Nitrate Vulnerable Zones” that are more heavily regulated.
A. Deflated with barley world market price B. Deflated with OECD consumer inflation rate
Figure 1. Real manure world market value, deflated with barley world market price and consumer
price index (Worldbank 2013).
Cattle manure $ / m3 Swine manure $ / m3
6
The project is partly financed by the European Union - European Regional Development Fund
Land application of phosphorus is regulated in national legislation. In Finland the field phosphorus application limits are bound to the national environmental subsidy program. This program is voluntary, but it has very good coverage among Finnish farmers (over 90 % of farms and 92 % of total field area (Aakkula et al. 2010)). Consequently, on the example farms utilized as cases in this study there were nutrient use restrictions set on amount of N and P on each field parcel and also on total N spread in manure. These limits were subject to the crop cultivated on the field parcel at issue. In addition soil properties and initial nutrient state of the current field parcel have an effect on the nutrient limits. In Sweden, manure application during a consecutive five year period cannot exceed 110 kg phosphorus per hectare on average for land receiving manure (Albertsson, 2012). Phosphorus fertilization recommendations are further based on soil phosphorus status and planed uptake by the crop, however it is recommended that the maximum annual application does not exceed 22 kg phosphorus per hectare. In addition to this, nitrogen application from manure is restricted by the Nitrates Directive (91/676/EEC) to a maximum of 170 kg total nitrogen per hectare and year.
2 Material and methods
2.1 Model for manure processing and logistics profitability calculation
2.1.1 Nutrient value assessment based on market prices of inorganic fertilizer products
Average prices of main nutrients (nitrogen, phosphorus and potassium) in commercial inorganic fertilizer products provide an opportunity cost (reference price in other words) for manure nutrients. However, it is not always easy to calculate the relevant “market prices” of main crop nutrients due to a large number of inorganic fertilizer products. Generally, farmers conceive the market prices of main crop nutrients on the basis of the inorganic fertilizer products available for farmers. Locally, the set of relevant inorganic fertilizer products providing the least cost crop nutrients depends on the soil characteristics and dominant crops cultivated in a region (“key nutrients”), as well as the local market situation and markets structure affecting the prices of inorganic nutrients. However, it is possible to single out 2 main methods for finding relevant reference nutrient prices, using available market prices of inorganic commercial fertilizer products:
A. Using system of linear equations on fertilizer price observations with appropriate nutrient
contents.
B. Running an ordinary least squares regression (OLS) on group of fertilizer price observations.
A. System of equations approach: one has to select fertilizers that have nutrient contents appropriate for
the system of equations approach.
1. The system needs to be symmetric, meaning that if you want to solve prices for three main
nutrients (N,P,K), you must have three fertilizers in the system.
2. Easiest way to make sure that the fertilizer nutrient contents are appropriate for the system is to
select one single nutrient fertilizer and one two-nutrient fertilizer. Third fertilizer is allowed to
7
The project is partly financed by the European Union - European Regional Development Fund
contain all three nutrients. However it is mandatory that each nutrient is present at least in one
observed fertilizer. Of course one can use only single nutrient fertilizers if available, but in that case
one doesn’t need to use the system of equations at all.
Generally the matrix solution of a system of equations is denoted as:
b = x Equation 1
Where A is a matrix of nutrient contents of the fertilizer products.
[
]
[
] [
] Equation 2
[
]
[
] [
]
Equation 3
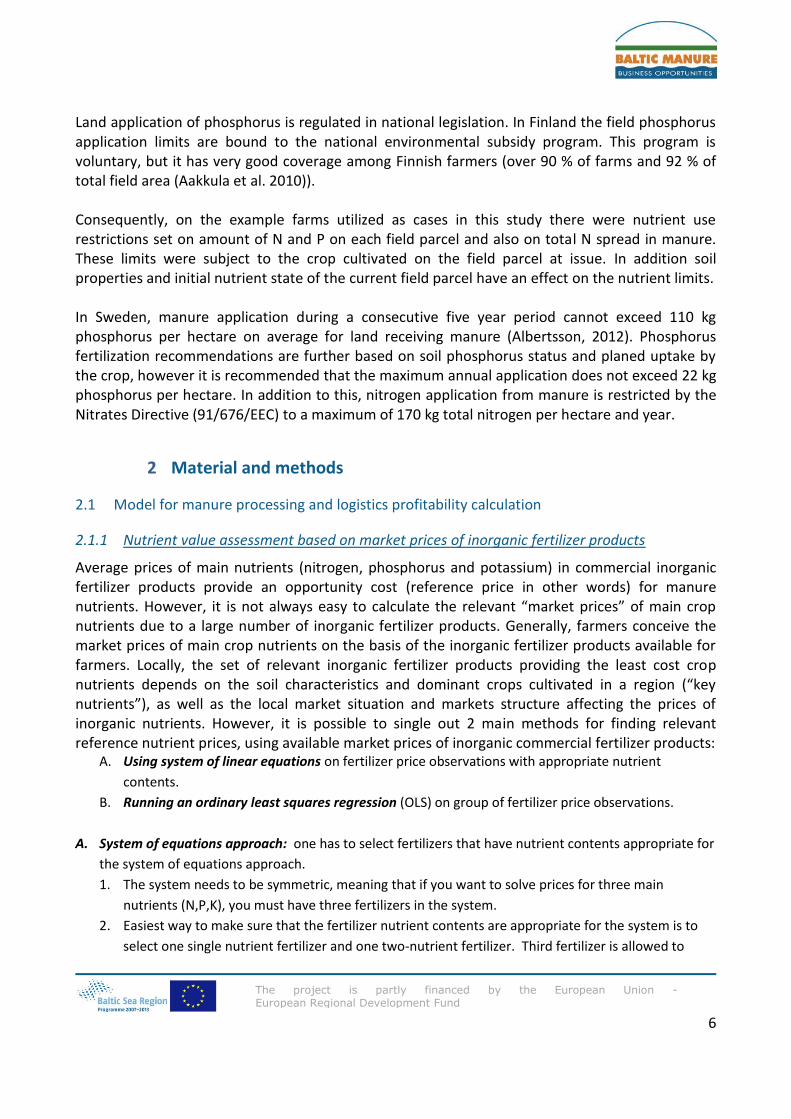
Matrix solution of this system of equations is presented in Equation 2 and a numerical example in Equation 3. In this example Fertilizer 1 (F1) contains only nitrogen (N), F2 contains N and potassium (K) and F3 contains all three main nutrients. And the numerical example, which is based on Finnish prices from summer of 2012 gives prices for N, P and K of 1,16, 2,94 and 0,68 € / kg, respectively.
B. Ordinary least squares regression (OLS): application on fertilizer price observations is less
limiting on the fertilizers used for price determination. The OLS regression is closely related to
the system of equations approach, but in regression it is admitted that there is some
unexplained variation in the nutrient-price relationships. Also results from regression and
system of equations approaches typically differ, because in OLS it is possible to use price
observations from synthetic compound (NPK) fertilizers, often designed to fit specific nutrient
requirements of certain crops in specific regions, and usually nutrient prices are higher in these
fertilizers compared to single nutrient fertilizers. For this use a special type of OLS with no
constant term is used. Constant term is omitted, because it is assumed that fertilizer with no
nutrients in it would cost precisely 0 €.
[
]
[
] [
]
Equation 4
8
The project is partly financed by the European Union - European Regional Development Fund
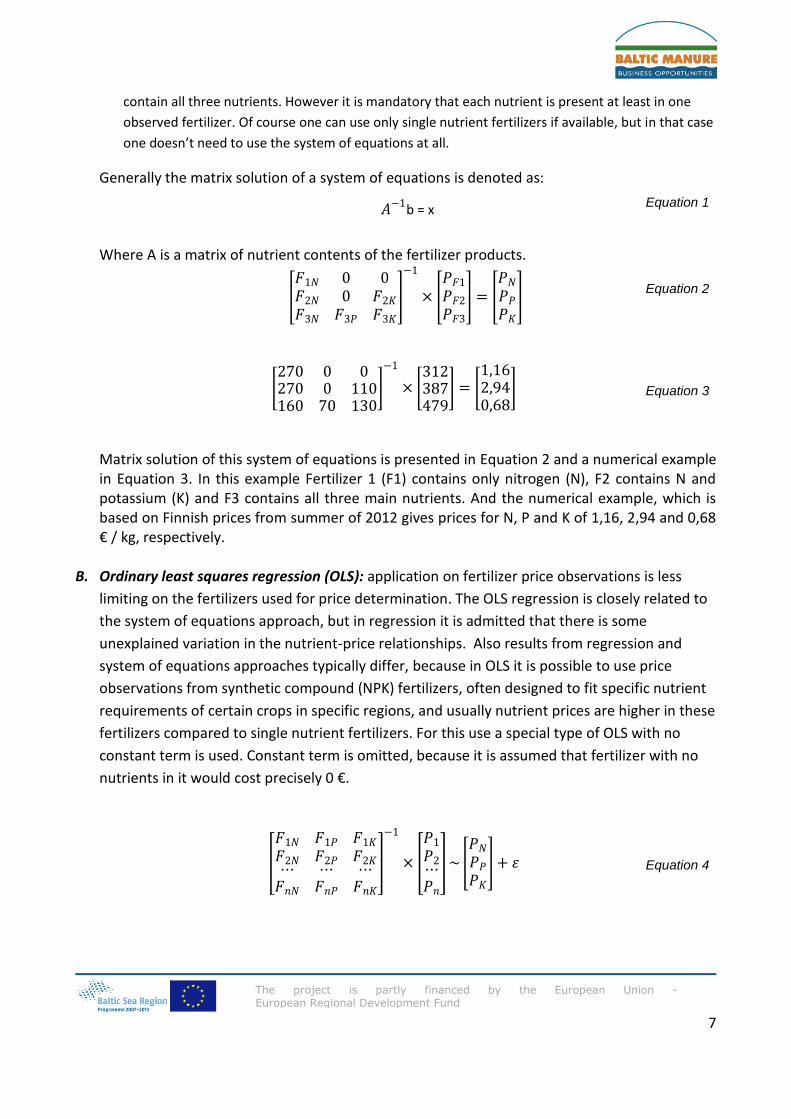
Fertilizer prices are typically recorded freight free, which is not feasible assumption considering nutrient prices in real farms. Freight is measured in ton / km and for fertilizer the nutrient concentration must be known, in order to assess the freight of the fertilizer. Fertilizers that are sold in Finland have mean nutrient concentration of 40 %, which means that 400 kg of total nutrients weights 1000 kilograms in total. Total nutrient price calculation formula is shown in Equation 5.
[
] [
]
Equation 5
2.1.2 Manure opportunity value assessment
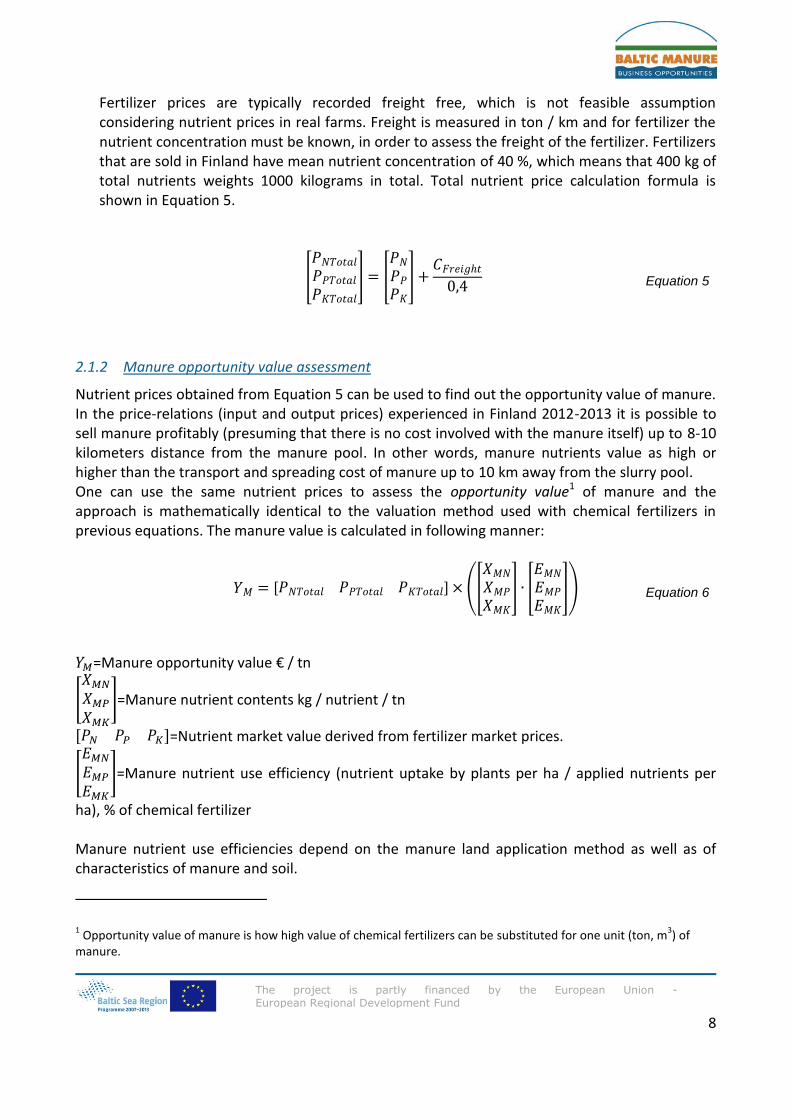
Nutrient prices obtained from Equation 5 can be used to find out the opportunity value of manure. In the price-relations (input and output prices) experienced in Finland 2012-2013 it is possible to sell manure profitably (presuming that there is no cost involved with the manure itself) up to 8-10 kilometers distance from the manure pool. In other words, manure nutrients value as high or higher than the transport and spreading cost of manure up to 10 km away from the slurry pool. One can use the same nutrient prices to assess the opportunity value1 of manure and the approach is mathematically identical to the valuation method used with chemical fertilizers in previous equations. The manure value is calculated in following manner:
[ ] ([
] [
])
Equation 6
=Manure opportunity value € / tn
[
]=Manure nutrient contents kg / nutrient / tn
[ ]=Nutrient market value derived from fertilizer market prices.
[
]=Manure nutrient use efficiency (nutrient uptake by plants per ha / applied nutrients per
ha), % of chemical fertilizer Manure nutrient use efficiencies depend on the manure land application method as well as of characteristics of manure and soil.
1 Opportunity value of manure is how high value of chemical fertilizers can be substituted for one unit (ton, m
3) of
manure.
9
The project is partly financed by the European Union - European Regional Development Fund
2.1.3 Manure separation model
Mechanical manure separation is a manure processing technique that yields several advantages such as reduction in odors as well as logistic and crop husbandry related benefits. Also separation may include some advantages on crop hygiene and liquid manure handling (Burton 2007). Although many of those aforementioned benefits may have an effect on farmers investment decision making, we have been forced to limit our study on those factors that are related to manure logistics and land application. In mechanical manure separation manure is split into two fractions, liquid and solid. We assume that the crop nutritional properties of nutrients included don’t depend on the fraction where the nutrient ends up. Nutrient separation efficiency is considered to be the extra amount of each nutrient that ends up into solid fraction compared to the fresh weight of the fraction. For example 8 % phosphorus separation efficiency (SEP) means that the amount of P ends up to solid fraction while 92% of P remains in liquid fraction (Equation 7). However the concentration of nutrients in solid fraction depends also on the fresh matter separation efficiency (8).
( [
])
Equation 7
(
( ) [
]
)
Equation 8
Where PM = [
], a vector of nutrients (kg) in unprocessed manure.
Two different separation technology options were calculated to Finnish example farms.
1. Mobile, tractor operated screw press separator
2. Stationary screw press separator with electric motor
For mobile separator option 1, it was assumed, that a tractor is needed for operation, and constant presence of the operator is needed hence labor demand equals machine operation time. The liquid fraction is pumped back to the slurry storage and solid fraction is stored in separate concrete storage. Investment cost of the mobile unit includes investment in separator, slurry pump and storage for solid fraction. Yearly running costs include cost for tractor labor and separator maintenance.
10
The project is partly financed by the European Union - European Regional Development Fund
In option 2, the stationary separator is assumed to be installed to a new production facility. In this way farmer can save in slurry storage investment costs by the volume that is reduced from slurry in solid fraction. Solid fraction storage is however needed. Investment cost of stationary separator includes separator, slurry pump, storage for solid fraction minus value of saved slurry storage investment cost. Running costs include some cost for labor, electricity and maintenance. For the Swedish farm example two different types of separators were used, a screw press and a centrifuge separator.
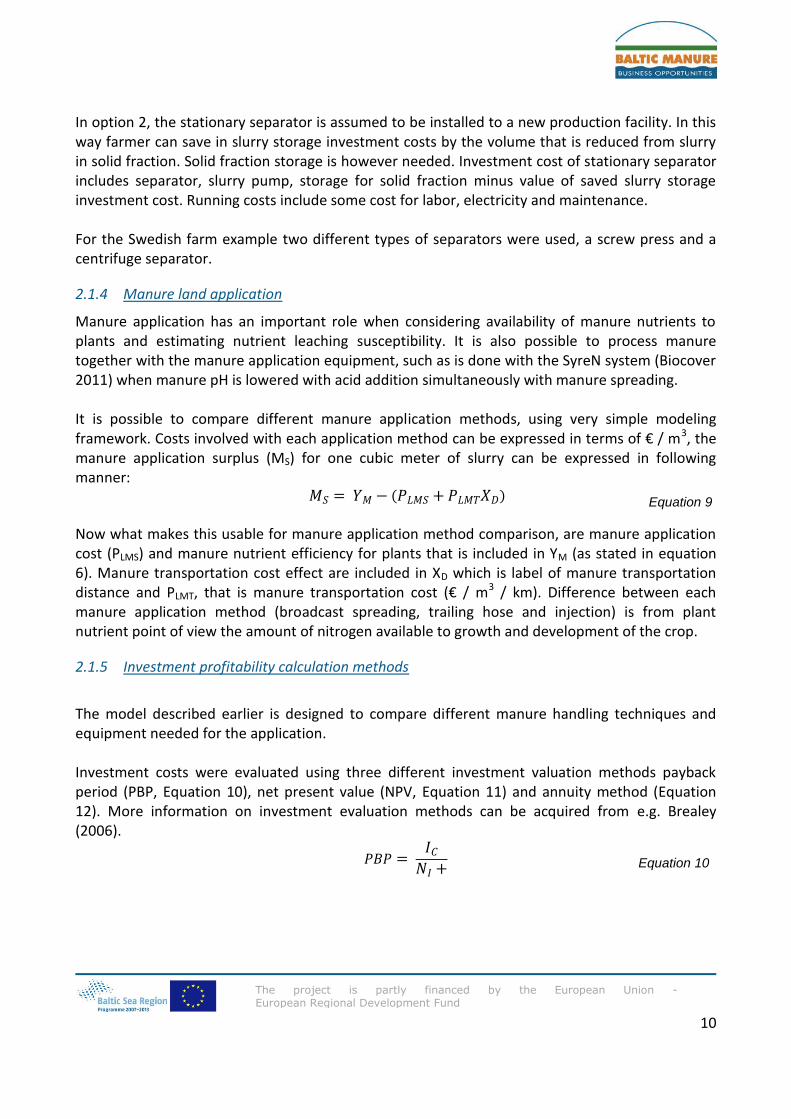
2.1.4 Manure land application
Manure application has an important role when considering availability of manure nutrients to plants and estimating nutrient leaching susceptibility. It is also possible to process manure together with the manure application equipment, such as is done with the SyreN system (Biocover 2011) when manure pH is lowered with acid addition simultaneously with manure spreading. It is possible to compare different manure application methods, using very simple modeling framework. Costs involved with each application method can be expressed in terms of € / m3, the manure application surplus (MS) for one cubic meter of slurry can be expressed in following manner:
( ) Equation 9
Now what makes this usable for manure application method comparison, are manure application cost (PLMS) and manure nutrient efficiency for plants that is included in YM (as stated in equation 6). Manure transportation cost effect are included in XD which is label of manure transportation distance and PLMT, that is manure transportation cost (€ / m3 / km). Difference between each manure application method (broadcast spreading, trailing hose and injection) is from plant nutrient point of view the amount of nitrogen available to growth and development of the crop.
2.1.5 Investment profitability calculation methods
The model described earlier is designed to compare different manure handling techniques and equipment needed for the application. Investment costs were evaluated using three different investment valuation methods payback period (PBP, Equation 10), net present value (NPV, Equation 11) and annuity method (Equation 12). More information on investment evaluation methods can be acquired from e.g. Brealey (2006).
Equation 10
11
The project is partly financed by the European Union - European Regional Development Fund
∑[ ( )
]
Equation 11
[( ( )]( ( ))( )
) Equation 12
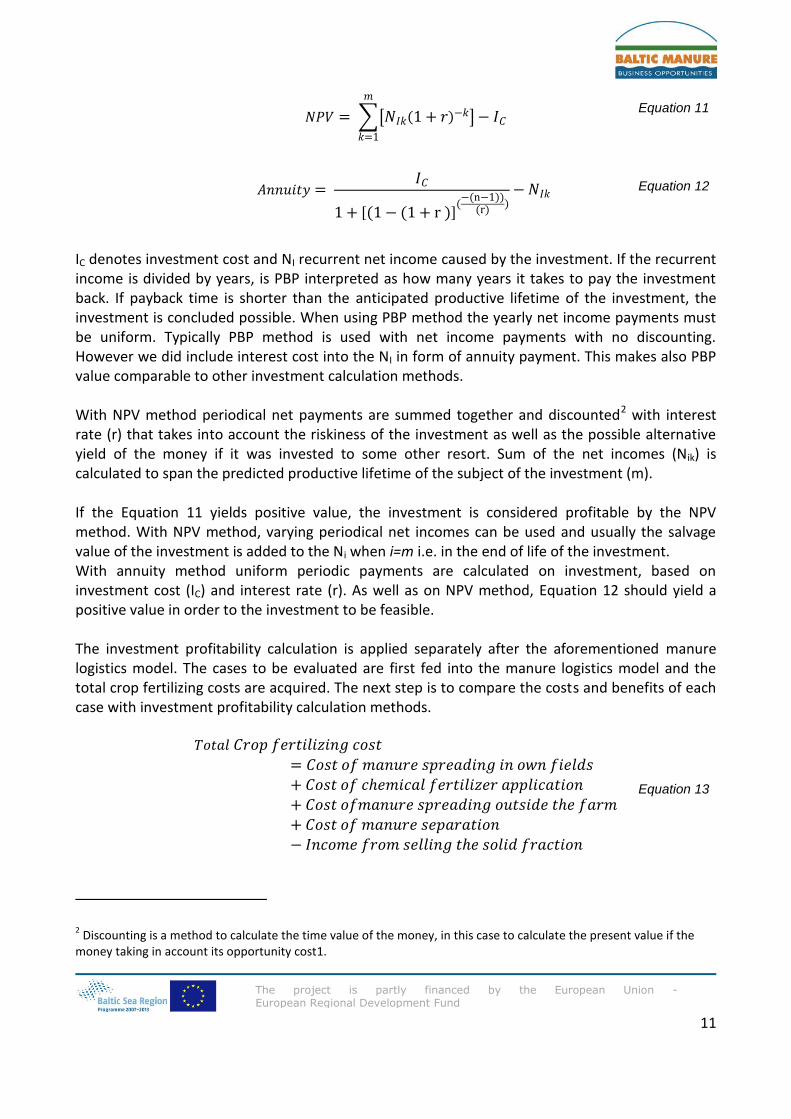
IC denotes investment cost and NI recurrent net income caused by the investment. If the recurrent income is divided by years, is PBP interpreted as how many years it takes to pay the investment back. If payback time is shorter than the anticipated productive lifetime of the investment, the investment is concluded possible. When using PBP method the yearly net income payments must be uniform. Typically PBP method is used with net income payments with no discounting. However we did include interest cost into the NI in form of annuity payment. This makes also PBP value comparable to other investment calculation methods. With NPV method periodical net payments are summed together and discounted2 with interest rate (r) that takes into account the riskiness of the investment as well as the possible alternative yield of the money if it was invested to some other resort. Sum of the net incomes (Nik) is calculated to span the predicted productive lifetime of the subject of the investment (m). If the Equation 11 yields positive value, the investment is considered profitable by the NPV method. With NPV method, varying periodical net incomes can be used and usually the salvage value of the investment is added to the Ni when i=m i.e. in the end of life of the investment. With annuity method uniform periodic payments are calculated on investment, based on investment cost (IC) and interest rate (r). As well as on NPV method, Equation 12 should yield a positive value in order to the investment to be feasible. The investment profitability calculation is applied separately after the aforementioned manure logistics model. The cases to be evaluated are first fed into the manure logistics model and the total crop fertilizing costs are acquired. The next step is to compare the costs and benefits of each case with investment profitability calculation methods.
Equation 13
2 Discounting is a method to calculate the time value of the money, in this case to calculate the present value if the
money taking in account its opportunity cost1.
12
The project is partly financed by the European Union - European Regional Development Fund
The yearly net cash flow considered in the model is calculated as remainder of Equation 13 calculated on both cases under evaluation. This comparison is presented in Equation 14.
Equation 14
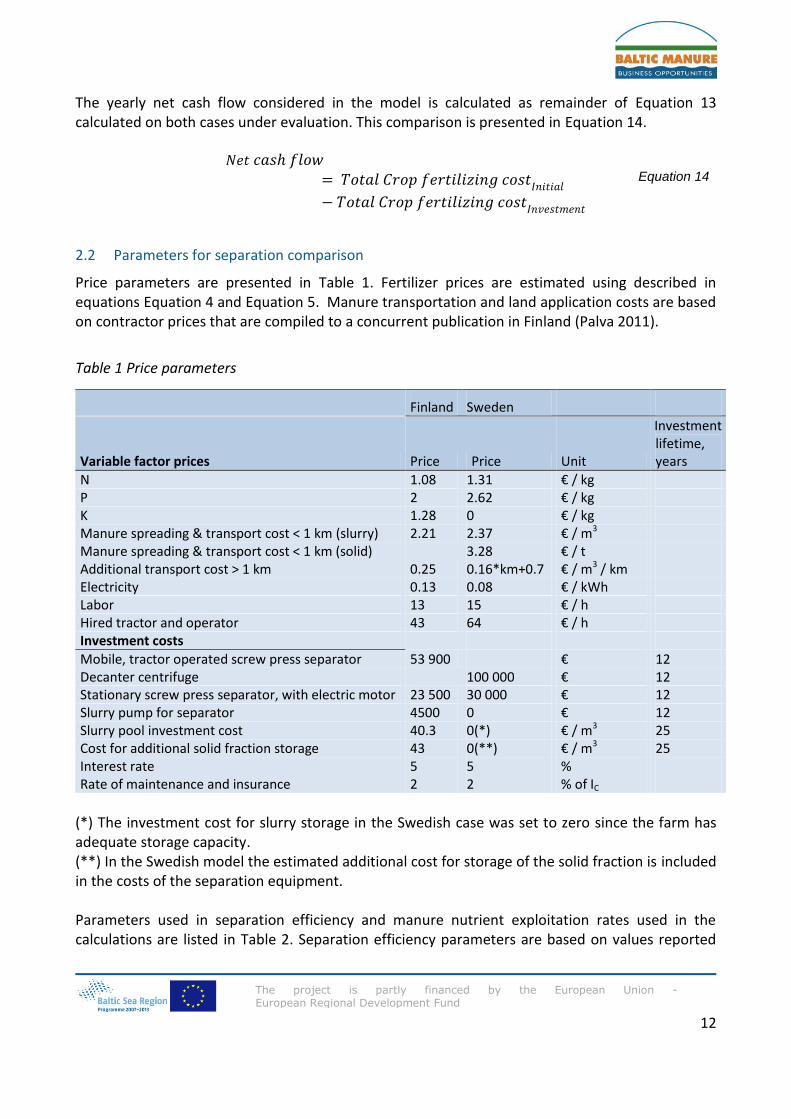
2.2 Parameters for separation comparison
Price parameters are presented in Table 1. Fertilizer prices are estimated using described in equations Equation 4 and Equation 5. Manure transportation and land application costs are based on contractor prices that are compiled to a concurrent publication in Finland (Palva 2011).
Table 1 Price parameters
Finland Sweden
Variable factor prices Price Price Unit
Investment lifetime, years
N 1.08 1.31 € / kg P 2 2.62 € / kg K 1.28 0 € / kg Manure spreading & transport cost < 1 km (slurry) 2.21 2.37 € / m3 Manure spreading & transport cost < 1 km (solid)
3.28 € / t
Additional transport cost > 1 km 0.25 0.16*km+0.7 € / m3 / km Electricity 0.13 0.08 € / kWh Labor 13 15 € / h Hired tractor and operator 43 64 € / h Investment costs
Mobile, tractor operated screw press separator 53 900 € 12 Decanter centrifuge
100 000 € 12
Stationary screw press separator, with electric motor 23 500 30 000 € 12 Slurry pump for separator 4500 0 € 12 Slurry pool investment cost 40.3 0(*) € / m3 25 Cost for additional solid fraction storage 43 0(**) € / m3 25 Interest rate 5 5 % Rate of maintenance and insurance 2 2 % of IC
(*) The investment cost for slurry storage in the Swedish case was set to zero since the farm has adequate storage capacity. (**) In the Swedish model the estimated additional cost for storage of the solid fraction is included in the costs of the separation equipment. Parameters used in separation efficiency and manure nutrient exploitation rates used in the calculations are listed in Table 2. Separation efficiency parameters are based on values reported
13
The project is partly financed by the European Union - European Regional Development Fund
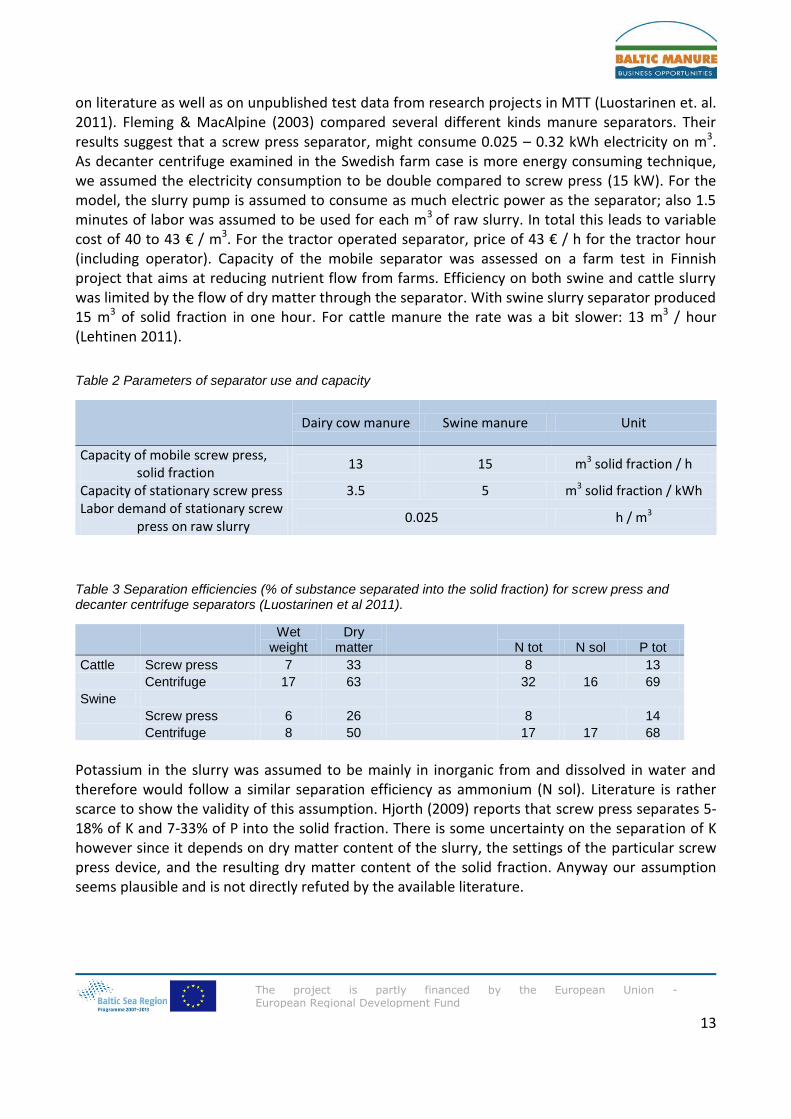
on literature as well as on unpublished test data from research projects in MTT (Luostarinen et. al. 2011). Fleming & MacAlpine (2003) compared several different kinds manure separators. Their results suggest that a screw press separator, might consume 0.025 – 0.32 kWh electricity on m3. As decanter centrifuge examined in the Swedish farm case is more energy consuming technique, we assumed the electricity consumption to be double compared to screw press (15 kW). For the model, the slurry pump is assumed to consume as much electric power as the separator; also 1.5 minutes of labor was assumed to be used for each m3 of raw slurry. In total this leads to variable cost of 40 to 43 € / m3. For the tractor operated separator, price of 43 € / h for the tractor hour (including operator). Capacity of the mobile separator was assessed on a farm test in Finnish project that aims at reducing nutrient flow from farms. Efficiency on both swine and cattle slurry was limited by the flow of dry matter through the separator. With swine slurry separator produced 15 m3 of solid fraction in one hour. For cattle manure the rate was a bit slower: 13 m3 / hour (Lehtinen 2011).
Table 2 Parameters of separator use and capacity
Dairy cow manure Swine manure Unit
Capacity of mobile screw press, solid fraction
13 15 m3 solid fraction / h
Capacity of stationary screw press 3.5 5 m3 solid fraction / kWh Labor demand of stationary screw
press on raw slurry 0.025 h / m3
Table 3 Separation efficiencies (% of substance separated into the solid fraction) for screw press and decanter centrifuge separators (Luostarinen et al 2011).
Wet weight
Dry matter
N tot N sol P tot
Cattle Screw press 7 33
8
13
Centrifuge 17 63
32 16 69
Swine
Screw press 6 26
8
14
Centrifuge 8 50
17 17 68
Potassium in the slurry was assumed to be mainly in inorganic from and dissolved in water and therefore would follow a similar separation efficiency as ammonium (N sol). Literature is rather scarce to show the validity of this assumption. Hjorth (2009) reports that screw press separates 5-18% of K and 7-33% of P into the solid fraction. There is some uncertainty on the separation of K however since it depends on dry matter content of the slurry, the settings of the particular screw press device, and the resulting dry matter content of the solid fraction. Anyway our assumption seems plausible and is not directly refuted by the available literature.
14
The project is partly financed by the European Union - European Regional Development Fund
2.3 Description of the farms
2.3.1 Finnish farms
Dairy farm
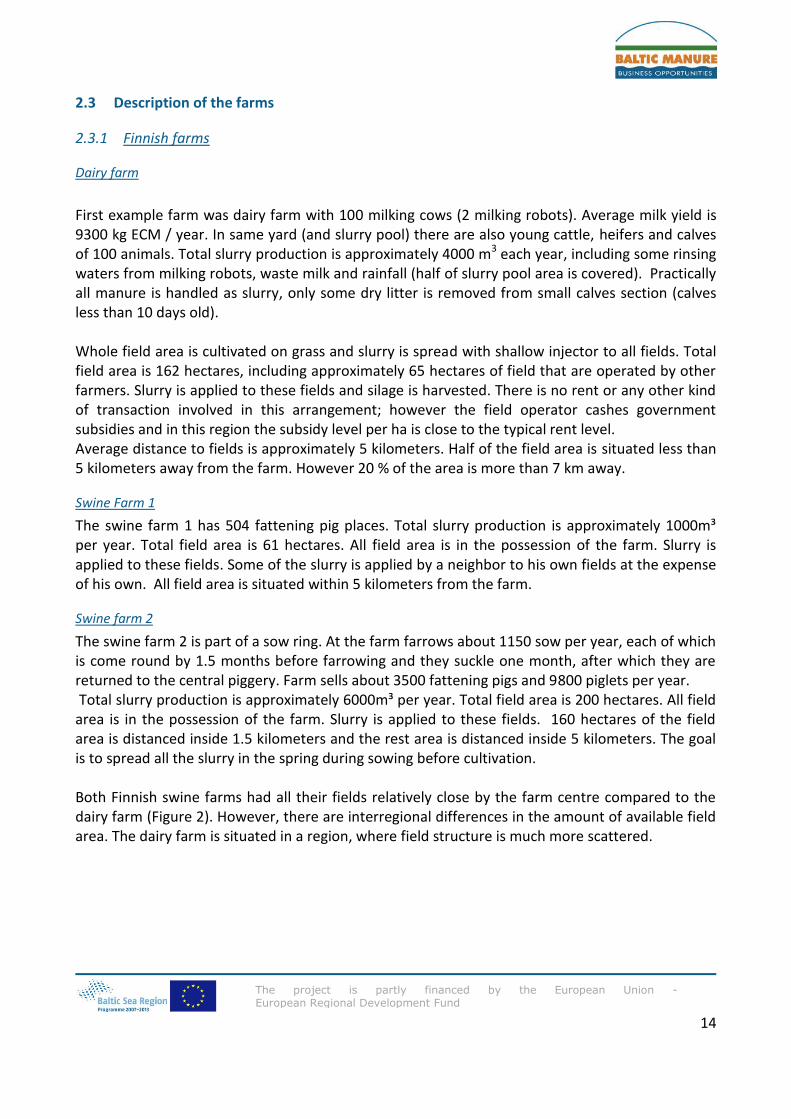
First example farm was dairy farm with 100 milking cows (2 milking robots). Average milk yield is 9300 kg ECM / year. In same yard (and slurry pool) there are also young cattle, heifers and calves of 100 animals. Total slurry production is approximately 4000 m3 each year, including some rinsing waters from milking robots, waste milk and rainfall (half of slurry pool area is covered). Practically all manure is handled as slurry, only some dry litter is removed from small calves section (calves less than 10 days old). Whole field area is cultivated on grass and slurry is spread with shallow injector to all fields. Total field area is 162 hectares, including approximately 65 hectares of field that are operated by other farmers. Slurry is applied to these fields and silage is harvested. There is no rent or any other kind of transaction involved in this arrangement; however the field operator cashes government subsidies and in this region the subsidy level per ha is close to the typical rent level. Average distance to fields is approximately 5 kilometers. Half of the field area is situated less than 5 kilometers away from the farm. However 20 % of the area is more than 7 km away.
Swine Farm 1
The swine farm 1 has 504 fattening pig places. Total slurry production is approximately 1000m³ per year. Total field area is 61 hectares. All field area is in the possession of the farm. Slurry is applied to these fields. Some of the slurry is applied by a neighbor to his own fields at the expense of his own. All field area is situated within 5 kilometers from the farm.
Swine farm 2
The swine farm 2 is part of a sow ring. At the farm farrows about 1150 sow per year, each of which is come round by 1.5 months before farrowing and they suckle one month, after which they are returned to the central piggery. Farm sells about 3500 fattening pigs and 9800 piglets per year. Total slurry production is approximately 6000m³ per year. Total field area is 200 hectares. All field area is in the possession of the farm. Slurry is applied to these fields. 160 hectares of the field area is distanced inside 1.5 kilometers and the rest area is distanced inside 5 kilometers. The goal is to spread all the slurry in the spring during sowing before cultivation. Both Finnish swine farms had all their fields relatively close by the farm centre compared to the dairy farm (Figure 2). However, there are interregional differences in the amount of available field area. The dairy farm is situated in a region, where field structure is much more scattered.
15
The project is partly financed by the European Union - European Regional Development Fund
Figure 2. Cumulative field distance distribution of the example farms
2.3.2 Swedish farm example
The Swedish farm example is a fictive dairy farm with a herd consisting of 560 cows, plus recruitment animals, with an equivalent total of 719 livestock units (LU). The farm has 487 ha of arable land available which gives a livestock density of 1.48 LU ha-1. Milk production is 10 000 kg ECM cow-1 yr-1. The entire herd is housed with slurry handling systems. Slurry production rates with 8 months of storage is 17.7 m3 cow-1 yr-1 (Jordbruksverket 1995:10) for the cows, but we assume this slurry production level for all LU. The herd has an annual slurry production of 13 895 m3 with nutrient contents given in Table 3 (data for manure and manure content is available from Stank in Mind www.greppa.nu).
0 %
10 %
20 %
30 %
40 %
50 %
60 %
70 %
80 %
90 %
100 %
0 0,5 1 1,5 2 2,5 3 3,5 4 4,5 5 5,5 6 6,5 7 >7
One way distance between farm and fields, km
Dairy farm Swine Farm 1 Swine Farm 2
16
The project is partly financed by the European Union - European Regional Development Fund
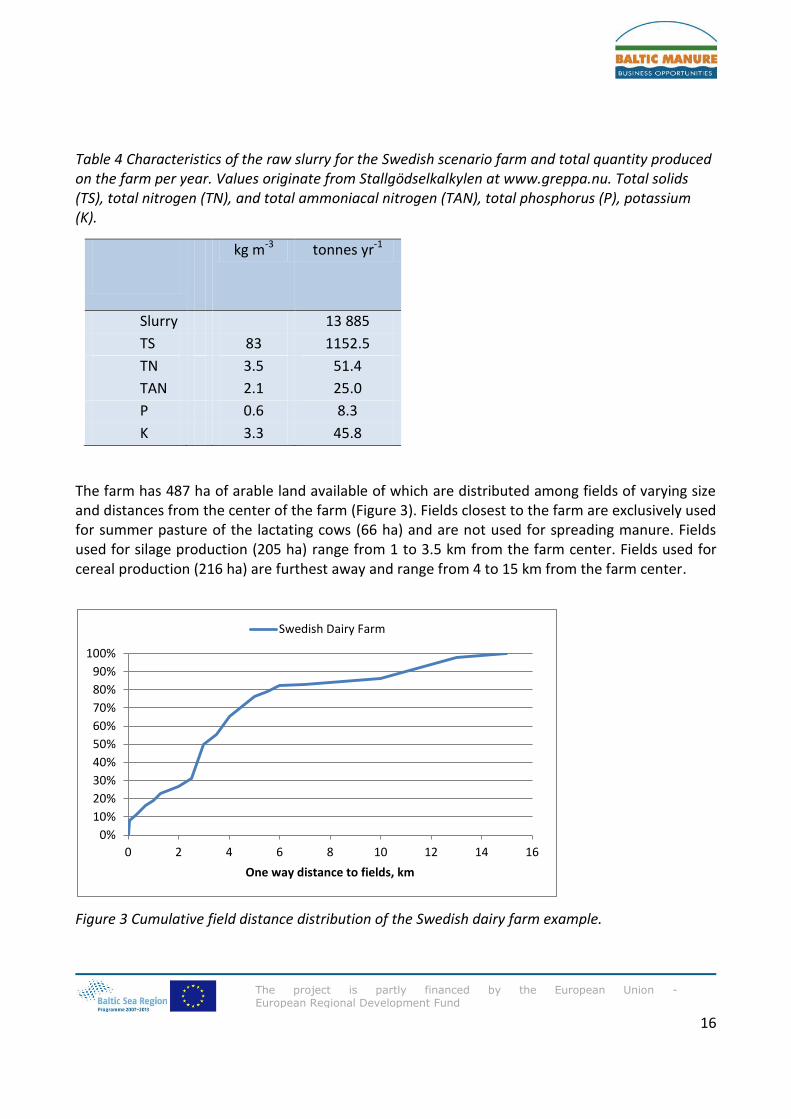
Table 4 Characteristics of the raw slurry for the Swedish scenario farm and total quantity produced on the farm per year. Values originate from Stallgödselkalkylen at www.greppa.nu. Total solids (TS), total nitrogen (TN), and total ammoniacal nitrogen (TAN), total phosphorus (P), potassium (K).
1.3.
kg m-3 tonnes yr-1
Slurry 13 885
TS 83 1152.5
TN 3.5 51.4
TAN 2.1 25.0
P 0.6 8.3
K 3.3 45.8
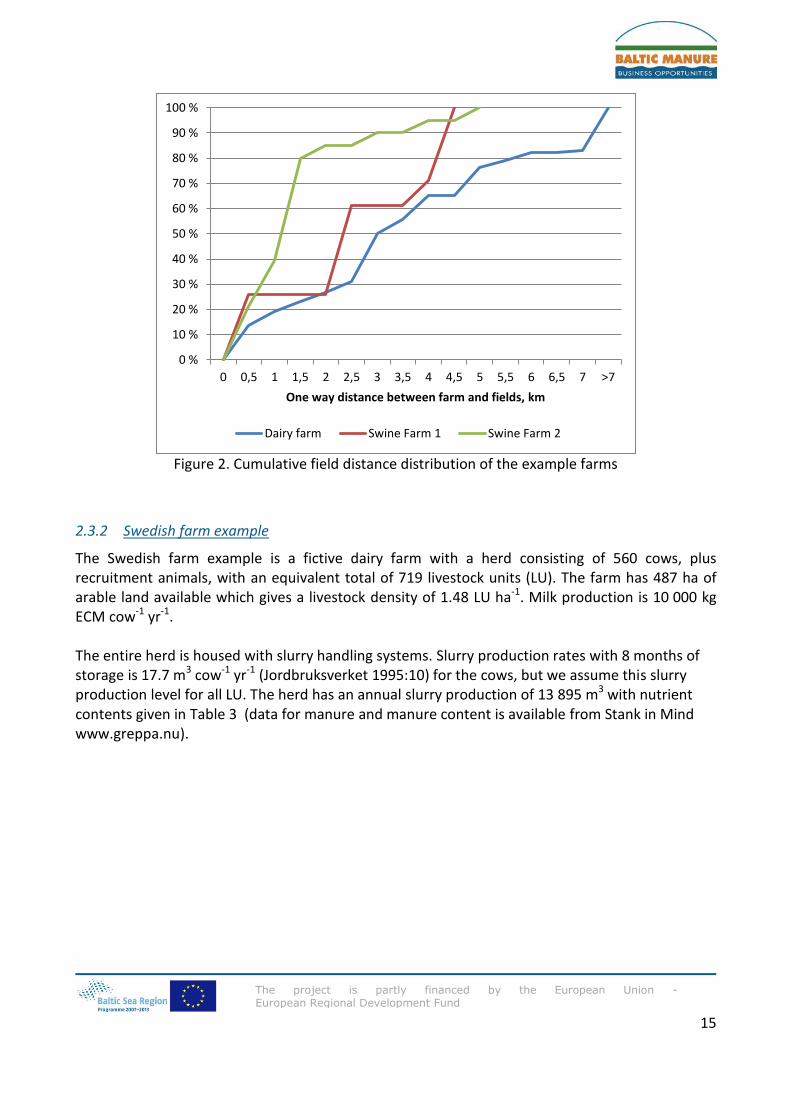
The farm has 487 ha of arable land available of which are distributed among fields of varying size and distances from the center of the farm (Figure 3). Fields closest to the farm are exclusively used for summer pasture of the lactating cows (66 ha) and are not used for spreading manure. Fields used for silage production (205 ha) range from 1 to 3.5 km from the farm center. Fields used for cereal production (216 ha) are furthest away and range from 4 to 15 km from the farm center.
Figure 3 Cumulative field distance distribution of the Swedish dairy farm example.
0%
10%
20%
30%
40%
50%
60%
70%
80%
90%
100%
0 2 4 6 8 10 12 14 16
One way distance to fields, km
Swedish Dairy Farm
17
The project is partly financed by the European Union - European Regional Development Fund
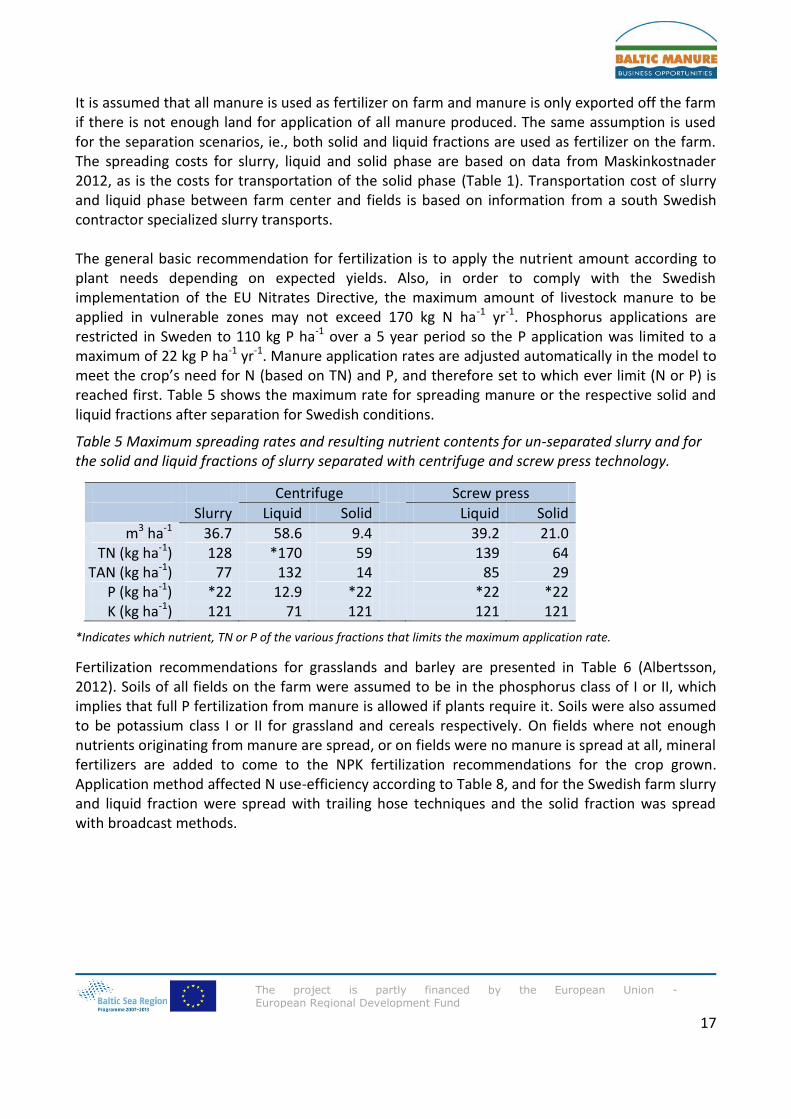
It is assumed that all manure is used as fertilizer on farm and manure is only exported off the farm if there is not enough land for application of all manure produced. The same assumption is used for the separation scenarios, ie., both solid and liquid fractions are used as fertilizer on the farm. The spreading costs for slurry, liquid and solid phase are based on data from Maskinkostnader 2012, as is the costs for transportation of the solid phase (Table 1). Transportation cost of slurry and liquid phase between farm center and fields is based on information from a south Swedish contractor specialized slurry transports. The general basic recommendation for fertilization is to apply the nutrient amount according to plant needs depending on expected yields. Also, in order to comply with the Swedish implementation of the EU Nitrates Directive, the maximum amount of livestock manure to be applied in vulnerable zones may not exceed 170 kg N ha-1 yr-1. Phosphorus applications are restricted in Sweden to 110 kg P ha-1 over a 5 year period so the P application was limited to a maximum of 22 kg P ha-1 yr-1. Manure application rates are adjusted automatically in the model to meet the crop’s need for N (based on TN) and P, and therefore set to which ever limit (N or P) is reached first. Table 5 shows the maximum rate for spreading manure or the respective solid and liquid fractions after separation for Swedish conditions.
Table 5 Maximum spreading rates and resulting nutrient contents for un-separated slurry and for the solid and liquid fractions of slurry separated with centrifuge and screw press technology.
Centrifuge Screw press
Slurry Liquid Solid Liquid Solid
m3 ha-1 36.7 58.6 9.4 39.2 21.0 TN (kg ha-1) 128 *170 59 139 64
TAN (kg ha-1) 77 132 14 85 29 P (kg ha-1) *22 12.9 *22 *22 *22 K (kg ha-1) 121 71 121 121 121
*Indicates which nutrient, TN or P of the various fractions that limits the maximum application rate.
Fertilization recommendations for grasslands and barley are presented in Table 6 (Albertsson, 2012). Soils of all fields on the farm were assumed to be in the phosphorus class of I or II, which implies that full P fertilization from manure is allowed if plants require it. Soils were also assumed to be potassium class I or II for grassland and cereals respectively. On fields where not enough nutrients originating from manure are spread, or on fields were no manure is spread at all, mineral fertilizers are added to come to the NPK fertilization recommendations for the crop grown. Application method affected N use-efficiency according to Table 8, and for the Swedish farm slurry and liquid fraction were spread with trailing hose techniques and the solid fraction was spread with broadcast methods.
18
The project is partly financed by the European Union - European Regional Development Fund
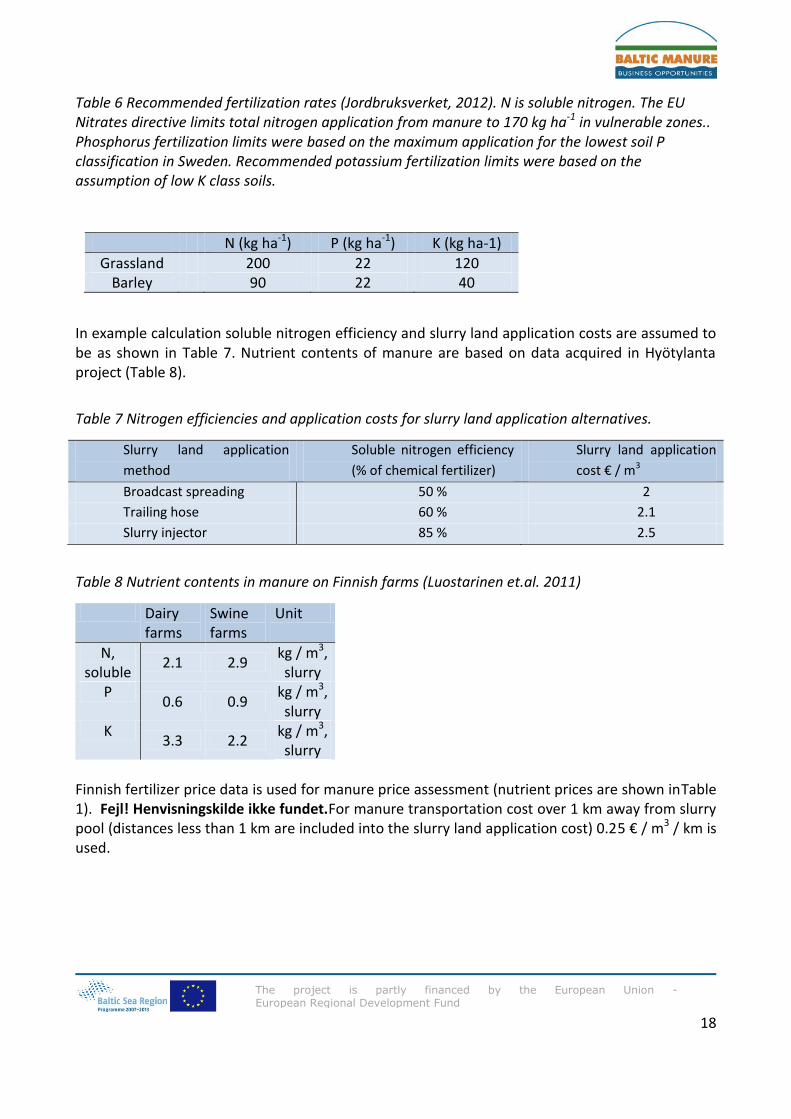
Table 6 Recommended fertilization rates (Jordbruksverket, 2012). N is soluble nitrogen. The EU Nitrates directive limits total nitrogen application from manure to 170 kg ha-1 in vulnerable zones.. Phosphorus fertilization limits were based on the maximum application for the lowest soil P classification in Sweden. Recommended potassium fertilization limits were based on the assumption of low K class soils.
N (kg ha-1) P (kg ha-1) K (kg ha-1)
Grassland 200 22 120 Barley 90 22 40
In example calculation soluble nitrogen efficiency and slurry land application costs are assumed to be as shown in Table 7. Nutrient contents of manure are based on data acquired in Hyötylanta project (Table 8).
Table 7 Nitrogen efficiencies and application costs for slurry land application alternatives.
Slurry land application
method
Soluble nitrogen efficiency
(% of chemical fertilizer)
Slurry land application
cost € / m3
Broadcast spreading 50 % 2
Trailing hose 60 % 2.1
Slurry injector 85 % 2.5
Table 8 Nutrient contents in manure on Finnish farms (Luostarinen et.al. 2011)
Dairy farms
Swine farms
Unit
N, soluble
2.1 2.9 kg / m3, slurry
P 0.6 0.9
kg / m3, slurry
K 3.3 2.2
kg / m3, slurry
Finnish fertilizer price data is used for manure price assessment (nutrient prices are shown inTable 1). Fejl! Henvisningskilde ikke fundet.For manure transportation cost over 1 km away from slurry pool (distances less than 1 km are included into the slurry land application cost) 0.25 € / m3 / km is used.
19
The project is partly financed by the European Union - European Regional Development Fund
3 Results
3.1 Manure land application and transportation cost model
3.1.1 Effect of manure land application method on manure transportation break-even cost
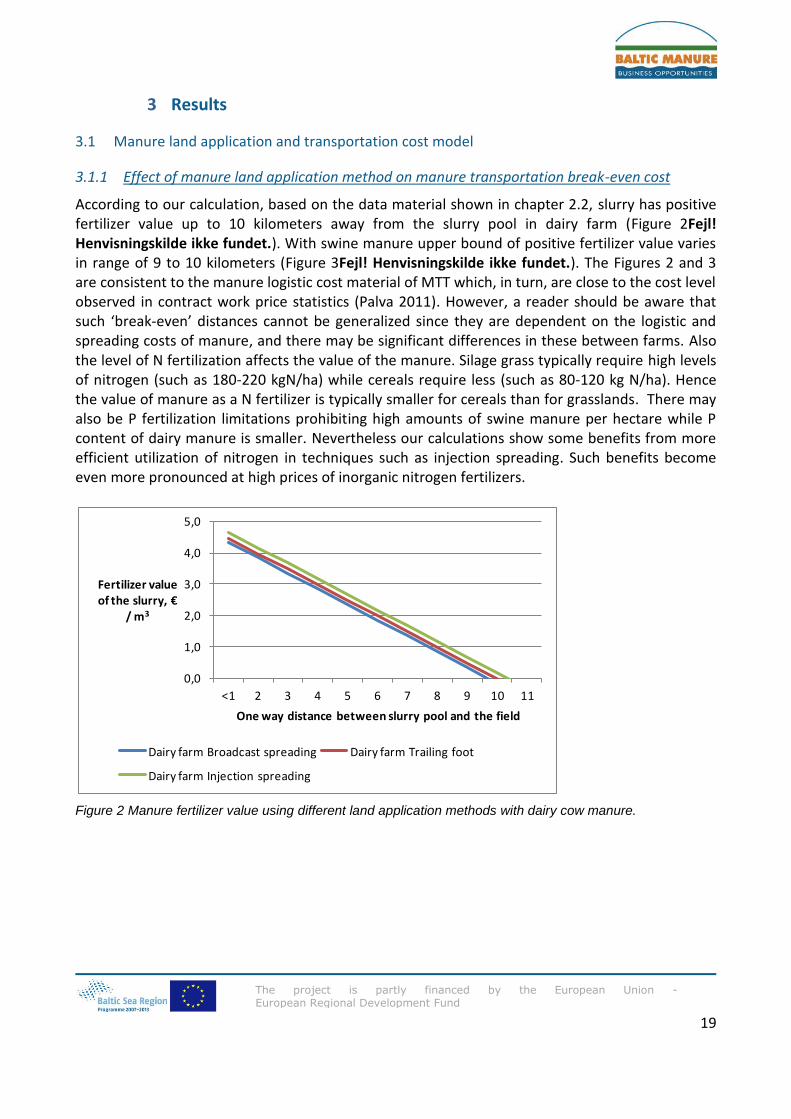
According to our calculation, based on the data material shown in chapter 2.2, slurry has positive fertilizer value up to 10 kilometers away from the slurry pool in dairy farm (Figure 2Fejl! Henvisningskilde ikke fundet.). With swine manure upper bound of positive fertilizer value varies in range of 9 to 10 kilometers (Figure 3Fejl! Henvisningskilde ikke fundet.). The Figures 2 and 3 are consistent to the manure logistic cost material of MTT which, in turn, are close to the cost level observed in contract work price statistics (Palva 2011). However, a reader should be aware that such ‘break-even’ distances cannot be generalized since they are dependent on the logistic and spreading costs of manure, and there may be significant differences in these between farms. Also the level of N fertilization affects the value of the manure. Silage grass typically require high levels of nitrogen (such as 180-220 kgN/ha) while cereals require less (such as 80-120 kg N/ha). Hence the value of manure as a N fertilizer is typically smaller for cereals than for grasslands. There may also be P fertilization limitations prohibiting high amounts of swine manure per hectare while P content of dairy manure is smaller. Nevertheless our calculations show some benefits from more efficient utilization of nitrogen in techniques such as injection spreading. Such benefits become even more pronounced at high prices of inorganic nitrogen fertilizers.
Figure 2 Manure fertilizer value using different land application methods with dairy cow manure.
0,0
1,0
2,0
3,0
4,0
5,0
<1 2 3 4 5 6 7 8 9 10 11
Fertilizer value of the slurry, €
/ m3
One way distance between slurry pool and the field
Dairy farm Broadcast spreading Dairy farm Trailing foot
Dairy farm Injection spreading
20
The project is partly financed by the European Union - European Regional Development Fund
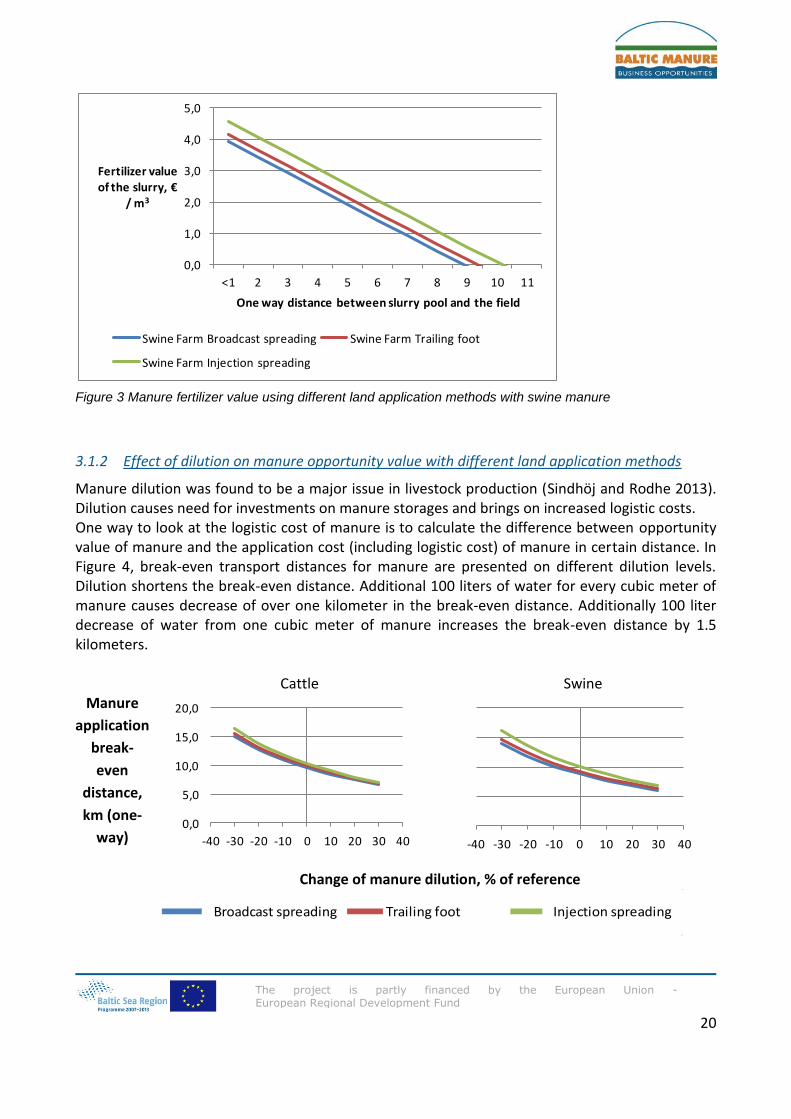
Figure 3 Manure fertilizer value using different land application methods with swine manure
3.1.2 Effect of dilution on manure opportunity value with different land application methods
Manure dilution was found to be a major issue in livestock production (Sindhöj and Rodhe 2013). Dilution causes need for investments on manure storages and brings on increased logistic costs. One way to look at the logistic cost of manure is to calculate the difference between opportunity value of manure and the application cost (including logistic cost) of manure in certain distance. In Figure 4, break-even transport distances for manure are presented on different dilution levels. Dilution shortens the break-even distance. Additional 100 liters of water for every cubic meter of manure causes decrease of over one kilometer in the break-even distance. Additionally 100 liter decrease of water from one cubic meter of manure increases the break-even distance by 1.5 kilometers. Cattle Swine
Manure
application
break-
even
distance,
km (one-
way)
Change of manure dilution, % of reference
0,0
1,0
2,0
3,0
4,0
5,0
<1 2 3 4 5 6 7 8 9 10 11
Fertilizer value of the slurry, €
/ m3
One way distance between slurry pool and the field
Swine Farm Broadcast spreading Swine Farm Trailing foot
Swine Farm Injection spreading
0,0
5,0
10,0
15,0
20,0
-40 -30 -20 -10 0 10 20 30 40 -40 -30 -20 -10 0 10 20 30 40
Broadcast spreading Trailing foot Injection spreading
21
The project is partly financed by the European Union - European Regional Development Fund
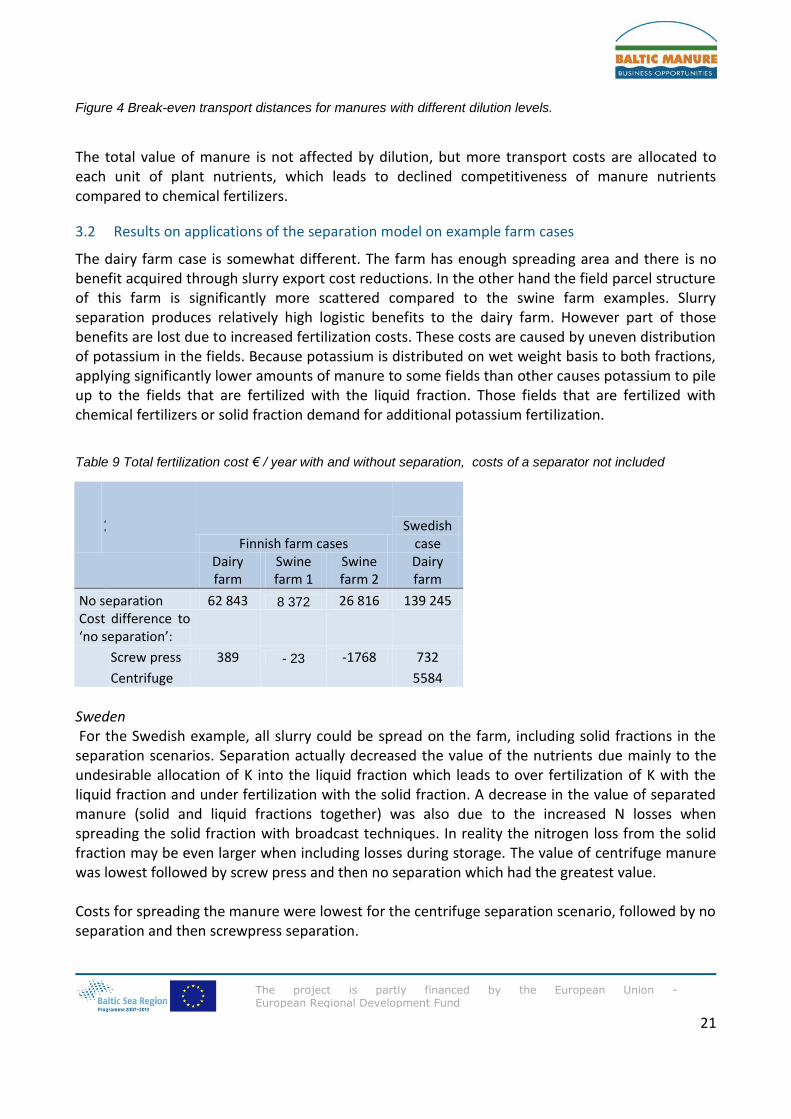
Figure 4 Break-even transport distances for manures with different dilution levels.
The total value of manure is not affected by dilution, but more transport costs are allocated to each unit of plant nutrients, which leads to declined competitiveness of manure nutrients compared to chemical fertilizers.
3.2 Results on applications of the separation model on example farm cases
The dairy farm case is somewhat different. The farm has enough spreading area and there is no benefit acquired through slurry export cost reductions. In the other hand the field parcel structure of this farm is significantly more scattered compared to the swine farm examples. Slurry separation produces relatively high logistic benefits to the dairy farm. However part of those benefits are lost due to increased fertilization costs. These costs are caused by uneven distribution of potassium in the fields. Because potassium is distributed on wet weight basis to both fractions, applying significantly lower amounts of manure to some fields than other causes potassium to pile up to the fields that are fertilized with the liquid fraction. Those fields that are fertilized with chemical fertilizers or solid fraction demand for additional potassium fertilization.
Table 9 Total fertilization cost € / year with and without separation, costs of a separator not included
1.4.
Finnish farm cases Swedish
case
Dairy farm
Swine farm 1
Swine farm 2
Dairy farm
No separation 62 843 8 372 26 816 139 245 Cost difference to ‘no separation’:
Screw press 389 - 23 -1768 732
Centrifuge
5584
Sweden For the Swedish example, all slurry could be spread on the farm, including solid fractions in the separation scenarios. Separation actually decreased the value of the nutrients due mainly to the undesirable allocation of K into the liquid fraction which leads to over fertilization of K with the liquid fraction and under fertilization with the solid fraction. A decrease in the value of separated manure (solid and liquid fractions together) was also due to the increased N losses when spreading the solid fraction with broadcast techniques. In reality the nitrogen loss from the solid fraction may be even larger when including losses during storage. The value of centrifuge manure was lowest followed by screw press and then no separation which had the greatest value. Costs for spreading the manure were lowest for the centrifuge separation scenario, followed by no separation and then screwpress separation.
22
The project is partly financed by the European Union - European Regional Development Fund
All three scenarios (no separation, screw press and centrifuge) had a positive net value for the manure; however, net value was greatest for no separation followed by screwpress and centrifuge. Similar to the Finnish farms, untreated slurry had a positive net value until the transport distance was greater than 10 km, however this was dependent on including the value of K. The value of N and P alone covered spreading costs only on fields less than 1 km from the farm center. When only considering the net value of N and P, centrifuge had the greatest value followed by no separation and then screwpress. The net value of the centrifuge solid fraction was slightly greater than the liquid fraction for any particular distance due to lower logistical costs (transport and spreading), even though the nutrient value of the solid fraction was lower than the liquid fraction, which suggests the solid fraction is suitable for spreading on fields far from the farm center. This was particularly obvious if only considering the value of N and P, in which case only the solid fraction had a positive value due to the high logistic costs of transporting the liquid fraction. Costs for additional mineral fertilization were greatest for centrifuge followed by screwpress and then no separation. The high cost for mineral fertilizers with centrifuge separation are due mainly to the mineral K needed when using only the centrifuge solid fraction; however there was also a slightly greater need for N fertilizer to compensate for the increased losses when spreading the solid fraction. Total fertilization costs, including spreading and mineral fertilizer costs, were greatest for centrifuge separation followed by screwpress and then no separation (Table 9), however, if only N and P are considered then centrifuge had the lowest total cost for fertilization. Main results The separator investment options were unprofitable in all cases studied. Savings in logistic costs were not able to cover the variable costs associated with separation technology. Increasing manure exporting distance from 5 km to 6.5 km decreased the fertilization cost enough for the savings to exceed the variable separation cost and increasing the distance to 20 km turned the investment profitable in terms of investment payback time. With investment subsidy of 30 % the investment would be possible with manure export distance of 16 km at a swine farm. Swine farm 2, gained the best advantage of separation, but swine farm 1 was too small to face adequate benefits from separation technology. Both dairy farm examples Finnish and Swedish farm were far from making the technology profitable.
23
The project is partly financed by the European Union - European Regional Development Fund
3.3 Sensitivity analysis
3.3.1 Specification of sensitivity analysis
Sensitivity analysis is a method targeted to be used to find out whether changes in surrounding conditions have impact on the phenomena that is being observed. Conditions that may have effect on manure use economies are can be set into three categories:
1. Changes in price relations between chemical fertilizers and manure handling and processing
technology investments and operations.
2. Changing policies.
3. New innovations.
Effect of number three, new innovations is difficult to assess due to those innovations not existing yet. For manure separation some effects of more efficient phosphorus reduction from liquid fraction could be tested. Also better N efficiency in field for slurry might be included into the sensitivity analysis. For points one and two we have some tools available. First we need to define range of possible variation, after which we can conduct the sensitivity analysis with the probable values. Considering the change in price relations seems straight forward: prices do change, we even have some deviation data available. However changing one price and keeping other constant yields a price relation change, but things seldom occurs that straight forward in real world. In practice most price changes are interconnected and have some effect on each other. Comparison on different manure handling (and processing) options is comparing cost of chemical fertilization to manure land application costs. Chemical (nitrogen) fertilizer production is heavily dependent on energy prices, as natural gas is the main ingredient in chemical nitrogen fertilizer production. On the other hand phosphorus and potassium are extractives with limited supply. Leading to that chemical fertilizer prices depend on energy prices and agricultural product prices. Prices relation changes in sensitivity analysis must involve the facts that:
1. There is strengthening connection between energy and agricultural product prices.
2. There is some connection between agricultural product and fertilizer prices.
3. There is connection between energy and fertilizer nitrogen prices
4. There is connection between energy prices and variable machine work costs (fuels).
5. Energy and agricultural product prices contribute heavily on costs of living, which can’t be without
effect on costs involved with agricultural labor also, influencing also on manure application costs.
Recognizing the weakest linkages from group of effects and connections related to manure use profitability, is important for the sensitivity analysis to be worthwhile. Instead of making direct price change scenarios, the sensitivity analysis is based on following price relations, which are based on cursory analysis on Finnish price data (Table 10). While conducting the analysis, grain and energy prices are assumed to deviate independently.
24
The project is partly financed by the European Union - European Regional Development Fund
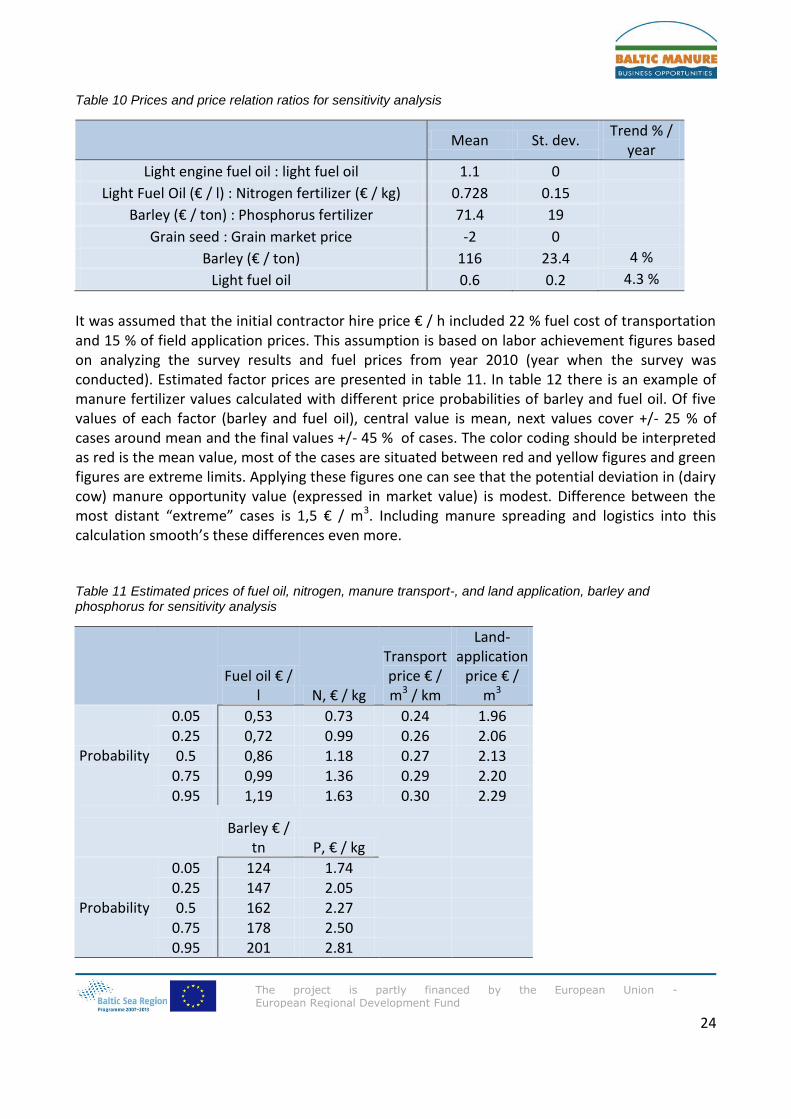
Table 10 Prices and price relation ratios for sensitivity analysis
Mean St. dev.
Trend % / year
Light engine fuel oil : light fuel oil 1.1 0
Light Fuel Oil (€ / l) : Nitrogen fertilizer (€ / kg) 0.728 0.15
Barley (€ / ton) : Phosphorus fertilizer 71.4 19
Grain seed : Grain market price -2 0
Barley (€ / ton) 116 23.4 4 %
Light fuel oil 0.6 0.2 4.3 %
It was assumed that the initial contractor hire price € / h included 22 % fuel cost of transportation and 15 % of field application prices. This assumption is based on labor achievement figures based on analyzing the survey results and fuel prices from year 2010 (year when the survey was conducted). Estimated factor prices are presented in table 11. In table 12 there is an example of manure fertilizer values calculated with different price probabilities of barley and fuel oil. Of five values of each factor (barley and fuel oil), central value is mean, next values cover +/- 25 % of cases around mean and the final values +/- 45 % of cases. The color coding should be interpreted as red is the mean value, most of the cases are situated between red and yellow figures and green figures are extreme limits. Applying these figures one can see that the potential deviation in (dairy cow) manure opportunity value (expressed in market value) is modest. Difference between the most distant “extreme” cases is 1,5 € / m3. Including manure spreading and logistics into this calculation smooth’s these differences even more.
Table 11 Estimated prices of fuel oil, nitrogen, manure transport-, and land application, barley and phosphorus for sensitivity analysis
Fuel oil € / l N, € / kg
Transport price € / m3 / km
Land-application
price € / m3
Probability
0.05 0,53 0.73 0.24 1.96 0.25 0,72 0.99 0.26 2.06 0.5 0,86 1.18 0.27 2.13
0.75 0,99 1.36 0.29 2.20 0.95 1,19 1.63 0.30 2.29
Barley € / tn P, € / kg
Probability
0.05 124 1.74 0.25 147 2.05 0.5 162 2.27 0.75 178 2.50 0.95 201 2.81
25
The project is partly financed by the European Union - European Regional Development Fund
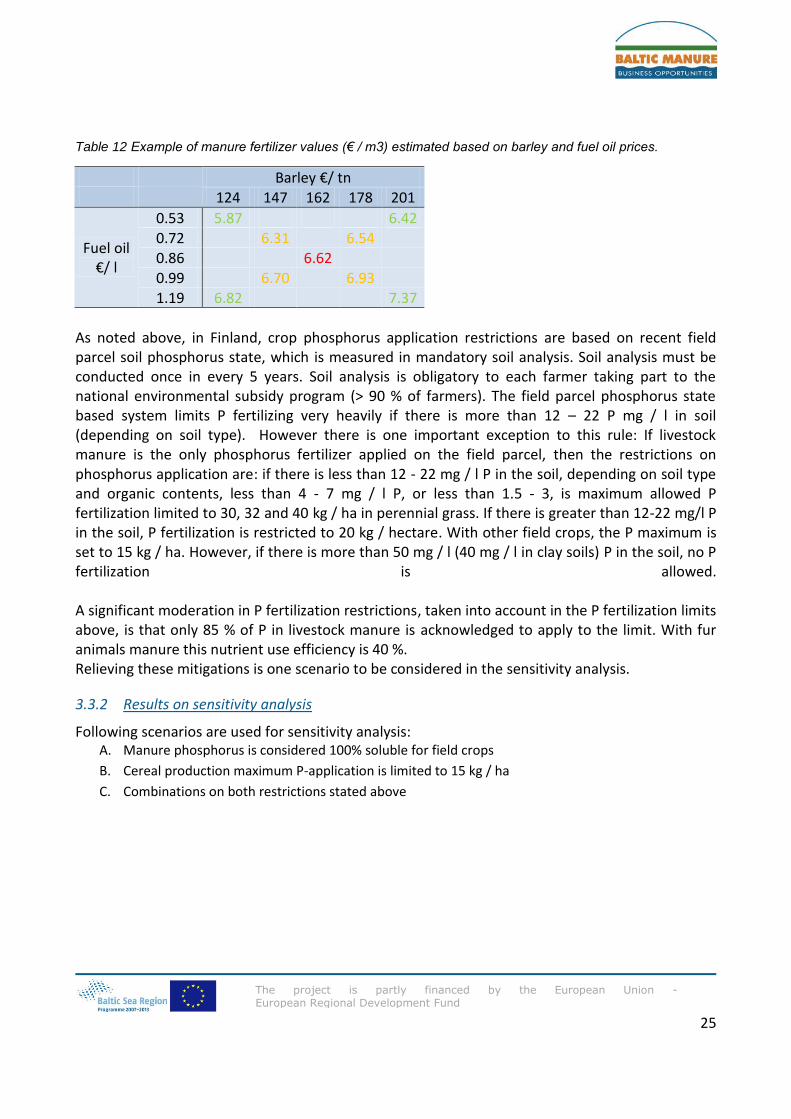
Table 12 Example of manure fertilizer values (€ / m3) estimated based on barley and fuel oil prices.
Barley €/ tn
124 147 162 178 201
Fuel oil €/ l
0.53 5.87 6.42 0.72 6.31
6.54
0.86
6.62 0.99 6.70
6.93
1.19 6.82
7.37
As noted above, in Finland, crop phosphorus application restrictions are based on recent field parcel soil phosphorus state, which is measured in mandatory soil analysis. Soil analysis must be conducted once in every 5 years. Soil analysis is obligatory to each farmer taking part to the national environmental subsidy program (> 90 % of farmers). The field parcel phosphorus state based system limits P fertilizing very heavily if there is more than 12 – 22 P mg / l in soil (depending on soil type). However there is one important exception to this rule: If livestock manure is the only phosphorus fertilizer applied on the field parcel, then the restrictions on phosphorus application are: if there is less than 12 - 22 mg / l P in the soil, depending on soil type and organic contents, less than 4 - 7 mg / l P, or less than 1.5 - 3, is maximum allowed P fertilization limited to 30, 32 and 40 kg / ha in perennial grass. If there is greater than 12-22 mg/l P in the soil, P fertilization is restricted to 20 kg / hectare. With other field crops, the P maximum is set to 15 kg / ha. However, if there is more than 50 mg / l (40 mg / l in clay soils) P in the soil, no P fertilization is allowed. A significant moderation in P fertilization restrictions, taken into account in the P fertilization limits above, is that only 85 % of P in livestock manure is acknowledged to apply to the limit. With fur animals manure this nutrient use efficiency is 40 %. Relieving these mitigations is one scenario to be considered in the sensitivity analysis.
3.3.2 Results on sensitivity analysis
Following scenarios are used for sensitivity analysis: A. Manure phosphorus is considered 100% soluble for field crops
B. Cereal production maximum P-application is limited to 15 kg / ha
C. Combinations on both restrictions stated above
26
The project is partly financed by the European Union - European Regional Development Fund
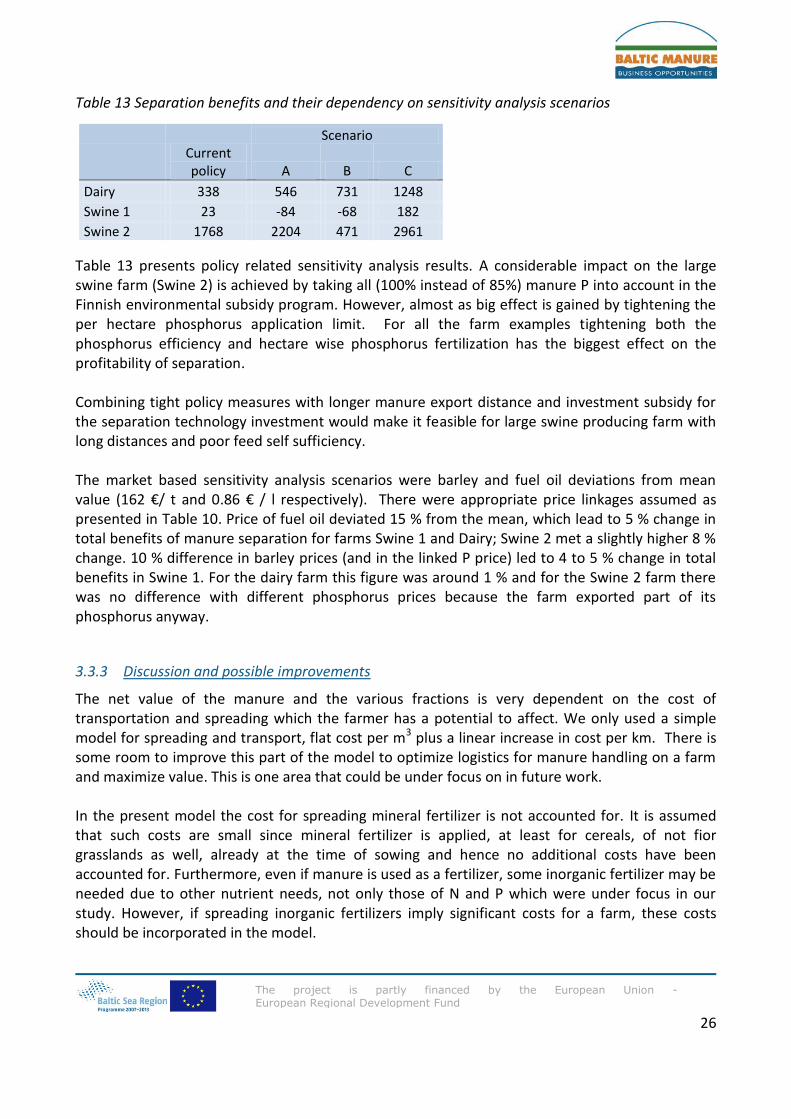
Table 13 Separation benefits and their dependency on sensitivity analysis scenarios
Scenario
Current policy A B C
Dairy 338 546 731 1248
Swine 1 23 -84 -68 182
Swine 2 1768 2204 471 2961
Table 13 presents policy related sensitivity analysis results. A considerable impact on the large swine farm (Swine 2) is achieved by taking all (100% instead of 85%) manure P into account in the Finnish environmental subsidy program. However, almost as big effect is gained by tightening the per hectare phosphorus application limit. For all the farm examples tightening both the phosphorus efficiency and hectare wise phosphorus fertilization has the biggest effect on the profitability of separation. Combining tight policy measures with longer manure export distance and investment subsidy for the separation technology investment would make it feasible for large swine producing farm with long distances and poor feed self sufficiency. The market based sensitivity analysis scenarios were barley and fuel oil deviations from mean value (162 €/ t and 0.86 € / l respectively). There were appropriate price linkages assumed as presented in Table 10. Price of fuel oil deviated 15 % from the mean, which lead to 5 % change in total benefits of manure separation for farms Swine 1 and Dairy; Swine 2 met a slightly higher 8 % change. 10 % difference in barley prices (and in the linked P price) led to 4 to 5 % change in total benefits in Swine 1. For the dairy farm this figure was around 1 % and for the Swine 2 farm there was no difference with different phosphorus prices because the farm exported part of its phosphorus anyway.
3.3.3 Discussion and possible improvements
The net value of the manure and the various fractions is very dependent on the cost of transportation and spreading which the farmer has a potential to affect. We only used a simple model for spreading and transport, flat cost per m3 plus a linear increase in cost per km. There is some room to improve this part of the model to optimize logistics for manure handling on a farm and maximize value. This is one area that could be under focus on in future work. In the present model the cost for spreading mineral fertilizer is not accounted for. It is assumed that such costs are small since mineral fertilizer is applied, at least for cereals, of not fior grasslands as well, already at the time of sowing and hence no additional costs have been accounted for. Furthermore, even if manure is used as a fertilizer, some inorganic fertilizer may be needed due to other nutrient needs, not only those of N and P which were under focus in our study. However, if spreading inorganic fertilizers imply significant costs for a farm, these costs should be incorporated in the model.
27
The project is partly financed by the European Union - European Regional Development Fund
The Swedish calculations for slurry transport costs are based on data from a Swedish contractor; however, the methods and costs assumed here may not be the most ideal method of transporting manure for this farm. Considering the very high cost of spreading and transportation, an optimization of transport and spreading options including tanker capacity, boom size, and at what distance a transport tanker with buffer tanks should be used could make a significant difference in the profitability of manure utilization on the farm. The use of an umbilical system might also be well coupled with separation since pumping of the liquid fraction will be easier and the potential for increasing spreading capacity could lower costs leading to greater manure value. Phosphorus and potassium status of all individual fields can be incorporated in the model so that the maximum fertilization limits are not exceeded. This has been done in the Finnish case study examples. However, potassium may not be considered relevant in all cases. Costs due to soil compaction can be explicitly included in the model. However special parameters are needed in evaluating the effect of soil compaction on the crop yield level. If such effects are considerable the high volumes of liquid phase manure imposes some additional costs, while the solid phase can be spread on more sensitive fields in terms of compaction risk. The Swedish calculations were based on a farm which currently has adequate manure storage capacity and land available for spreading manure. This farm, however, does not have much buffer land available for spreading manure and we assume storage capacity is also at the limit. Thus, expanding production with only 20 cows would create a need to invest in another storage structure as well as necessitate the export of manure off-farm. There is the possibility that slurry separation is an economically interesting alternative if expanding production would require either exporting manure or investing in increased storage capacity and land for spreading. The Swedish Board of Agriculture recommends spring application rates for dairy slurry not to exceed 30 tonnes per hectare, however, in this model application rates of slurry and separated fractions were increased to reach either N or P application limits stipulated by Swedish legislation. This might seem apparent from the perspective of utilizing the nutrient potential in the processed fractions, however spreading 58 m3 ha-1 might not be technically feasible even if the liquid fraction is known to infiltrate much faster than untreated slurry (Sørensen & Thomsen, 2005). It might also affect the spreading cost in ways not accounted for by this model. The Swedish calculations should be carried out for pig farms as well to investigate if this farm type has more to gain from manure separation as the Finnish calculations have suggested. The Swedish model was based on an earlier version of the Finnish model. That is why certain parameters are not included in the Swedish calculations, for instance labor costs for additional work regarding manure separation and other running cost.
28
The project is partly financed by the European Union - European Regional Development Fund
4 Conclusions
Applying the manure logistics and separation model on three Finnish farms conditions revealed us some critical points on economics of manure processing. With the assumptions used the most urging condition for the farm to consider mechanical manure separation is when a swine farm is forced to export large share of the manure produced in the farm to some other farmers fields and the distance to those fields is relatively long (in our study a 10 km distance was used). Changes in surrounding market conditions do not seem to have strong effects on the profitability of manure separation. However, changes in logistic costs of manure and/or environmental regulations on manure (and overall nutrient) use have a substantial effect on benefits of manure separation on farms. The selected technology option has impacts on the profitability of manure separation. In the investment calculations the mobile, relatively expensive separator couldn’t match with the profitability of stationary separator, when it was assumed that installing latter one made it possible to save some slurry storage space. Nevertheless, this kind of decision is possible only in case of more extensive investment situation. Investment in manure separator for cattle manure is not as tempting as with the swine manure. While the logistic benefits are similar to the swine case, there is a problem with allocation of potassium to desired field parcels. Parcels fertilized with liquid fraction get an overdose of potassium and parcels fertilized with solid fraction need some additional potassium. This leads to increasing fertilizer cost for cattle farms that separate their slurries. Also, it should be noted that farm needs to be of sufficient size in order to be able to produce adequate total benefits for the separator investment. Our example swine farm 2 with 6000 m3 of slurry seems to be of sufficient size. In the case of a dairy farm with 4000 m3 of slurry annually the manure separation is unprofitable, as well as a swine farm with 1000 m3 slurry annually. On the basis of the Swedish farm case study calculations it can be concluded that manure separation was not economical feasible for this dairy farm under the assumed conditions. However, no two farms are alike and manure separation may be profitable for a dairy farm under certain conditions: 1) if field distance is very far from the farm center, 2) if expanding production requires investing in new storage structures and either exporting manure or acquiring new land for spreading manure, 3) if alternative uses for the solid fraction could be found providing potential income, and 4) if P application on fields with high P content is further restricted beyond the current annual limit of 22 kg P/ha. Separation technologies that can effectively separate phosphorus into the solid fraction at a reasonable cost are needed. There is also a need for data concerning the separation efficiency of potassium since it was seen that this had a great effect on manure value and cost of extra mineral fertilization. We assumed that K is separated with similar efficiency as P; however, we could not find sufficiently many earlier studies or much data to either confirm or refute this assumption.
29
The project is partly financed by the European Union - European Regional Development Fund
If the use of manure phosphorous as a fertilizer will be extensively restricted by specific policies in a number of EU countries, there will be an increasing need for profitability calculations similar to the ones presented above. As shown, while current and recently observed prices of nutrients do not lead to clearly profitable manure separation investments and activities, changes in environmental regulations on manure and all nutrient use is likely to change the benefits of manure separation on farms. According to our experience in this project it seems that there is an obvious need for manure processing profitability calculations on large livestock farms, especially pig farms, which are paying high prices for various services related to manure logistics. Even though the manure processing investments are not likely to be profitable at dairy farms in the near future, rapidly increasing farm size in most competitive dairy regions in Europe due to milk quota abolition may change this situation in some individual farms and regions. More attempts are likely to be needed in constructing similar kinds of models as reported in this study, where a number of parameters can be changed, either to be used in farms directly or by extension professionals. It is indeed a relevant question for livestock farmers if manure processing investments and activities could become more profitable after changes in the key parameters, including changes in farm operations, prices of nutrients, legislation and agri-environmental schemes.
5 Recommendations
The following requirements for economic sustainability with manure separation technology in Finland have been found:
Restrictions on P –application on fields imply costs for farmers which could be avoided by manure separation
Positive P-balance on whole farm level
Long manure transportation distances (= sparse field plot structure)
Large swine farms, that import a significant share of the feed used in livestock production are most likely to invest in separation technology; even with short distance to fields.
- Medium, if not high, P separation efficiency is needed at swine farms
- Also there must be enough slurry to be treated (the smaller swine farm didn’t make the investment profitable in any of the cases). (~< 3000 m3)
For dairy farm, long manure transportation distances are required in order to make the separator investment plausible.
Potassium distribution within dairy farms fields causes problems in: - Too high potassium fertilization level on nearby fields, - Potassium fertilisation needed on far away fields.
For Sweden, the following recommendations could be set:
30
The project is partly financed by the European Union - European Regional Development Fund
Manure separation is not likely to be economically feasible on the majority of Swedish dairy farms
Large farms with poor field plot distribution and excessive distances to fields might be able to profit from separation, or if alternative uses for the solid fraction can be found.
Separation systems might be a viable investment for expanding dairy farms needing additional storage structures and land available for spreading manure.
Alternative uses which can bring an income from the solid fraction might make separation more economically feasible.
31
The project is partly financed by the European Union - European Regional Development Fund
6 References
Aakkula, J., Manninen, T. & Nurro, M. (Eds.), 2010. Maatalouden ympäristötuen vaikuttavuuden seuranta tutkimus (MYTVAS 3) – Väliraportti, Helsinki 2010 Maa- ja metsätalousministeriön julkaisuja, http://www.mmm.fi/attachments/mmm/julkaisut/julkaisusarja/newfolder/5pe9soaAU/Mytvas_netti.pdf
Albertsson, B. 2012. Riktlinjer för gödsling och kalkning 2013. Jordbruksinformation 2012:12, Jordbruksverket.
Biocover, 2011, http://en.biocover.dk/images/files/pdf/syren%20brochurer%20uk%20-%20version%20juli%202011.pdf referenced 12.2.2013
Brealey, Myers & Allen 2006. Corporate finance 8th edition. McGraw-Hill, USA 2006. Burton, C.H., 2007. The potential contribution of separation technologies to the management of
livestock manure Fleming, R. & MacAlpine, M. 2003, Evaluation of Mechanical Liquid/Solid Manure Separators,
available at: http://www.ridgetownc.uoguelph.ca/research/documents/fleming_Separatortesting.pdf
Hjorth, M. 2009. FLOCCULATION AND SOLID-LIQUID SEPARATION OF ANIMAL SLURRY; FUNDAMENTALS, CONTROL AND APPLICATION. PhD Thesis, University of Southern Denmark. http://www.inbiom.dk/download/viden_teknologi/flocculation_afhandling.pdf
Lehtinen, S. 2011, Lietelannan separointikokeilu TEHO-tiloilla, in Lillunen, A. & Yli-Renko (eds.), M. 2011. Fosforin kerrostuminen, Lietteenlevitys sokerijuurikkaalle, Lannan levityskokeilut, Separointi, Typen poisto. TEHO-hankkeen raportteja 6 / 2011 http://www.ymparisto.fi/download.asp?contentid=128027&lan=fi Luostarinen, S., Logrén, J,, Grönroos, J., Lehtonen, H, Paavola, T., Rankinen, K. Rintala, J., Salo, T. , Ylivainio, K., Järvenpää, M. (editors). 2011, Lannan kestävä hyödyntäminen. MTT Raportti 21. In Finnish
Nitrates Directive http://eur-lex.europa.eu/LexUriServ/LexUriServ.do?uri=CELEX:31991L0676:EN:NOT
Palva, R. 2011, Konetyön kustannukset ja tilastolliset urakointihinnat. TTS:n tiedote, Maataloustyö ja tuottavuus 4/2011 no 631. In Finnish.
Sindhöj, E. & Rodhe L. (Eds), 2013. Manure handling techniques on case-study farms in Baltic Sea Region. Knowledge report, WP3 Innovative technologies for manure handling, Baltic Forum for Innovative Technologies for Sustainable Manure Management (Baltic Manure; www.balticmanure.eu).
Sørensen, P., I.K. Thomsen. 2005. Separation of pig slurry and plant utilization and loss of nitrogen-15-labeled slurry nitrogen. Soil Sci. Soc. Am. J. 69:1644-1651.
www.balticmanure.eu
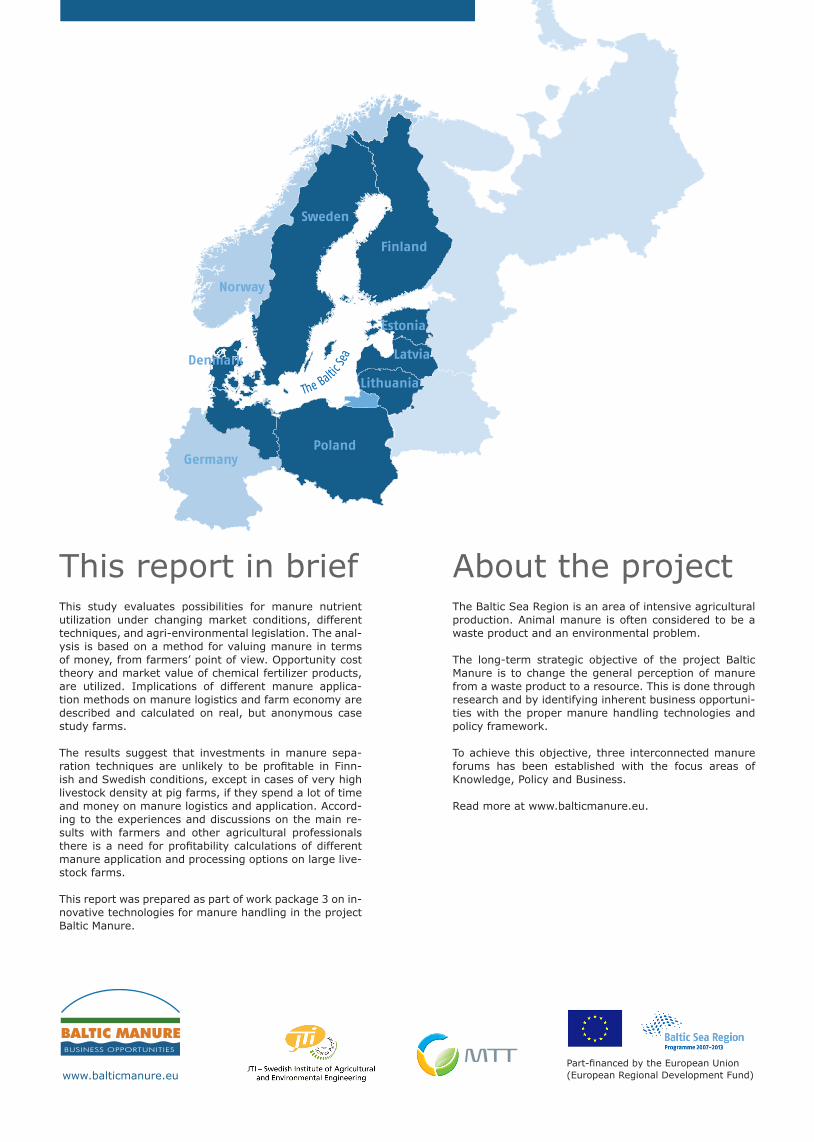
The Baltic Sea Region is an area of intensive agricultural production. Animal manure is often considered to be a waste product and an environmental problem.
The long-term strategic objective of the project Baltic Manure is to change the general perception of manure from a waste product to a resource. This is done through research and by identifying inherent business opportuni-ties with the proper manure handling technologies and policy framework.
To achieve this objective, three interconnected manure forums has been established with the focus areas of Knowledge, Policy and Business.
Read more at www.balticmanure.eu.
About the project
Part-financed by the European Union(European Regional Development Fund)
This study evaluates possibilities for manure nutrient utilization under changing market conditions, different techniques, and agri-environmental legislation. The anal-ysis is based on a method for valuing manure in terms of money, from farmers’ point of view. Opportunity cost theory and market value of chemical fertilizer products, are utilized. Implications of different manure applica-tion methods on manure logistics and farm economy are described and calculated on real, but anonymous case study farms.
The results suggest that investments in manure sepa-ration techniques are unlikely to be profitable in Finn-ish and Swedish conditions, except in cases of very high livestock density at pig farms, if they spend a lot of time and money on manure logistics and application. Accord-ing to the experiences and discussions on the main re-sults with farmers and other agricultural professionals there is a need for profitability calculations of different manure application and processing options on large live-stock farms.
This report was prepared as part of work package 3 on in-novative technologies for manure handling in the project Baltic Manure.
This report in brief