economics of climate change in trinidad and tobago_webnew
TRANSCRIPT

UNDERSTANDING THE ECONOMICS OF
CLIMATEIN TRINIDAD AND TOBAGOADAPTATION

Study coordinator: Gerard Alleng, Inter-American Development BankFor more information please contact: Gerard Alleng | [email protected] Sara Valero | [email protected]

IDB PROJECT #: TT-T1033
UNDERSTANDING THE ECONOMICS OF
CLIMATEIN TRINIDAD AND TOBAGOADAPTATION
INTER-AMERICAN DEVELOPMENT BANK
EXECUTIVE SUMMARY


In terms of climate hazards, Trinidad and Tobago will, presumably, undergo higher tropical storm (TS) frequency and the effects derived from them: coastal flooding, wind and rainfall. Additionally the island will likely experience sea level rise and more frequent and intense droughts. The table on the next page shows a summary of the potential effects of climate change in Trinidad and Tobago.
In this report, the potential hazards due to climate change are presented, the economic effects of climate change in Trinidad and Tobago are calculated, the actions to mitigate the losses caused by climate change are proposed, and their economic costs and benefits are analyzed. Please note that all monetary values presented in this report are in current US Dollars.

Sector Impact
Agriculture• Warmer weather from high temperature will cause soil aridity, lead to prolifer-
ation of pests and diseases, and put pressure on water resources for water for irrigation purposes.
• Sea level rise will cause inundation and soil desalination.
• The combined impact is low agricultural yields and decrease in food production.
Human Health
• Higher temperature will increase spread of vector diseases.
• Decrease in rainfall will affect potable water supply.
• Sea level rise will cause increases in water borne diseases.
Human settlements
• Increase in frequency and intensity of storm surge will cause more flooding and disrupt or destroy coastal settlements.
• Increase in frequency and intensity of storm surge and extreme rainfall will cause damages to infrastructure from flooding and erosion.
Coastal zones
• Sea level rise will lead to increased inundation, increased erosion, loss of wet-lands, loss of ecosystems, and displacement of coastal communities.
• High temperature will result in loss of coral reefs and reduction in fish stock.
Water resources• Increase in temperature will result in increased evapotranspiration and loss of
available surface water.
• Decrease in precipitation will reduce groundwater and aquifer recharge.
• As an effect, available water resources will be reduced.
Energy sector• Infrastructure, including field installations and offshore operations, are at risk of
inundation from sea level rise, storm surges and erosion from extreme rainfall.
• Water shortages in the country may affect the needs of the industry in terms of energy generation.
• Infrastructure damages due to extreme weather events.
Potential effects of climate change by sector in Trinidad and Tobago
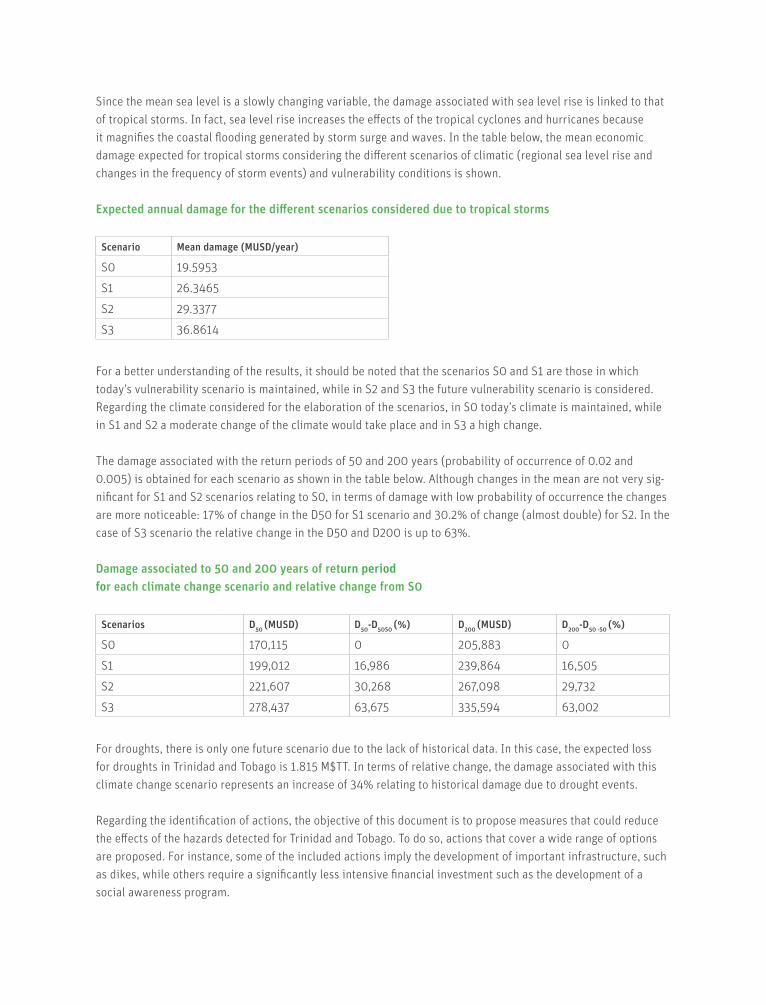
Since the mean sea level is a slowly changing variable, the damage associated with sea level rise is linked to that of tropical storms. In fact, sea level rise increases the effects of the tropical cyclones and hurricanes because it magnifies the coastal flooding generated by storm surge and waves. In the table below, the mean economic damage expected for tropical storms considering the different scenarios of climatic (regional sea level rise and changes in the frequency of storm events) and vulnerability conditions is shown.
Expected annual damage for the different scenarios considered due to tropical storms
Scenario Mean damage (MUSD/year)
S0 19.5953
S1 26.3465
S2 29.3377
S3 36.8614
For a better understanding of the results, it should be noted that the scenarios S0 and S1 are those in which today’s vulnerability scenario is maintained, while in S2 and S3 the future vulnerability scenario is considered. Regarding the climate considered for the elaboration of the scenarios, in S0 today’s climate is maintained, while in S1 and S2 a moderate change of the climate would take place and in S3 a high change.
The damage associated with the return periods of 50 and 200 years (probability of occurrence of 0.02 and 0.005) is obtained for each scenario as shown in the table below. Although changes in the mean are not very sig-nificant for S1 and S2 scenarios relating to S0, in terms of damage with low probability of occurrence the changes are more noticeable: 17% of change in the D50 for S1 scenario and 30.2% of change (almost double) for S2. In the case of S3 scenario the relative change in the D50 and D200 is up to 63%.
Damage associated to 50 and 200 years of return period for each climate change scenario and relative change from S0
Scenarios D50 (MUSD) D50-D50S0 (%) D200 (MUSD) D200-D50 -S0 (%)
S0 170,115 0 205,883 0
S1 199,012 16,986 239,864 16,505
S2 221,607 30,268 267,098 29,732
S3 278,437 63,675 335,594 63,002
For droughts, there is only one future scenario due to the lack of historical data. In this case, the expected loss for droughts in Trinidad and Tobago is 1.815 M$TT. In terms of relative change, the damage associated with this climate change scenario represents an increase of 34% relating to historical damage due to drought events.
Regarding the identification of actions, the objective of this document is to propose measures that could reduce the effects of the hazards detected for Trinidad and Tobago. To do so, actions that cover a wide range of options are proposed. For instance, some of the included actions imply the development of important infrastructure, such as dikes, while others require a significantly less intensive financial investment such as the development of a social awareness program.

The process of the identification of actions consisted of several steps. As a first step, an analysis of the possible actions which could be developed in the country was carried out. To do so, a tailor-made prioritization method-ology was designed, with which different possible adaptation actions were assessed and selected for the country level.
To do so, for the sectors included in the scope of the project - agriculture, industry, human health, human set-tlements and water resources - the direct and indirect consequences of the derived hazards that Trinidad and Tobago will face due to climate change were analysed.
After analyzing the direct and indirect consequences for every sector, the identification of the priorities of the country in adaptation terms was carried out. From those direct and indirect consequences, the priorities in terms of climate change adaptation for Trinidad and Tobago were defined as:
The next step in the prioritization methodology was the analysis of the actions, which was carried out consider-ing different approaches. On the one hand, the results of the country priorities were considered by determining which priorities every action would respond to. Additionally, for every action, an evaluation of specific parame-ters which would likely act as barriers to implementation was carried out. These parameters included: economic requirements, legal capacity, institutional capacity, technological capacity and social capacity.
Since not all the parameters have the same relevance regarding an action´s implementation, the proposed measures were classified by their importance and the action´s compliance level for the different parameters. A weighted mark was given based on the economic evaluation and the different capacities.
In the next table, a summary of the results is shown. As can be seen in the table, all the not selected actions have a lower mark than 22, which was considered the threshold which guaranteed the implementation of the action, except for the desalination technology. This measure was not included due to the fact that there is already a plant of this type in Trinidad, it is very costly, and it is environmentally less sustainable than other options.
Prevent flooding in:Human settlementsIndustryAgricultural land
Reduce the damage caused by extreme events (tropical storms, hurricanes, droughts, heat waves), in:Human settlementsIndustryAgriculture
Prevent the erosion of:Coastal landAgricultural land
Guarantee water supply to:Human settlementsAgricultureIndustry

Summary of the action prioritization
Action Weighted score Selected
National Building Code 29 Yes
Construction of dikes in coastal areas 23 Yes
Meteorological Alert System connected to the Monitoring System 30 Yes
Emergency Protocols 29 Yes
Social Awareness Program 33 Yes
Institutional Training Program 33 Yes
Rainwater harvesting 27 Yes
Infrastructure and Building Reinforcement 22 Yes
Retention ponds 33 Yes
Filter Strips 32 Yes
Permeable pavements 23 Yes
Beach nourishment 26 Yes
Mangrove Restoration 30 Yes
Parametric Insurance Scheme 30 Yes
Agriculture & Climate Change Research Unit 31 Yes
Green Roofs 26 Yes
Climate Change Adaptation Tool 26 Yes
Sustainable Drainage Systems 29 Yes
Coral Reef Protection and Restoration 33 Yes
Resettlement of population 15 No
Elevation of infrastructure 18 No
Pumping systems 20 No
Cover crops 21 No
Desalination technology 24 No
In order to diversify the options and maximize the applicability of the actions, a specific focus has been set on the type of investment required. Measure for which the funding would be provided by institutions, but also some measured based on a combined financial scheme or solely funded by the private sector were included in this study.
Furthermore, since the effects of climate change and, particularly, the hazards observed for Trinidad and Tobago affect different sectors, the actions identified are designed to deal with this factor, as stated in the prioritization stage. When possible, actions were designed in order to obtain a widespread impact.
In the next table, the complete list of the identified adaptation actions for Trinidad and Tobago is included along with the affected sectors and the type of investment required for every action.

Identified adaptation actions for Trinidad and Tobago
Action code
Title Type of measure Type of investment
Sector
TTA 1 National Building Code Technological/procedural optimisation responses
Public
TTA 2 Coastal Zone Protection in Trinidad
Infrastructure and asset-based responses Public
TTA 3 Meteorological alert and Monitoring Systems Connected
Systemic/behavioural responses Public
TTA 4 Emergency Protocols Systemic/behavioural responses Public
TTA 5 Social Awareness Program Systemic/behavioural responses Public
TTA 6 Institutional Training Program Systemic/behavioural responses Public
TTA 7 Rainwater harvesting Technological/procedural optimisation responses
Private
TTA 8 Infrastructure and Building Reinforcement
Infrastructure and asset-based responses Private
TTA 9 Retention ponds Infrastructure and asset-based responses Public and private
TTA 10 Filter Strips Infrastructure and asset-based responses Public and private
TTA 11 Permeable pavements Infrastructure and asset-based responses Public
TTA 12 Beach Restoration and Protection in Tobago
Infrastructure and asset-based responses Public
TTA 13 Mangrove Restoration in Trinidad Infrastructure and asset-based responses Public
TTA 14 Parametric Insurance Scheme Risk transfer via insurance and alternative financial solutions
Public and private
TTA 15 Agriculture & Climate Change Research Unit
Technological/procedural optimisation responses
Public
TTA 16 Green Roofs Infrastructure and asset-based responses Public and private
TTA 17 Climate Change Culture Survey for the General Public
Systemic/behavioural responses Public
TTA 18 Mangrove Restoration in Tobago Infrastructure and asset-based responses Public and private
TTA 19 Coral Reef Protection and Restoration in Tobago
Systemic/behavioural responses Public

For this report, the economic costs and benefits of each measure were identified, calculated and analyzed in order to understand the economic viability of each action.
Economic costs were calculated by estimating the costs of implementing each measure, including construction costs, labour costs, material costs, and maintenance costs. Economic benefits were calculated by taking the probabilities of natural hazards occurring with the projections of moderate climate change, the expected damag-es from these natural hazards, and the impact that these measures would have in mitigating damages. In most cases, several benefits were able to be identified and calculated for each measure. However, in some cases, given the lack of environmental and social information specific to Trinidad and Tobago, and given the nature of certain benefits, some benefits to society were not able to be calculated. It should be expected that, in these cases, the total benefits to society will be larger than the benefits calculated in this study, given that not all benefits were able to be monetized for this analysis.
Several economic and multi-criteria tools were used in order to analyse the feasibility of the measures including Net Present Value, Payback Period, Benefit/Cost Ratio, “No Regret” analysis, and a Multi-Criteria Analysis. The first four tools fall into the category of cost-benefit analysis in which environmental and social costs and benefits are all given monetary values in order to understand their feasibility and compare each measure against each other. In the last tool, Multi-Criteria Analysis, each societal good is looked at independently, and not given a monetarial value. Although complex and subjective, it invites other issues related to the measures to be looked at and compared.
The table on the next page shows a summary of the economic analysis done for this study. It includes the total costs and benefits calculated for the measure, the net present value of the project´s cash flows, the estimated payback period of each measure, and the measure’s Benefit-Cost Ratio.

Results of the Cost-Benefit Analysis of the actions
Action code
Title Sector Total cost Total benefit Net present value
Pay back (years)
Benefit- Cost Ratio
TTA 1 National Building Code
$4,529,327 $72,151,025 $43,923,883 1.9 15.9
TTA 2 Dike Construction in Trinidad
$115,554,303 $4,033,247 -$79,223,470 61.6 0.0
TTA 3 Meteorological Alert System Connected to the Monitoring System
$41,000 $3,935,834 $2,830,906 0.1 96.0
TTA 5 Social Awareness Program
$198,787 $98,240 -$83,151 ∞ 0.5
TTA 4 Emergency Protocols $1,659,793 $3,545,712 $1,344,701 0.9 2.1
TTA 6 Institutional Training Program
TTA 7 Rainwater Harvesting $1,714,977 $1,180,476 -$500,418 24.9 0.7
TTA 8 Infrastructure and Building Reinforce-ment
$61,820,734 $27,911,274 -$27,646,239 35.4 0.5
TTA 9 Retention Ponds $279,616 $47,027 -$187,075 ∞ 0.2
TTA 10 Filter Strips $487,080 $356,132 -$121,338 24.9 0.7
TTA 11 Permeable Pavements
$375,536,762 $38,897,785 -$252,122,202 ∞ 0.1
TTA 12 Beach Nourishment in Tobago
$23,688,332 $20,736,386 -$5,522,748 19.4 0.9
TTA 13 Mangrove Restoration in Trinidad
$744,188 $71,348,613 $43,881,303 4.4 95.9
TTA 14 Parametric Insurance Scheme
$62,850 N/A N/A N/A N/A
TTA 15 Agriculture & Climate Change Research Unit
$4,455,439 $986,772 -$2,661,472 ∞ 0.2
TTA 16 Green Roofs $1,055,220 $1,786,554 $276,093 9.9 1.7
TTA 17 Climate Change Survey for the General Public
$24,794 N/A N/A N/A N/A
TTA 18 Mangrove Restoration in Tobago
$35,325 $5,193,043 $3,402,443 4.2 147.0
TTA 19 Coral Reef Protection and Restoration in Tobago
$624,672 $523,245 -$89,772 ∞ 0.8

Please note: The total costs and total benefits for TTA 4 and TTA 6 were calculated together. Also, TTA 14 does not have any measure-
able economic benefits, as it is considered that insurance programmes do not modify the overall damage caused by the extreme events.
They are useful from a cost-efficiency perspective but not from a cost-benefit approach, because the economic damage is the same even
if insurance programmes are not developed. The only difference is the way in which that economic damage is covered. Therefore, from
a societal cost perspective the cost-benefit analysis does not change. However, of course, from a private cost perspective it does make
a difference. TTA 17 also does not have any economic benefits that can be calculated; the survey will provide information to both policy
makers and practitioners, yet without knowing the results of the survey, it is impossible to determine the impact of this information in
economic terms.
The graph on the next page shows the total costs and total benefits of each measure as a percentage of total GDP in Trinidad and Tobago:

Total Costs and Total benefits as a Percentage of GDPPlease Note: This graph is in Logarithmic Scale.
Action code
Title Sector
TTA 1 National Building Code
TTA 2 Dike Construction in Trinidad
TTA 3 Meteorological Alert System Connected to the Monitoring System
TTA 5 Social Awareness Program
TTA 4 Emergency Protocols
TTA 6 Institutional Training Program
TTA 7 Rainwater Harvesting
TTA 8 Infrastructure and Building Reinforcement
TTA 9 Retention Ponds
TTA 10 Filter Strips
TTA 11 Permeable Pavements
TTA 12 Beach Nourishment in Tobago
TTA 13 Mangrove Restoration in Trinidad
TTA 14 Parametric Insurance Scheme
TTA 15 Agriculture & Climate Change Research Unit
TTA 16 Green Roofs
TTA 17 Climate Change Survey for the General Public
TTA 18 Mangrove Restoration in Tobago
TTA 19 Coral Reef Protection and Restoration in Tobago
Total Cost as a % of GDP Total Benefit as a % of GDP
0.0001% 0.0010% 0.0100% 0.1000% 1.0000%

As can be seen by these measures, with the exception of permeable pavements (TTA 11) and Dike Construction in Trinidad (TTA 2) all of the measures have a total cost (not discounted) that is less than 0.3% of the GDP of Trini-dad and Tobago in 2012. In terms of total benefit (not discounted), Mangrove Restoration in Trinidad (TTA 13) and National Building Code (TTA 1) have total benefits of about 0.3% of GDP. The average total cost as a percentage of GDP is 0.137% and the average total benefit as a percentage of GDP is 0.59%.
When organized by sector, the measures for Coastal Zones and the measures for Human Settlements have rela-tively high benefits. Coastal Zone measures average a benefit equivalent to 0.426% of GDP and Human Settle-ments measures average a benefit equivalent to 0.618% of GDP. That being said, these two groups of measures also have the largest costs. Coastal Zone measures average cost is equivalent to 0.586% of GDP and Human Settlements measures average cost is equivalent to 1.854% of GDP. The next groups of measures with the highest benefits are the agriculture (with an average benefit of 0.006% of GDP) and water resources (with an average to-tal benefit of 0.005% of GDP). However, in terms of cost; the measures for water resources have an average cost equivalent to 0.008% of GDP, while the average costs of measures for agriculture is higher, at 0.021% of GDP. Lastly, the measure for the Human Health sector has both the smallest cost (0.001% of GDP) and smallest benefit (0.004% of GDP).
The table on the following page shows the results for each measure in terms of “No Regret”. “No regret” strategies are those in which the project can be justified in economic terms, even without climate change, however its bene-fits increase even more with climate change. For the analysis, four categories were developed:
High Impact and “No Regret”: Actions that have no regret, and also have a high impact in reducing damages due to natural hazards.
Low Impact and “No Regret”: Actions that have no regret, and offer a lower impact in terms of reducing damages.
Low Regret: Actions that are not necessarily “No Regret” yet will produce significant benefits in the event of a natural hazard.
Potential High Regret: Actions that are not “No Regret” yet produce lower levels of benefits in the event of a natural hazard.

“No Regret” Analysis Please note: this graph is showing the present value of the total benefits and total costs. It is also in logarithmic scale.
Potential High Regret
Low Impact No Regret
High Impact No Regret
From this analysis, the results show that:
The National Building Code (TTA 1) and Mangrove Restoration in Trinidad (TTA 13) fall into the category of High Impact and “No Regret”
Meteorological alert system connected to the Monitoring System (TTA 3); Emergency Protocols (TTA 4) and Institutional Training Program (TTA 6); Green Roofs (TTA 16); and Mangrove Restoration in Tobago (TTA 18) all fall into the category of Low Impact and “No Regret”
Infrastructure & Building Reinforcement (TTA 8); Permeable Pavements (TTA 11); and Beach Nourishment in Tobago (TTA 12) fall into the category of Low Regret
Dike Construction in Trinidad (TTA 2); Social Awareness Program (TTA 5); Rainwater Harvesting (TTA 7); Re-tention Ponds (TTA 9); Filter Strips (TTA 10); Agriculture & Climate Change Research Unit (TTA 15) and Coral Reef Protection and Restoration in Tobago (TTA 19) fall into the category of Potential High Regret.
TTA 13 TTA 1
TTA 12TTA 8
TTA 11
TTA 2
TTA 15TTA 7
TTA 19TTA 10
TTA 5
TTA 9
TTA 4 & 6
TTA 16
TTA 3
TTA 18
Average total benefit
Benefits
Costs

Lastly, a multi-criteria analysis was made in order to weigh the economic information against additional criteria necessary for decision-making. These criteria included:
Importance: The importance that the measure has in regarding the ability to decrease the impacts of climate change.
Urgency: The urgency with which the measure should be implemented in order to gain the maximum benefits from its implementation.
No Regret: The level of “No Regret” this measure has. “No regret” strategies are those in which the project can be justified in economic terms, even without climate change, however its benefits increase even more with climate change.
Secondary Effects: The level to which this measure would bring additional positive secondary effects to society.
Mitigation Effects: The level to which, in addition to improving the adaptability of the country to Climate Change, the implementation of the measure also would help mitigate climate change by reducing emissions.
These scores have then been given a weighted score, with Importance having more weight (5) over Urgency (4), No-Regret (3), Secondary Effects (2), and Mitigation Effects (1). Therefore, in the following graphs, those measures with the largest bar are not necessarily those with the highest priority. For example, although Mangrove Resto-ration in Trinidad has a very high ranking in all aspects, it is not the highest in terms of priority since its weighted score was not the highest.
The measures are ordered within the following table and graph based on their score in Importance, then Urgency, then No-Regret, then Secondary Effects, and Lastly Mitigation Effects.

Multi-criteria analysis of the actions
Measure Priority
Nº Measure Weighted
1 TTA 1 National Building Code 5 5 5 3 3 69
2 TTA 6 Institutional Training Program 5 5 5 3 2 68
3 TTA 8 Infrastructure and Building Reinforcement 5 5 4 4 3 68
4 TTA 4 Emergency Protocols 5 4 3 2 1 55
5 TTA 3 Meteorological Alert & Monitoring Systems Linked 5 4 3 1 1 53
6 TTA 17 Climate Change Survey for the General Public 5 4 2 2 1 52
7 TTA 13 Mangrove Restoration in Trinidad 4 5 5 5 4 69
8 TTA 18 Mangrove Restoration in Tobago 4 5 5 5 4 69
9 TTA 19 Coral Reef Protection and Restoration in Tobago 4 5 5 5 2 67
10 TTA 5 Social Awareness Program 4 5 5 3 2 63
11 TTA 12 Beach Nourishment in Tobago 4 4 5 4 1 60
12 TTA 14 Parametric Insurance Scheme 4 4 5 1 1 54
13 TTA 7 Rainwater Harvesting 4 3 5 3 2 55
14 TTA 2 Dike Construction in Trinidad 4 3 3 4 1 50
15 TTA 15 Agriculture & Climate Change Research Unit 4 3 1 3 2 43
16 TTA 9 Retention Ponds 3 4 5 4 2 56
17 TTA 10 Filter Strips 2 4 5 4 1 50
18 TTA 11 Permeable Pavements 2 3 4 3 2 42
19 TTA 16 Green Roofs 2 2 4 4 3 41
Based on the Multi-criteria analysis, National Building Code (TTA 1), Institutional Training Program (TTA 6), Infrastructure & Building Reinforcement (TTA 8), Emergency Protocols (TTA 4), and Meteorological alert system connected to the Monitoring System (TTA 3) came in as the top 5 in terms of priority measure to implement.
In conclusion, after looking at all of the different facets of each measure and analyzing cost/benefit results mentioned in this study, the measures that are the most favourable and feasible for Trinidad and Tobago are the implementation of a National Building Code (TTA 1), Meteorological Alert System connected to the Monitoring System (TTA 3), Emergency Protocols (TTA 4), and Institutional Training Program (TTA 6), given that they were ranked the highest priority and they are all considered “No Regret” Measures. Additionally, Infrastructure & Building Reinforcement (TTA 8) is recommended due to its high ranking in the multicriteria analysis and that it is considered Low Impact and Low Regret. Given the large benefits associated with mangroves, Mangrove Resto-ration in Trinidad (TTA 13) and Tobago (TTA 18) are also highly recommended for implementation. The Parametric Insurance Scheme (TTA 14) is also highly recommended, although it is not considered “No Regret”, is as it will help reduce the financial risks felt by the Government, private companies and individuals in situations of Natural Hazard. Also, given the strong percentage of tourism related to the economic well-being of Tobago, it would be interesting to look into Beach Nourishment (TTA 12) and Coral Reek Protection and Restoration (TTA 19) as a possible ways to maintain the long term growth of tourism on the island.

Multi-criteria analysis of the actions
Nº Measure
TTA 1 National Building Code
TTA 6 Institutional Training Program
TTA 8 Infrastructure and Building Reinforcement
TTA 4 Emergency Protocols
TTA 3 Meteorological Alert & Monitoring Systems Linked
TTA 17 Climate Change Survey for the General Public
TTA 13 Mangrove Restoration in Trinidad
TTA 18 Mangrove Restoration in Tobago
TTA 19 Coral Reef Protection and Restoration in Tobago
TTA 5 Social Awareness Program
TTA 12 Beach Nourishment in Tobago
TTA 14 Parametric Insurance Scheme
TTA 7 Rainwater Harvesting
TTA 2 Dike Construction in Trinidad
TTA 15 Agriculture & Climate Change Research Unit
TTA 9 Retention Ponds
TTA 10 Filter Strips
TTA 11 Permeable Pavements
TTA 16 Green Roofs
It is important to note that while all of these measures are analyzed as individual measures, many of these measures would have increased impacts if they were implemented in conjunction with other proposed measures. As an example, many of the measures regarding coastal management, including the construction of dikes (TTA 2), the restoration of mangroves (TTA 13 and TTA 18) and the protection of coral reefs (TTA 19), will have improved results if jointly implemented. The same can be said for the social awareness campaign (TTA 5), emergency protocols (TTA 4), institutional training program (TTA 6), and meteorological alert system connected to the monitoring system (TTA 3). All of the measures detailed in this report should therefore be looked at holistically and strategically when deciding which activities to implement, ensuring that possible mutual and re-enforcing benefits are captured.
Additionally, these recommendations have been made based on the information currently available. In many cas-es, secondary sources were used in order to determine the costs and benefits for these measures, given the lack of primary source information. It is recommended that before any of these measures are undertaken, a detailed analysis of their feasibility and impacts be done in order to decide whether or not to implement the measure.

Case
ThePilot

For this analysis, the pilot case study has been focused on the Petroleum Corporation of Trinidad and Tobago (Petrotrin). This case study was chosen given the importance of the petroleum sector in the country’s economy, and Petrotrin’s importance within the sector. The Petroleum Industries sector accounts for over 43% of the GDP of Trinidad and Tobago in 2012, based on the GDP statistics provided by the Central Statistics Office (CSO) of Trinidad and Tobago. Petrotrin was incorporated in 1993 to consolidate the interests of the Trinidad and Tobago Oil Company (Trintoc) and the Trinidad and Tobago Petroleum Company (Trintopec), but its roots can be traced to the first years of the 20th century. They play a leading role in the development of the ener-gy sector in Trinidad and Tobago, being the nation’s largest crude oil producer.

This in terms of production is expressed by the full capacity of the refinery, of up to 168,000 barrels per day and average of approximately 127,650 barrels per day. A map showing the extent of Petrotrin’s operations in the country is shown in the figure below.
Map showing Petrotrin’s Areas of Operations Source: Petrotrin, Energy Map Feb 2013

The table below describes how each of these measures is defined along these categories.
Proposed actions for the pilot study
Action code
Title Type of measure / responses Type of investment
Sector
PT 1 Climate Change Adaptation Tool Technological/procedural optimisation
Private
PF 1 Coastal Zone and Guaracara River Protection Infrastructure and asset-based Private
PF 2 Retention Ponds in Point Fortin Infrastructure and asset-based Private
PF 3 Construction of Swales and Berms in Point Fortin
Infrastructure and asset-based Private
PF 4 Mangrove Protection in Point Fortin Infrastructure and asset-based Private
PF 5 Relocation of Infrastructure in Point Fortin Infrastructure and asset-based Private
PF 6 Infrastructure Elevation in Point Fortin Infrastructure and asset-based Private
PAP 1 Dike Construction in Pointe-à-Pierre Infrastructure and asset-based Private
PAP 2 Construction of Retention Ponds at Pointe-à-Pierre
Infrastructure and asset-based Private
PAP 3 Sustainable Drainage Systems in Pointe-à-Pierre Infrastructure and asset-based Private
PAP 4 Mangrove Restoration in Pointe-à-Pierre Infrastructure and asset-based Private
PAP 5 Relocation of Infrastructure in Pointe-à-Pierre Infrastructure and asset-based Private
PAP 6 Infrastructure Elevation in Pointe-à-Pierre Infrastructure and asset-based Private
As with the measures analysed for the country, the economic costs and benefits of each measure designed for Petrotrin have been identified, calculated and analyzed in order to understand the economic viability of each action. The next table shows a summary of the economic analysis done for this study. It includes the total costs and benefits calculated for the measure, the net present value of the project´s cash flows, the estimated payback period of each measure, and the measure’s Benefit-Cost Ratio.
It is important to note that costs and benefits were not estimated for PF 6 and PAP 6 due to the lack of informa-tion about the specific infrastructure in these areas.

Results of the Cost-Benefit Analysis of the pilot project actions
Action code
Title Total cost Total benefit Net present value
Pay back (years)
Benefit/ Cost Ratio
PT 1 Climate Change Adaptation Tool $117,500 N/A N/A N/A N/A
PF 1 Coastal Zone and Guaracara River Protection
$7,267,721 $370,635 -$3,927,621 ∞ 0.1
PF 2 Retention Ponds in Point Fortin $269,900 $145,574 -$173,446 24 0.5
PF 3 Construction of Swales and Berms in Point Fortin
$126,194 $134,871 -$52,703 15.4 1.1
PF 4 Mangrove Protection in Point Fortin $6,750 $72,391 $26,285 7.8 10.7
PF 5 Relocation of Infrastructure in Point Fortin
$2,317,739 $20,375,901 $9,987,274 0 8.8
PF 6 Infrastructure Elevation in Point Fortin N/A N/A N/A N/A N/A
PAP 1 Dike Construction in Pointe-à-Pierre $4,961,914 $1,869,243 -$2,011,884 27.8 0.38
PAP 2 Construction of Retention Ponds at Pointe-à-Pierre
$269,900 $537,769 $37,866 9.3 2.0
PAP 3 Sustainable Drainage Systems in Pointe-à-Pierre
$644,715 $669,062 -$223,766 15.6 1.04
PAP 4 Mangrove Restoration in Pointe-à-Pierre
$8,708 $93,384 $33,907 7.8 10.7
PAP 5 Relocation of Infrastructure in Pointe-à-Pierre
$6,260,578 $52,076,889 $24,548,353 0 8.3
PAP 6 Infrastructure Elevation in Pointe-à-Pierre
N/A N/A N/A N/A N/A
Relocation of infrastructure in both Point Fortin and Pointe-à-Pierre both have significantly high positive Net Present Values, given the fact that the infrastructure built will provide the company benefits during their entire use life and remove the risks of inundation. For the actions restoring mangroves in both Point Fortin (PF 4) and Pointe-à-Pierre (PAP 4), the costs of the action are much lower than the potential benefits. The actions related to improving drainage in both Point Fortin (PF 2 and PF 3) and Pointe-à-Pierre (PAP 2 and 3) have Payback Periods of less than three years, making these measures interesting for consideration in terms of reducing the risk of inundation in both locations. Lastly, the measure related to building dikes in Point Fortin (PF 1) has rather high costs relative to its benefits. This is partly due to the fact that the benefits due to Petrotrin’s use of the port area and terminalling stations were not able to be included in the study due to lack of specific information regarding the use of this port by the company. It should be mentioned that Point Fortin is considered and an important terminalling station for the company, and therefore if this benefit were able to be included, this measure’s results would likely improve.

Total Cost and Total Benefits of each measure as a percentage of Petrotrin’s Net Profit in 2012Please note, this graph is in logarithmic scale
Action code
Title
PT 1 Climate Change Adaptation Tool
PF 1 Coastal Zone and Guaracara River Protection
PF 2 Retention Ponds in Point Fortin
PF 3 Construction of Swales and Berms in Point Fortin
PF 4 Mangrove Protection in Point Fortin
PF 5 Relocation of Infrastructure in Point Fortin
PF 6 Infrastructure Elevation in Point Fortin
PAP 1 Dike Construction in Pointe-à-Pierre
PAP 2 Construction of Retention Ponds at Pointe-à-Pierre
PAP 3 Sustainable Drainage Systems in Pointe-à-Pierre
PAP 4 Mangrove Restoration in Pointe-à-Pierre
PAP 5 Relocation of Infrastructure in Pointe-à-Pierre
Total Cost as a % of Company Profit 2012 Total Benefit as a % of Company Profit 2012
The graph shows the measures’ total costs and total benefits as a percentage of the company’s net profit in 2012.
Both measures related to the relocation of infrastructure in Point Fortin (PF 5) and Pointe-à-Pierre (PAP 5) fall under the category of High Impact and “No Regret”. As mentioned previously, this is due to the fact that the infra-structure built will provide the company benefits during their entire use life and remove the risks of inundation. The measures involving mangrove restoration in Point Fortin (PF 4) and Pointe-à-Pierre (PAP 4) are considered Low Impact and “No Regret” due to their high Benefit/Cost ratio. Retention Ponds in Pointe-à-Pierre is between Potential High Regret and Low Impact and “No Regret”, as its costs are similar to its benefits. Lastly, the rest of the measures, fall under the category of Potential High Regret. The measures in Pointe-à-Pierre have slightly better results than those for Point Fortin. This is due partially to the fact that more of the benefits related to the productive value of Pointe-à-Pierre were able to be estimated and included in the analysis. However, this result also makes sense given that Pointe-à-Pierre has the country’s only oil refinery, and is of relatively higher strategic importance for Petrotrin.
Similar to the country level actions, a multi-criteria analysis was carried out as well for the actions of the pilot study. The results of this Multi-Criteria Analysis exercise are shown in the graph on the next page.
0.00% 0.01% 0.10% 1.00% 10.00%

Multi-criteria analysis of the pilot project actions The scores in each bar in order from left to right: Importance, Urgency, No-Regret, Secondary Effects, and Mitigation
Action code
Title
PT 1 Climate Change Adaptation Tool
PF 1 Coastal Zone and Guaracara River Protection
PF 2 Retention Ponds in Point Fortin
PF 3 Construction of Swales and Berms in Point Fortin
PF 4 Mangrove Protection in Point Fortin
PF 5 Relocation of Infrastructure in Point Fortin
PF 6 Infrastructure Elevation in Point Fortin
PAP 1 Dike Construction in Pointe-à-Pierre
PAP 2 Construction of Retention Ponds at Pointe-à-Pierre
PAP 3 Sustainable Drainage Systems in Pointe-à-Pierre
PAP 4 Mangrove Restoration in Pointe-à-Pierre
PAP 5 Relocation of Infrastructure in Pointe-à-Pierre
As shown in the graph, the elevation of the Port in Point Fortin is the classified as highest, by weighted score. This is due to the fact that the port and terminalling stations are strategic for Petrotrin. The actions focused on reinforcing the coastal areas in both Point Fortin and Pointe-à-Pierre are also highly classified in the Multi-Criteria Analysis. The Relocation of Infrastructure and improvement of drainage systems in Pointe-à-Pierre also have high importance and urgency due to the significance of the infrastructure in Pointe-à-Pierre to Petrotrin. The climate change action adaptation tool obtains better results than mangrove restoration, mainly due to its urgency com-pared to that of the mangrove restoration.
When the actions are classified by type, actions in both Point Fortin and Pointe-à-Pierre are both relatively equal in terms of scoring, with actions in Point Fortin having slightly higher urgency. This is due to the fact that flood-ing in Point Fortin is expected to occur before 2031, whereas flooding in Pointe-à-Pierre - although affecting more infrastructure for the company - is not projected to occur until 2051.
As a conclusion, if the results of the different assessments conducted are analysed in conjunction, it can be seen that, for different reasons, all the actions proposed might be helpful and interesting from a climate change adaptation perspective. In terms of Mangrove Restoration in both Point Fortin (PF 4) and Pointe-à-Pierre (PAP 4), the results of the multi-criteria analysis related to importance and urgency are lower, but it has a good bene-fit-cost ratio and offers many positive secondary effects. Second, the climate change adaptation tool does not offer any economic benefits itself, but it would be very useful for the company to obtain a comprehensive view of its current and future situation in terms of climate change adaptation. Furthermore, it would include all the climate change adaptation information already developed by the company and would facilitate the development of complex adaptation assessments in the different sites in which the company is located - taking into account the vulnerability of those sites and any other relevant factors. It would therefore facilitate the decision-making by including the climate change factor in the assessments of the company.
Lastly, it is important for Petrotrin to look at the remaining measures holistically, and determine its best strategy for the company, and then for both Point Fortin and Pointe-à-Pierre. As can be seen by the projections done for both areas by Singh and El Fouladi (2006 for Pointe-à-Pierre and 2007 for the Point Fortin area), both locations are at risk of inundation and land erosion due to sea level rise and storm surge in the future. Both areas are also strategically important for the company, as Point Fortin facilities deliver the region’s best strategically located terminalling services and Pointe-à-Pierre is home to the country’s only oil refinery (Petrotrin, 2013). Therefore, both areas will likely need investments made in order to adapt to the risks of climate change and ensure their productive use in the future. Petrotrin will need to look strategically at the options and decide what is best for the company. As an example, they may decide to improve the drainage systems in both locations in the short term (PF 2 and 3, PAP 2 and 3), while working to acquire the financial investments required for larger projects such as Port and Infrastructure Elevation in Point Fortin (PF 6) and Dike Construction in Pointe-à-Pierre (PAP 1).
It is important to mention that while all of these measures are analyzed as individual measures, many of these measures would have increased impacts if they were implemented in conjunction with other proposed mea-sures. As an example, all of the measures, with the exception of relocation and elevation of infrastructure, are designed to help reduce the risk of flooding and storm surge, and therefore could help improve the protection of the industrial area if jointly implemented. All of the measures detailed in this report should therefore be looked at holistically and strategically when deciding which activities to implement, ensuring that possible mutual and re-enforcing benefits are captured.
Also, these recommendations have been made based on the information currently available. In many cases, secondary sources were used in order to determine the costs and benefits for these measures, given the lack of primary source information. It is recommended that before any of these measures are undertaken, a detailed analysis of their feasibility and impacts be done in order to decide whether or not to implement the measure. Ad-ditionally, it is recommended that Petrotrin complete a multi-criteria analysis similar to the one done in this study in order to include their knowledge and experience regarding their business practices into the results.


MORE?For the full report, please visit:
www.iadb.org/climatechange
Want

Unless otherwise noted, graphics and tables source: Prepared by the authors.
Design: Cecilia Reifschneider
www.iadb.org
The opinions expressed in this publication are those of the authors and do not necessarily reflect the views of the Inter-American Development Bank, its Board of Directors, or the countries they represent.
The unauthorized commercial use of Bank documents is prohibited and may be punishable under the Bank’s policies and/or applicable laws.
Copyright © 2014 Inter-American Development Bank. All rights reserved; may be freely reproduced for any non-commercial purpose.
Cataloging-in-Publication data provided by theInter-American Development BankFelipe Herrera Library
Inter-American Development Bank.Understanding the economics of climate adaptation in Trinidad and Tobago / Inter-American Development Bank.p. cm. 1. Climatic changes—Economic aspects—Trinidad and Tobago. 2. Climate change mitigation—Trinidad and Tobago. 3. Climatic changes—Adaptation—Trinidad and Tobago. I. Inter-American Development Bank. Climate Change and Sustainability Division. II. Title. IDB-BR-135 Keywords: Climate Change, Adaptation, Mitigation, Trinidad and Tobago, MangrovesJEL Codes: Q2 , Q54, O13
Factor CO2 Kepa SolaunMark KowalZaloa AresDavid MartínAmy Blyth
IH Cantabria Iñigo LosadaRaul MedinaCristina IzaguirreJavier DiezOmar CastellanosFernando MendezPedro Díaz
University of the West IndiesJohn AgardAbdullahi Abdulkadri
The IDB thanks Factor CO2, IH Cantabria, the University of the West Indies for their contribution, and acknowledge the participation of:
Study coordinator: Gerard Alleng, Inter-American Development BankFor more information please contact: Gerard Alleng | [email protected] Sara Valero | [email protected]


INTER-AMERICAN DEVELOPMENT BANK
Follow us on Twitter @BIDcambioclima
Read posts from our climate change specialists - blogs.iadb.org/cambioclimatico