economics of climate change: global to asean &...
TRANSCRIPT

Rawshan Ara Begum* (Ph.D)
Center for Water Cycle, Marine Environment and Disaster Management (CWMD)
Kumamoto University, Japan
*Coordinating Lead Author (CLA), IPCC Sixth Assessment Report
March 20, 2019
ECONOMICS OF CLIMATE CHANGE: GLOBAL TO
ASEAN & MALAYSIAN PERSPECTIVE
Brown Bag Seminar Series, Ungku Aziz Centre For Development Studies, University
of Malaya, Kuala Lumpur, March 20, 2019
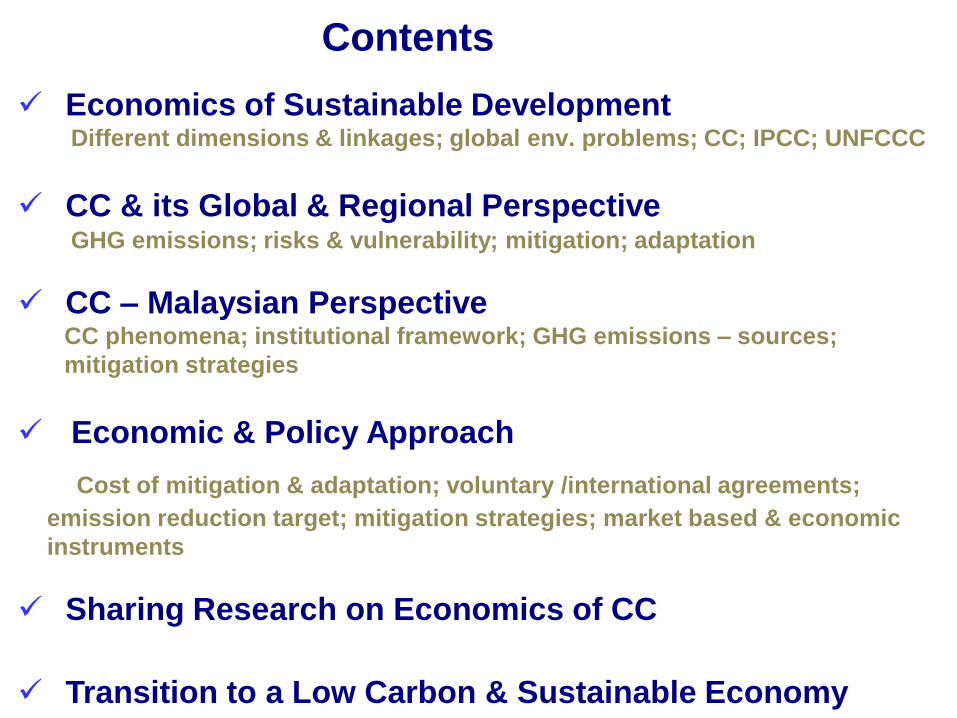
Economics of Sustainable Development Different dimensions & linkages; global env. problems; CC; IPCC; UNFCCC
CC & its Global & Regional Perspective GHG emissions; risks & vulnerability; mitigation; adaptation
CC – Malaysian Perspective CC phenomena; institutional framework; GHG emissions – sources;
mitigation strategies
Economic & Policy Approach
Cost of mitigation & adaptation; voluntary /international agreements;
emission reduction target; mitigation strategies; market based & economic
instruments
Sharing Research on Economics of CC
Transition to a Low Carbon & Sustainable Economy
Contents

Sustainable Development: Economics of SD
Economics of SD- production & use of natural resources; environmental impact assessment;
environmental valuation; policy responses; climate & disaster resilience; low carbon economy;
sustainable community; externality; market opportunities
Economicincome, equity,
employment,
resource use,
waste, pollution
Socialpopulation, household,
education, labor force,
demographic
changes, consumption
patterns; behavioral &
lifestyles
Environmentalnatural resources,
employment, sink,
livelihoods,
recreational
Institutional/
Governance –
cross
dimensional
Different dimensions of SD - synergies and trade-offs
Rawshan@2018
Concerns:
poverty & hunger; pollution; health &
food security; loss of biodiversity;
deforestation; climate change
(SDG 13); frequent natural
disasters (SDG 9 - resilient
infrastructure, SDG 11- resilient
cities & human settlements)
Challenges:
how to meet the growing
worldwide demand that
will conserve the Earth &
its resources, and
empower people to meet
the present and future
needs?

CC & its Global & ASEAN Perspective

IPCC - by the World Meteorological Organization and
the United Nations Environment Programme (UNEP)
in 1988
Issued its first assessment report in 1990 which
reflected the views of 400 scientists - stated that
global warming was real and urged that something
be done about it
Working Group I Report "The Physical Science Basis"
Working Group II Report "Impacts, Adaptation, and Vulnerability”
Working Group III Report "Mitigation of Climate Change"
Intergovernmental Panel on Climate Change (IPCC)
IPCC - does not conduct its own scientific inquiries, but reviews worldwide
research, issues regular assessment reports (now been five), and compiles
synthesis reports, special reports and technical papers
FAR – 1990; SAR – 1995; TAR – 2001; AR4- 2007; AR5 – 2013/2014

IPCC’s FAR in 1990 spurred governments to create the
UNFCCC
By standards for international agreements, negotiation of
the UNFCCC was signed by 154 nations at the 1992 United
Nations Conference on Environment and Development
known as the "Earth Summit" in Rio de Janeiro
United Nations Framework Convention on Climate Change
(UNFCCC)
UNFCCC - entered into force since 21 March 1994
- universal membership with 196 nations
Ultimate objective of the UNFCCC is to stabilize greenhouse gas (GHG)
concentrations in the atmosphere at a level that will prevent dangerous human
interference with the climate system
IPCC reports - frequently used as the basis for decisions made under the
Convention, and played a major role in the negotiations e.g. Kyoto Protocol (an
international treaty on CC)

Mitigation: CC & DRR
CC and DRR communities both use the word mitigation,
but for each, it means something different
DRR Perspective
Mitigation refers to the term given to structural and non-structural measures undertaken to limit the adverse impact of natural hazards, environmental degradation and technological hazards.
MITIGATION
CC Perspective
Mitigation refers to a human intervention to reduce the sources or enhance the sinks of greenhouse gases.

Climage Change: happening? why? what can we do?
Warming of the climate system - unequivocal; many of the observed changes -
unprecedented.
Atmosphere & ocean - warmed; amounts of snow & ice - diminished; sea level -
risen, concentrations of GHGs - increased.
IPCC AR5 WG I (2013)
Observed Surface Temperature Change: 1901 to 2012
Almost the
entire globe
experienced
surface
warming
Rawshan@2018

Total anthropogenic GHG emissions - the
highest in human history from 2000 to
2010 and reached 49 (±4.5)
GtCO2eq/year in 2010.
Despite a growing number of CC
mitigation policies, annual GHG
emissions grew on average by 1.0
GtCO2eq (2.2%) from 2000 to 2010
compared to 0.4 GtCO2eq (1.3%) from
1970 to 2000.
IPCC AR5 WG I (2013)
Climage Change: happening? why? what can we do?
Total annual anthropogenic GHG emissions by gases 1970–2010
Continued emissions of GHGs will cause further warming and changes in all
components of the climate system.
Limiting CC will require substantial and sustained reductions of GHG emissions.
More than half of the observed increase in global average surface temperature from 1951 to 2010 was
caused by the anthropogenic increase in GHG concentrations and other anthropogenic forcings
together (extremely likely).
Rawshan@2018

Source: CC 2007 Synthesis Report (IPCC)
Mitigation & Adaptation - complementary strategies for
reducing & managing the risks of CC
CC -13th
SDGs
Vulnerable
sectors
Low carbon
technologies
Rawshan@2018
Framework of Anthropogenic CC Drivers, Impacts & Responses

Global GHG Emissions
2000
Total anthropogenic GHG emissions
(GtCO2eq/ye) by economic sectors
2010
Source: IPCC AR5 WG III, 2013
GHG Emissions – Global Perspective
Rawshan@2018

GHG Emissions – ASEAN Perspective
Source: ADB, 2015
Indonesia, Malaysia, Philippines, Thailand & Vietnam
GHG Emissions in 2010
90% of GHG emissions in Southeast Asia
Emissions growth in the region - as fast as economic growth,
with nearly 5% annual increases over 1990–2010
Land-use emissions (all “agriculture” lumped here) - evident in Indonesia’s
emissions profile, where this accounts for nearly ¾ of 2010 emissions
Malaysia – 38%
ADB (2015): Southeast Asia & the Economics of Global Climate Stabilization

CO2 Emitters in 2015
Source: EDGAR database created by European Commission & Netherlands
Environmental Assessment Agency released (2015)
Selected
countries
Share of World
Total (%)
CO2 Emissions
Per Capita (t CO2)
China 29.51 7.7
United States 14.34 16.1
India 6.81 1.9
European
Union
9.62 6.9
Russia 4.88 12.3
Japan 3.47 9.9
Canada 1.54 15.5
United
Kingdom
1.11 6.2
Indonesia 1.39 2.0
Thailand 0.77 4.1
Malaysia 0.68 8.1

Risks & Vulnerability
Unfortunately, the
recipients are
mainly from
developing world!
Source: UNDP (2007): Human Development Report 2007/2008
Fighting Climate Change: Human Solidarity in a Divided World
2014 Sustaining Human Progress: Reducing Vulnerability & Building ResilienceRawshan@2018

Adaptation
Adaptation equals to
good investment!
Adaptation measures are
weak in developing
countries!
Source: UNDP (2007): Human Development Report 2007/2008
No one country can win the battle against climate change acting alone.
Collective action is not an option but an imperativeRawshan@2018

Malaysia - experiencing a warming trend for the past few decades
Malaysia - experiencing adverse effects of CC on key economic sectors; energy, industries,
transport, forestry, agriculture, water & coastal resources, public health, human settlements,
waste sector and others
Climate Change – Malaysian Perspective
Observed and Projected Climate Change (NC3, 2018)
Rawshan@2018
Surface mean
temperature
increase
around 0.13 to
0.240C per
decade

Climate Change – Malaysian Perspective
Malaysia ratified UNFCCC in July 1994; Kyoto Protocol in September
2002
National Focal Point - MINISTRY OF ENERGY, SCIENCE, TECHNOLOGY,
ENVIRONMENT AND CLIMATE CHANGE (MESTECC)
[FORMER Ministry of Natural Resources & Environment ]
Green Technology Policy 2009
National policy on Climate Change 2010
Green Technology & Climate Change Council 2011- to enable strategic
implementation of these policies and foster greater coordination in these
complementary areas.
guide the nation towards
addressing CC holistically,
ensuring climate-resilient
development, developing a low
carbon economy and promoting
green technology.
Rawshan@2018
Initial National Communication (INC) submitted to UNFCCC – Aug 2000
2nd National Communication (NC2) submitted to UNFCCC – April 2011
First Biennial Update Report (BUR1) submitted to UNFCCC - Dec 2015
Third National Communication (NC3) & BUR2 submitted to UNFCCC – September
2018

Integrating CCA & DRR
KA1‐ST1: Review and harmonise existing legislation, policies and plans to
address DRR.
KA13‐ST4: Incorporate (adaptation) measures into DRR.
KA29‐ST7: Strengthen national data repository by establishing database
inventory on natural disasters and extreme weather events.
KA1‐ST1: Review and harmonise existing legislation, policies and plans to
address DRR.
Malaysia: National Policy on Climate Change
Objectives :
1. Mainstreaming CC for strengthened competitiveness and
improved quality of life;
2. Integration of CC responses into policies, plans and
programmes; and
3. Strengthening of institutional and implementation capacity.
KA13‐ST4: Incorporate (adaptation) measures into DRR.
KA29‐ST7: Strengthen national data repository by establishing database inventory on natural disasters and extreme
weather events.
KA36‐ST8: Promote community‐based CC responses and programmes.
KA18‐ST4: Develop national climate projection models for assessing vulnerabilities and potential impacts of CC.
KA26‐ST6: Integrate CC considerations at the planning level
KA34‐ST8: Institutionalise effective & efficient communication & consultation mechanisms among all stakeholders.
KA37‐ST8: Strengthen collaborative networks and capacity of agencies at the federal, state & local government levels.
Policy Statement: Ensure climate-resilient development to fulfil National aspirations for
sustainability

Malaysia: Trends of GDP, Primary Energy Supply & Final
Energy Consumption
Source: NEB, 2015
Rawshan@2018

201120052000
Malaysia: GHG Emissions by SectorSource: INC; NC2; BUR; NC3/BUR2
Energy Sector – most GHG emissions in Malaysia
Rawshan@2018
2014

Economic & Policy Perspective

9-41 4-37 >50
86-10928-67
70-100
0
20
40
60
80
100
120
World Bank(2006)
Stern (2006) Oxfam (2007) UNDP (2007) UNFCCC(2007)
World Bank(2010)
Adaptation cost (billion US$) per year
Timeframe present present present 2015 2030 2050
If we don’t act, the overall costs and risks of CC will be equivalent to losing at
least 5% of global GDP each year, now and forever. If a wider range of risks and
impacts is taken into account, the estimates of damage could rise to 20% of GDP
or more.
In contrast, mitigation cost/costs of action – reducing GHG emissions to avoid
the worst impacts of CC can be limited to around 1% of global GDP each year.
Economics of Climate Change: Stern Review (2007)

loss of 11% of GDP by 2100, if no mitigation
actions (BAU emissions scenario)
Southeast Asia & the Economics of Global
Climate Stabilization: ADB (2015)
the policy costs of emissions mitigation - to be
2.5% to 3.5% of regional GDP over the 2010
to 2050 period for the below 2ºC mitigation
scenario (500 ppm scenario)
Low carbon energy technologies - critical to
reduce decarbonisation costs in the long term
Under a 2ºC mitigation (500 ppm stabilization)
scenario, low carbon energy technologies
have the potential to reduce 2050 GDP costs
of emissions reduction by more than 50%.
Indonesia, Malaysia, Philippines,
Thailand & Vietnam
Rawshan@2018

Environmental Policy ApproachVoluntary Environmental Agreements- helps to build environmental management capacity, improve environmental performance & best
environmental practice
ASEAN
Countries
Voluntary Commitment - COP15 @ Copenhagen in 2009 NAMA
Indonesia 26% of CO2 equivalent emission reduction on its own efforts
and up to 41% with international supports by 2020
Sustainable Peat land Management;
Reduction in Rate of Deforestation and Land
Degradation;
Development of Carbon Sequestration Projects in
Forestry and Agriculture;
Promotion of Energy Efficiency;
Development of Alternative and Renewable Energy
Sources;
Reduction in Solid and Liquid waste ;
Shifting to Low-Emission Transportation Mode.
Malaysia Up to 40% in terms of emissions intensity of GDP by the year
2020 compared to 2005 levels
Singapore Mitigation measures leading to a reduction of GHG emissions by
16% below Business-as-Usual (BAU) levels in 2020, contingent
on a legally binding global agreement in which all countries
implement their commitments in good faith
Thailand On a voluntary basis, to reduce its GHG emissions in the range of
7 to 20% below the Business as usual (BAU) in energy and
transportation sectors in 2020, subject to the level of
international supports provided in the forms of technology
development and transfer, finance, and capacity building for
NAMAs preparation and implementation
Development of renewable and alternative energy
sources; Energy efficiency improvement in industries,
buildings, transportation and power generation;
Bio-fuels in transportation; and
Environmentally sustainable transport system
Carbon Intensity of GDP = Total Carbon Emission / Total GDP
i.e. carbon emission per unit GDP [not an absolute reduction of emission]
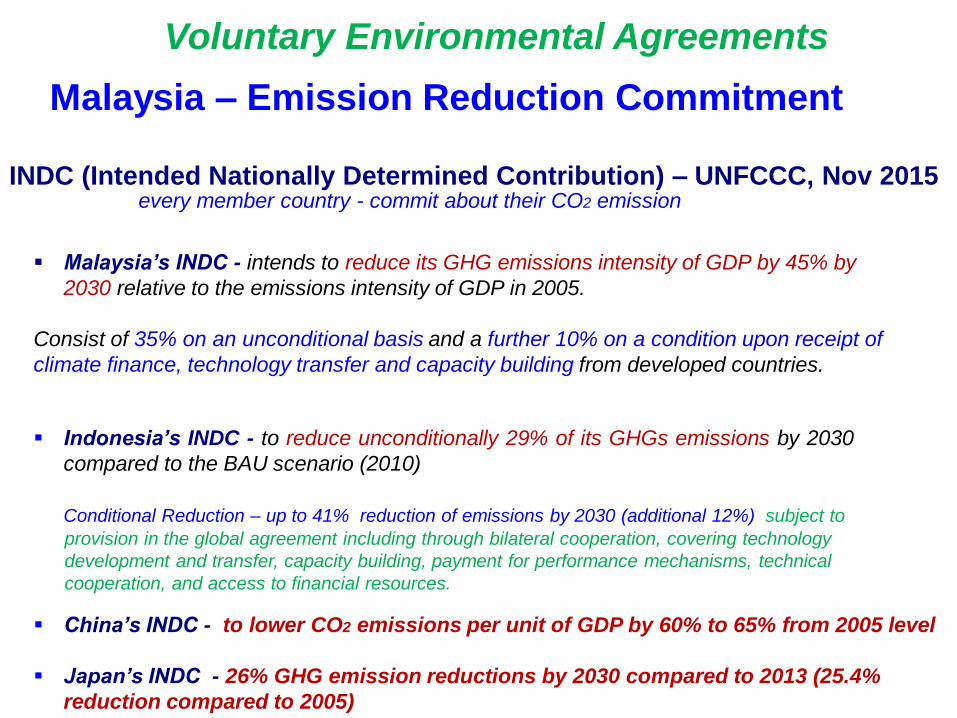
Malaysia – Emission Reduction Commitment
INDC (Intended Nationally Determined Contribution) – UNFCCC, Nov 2015
Malaysia’s INDC - intends to reduce its GHG emissions intensity of GDP by 45% by
2030 relative to the emissions intensity of GDP in 2005.
Consist of 35% on an unconditional basis and a further 10% on a condition upon receipt of
climate finance, technology transfer and capacity building from developed countries.
every member country - commit about their CO2 emission
Indonesia’s INDC - to reduce unconditionally 29% of its GHGs emissions by 2030
compared to the BAU scenario (2010)
Conditional Reduction – up to 41% reduction of emissions by 2030 (additional 12%) subject to
provision in the global agreement including through bilateral cooperation, covering technology
development and transfer, capacity building, payment for performance mechanisms, technical
cooperation, and access to financial resources.
Voluntary Environmental Agreements
China’s INDC - to lower CO2 emissions per unit of GDP by 60% to 65% from 2005 level
Japan’s INDC - 26% GHG emission reductions by 2030 compared to 2013 (25.4%
reduction compared to 2005)
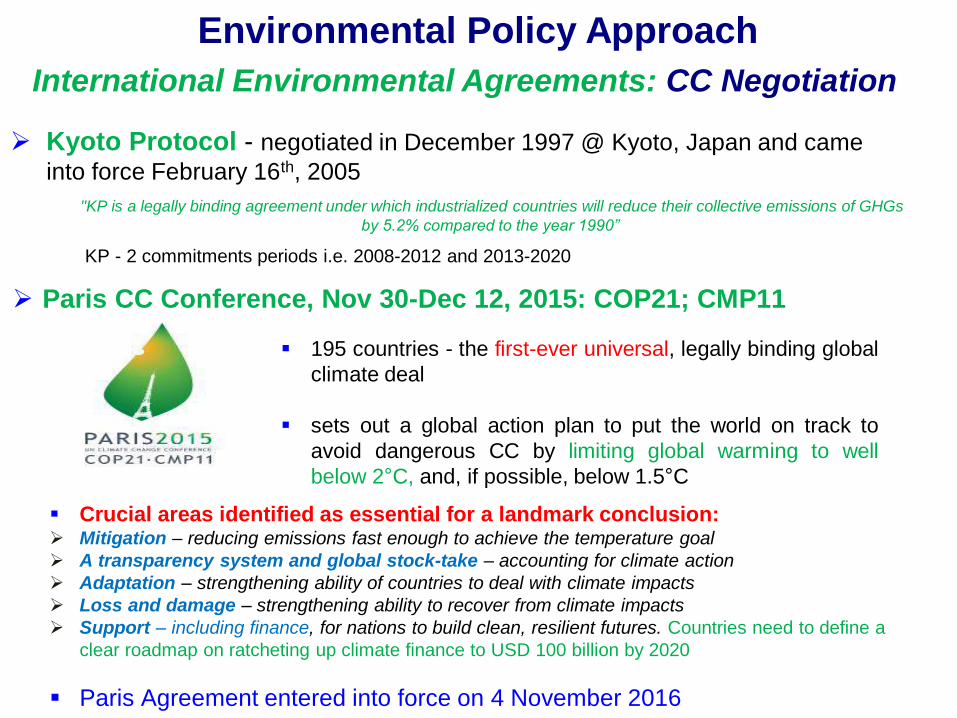
Kyoto Protocol - negotiated in December 1997 @ Kyoto, Japan and came
into force February 16th, 2005
International Environmental Agreements: CC Negotiation
Paris CC Conference, Nov 30-Dec 12, 2015: COP21; CMP11
195 countries - the first-ever universal, legally binding global
climate deal
sets out a global action plan to put the world on track to
avoid dangerous CC by limiting global warming to well
below 2°C, and, if possible, below 1.5°C
Crucial areas identified as essential for a landmark conclusion: Mitigation – reducing emissions fast enough to achieve the temperature goal
A transparency system and global stock-take – accounting for climate action
Adaptation – strengthening ability of countries to deal with climate impacts
Loss and damage – strengthening ability to recover from climate impacts
Support – including finance, for nations to build clean, resilient futures. Countries need to define a
clear roadmap on ratcheting up climate finance to USD 100 billion by 2020
Paris Agreement entered into force on 4 November 2016
"KP is a legally binding agreement under which industrialized countries will reduce their collective emissions of GHGs
by 5.2% compared to the year 1990”
KP - 2 commitments periods i.e. 2008-2012 and 2013-2020
Environmental Policy Approach

Environmental Policy Approach
Market Based/Economic Instrument
includes charges on harmful emissions & wastes, subsidies to clean energy
Among other methods, economic evaluation is commonly used to inform
environmental /climate policy design such as cost-benefit analysis, cost-
effectiveness analysis, utility theory analysis.
Putting a price on GHG emissions
Both provide incentive to reduce emissions & to
minimize the costs of abatement
Emissions taxEmissions trading (eg. European Union Emission
Trading Scheme)
fixes the carbon price but leaves the
quantity of emissions uncertain, for
instance, setting taxes too low would lead
emissions to overshoot their target -
dangerous.
Carbon trading guarantee that a
particular emissions target is achieved,
price uncertainty and volatility (potential
problem with carbon trading, when the
market rules are unclear and trading is
narrow and thin).

Emission Tax Vs Emission Trading scheme
long term
short term long term
MB – flat means gently decreases as quantity of emissions
reduction ↑
Reflects variations in emissions in any single year are
unlikely to have a significant effect on stock of GHG
emissions
MC – steeply increases as quantity of emissions reduction ↑
Firms find more difficult to reduce emissions unless they can
adjust their capital stock and choice of technology (assume
impossible in Short Term)
Efficiency loss by Emissions Tax < by Emissions
Trading Scheme
MB – steeply decreases as quantity of emissions
reduction ↑
MC – gently increases as quantity of emissions
reduction ↑
Since in the long run, there is more flexibility to
adjust emission reduction efforts
Efficiency loss by Emissions Tax > by
Emissions Trading Scheme

Malaysia: Reduction of Carbon Emission Intensity
NC3/BUR2 (Biennial Update Report), 2018 to the UNFCCC:
Malaysia – achieved about 33% reduction of carbon emission intensity
Rawshan@2018

Programs Actions/Initiatives
Energy policies Fifth Fuel Policy 2000 (oil, natural gas, coal, hydro & RE); National Bio-fuel Policy 2006 (introduced B5
biodiesel in June 2011); National Renewable Energy Policy 2010;
Programs Small Renewable Energy Power Programme (SREP);
Biomass Power Generation and Deconstruction Project (BioGen);
National SURIA 1000 Programme jointly promoted by the Government, the United Nations Development
Programme (UNDP) and the Global Environment Facility (GEF);
Malaysia Building Integrated Photovoltaic Technology application (MBIPV);
Malaysian Industrial Energy Efficiency Improvement Project (MIEEIP);
Information for the Commercialisation of Renewables in ASEAN (ICRA);
Energy Audit Program in Government Buildings;
National Corporate GHG Reporting Programme for Malaysia (MyCarbon);
Low Emission Capacity Building Project (LECB) Malaysia under NAMA
Incentives & Tariffs Tax incentives for companies that generate RE & providing EE services, e.g., pioneer status with a tax
exemption of 100% of the statutory income (10 years) or an investment tax allowance of 100% on the
qualifying capital expenditure that is incurred, which will be offset against 100% of the statutory income for
each year of the assessment (five years);
Exemptions from import duties and sales taxes on equipment used to generate energy that is not produced
locally; & a sales tax exemption on equipment purchased from local manufacturers;
Feed-in-Tariff (FiT) pays a premium rate for green electricity and is eligible for biomass, biogas, small-hydro,
and solar PV;
Fund & Financing
Scheme
Renewable Energy Fund under FiT; Renewable Energy Business Fund;
Green Technology Financial Scheme (GTFS); Renewable Energy & Energy Efficiency Scheme;
Regulatory
Frameworks
Renewable Energy Act of 2011;
Sustainable Energy Development Authority (SEDA) Act of 2011.
Mitigation Policy Strategy in Malaysia
Source: KeTTHA, 2010;
PTM, 2008
FiT mechanism may work as an incentive for energy savings and a motivation to consumers (individual or
industry) to offset the incremental electricity cost by applying EE & RE measures. Rawshan@2018

Economic instruments can foster adaptation by providing incentives for
anticipating and reducing impacts such as public-private finance
partnerships, loans, payments for environmental services, improved
resource pricing, charges and subsidies, norms and regulations, & risk
sharing and transfer mechanisms.
Risk financing mechanisms in the public and private sector (insurance and
risk pools) can contribute to increasing resilience, but without attention to
major design challenges, they can also provide disincentives, cause
market failure, and decrease equity.
Regulatory approaches e.g. energy efficiency standards are widely used &
often environmentally effective. Minimum standards for buildings and
appliances also proved a cost-effective way to improve performance.
Information policy measures (awareness & education; early warning
system; sharing best practices; labelling programmes) can help
consumers and businesses make better-informed decisions, and stimulate
competitive markets for low-carbon and high-efficiency goods and
services.
Policy Approach for Adaptation

Link between Adaptation Cost & Residual Cost of CC
CC damage can be reduced at no cost (e.g. by changing sowing dates in agricultural sector). With increasing AC,
CC costs can be reduced further. In some cases (left-hand panel), sufficiently high adaptation spending can take
residual cost to zero. In other cases (right-hand panel), some residual cost of CC is unavoidable.
The optimal level of adaptation equalizes MAC and MAB, given by the point on the adaptation curves where the
slope is -45º. If barriers and constraints impose a suboptimal situation, the MAC and MAB are not equal, possibly
because there is too much investment in adaptation, so that investing $1 in adaptation reduces CC residual cost
by less than $1, or because there is not enough investment in adaptation and investing $1 more in adaptation
would reduce residual cost by more than $1 (the situation in the right-hand panel).

Sharing Research on Economics of CC

Corporate managers view on climate change (Begum & Pereira,
2013) - well aware;
Rank of motivational factors to address CC [Begum & Pereira (2015) @
Mitigation & Adaptation Strategies for Global Change]
Opinion - CC affects the
company profit
Factors
Average
Important
Score, AIS
Standard
Deviation,
Factors
Index Value,
FIV
Rank of Factors
Index Value, RFIV
Education & awareness building 3.72 0.49 11.31 1
Legislation & regulation 3.61 0.53 10.42 2
Financial incentives 3.33 0.64 8.53 4
Guidelines & training support 3.30 0.72 7.88 5
Appropriate technology 3.5 0.64 9.0 3
Research & development 3.26 0.83 7.19 6

Linking CCA and DRR
CCA & DRR both - share
similar goals and
conceptual overlaps
CCA & DRR both - seek to
reduce vulnerability and
build resilience to hazards
in the context of SD
CCA & DRR both
-require similar information
systems, skills, and
institutional arrangements
Both - struggling to be
mainstreamed into regular
development planning
Climate Change Adaptation
Convergence
Disaster Risk Reduction
Economic Approaches for Linking DR Management & CCA[ERGS; Begum et al; 2011-14]

Conceptual Framework: Factors to linking DRR & CCA
Coordination on
technology transfer and
cooperation between
DRR & CCA has been
lacking, which has led to
fragmented
implementation
Integration of local
knowledge with
additional scientific
& technical
knowledge can
improve DRR &
CCA
Begum R.A., Sarkar M.S.K., Jaafar A.H. & Pereira J.J. 2014. Toward conceptual Framework for Linking Disaster
Risk Reduction and Climate Change Adaptation. International Journal of Disaster Risk Reduction , 10: 362–373.

Relationship between CO2 emission/capita and GDP/capita (1970-2009)
1970
19711972
197319741975
1976
19771978
1979
19801981
1982
1983
1984
1985
19861987
1988
1989
1990
19911992
1993
1994
1995
1996
19971998
1999
2000
2001
2002
20032004
2005
2006
20072008
2009
11.2
1.4
1.6
1.8
Log C
O2 E
mis
sion P
er
Capita
50 55 60 65 70 75 Log GDP Per Capita Square
95% CI Fitted values
CO2
Concept of Environmental Kuznets Curve Opposite of EKC
[Begum, et al. (2015) @ Renewable & Sustainable
Energy Reviews]
Significant transformation of low carbon technologies i.e. RE & EE could contribute to
reduce the emissions and sustain the long run economic growth
Economic growth – strongly correlated with increasing energy use and
growth of GHG emissions
ARDL version of the vector error correction model (VECM)
Rawshan@2018
Feasibility study of low carbon technology in terms of
emission reduction & economic cost-benefit [FRGS; Begum et al; 2013-15]

the economy would decrease about
126,683,716 tonne of carbon emission
from 2010 to 2020 whereas the market
value of this carbon is approximately
RM604,281,323 which is cost savings of
the economy.
5% Share of
biodiesel Energy
Use in Transport
Sector
7.8% share of
Renewable Energy
Sector Change
in
Output
Change in
CO2
Emission
Change
in Output
Change in
CO2
Emission
Agriculture 0 -0.2542 0 -7.426
Energy 0 -0.2532 0 -7.328
Industrial 0 -0.2545 0 -7.451
Manufacture 0 -0.2539 0 -7.398
Rest. &Acco. 0 -0.2546 0 -7.462
Transport 0 -0.2531 0 -7.310
ICT 0 -0.2540 0 -7.405
Bank & Finance 0 -0.2543 0 -7.437
Real Estate 0 -0.2525 0 -7.250
Service 0 -0.2591 0 -7.915
Total (Average) 0 (-0.253) 0 -7.4382
Renewable Energy: Emission Reduction & Cost Benefit Analysis [Sohag, Begum, Abdullah & Jaafar, 2018 -unpublished]
CBA supports the findings of the CGE model
CBA of using 7.8% share of RE
Sectoral economic Impacts of RE – CGE
About 4,357,312 tonne of carbon emission
reduction while the market value of carbon
is RM20,784,379
CBA of using 5% share of biodiesel
Both policy targets ensure reduction of carbon emission without harming GDP
Cost Benefit Analysis (CBA)
Rawshan@2018
Mainstreaming CC impacts into development plans & policies in Malaysia

Assessing Coastal Vulnerability due to CC towards
Sustainable Community in Malaysia [Arus Perdana; Begum et al; 2016-18]
Study area - low lying coastal areas in Kuantan (Cherating to Pekan)
Development of Integrated Coastal Vulnerability Index & Adaptation Strategies

Investigation of Coastal Vulnerability due to Climate Change
(Primary & Secondary Data; Questionnaire Survey; Numerical morph dynamic
models; Geometric profile relationships -Bruun Rule; Damage Cost )
Recommendations for policy implications; Framework
and Guidelines for sustainable coastal community
Development of Adaptation Strategies for
Different Stakeholders: Focus Group Discussion;
Stakeholders Workshop;
Development of Integrated Coastal Vulnerability Index: Primary
& Secondary Data; Questionnaire Survey; Focus Group Discussion;
Stakeholders Workshop
CVI for physical
parameters (coastal
hydrodynamics including
sea level rise, shoreline
erosion and inundation and
others)
CVI for environmental
parameters (emissions,
water pollution, mangrove,
vegetation & coastal
ecosystems including water
and drainage and others)
CVI for economic
parameters
(economic activities,
settlements;
infrastructure and
others)
CVI for socio-cultural
parameters
(livelihood, stress,
historic resources,
customs, culture,
policy & others)
Assessing Coastal Vulnerability due to CC towards Sustainable Community
in Malaysia [Begum et al; 2016-18]
by reducing risk & vulnerability,
we can minimize the effects of
CC & disaster
To promote resilience we need
to know vulnerability
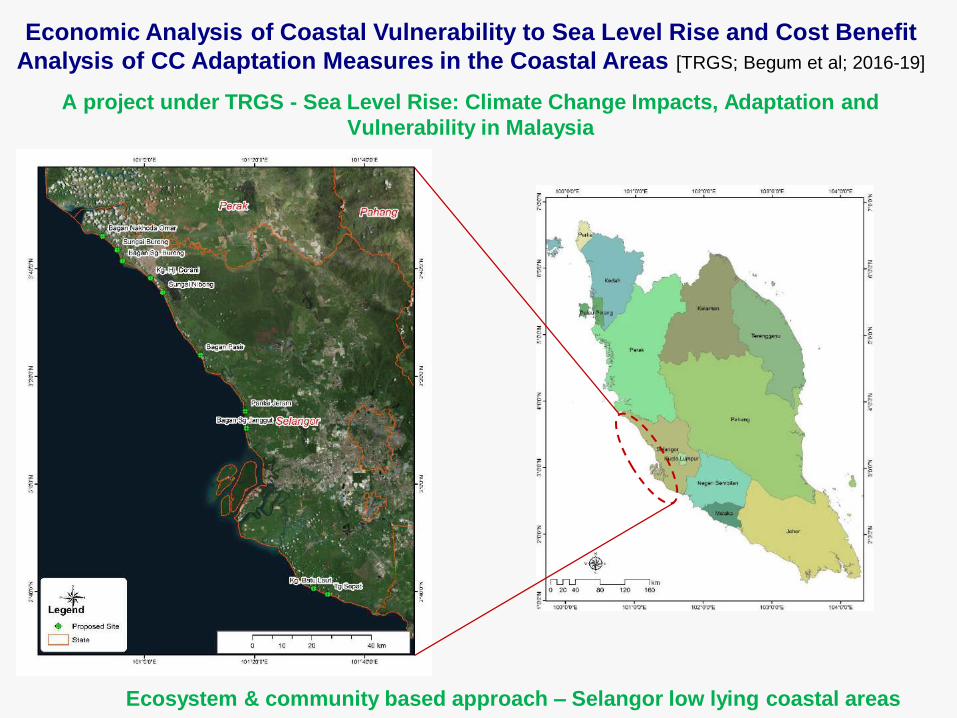
Economic Analysis of Coastal Vulnerability to Sea Level Rise and Cost Benefit
Analysis of CC Adaptation Measures in the Coastal Areas [TRGS; Begum et al; 2016-19]
A project under TRGS - Sea Level Rise: Climate Change Impacts, Adaptation and
Vulnerability in Malaysia
Ecosystem & community based approach – Selangor low lying coastal areas

Major Goal
Increase the capacity of teacher trainers and national teacher-training institutes (TTIs) to deliver
CCE through elementary, junior and secondary education
Expand the level of environmental literacy within national education systems in target locations
of SIDS in Asia Pacific
Begum, RA
Training Material Development on Climate Change Education
for SIDS in Asia Pacific [UNESCO; Said, Zakaria, Begum.., 2015-17]

Research @ Kumamoto University
Rawshan@2018
Inter and trans-disciplinary research – CC & DM
- CC and disaster prevention education team
Building resilience by prioritizing DRR & adaptation measures
towards sustainable community – Case study – Tunisia
Estimation of public preferences for storm surge risk reduction
@ Osaka Bay, Japan
Development and application of climate and disaster resilient Index
- Case study - Southern part of Bangladesh
2016 Kumamoto Earthquake
- Benefits & Perceptions study of Living Temporary Housing
- Efficiency of providing incentives for disaster reconstruction

“Sendai Framework for DRR 2015-2030” adopted at
the Third World Conference on DRR, held from in
Sendai, Miyagi, Japan
Need for focused action within & across sectors by
States at local, national, regional and global levels in
the 4 priority areas:
1. Understanding disaster risk;
2. Strengthening DR governance to manage DR
3. Investing in DRR for resilience;
4. Enhancing disaster preparedness for effective
response, and to “Build Back Better” in recovery,
rehabilitation and reconstruction.
Post-2015 Framework for DRR
14-18 March 2015
SDGs - Transform the world by 203025 September 2015
Limiting global warming
to well below 2°C, and, if
possible, below 1.5°C.
COP21: Paris Agreement - CC Nov 30-Dec 12, 2015
CC - global environmental problem
global, regional, national, local, community & individual
decoupling economic growth with the emission growth
policies - building on diverse national & local
conditions implementing proper policy & responses - to fortify the nation
& community resilience
inter and trans-disciplinary R&D
effective usage of LC & STs (RE & EE, CCS, green growth policy)
policy - link between current actions & long-term goal
Transition to a Climate Resilient & Sustainable Economy
integrating DM, CC & SD
integrated approach (science-social science – policy)
education, awareness & communication
adequate technical and financial support transformations to sustainability in economic, social,
environmental, technological, and political decisions & actions
Rawshan@2018

Further Contacts:
Thank You