economics and human biology
TRANSCRIPT
Economics and Human Biology 31 (2018) 54–68
Perceived health risk, environmental knowledge, and contingentvaluation for improving air quality: New evidence from the Jinchuanmining area in China$
Zhengtao Lia,*, Bin Hub
a School of Economics, Zhejiang University of Finance & Economics, Xueyuan Street No. 18, Xiasha Higher Education Park, Hangzhou, 310018, Chinab School of Public Finance and Public Policy, Central University of Finance and Economics, 39 South College Road, Haidian District, Beijing, 100081, China
A R T I C L E I N F O
Article history:Received 19 June 2017Received in revised form 23 July 2018Accepted 23 July 2018Available online 27 July 2018
Keywords:Contingent valuation methodBehavioural intentionPerceived health riskEnvironmental knowledgeAir pollutionChina
A B S T R A C T
This study examined people’s willingness to pay (WTP) for improving air quality obtained throughcontingent valuation method (CVM) in the context of the theory of planned behaviour. Following thistheory, four indicators were developed to measure people’s behavioural intentions for improving airquality; two of these indicators were correlated with contingent valuation survey. Structural equationmodelling (SEM) was employed to estimate our Perception-based Behavioural Intention Model (PBIM) byusing a cross-sectional data set of 759 residents of the Jinchuan mining area in Gansu Province, China. Wefound that Jinchuan residents’ WTP for improving local air quality was significantly influenced by theperceived health risk of hazardous pollutants, environmental knowledge, socioeconomic status, currenthealth condition, gender, work environment, and proximity to the pollution source. This study shows thatSEM outperforms conventional CVM econometrically and in terms of the provision of relevant policyinformation.
© 2018 Elsevier B.V. All rights reserved.
Contents lists available at ScienceDirect
Economics and Human Biology
journal homepage: www.elsev ier .com/locate /ehb
1. Introduction
Many cities in China are experiencing severe levels of airpollution associated with a rapid increase in energy consumptionfor industrial, residential, and motor vehicle use (Wang et al., 2006;Watts, 2005). A report published by the State EnvironmentalProtection Administration of China (2006) showed that two out offive cities in China failed to meet the residential-area air qualitystandards, resulting in the exposure of their populations to the riskof adverse health effects. Wong (2013) found that air pollution ledto 1.2 million premature deaths in China in 2010.
Jinchuan has the largest nickel resources in China. Nickelindustries, including mining and smelting, dominate localeconomic development. The output of Jinchuan’s nickel industriesaccounts for more than 90% of China’s total nickel production.Approximately 70% of the government revenues of Jinchuan derivefrom Nickel industries (Jinchuan Yearbook, 2012). Nickel
$ Two authors contributed equally to this work. We gratefully acknowledge thecomments and suggestions by two anonymous reviewers and that have helped us alot to improve previous versions of the paper. The usual disclaimer applies.* Corresponding author.E-mail addresses: [email protected] (Z. Li), [email protected] (B. Hu).
https://doi.org/10.1016/j.ehb.2018.07.0071570-677X/© 2018 Elsevier B.V. All rights reserved.
industries, however, also cause serious environmental issues,particularly air pollution, and Jinchuan has become one of the 10most polluted cities in China (Wei, 2008). The suspended particles,sulphur dioxide, chlorine gas, and carbon dioxide discharged bynickel industries are the main pollutants of Jinchuan’s air (Huanget al., 2009; Li and Zhao, 2004; Wei, 2008; Xiao, 2003). The firstthree pollutants increase the probability of respiratory andcardiovascular illnesses and lung cancer, and can even result indeath (Bernstein et al., 2004; Dockery & Pope III, 2006; Kampa andCastanas, 2008). Carbon dioxide is the primary greenhouse gas(Olah et al., 2008).
The main objective of this study is to value Jinchuan residents’willingness to pay (WTP) for improving air quality. The value ofimproving air quality, however, cannot be directly observedthrough economic transactions and market data (Louviere et al.,2000; Mendelsohn and Olmstead, 2009). Thus, a hypotheticalmarket (scenario) involving an improvement of air quality isconstructed through the process of applying contingent valuationmethod (CVM).
CVM has been widely used to value people’s preference forimproving air quality. For instance, Carlsson and Johansson-Stenman (2000) studied individual WTP for improving air qualityin Sweden with CVM and found that people’s WTP increasedaccording to income, wealth, and education. It was higher for men,

Z. Li, B. Hu / Economics and Human Biology 31 (2018) 54–68 55
members of environmental organizations, people living in bigcities (which are, on average, more polluted), and people whoowned a house or apartment. Using data from the state of Kerala inIndia, Baby (2009) estimated local people’s WTP for avoidinghealth risks associated with suspended particulate matter (SPM)with CVM and found that WTP values increased with income, SPMlevels, and visits to the doctor. Wang et al. (2006) assessedresidents’ WTP to improve air quality in the urban area of Beijingwith CVM and found that WTP increased with income andeducation levels and decreased with household size and age. Wangand Zhang (2009) employed CVM to study the relationshipbetween poor air quality and residents’ WTP for improving airquality in the city of Ji’nan, China. They found that annualhousehold income, expenditures on the treatment of respiratorydiseases, and the number of workers in the family significantlyinfluenced people’s WTP.
With regards to the reliability of CVM, Arrow et al. (1993)concluded that contingent valuation provided reliable informationon estimating the value of improving air quality;1 moreover, theysuggested that respondents’ ‘internal psychological processes’should not be ignored when responses to valuation questions areinterpreted. People’s internal psychological processes, however,still remain unexplained in a ‘black box’ of conventional CVM. Thus,it is essential to discern the effects of people’s internalpsychological processes on their WTP (Ajzen, 1991; Hammitt,2013; Menon et al., 2008; Shogren and Taylor, 2008). For instance,Kotchen and Reiling (2000) conducted a contingent valuationsurvey in Maine and analysed the relationships among environ-mental attitudes, nonuse values for endangered species, andunderlying motivations for contingent valuation responses. Theyfound that pro-environmental attitudes associated with strongerreliance on ethical motives for species protection resulted in higherestimates of mean WTP.
Therefore, knowing how much people are willing to pay forimproving air quality but ignoring whether they view the riskscaused by air pollution as highly probable and having severelynegative consequences will result in biased explanations regardingthis WTP.
This study makes two primary contributions to the literature.First, we provide an empirical application of a traditional CVM andextend it by considering psychological factors-notably, environ-mental knowledge and risk perception. This results in a betterunderstanding of respondents’ decision-making processes(Temme et al., 2008) and improvement of the explanatory powerof the CVM. Second, the reliability of contingent valuationmeasures is enhanced by using four indicators to measure Jinchuanresidents’ behavioural intention to improve local air quality andemploying structural equation modelling (SEM) to complete thedata analysis.
We found that perceived health risk, environmental knowledge,current health condition, socioeconomic status, proximity to thepollution source, work environment, and gender are importantdeterminants of Jinchuan residents’ WTP for improving air quality.Furthermore, the explanatory power of CVM is enhanced byconsidering perceived health risk and environment knowledge.
The paper is organized as follows. The next section introducesthe background of behavioural intention, perceived health risk,and environmental knowledge. This is followed by a description ofthe type of SEM, the conceptual model, and its identification. Thenext section outlines the survey and presents the data and
1 In 1993, a panel of prominent economists assembled by the National Oceanicand Atmospheric Administration issued a report assessing the reliability of CV forestimating nonuse values (Arrow et al., 1993).
empirical results. Finally, we present conclusions and policyrecommendations.
2. Background: behavioural intention, perceived health risk,and environmental knowledge
According to planned behaviour theory, behavioural inten-tion, which is the immediate antecedent of people’s behaviour, canbe predicted with high accuracy by other psychological factors,such as attitudes, perception, and subjective norms. Thus, toimprove the capacity to describe and predict contingent valuation,Barro and Lee (1996), Kerr and Cullen (1995), Luzar and Cosse(1998), and Bernath and Roschewitz (2008) suggested using thetheory of planned behaviour as context and considering WTP asbehavioural intention when examining WTP responses obtainedthrough CVM.
The relationship between perceived risk and risk behaviourhas aroused interest in people’s (environmental) behaviouralintention. This is because perceived risk in shaping people’sbehavioural intention has been a fundamental issue in environ-mental economics and psychology. Theories and empiricalstudies agree regarding the importance of risk perception inexplaining people’s risk-related behavioural intention. The social-psychology literature on behavioural research also has estab-lished risk perceptions as important predictors of behaviour andbehavioural intentions (Ajzen, 1988; Fishbein and Ajzen, 1975). Inother words, perceived health risk has been central to mosthealth-specific behavioural theories (Weinstein, 1993), includingthe health belief model (Becker, 1974; Kirscht, 1988), subjectiveexpected utility theory (Edwards, 1954), protection motivationtheory (Maddux and Rogers, 1983), the theory of reasoned action(Fishbein and Ajzen, 1975), and the theory of planned behaviour(Ajzen, 1985). These theories agree that the motivation to takeactions correlated with negative outcome depends on people’sassessment about the likelihood that the negative outcome willoccur.
The concept of ‘perceived risk’ is also popular in the field ofeconomics. Bauer (1960) first introduced the concept into themarketing literature. Since then, perceived risk has also attractedsubstantial attention from environmental economists. In this line,Um et al. (2002) found that individuals’ aversion to using tap waterin South Korea was significantly influenced by their risk percep-tion. Further, Nauges and Van Den Berg (2009) found thatperceived health risk encouraged households in Sri Lanka to treatwater carefully—that is, to boil or filter it before drinking. Byanalysing the economic health cost of exposure to wildfire smokein the United States, Richardson et al. (2012) found that perceptionof air pollution levels had a positive and significant effect onhouseholds’ averting activities.
The variable ‘environmental knowledge’ is often used incampaigns to improve behavioural intention. Researchers haveshown that an individual’s knowledge of environmental issues isimportant to decision-making within an environmental context(e.g., Hines et al., 1987; Hungerford and Volk, 1990; Marcinkow-ski, 1988). Environmentally conscious behaviour is possible onlywhen people know what they can or could do. Withoutenvironmental knowledge, it is impossible to act in an environ-mentally friendly way. Vassanadumrongdee and Matsuoka(2005) conducted contingent valuation surveys in Bangkok tomeasure individuals’ WTP for reducing mortality risk arising fromair pollution and found WTP to be significantly and positivelyinfluenced by personal knowledge. This conclusion was alsosupported by Gil and Soler (2006), who studied consumers’knowledge and WTP for organic food products in Spain and foundthat this knowledge significantly influenced consumers’ WTP fororganic food production.

Fig. 1. The Perception based Behavioural Intention Model.
56 Z. Li, B. Hu / Economics and Human Biology 31 (2018) 54–68
3. Model specification and identification
3.1. Structural equation modelling
To handle the three psychological factors discussed above—environmental knowledge, perceived health risk, and behaviouralintention—and their explanatory variables (e.g., age, gender, workenvironment) and model of systems of relationships within onemodel framework, SEM was employed to complete the empiricalestimation (Jöreskog and Sörbom, 1996).
A SEM is made up of three sub-models: two measurementmodels and the structural model (Jöreskog and Sörbom, 1996). Eqs.(1) and (2), which describe the relations between latent variablesand their corresponding indicators, are the measurement models.
y ¼ Lyh þ e with cov e ¼ Qe ð1Þ
x ¼ Lxj þ d with cov ðdÞ ¼ Qd ð2ÞSpecifically, the variables y and x on the left side of the
measurement equations are (p � 1) and (q � 1) vectors of observedendogenous and exogenous variables, respectively. The variables hand j, which are on the right side of the measurement equations,are (m � 1) and (n � 1) vectors of latent endogenous and latentexogenous variables,2 respectively. Ly and Lx constitute the (p �m) and (q � n) matrix, and they specify the relationship (loadings)between y and x and their corresponding latent variables of h and j,respectively. Qe p � pð Þand Qd ðq � qÞ are covariance matrices of e
and d, which are the measurement errors of y and x, respectively.
h ¼ Bh þ G j þ z with cov ðjÞ ¼ F ; cov ðzÞ ¼ C ð3Þ
2 The latent variable, which is also called latent construct and cannot be observeddirectly, is commonly measured by multiple observed variables (also calledmanifest variables, items, or indicators).
Eq. (3) is the structural model that specifies the relationshipsamong the latent variables. Bis an (m � m) matrix that contains thestructural parameters relating the endogenous variables to oneanother, and G is an (m � n) matrix containing structuralcoefficients relating the endogenous variables to the exogenousvariables. z, also called a structural disturbance, is a random (p � 1)vector of errors with covariance matrix C p � pð Þ. The covariancematrix of j is Fðn � nÞ.3 For details on identification, estimation,testing, and model modification of an SEM, we refer to Bollen(1989) and Bollen and Noble (2011).
Using SEM has several advantages. First, SEM allows a closercorrespondence between theory (which is formulated in terms oflatent variables) and empirics (which are based on observedvariables) (Oud and Folmer, 2008). Second, because the measure-ment errors of the explanatory variables are purged of the truelatent variables in the measurement model, SEM reducesattenuation bias (bias towards zero) in the structural model.Finally, SEM reduces multicollinearity by taking strongly correlat-ed observed variables as indicators of one latent variable in themeasurement model. In the structural model, the latent variablesare substituted for the strongly correlated observed variables(Folmer and Nijkamp, 1986).
3.2. Conceptual model
We present the conceptual model of our research in Fig. 1 andEqs. (4)–(6). Our conceptual model contains five endogenousvariables: behavioural intention, perceived health risk, environmentalknowledge, socioeconomic status, and current health condition.Moreover, all of them are influenced by people’s sociodemographic
3 Note that it is possible to include intercepts in the measurement models and inthe structural model. However, we standardize the variables below. Note also thatdirectly observed variables can be included in the structural model by specifying anidentity relationship between a latent variable and its indicator in the measurementmodel and fixing the measurement error at zero.

Table 1Descriptive statistics for the observed exogenous variables.
Variables Min Max Mean S.D
Age (AGE) 21 78 44.11 11.4Family size (FS) 1 6 2.95 0.78Gender (GEN) 0 1 0.39 0.49Current health condition(CHC) 1 5 3.68 0.85Family health experience(FHE) 0 1 0.33 0.48
Education (EDU) % Household net income(CNY per month) (IN)
%
Primary school 6.30% 1000-2000 4.70%Middle school 23.60% 2000-3000 15.30%High school 25.30% 3000-4000 18.30%Vocational school, 25.30% 4000-5000 19.10%Bachelor’s degree 19.10% 5000-6000 20.90%Master’s degree 0.40% 6000-7000 13.00%Proximity to the pollution source (PPS) % 7000-8000 3.70%Nearby smelting plants, severe air pollution (SAP) 29.60% 8000-9000
9000-100001.80%1.10%
Medium air pollution (MAP) 29.80% More than 10000 2.00%Far away from smelting plants, light air pollution (LAP, reference case) 40.60% Current health conditionWork environment (WE) %Non-JMC individuals (reference case) 59.55%Miners and smelter workers of JMC (MS) 18.18%JMC employee, but not miner or smelter worker (NMS) 22.27%
Note: Source: Author’s survey. Family size: number of family members living in the same house. Current health condition: respondent's self -evaluation of his/her owncurrent health condition. (5=very good, 4=good, 3= no good, no bad, 2=bad,1=very bad). Family health experience: 1 if the respondent or one or more of their family membershave been hospitalized for cardiovascular diseases (e.g., hypertension, heart attack, chest pain, arrhythmia and miocardial infraction) or respiratory diseases (e.g., upperrespiratory tract infection, bronchitis, pneumonia, asthma, and lung cancer), 0 otherwise. Gender is measured as a dummy variable (Male = 0, Female = 1).
Z. Li, B. Hu / Economics and Human Biology 31 (2018) 54–68 57
characteristics, including age, age square, gender, family size,family health experience, work environment, and proximity to thepollution source.
Before going into detail, we observed that the studies on therelationship between Behavioural intention (BI) for improving airquality and perceived health risk caused by air pollution are limited;thus, we have expanded the scope of the literature review by alsoincluding some research on the relationship between BI and formsof environmental risks other than those that are related to airpollution. BI, which is a measure of a person’s willingness (orrelative strength of purpose) to execute certain behaviour (Ng andPaladino, 2009), is the main dependent variable of our conceptualmodel. To improve the reliability of measures, Ajzen (1991); Graefeet al. (1988), and Hrubes et al. (2001) suggested using multiple-item measures of BI rather than single-item measures. Thus, fourindicators were developed in this study to test Jinchuan residents’BI for improving local air quality (Fig. 3).
Perceived health risk (PHR) is here conceptualized as thesubjective assessment of the possibility of suffering negativehealth events over a specified period (Menon et al., 2008). It isassumed that the impact of PHR on BI is direct and positive. Thishypothesis is supported by Brewer et al. (2007), who conducted ameta-analysis to assess the bivariate association between adultvaccination and PHR and found consistent relationships betweenrisk perceptions and intentions of avoiding health risks. Fiveindicators were developed in this study to examine Jinchuanresidents’ PHR (Fig. 4).
Environmental knowledge (EK) is conceptualized as anindividual’s cumulative body of knowledge of the interdependen-cy between human society and its natural environment (Berkeset al., 2000). It is generally considered as a prerequisite forother environmental psychological factors, such as environmentalvalue, environmental attitude, and risk perception (Hungerfordand Volk, 1990). Kitzmüller (2009) analysed data collectedfrom Bowling Green, Ohio, and found that EK indirectlyinfluences BI via environmental attitude. Thus, in our study, wehypothesize that EK indirectly influences BI through PHR. Eight
indicators were developed in this study to test Jinchuan residents’EK (Fig. 5).
Current health condition (CHC) has been considered an impor-tant determinant of individuals’ BI for improving air pollution(Elliott et al., 1999; Slovic, 1987). First, we hypothesize that CHCdirectly and positively influences BI for improving air quality. Thisis because people’s behaviours in avoiding the negative effects ofpolluted air are embedded in daily life through their own healthexperiences (Bickerstaff, 2004). Additionally, people with poorhealth status would be concerned about the negative effectscaused by air pollution and likely to adopt aversive behaviours (Elliott et al., 1999). Thus, we also postulate that CHC indirectlyinfluences BI via risk perception. CHC is measured by arespondent’s self-evaluation of his or her CHC (Table 1).
Socioeconomic status (SES), which is measured by incomeand education, is assumed to positively influence people’s BI forimproving air quality (Hammitt and Zhou, 2006; Wang and Zhang,2009). That is, people with higher SES have more power tocarry out their plans and achieve their goals. We alsopostulate that individuals with higher SES have higher levels ofEK, PHR, and CHC than individuals with lower SES (Diamantopou-los et al., 2003; Kahn et al., 2009; Kim et al., 2017a; Ogunbode andArnold, 2012).
Following the contingent valuation literature, respondents’sociodemographic characteristics, such as age, age square, familysize, gender, family health experience, work environment, andproximity to the pollution source were all assumed to be importantdeterminants of their BI for improving air quality. This is becauseeach has been shown to be a valid predictor of BI aimed at reducingthe negative health effects caused by environmental degradation(Abdalla et al., 1992; Bresnahan et al., 1997; Harrington et al., 1989;Laughland et al., 1996; Um et al., 2002). Moreover, EK, PHR, CHC,and SES are all postulated as endogenous and influenced byrespondents’ sociodemographic characteristics (Kim et al., 2017a,2017b; Li et al., 2016, 2014).
In terms of Eqs. (1)–(3), the conceptual model is shown in Fig. 1and reads as follows:

Fig. 2. Heavily, moderately and lightly polluted areas of the Jinchuan mining area.Note: the dominant wind directions are from the east and south-east during summer and from west and north-west during winter.Source: JEQMR (2011), Wei (2008) and Li et al., (2014)
58 Z. Li, B. Hu / Economics and Human Biology 31 (2018) 54–68

Fig. 3. Statistics for the indicators of Behavioural intention.Note: BI1: Would you like to pay environmental taxes (e. g., raising fuel or automobile taxes) for improvement of air quality of Jinchuan. BI2: Would you like to walk or ridebicycle to work place for improvement of air quality of Jinchuan? BI3: Would you like to pay extra money per month for improvement of air quality of Jinchuan. BI4: What isthe maximum your household per month would like to pay for improvement of air quality of Jinchuan?Source: Author survey
Fig. 4. Frequency distribution of the indicators of Perceived health risk.Note: PHR1: what do you perceive as the average number of days per week Jinchuan's air was heavily polluted during the past year? PHR2: Jinchuan’s air pollution increasesthe likelihood of suffering from respiratory illnesses. PHR3: Jinchuan’s air pollution increases the likelihood of suffering from cardiovascular illnesses. PHR4: Jinchuan’s airpollution increases the likelihood of suffering from lung cancer. PHR5: Jinchuan’s air pollution increases the likelihood of suffering from death.Source: Author survey
Z. Li, B. Hu / Economics and Human Biology 31 (2018) 54–68 59
The Measurement Model
BIL1...
BIL4PHR1
..
.
PHR5EK1...
EK8CHCINEDU
2666666666666666666664
3777777777777777777775
¼
ly1 1
..
.
ly4 100...
000...
0000
0...
0ly5 2
ly6 2
..
.
ly9 200...
0000
0...
000...
0ly10 3
..
.
ly17 3000
0...
000...
000...
0100
0...
000...
000...
00
ly19 5
ly20 5
266666666666666666666666664
377777777777777777777777775
�
BIPHREKCHCSES
266664
377775þ
e1...
e4e5...
e9e10...
e170e19e20
26666666666666666666664
37777777777777777777775
ð4Þ
AGEAGE2
GENFSFHEMAPSAPNMSMS
26666666666664
37777777777775
¼
100000000
010000000
001000000
000100000
000010000
000001000
000000100
000000010
000000001
26666666666664
37777777777775
�
AGEAGE2
GENFSFHEMAPSAPNMSMS
26666666666664
37777777777775
þ
000000000
26666666666664
37777777777775
ð5Þ

Fig. 5. Frequency distribution of the indicators of Environmental Knowledge.Note: EK1: Do you acknowledge that Jinchuan suffers from air pollution?. EK2: Doyou acknowledge that Jinchuan suffers from industrial solid waste? EK3: Do youacknowledge that Jinchuan suffers from water pollution? EK4: Do you acknowledgethat environmental issues in Jinchuan are mainly caused by local industrialactivities? EK5: Do you acknowledge that sulfur dioxide is one of the main airpollutants of Jinchuan? EK6: Do you acknowledge that suspended particle matter isone of the main air pollutants in Jinchuan?. EK7: Do you acknowledge that carbondioxide is one of the main air pollutants of Jinchuan? EK8: Do you acknowledge thatchlorine gas is one of the main air pollutants of Jinchuan?Source: Author survey.
4 Hukou, which is a system of household registration in mainland China, containsa person’s information (e.g., name, parents, spouse, date of birth) and can identify aperson as a resident of an area.
5 Traditionally, in psychology, people’s (environmental) behavioural intention ismeasured by asking about the likelihood of exhibiting the (environmental)behaviour in question.
60 Z. Li, B. Hu / Economics and Human Biology 31 (2018) 54–68
The Structural Model
BIPHREKCHCSES
266664
377775¼
00000
b1 20000
0b2 3000
b1 4b2 4000
b1 5b2 5b3 5b4 50
266664
377775�
BIPHREKCHCSES
266664
377775
þ
g1 1g 2 1g3 1g4 1g5 1
g1 2g2 2g4 2g4 2g5 2
g1 3g2 3g3 3g4 3g5 3
g1 4g2 4g3 4g4 4g5 4
g1 5g2 5g3 5g4 5g5 5
g1 6g2 6g3 6g4 6g5 6
g1 7g2 7g3 7g4 7g5 7
g1 8g2 8g3 8g4 8g5 8
g1 9g2 9g3 9g4 9g5 9
266664
377775
�
AGEAGE2
GENFSFHEMAPSAPNMSMS
26666666666664
37777777777775
þ
z1z2z3z4z5
266664
377775
ð6Þ
3.3. Identification
A prerequisite for estimation of Eqs. (4)–(6) is that they areidentified. One condition for the identification of Eqs. (4)–(6) isthat measurement scales should be assigned to all latent variables,including BI, PHR, EK, and SES. This can be achieved by fixing thevariances of the latent variables, usually at 1, or by fixing onemeasurement coefficient for each latent variable, usually also at 1.In our study, we apply the first method (Byrne, 2013; Hoyle, 2011).
Apart from assigning measurement scales to latent variables,the order and rank conditions also need to be met for identifica-tion. The latter may be tedious to check. However, estimation ofEqs. (4)–(6) can be done by a variety of software packages, of whichLISREL 8 (Jöreskog and Sörbom, 1996) and Mplus (Muthén andMuthén, 2010) are probably the best known and can giveindications of the identification problems of Eqs. (4)–(6) byevaluating the information matrix at the minimum of the fittingfunction. If the estimated information matrix is singular, Eqs. (4)–
(6) are not identified (Silvey, 1975). Moreover, LISREL 8 and Mpluscan also be used to obtain modification indices, which makesuggestions about model improvement by freeing fixed or con-strained parameters.
4. Empirical results
4.1. Survey and data collection
The survey data were collected from the Jinchuan mining areain Gansu Province, China, in August 2012. Because the question-naire was eight pages long, face-to-face interviews were con-ducted. Before the survey, a pilot survey was carried out. Thequestionnaire was adjusted, corrected, and reworded based on theresults of the pilot survey. Interviewers were trained and selectedfrom a group of college students at Gansu Nonferrous MetallurgyCollege in Jinchuan based on their understanding of theenvironmental issues in Jinchuan and of the local language.
The sample was stratified and selected from permanentresidents of Jinchuan who had ‘Hukou’4 and had lived in this areafor at least 10 years. Interviewees were family heads and wereabove 21 years of age. The data were collected in two steps. First,the Jinchuan mining area was divided into three sub-areas basedon the level of air pollution (corresponding to the distance from thelocal smelting plants): severely polluted, moderately polluted, andlightly polluted (JEQMR, 2011; Wei, 2008; see Fig. 2). Second, theinterviewees in each area were randomly selected. One or twohouseholds per 100 households were selected; thus the proportionof interviewees from each area represented the area's proportionof the overall region. The total sample size was 759. The responserate was about 90%, which is high but not uncommon in China (seeGrant et al., 2004; Zhang et al., 2008). Moreover, apart fromquestions on socioeconomic and demographic characteristics,interviewees were also questioned about their EK, PHR, and BI forimproving air quality (see Figs. 3–5 for details).
4.2. Descriptive statistics
From our 800 questionnaires, 41 (5.12%) were rejected becausethey were incomplete. There was no evidence of nonrandomdropout. Descriptive statistics are presented in Table 1 and Figs. 3,4, and 5.
Four indicators were developed to measure Jinchuan residents’BI for improving air quality.5 First, respondents’ intention forimproving air quality was tested by two noncontingent valuationquestions (BI1 and BI2), which are indicated in Fig. 3. As also shownin Fig. 3, over 80% of the respondents would like to take actions toimprove the air quality of Jinchuan by paying an environmental taxor using environmentally friendly transportation. Second, Jinchuanresidents’ WTP for improving air quality (contingent valuationscenario) was elicited by another two questions (BI3 and BI4). Eachrespondent was first asked whether he or she would like to payextra money per month to improve Jinchuan’s air quality. A 5-pointscale ranging from 1 (certainly not) to 5 (certainly yes) was used toanswer this question. If respondents did not answer ‘certainly not’or ‘not’, an initial bid amount was randomly selected from a set ofinitial values. The respondent was then asked a follow-up question,for which the bid amount depended on his or her response to the

6 Weighted least squares (WLS), sometimes called inverse probability weighting,eliminates the need for exclusion restrictions, though WLS does require the modelto satisfy the ignorability assumption (Wooldridge, 2002). That is, under the keyassumption that selection bias is ignorable, an inverse probability weightingscheme generally provides extra information and identifies the populationparameters (Blundell and Powell, 2007; Fitzgerald et al., 1998; Khan and Lewbel,2007).
Table 2Overall goodness- of -fit indices.
Fit index Value Cut off value
χ2/DF 1.20 <3.00Goodness-of-fit index(GFI) 0.97 >0.90Adjusted goodness-of-fit index (AGFI) 0.96 >0.90Standardized root mean square residual (SRMR) 0.031 <0.08Root mean square error of approximation (RMSEA) 0.045 <0.08
Z. Li, B. Hu / Economics and Human Biology 31 (2018) 54–68 61
initial bid. If he or she responded ‘yes’ to the initial bid, the follow-up bid was twice as large as the initial bid; if he or she responded‘no’ to the initial bid, the follow-up bid was half as large as theinitial bid. Following the two dichotomous-choice questions, wefinally asked respondents to state their maximum WTP forimproving the air quality of Jinchuan (Hammitt and Zhou,2006). Fig. 3 shows that a large majority (approximately 80%) ofrespondents would be willing to pay extra money for improving airquality (BI3) and that their maximum WTP varies between 0 to1000 CNY per month, with a mean value of 102 CNY.
Following Sjöberg et al. (2004) and Egondi et al. (2013), twodomains of Jinchuan residents’ PHR caused by air pollution wereexamined; perceived risks caused by exposure in density and thehazardousness of pollutants were measured by asking participantsto express their opinions and answer five questions. For theperceived risk of exposure in density, respondents were asked toanswer the following question: What is the average number of daysper week you perceived the air in Jinchuan to be heavily pollutedduring the past year? Fig. 4 shows that the majority (62.1%)answered ‘medium polluted’ (2 or 3 days a week), whereas someanswered ‘lightly polluted’ (0 or 1 day a week, 18.3% ofrespondents) and ‘heavily polluted’ (4 or more days a week,19.6% of respondents). Regarding the perceived risk caused byhazardous pollutants, respondents were asked their opinion aboutthe extent to which Jinchuan’s air pollution increased theprobability of suffering from four major types of health problems.A 5-point scale was used, with 1 indicating ‘strong negativeopinion’ and 5 indicating ‘strong positive opinion’. The resultsshowed that the rank of perceived impacts from serious to lightwere respiratory illnesses (95.9%), lung cancer (83.6%), cardiovas-cular illnesses (75%), and death (73.1%).
Respondents’ knowledge concerning Jinchuan’s environmen-tal issues was measured by eight indicators (Fig. 5). Each indicatorwas measured on a 5-point scale ranging from 1 (stronglydisagree) to 5 (strongly agree). The first three indicators (EK1–EK3) tested respondents’ knowledge of general environmentalissues in Jinchuan. As can be seen from Fig. 5, over 80% of therespondents agreed or strongly agreed that air pollution,industrial solid waste, and water pollution are environmentalissues affecting Jinchuan. Moreover, 93.2% believed that Jin-chuan’s environmental problems are mainly caused by localindustrial activities (EK4). Another four indicators were devel-oped to measure people’s knowledge of the main pollutants inJinchuan’s air. Fig. 5 shows that over 55% of the respondentseither strongly agreed or agreed that chlorine gas, sulphurdioxide, suspended particles, and carbon dioxide are the mainpollutants of Jinchuan’s air.
Before going into detail, we emphasize that in order tofacilitate comparison of the effects of different variables,estimated coefficients were standardized or beta coefficient.Standardized coefficients, which can be directly compared, givethe standard deviation change in a dependent variable due to astandard deviation change of an explanatory variable. Asmentioned above, BI is a latent variable measured by fourindicators: BI1, BI2, BI3, and BI4 (see Fig. 3 for definitions). Toobtain percentage changes of people’s WTP for improving airquality (BI4), we took natural logarithms of its scores andrelabelled it as BIL4. As some outcomes of BI4 are equal to zero,we increased all scores by 1. Hence BIL4 = ln (BI4 + 1). Note that wealso relabelled BI1, BI2, and BI3 as BIL1, BIL2, and BIL3, respectively,but did not log-transform them.
Figs. 3–5 show that thecategorical indicators of BI, PHR,and EK arehighly skewed and nonnormally distributed. Therefore, weightedleast squares based on the matrix of polychoric correlations wasemployed to estimate Models (4)–(6). As a first step, the fullconceptual model (Initial Model) presented by Eqs. (4)–(6) was
estimated.6 The estimated results of the measurement models ofthe Initial Model (see Tables A1–A3 in Appendix A) show that thereliability of PHR1 was very low (0.02), and this indicates that PHR1measures a different dimension from the other four indicators(PHR2–PHR5; Bollen, 1989). Therefore, the latent variable PHR wassplit into two latent variables: (a) PHR caused by the intensity ofexposure (Exposure) and (b) PHR caused by the hazardousness ofpollutants (Hazardousness). Exposure was measured by PHR1, andHazardousness was measured by PHR2–5. Note that this split wassupported by Sjöberg et al. (2004) and Egondi et al. (2013).
Another outcome of the estimated Initial Model was thatseveral explanatory variables of five endogenous variables werehighly insignificant. We deleted the variables with insignificantcoefficients in a stepwise procedure, starting with the one with thelargest p-value (stepwise backward elimination). This gave us theFinal Model. (For illustrative purposes, we also included some ofthe insignificant variables in the Final Model [see Table 4].) Wediscuss the Final Model below.
The overall goodness-of-fit indices of the Final Model arepresented in Table 2, that is, the χ2/DF (DF denoting degrees offreedom), the Goodness-of-Fit statistic (GFI), the AdjustedGoodness-of-Fit statistic (AGFI), the Standardized Root MeanSquare Residual (SRMR) and the Root Mean Square Error ofApproximation (RMSEA) (see Byrne, 1998; Jöreskog and Sörbom,1996; Ouyang, 2009). All the indices met their critical values,indicating that the Final Model had a good fit.
The estimated measurement models are presented in Table 3,which contains, for each indicator, its loadings, standard error, and
reliability (R2). Table 3 indicates that the loadings of all indicatorsare significant at 1% or less.
The structural model is presented in Table 4. It shows thatHazardousness positively and significantly influences people’s BI forimproving air quality. However, the impact of PHR due to Exposureon BI is highly insignificant. This indicatesthat Jinchuan residents’ BIfor improving air quality is not sensitive to the level of exposure.However, their perception of health risk caused by hazardous airpollutants, which is the perception of the negative outcome of airpollution, motivates them to take actions to reduce correspondinghealth risks. Moreover, CHC, as hypothesized, significantly andpositively impacts BI for improving air quality; however, its indirectimpact on BI via PHR is insignificant. In line with the conceptualmodel, EK positively and significantly influences latent PHR.
In line with Wang and Zhang (2009), SES positively andsignificantly influences people’s BI for improving air quality.Moreover, the positive impacts of SES on CHC and EK suggest thatindividuals with higher SES can have better health status and canacquire a better understanding of the nature of environmentalissues, including those in Jinchuan (Diamantopoulos et al., 2003;Kahn et al., 2009; Lee et al., 2009; Ogunbode and Arnold, 2012).

Table 3Measurement model.
Latent variables Indicators Coefficient Standard errors R-square
Behavioral intention (BI) BHL1 0.41 0.04 0.17BHL2 0.32 0.05 0.10BHL3 0.51 0.04 0.26BHL4 0.30 0.04 0.09
Exposure PHR1 1.00 0.02 1.00Hazardousness PHR2 0.60 0.03 0.36
PHR3 0.52 0.03 0.27PHR4 0.62 0.03 0.38PHR5 0.55 0.03 0.30
Environmental knowledge (EK) EK1 0.52 0.04 0.27EK2 0.46 0.03 0.22EK3 0.39 0.03 0.15EK4 0.48 0.04 0.23EK5 0.55 0.04 0.31EK5 0.46 0.03 0.22EK7 0.31 0.03 0.09EK8 0.44 0.03 0.19
Socioeconomic status (SES) Education 0.47 0.05 0.19Income 0.43 0.04 0.24
Table 4Structural model.
Variables BI Exposure Hazardousness EK CHC SES
Behavoiural intention (BI)Exposure 0.03
(0.04)Hazardousness 0.13**
(0.05)Environmentalknowledge (EK)
0.14*** 0.67***(0.03) (0.09)
Current health condition (CHC) 0.11***(0.04) (0.02) (0.04)
Socioeconomic status (SES) 0.42*** 0.05 0.09 0.43*** 0.14***(0.10) (0.04) (0.07) (0.08) (0.04)
Age (AGE) 0.07** 0.07** -0.12***(0.03) (0.03) (0.02) (0.03)
Age-square (AGE2) 0.02 0.03(0.03) (0.03) (0.02) (0.03)
Gender (GEN) -0.05*** 0.01(0.03) (0.02) (0.03)
Family size (FS) -0.06* -0.08*** 0.12***(0.03) (0.03) (0.02) (0.03)
Family healthexperience (FHE)
0.01 0.05 -0.20***(0.03) (0.03) (0.02) (0.03)
Medium air pollution (MAP) 0.02 0.09*** 0.05 0.01 -0.19***(0.05) (0.02) (0.04) (0.04) (0.02) (0.05)
Severe air pollution (SAP) 0.10** 0.20*** 0.03 0.10* 0.01 -0.32***(0.04) (0.02) (0.04) (0.04) (0.03) (0.05)
JMC employee, but not miner or smelter worker (NMS) 0.03 -0.15*** 0.43***(0.05) (0.03) (0.05)
Miners and smelter workers of JMC (MS) 0.11* -0.15*** 0.22***(0.05) (0.03) (0.05)
R-square 0.26 0.05 0.52 0.19 0.08 0.27
Notes: Standard errors in parenthesis. *, **and *** :10%, 5% and 1% level, respectively.
62 Z. Li, B. Hu / Economics and Human Biology 31 (2018) 54–68
We now turn to the sociodemographic characteristics. Age andage square both positively influence BI for improving air quality,although age square was not significant, indicating that Jinchuan’selders have a stronger intention for improving air quality to makelife safer for themselves than do younger people (Firoozzarea andGhorbani, 2011). Family size has a negative influence on BI forimproving air quality; this shows that a larger family has relativelyless intention to improve air quality because of the associatedrunning costs (i.e., budgetary constraints; Belhaj Fraj, 2003 Moffat,2011). Proximity to the pollution source, as measured by twodummies-medium air pollution and severe air pollution (light airpollution is the reference case)-had a positive impact on BI forimproving air pollution, but only severe air pollution was
significant. Apparently, people living farther away from smeltingplants are less exposed to air pollution than those who live nearbyand would like to take less action to reduce air pollution (Bickerstaffand Walker, 2001; Combest-Friedman et al., 2012; Riddel and Shaw,2006). Work environment, family health experience, and gender arenot important determinants of BI for improving air quality.
In addition to EK, family size significantly influences Hazard-ousness, indicating that a larger family implies a bigger capacity toabsorb risks (Ajetomobi and Binuomote, 2006; Amaefula et al.,2012). Moreover, the estimated results show that proximity to thepollution source positively influence Exposure and Hazardousness,although the latter is insignificant. The rationale is that respond-ents who live farther away from smelting plants are less exposed to

Table 5Total effects.
Variables BI Exposure Hazardousness EK CHC SES
Behavoiural intention (BI)Exposure 0.03
(0.04)Hazardousness 0.13** `
(0.05)Environmental knowledge(EK) 0.09** 0.14*** 0.67***
(0.04) (0.03) (0.09)Current health condition (CHC) 0.11***
(0.04) (0.02) (0.04)Socioeconomic status (SES) 0.48*** 0.11*** 0.38*** 0.43*** 0.14***
(0.08) (0.03) (0.09) (0.08) (0.04)Age (AGE) 0.02 0.02 -0.03* -0.12***
(0.03) (0.01) (0.02) (0.03) (0.02) (0.03)
Age-square (AGE2) 0.02 -0.04**(0.03) (0.01) (0.02) (0.03) (0.02) (0.03)
Gender (GEN) -0.07* 0.01 0.01 0.01 -0.05** 0.01(0.03) (0.01) (0.02) (0.02) (0.02) (0.03)
Family size (FS) 0.01** 0.05** 0.01 0.12***(0.03) (0.00) (0.01) (0.01) (0.01) (0.03)
Family health experience (FHE) 0.01 0.05 -0.20***(0.03) (0.01) (0.03) (0.01) (0.02) (0.03)
Medium air pollution (MAP) -0.07*** 0.07*** -0.08* -0.20***(0.02) (0.02) (0.05) (0.05) (0.04) (0.02)
Severe air pollution (SAP) -0.04** 0.17*** -0.32***(0.02) (0.02) (0.05) (0.04) (0.02) (0.05)
JMC employee, but not miner or smelter worker (NMS) 0.19*** 0.05*** 0.18*** 0.21*** -0.09*** 0.43***(0.04) (0.01) (0.05) (0.05) (0.03) (0.05)
Miners and smelter workers of JMC (MS) 0.10*** 0.04*** 0.16*** 0.20** -0.12*** 0.20**(0.03) (0.01) (0.04) (0.05) (0.03) (0.05)
Notes: Standard errors in parenthesis. *, **and *** :10%, 5% and 1% level, respectively.
Z. Li, B. Hu / Economics and Human Biology 31 (2018) 54–68 63
air pollution and have a lower level of risk perception than thosewho live nearby (Bickerstaff and Walker, 2001; Combest-Friedmanet al., 2012; Riddel and Shaw, 2006).
The positive effect of age on EK suggests that older individuals-who in virtually all cases have spent most of their lives in Jinchuan-have better knowledge of Jinchuan’s environmental issues (AlKhamees and Alamari, 2009; Aminrad et al., 2011). EK is alsopositively and significantly associated with proximity to thepollution source and the work environment. Apparently, higherobjective air pollution exposure levels, particularly for people wholive close to smelting plants or work in a highly polluted miningfacility, have stronger motivation to learn about Jinchuan’senvironmental issues. In addition, for Jinchuan Mining Company(JMC) employees, especially miners and smelter workers, this ispossibly because they know more about the input and output ofthe smelting process7 than do non-JMC individuals (Doria Mdeet al., 2009; Juang et al., 2010).
CHC links to work environment with the JMC staff being morelikely to report worse health status than other citizens in theJinchuan mining area. This suggests that higher air pollutantexposure in workplaces will lead to worse health status (Kim et al.,2017a, b; Isen et al., 2017). Major gender differences in self-reported health status are also found in our study, as men reportedbetter health status than women. This is possibly because womenhave a lower pain threshold and tolerance, a greater ability todiscriminate, and a propensity to assign higher pain ratings(Berkley, 1997). Family health experience negatively influencesindividuals’ CHC, indicating that an individual’s self-reportedhealth status is strongly correlated with family members’ healthstatus. This is because individual and family members can sharethe social environment, including functional relationships such ascaregiving, as well as socioeconomic circumstances, such asincome and wealth, which are linked to barriers and opportunities
7 JMC is the source of Jinchuan’s environmental issues.
for healthy living and improved individual health status (Rausa,2008; Walsh, 1996). This is in line with the positive effect of familysize on the family head’s SES.
Age and age square both negatively influence SES, suggesting thatyoung people in the Jinchuan mining area have a higher SES. This ispossibly because young people have been the recipients of bettereducation and older adults have fewer options for continuedincome. Older adults are at risk of rising costs of living, which mayplace them at an economic disadvantage and potentially at lowerSES levels (Butrica et al., 2008; Cahill et al., 2013). SES is negativelyand significantlycorrelated with proximity to the pollution sources,showing that areas where low-SES communities live experience ahigher concentration of air pollutants. One possible explanation forlow-level exposure being linked to higher SES is that people with ahigher SES level have a greater capacity to live in low-pollution areas(Maas et al., 2006). We also found that JMC staff members had ahigher SES level than non-JMC individuals; this is becauseindividuals working at JMC earn a higher salary due to the harshwork environment. Moreover, JMC has a higher concentration ofhighly educated individuals who are employed to operate advancedmining and smelting devices (Jinchuan Yearbook, 2012).
Table 5 and Table 6 present the standardized total and indirecteffects of all variables on all endogenous variables. Specifically, theindirect effect is the effect of an endogenous or exogenous variableon an endogenous variable through intervening endogenousvariables, and the total effect is the sum of the direct and indirecteffects (Jöreskog and Sörbom, 1996). At first glance, Table 5indicates that SES is the most important determinant of BI, with atotal effect of 0.48. Next is Work environment. Hazardousness andCHC significantly influence BI, with total effects of 0.13 and 0.11,respectively. Gender significantly influences BI, with a total effectof -0.07. Proximity to the pollution source significantly andnegatively affects BI. Age, family health experience, and familysize have insignificant total effects on BI.
EK has the largest total effect on Hazardousness (0.67),followed by SES (0.38). Work environment significantly influences

Table 6Indirect effects.
Variables BI Exposure Hazardousness EK CHC SES
Behavoiural intention (BI)Exposure
Hazardousness
Environmental knowledge(EK) 0.09**(0.05)
Current health condition (CHC) 0.01(0.01)
Socioeconomic status (SES) 0.06** 0.06*** 0.29***(0.02) (0.02) (0.07)
Age (AGE) -0.05*** 0.01 -0.05** -0.02**(0.02) (0.01) (0.02) (0.01) (0.01)
Age-square (AGE2) 0.01(0.02) (0.01) (0.02) (0.01) (0.01)
Gender (GEN) 0.01 0.01 0.01 0.01(0.02) (0.01) (0.02) (0.02) (0.02)
Family size (FS) 0.05** 0.01** 0.05*** 0.05*** 0.02(0.02) (0.00) (0.02) (0.02) (0.01)
Family health experience (FHE) 0.01(0.02) (0.01) (0.02) (0.01) (0.01)
Medium air pollution (MAP) -0.09*** -0.02* -0.07* -0.08*** -0.03***(0.03) (0.01) (0.04) (0.02) (0.01)
Severe air pollution (SAP) -0.14*** -0.14*** -0.05***(0.03) (0.01) (0.04) (0.03) (0.01)
JMC employee, but not miner or smelter worker (NMS) 0.19*** 0.05*** 0.18*** 0.18*** 0.06***(0.04) (0.01) (0.05) (0.03) (0.02)
Miners and smelter workers of JMC (MS) 0.10*** 0.04*** 0.15*** 0.09*** 0.03**(0.03) (0.01) (0.04) (0.03) (0.01)
Notes: Standard errors in parenthesis. *, **and *** :10%, 5% and 1% level, respectively.
64 Z. Li, B. Hu / Economics and Human Biology 31 (2018) 54–68
Hazardousness. Proximity to the pollution source is the mostimportant determinant of Exposure, followed by EK, SES, and workenvironment. Family size affects Exposure, with a total effect of 0.01.
SES is the most important determinant of EK, with a total effectof 0.43. JMC employees but not miners or smelter workers (NMS)and miners and smelter workers (MS) have better EK thanindividuals not affiliated with the mining company, with totaleffects of 0.21 and 0.20, respectively. Family size influences EK,with a total effect of 0.05.
Family health experience is the most important determinant ofCHC, with a total effect of -0.20. Next is SES, with a total effect of0.14. NMS and MS negatively and significantly influence CHC, withtotal effects of -0.09 and -0.12, respectively. Age and gendernegatively and significantly influence CHC, with total effects of-0.03 and -0.05, respectively.
NMS and MS have higher SES than individuals who are notaffiliated with JMC, with total effects of 0.43 and 0.20, respectively.People living in lightly polluted areas have a higher SES level. Ageand family size influence SES, with total effects of 0.12 and 0.12,respectively.
We now turn to people’s WTP for improving air quality, which isthe fourth indicator of BI. The total effects of variables on WTP basedon our SEM model are presented in Table 7. Further, to illustrate itsstrengths relative to conventional contingent valuation approaches,we compared the SEM results to the estimate of the reduced formmodels without latent exogenous variables (see Table 7).
In Table 7, the R-square and adjusted R-square of WTP (SEM) are0.098 and 0.08, which are two times more than the R-square of
8 The R square of WTP is low. Note that low R squares are quite common in cross-section analyses in social science. Although a low R square indicates that manyother factors than the ones included in the model affect the dependent variable, itdoes not necessarily mean a poor estimation of the ceteris paribus relationshipsbetween the dependent variable and explanatory variables (Wooldridge, 2012).That is, if the zero conditional mean assumption is met, then the estimator of theimpacts of the explanatory variables on the dependent variable is unbiased.
WTP without the latent variables counterparts of 0.04 and 0.03,respectively. These results indicate that SEM has more explanatorypower than its alternative. Another important difference is that incontrast to SEM, where gender, work environment, and proximityto the pollution source are significant, they are not significant inthe reduced form model. This demonstrates that SEM providesmore information on how people’s sociodemographic character-istics influence their intentions for improving air quality than itsalternative. However, the most important difference between thetwo classes of models is that SEM provides information on theimpacts of Hazardousness and EK on WTP, which is instrumental forpolicy design, as shown in the conclusions.
5. Summary and conclusions
To increase the understanding of contingent valuation results,this study took the theory of planned behaviour as a context andconsidered WTP as the indicator of behavioural intention toexamine responses obtained through a CVM (Rekola and Pouta,2005). Based on a cross-section data set of 759 households in theJinchuan mining area, we assessed Jinchuan residents’ behaviouralintention for improving air quality. The primary focus of this paperwas the impact of internal psychological factors-notably, perceivedhealth risk and environmental knowledge-on people’s WTP forimproving air quality. We considered the effects of both subjectiveand objective measures of health risk caused by air pollution onWTP.
Our main finding was that Jinchuan residents have a strongwillingness to reduce air pollution. Over 80% of the respondentswere found willing to pay an environmental tax or to takeenvironmentally friendly transportation, and approximately 80%of residents were found willing to spend extra money each monthto reduce air pollution.
Another important finding was that psychological factors,notably PHR and EK in CVM, increased the explanatory power ofWTP. PHR, EK, gender, SES, proximity to the pollution source, work

Table 7Total effects of variables on WTP.
Variables WTP(SEM)
WTPwithout latent variables
Behavoiural intention (BI) 0.42***(0.04)
Exposure 0.01(0.02)
Hazardousness 0.05 **(0.02)
Environmental knowledge (EK) 0.04 **(0.02)
Current health condition (CHC) 0.05** 0.10***(0.02) (0.02)
Socioeconomic status (SES) 0.21***(0.03)
Income 0.06***(0.02)
Education 0.10***(0.02)
Age (AGE) 0.01 -0.03(0.01) (0.02)
Age-square () 0.01 -0.02(0.01) (0.02)
Gender (GEN) -0.03* -0.03(0.01) (0.02)
Family size (FS) -0.01 0.01(0.01) (0.02)
Family health experience (FHE) 0.01 0.03(0.01) (0.02)
Medium air pollution (MAP) 0.01 -0.04(0.02) (0.03)
Severe air pollution (SAP) 0.07** 0.02(0.02) (0.03)
Miners and smelter workers of JMC (MS) 0.08*** 0.01(0.01) (0.03)
JMC employee, but not miner or smelterworker (NMS)
0.04*** 0.01(0.01) (0.04)
R-square 0.09 0.04Adjust R-square 0.08 0.03
Notes: Standard errors in parenthesis. *, **and ***:10%, 5% and 1% level, respectively.
Z. Li, B. Hu / Economics and Human Biology 31 (2018) 54–68 65
environment, and CHC are important determinants of WTP. Inparticular, two domains of PHR-perceived risk caused by exposurelevel and hazardous pollutants-are positively correlated withpeople’s intention to improve air quality. However, only anassessment based on final negative outcomes caused by air
p-
Table A1Measurement model.
Latent variables Indicators
Behavioral intention (BI) BHL1
BHL2
BHL3
BHL4
Perceived health risk (PHR) PHR1
PHR2
PHR3
PHR4
PHR5
Environmental knowledge (EK) EK1
EK2
EK3
EK4
EK5
EK5
EK7
EK8
Socioeconomic status (SES) Education
Income
ollution (Hazardousness) significantly influenced WTP. This indi-cates that Jinchuan residents are sensitive to the perception ofnegative health outcomes caused by air pollution rather than to theexposure level. This may also suggest that our results can be seen asa behavioural intention targeted at a proposed policy for improvingair quality and as an expression of people’s understanding andassessment of air pollution.
Evidence from this study also suggests that reducing airpollution is an important policy measure to improve people’swelfare. PHR has significant effects on BI for improving air quality.Moreover, we found that EK is an important moderator of BI.Therefore, information on air pollution should be disclosed to thepublic. For this purpose, a new environmental managementinstitution, which includes government, scientific institutions,the mining and smelting company, and citizens’ organizations,should be created. The institution should respond to publicconcerns and stimulate dialogue and cooperation betweenparticipants.
The present study can be extended in several ways because itfocuses on only the relationship between air pollution and people’sbehavioural intention for improving air quality. However, apartfrom air pollution, nickel industries also cause water pollution andsolid waste in the Jinchuan region. It would be interesting toanalyse how overall environmental degradation affects people’s BIfor improving environmental quality. Further, it would beinteresting and important, both from a theoretical and a policyperspective, to further develop the notions of BI, family healthexperience, PHR, and EK and to test their indicators.
Funding
This study was funded by MOE (Ministry of Education in China)Project of Humanities and Social Sciences (ProjectNo.17YJC790087).
Conflict of interest
We declare that we have no conflict of interest.
Appendix A. The estimated Initial model
Coefficient Standard errors R-square
0.41 0.04 0.170.32 0.05 0.100.51 0.04 0.260.30 0.04 0.090.16 0.03 0.020.60 0.03 0.360.52 0.03 0.270.62 0.03 0.380.55 0.03 0.300.52 0.04 0.260.46 0.03 0.240.39 0.03 0.180.48 0.04 0.220.55 0.04 0.300.46 0.03 0.230.31 0.03 0.120.44 0.03 0.190.45 0.05 0.220.43 0.04 0.18
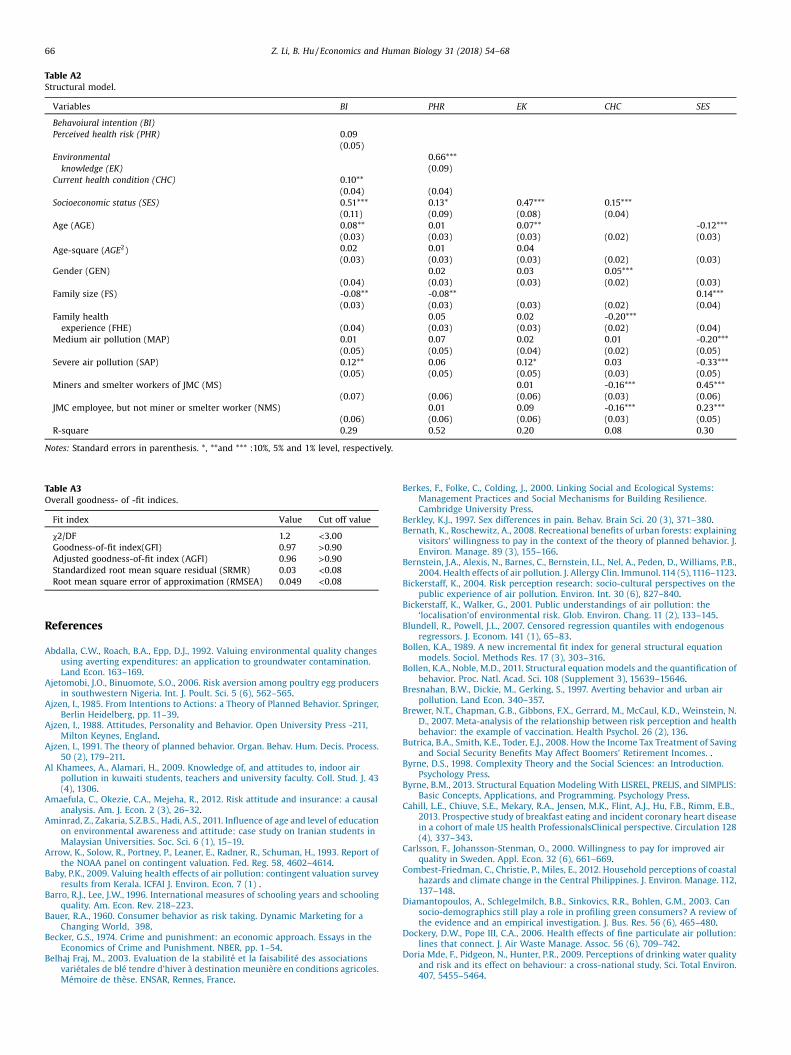
Table A2Structural model.
Variables BI PHR EK CHC SES
Behavoiural intention (BI)Perceived health risk (PHR) 0.09
(0.05)Environmentalknowledge (EK)
0.66***(0.09)
Current health condition (CHC) 0.10**(0.04) (0.04)
Socioeconomic status (SES) 0.51*** 0.13* 0.47*** 0.15***(0.11) (0.09) (0.08) (0.04)
Age (AGE) 0.08** 0.01 0.07** -0.12***(0.03) (0.03) (0.03) (0.02) (0.03)
Age-square (AGE2) 0.02 0.01 0.04(0.03) (0.03) (0.03) (0.02) (0.03)
Gender (GEN) 0.02 0.03 0.05***(0.04) (0.03) (0.03) (0.02) (0.03)
Family size (FS) -0.08** -0.08** 0.14***(0.03) (0.03) (0.03) (0.02) (0.04)
Family healthexperience (FHE)
0.05 0.02 -0.20***(0.04) (0.03) (0.03) (0.02) (0.04)
Medium air pollution (MAP) 0.01 0.07 0.02 0.01 -0.20***(0.05) (0.05) (0.04) (0.02) (0.05)
Severe air pollution (SAP) 0.12** 0.06 0.12* 0.03 -0.33***(0.05) (0.05) (0.05) (0.03) (0.05)
Miners and smelter workers of JMC (MS) 0.01 -0.16*** 0.45***(0.07) (0.06) (0.06) (0.03) (0.06)
JMC employee, but not miner or smelter worker (NMS) 0.01 0.09 -0.16*** 0.23***(0.06) (0.06) (0.06) (0.03) (0.05)
R-square 0.29 0.52 0.20 0.08 0.30
Notes: Standard errors in parenthesis. *, **and *** :10%, 5% and 1% level, respectively.
Table A3Overall goodness- of -fit indices.
Fit index Value Cut off value
χ2/DF 1.2 <3.00Goodness-of-fit index(GFI) 0.97 >0.90Adjusted goodness-of-fit index (AGFI) 0.96 >0.90Standardized root mean square residual (SRMR) 0.03 <0.08Root mean square error of approximation (RMSEA) 0.049 <0.08
66 Z. Li, B. Hu / Economics and Human Biology 31 (2018) 54–68
References
Abdalla, C.W., Roach, B.A., Epp, D.J., 1992. Valuing environmental quality changesusing averting expenditures: an application to groundwater contamination.Land Econ. 163–169.
Ajetomobi, J.O., Binuomote, S.O., 2006. Risk aversion among poultry egg producersin southwestern Nigeria. Int. J. Poult. Sci. 5 (6), 562–565.
Ajzen, I., 1985. From Intentions to Actions: a Theory of Planned Behavior. Springer,Berlin Heidelberg, pp. 11–39.
Ajzen, I., 1988. Attitudes, Personality and Behavior. Open University Press -211,Milton Keynes, England.
Ajzen, I., 1991. The theory of planned behavior. Organ. Behav. Hum. Decis. Process.50 (2), 179–211.
Al Khamees, A., Alamari, H., 2009. Knowledge of, and attitudes to, indoor airpollution in kuwaiti students, teachers and university faculty. Coll. Stud. J. 43(4), 1306.
Amaefula, C., Okezie, C.A., Mejeha, R., 2012. Risk attitude and insurance: a causalanalysis. Am. J. Econ. 2 (3), 26–32.
Aminrad, Z., Zakaria, S.Z.B.S., Hadi, A.S., 2011. Influence of age and level of educationon environmental awareness and attitude: case study on Iranian students inMalaysian Universities. Soc. Sci. 6 (1), 15–19.
Arrow, K., Solow, R., Portney, P., Leaner, E., Radner, R., Schuman, H., 1993. Report ofthe NOAA panel on contingent valuation. Fed. Reg. 58, 4602–4614.
Baby, P.K., 2009. Valuing health effects of air pollution: contingent valuation surveyresults from Kerala. ICFAI J. Environ. Econ. 7 (1) .
Barro, R.J., Lee, J.W., 1996. International measures of schooling years and schoolingquality. Am. Econ. Rev. 218–223.
Bauer, R.A., 1960. Consumer behavior as risk taking. Dynamic Marketing for aChanging World, 398.
Becker, G.S., 1974. Crime and punishment: an economic approach. Essays in theEconomics of Crime and Punishment. NBER, pp. 1–54.
Belhaj Fraj, M., 2003. Evaluation de la stabilité et la faisabilité des associationsvariétales de blé tendre d’hiver à destination meunière en conditions agricoles.Mémoire de thèse. ENSAR, Rennes, France.
Berkes, F., Folke, C., Colding, J., 2000. Linking Social and Ecological Systems:Management Practices and Social Mechanisms for Building Resilience.Cambridge University Press.
Berkley, K.J., 1997. Sex differences in pain. Behav. Brain Sci. 20 (3), 371–380.Bernath, K., Roschewitz, A., 2008. Recreational benefits of urban forests: explaining
visitors’ willingness to pay in the context of the theory of planned behavior. J.Environ. Manage. 89 (3), 155–166.
Bernstein, J.A., Alexis, N., Barnes, C., Bernstein, I.L., Nel, A., Peden, D., Williams, P.B.,2004. Health effects of air pollution. J. Allergy Clin. Immunol. 114 (5), 1116–1123.
Bickerstaff, K., 2004. Risk perception research: socio-cultural perspectives on thepublic experience of air pollution. Environ. Int. 30 (6), 827–840.
Bickerstaff, K., Walker, G., 2001. Public understandings of air pollution: the‘localisation’of environmental risk. Glob. Environ. Chang. 11 (2), 133–145.
Blundell, R., Powell, J.L., 2007. Censored regression quantiles with endogenousregressors. J. Econom. 141 (1), 65–83.
Bollen, K.A., 1989. A new incremental fit index for general structural equationmodels. Sociol. Methods Res. 17 (3), 303–316.
Bollen, K.A., Noble, M.D., 2011. Structural equation models and the quantification ofbehavior. Proc. Natl. Acad. Sci. 108 (Supplement 3), 15639–15646.
Bresnahan, B.W., Dickie, M., Gerking, S., 1997. Averting behavior and urban airpollution. Land Econ. 340–357.
Brewer, N.T., Chapman, G.B., Gibbons, F.X., Gerrard, M., McCaul, K.D., Weinstein, N.D., 2007. Meta-analysis of the relationship between risk perception and healthbehavior: the example of vaccination. Health Psychol. 26 (2), 136.
Butrica, B.A., Smith, K.E., Toder, E.J., 2008. How the Income Tax Treatment of Savingand Social Security Benefits May Affect Boomers’ Retirement Incomes. .
Byrne, D.S., 1998. Complexity Theory and the Social Sciences: an Introduction.Psychology Press.
Byrne, B.M., 2013. Structural Equation Modeling With LISREL, PRELIS, and SIMPLIS:Basic Concepts, Applications, and Programming. Psychology Press.
Cahill, L.E., Chiuve, S.E., Mekary, R.A., Jensen, M.K., Flint, A.J., Hu, F.B., Rimm, E.B.,2013. Prospective study of breakfast eating and incident coronary heart diseasein a cohort of male US health ProfessionalsClinical perspective. Circulation 128(4), 337–343.
Carlsson, F., Johansson-Stenman, O., 2000. Willingness to pay for improved airquality in Sweden. Appl. Econ. 32 (6), 661–669.
Combest-Friedman, C., Christie, P., Miles, E., 2012. Household perceptions of coastalhazards and climate change in the Central Philippines. J. Environ. Manage. 112,137–148.
Diamantopoulos, A., Schlegelmilch, B.B., Sinkovics, R.R., Bohlen, G.M., 2003. Cansocio-demographics still play a role in profiling green consumers? A review ofthe evidence and an empirical investigation. J. Bus. Res. 56 (6), 465–480.
Dockery, D.W., Pope III, C.A., 2006. Health effects of fine particulate air pollution:lines that connect. J. Air Waste Manage. Assoc. 56 (6), 709–742.
Doria Mde, F., Pidgeon, N., Hunter, P.R., 2009. Perceptions of drinking water qualityand risk and its effect on behaviour: a cross-national study. Sci. Total Environ.407, 5455–5464.

Z. Li, B. Hu / Economics and Human Biology 31 (2018) 54–68 67
Edwards, W., 1954. The theory of decision making. Psychol. Bull. 51 (4), 380.Egondi, T., Kyobutungi, C., Ng, N., Muindi, K., Oti, S., Vijver, Svd., Ettarh, R., Rocklöv, J.,
2013. Community Perceptions of Air Pollution and Related Health Risks inNairobi Slums. .
Elliott, S.J., Cole, D.C., Krueger, P., Voorberg, N., Wakefield, S., 1999. The power ofperception: health risk attributed to air pollution in an urban industrialneighbourhood. Risk analysis 19 (4), 621–634.
Firoozzarea, A., Ghorbani, M., 2011. Investigation of citizens’ WTP for Mashhad airpollution reduction: applying Heckit model5th Symposium on Advances inScience & Technology . . Retrieved Jun, 15, 2015, from http://profdoc.um.ac.ir/articles/a/1022664.pdf.
Fishbein, M., Ajzen, I., 1975. Belief, Attitude, Intention and Behavior: an Introductionto Theory and Research. .
Fitzgerald, J., Gottschalk, P., Moffitt, R.A., 1998. An Analysis of Sample Attrition inPanel Data: The Michigan Panel Study of Income Dynamics. .
Folmer, H., Nijkamp, P., 1986. Methodological Aspects of Impact Analysis of RegionalEconomic Policy. .
Gil, J.M., Soler, F., 2006. Knowledge and willingness to pay for organic food in Spain:evidence from experimental auctions. Acta Agric. Scand Sect. C 3 (3-4), 109–124.
Graefe, K.H., Ziegler, R., Wingender, W., Rämsch, K.D., Schmitz, H., 1988. Plasmaconcentration-response relationships for some cardiovascular effects ofdihydropyridines in healthy subjects. Clin. Pharmacol. Ther. 43 (1), 16–22.
Grant, B.F., Dawson, D.A., Stinson, F.S., Chou, S.P., Dufour, M.C., Pickering, R.P., 2004.The 12-month prevalence and trends in DSM-IV alcohol abuse and dependence:united States, 1991–1992 and 2001–2002. Drug Alcohol Depend. 74 (3), 223–234.
Hammitt, J.K., 2013. Admissible utility functions for health, longevity, and wealth:integrating monetary and life-year measures. J. Risk Uncertain. 47 (3), 311–325.
Hammitt, J.K., Zhou, Y., 2006. The economic value of air-pollution-related healthrisks in China: a contingent valuation study. Environ. Resour. Econ. 33 (3), 399–423.
Harrington, R.A., Brown, B.J., Reich, P.B., Fownes, J.H., 1989. Ecophysiology of exoticand native shrubs in southern Wisconsin. II. Annual growth and carbon gain.Oecologia 368–373.
Hines, J.M., Hungerford, H.R., Tomera, A.N., 1987. Analysis and synthesis of researchon responsible environmental behavior: a meta-analysis. J. Environ. Educ.18 (2),1–8.
Hoyle, R.H., 2011. Structural Equation Modeling for Social and PersonalityPsychology. SAGE Publications Ltd..
Hrubes, D., Ajzen, I., Daigle, J., 2001. Predicting hunting intentions and behavior: anapplication of the theory of planned behavior. Leis. Sci. 23 (3), 165–178.
Huang, H., Nan, Z., Hu, X., Liu, X., Li, Y., Ding, H., 2009. Spatial distributions of heavymetals and assessment of potential ecological risk in jinchang urban area.Admin. Techn. Environ. Monit. 5, 7–8 (in Chinese).
Hungerford, H.R., Volk, T.L.,1990. Changing learner behavior through environmentaleducation. J. Environ. Educ. 21 (3), 8–21.
Isen, A., Rossin-Slater, M., Walker, W.R., 2017. Every breath you take—every dollaryou’ll make: the long-term consequences of the clean air act of 1970. J. Polit.Econ. 125 (3), 848–902.
JEQMR, 2011. Jinchuan Environmental Quality Monitoring Report. JinchuanEnvironmental Protection Bureau (in Chinese).
Jinchuan Statistical Yearbook, 2012. In Chinese). Statistical Yearbook. JinchuanStatistic Bureau, Jinchuan, China.
Jöreskog, K.G., Sörbom, D., 1996. LISREL 8: User’s Reference Guide. ScientificSoftware International.
Juang, D.F., Lee, C.H., Yang, T., Chang, M.C., 2010. Noise pollution and its effects onmedical care workers and patients in hospitals. Int. J. Environ. Sci. Technol. 7 (4),705–716.
Kahn, J.A., Ding, L., Huang, B., Zimet, G.D., Rosenthal, S.L., Frazier, A.L., 2009. Mothers’intention for their daughters and themselves to receive the humanpapillomavirus vaccine: a national study of nurses. Pediatrics 123 (6), 1439–1445.
Kampa, M., Castanas, E., 2008. Human health effects of air pollution. Environ. Pollut.151 (2), 362–367.
Kerr, G., Cullen, R., 1995. Economic approaches to analysis of outdoor recreationmanagement. Outdoor Recreation in New Zealand..
Khan, S., Lewbel, A., 2007. Weighted and two-stage least squares estimation ofsemiparametric truncated regression models. Econ. Theory 23 (2), 309–347.
Kim, Y., Knowles, S., Manley, J., Radoias, V., 2017a. Long-run health consequences ofair pollution: evidence from Indonesia’s forest fires of 1997. Econ. Hum. Biol. 26,186–198.
Kim, Y., Manley, J., Radoias, V., 2017b. Medium-and long-term consequences ofpollution on labor supply: evidence from Indonesia. IZA J. Labor Econ. 6 (1), 5.
Kirscht, J.P., 1988. The health belief model and prediction of health actions. In:Gochman, D.S. (Ed.), Health Behavior: Emerging Research Perspectives (13).Plenun Press, New York.
Kitzmüller, C., 2009. Environmental Knowledge and Willingness to Change PersonalBehavior: an American-austrian Comparison of Energy Use. .
Kotchen, M.J., Reiling, S.D., 2000. Environmental attitudes, motivations, andcontingent valuation of nonuse values: a case study involving endangeredspecies. Ecol. Econ. 32 (1), 93–107.
Laughland, A.S., Musser, W.N., Shortle, J.S., Musser, L.M., 1996. Construct validity ofaverting cost measures of environmental benefits. Land Econ. 100–112.
Lee, S.A., Shu, X.O., Li, H., Yang, G., Cai, H., Wen, W., Zheng, W., 2009. Adolescent andadult soy food intake and breast cancer risk: results from the ShanghaiWomen’s Health Study. Am. J. Clin. Nutr. 89 (6), 1920–1926.
Li, Z., Folmer, H., Xue, J., 2014. To what extent does air pollution affect happiness?The case of the Jinchuan mining area, China. Ecol. Econ. 99, 88–99.
Li, Z., Folmer, H., Xue, J., 2016. Perception of air pollution in the Jinchuan MiningArea, China: a structural equation modeling approach. Int. J. Environ. Res. PublicHealth 13 (7), 735.
Li, T., Zhao, Y., 2004. The distribution and pollution analysis of the heavy metal Ni,Cu, Pb, Cd, in Jinchuan. China Environ. Manag. 2, 52–53 (in Chinese).
Louviere, J.J., Hensher, D.A., Swait, J.D., 2000. Stated Choice Methods: Analysis andApplications. Cambridge University Press.
Luzar, E.J., Cosse, K.J., 1998. Willingness to pay or intention to pay: the attitude-behavior relationship in contingent valuation. J. Soc. Econ. 27 (3), 427–444.
Maas, J., Verheij, R.A., Groenewegen, P.P., De Vries, S., Spreeuwenberg, P., 2006.Green space, urbanity, and health: how strong is the relation? J. Epidemiol.Community Health 60 (7), 587–592.
Maddux, J.E., Rogers, R.W., 1983. Protection motivation and self-efficacy: a revisedtheory of fear appeals and attitude change. J. Exp. Soc. Psychol. 19 (5), 469–479.
Marcinkowski, T.J., 1988. An Analysis of Correlates and Predictors of ResponsibleEnvironmental Behavior. .
Mendelsohn, R., Olmstead, S., 2009. The economic valuation of environmentalamenities and disamenities: methods and applications. Annu. Rev. Environ.Resour. 34, 325–347.
Menon, G., Raghubir, P., Agrawal, N., 2008. Health risk perceptions and consumerpsychology. In: Haugtveldt, Herr, Kardes (Eds.), Handbook of ConsumerPsychology, , pp. 981–1010.
Moffat, A.C., 2011. Clarke’s Analysis of Drugs and Poisons (Vol. 3). Pharmaceuticalpress, London.
Muthén, L.K., Muthén, B.O., 2010. Mplus: Statistical Analysis With Latent Variables:User’s Guide. Muthén & Muthén, Los Angeles, pp. 1998–2007.
Nauges, C., Van Den Berg, C., 2009. Demand for piped and non-piped water supplyservices: evidence from Southwest Sri Lanka. Environ. Resour. Econ. (Dordr) 42(4), 535–549.
Ng, S., Paladino, A., 2009. Examining the influences of intentions to purchase greenmobile phones among young consumers: an empirical analysis. ANZMAC 2009,212–230.
Ogunbode, C.A., Arnold, K., 2012. A study of environmental awareness and attitudesin Ibadan, Nigeria. Hum. Ecol. Risk Assessment 18 (3), 669–684.
Olah, G.A., Goeppert, A., Prakash, G.S., 2008. Chemical recycling of carbon dioxide tomethanol and dimethyl ether: from greenhouse gas to renewable,environmentally carbon neutral fuels and synthetic hydrocarbons. J. Org. Chem.74 (2), 487–498.
Oud, J.H., Folmer, H., 2008. A structural equation approach to models with spatialdependence. Geogr. Anal. 40 (2), 152–166.
Ouyang, Y., 2009. The mediating effects of job stress and job involvement under jobinstability: banking service personnel of Taiwan as an example. J. MoneyInvestig. Bank. 11, 16–26.
Rausa, B.A., 2008. Social support. Encyclopedia of Aging and Public Health. Springer,US, pp. 751–754.
Rekola, M., Pouta, E., 2005. Public preferences for uncertain regeneration cuttings: acontingent valuation experiment involving Finnish private forests. For. PolicyEcon. 7 (4), 635–649.
Richardson, L.A., Champ, P.A., Loomis, J.B., 2012. The hidden cost of wildfires:economic valuation of health effects of wildfire smoke exposure in SouthernCalifornia. J. For. Econ. 18 (1), 14–35.
Riddel, M., Shaw, W.D., 2006. A theoretically-consistent empirical model of non-expected utility: an application to nuclear-waste transport. J. Risk Uncertain. 32(2), 131–150.
Shogren, J.F., Taylor, L.O., 2008. On behavioral-environmental economics. Rev.Environ. Econ. Policy 2 (1), 26–44.
Silvey, J., 1975. Deciphering Data: the Analysis of Social Surveys. LongmanPublishing Group.
Sjöberg, L., Moen, B.-E., Rundmo, T., 2004. Explaining risk perception. An evaluationof the psychometric paradigm in risk perception research. Trondheim..
Slovic, P., 1987. Perception of risk. Science 236 (4799), 280–285.State Environmental Protection Administration (SEPA), 2006. Report on the State of
the Environment in China-2005, Section on Atmospheric EnvironmentAvailable from:. State Environmental Protection Administration, Beijing. http://english.sepa.gov.cn/ghjh/hjzkgb/200701/P020070118528407141643.pdf.
Temme, D., Paulssen, M., Dannewald, T., 2008. Incorporating Latent Variables IntoDiscrete Choice models-A Simultaneous Estimation Approach Using SEMSoftware. .
Um, M.J., Kwak, S.J., Kim, T.Y., 2002. Estimating willingness to pay for improveddrinking water quality using averting behavior method with perceptionmeasure. Environ. Resour. Econ. 21 (3), 285–300.
Vassanadumrongdee, S., Matsuoka, S., 2005. Risk perceptions and value of astatistical life for air pollution and traffic accidents: evidence from Bangkok,Thailand. J. Risk Uncertain. 30 (3), 261–287.
Walsh, F., 1996. The concept of family resilience: crisis and challenge. Fam. Process35 (3), 261–281.
Wang, T., Ding, A., Gao, J., Wu, W.S., 2006. Strong ozone production in urban plumesfrom Beijing, China. Geophys. Res. Lett. (21), 33.
Wang, Y., Zhang, Y.S., 2009. Air quality assessment by contingent valuation in Ji’nan,China. J. Environ. Manage. 90 (2), 1022–1029.
Watts, J., 2005. China: the air pollution capital of the world. The Lancet 366 (9499),1761–1762.
Wei, K., 2008. Analysis of Atmosphere Sulfur Dioxide Pollution Control andCountermeasures. Lanzhou University (in Chinese).

68 Z. Li, B. Hu / Economics and Human Biology 31 (2018) 54–68
Weinstein, N.D., 1993. Testing four competing theories of health-protectivebehavior. Health Psychol. 12 (4), 324.
Wong, E., 2013. Air pollution linked to 1.2 million premature deaths in China. NewYork Times 1 (April) .
Wooldridge, Jeffrey M., 2002. Inverse probability weighted M-estimators for sampleselection, attrition, and stratification. Port. Econ. J. 1 (2), 117–139.
Wooldridge, J., 2012. Introductory Econometrics: a Modern Approach. CengageLearning.
Xiao, M., 2003. The analysis of pollution present condition and trend of pm10 ofJinchuan’s air. Gansu Environment Monitoring and Research 16, 101–102 inChinese.
Zhang, L., Zhang, P., Wang, F., Zuo, L., Zhou, Y., Shi, Y., Wang, H., 2008. Prevalence andfactors associated with CKD: a population study from Beijing. Am. J. Kidney Dis.51 (3), 373–384.