economics and finance | electricity markets | solar energy solar market...
TRANSCRIPT
[email protected] +49 40 767 9638 0 www.suntrace.de
1
Economics and Finance | Electricity Markets | Solar Energy
Solar Market Brief: Spain
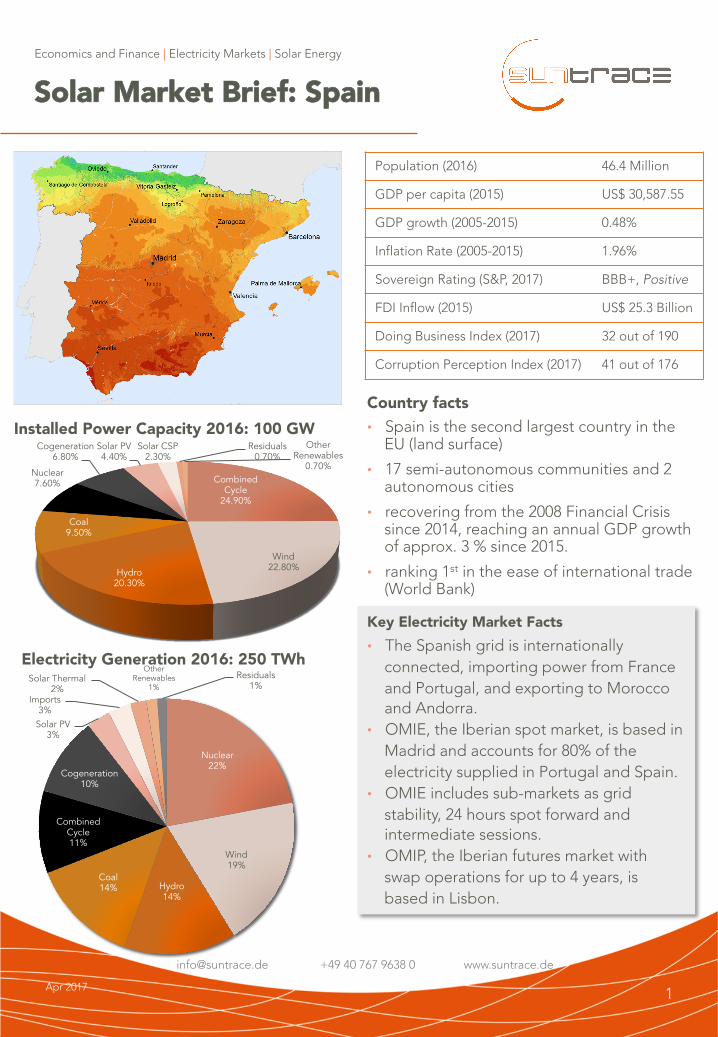
Population (2016) 46.4 Million
GDP per capita (2015) US$ 30,587.55
GDP growth (2005-2015) 0.48%
Inflation Rate (2005-2015) 1.96%
Sovereign Rating (S&P, 2017) BBB+, Positive
FDI Inflow (2015) US$ 25.3 Billion
Doing Business Index (2017) 32 out of 190
Corruption Perception Index (2017) 41 out of 176
Country facts• Spain is the second largest country in the
EU (land surface)
• 17 semi-autonomous communities and 2 autonomous cities
• recovering from the 2008 Financial Crisis since 2014, reaching an annual GDP growth of approx. 3 % since 2015.
• ranking 1st in the ease of international trade (World Bank)
Key Electricity Market Facts• The Spanish grid is internationally
connected, importing power from France and Portugal, and exporting to Morocco and Andorra.
• OMIE, the Iberian spot market, is based in Madrid and accounts for 80% of the electricity supplied in Portugal and Spain.
• OMIE includes sub-markets as grid stability, 24 hours spot forward and intermediate sessions.
• OMIP, the Iberian futures market with swap operations for up to 4 years, is based in Lisbon.
Apr 2017
Installed Power Capacity 2016: 100 GW
Nuclear 22%
Wind 19%
Hydro 14%
Coal 14%
Combined Cycle 11%
Cogeneration 10%
Solar PV 3%
Imports 3%
Solar Thermal 2%
Other Renewables
1% Residuals
1%
Electricity Generation 2016: 250 TWh
Combined Cycle
24.90%
Wind 22.80% Hydro
20.30%
Coal 9.50%
Nuclear 7.60%
Cogeneration 6.80%
Solar PV 4.40%
Solar CSP 2.30%
Residuals 0.70%
Other Renewables
0.70%

2
Key Points to Consider
• There are several opportunities: spot market, public tenders, self-generation, etc.
• A guarantee of 10,000 €/MW is required for grid access (recovered upon failure to obtain permits).
• A production tax of 7% is charged for power generation.
Apr 2017
International Trade of Electricity• Since 2012, the Spanish imports of
electricity drastically increased, thus moving its imports balance from exports of 11.2 TWh to imports of 7.3 TWh.
• main sources for imports are from France and Portugal, while Spain has been exporting to Morocco and Andorra.
OMIE (spot) & OMIP (futures)
• over the last ten years, OMIE‘s annual average prices ranged between € 40 and € 60 per MWh, even in times of the financial crisis.
• In 2016, the highest monthly average per MWh was € 60.49 (December) against a minimum of € 24.11 (April).
• At OMIP‘s futures market, it is possible to set contracts forward either per year (up to 4), per quarter, per month or per week.
• In early February 2017, contracts until 2021 were closed at a tariff of € 42.22 per MWh.
• spot (OMIE) and futures (OMIP) operations can be combined according to power sales strategy preferences.
Economics and Finance | Electricity Markets | Solar Energy
Solar Market Brief: Spain
39.95
64.43
39.96 37.01
49.93 47.23
44.26 42.13
50.32
39.67
0
10
20
30
40
50
60
70
2007 2008 2009 2010 2011 2012 2013 2014 2015 2016
Average Price (Spot Market) €/MWh
1.88 1.7 3.56
7.32 6.11
-7.89
-2.77 -0.9 -2.26
6.68
-4.9 -5.37 -5.83 -4.92 -5.19
-0.28 -0.28 -0.23 -0.26 -0.28
-10
-5
0
5
10
2012 2013 2014 2015 2016
Expo
rts
(-) v
s. Im
port
s (+
) in
TWh
France Portugal Morocco Andorra
Interconnections
Suntrace’s View
• Spain is recovering from the aftermath of 2008 economic crisis, with GDP growing at 3% per year since 2015.
• For IPP's, several types of power sales models can be realized; self-generation, direct PPA's, public auction or sales to the electricity exchange.
• The Spanish government announced on April 12th 2017 that the eagerly awaited auction for large-scale renewable energy projects will be held on May 17th 2017. Reports suggest that up to 3 GW of power capacity
will be auctioned.
• The Iberian spot, OMIE (http://m.omie.es) and futures markets, OMIP (www.omip.pt) are the basic sales options. Both can be accessed by authorized traders and energy producers.
• Prices on the power exchange have been comparatively stable with annual averages of EUR 40/MWh to 50/MWh since 2007, notwithstanding the Spanish economic depression during the last ten years. Today, power
generators could lock in sales for the next four years @ EUR 41/MWh (base) or EUR 46/MWh (peak).
• How are power prices going to develop over the next 10 to 20 years? Here is our crystal ball reading: today, almost 25 % of Spanish power consumption is supplied either by coal, oil or gas fired power plants. Their fuel costs per MWh determine market settlement prices and will do so for quite some years to come. Typical
marginal cost move around EUR 40/MWh to 60/MWh, depending on the type of power plant and fuel price cost. In addition, nuclear power is supplying another 22% of overall consumption, marginal costs are low. However, the nuclear fleet is pushing the envelope on technical and safety limits with its age: all operating
Spanish nuclear plants were commissioned between 1981 to 1988 and hence are between 30 to 40 years old. Their current operating licences extend until latest 2024. Any decommissioning or replacement would reduce
the number of low marginal cost producers and further drive or at least stabilize prices on the power exchange. On the demand side, increasing exports to power-constrained Morocco or France as well as an increase in consumption by electric vehicles would also provide clear pricing upsides.
• A scenario analysis (all Suntrace assumptions, not considering power tax charge):
• 20 years of power sales @ average EUR 42/MWh, solar PV plant w/EPC price of EUR 0,7 MM per MWp installed (2019), Spanish GHI of 1800 kwh/sqm/year would yield a Project IRR (unlevered) of approx. 5%.
Introducing 60 % debt financing @ an interest rate of 3.5% with a 12 years tenor would lift Equity IRR to 7 %.
• With average sales of EUR 50/MWh or alternatively, an EPC of EUR 0,60/MWp installed (2019) these values would rise to 7% Project IRR unlevered and 10% Equity IRR (levered), all other assumptions unchanged.
• The retroactive cut of renewable subsidies by Spain has caused severe mistrust among the financial community, specifically with regard to the reliability of long term guaranteed Feed-in-Tariffs. The flip side are energy sales
on a fully commercial market basis, where risks and upsides are different in character. With a good understanding of the Spanish power market drivers and dynamics, merchant renewable assets can be a good add-on e.g. for a contracted power portfolio, balancing out risks and returns according to investor's
preferences. Are you ready for merchant risk?
© 2017 Suntrace, all rights reserved 3
Economics and Finance | Electricity Markets | Solar Energy
Solar Market Brief: Spain
Disclaimer
Suntrace GmbH has elaborated this document in good faith and in order to provide an initial insight into the market conditions, based on our information available. However, Suntrace makes no warranty – implied or expressive – with respect to the accuracy, correctness, completeness or appropriateness of any information contained in this document. Suntrace GmbH undertakes no duty to or accepts no responsibility to any third party who may rely on this document.
© 2017 Suntrace GmbH, all rights reserved