economics 330 money and banking - sscc - homemchinn/e330_f06_lecture1.pdf · • oh: mw 2:30-3:30,...
TRANSCRIPT

Economics 330Money and Banking
(Fall 2006)
Prof. Menzie ChinnTAs: Chikako Baba,
Deokwoo Nam

Outline
• Administrative issues• The current macro context• Some basic concepts and
definitions

Administrative Issues
• Course website: http://www.ssc.wisc.edu/~mchinn/web330_f06.html
• OH: MW 2:30-3:30, 7418 Soc Sci• Textbook: Mishkin, Economics of Money,
Banking and Financial Markets 8/e (7/e okay)
• Grading: 20% PS, 40% 2xMTs, 40% Final

Administrative Issues
• Dates:- MT1 on Wed. 10/11- MT2 on Wed. 11/8- Final on Fri. 12/22
• Make-ups: None. Points are re-allocated if you have a legitimate excuse. No late assignments accepted (have to be handed in)
• If you know you can’t make the final exam, don’t take the course.
Macro Context
• The slowdown and potential recession
• Housing price deflation• Associated energy shocks• Government budget deficit• Current account and trade deficits

The slowdown: GDP
-.02
.00
.02
.04
.06
.08
1999 2000 2001 2002 2003 2004 2005 2006
(G D P 00/G D P 00(-1 ))^4-1 DBFCST
R e a l G D Pg ro w th(S AAR )
D eutscheB ankf'c a s t (9 /1 )
Annualized growth = [(X(t)/X(t-1))4 – 1] when data is quarterly

The Slowdown: Employm’t
125000
130000
135000
140000
145000
1999 2000 2001 2002 2003 2004 2005 2006
Nonfarmpayrollemploym't('000s)
Civilian employm't('000s)

The Slowdown: Employmen’t
-.08
-.04
.00
.04
.08
.12
2000 2001 2002 2003 2004 2005 2006
(P A Y E M S /P A Y E M S (-1 ))^1 2 -1(C E 1 6 O V /C E 1 6 O V(-1 ))^1 2 -1
H u rric a n eK a tr in a
Annualized growth = [(X(t)/X(t-1))12 – 1] when data is monthly

The Slowdown: Hours
98
99
100
101
102
103
104
105
106
33.2
33.4
33.6
33.8
34.0
34.2
34.4
34.6
34.8
1999 2000 2001 2002 2003 2004 2005 2006
AW HI AWHNONAG
AggregateHours W orked[left scale]
AverageW eeklyHours[right scale]

The Slowdown: Yield Curve
-3
-2
-1
0
1
2
3
4
5
1970 1975 1980 1985 1990 1995 2000 2005
/S ep. 5-0 .21%
10 year-3 monthspread

The Slowdown: Housing
http://www.ofheo.gov/media/pdf/2q06hpi.pdf

Petroleum Prices
St. Louis Fed, 9/5/06
0
10
20
30
40
50
60
70
80
1970 1975 1980 1985 1990 1995 2000 2005
Real O ilPrice W T I(CPI=1 '82-'84) \
NominalOil PriceW T I

Energy Futures
St. Louis Fed, NET 9/5/06

Gasoline
http://www.eia.doe.gov/oil_gas/petroleum/data_publications/wrgp/mogas_home_page.html

Macro Implications: Framework

Negative Supply Shock
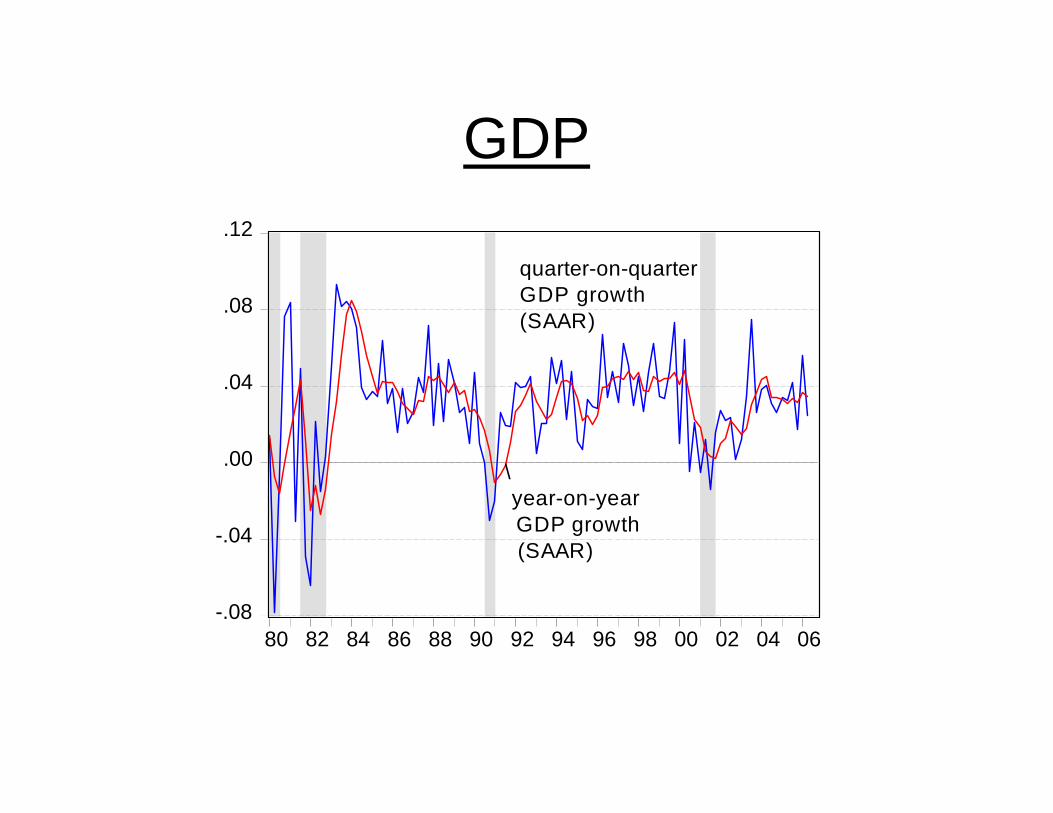
GDP
-.08
-.04
.00
.04
.08
.12
80 82 84 86 88 90 92 94 96 98 00 02 04 06
quarter-on-quarterGDP growth(SAAR)
\ year-on-year GDP growth (SAAR)

Appendix: Definitions
Growth Rates and the Inflation Rate
1
1
Growth Rate 100t t
t
x xx
−
−
−= ×
$9.5 trillion $9 trillionGDP Growth Rate 100 5.6%$9 trillion
−= × =
113 111Inflation Rate 100 1.8%111−
= × =

Inflation: CPI and core CPI
.00
.02
.04
.06
.08
.10
.12
.14
.16
80 82 84 86 88 90 92 94 96 98 00 02 04 06
year-on-yearcore CPIinflation
year-on-yearCPI inflation

Interest Rates
0
4
8
12
16
20
80 82 84 86 88 90 92 94 96 98 00 02 04 06
10 yearbond yield
3 monthT-bill yield

Term Structure
http://www.bloomberg.com/markets/rates/index.html

The rest of the world
-.07
-.06
-.05
-.04
-.03
-.02
-.01
.00
.01
.02
80 82 84 86 88 90 92 94 96 98 00 02 04
Current Accountto G D P ratio
N et assetincome to GDP
N et Exportsto GDP ratio

The Dollar
3.4
3.6
3.8
4.0
4.2
4.4
4.6
4.8
5.0
80 82 84 86 88 90 92 94 96 98 00 02 04 06
Log real valueof the dollar
Log nominal valueof the dollar

Chapter 1
Why Study Money, Banking, and Financial Markets?

Why Study Financial Markets?1.Channel funds from savers to investors, thereby
promoting economic efficiency2.Affect personal wealth and behavior of business
firmsWhy Study Banking and Financial
Institutions?1.Financial Intermediation
Helps get funds from savers to investors2.Banks and Money Supply
Crucial role in creation of money3.Financial Innovation
Why Study Money and Monetary Policy?1. Influence on business cycles, inflation, and interest
rates

Bond Market

Stock Market

Money and Business Cycles

Money and the Price Level

Money Growth and Inflation

Money Growth and Interest Rates

Fiscal Policy
-.07
-.06
-.05
-.04
-.03
-.02
-.01
.00
.01
1980 1985 1990 1995 2000 2005 2010 2015
Actua l Federa lBudget Balanceto G D P ratio(fisca l yrs)
C BO Baseline
Extend ingEG T R R A& JG T RRA

CBO Debt Projections
Source: CBO (Aug. 2006)
.25
.30
.35
.40
.45
.50
1980 1985 1990 1995 2000 2005 2010 2015
Debt to GDPRatio (Actualand Projected) CBO
Baseline
Extend EGTRRAand JGTRRA,reform AMT

34
How We Study Money and Banking
Basic Analytic Framework1. Simplified approach to the demand for assets2. Concept of equilibrium3. Basic supply and demand approach to understand
behavior in financial markets4. Search for profits5. Transactions cost and asymmetric information
approach to financial structure6. Aggregate supply and demand analysis

Appendix: DefinitionsAggregate OutputAggregate IncomeDistinction Between Nominal and RealNominal = values measured using current pricesReal = quantities, measured with constant pricesAggregate Price Level
nominal GDPGDP Deflator = real GDP
$10 trillion GDP Deflator = = 1.11$9 trillionConsumer Price Index (CPI) price of “basket” of goods and
services