economic welfare change attributable to biological...
TRANSCRIPT

Economic Welfare Change Attributable to Biological Control of Lepidopteran
Cereal Stemborer Pests in East and Southern Africa: Cases of Maize and
Sorghum in Kenya, Mozambique and Zambia
Soul-kifouly Midingoyi a,b*, Affognon
aInternational Centre of Insect Physiology and Ecology (icipe), PO Box 30772bDepartment of Agribusiness Management & Trade
Biological Sciences, University of Nairobi
*Corresponding author:
Abstract
This study adopted the economic surplus model to evaluate the impact of the biological control
program (BC), implemented by the
on cereal crops production in Kenya
and Southern Africa between 1993 and
cereal yield losses due to stem-borers and improve their well
intervention substantially contributes to
net present value of $US 271.76 million, the attractive Internal Rate of Return of
the estimated Benefit Cost Ratio of
Moreover, 0.35%, 0.25% and 0.20% of poor are yearly lifted out of poverty respectively in Kenya,
Mozambique and Zambia. These findings underscore the need for increased investment in
sub-region.
Keywords: Biological Control, Stemborers, Economic
Economic Welfare Change Attributable to Biological Control of Lepidopteran
Cereal Stemborer Pests in East and Southern Africa: Cases of Maize and
Sorghum in Kenya, Mozambique and Zambia
Affognon Hippolyte a, Ong’amo Georges a,d and LeRu
Centre of Insect Physiology and Ecology (icipe), PO Box 30772-00100, Nairobi, Kenya
Department of Agribusiness Management & Trade, Kenyatta University, Nairobi – Kenya
Nairobi, Nairobi – Kenya; eInstitut de Recherche pour le Developpement,
France Email: [email protected] or [email protected]
This study adopted the economic surplus model to evaluate the impact of the biological control
International Centre of Insect Physiology and Ecology (icipe)
Kenya, Mozambique and Zambia. The BC was implemented in East
and 2008, with the aim of helping small scale farmers to reduce
borers and improve their well-being. Findings show that BC
contributes to consumer and producer welfare in the three countries. The
million, the attractive Internal Rate of Return of
the estimated Benefit Cost Ratio of 33.47, imply the efficiency of investment in BC
er, 0.35%, 0.25% and 0.20% of poor are yearly lifted out of poverty respectively in Kenya,
se findings underscore the need for increased investment in
ontrol, Stemborers, Economic Surplus Model, Kenya, Mozambique, Zambia
Economic Welfare Change Attributable to Biological Control of Lepidopteran
Cereal Stemborer Pests in East and Southern Africa: Cases of Maize and
LeRu Bruno a,e
00100, Nairobi, Kenya;
Kenya; dSchool of
de Recherche pour le Developpement,
This study adopted the economic surplus model to evaluate the impact of the biological control
International Centre of Insect Physiology and Ecology (icipe),
C was implemented in East
scale farmers to reduce
being. Findings show that BC-
consumer and producer welfare in the three countries. The
million, the attractive Internal Rate of Return of 67%, as well as
, imply the efficiency of investment in BC-program.
er, 0.35%, 0.25% and 0.20% of poor are yearly lifted out of poverty respectively in Kenya,
se findings underscore the need for increased investment in BC in the
odel, Kenya, Mozambique, Zambia

1. Introduction
In Eastern and Southern Africa, cereals, especially maize [Zea mays L.] and sorghum [Sorghum
bicolor (L.)], are among the most important and widely grown field crops by commercial and
small-scale farmers. Their production is, however, constrained by biotic and abiotic problems.
Abiotic constraints included among others, climate change, soil fertility and low input use due to
limited capital endowment. Among biotic constraints, insect pests represent an important
challenge and lepidopteran stemborers are by far the major injurious pests that occur when maize
and sorghum are cultivated (Omwega et al., 2006, Kfir et al., 2002; Polaszek, 1998; Kfir, 1998).
Due to the economically important yield loss associated with stemborers infestation, many
endogenous and introduced mitigation strategies have been developed and can be grouped in
three categories: the Integrated Pest Management (IPM), chemical control and cultural control
(Polaszek, 1998). Unfortunately, many recommendations on these strategies have not been
adopted due to the constraints associated to their use that make them impracticable and
unattractive to farmers (Van den berg and Nur, 1998).
The chemical control strategy is based on the use of synthetic insecticides to eliminate
stemborers and then reduce the output losses. However, inconveniences are noted and include
the resistance to insecticides, adverse effects on non-target species, hazards of insecticides
residues, direct hazard from insecticides, non-guaranteed success in application, tendency in
insecticides overusing and application of insecticides cocktails (Varela et al., 2003; Van den berg
and Nur, 1998). Moreover, even if insecticides are perceived to be important product against
stemborers in commercial agriculture, the lower purchasing power due to the low-economic
value of cereal crops seem to be a limiting factor and many resource-poor farmers cannot afford
them. Considering these constraints and the potentially negative impact of chemical control on
human health and environment, biological control is gaining attention. Classical biological
control involves the introduction of an exotic natural enemy, such as predator and parasitoid, into
a new environment where they did not formerly exist. Because of its self-perpetuating
characteristic when definitely established and the no-requirement of recurrent additional
investment, classical biological control remains an appropriate tool for pests control for resource-
poor farmers (Hajek, 2004; Kipkoech, 2009).

As part of research program on the biological control, from the early 90s to date, the African
Insect Science for Food and Health (icipe) made important progress in investigating on
suitability and effectiveness of pests’ control with numbers of natural enemies. Icipe, in
partnership with National Agricultural Research Organisations (NAROs) and Universities,
implemented biological control of stemborers through different projects1 by releasing natural
enemies in the major maize and sorghum producing area in East and Southern Africa. Following
this introduction of natural enemies, post-release survey and a number of studies have been
carried out, reporting establishment, acceptable level of parasitism, reduction of stemborer
densities and reduction in yield losses (Omwega et al., 2006; Odendo et al., 2003, Emana et al.,
2001; Cugala and Omwega, 2001; Zhou et al., 2001; Bonhof, 1997). The ultimate goal of
research being the welfare improvement of poor population with little resource endowment, the
direct effect of icipe’ biological control of stemborers needs to be assessed in order to really
appreciate its contributions to rural communities and general economy.
In this paper, we analyze the welfare effects of the release of natural enemies of maize and
sorghum stemborers through different biological control programs initiated by icipe from the
early 1990s to 2007. The objective of the study is to pinpoint the distribution of benefits among
the economic agents in presence and, to appreciate the efficiency of investments in research on
icipe implemented biological control programs in Kenya, Mozambique and Zambia.
2. Background on the biological control interventions
2.1 Biological control
The biological control can be defined as the deliberate use of living organisms (predators,
parasitoids, nematodes, and pathogens) to maintain the population of a species (especially pests)
at a lower density (Simmonds,1967; Debach and Rosen, 1991; Lazarovitz et al., 2007) This type
of control stems from natural ecosystem function principle by which populations of an organism
1 Among these projects, we have “Biological control of insect pests in subsistence crops grown by small-scale
farmers” within the period of 1993 to 1996, the aim was to minimize health risks, environmental pollution and damage to natural ecosystems through the development of a sustainable crop protection technology. Another project considered was “Biological control: a sustainable solution for smallholder maize and sorghum farmers in East and Southern Africa” that covered the period of 2002 to 2005. The objective here was the regulation of pest density through biological control implementation, capacity building and increasing awareness among farmers on biological control.

are regulated through the interaction of their lifecycle with another organism. This natural
principle has then been applied to agriculture with the goal of effectively manage populations of
beneficial organisms and their ability to reduce the pests’ activities within environmental, legal
and economic constraints (Lazarovitz et al., 2007).
Using this principle, many pest management programs have been implemented in sub-Saharan
Africa. Among the common examples were the control of the cabbage pest Plutella xylostella
with the parasitoid Diadegma semiclausum on cabbage production in Kenya (Macharia et al.,
2005; Asfaw et al., 2013), the use of Cotesia flavipes as an augmentative biological control agent
for Diatraea saccharilis in rice production (Lv, 2010); the control of water hyacinth with the
release of Neochetina species in Benin and East Africa (De Groote et al., 2003), and the
biological control of the cassava mealybug (Phenacoccus manihoti) using the control agent
Apoanagyrus (Epidinocarsis) lopezi in 27 african countries (Zeddies et al., 2001). In this study,
we will consider the biological control as the use of parasitoids against stemborers with the
expectation of significant reduction of pest population densities and abatement of damages to
maize and sorghum crops.
2.2 Major targeted stemborer pests
Stemborers are insect pests that cause, during their larval stage, important physical and
economical damages on cereal crops (Overholt et al., 2001; Kfir et al., 2002). Many studies
revealed the presence and the high diversity of stemborer species in East and Southern Africa
(Le Ru et al., 2006; Moolman et al., 2014) but the most economically important species are the
crambid Chilo partellus (Swinhoe), and the noctuids Busseola fusca (Fuller) and Sesamia
calamistis Hampson (Kfir et al., 2002). The summary of their main characteristics is presented in
table 1. Odendo et al. (2003) examined the economic value of loss due to stemborers and found
the average loss in maize due to stemborer attacks to be at 14 %, ranging from 11% in the
highlands to 21% in the dry areas. An extrapolation to the Kenyan national production in maize
revealed that about 0.44 million tons valued at US$ 25-60 million and which is enough to feed
3.5 million2 people per annum are lost.
[Table 1 about here]
2 The per capita annual maize consumption is 125 kg

2.3 Released parasitoids of cereal stemborers
This study concerns the classical biological control as most of the released parasitoids are exotic.
The exotic larval parasitoid Cotesia flavipes Cameron (Hymenoptera, Braconidae) has been
imported from Asia in 1991 and released from 1993 in East and Southern Africa beginning by
the coastal region of Kenya (Overholt et al., 1994). The egg parasitoid Telenomus isis (Polaszek)
(Hymenoptera, Scelionidae) is one of the most important stemborers’ natural enemies found in
West Africa (Schultess et al., 2001; Bruce et al., 2009) and introduced by icipe in East Africa in
2005. In addition to this last species released, the virulent strain of the indigenous larval
parasitoid Cotesia sesamiae Cameron from Western Kenya has been introduced in Taita Hills in
Kenya where it didn’t formerly exist. But before this redistribution of C. sesamiae, the solitary
pupal parasitoid Xanthopimpla stemmator Thunberg (Hymenoptera, Ichneumonidae) was
released in the early 2000s in many East and Southern African countries including Mozambique
and Zambia (Cugala, 2007). These four biological control agents are the focus of this economic
evaluation which intends to appreciate the extent to which the biological control program
contributes to the improvement of the community (consumer and producer) welfare.
2.4 Released points and establishment of the released bio-agents
Many ESA countries benefited from the icipe Biological Control (BC) program comprising
Tanzania, Ethiopia, Zambia, Mozambique, Eritrea, Uganda and Kenya. The release sites of our
study countries are depicted in figure 1. This figure presents the distribution of release sites in
Kenya agricultural zone. In this country, bio-agents have been released in six provinces
including the major cereal growing zones. The release species include C. flavipes, the first
parasitoid released in 1993, X. stemmator in 2004, T. isis and C. sesamiae in 2007 released at
Taita Taveta and Eldoret. In Mozambique, the first release has been realized at Maracuene and
Moamba in 1996 with C. flavipes. The most recent release in this country is that of X. stemmator
realized in 2003 and 2004. The majority of releases sites have been concentrated in Gaza and
Maputo provinces. In Zambia, C. flavipes has first been released in Luangwa, Sinazongwe and
Sesheke districts in 1999. It has been complemented by X. stemmator first released in 2004.
The establishment assessment is a pre-condition for any economic assessment as the
effectiveness in yield reduction and contribution to revenues and food security is strongly

conditioned by the effective presence and parasitism by the bio-agents. The presence and
effective parasitism of the released parasitoid have been confirmed through many studies and
surveys (Assefa et al., 2008; Mailafiya, 2008; Moonga, 2007; Cugala, 2007; Omwega et al.,
2006; Getu et al., 2003; Sallam et al., 2000; Omwega et al., 1997; Omwega et al., 1995).
However, during a recent sampling survey, the T.isis has been found just in the regions where it
has been released and the C.sesamiae has not been recorded (Ongamo et al. 2014, unpublished
data). The impact assessment will then mainly based on the other two species (C. falvipes and X.
stemmator)
[Figure 1 about here]
2.5 Maize and sorghum areas and yields in Kenya, Mozambique and Zambia
The time-series data on maize and sorghum cropped area and yield for the three study countries
were sourced from the FAO database (FAO, 2014) and compiled in graph forms (figure 2, figure
3, and figure 4) for the three countries. The situation of the two crops in Kenya the last three
decades is depicted in figure 2. The total area under maize and sorghum generally depicted an
increase with some fluctuations. The yield for both crops also depicted a fluctuation trends but
remains globally stagnant for the three countries. The responsible factors for this stagnating
trends in yield performance include climatic factors with poor rainfall (Smale et al., 2011)
declining soil fertility, lower adoption of best practices such as the use of hybrids and fertilizers
(JAICAF, 2008) and the high prevalence of bird and pest damages (USAID, 2009; Denic et al.,
2001) and generally a lower uptake of new agricultural technologies (World Bank, 2006).
[Figure 2 about here]
[Figure 3 about here]
[Figure 4 about here]
3. Theoretical framework for economic welfare analysis
3.1 Economic surplus model
Since the introduction of the Economic Surplus Modeling (ESM) approach in agricultural
technology impact assessment by Shultze (1953) and Grilitches (1958) and its improvement

through applications by Akino et Hayami, (1975), Altson et al. (1995) and Zhao et al. (1997),
there has been a growing interest in its application in agricultural research ex-post impact
assessment. The ESM stems from partial equilibrium framework which is the most common
approach for the evaluation of commodity-related technological progress in agriculture (Alston
et al., 1995; Norton and Davis, 1981). The economic surplus model consists in estimating the
aggregate total monetary benefits for socio-economic agents entailed by the introduction of a
research innovation of development intervention in a targeted social environment (Maredia et al.,
2014; Akino and Hayami, 1975). In other words, estimations through this model make it possible
to appreciate the variation of consumer and producer surplus attributable to intervention.
The framework has been developed in the literature under many assumptions. In most of the East
and Southern Africa countries, the locally produced maize and sorghum are commercialized
within each country. Very small proportion of these crops is exported and this led to assume the
close economy in the development of our framework. Under this assumption, and following the
framework presented by Alston et al., 1995, Maredia et al. 2000, Moore et al. (2000), Mensah et
al. (2009) and assuming linear curves3 of supply and demand, the determination of surplus
change from the Biological Control (BC) intervention can be described as follows.
The maize or sorghum supply curve before the BC-intervention is given by: �� = � + �� (1)
where �� is the initial quantity supplied, � the intercept of the supply curve, � the slope
parameter of the supply curve and� the price level. The initial demand curve is given by:
�� = � + �� (2) where �� represents the initial quantity demanded, � the intercept of the
demand curve and � the slope of the demand curve. Following the economic theory, the initial
market equilibrium is obtained by equating the total demand to the total supply equations,
yielding the initial market equilibrium price �∗ before the intervention:
∑�� = ∑�� ⟺ �∗ = (� − �)/(� + �) (3)
The BC intervention induces a parallel and downward shift of the supply curve giving a new
supply curve ���� = � + �(� + �) = (� + ��) + ��, where � stands for the shift factor treated
as intercept change and ���� represents the new quantity supplied with the intervention. New
market equilibrium is derived from this technology-induced supply curve and the demand curve
3 The question of which functional form of supply and demand curves is to be considered. Researchers assumed that
in case of parallel supply shift, linear model provides a good approximation of any other non-linear model, and then the choice of the functional form is considered as irrelevant (Mensah et al., 2009)

(��� = � + ��), yielding a new market equilibrium price, considered as derived from the supply
shift:
∑���� = ∑���
� ⟺ ���∗ = (� − � − ��)/(� + �) (4)
The graphical illustration of the market equilibrium displacement provides a geometrical view of
the economic surplus model (Figure 5). The initial supply curve S0 (algebraically described by
the equation (1)) and the demand curve D (algebraically described by the equation (2)) intercept
at the point A (p*, q0) which represents the initial market equilibrium as assumed in economic
theory. The point A coordinates p* and q0 represent respectively the initial equilibrium price and
quantity supplied or demanded.
[Figure 5 about here]
Hence, the initial surplus distribution is presented as follow:
Initial Consumer Surplus �∗���
Initial Producer Surplus �∗���
Initial Total Surplus �����
With the BC intervention, the supply curve S0 is expected to shift to S1. This results in a new
equilibrium point B(���, ���) with the coordinates pBC and qBC representing respectively the new
equilibrium price and quantity of maize or sorghum under the BC intervention. The resultant
change in welfare (surplus) is then given as follow:
Change in Consumer Surplus: ∆�� = �∗����� = �∗�∗�(1 + 0.5�ŋ)
Chance in Producer Surplus: ∆�� = ������ = �∗�∗(� − �)(1 + 0.5�ŋ)
Change in Total Surplus: ∆�� = �∗����� + ������ = �∗�∗�(1 + 0.5�ŋ)
with � = �/�� the supply shift factor, � the supply elasticity and ŋ the demand elasticity and
� = −���∗ ��∗
�∗= (��)/(� + ŋ) relative reduction in price according to Alston et al. 1995
3.2 Return to investments and benefit-cost analysis
In general, the welfare benefits are compared to the monetary investments in order to appreciate
the efficiency of the program or research through the measure of its return to investment.
Economic benefit of the BC intervention will be extended to the estimation and analysis of the
Net Present Value (NVP), the Internal Rate of Return (IRR) and Benefit-Cost Ratio (B/C)
(Masters, 1996; Jones et al., 2006). NPV measures surplus from profit compared with costs of
research and it is estimated based on a given interest rate. This must adequately reflect

opportunity cost of funds invested i.e. the profitability rate of funds invested in the research. The
NPV expression is given as:
��� = ∑(�����)
(���)����� (5)
Where Bt is benefits of the technology (the total surplus), Ct represents the total cost incurred in
BC, r is the discount rate, and t is time periods for which the Biological Control (BC) occurs. A
technology project is profitable and acceptable if the NPV exceeds zero.
IRR measures the interest rate at which, current value of investments in BC is equal to current
value of BC benefits. IRR can then be compared to any other rate of interest; in particular the
one charged by commercial banks or interest rates of private investments. If IRR is greater than
those rates mentioned, one should conclude that investments in BC in the studied countries are
relevant. The benefit-cost ratio (BCR) measures the relative value of benefit generated per
investment unit. It is expressed as a ratio of the sum of a BC intervention’s discounted benefits to
the sum of discounted costs of research and releases. A ratio greater than one, will justify the
relevancy of investment in BC program in the selected countries.
��� =
∑ ��(���)���
���
∑ ��(���)���
���
(6)
3.3 Effects on poverty reduction
The welfare effects have been calculated as total monetary value associated with the BC of
maize and sorghum stemborers. This total generated social benefit can also be seen as accrued
surplus that allow households to escape poverty. Indeed, the BC intervention can reduce poverty
by raising the income of farmers’ households, by reducing purchasing price for consumers’
households or by creating new employment in the maize or sorghum value chains. Alene et al.,
(2009) provides a formula that allows deriving the number of poor people lifted out of poverty
from the change in surplus due to new technology. Hence for each country, the increase in
number of persons that shifted from the group of poor (under the poverty line) to the group of
non-poor (above the poverty line) due to the icipe’ biological control program is given by:

∆� = �∆��
�����∗ 100%� ∗
���(�)
���(�����)∗ � (7)
Where ∆� is the number of poor lifted out of poverty, ∆�� is the change in economic surplus
due to the biological control program, ����� is agricultural gross domestic production in year t
and N is the total number of poor. The term ���(�)
���(�����) represents the poverty elasticity that
stands for percentage reduction of total number of poor due to 1% increase in agricultural
productivity. This term is fund to be equal to 0.72 for Sub-Saharan Africa (Thirtle, 2003) and
will be used for this study.
4. Parameters and data sources
4.1 Biological control induced supply shift parameter
While referring to the theoretical framework and the formula obtained for the producers,
consumers and total surplus in equation (08), the Kt parameter representing the BC research-
induced supply shift parameter is found to be critical in determining the benefits from the BC
spread. The supply shift parameter is estimated by Alston et al. (1995) to be equal to:
�� = ���
�� − �� (08)
where jt is the proportionate change in production due to BC intervention at time t, � the price
supply elasticity of the product and Ct, the cost increase incurred by the presence of the BC
agent. Biological control is a self-spreading and self-sustained technology that prevents farmers
from spending any additional cost in insecticides use. This imply that the total cost of production
remains unchanged and rending the parameter ct in Equation (08) to be equaled to zero.
Therefore the expression of the supply shift equation is reduced to the ratio ( ��
� ).
While � is provided by the literature on maize and sorghum supply studies, the parameter �� still
need to be estimated. The parameter represents the total increase in production attributable to the
BC intervention. It’s given by the following equation:
�� = ∑ (∆���� ∗ ��� ∗�� ��) (09)

With ∆�� accounting for yield increase due to the presence of a biological control agent or
combination of agents, i the released and established species of the bio-agents and their
combination. C. flavipes (Cf), and X. stemmator (Xs) as well as their combination (Cf, Xs). S is
the rate of BC area coverage which is the ratio of the total area covered by a released BC agent
(or combination of agents) i and the total acreage under considered crop (maize or sorghum), �
is the total acreage under considered crop and t represents the time. The parameter ��is then
derived from the equation (10) as proportion of total production at the year t as (�� = ��/��)
where Yt stands for the total production of maize or sorghum at the defined year t. Therefore the
overall formula for estimating the BC-research supply shift becomes:
�� =1
� ∗ ����(∆���� ∗ ��� ∗
�
�
��)�(11)
4.2 Yield gains attributable to the BC intervention (∆��)
The yield gains due to each of the released bio-agents have been sourced from results on
exclusion experiments conducted by entomologists. Researchers conduct the so-called exclusion
experiments to determine the intrinsic gain due to the parasitism by the bio-agents (Kfir, 2002;
Cugala, 2007). These trials have consisted in setting plots in fully protected, unprotected and
exclusion plots as treatments. The unprotected plots are those let without any plant protection
and then represent where the BC activities occurred naturally. The exclusion plots were sprayed
with selected insecticide to partially eliminate the natural enemies and then were referred to as
the non-BC plots. On the fully protected plots, natural enemies and stemborers pests have been
totally removed. Yield losses due to the stemborers attack in the absence of the natural enemies
were obtained from the difference between the expected yield from the fully protected and
exclusion plots. The difference between the yield from unprotected and exclusion plots is of high
interest for the present study and represent the yield gain due the biological control at plot level.
Hence, the yield gain due to BC was 26.1% in Chokwe, 11.2% in Machipanda and 7.6% in
Lichinga in Mozambique (Cugala, 2007). The mean of these three percentages (14.96%) has
been considered in this study for X. stemmator. Zhou et al. (2001) estimated the yield gain due to
C. flavipes at 10% and this proportion has been considered for C. flavipes in the present study.
In addition, based on the findings from Zhou et al. (2001) on the impact of bio-agent pests

parasitism4 over time, we assumed the BC-induced gain not be constant along the timeframe of
our analysis. Following the parasitism rate trends, we consider 5% of the above-found yield-gain
for the first three years, 18% for the fourth year, 50% for the fifth year and the constant 100%
from the sixth year.
4.3 Evolution of the BC-covered area
The biological control is a self-spreading technology and consequently the evaluation of its
impact largely depends on the extent to which the released natural enemies really spread. The
measurement of the area covered by BC in this impact evaluation constitutes a challenge as data
on the follow-up and yearly monitoring of the spread are missing and mostly for the most recent
releases. However, models on the organism spreading are available in the literature: Waage’s
function �� = 4������ where �� is the area occupied at time t, � is the population diffusion
coefficient and �� the intrinsic rate of the population growth; Chock’s exponential function
�� = � ∗ ��� where ��is the proportion of acreage where the biocontrol agent is established in
year t after release, � is the intercept coefficient, g is a constant specific to the dispersal rate, and
e is the base of the natural logarithm (≈ 2.718).
These functions do not integrate the complexity that can imply a time-variant and multiple
agents-based BC program. In other words, the possibilities of multiple points of release, the
possibility of diversity in the released bio-agents and the overlapping probability of the spread of
two or more different bio-agents are of high importance in spread modeling. Hence, to
approximate the annually covered area by the BC-spread, spatial analysis using geo-processing
tools of GIS software has been used. We first checked and documented all the GIS coordinates
of the release points. We then modeled the spread around each release benchmark site in the four
encompass directions using the method of concentric circles respecting the year of release and
the appropriate specific dispersal rate.
In this assessment, the annual spread rates were taken from various sources (Error! Reference
source not found.). In fact, the literature on the dispersal rate provides many figures for the first
4 Based on host-parasite interaction model, the impact study by Zhou et al (2001) demonstrated the trends of
stemborer-pest parasitism by bio-agent to show a latent period (first three year) an uptake period (three years) and a plateau (maximum) during the remaining period. And then, higher impact from BC-agent is really effective after several years following the release.

released species C. flavipes. Base on this species’ recovery in Northern Tanzania where no
release has been made before, Omwega et al. (1997), assuming the origin to be the inadvertent
escape from Mbita, estimated the spread rate of Cotesia to be 60 km.year-1. In another study
conducted by Assefa et al. (2008) in Ethiopia, the dispersal rate of Cotesia was found to be
higher than 200 km.year-1. Another recent study estimates the spread distance at 11.23 km.year-1.
The principle of the “least favorable assumption case” led us to select the minimum distance
found in the literature. The dispersal rate was estimated at 8.3 km per year for X. stemmator
(from Cugala, 2007).
Based on these spread distances, the BC covered area has been modeled for all of release points
for each year and the area under BC spread (6) has been calculated using the GIS software
functions. For Kenya case, the spread modeling has been made using the agricultural land map
whereas for the Mozambique and Zambia cases, the modeling has been made on all land as
agricultural land maps were not available. The appropriate coefficients5 were then used to
calculate the annual maize and sorghum cultivated area under BC and we finally derived the
proportions of maize and sorghum cultivated land under BC (Figure 7). The trends in these
proportions show a higher BC cover for Kenya comparatively to Zambia and Mozambique
(Figure 6 and Figure 7).
[Figure 6, 7 about here]
4.4 Price elasticity of supply and demand and prices data for maize and sorghum
As previously demonstrated in the section on the economic surplus model, price elasticity of
supply and demand (ԑ and ŋ) are key determinants in the estimation of consumer, producer and
the overall social benefits. The estimates of price supply elasticities are found to equal 0.11 in
Olwande et al. (2009), 0.36 in Onono et al. (2010), 0.53 (short run) and 0.76 (long run) in Mose
et al. (2007). According to Alston et al. (1995), when data on supply elasticities is lacking, it
becomes expedient to rely on the unit price elasticity of supply. The most closed figure to the
unit elasticity supply, that is 0.76, has been referred to in this assessment for Kenya case. For the
remaining countries, the literature on recent estimates on supply elasticity is short and the figures
5 In Kenya, maize occupies over 22% of total farmed land (Mbithi and Huylenbroeck, 2000). For
Mozambique and Zambia, the yearly proportions of acreage under maize and sorghum compared to the entire land have been used.

found from various sources (Table 2) have been considered. On the other hand, all the price
elasticities of demand found in the literature with value lower than one have been considered in
the assessment as they confirmed the necessity nature of maize and sorghum in East and
Southern Africa.
Maize and sorghum time-series data on prices have been assessed from FAO database and other
documents and compiled in curves shown in Figure 8. Maize and sorghum prices steadily
increased from 1990 to 2013. The highest price for each curve is observed in 2008 or 2009 and
this confirms the rise in price following the 2008 world food crisis. In the estimation of the total
product value, these prices have been converted to real using the food consumer price indexes
assessed from the FAO and African Development Bank databases.
[Table 2 about here]
[Figure 8 about here]
4.5 BC – research investments
The set of activities (Identification of pests, importation and quarantine of natural enemies, field-
releases, follow-up and evaluation) implemented by the Icipe as part of its BC program implied
investments in personal including scientists, administratives, technicians and dissertation
scholars. This program also invested in laboratory equipments and vehicles for the projects,
importation and mass rear natural enemies, basic surveys, studies and consultations, training of
national scientists, extensionists and farmers. Data on the annual total cost of these activities
have been assessed from project documents and evaluations reports. Basically the Biological
Control program is made of a series of four projects that have been implemented from 1990 to
2005: the first from 1990 to 1992 with a cost of USD 0.6 millions, the second from 1993 to 1996
with a total cost of DFI6 3.87 millions, the third from 1997 to 2001 with a total cost of DFI 7.5
millions and the fourth from 2002 to 2005 with a total cost of USD 5.52 millions. The total
annual expenses have been partitioned base on the 10 countries (Kenya, Eritrea, Madagascar,
Malawi, Mozambique, Somalia, Tanzania, Uganda, Zambia, and Zimbabwe) that benefited from
the program and the shares of our three study countries have been considered.
6 DFI is the “Dutch Guilders”, former currency of the Netherlands (1 unit worth 0.56 USD, value of 23.02.2015)

5. Results and discussions
5.1 Welfare change due to biological control of stemborers
The results on the welfare gain from the economic surplus model are presented in the table 3.
The Biological control intervention has contributed to an aggregate value of $US 1,358.46
million to the economy of the three countries with 84.25% ($US 1,144.57 million) from maize
production and the remaining 15.75% ($US 213.89 million) from sorghum production. These
results show that the Biological Control program of icipe has globally induced a highly positive
impact on welfare in the three countries. The value is however lower than that obtained for the
biological control of the cassava mealybug in Africa that was estimated at $US 2,205 million
(Norgaard, 1988). Producers got the larger share of welfare by gaining 57.70 % of the total
surplus generated by the icipe’ BC program.
At country level, results show that Kenyan maize farmers gained an average of $US 14 million
annually from 1993 to 2013 whereas sorghum producers gained an average of $US 5.31 million
per year during the same period. The annual gains were $US 6.44 and 14.72 million for maize
production, $US 0.98 and 0.30 million for sorghum production, respectively for Mozambique
(from 1996 to 2013) and Zambia (from 1999 to 2013). Maize and sorghum consumers gained as
well from the decrease in price due to the higher supply induced by the biological control of
stemborers. Annual surplus gains were 11.82, 5.48 and 9.40 $US million for maize consumers
and 3.58, 0.93 and 0.17 $US millions for sorghum consumers in Kenya, Mozambique and
Zambia respectively. Although these country results are positive, they are lower than the average
annual gain of $US 50 million estimated by Bokonon-Ganta et al. (2002) for the Biological
Control program of mango mealybug in Benin.
[Table 3 about here]
5.2 Net benefits and rates of return to investments in BC program
The results of estimation of the net present value of benefits, the rates of return on investments in
BC-program and the benefit-cost ratios are reported in Table 3. The total net present value of
icipe’ biological control program over the period of 1990-2013 was estimated at $US 175.66
million for maize, $US 46.56 million for sorghum cumulating at $US 271.76 for both crops. At

country level, the NPVs were found to reach $US 141.52, $US 33.02 and $US 38.98 million for
both crops in Kenya, Mozambique and Zambia respectively. The higher results for Kenya
compared to the other two countries can be explained by the higher number of natural enemies
released in the country with the synergy of their effect leading to high parasitism translating into
high loss reduction. The other explanation is the seemingly best distribution of the released sites
that allow the natural enemies to spread and cover more extended agricultural areas in the
country. The spread started from the coastal region and Western (with the Mbita inadvertent
escape), and has been followed by spread from other well-distributed released sites in the
Central, Eastern and Rift-valley. In Mozambique, the majority of the release points are
concentrated in the south region and in Zambia, most releases were done closer to the border
entailing the large share of spread to occur out of the country territory. Moreover, the earlier start
of the BC-program in Kenya may explain the higher value of the BC-derived social benefits.
The net present values derived from BC-program are however lower than estimates from impact
of other Biological control program in Africa. For example, De Groote et al. (2003) found a net
present value of the biological control of water hyacinth in southern Benin to be US$260 million.
One important step in this evaluation was to appreciate the efficiency of investment in the BC-
research by calculating the internal rate to return on the investments. The overall internal rate of
return of 44% obtained for the aggregate three countries is attractive because the return is above
the prevailing discount rate considered of 10%. In addition, for all countries and both crops, the
internal rate of return, ranging from 69.84% for maize in Kenya to 23.39% for sorghum in
Zambia, is higher than current prevailing interest rate of 10%. This result justifies that the
investment in icipe’ biological control research was a highly worthwhile investments in the three
countries.
The other efficiency measure for funds use in research is the Benefit-Cost Ratio (BCR) which
was found to equal 15.60 meaning that each dollar invested in the biological control program
generates an additional higher value of 33.47 dollars for the aggregate countries. For each
country, the BCRs are much higher than 1, confirming the high profitability of investing in icipe’
biological control research and release of natural enemies in these countries. However, the
figures found are lower than that obtained in many other BC program impact assessments for
instance De Groote et al. (2003) estimated a BCR of 124:1 for the biological control program of

water hyacinth in Southern Benin, Bokonon-Ganta et al. (2002) found a BCR of 145:1 for the
biological control program of mango mealybug in Benin and Norgaard (1988) estimated a BCR
of 149:1 for the biological program against the cassava mealybug in Africa.
5.3 Impact of biological control of stemborers on poverty reduction
Poverty reduction expressed here as the proportion of poor lifted out of poverty7 ranges from
0.01% in 1996 to 0.56% in 2013 for Kenya, 0.04% in 2001 to 0.49% in 2013 for Mozambique;
and 0.03% in 2003 to 0.79% in 2013 for Zambia. For each country, the reduction in poverty
reached 0.1% after 6 to 7 years confirming the finding that the period before the expectation of
impact from BC program is about 6 years (Zhou et al., 2001). The average annual poverty
reduction is presented in the table 4. Estimated impact on poverty was in average 0.35% per year
in Kenya, 0.25% in Mozambique and 0.20% in Zambia. The relatively higher impacts for Kenya
and for maize in term of poverty reduction are consistent with the broader spread of BC and the
importance of maize as crop produced and consumed by the higher share of populations who are
in majority the resource-poor people. Poverty impacts from BC-program have steadily increased
with time confirming the BC intervention as a sustainable policy for promoting poverty
reduction.
[Table 4 about here]
5.4 Sensitivity analysis
To determine the robutness of the findings to change in yield-gain from the released natural
enemies, sensitivity analysis was undertaken. Results show that the welfare change, the
efficiency of investment in BC-research and the poverty reduction are sensitive to change in
proportional yield gain (or BC-agents aptitude to parasitism) and price elasticity. Reducing the
yield gain attributable to the parasitism by the bio-agent Cotesia flavipes by 50%, results in
reduction of 47%; 37% and 34% of the total social benefits; 48%, 41% and 46% of the net
present value of benefits for both crops and respectively for Kenya, Mozambique and Zambia.
Reduction is also observed with the internal rate on return that drops from 113%, 29% and 19%
7 Poor were defined as people living below international poverty line of US$ 1.25 per day.

to 93%, 25% and 16% respectively for each country. The poverty change also reduced in
percentage by 48%, 38% and 34% respectively for Kenya, Mozambique and Zambia. Changes in
yield gain due to X.stemmator also present variations but in a lesser extent and this may be due to
the late release and shorter spread in comparison to the release of C.flavipes. With the
reduction/augmentation in parameters, results still keep positive and high figures denoting that
the higher profitability of the icipe BC program is verified.
[Table 5 about here]
6. Conclusion and implications
Using market and production data from various sources and GIS modeling, this study provides
an ex-post evaluation of the impacts of icipe’ biological control program on welfare and the
efficiency in investments in biological control research. We applied the economic surplus model
to assess the impact of the biological control of stemborers in Kenya, Mozambique and Zambia.
The releases of Cotesia flavipes, Cotesia sesamiae, Telenomus Isis and Xanthopimpla stemmator
over the period of 1993 to 2008 to control stemborers result in an auto-spread of the biological
control that covers up to 90% of sorghum and maize in Kenya and just 20% in Zambia and
Mozambique. The resulting welfare in term of monetary surplus for both producers and
consumers were $US 1358.46 million for the three countries with 84.25% from maize and the
remaining 15.75% from sorghum. In the three countries, the estimation of the internal rate of
return and the benefit-cost ratios revealed the high efficiency of funds invested in BC research.
The net present value also confirmed the high profitability of this investment. Moreover, the
results showed a yearly increasing number of persons lifted out of poverty with the spread of BC
and this justify that the BC intervention remains an important policy and self-sustain tool to
promote and contribute to poverty reduction in the region.
However, the findings on BC advantages can be considered as a lower boundary, since the
calculation used conservative assumptions through the reasonable least favorable case principle
(the lower dispersal rate of the released bio-agents for instance). The benefits would have
increased if the advantages due to the spillover effect (spreads to the neighboring countries) were
considered. The major implication of this assessment is that more funds could be advantageously
invested in Biological program in East and Southern Africa.

Acknowledgment
The authors would wish to acknowledge Department for International Development (DFID) for
financial support. We are grateful to the International Centre of Insect Physiology and Ecology
(ICIPE) and the Institut de Recherche pour le Development (IRD) for the advice and research
support. Our deepest thanks to Gerphas Okuku, Esther Abonyo and Kabiro Macharia for their
effort in provision of data.
7. References
Akino, M., Hayami, Y., 1975. Efficiency and equity in public research: Rice breeding in Japan's economic development. American Journal of Agricultural Economics 57(1): 1-10.
Alene, A. D., Menkir, A., Ajala, S. O., Badu-Apraku, B., Olanrewaju, A. S., Manyong, V. M., Ndiaye, A., 2009. The Economic and Poverty Impacts of Maize Research in West and Central Africa. Agricultural Economics 40 (5): 535 –550.
Alston, J.M., Norton, G.W., Pardey, P.G., 1995. Science Under Scarcity: Principles and Practice for Agricultural Research Evaluation and Priority Setting. Cornell University Press, Ithaca, New York.
Asfaw, A., Mithöfer, D., Löhr, B., Waibel, H., 2013. Challenges for Economic impact assessment of classical biological control in Kenya and Tanzania. In Mithöfer, D., Waibel, H., 2013. Vegetable production and Marketing in Africa: Socio-economic research. Icipe- CABI
Assefa, Y., Mitchell, A., Conlong, D.E., Muirhead, K.A., 2008. The establishment of Cotesia flavipes (Hymenoptera: Braconidae) in sugarcane fields of Ethiopia and the origin of the founding population. Journal of Economic Entomology 101, 686-691.
Bokonon-Ganta, A.H., De Groote H., Neuenschwander, P., 2002. Socio-economic impact of biological control of mango mealybug in Benin. Agriculture, Ecosystems and Environment 93 (2002) 367–378
Bonhof, M. J., Overholt, W. A., Van Huis, A. Polaszek, A., 1997. Natural Enemies of Cereal Stemborers in East Africa: a Review. International Journal of Tropical Insect Science, 17, pp 19-35. doi:10.1017/S1742758400022141.
Bruce, Y. A., Schulthess, F., Mueke, J., Gohole, L., 2009.'Egg parasitoids of noctuid stemborers on maize in Kenya',International Journal of Biodiversity Science & Management,5:3,174 — 180
Cugala, D. R., 2007. Impact assessment of natural enemies on stem borer populations and maize yield in three agroecological zones in Mozambique. PhD thesis, Kenyata University. Nairobi, Kenya.

Cugala, D., Omwega, C. O., 2001. Cereal stemborer distribution and abundance, and introduction and establishment of Cotesia flavipes Cameron (Hymenoptera: Braconidae) in Mozambique. International Journal of Tropical Insect Science, 21, pp 281-287.
De Groote, H., Ajuonu, O., Attignon, S., Djessou, R., Neuenschwander, P., 2003. Economic impact of biological control of water hyacinth in Southern Benin. Ecological Economics 45: 105-117.
DeBach, P., Rosen, D., 1991. Biological control by natural enemies, 2nd edn. Cambridge: Cambridge University Press.
Denic, M., Chauque, P., Fato, P., Haag, W., Mariote, D., Langa, M., Jose, C., 2001. Maize screening for multiple stress tolerance and agronomic traits. Seventh Eastern and Southern Africa Regional Maize Conference.
Diao, X., Fan, S., Headey, D., Johnson, M., Pratt, A. N., Yu, B., 2008. Accelerating Africa’s Food production in Response to Rising Food Prices Impacts and Requisite Actions. IFPRI Discussion Paper 00825.
Emana, G., Overholt, W.A., Kairu, E., MacOpiyo, L., Zhou, G., 2002. Predicting the Distribution of Chilo partellus (Swinhoe) and Its Parasitoid Cotesia flavipes Cameron in Ethiopia using Correlation, Step-wise Regression and Geographic Information Systems.
FAOSTAT., 2014. FAOSTAT. (Available from http://faostat.fao.org) (Accessed on June 2014)
Getu, E., Overholt, W.A., Kairu, E., Omwega, C.O., 2003. Evidence of the establishment of Cotesia flavipes (Hymenoptera: Braconidae), a parasitoid of cereal stem borers, and its host range expansion in Ethiopia. Bulletin of Entomological Research 93: 125-129.
Griliches, Z., 1958. “Research Costs and Social Returns: Hybrid Corn and Related Innovations,” Journal of Political Economy, 66 (5), pp. 419-431.
Hajek, A., 2004. Natural Enemies: An Introduction to Biological Control. Cambridge: Cambridge University Press.
JAICAF., 2008. The maize in Zambia and Malawi. Japan Association for International Collaboration for Agriculture and Forestry
Jones, R., Saunders, G. & Balogh, R., 2006. An Economic Evaluation of a Pest Management Control Program: ‘Outfox the Fox’. Economic Research Report No. 29
Kfir R., 1998. Maize and Grain Sorghum: Southern Africa. In Polaszek., A., 1998. (Ed.) African cereal stem borers: economic importance, taxonomy, natural enemies and control. CAB International, Wallingford, Oxon, UK, 530 pp.
Kfir, R., 2002. Increase in cereal stem borer populations through partial elimination of natural enemies. Entomologia Experimentalis et Applicata 104: 299–306, 2002.
Kfir, R., Overholt, W. A., Khan, Z. R. and Polaszek, A., 2002. Biology and management of economically important lepidopteran cereal stemborers in Africa. Annu. Rev. Entomol. 2002. 47:701–31
Kipkoech, A., Schulthess, F., Yabann, W., Maritim, H., Mithöfer, D., 2006. Biological control of cereal stem borers in Kenya: A cost benefit approach. Ann. soc. entomol. Fr. (n.s.), 2006, 42 (3-4) : 519-528

Kipkoech, A., Schulthess, F., Yabann, W., Maritim, H., Erick, M., Mithöfer, D., 2009. The economic value of releasing parasitoid for the control of maize stemborers in East and Southern Africa. Contributed paper prepared for presentation at the International Association of Agricultural Economics Conference, Beijing, China, August 16-22, 2009
Lazarovitz, G., Goettel, S., Vincent, C., 2007. Adventures in Biological Control. In Vincent C, Goettel S and Lazarovitz G (2007) Biological Control, a global perspectives: Case studies from around the world, CABI
Le Rü, B., Ong’amo, G., Moyal, P., Muchugu, E., Ngala, L., Musyoka, B., Abdullah, Z., Matama-Kauma, T., Yahya Lada, V., Pallangyo, B., Omwega, C., Schulthess, F., Calatayud, P., Silvain, J., 2013. Geographic distribution and host plant ranges of East African noctuid stem borers. International Journal of Entomology, 42:3-4, 353-361
Lv, J., Wilson, L.T., Beuzelin, J.M., White, W.H., Reagan., T.E. Way, M.O., 2010. Impact of Cotesia flavipes (Hymenoptera: Braconidae) as an augmentative biocontrol agent for the sugarcane borer (Lepidoptera: Crambidae) on rice. Biological Control 56 (2011) 159–169
Machariaa, I., Lohra, B., De Groote, H., 2005. Assessing the potential impact of biological control of Plutella xylostella ( diamondback moth) in cabbage production in Kenya. Crop Protection 24 (2005) 981-989
Mailafiya, D., Le Ru, B., Kairu, W., Calatayud, P., Dupas, S., 2008. Species diversity of lepidopteran stem borer parasitoids in cultivated and natural habitats in Kenya. J. Appl. Entomol. 133 (2009) 416–429
Maredia, M., Byerlee, D. Anderson., J. R., 2000. Ex-post evaluation of Economic impacts of agricultural Research Programs: A tour of good practice. Proceedings of a workshop organized by the Standing Panel on Impact Assessment of the Technical Advisory Committee CGIAR-TAC: “The Future of Impact Assessment in the CGIAR”, 3-5- May 2000, Rome, Italy.
Maredia, M. K., Shankar, B., Kelley, T. G., Stevenson, J. R., 2014. Impact assessment of agricultural research, institutional innovation, and technology adoption: Introduction to the special section. Food Policy, 44, 214-217.
Masters, A.W., Coulibaly, B., Sanogo, D., Sidibé, M., Williams, A., 1996. The economic impact of agricultural research:a practical guide. Department of Agricultural Economics, Purdue University
Mbithi, L., Huylenbrock, V.G., 2000. A comparaison of maize production in Kenya before and after liberalization, tropicultura 2000, pp 191-186
Mensah, E.C., Clifford, E., Wohlgenant, K., 2009. A market impact analysis of soybean technology adoption. Research in Business and Economics Journal.
Moolman, J., Van Den Berg, J., Conlong, D., Cugala, D., Siebert, S., Le Ru, B., 2014. Species diversity and distribution of lepidopteran stem borers in South Africa and Mozambique. Journal of Applied Entomology 138: 52–66
Moonga, M.N., 2007. Assessment of infestation level of Chilo partelus swinhoe (Lepidoptera:crambidae) o maize and the impact of its parasitoid Cotesia flavipes Cameron (Hymenoptera:Braconide) in Sinazongwe District of Zambia. Master thesis, University of Zambia

Moore, R.M., Gollehon, N.R.& Hellerstein, D.M., 2000. Estimating Producer's Surplus with the Censored Regression Model: An Application to Producers Affected by Columbia River Basin Salmon Recovery. Journal of Agricultural and Resource Economics 25(2):325-346
Mose, L., Burger, K., Kuvyenhoven, A., 2007. Agregate supply response to price incentives: the case of smallholder of maize production in Kenya. African Crop Sciences Conference proceedings, vol. 8 pp. 1271-1275.
Norgaard, R. B., 1988. The Biological Control of Cassava Mealybug in Africa. American Journal of Agricultural Economics. 70(2):366-71.
Norton, G., Davis, J., 1981. Evaluating Returns to Agricultural Research: A Review. American Journal of Agricultural Economics 63(4):685-699.
Odendo, M., Ouma, J., Wachira, S., Wanyama, J., 2003. Economic assessment of maize yield loss due to stem borer in major maize agro-ecological zones of Kenya. African Crop Science Conference Proceedings, Vol. 6. 683-687
Olwande, J., Ngigi, M., Nguyo, W., 2009. Supply responsiveness of maize farmers in kenya: a farm-level analysis. Contributed Paper prepared for presentation at the IAAE 2009 Conference, Beijing, China, August 16-22, 2009.
Omwega, C., Muchugu, E., Overholt, W., Schulthess, F., 2006. Release and establishment of C flavipes, an exotic parasitoid of C partellus in East and Southern Africa, Annales de la Societe entomologique de France (NS). 42:3-4, 511-517
Omwega, C.O., Kimani, S.W., Overholt, W.A., Ogol, C.K.P.O., 1995. Evidence of the establishment of Cotesia flavipes Cameron (Hymenoptera: Braconidae) in continental Africa. Bulletin of Entomological Research 85 : 525-530.
Omwega, C.O., Overholt, W.A., Mbapila J.C. & Kimani-Njogu, S.W., 1997 . Establishment and dispersal of Cotesia flavipes (Cameron), an exotic endoparasitoid of Chilo partellus Swinhoe in northern Tanzania. African Entomology 5: 71-75.
Onono, P.A., Wawire, N.W.H., Ombuki, C., 2013. “The response of maize production in Kenya to economic incentives”, International Journal of Development and Sustainability, Vol. 2 No. 2, pp. 530-543.
Overholt, W. A., Ochieng J. O., Lammers, P. M., Ogedah, K., 1994 Rearing and field release methods for Cotesia flavipes Cameron (Hymenoptera: Braconidae), a parasitoid of tropical gramineous stemborers. Insect Sci. Applic. 15, 253-259.
Overholt, W.A., Maes, K.V.N., Goebel, F.R., 2001. Field Guide to the Stem Borer larvae of Maize, Sorghum and Sugarcane in Eastern and Southern Africa. ICIPE Science Press, Nairobi, Kenya.
Polaszek, A., 1998. (Ed.) African cereal stem borers: economic importance, taxonomy, natural enemies and control. CAB International, Wallingford, Oxon, UK, 530 pp.
Sallam, M.N., Overholt, W.A., Kairu, E., 2000. Dispersal of the exotic parasitoid Cotesia flavipes in a new ecosystem. Entomologia Experimentalis et Applicata 98: 211–217
Schulthess, F., Chabi-Olaye, A., Goergen, G., 2001. Seasonal fluctuations of noctuid stemborer egg parasitism in southern Benin with special reference to Sesamia calamistis Hampson

(Lepidoptera: Noctuidae) and Telenomus spp Hymenoptera: Scelionidae) on maize. Biocontrol Science and Technology 11, 765–77.
Schultz, T. W., 1953. The Economic Organization of Agriculture, McGraw-Hill, 1953.
Simatele, M. C. H., 2006. Food production in Zambia: The impact of selected structural adjustment policies. African Economic Research Consortium (AERC)
Simmonds, F.J., 1967. The economics of biological control. Journal of the Royal Society of Arts, Vol. 115, No. 5135 (OCTOBER 1967), pp. 880-898
Smale, M., Byerlee, D., Jayne, T., 2011. Maize evolutions in Sub-Saharan Africa. The World Bank Development Research Group, Policy Research Working Paper 5659
Thirtle, C., Lin, L., Piesse, J., 2003. The Impact of Research-Led Agricultural Productivity Growth on Poverty Reduction in Africa, Asia and Latin America. World Development, 31(12), 1959 -1975. doi: 10.1016/j.worlddev.2003.07.001
USAID, 2009. Staple foods value-chain - country report: Zambia. USAID
Van den Berg, J., Nur, A.F., 1998. Chemical Control. In Polaszek., A., 1998. (Ed.) African cereal stem borers: economic importance, taxonomy, natural enemies and control. CAB International, Wallingford, Oxon, UK, 530 pp.
Varela, A. M., Seif, A., Löhr, B., 2003. A Guide to IPM in Brassicas production in Eastern and Southern Africa. ICIPE Science Press.
World Bank, 2006. Mozambique, Agricultural Development Strategy: Stimulating Smallholder Agricultural Growth. Report No. 32416 MZ
Zeddies, J., Schaab, P., Neuenschwander, P., Herren, H., 2001. Economics of biological control of cassava mealybug in Africa. Agricultural Economics 24 (2001) 209–219
Zhao, X., Mullen, J.D., Griffith, G., 1997. Functional Forms, Exogenous Shifts, and Economic Surplus Changes. Amer. J. Agr. Econ. 79 (November 1997): 1243-1251
Zhou, G., Baumgartner, J., Overholt, W.A., 2001. Impact of an exotic parasitoid on stemborer (Lepidoptera) populations dynamics in Kenya. Ecol. Appl. 11: 1554–62

Tables and Figures
Kenya Mozambique
Zambia
Figure 1. Points of released of parasitoids in the study countries

Figure 2. Trends in maize and sorghum area and yield in Kenya
Figure 3. Trends in maize and sorghum area and yield in Mozambique
Figure.4: Trends in maize and sorghum area and yield in Zambia
0
500
1000
1500
2000
2500
3000
3500
0
500
1000
1500
2000
19
90
19
91
19
92
19
93
19
94
19
95
19
96
19
97
19
98
19
99
20
00
20
01
20
02
20
03
20
04
20
05
20
06
20
07
20
08
20
09
20
10
20
11
20
12
20
13
Yie
ld (
kilo
gram
me
pe
r h
a)
Are
a (x
10
00
ha)
KENYA Maize area
Sorghum area
Maize yield
Sorghum yield
0
500
1000
1500
2000
2500
3000
3500
0
500
1000
1500
2000
19
90
19
91
19
92
19
93
19
94
19
95
19
96
19
97
19
98
19
99
20
00
20
01
20
02
20
03
20
04
20
05
20
06
20
07
20
08
20
09
20
10
20
11
20
12
20
13
Yie
ld (
kilo
gram
me
pe
r h
a)
Are
a (x
10
00
ha
MOZAMBIQUE
Maize areaSorghum areaMaize yieldSorghum yield
0
500
1000
1500
2000
2500
3000
3500
0
200
400
600
800
1000
1200
19
90
19
91
19
92
19
93
19
94
19
95
19
96
19
97
19
98
19
99
20
00
20
01
20
02
20
03
20
04
20
05
20
06
20
07
20
08
20
09
20
10
20
11
20
12
20
13
Yie
ld (
kilo
gram
me
pe
r h
a)
Are
a (x
10
00
ha)
ZAMBIA
Maize area Sorghum area
Maize yield Sorghum yield

Kenya 20028 Kenya 2008 Kenya 2013
Mozambique 2002 Mozambique 2008 Mozambique 2013
Zambia 2002 Zambia 2008 Zambia 2013
Figure 6. Evolution of BC spread in the study countries
8 Spread modeled considering the lower spread rate found in the literature (11.2 km.year-1 – Omwega et al (2006)

Figure 7. Trends in estimated proportions of area under crop covered by BC-agents
Table 1. Targeted stemborers and their characteristics
Stem borers Origin Common name
Crop infested
Damage on crops
Distribution Reported yield loss
Chilo partellus
(Swinhoe)
(Lepidoptera:
Crambidae)
Exotic
(Introduce
d in Africa
through
Malawi in
1935)
Spotted
borer maize,
sorghum,
rice
sugarcane
Leaf damage,
dead-heart,
direct damage
to grain,
increase
susceptibility
to stalk rot and
lodging
East and
Southern
Africa in
warm and
low altitude
14-40% on maize (De
Groote et al., 2003)
12-30% (Polaszek,
1998)
Busseola fusca
(Fuller)
(Lepidoptera:
Noctuidae)
Indigenou
s to Africa
African
maize
borer
maize,
sorghum,
millet,
Feed on stem
and leaves
Sub-Saharan
Africa, in
cool high
altitude area
in Eastern
20-80% (Kfir et al.,
2002)
26 – 28% (Harris,
1962)
Sesamia
calamistis
Hampson.
(Lepidoptera:
Noctuidae)
Indigenou
s to Africa
Pink
borer maize,
sorghum,
finger
millet,
rice
sugarcane
Attack a
number of
young stems,
feed on stem
Sub-Saharan
Africa,
prevalent in
medium and
low altitude
areas
20-40% (Nsami et al,
2002)
0
0.1
0.2
0.3
0.4
0.5
0.6
0.7
0.8
0.9
1
19
93
19
94
19
95
19
96
19
97
19
98
19
99
20
00
20
01
20
02
20
03
20
04
20
05
20
06
20
07
20
08
20
09
20
10
20
11
20
12
20
13
Maize_Kenya
Sorgum_Kenya
Maize_Mozambique
Sorghum_Mozambique
Maize_Zambia
Sorghum_Zambia
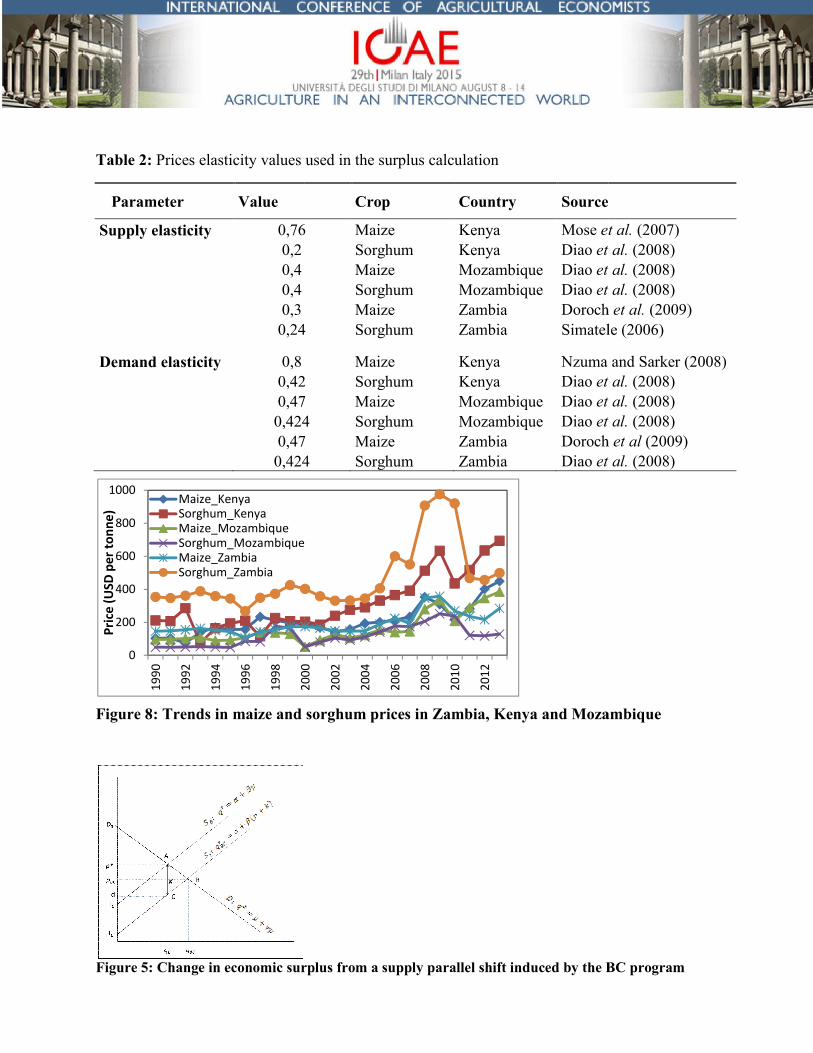
Table 2: Prices elasticity values used in
Parameter Value
Supply elasticity 0,760,2 0,4 0,4 0,3 0,24
Demand elasticity 0,8 0,420,470,4240,47
0,424
Figure 8: Trends in maize and sorghum prices in Zambia, Kenya and Mozambique
Figure 5: Change in economic surplus from a supply parallel shift induced by the BC program
0
200
400
600
800
1000
19
90
19
92
19
94
19
96
19
98
20
00
Pri
ce (
USD
pe
r to
nn
e)
Maize_KenyaSorghum_KenyaMaize_MozambiqueSorghum_MozambiqueMaize_ZambiaSorghum_Zambia
lasticity values used in the surplus calculation
Crop Country Source
76 Maize Kenya Mose et
Sorghum Kenya Diao et al.
Maize Mozambique Diao et al.
Sorghum Mozambique Diao et al.
Maize Zambia Doroch
0,24 Sorghum Zambia Simatele (2006)
Maize Kenya Nzuma 0,42 Sorghum Kenya Diao et al.
0,47 Maize Mozambique Diao et al.
0,424 Sorghum Mozambique Diao et al.
0,47 Maize Zambia Doroch
0,424 Sorghum Zambia Diao et al.
aize and sorghum prices in Zambia, Kenya and Mozambique
hange in economic surplus from a supply parallel shift induced by the BC program
20
00
20
02
20
04
20
06
20
08
20
10
20
12
Sorghum_Mozambique
et al. (2007) et al. (2008) et al. (2008) et al. (2008)
Doroch et al. (2009)
Simatele (2006)
Nzuma and Sarker (2008) et al. (2008) et al. (2008) et al. (2008)
Doroch et al (2009) et al. (2008)
aize and sorghum prices in Zambia, Kenya and Mozambique
hange in economic surplus from a supply parallel shift induced by the BC program
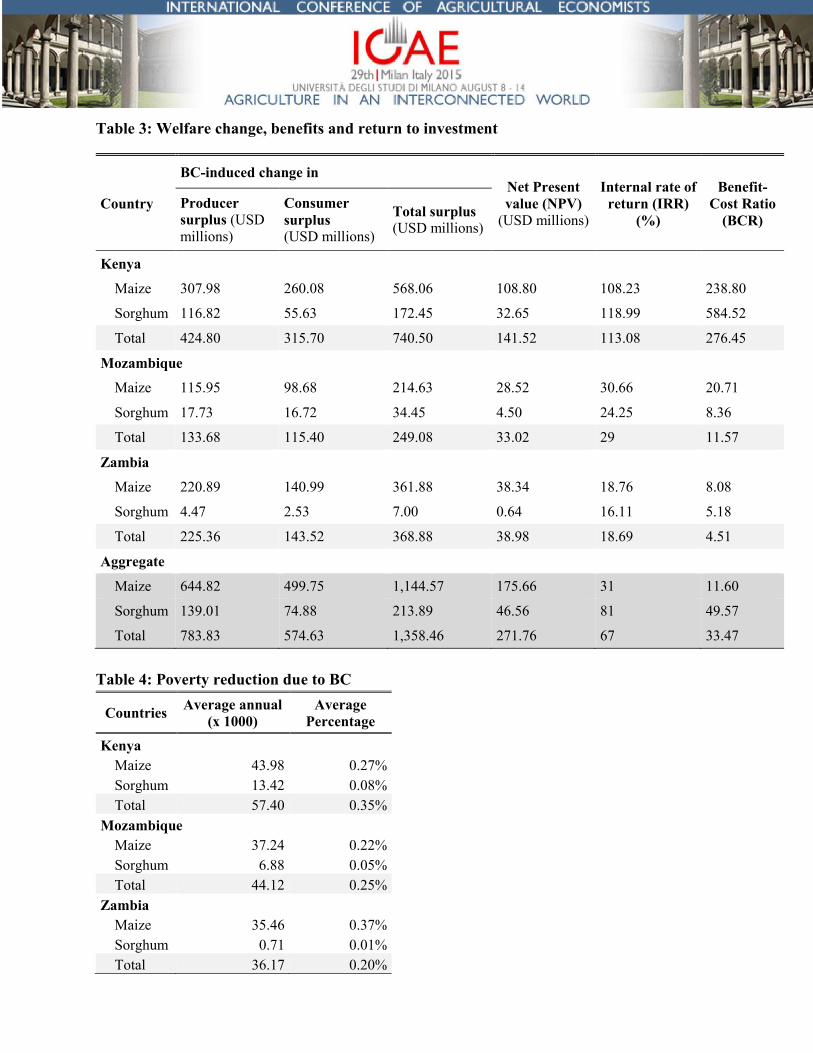
Table 3: Welfare change, benefits and return to investment
Country
BC-induced change in Net Present value (NPV)
(USD millions)
Internal rate of return (IRR)
(%)
Benefit-Cost Ratio
(BCR) Producer surplus (USD millions)
Consumer surplus (USD millions)
Total surplus (USD millions)
Kenya
Maize 307.98 260.08 568.06 108.80 108.23 238.80
Sorghum 116.82 55.63 172.45 32.65 118.99 584.52
Total 424.80 315.70 740.50 141.52 113.08 276.45
Mozambique
Maize 115.95 98.68 214.63 28.52 30.66 20.71
Sorghum 17.73 16.72 34.45 4.50 24.25 8.36
Total 133.68 115.40 249.08 33.02 29 11.57
Zambia
Maize 220.89 140.99 361.88 38.34 18.76 8.08
Sorghum 4.47 2.53 7.00 0.64 16.11 5.18
Total 225.36 143.52 368.88 38.98 18.69 4.51
Aggregate
Maize 644.82 499.75 1,144.57 175.66 31 11.60
Sorghum 139.01 74.88 213.89 46.56 81 49.57
Total 783.83 574.63 1,358.46 271.76 67 33.47
Table 4: Poverty reduction due to BC
Countries Average annual
(x 1000) Average
Percentage
Kenya
Maize 43.98 0.27%
Sorghum 13.42 0.08%
Total 57.40 0.35%
Mozambique
Maize 37.24 0.22%
Sorghum 6.88 0.05%
Total 44.12 0.25%
Zambia
Maize 35.46 0.37%
Sorghum 0.71 0.01%
Total 36.17 0.20%

Table 5: Sensitivity analysis of the impact of Biological Control on maize and sorghum stemborers to yield gain
Parameter Country Parameter Surplus NPV IRR BC ratio Poverty
Base Change (%) Value Value
Change (%) Value
Change (%) Value
Change (%) Value
Change (%) Value
Change (%)
Cotesia flavipes (yield gain)
Kenya 10 -50 5.0 395.6 -46.6 73.1 -48.3 93% -17.3 143.4 -48.1 0.18% -48.2 10 50 15.0 1112.5 50.2 214.9 51.9 126% 11.2 419.2 51.7 0.54% 51.7
Mozambique 10 -50 5.0 157.9 -36.6 19.6 -40.6 25% -13.6 7.3 -37.1 0.16% -37.7 10 50 15.0 341.8 37.2 46.6 41.2 32% 9.7 15.9 37.7 0.35% 38.2
Zambia 10 -50 5.0 245.2 -33.5 21.2 -46.1 16% -15.1 3.0 -34 0.13% -37.3 10 50 15.0 494.4 34.0 57.6 46.7 21% 11.0 6.2 34.4 0.27% 37.8
Xanthopimpla stemmator (Yield gain)
Kenya 15 -50 7.5 703.0 -5.1 136.8 -3.3 113% 0.0 267.3 -3.3 0.34% -3.2 15 50 22.5 778.6 5.1 146.3 3.4 113% 0.0 285.7 3.3 0.36% 3.3
Mozambique 15 -50 7.5 213.6 -14.2 28.1 -15.0 28% -3.6 10.0 -13.7 0.22% -13.0 15 50 22.5 284.8 14.3 38.0 15.1 30% 3.2 13.2 13.8 0.28% 13.1
Zambia 15 -50 7.5 305.2 -17.3 30.4 -22.7 18% -6.4 3.8 -16.8 0.17% -16.7 15 50 22.5 433.1 17.4 48.3 22.9 20% 5.5 5.4 16.9 0.24% 16.9