economic viability under frozen conflict: the island of
TRANSCRIPT

Economic Viability Under Frozen Conflict:
“The Island of Transnistria”
Iryna Sabor
Master’s Thesis in Peace and Conflict Studies Department of Political Science
UNIVERSITY OF OSLO
Spring 2012

ii

iii
Economic Viability Under Frozen Conflict:
“The Island of Transnistria”
Iryna Sabor
Master’s Thesis in Peace and Conflict Studies
Department of Political Science
University of Oslo, Spring 2012
(Total number of words: 26 237)

iv
© Iryna Sabor
2012
Economic Viability Under Frozen Conflict: ”The Island of Transnistria”
Iryna Sabor
http://www.duo.uio.no/
Print: Reprosentralen, Universitetet i Oslo

v
Acknowledgements
First of all, I would like to express my deepest appreciation of the guiding
support and supervision of Prof. Halvor Mehlum from the Department of Social
Sciences of the University of Oslo, whose essential suggestions the research relied on.
Special acknowledgement should be given to Joël Cariolle, who so generously
provided his expertise and experience for the calculations of the Economic
Vulnerability Index. Also Matthias Bruckner from the Secretariat of the Committee for
Development Policy, Development Policy and Analysis Division of UN Department of
Economic and Social Affairs merits special mention for his useful advices.
Acknowledgement is also extended to Helge Blakkisrud from Norwegian
Institute for Foreign Affairs (NUPI), and Prof. Pål Kolstø from the University of Oslo
for their valuable suggestions on Transnistrian conflict.
A part of the thesis is to a high degree a collaborative undertaking of the
experts interviewed, who made a substantial input to Chapter 4.
Finally, I am forever indebted to my parents and Yuriy for their understanding,
endless patience, constructive criticism and encouragement.

vi
Summary
The thesis attempts at assessing dynamics of economic viability of Moldova’s
break-away region Transnistria living under frozen conflict. By assuming that
Transnistria is a small developing island state, Briguglio’s methodology of
juxtaposition of structural economic vulnerability and resilience was employed for the
research. A quantitative method of calculating the Economic Vulnerability Index was
combined with a qualitative analysis of expert interviews to estimate the structural
economic vulnerability and resilience of the separatist republic respectively, and draw
conclusions on the region’s economic viability. Also other theoretical and empirical
studies on SIDS were utilized to explain the pattern of economic viability under frozen
conflict and point to possible implications for the future. Finally, suggestions are made
on possible use of the methodology elaborated in the research in similar studies on
other de facto states.
Key words: de facto state, economic viability, Economic Vulnerability Index
(EVI), frozen conflict, resilience, secession, small island developing state, state
building, structural economic vulnerability

vii
Contents
Acknowledgements ......................................................................................................... v
Summary ........................................................................................................................ vi
Introduction ..................................................................................................................... 1
1 Transnistria’s State Building Project ........................................................................... 5
1.1 From the History of the Conflict ........................................................................ 5
1.2 Building Economy - Building the State ............................................................. 9
2 Theoretical Approaches to Viability of de facto Economy ..................................... 15
2.1 Viability of Transnistria's Economy: Research and Knowledge Gaps ............ 15
2.2 de facto Economy: Transnistria as a Small Island Developing State .............. 18
2.3 Vulnerability and Resilience as Viability Measure: Main Theories ............... 22
3 Methodology for the Estimation of Transnistria's Economic Viability ..................... 26
3.1 Measuring Economic Vulnerability ................................................................. 26
3.1.1 The History of the Economic Vulnerability Index ................................. 26
3.1.2 The Concept of Structural Economic Vulnerability. .............................. 28
3.1.3 The EVI Components. ............................................................................ 31
3.1.4 Applying the EVI Methodology to a de Facto State. ............................. 36
3.2. Defining Economic Resilience. ....................................................................... 38
3.2.1 The Concept of Resilience ...................................................................... 38
3.2.2 Identifying Methods to Assess Resilience of Transnistrian Economy ... 39
3.3 Estimation of Economic Viability .................................................................... 41
4 Economic Viability of "The Island of Transnistria" .................................................. 43
4.1 Calculation of the EVI Components for Transnistria. . ................................... 43
4.2 EVI Scores: Behind the Vulnerability Façade ................................................. 49
4.3 Transnistria's Resilience Profile ....................................................................... 52
4.4 Economic Viability of Transnistria .................................................................. 56
viii
Conclusions. .................................................................................................................. 59
List of Figures and Tables............................................................................................. 62
References ..................................................................................................................... 63
Appendixes:. ................................................................................................................. 73

1
Introduction
Over the past 70 years nearly 20 unrecognized or de facto states1 appeared on
the political map of the world. The usually tiny grey spots with blurred boundaries
often resemble small abandoned islands: as a meeting place of myth and mystery, de
facto states remain equally unknown to the world. Unlike the gardens of Eden arising
in the imagination whenever a small island is mentioned, de facto states are most
commonly associated with an “offshore” paradise for illegal businesses and criminal
activity.
Despite prevailing skepticism, there have been examples in history when de
facto states reached international recognition and continued their existence as
independent countries. The most known example to mention here is the Democratic
Republic of Timor-Leste – the first sovereign state born in the 21st century. Intense
diplomatic efforts have opened for limited recognition by a number of UN members of
the State of Palestine and the Republic of Kosovo. The Republic of China (Taiwan)
has opted for a strikingly unique strategy of living in the non-recognition: refraining
from the struggle for a formal recognition while at the same time, boosting pragmatic
cooperation with the world. The Republic of Abkhazia, the Republic of South Ossetia,
the Pridnestrovian Moldovan Republic, PMR (Transnistria), the Republic of Nagorno-
Karabakh and the Turkish Republic of Northern Cyprus are either recognized or
informally supported by their patron states2 only. While the Republic of Somaliland
keeps struggling for existence retaining no legitimacy beyond own sovereignty claims,
1 Unrecognized states are also called de facto states, quasi-states (Kolstø), separatist states (Lynch), or pseudo-
states (Troebst). Pegg (2008) defines the following six characteristic features of de facto states: organized
political leadership, sufficient capacity to provide governance, effective control of a territory for at least 2 years,
capable of entering relations with other states, seeking a wide-spread international recognition, and the final
feature is the lack of the wide-spread international recognition. Sharing this view, Caspersen (2011) speaks about
unrecognized states as characterized by de facto independence, including control over most claimed territory for
at least two years; lack of very broad international recognition; and a demonstrated aspiration for full, de jure,
independence. Despite the lack of a clear tradition in the use of the terms, the “de facto state”, as defined by
Pegg (2008), has been more commonly used and therefore will be preferred in the thesis.
2 The concept “patron states” is used in the literature to define the states that support the breakaway region both
financially and politically, usually for strategic or historical reasons.
2
a bulk of de facto entities (the recent example being Tamil Eelam) were integrated
back into their parent states3.
All in all, de facto existence may last for a lengthy period of time, the reasons
being manifold. Setting the geopolitical considerations and military capacity aside, the
factor of economic viability appears to play a role. In the first comprehensive study of
the secessionist economy4, Bookman (1993: 145-146) defined economic viability as
“ability to sustain growth in the aftermath of secession at the preindependence levels”
and mentioned it among the factors contributing to the success of a region’s efforts to
secede (Bookman 1993:3).
Being vital for political survival, economic development of de facto states is
perceived to be considerably constrained by the lack of legitimate status and often also
by an ongoing conflict with the parent state. Traditionally, such conflicts in the post
Soviet space, where most of the present day de facto entities struggle for existence, are
referred to as frozen conflicts5 (or “protracted conflicts” in the OSCE terminology).
The “no peace no war” situation in the four self-proclaimed republics (Transnistria,
South Ossetia, Nagorno-Karabakh and Abkhazia) exerts a destabilizing impact on
economy, leaving few opportunities for legal trade with foreign countries. Surprisingly
enough, in some of de facto states, and primarily in Transnistria, frozen conflict has
urged active state-building and economic development efforts. In the absence of the
final settlement in the conflict, Transnistrian de facto government seems to have
launched efforts, accompanied by the corresponding propagandistic campaigns, to
3 The parent state is the state that used to incorporate the breakaway region and claims jurisdiction over the entity
(Bookman 1993, Kolstø 2006). Nodia (2004) offers an alternative term, the rump state, which is, however,
seldom in use.
4 According to Crawford, secession is “the creation of a state by the use or threat of force without the consent of
the former sovereign” (Crawford 2006:375). A more simplistic definition is provided by Pavkovic and Radan:
“creation of new states by the withdrawal of a territory and its population from an existing state” (Pavkovic and
Radan 2007:2). While Premdas (1990:15-16) defines secession through its main characteristics: “an organized
struggle, a demand for territorial self-government, common language, religion or ethnicity, a perception of self-
determination as a right, and the desire to be a state in the international organization”. Premdas’ definition is
closest to the definition of de facto states, given earlier in the Introduction and adhered to further in the thesis.
5Frozen conflicts are best defined by Nodia (2004) as those in which violent ethnopolitical conflict over
secession has led to the establishment of a de facto regime that is recognized by neither the international
community nor the rump (parent) state from which the secession occurred and, as Clancy and Nagle (2009:14)
add, which ended with a stalemate without any peace agreement signed.

3
build a viable and functioning economy as a prerequisite for international recognition
in the future. These efforts confirm functionality of status quo6 and call for a vigorous
scientific research of economic development under frozen conflict.
In this context, Transnistria represents a highly interesting case. Proclaimed in
1990, Moldova’s breakaway region possesses practically no ethnic identity. There is
no “Transnistrian language”, neither has the “Transnistrian nation” been ever
mentioned in history. Transnistrian de facto statehood is closely related to the territory,
referring back to the island metaphor. Like a small island state, Transnistria struggles
for a viable economy with the limited resources available, despite the isolation and
unfavorable (hostile) environment. Whereas, building a viable economy corresponds
with Transnistrian state-building efforts aimed at putting an end to the exhausting
frozen conflict. How vulnerable is its de facto economy to external factors? Is it viable
enough to offset the adverse impact of the frozen conflict situation? Has its capacity to
survive changed over the years after secession? And in the end of the day, is it able to
survive in the long run?
The thesis will explore the economic viability of Transnistria over the past 10
years to reveal its dynamics, to assess its present potential, as well as to predict the
future scenario of its economic development under frozen conflict. Since the
quantitative scientific research on the issue has been modest, an attempt will be made
to elaborate an appropriate methodology to assess de facto economy’s viability. For
this purpose it will be assumed that Transnistria is a small island developing state
(SIDS). By employing the SIDS theory developed by Briguglio (1995) the thesis will
consider economic vulnerability and economic resilience of Transnistria as main
antagonistic determinants of its economic viability. The region’s vulnerability will be
measured by the Economic Vulnerability Index developed by the UNDESA (2008)
and refined by Guillaumont (2009) and Cariolle (2011a), while its resilience will be
explored through qualitative analysis of expert interviews.
6According to Kemp (2011), it is now necessary to reconceptualize frozen conflicts and to stop viewing the
status quo as dysfunctional. Conflict resolution might not always be possible and de facto states might be seen to
represent a new hybrid form in the international system. Therefore, there is need for a focus on the on-the-
ground issues in frozen conflicts, such as economic development and the need for rebuilding trust.

4
The thesis will begin with a brief outline of the history of the conflict. By
revealing the role of economy in Transnistria’s state-building project, the research
question will be posed. In the second chapter, the knowledge gaps will be located and
clear aims for the research will be set. Revealing similarities between de facto states
and SIDS, the thesis will proceed by setting main theories of economic development of
the small island developing states as a theoretical framework to assess the economic
viability of Transnistria’s de facto state. The notions of structural economic
vulnerability and economic resilience will be defined. In the end of the chapter,
economic viability will be presented as juxtaposition of the two notions. Finally, the
research objective will be accordingly refined.
The third chapter will dwell upon research methods. The thesis will draw
arguments for the use of the EVI index, developed by the UN for SIDS and least
developed countries (LDCs), to measure Transnistria’s vulnerability, and proceed by a
detailed description of the index components. The other part of the chapter will be
devoted to the method of expert interviews to be applied to assess Transnistria’s
economic resilience.
In the final fourth chapter scores of the retrospective EVI computed for
Transnistria for the period of 2001-2010 will be presented and interpreted. Further, the
economic resilience of Transnistria will be explored on the basis of knowledge
gathered in the course of experts interviewing. Relieving some limitations of the
theoretical framework, the thesis will point to several topics requiring further research.
Finally, conclusions will be drawn on Transnistria’s economic viability, as
well as on applicability of the methodology used in the thesis to similar researches on
other de facto states living under frozen conflict. To sum up, some implications of the
empirical findings will be suggested.
Recognizing the importance of consistency, the term “de facto state” will be
adhered to throughout the research. “Separatist republic” and “Moldova’s break-away
region” will be occasionally used for linguistic brilliance, since according to the
international law Transnistria is still a part of Moldova. As the conflict is characterized
by relatively peaceful coexistence between the state and the secessionist region, the
term “conflict settlement” negotiations instead of “peace negotiations” is preferred.
5
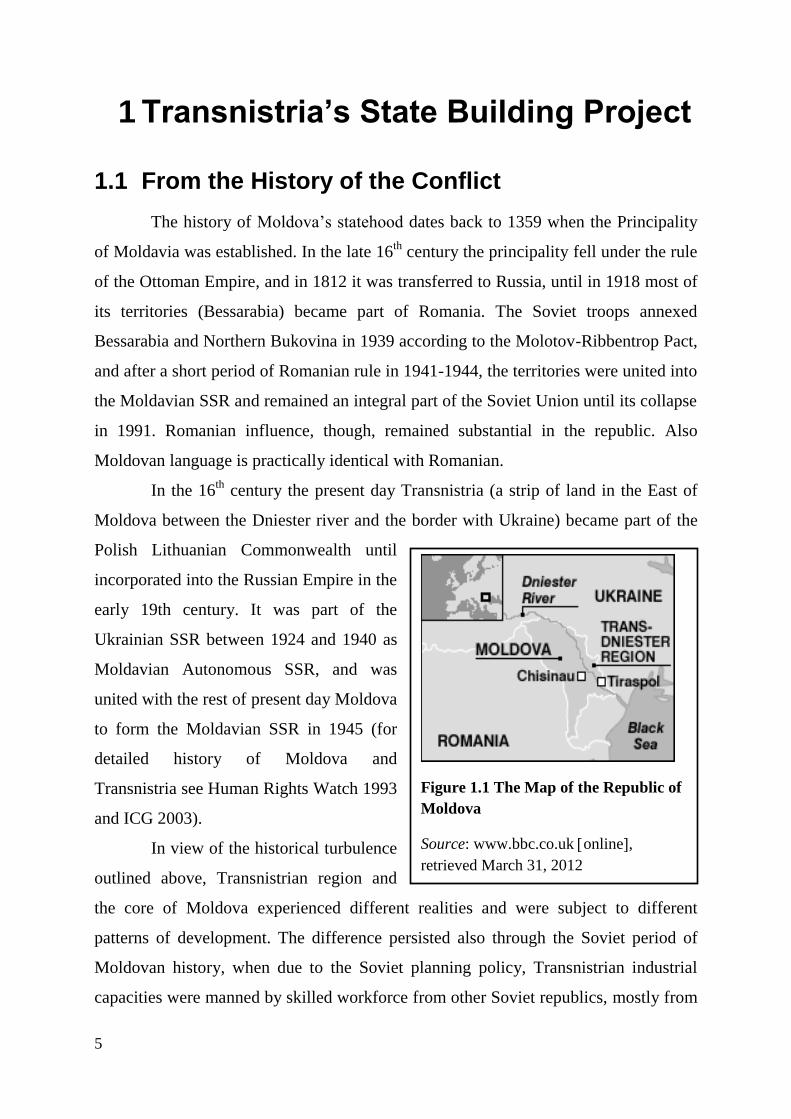
Figure 1.1 The Map of the Republic of
Moldova
Source: www.bbc.co.uk online,
retrieved March 31, 2012
1 Transnistria’s State Building Project
1.1 From the History of the Conflict
The history of Moldova’s statehood dates back to 1359 when the Principality
of Moldavia was established. In the late 16th
century the principality fell under the rule
of the Ottoman Empire, and in 1812 it was transferred to Russia, until in 1918 most of
its territories (Bessarabia) became part of Romania. The Soviet troops annexed
Bessarabia and Northern Bukovina in 1939 according to the Molotov-Ribbentrop Pact,
and after a short period of Romanian rule in 1941-1944, the territories were united into
the Moldavian SSR and remained an integral part of the Soviet Union until its collapse
in 1991. Romanian influence, though, remained substantial in the republic. Also
Moldovan language is practically identical with Romanian.
In the 16th
century the present day Transnistria (a strip of land in the East of
Moldova between the Dniester river and the border with Ukraine) became part of the
Polish Lithuanian Commonwealth until
incorporated into the Russian Empire in the
early 19th century. It was part of the
Ukrainian SSR between 1924 and 1940 as
Moldavian Autonomous SSR, and was
united with the rest of present day Moldova
to form the Moldavian SSR in 1945 (for
detailed history of Moldova and
Transnistria see Human Rights Watch 1993
and ICG 2003).
In view of the historical turbulence
outlined above, Transnistrian region and
the core of Moldova experienced different realities and were subject to different
patterns of development. The difference persisted also through the Soviet period of
Moldovan history, when due to the Soviet planning policy, Transnistrian industrial
capacities were manned by skilled workforce from other Soviet republics, mostly from
6
neighboring Ukraine and Russia. At the same time, the mainly agrarian rest of
Moldova remained ethnically intact over many years. This was later reflected in ethnic
compound, which contributed to the shaping of Transnistrian separatist movement in
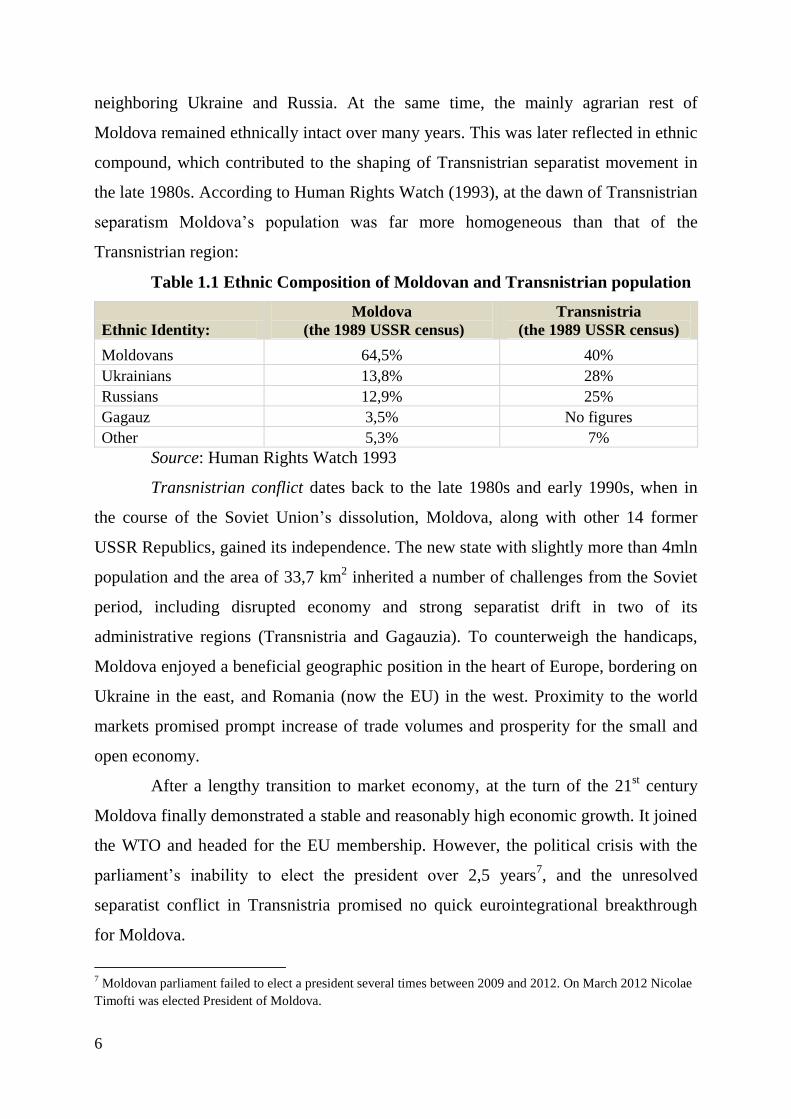
the late 1980s. According to Human Rights Watch (1993), at the dawn of Transnistrian
separatism Moldova’s population was far more homogeneous than that of the
Transnistrian region:
Table 1.1 Ethnic Composition of Moldovan and Transnistrian population
Ethnic Identity:
Moldova
(the 1989 USSR census)
Transnistria
(the 1989 USSR census)
Moldovans 64,5% 40%
Ukrainians 13,8% 28%
Russians 12,9% 25%
Gagauz 3,5% No figures
Other 5,3% 7%
Source: Human Rights Watch 1993
Transnistrian conflict dates back to the late 1980s and early 1990s, when in
the course of the Soviet Union’s dissolution, Moldova, along with other 14 former
USSR Republics, gained its independence. The new state with slightly more than 4mln
population and the area of 33,7 km2 inherited a number of challenges from the Soviet
period, including disrupted economy and strong separatist drift in two of its
administrative regions (Transnistria and Gagauzia). To counterweigh the handicaps,
Moldova enjoyed a beneficial geographic position in the heart of Europe, bordering on
Ukraine in the east, and Romania (now the EU) in the west. Proximity to the world
markets promised prompt increase of trade volumes and prosperity for the small and
open economy.
After a lengthy transition to market economy, at the turn of the 21st century
Moldova finally demonstrated a stable and reasonably high economic growth. It joined
the WTO and headed for the EU membership. However, the political crisis with the
parliament’s inability to elect the president over 2,5 years7, and the unresolved
separatist conflict in Transnistria promised no quick eurointegrational breakthrough
for Moldova.
7 Moldovan parliament failed to elect a president several times between 2009 and 2012. On March 2012 Nicolae
Timofti was elected President of Moldova.

7
Unlike Gagauzia that has put up with an “autonomous territorial unit” status,
Transnistria proclaimed an own state “Pridnestrovskaya Moldavskaya Respublika”
(PMR) with the capital in Tiraspol as early as in 1990, and on the 25th
of August 1991
declared its independence from Moldova (for larger maps see Appendix 4). The
Government in the Moldovan capital Chisinau refused to recognize the self-
proclaimed separatist republic. Escalation of the conflict between the parent state of
Moldova and the break-away territory led to the War of Transnistria in March 1992.
The war saw several severe fights between Moldovan troops and police
(supported by Romanian volunteers) and Transnistrian irregular forces (backed by the
Russian 14th
army, Russian and Ukrainian volunteers). By different estimations, during
the military conflict in March-July 1992, from nearly 300 to 500 people were shot and
the number of wounded varied between 500 and 1300. The number of refugees and
forcibly displaced persons reached 100 000 (Helsinki Watch 1993:4-5). On July 21,
1992 the Moscow peace agreement was signed, declaring a ceasefire and documenting
some limited autonomy provisions for the break-away territory as the “autonomous
territorial entity with special status”. The agreement envisaged a Russian-led
peacekeeping mission to observe the ceasefire, which is still present in the region (ICG
2004:4). Since then the foreign military presence has raised strong security concerns in
Chisinau.
After the ceasefire agreement, the military conflict subsided into the phase of
permanent frozen conflict with the secessionist region claiming its independence and
the parent state refusing to recognize it. On the one hand, after July 1992 the situation
remained relatively peaceful, with practically no casualties registered (accept few
accidents). On the other, the frozen conflict has been preventing both full-fledged
reforms and economic development in the region.
The PMR has never been recognized by any foreign country, except the three
other Post Soviet separatist states – Abkhazia, Southern Ossetia and Nagorniy
Karabakh. Despite the lack of international recognition, the PMR strives to acquire,
preserve and strengthen all the attributes of a functioning parliamentary republic with
its own president, government, parliament, police, and social care system. It has
adopted an own constitution, flag, national anthem, and coat of arms, introduced its

8
own currency8. This has made Transnistria into the textbook example of a de facto
state in the definition presented earlier in the thesis. Now, 20 years after the secession
the political status of Transnistria still remains unresolved.
The citizens of Transnistria have learnt to live in the status quo of the frozen
conflict, though. Since Transnistrian passports are not recognized anywhere in the
world, along with Transnistrian, many hold Moldovan, Ukrainian or Russian
citizenship and freely migrate to the neighboring countries either to work, to get an
education or to receive medical treatment. The frozen nature of the conflict seems to
provide the minimum conditions for existence.
Motives for Transnistrian secession have been widely discussed in the
literature. At least three different reasonings could be singled out. One of them points
to the ethnic or historical nature of the conflict (Kaufman 1996, Protsyk 2009).
According to this point of view, the secession was caused by the fear of the mainly
Slavic right bank of the Dniester river to be discriminated in allegedly Romanian
influenced Moldova. Economic benefit is mentioned as an alternative motivation for
secession (Isachenko 2009, Allin 2011). It is claimed, that with all the heavy industry
concentrated in Transnistria, the region was reluctant “to sustain” the mainly agrarian
“mainland”. Further, as the situation stabilized into the frozen conflict, the status quo
provided additional sources of income, including illegal, urging no reitengration.
Another view points to the geopolitical motivation (Popescu 2006b). Russia’s
ambitions to extend its sphere of influence are often put behind the Russian support of
Tiraspol’s separatism and its former leader Igor Smirnov. Declaring the necessity to
protect the Russian speaking population of Transnistria, the Russian military played in
fact the crucial role in the military clashes of 1992, helping to establish de facto
sovereignty of the PMR.
Notwithstanding the motives, Transnistria struggles for existence. Its
government largely controls the territory, regularly conducts elections, builds up its
statehood and documents economic development. At the same time, because of the
loose legal status, the break-away region has turned into a free haven of contraband,
8Transnistrian Ruble.
9
shadow offshore operations, and illegal immigration damaging economic interests and
security of the neighboring countries, also in a wider European context. These
developments raise regional concern and promote international mediation in the
conflict resolution process.
Over 20 years that followed the secession, many attempts were made by
different mediators to settle the conflict. No settlement plan, though, was accepted by
the parties so far. The Russian Kozak Memorandum of 2003 (Memorandum Kozaka
2003), OSCE Settlement Proposals of 2004 (OSCE 2004), Yushchenko’s Plan of 2005
(Kulyk and Yakushyk 2008) put forward by the Ukrainian President – all offering
reintegration of the parent state and the secessionist entity despite the latter’s claims
for sovereignty – were all rejected. Since 2005 the negotiations were held in the so
called 5+2 format, under the auspices of the OSCE, with Moldova and Transnistria as
conflicting parties, Russia, Ukraine and the OSCE as mediators and the EU and the
USA as observers. In 2006, after the referendum revealing an overwhelming popular
support of the claim for independence9, the negotiations came to a stalemate.
Negotiations in the format of 5+2 were suspended (for detailed history of negotiations
see ICG 2003, ICG 2004). A long period of some minor talks followed, until the year
2011 launched a new stage of the conflict settlement process, with a brief meeting of
the negotiators in Moscow in September 2011. Presidential elections in Moldova in
2012, and the sunset of Igor Smirnov’s political era in Transnistria in 2011, when the
new president Evgeniy Shevchuk came to power, raised hopes for a new turn in the
settlement of the conflict. Yet it is obvious that getting over the deadlock will be
neither easy nor prompt.
1.2 Building Economy - Building the State
It is widely accepted that de facto statehood is a framework too fragile for
sustainable economic development. Many point to destructive impact upon the
secessionist region of the black or shadow economic activities (Isachenko 2009),
9 In September 2006, 97,2% of the voters that took part in the referendum answered “Yes” to the question “Do
you support the course towards the independence of Transnistria and the subsequent free association with the
Russian Federation?”. The voter turnout was 78,6% (Newsru.com 2006).
10
organized crime (Lynch 2002), external pressure from “parent state” and international
isolation (Caspersen 2009). On the contrary, Blakkisrud, Kolstø (2011) claim that
living in the frozen conflict has given Transnistria the time not only to retain its de
facto statehood, but also to launch an own state-building project. The main goal of
state-building in de facto states, according to Blakkisrud and Kolstø (2011) is at least
twofold: to grow strong preventing possible loss of resources gained with the secession
and, subsequently, gain international recognition as a reward for the high political and
economic performance.
The idea of state-building as a survival strategy for secessionist entities
correlates with the neoconservative notion of existential threat in the international
relations. Seeking international recognition as the final goal, de facto states face
constant external “existential threats” in terms of reintegration with the “parent state”,
or loosing de facto sovereignty to a patron state. Internal threats, such as gradual
subsiding into chaos due to the lack of legitimacy, pose yet another challenge (see, for
example, Halabi 2009). Thus, in the face of both external and internal threats,
consolidation of the secessionist entity’s resources appears to be the only way at least
to preserve the existing status quo, if not to play its card internationally.
Definition of state-building was first introduced by Tilly (1985). Since then
this notion has been taking different shape, especially in connection of the era of
peace-building launched at the turn of the millennium. Most of the definitions,
however, boil down to a functional, viable state. Generally speaking, “Key goals of
state-building include effective delivery of basic goods and services through functional
formal state institutions” (Brinkerhoff 2007). Whereas, economy appears to be one of
the key dimensions of the state-building process. Thus, according to Blakkisrud and
Kolstø, “state-building entails the development of the physical framework of the state:
establishing control over territory and developing administrative structures,
institutions, a capacity for taxation and redistribution of wealth” as well as “ability to
facilitate economic development, collect taxes and tolls, and provide a minimum of
social security for their population” (Blakkisrud, Kolstø 2011: 184, 182).
As comes from the Blakkisrud and Kolstø’s definition, state-building in the
post secession phase is a goal in itself, the final outcome of any successful secession
11
project. Thus, creating a viable economy translates into an essential attribute of a
functioning state. This echoes, for example, in the findings of Troebl (2003:963) on
the Transnistrian conflict: “Stützpfeiler des Staatlichkeitsstrebens der
gesellschaftlichen Akteure in der … Transnistrischen Moldauischen Republik … sind
eine auf Besitzstandswahrung bedachte Regionalelite, das wirtschaftliche Potential
dieser hochindustrialisierten Region sowie mit politischer Unterstützung Moskaus
erworbene militärische Machtmittel.”
Another pattern of post secession state-building arises from the theory of
political economy of secession offered by Collier and Hoffler (2002). Drawing
conclusions from B.Anderson’s concept of “imagined communities10
(1983) and the
theory of internal exit11
of Buchanan and Faith (1986), they note that: ”the common
economic interest of the minority of the population that is rich… functions as the vital
ingredient in identity politics. That is, secessionist political communities invent
themselves when part of the population perceives secession to be economically
advantageous.” A major focus falls here upon the “greed” motivation for secession,
which makes the subsequent state-building process and creation of political identity
into a mere tool of gaining economic benefits out of the sovereignty retained. From
this point of view, the lack of political compromise in Transnistria’s frozen conflict
may be explained by the economic benefits stemming from the current status quo.
Governed either by the existential threat (grievance) or by economic
advantage (greed), Transnistrian leaders have focused on gaining economic viability to
build a functioning state. The same rhetoric was used for propaganda. Taiwan’s
economic achievements and even Timor Leste’s experience have been repeatedly
mentioned by Transnistrian officials in public speeches as an example to follow
(Ignatiev 2012). Yet, the reality bears little resemblance of the Asian unrecognized
island state. Lyndon (2011:7), for example, describes “the uncertain viability of
Transdni(e)strian economic actors whose business model depends on relationships
10
Anderson claims that states are social constructs, imagined by the people who perceive themselves as part of
the group. (Anderson 1993).
11 According to the theory of internal exit, secession may occur when a rich region decides to retain income
generated locally and refuses to pay taxes to the parent state (usually constituting the main source of its income).
12
with local authorities”. Isachenko (2009) states that Transnistrian leaders have opted
for “the priority of the claim for statehood over economic viability” (Isachenko
2009:74) and sacrificed economy for the political goals of separation.
Right before the secession the PMR accounted for 40% of Moldova’s GDP
and 90% of the electricity produced in the country (Allin 2011:1). Self-proclaimed on
the territory of 4 100 sq. km (comparable to Cabo Verde or Trinidad and Tobago) with
a population slightly more than half a million (constituting 13% of the total number of
Moldovan residents), the break-away republic survived the 1990s in a severe economic
crisis. In the beginning of the new millennium the situation stabilized, and in 2003-
2008, before the global financial crisis, the annual GDP growth amounted to 9,6% on
average, and growth of services in the GDP increased by 50-70% every year (Shelari
2010:2-3). In 2006-2008 the foreign trade volume more than doubled (Statistical
Yearbook 2011:167). The efforts to introduce a monetary reform fairly succeeded,
although Transnistrian ruble is only recognized in the break-away region. The positive
achievements resulted from the policies – the state’s massive stabilization and reform
efforts, including (“crony”) privatization, as well as the economic structure – strong
industrial base inherited from the Soviet times. Additional considerable source of
income is remittances of migrants, and shadow economy, mainly entailing re-export
schemes or smuggling (Isachenko 2009b).
On the other hand, the PMR’s small de facto economy is highly vulnerable to
external factors. The economy is very open: in 2006-2010 foreign trade accounted for
almost 270% of GDP on average (estimated on the basis of data provided in the
Statistical Yearbook 2011), and therefore subject to volatility on the world markets.
Moldovan economist G.Shelari suggests that “the almost complete lack of
internal resources for growth in the Transnistrian economy has determined its
increased vulnerability to external shocks” (Shelari 2010:3). That is, the very structure
of the PMR’s economy adds up to the barriers preventing vigorous and stable
economic development. The economic structure is, in fact, to a certain extent a product
of secession: the highly industrialized, concentrated production pattern of the break-
away republic with domination of export oriented industries and monopoly of a few
13
giant companies, considerably urbanized with little to no agricultural experience was
from the very beginning of its history equipped with a set of structural handicaps.
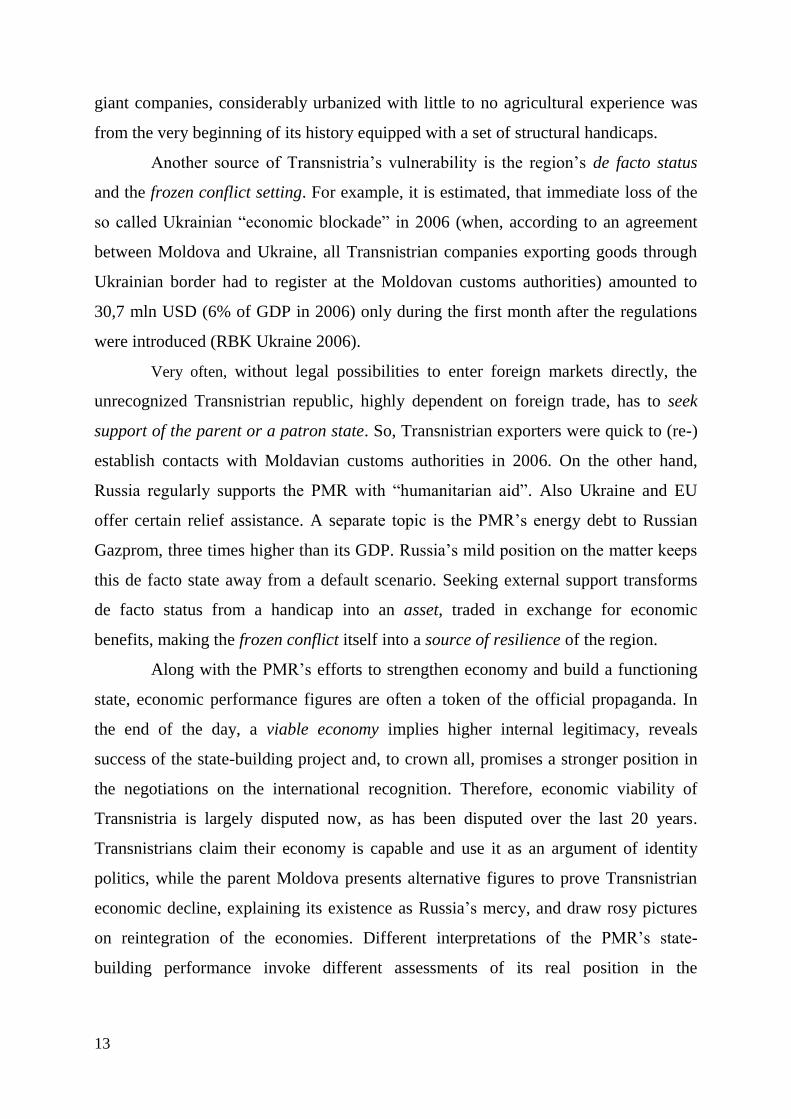
Another source of Transnistria’s vulnerability is the region’s de facto status
and the frozen conflict setting. For example, it is estimated, that immediate loss of the
so called Ukrainian “economic blockade” in 2006 (when, according to an agreement
between Moldova and Ukraine, all Transnistrian companies exporting goods through
Ukrainian border had to register at the Moldovan customs authorities) amounted to
30,7 mln USD (6% of GDP in 2006) only during the first month after the regulations
were introduced (RBK Ukraine 2006).
Very often, without legal possibilities to enter foreign markets directly, the
unrecognized Transnistrian republic, highly dependent on foreign trade, has to seek
support of the parent or a patron state. So, Transnistrian exporters were quick to (re-)
establish contacts with Moldavian customs authorities in 2006. On the other hand,
Russia regularly supports the PMR with “humanitarian aid”. Also Ukraine and EU
offer certain relief assistance. A separate topic is the PMR’s energy debt to Russian
Gazprom, three times higher than its GDP. Russia’s mild position on the matter keeps
this de facto state away from a default scenario. Seeking external support transforms
de facto status from a handicap into an asset, traded in exchange for economic
benefits, making the frozen conflict itself into a source of resilience of the region.
Along with the PMR’s efforts to strengthen economy and build a functioning
state, economic performance figures are often a token of the official propaganda. In
the end of the day, a viable economy implies higher internal legitimacy, reveals
success of the state-building project and, to crown all, promises a stronger position in
the negotiations on the international recognition. Therefore, economic viability of
Transnistria is largely disputed now, as has been disputed over the last 20 years.
Transnistrians claim their economy is capable and use it as an argument of identity
politics, while the parent Moldova presents alternative figures to prove Transnistrian
economic decline, explaining its existence as Russia’s mercy, and draw rosy pictures
on reintegration of the economies. Different interpretations of the PMR’s state-
building performance invoke different assessments of its real position in the

14
negotiations. Consequently, scenarios for the conflict settlement range from
reintegration of the region into Moldova to its full independence.
To sum up, the question of Transnistria’s economic viability appears to be
crucial in the state-building and/or conflict settlement process, with the vulnerability of
the PMR and the region’s ability to cope with the handicaps brought into the focus of
international discussions. How viable is the PMR as a sovereign economy in reality?
How does it cope with vulnerabilities, including those induced by the frozen conflict?
Has the situation changed over time that elapsed since secession, as suggested by
Blakkisrud and Kolstø (2011)? Has the economy become viable enough to deem the
state-building process successful and claim international recognition?

15
2 Theoretical Approaches to Viability
of de facto Economy
Following the reflections outlined in the previous Chapter, the thesis will
proceed by focusing on the economic dimension of Transnistria’s state-building in the
post secessionist stage. The research will attempt at examining the ability of the
secessionist entity to consolidate a functioning or viable economy, and dynamics of
this ability over the time that elapsed since secession. Pursuing a supplementary aim,
the thesis will use the case of the PMR to elaborate a relevant research methodology to
test the viability of de facto economy as such.
The pragmatic motivation behind the necessity to assess de facto economy’s
viability correlates with the two practical applications: to alarm the leaders of the
secessionist region as well as international community about the future developments
and measures to be taken, and to estimate the real positions of the conflicting parties in
the settlement negotiations. Viability assessment is also useful for international donors
willing to provide humanitarian relief in a frozen conflict situation.
2.1 Viability of Transnistria's Economy: Research
and Knowledge Gaps
Secession has attracted comparatively little interest in the economic literature,
with most of the studies devoted predominantly to the reasons for secession (Buchanan
and Faith 1997, Fearon and van Houten 2002, Collier and Hoeffler 2002). Secessions
that resulted in a frozen conflict were studied even less. Although the research on
frozen conflicts has been considerably politicized, living in a frozen conflict entails a
number of challenges for the economy, requiring separate studies. At the same time,
economic viability of unrecognized entities has only recently fallen into the focus of
scientific research, quantitative studies in the field still being rare.
The lack of comprehensive economic research on de facto statehood owe, on
the one hand, to the modest role de facto states play on the world markets, and, on the
other, to the complexity and specific background of the each case of secession. This, in

16
turn, explains domination of case studies in the field and the lack of a comprehensive
theoretical research gathering general knowledge on de facto economies.
One of the first full-scale researches devoted to the economics of secession
was offered by M.Bookman. According to Bookman (1993), there are three phases of
secession, and economic issues are relevant in the study of each of them. The first
implies the “cost and benefit analysis” before the secession as part of the motivations
for breaking up with the parent state, the second envisages disentangling ties between
the new independent economies in the process of secession, and the third post
secession phase focuses on economic viability of the region as an independent entity
(Bookman 1993:2-3). A major research question in the third phase, Bookman argues,
is what factors contribute to the success of a region’s efforts to secede or to the
region’s economic viability (Bookman 1993:3), which is defined as an “ability to
sustain growth in the aftermath of secession at the preindependence levels” and should
not be perplexed with self-sufficiency (Bookman 1993:145-146). The definition
implies that viability is not providing for survival only, but also for development
(growth). This thesis will adhere to Bookman’s definition of economic viability as one
of the most elaborated so far.
In her book “The Economics of Secession”, Bookman provides an empirical
study of 30 secessionist movements, using own methodology to “offer hypothesis
pertaining to economic viability of the independent entities” (Bookman 1993:17). The
methodology implies qualitative analysis of four variables effecting economic
viability: the level of economic development, trade dependency, net flows, and the
degree of regional decentralization. It should be noted, that the parameters listed are
predominantly of structural nature.
Considerable contribution into the study of the economy of secessionist (and
existing de facto) states was made by numerous case studies. Researches on different
de facto economies derive viability of a secessionist unit from abundance in mineral
resources, foreign trade, private remittances, and foreign aid (Huliaras 2002); human,
technical and financial resources on the one hand, and growth-promoting policies on
the other (Abed 1990); or substantial external support (Caspersen 2009). Bookman’s
findings, though, remain a single attempt to elaborate universal methodology to assess

17
viability of de facto economy. Attempts to apply quantitative methods to assess
economic viability of a secessionist entity have not been numerous either.
Similar trends prevail in the scientific research on Transnistria. The wave of
scientific research that followed right after the War of Transnistria focused mainly on
the motives for or roots of the secession (Roper 2004, Kolstø, Edemsky and
Kalashnikova 1993). Literature dwelling on possible conflict resolution schemes
dominated when settlement negotiations started (Lynch 2004, Protsyk 2006). Years
later, the focus of scientific research shifted to the post-secession development
(Caspersen 2009, Popescu 2006a) and the early signs of state-building in the
unrecognized state (Troebst 2002, Blakkisrud and Kolstø 2011).
Economy has been touched upon in most of the studies on the PMR. A typical
research paper on Transnistria lays a special focus on the scale of informal economy,
dependence on Russia, and “greed” of the Transnistrian elite benefiting from the status
quo induced by the frozen conflict. Although such studies provide a general picture of
the region’s economic performance, they tend to document the lack of self-sufficiency,
rather than assess viability of the economy. De-masking Transnistrian sources of
income or reflecting on its economic handicaps does not explain de facto existence
(functioning) of the secessionist economy, neither does it say much on future
developments.
The PMR’s economic viability, on the contrary, has very rarely been chosen as
an object of academic research. Close to find the clue to the quest on viability,
Isachenko (2009) claims that survival of the PMR’s economy rests with the very non-
recognition. A more precise statement on economic viability of the PMR can be found
in the research of Moldova-based Center for Strategic Studies and Reforms: “it is
possible to draw (a) paradoxical, at the first sight, conclusion: the economy of
Transnistria is not self-sufficient but viable. At least, it is not more vulnerable than the
economy of the Republic of Moldova“. The research also refers to de facto status of the
PMR as a “profitable business” considerably contributing to viability (CSSR 2001:10).
The conclusion is reached by exploring economic performance and sources of
vulnerability (“informal” economy, concentration of industrial production, dependency

18
on foreign trade) and predicting successful semi-autonomous existence of the region in
the future.
Political scientists Troebst (2002, 2003) and Blakkisrud and Kolstø (2011)
introduce a more comprehensive understanding of a facto state’s economic viability,
considering it as an integral part of the state-building project and implying authorities’
efforts to speed up economic development despite the benefits of status quo. This calls
for a deeper analysis of factors of economic viability in a separate economic research,
as the question reaches beyond the scope of political science. It should also be noted,
that in most of the previous studies, viability of the PMR’s economy is addressed as a
secondary or supplementary issue. In addition, researches apply predominantly
qualitative methods. Whereas, quantitative methods would allow to maximally avoid
biased reasoning in the abundance of propagandistic information. These facts add up
to the need to explore viability of Transnistria’s de facto economy.
This thesis addresses the economic viability in a wider context of state-
building. The purpose of this research arouse from the lack of a comprehensive study
on the issue and lack of an instrumental methodological approach to assess de facto
economies. In order to fill in the research gap, the aim of the thesis it twofold: to
estimate Transnistria’s economic viability, and to elaborate a relevant quantitative
method for the research, which can be generalized and applied to assess other
secessionist economies developing under frozen conflict.
2.2 De Facto Economy: Transnistria as a Small
Island Developing State
In search for a relevant methodology for a comprehensive research of de facto
economy, it will be assumed that Transnistria is an island state. The assumption rests,
in fact, upon solid analogies. Indeed, the break-away region clearly resembles an
island state, or, to be precise, a small island developing state (SIDS). An unrecognized
republic living in the frozen conflict is in most of the cases small. Like a small island
country, it is both comparatively more isolated and vulnerable to exogenous factors
than other states. It also tries to build a functioning economy constrained by the

19
limited resources (natural, financial and human) and challenging (hostile)
environment, bound to deal with market inefficiency, concentrated industry pattern,
and high dependency on trade.
Perhaps the closest similarity lies in the vulnerability to external factors. Both
small island states and de facto entities experience deteriorating impact of trade
barriers. However, there is a strong difference in the character of the barriers: whereas
de facto states are subject to embargos and other international sanctions due to their
status or the frozen conflict setting, islands’ trade is affected by natural disasters or
long distances to main trading partners (or unfavorable conditions for transportation),
which can be also ascribed to nature. Nevertheless, all of the disadvantages are largely
beyond the state’s control.
In addition, both rely on diaspora’s remittances, and foreign aid to compensate
for their vulnerability. On the other hand, islands’ isolation and remote location
provide certain security stakes, which are lacking in de facto states. However, the
frozen conflict does allow some “outsourcing” of the security functions to a parent
state.
The definition of the small developing islands allows further identifying of
similarities in the economic development. UN definition of SIDS stipulates that “Small
Island Developing States (SIDS) include low-lying coastal countries that share similar
sustainable development challenges, including small population12
, limited resources,
remoteness, susceptibility to natural disasters, vulnerability to external shocks, and
excessive dependence on international trade. Their growth and development is often
further stymied by high transportation and communication costs, disproportionately
expensive public administration and infrastructure due to their small size, and little to
no opportunity to create economies of scale” (UNDESA 2012). Indeed, characterizing
four Post Soviet separatist states (in Moldova, Georgia and Azerbaijan), Lynch
underlines that “they are completely isolated in international relations, and they all
face deep internal problems and external threats to their existence” (Lynch 2002:832).
So, like SIDS, de facto states deal with the challenges of vulnerability to external
12
According to the UN, the small state is a state with population of not more than 1 mln. people.

20
shocks (mainly trade-related, like exchange rates volatility, changes in tariffs or non-
tariff regulations), isolation from other foreign countries, and remoteness (in terms of
high trade costs which in de facto states are connected with trade embargoes or
specific external measures to limit their trade). Other handicaps are derived from
smallness: limited resources (even when an oil rich region secedes, dependency on one
or few resources is detrimental for a small economy due to the dangers of the Dutch
disease), dependence on trade (apart from common problems related to trade
dependency, de facto states face also “political” challenges in this regard: they have to
establish trade ties despite the lack of legitimacy and formal recognition by their
trading partners; in most of the cases trade with the parent (and hostile) country is
crucial for the economy, at least in the initial period after secession), expensive public
administration and infrastructure (that is why de facto states, like SIDS, often
“outsource” some governmental functions to patron or parent states, as, for example,
medical treatment or higher education) and lack of the possibilities to benefit from
economies of scale.
In addition to vulnerability comparison, interesting conclusions arise from the
reflections on the advantages of being a small island versus living in the non-
recognition. According to the UN, “small island developing states have valuable
resources, including oceans, coastal environments, biodiversity and, most importantly,
human resources” (UN 1994a). If a small island may benefit from the surrounding sea
(due to its attraction as a tourist destination and its rich marine resources), which is at
the same time contributing to its vulnerability (being the source of tsunami, on the one
hand, and isolation from the rest of the world, on the other), a de facto state may also
draw benefits from dealing with the (hostile) surrounding states. This often implies,
however, engaging in half-legal or illegal activities like smuggling, re-export schemes
or money laundering. On the other hand, according to Azzopardi (2004:810), a
characteristic feature of most small islands is their unique specialization on the basis of
a “niche” comparative advantage (serving as tax havens, tourist attractions or even
trading votes in the international organizations). De facto states also survive by some
narrow export specialization, as listed by Pegg (2008:3): metallurgy and steel industry
in Transnistria, livestock exports from Somaliland and tourism in Northern Cyprus.
21
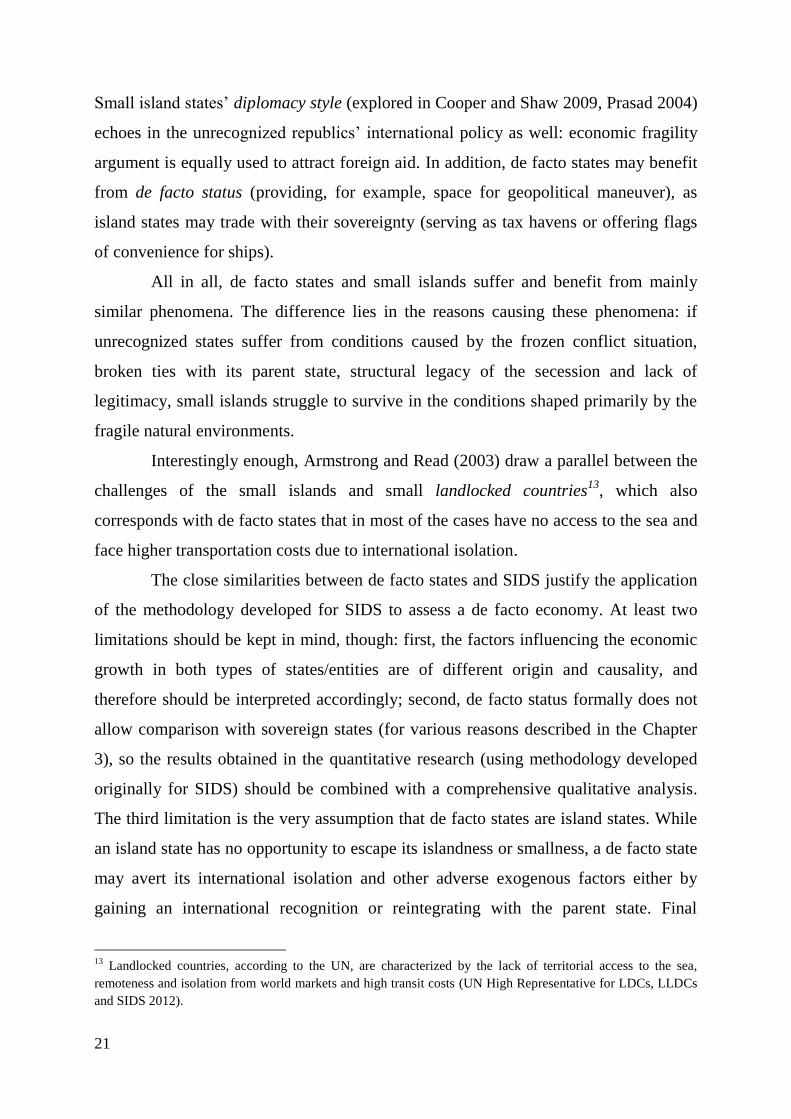
Small island states’ diplomacy style (explored in Cooper and Shaw 2009, Prasad 2004)
echoes in the unrecognized republics’ international policy as well: economic fragility
argument is equally used to attract foreign aid. In addition, de facto states may benefit
from de facto status (providing, for example, space for geopolitical maneuver), as
island states may trade with their sovereignty (serving as tax havens or offering flags
of convenience for ships).
All in all, de facto states and small islands suffer and benefit from mainly
similar phenomena. The difference lies in the reasons causing these phenomena: if
unrecognized states suffer from conditions caused by the frozen conflict situation,
broken ties with its parent state, structural legacy of the secession and lack of
legitimacy, small islands struggle to survive in the conditions shaped primarily by the
fragile natural environments.
Interestingly enough, Armstrong and Read (2003) draw a parallel between the
challenges of the small islands and small landlocked countries13
, which also
corresponds with de facto states that in most of the cases have no access to the sea and
face higher transportation costs due to international isolation.
The close similarities between de facto states and SIDS justify the application
of the methodology developed for SIDS to assess a de facto economy. At least two
limitations should be kept in mind, though: first, the factors influencing the economic
growth in both types of states/entities are of different origin and causality, and
therefore should be interpreted accordingly; second, de facto status formally does not
allow comparison with sovereign states (for various reasons described in the Chapter
3), so the results obtained in the quantitative research (using methodology developed
originally for SIDS) should be combined with a comprehensive qualitative analysis.
The third limitation is the very assumption that de facto states are island states. While
an island state has no opportunity to escape its islandness or smallness, a de facto state
may avert its international isolation and other adverse exogenous factors either by
gaining an international recognition or reintegrating with the parent state. Final
13
Landlocked countries, according to the UN, are characterized by the lack of territorial access to the sea,
remoteness and isolation from world markets and high transit costs (UN High Representative for LDCs, LLDCs
and SIDS 2012).

22
settlement of a frozen conflict makes the island assumptions no longer applicable. This
study thesis sets limitations of “permanent islandness” and hence, explores living
under frozen conflict with de facto status as a non-reversible condition.
2.3 Vulnerability and Resilience as Viability
Measure: Main Theories
By contrast to de facto economies, small islands’ economic performance has
drawn much attention. A comparatively intense scientific interest can be explained by
the number of the small island developing states in the world, amounting to 52 in 2012
(UN High Representative for LDCs, LLDCs and SIDS 2012), their increased
vulnerability and pressure for foreign assistance to compensate for handicaps like
isolation, remoteness and exposure to natural shocks.
Generally, studies on the small island state economies have been evolving in
two main directions, surprisingly contradicting each other. Predominant economic
research (Streeten 1993, Briguglio 1995, Witter 2002, Farrugia 2004, Briguglio et al
2008) explores SIDS economies within the vulnerability discourse, also shared by the
UN and most international organizations. Referring to the research on small economies
introduced by Kuznets (1960), they claim that small island developing states are more
vulnerable than other countries, while the successful economic development of some
SIDS is explained by their ability to resist the deteriorating impact of the (inherent)
vulnerability sources and recover after adverse shocks – (nurtured) resilience, or
copying ability (Briguglio et al 2008, Farrugia 2004, Witter 2004). According to
Malta-based economist Briguglio and his associates (Briguglio et al 2008:2),
“economic vulnerability is ascribed to inherent conditions affecting a country’s
exposure to exogenous shocks, while economic resilience is associated with actions
undertaken by policy-makers and private economic agents which enable a country to
withstand or recover from the negative effects of shocks”. Encouraged by the
corresponding UN call, the composite Economic Vulnerability Index was introduced to
measure structural vulnerability of SIDS economies (Briguglio 1995) and the
Economic Resilience Index – to assess their copying ability (Briguglio et al 2008). By
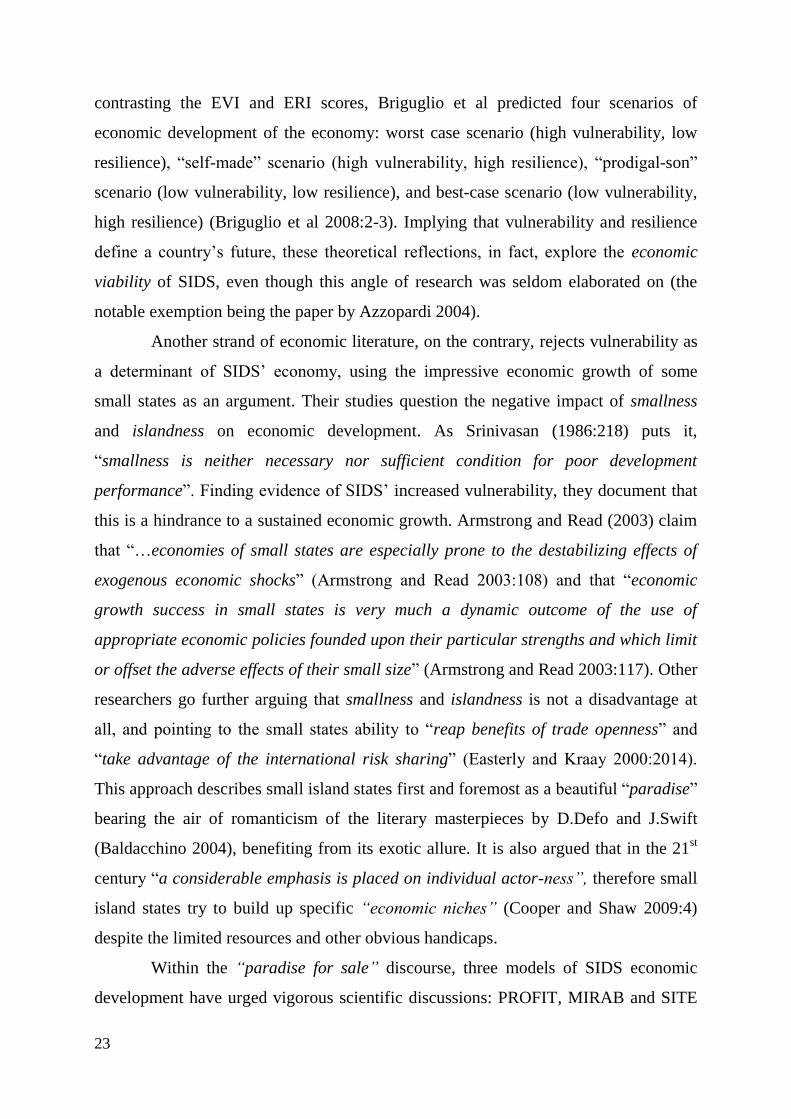
23
contrasting the EVI and ERI scores, Briguglio et al predicted four scenarios of
economic development of the economy: worst case scenario (high vulnerability, low
resilience), “self-made” scenario (high vulnerability, high resilience), “prodigal-son”
scenario (low vulnerability, low resilience), and best-case scenario (low vulnerability,
high resilience) (Briguglio et al 2008:2-3). Implying that vulnerability and resilience
define a country’s future, these theoretical reflections, in fact, explore the economic
viability of SIDS, even though this angle of research was seldom elaborated on (the
notable exemption being the paper by Azzopardi 2004).
Another strand of economic literature, on the contrary, rejects vulnerability as
a determinant of SIDS’ economy, using the impressive economic growth of some
small states as an argument. Their studies question the negative impact of smallness
and islandness on economic development. As Srinivasan (1986:218) puts it,
“smallness is neither necessary nor sufficient condition for poor development
performance”. Finding evidence of SIDS’ increased vulnerability, they document that
this is a hindrance to a sustained economic growth. Armstrong and Read (2003) claim
that “…economies of small states are especially prone to the destabilizing effects of
exogenous economic shocks” (Armstrong and Read 2003:108) and that “economic
growth success in small states is very much a dynamic outcome of the use of
appropriate economic policies founded upon their particular strengths and which limit
or offset the adverse effects of their small size” (Armstrong and Read 2003:117). Other
researchers go further arguing that smallness and islandness is not a disadvantage at
all, and pointing to the small states ability to “reap benefits of trade openness” and
“take advantage of the international risk sharing” (Easterly and Kraay 2000:2014).
This approach describes small island states first and foremost as a beautiful “paradise”
bearing the air of romanticism of the literary masterpieces by D.Defo and J.Swift
(Baldacchino 2004), benefiting from its exotic allure. It is also argued that in the 21st
century “a considerable emphasis is placed on individual actor-ness”, therefore small
island states try to build up specific “economic niches” (Cooper and Shaw 2009:4)
despite the limited resources and other obvious handicaps.
Within the “paradise for sale” discourse, three models of SIDS economic
development have urged vigorous scientific discussions: PROFIT, MIRAB and SITE

24
models. The PROFIT model (standing for People, Resource management, Overseas
issues, Finance and Transportation) introduced by Baldacchino (2004), explores the
impact of the five sources of survival for SIDS. The MIRAB (Migration, Remittances,
Aid and Bureaucracy) model explains small islands economic development by
revisiting the role of remittances for economy and underlining that the islanders have
been the strongest per capita aid beneficiaries in the world (Bertram and Watters 1985,
Bertram 1999). While the SITE model (Small Island Tourist Economies) underlines
the benefits of tourism for SIDS economies (McElroy 2006).
Among other theoretic reflections on small island states, Bertram’s findings on
“the convergence of small island economies with their metropolitan patrons” (2004)
are also worth mentioning in the context of this research. Analyzing island economies
worldwide, Bertram has proven that economic growth of small island states depends
mainly on two variables: dependence on a corresponding metropolitan patron country
and the patron’s GDP per capita. His regression analysis of the Pacific small island
economies proved a “particularly strong association between political dependence
and high per capita GDP” stating that “there has been no tendency for island
economies to converge to one another, but there have been strong tendencies for them
to converge with their patrons” (Bertram 2004:352-353). A study by Armstrong and
Read (2000), in turn, has shown that dependent territories exhibit superior GNP per
capita, if compared to sovereign microstates. If dependence on a rich and growing
patron economy is positively correlated with the island’s economic growth, it does so
with the pattern of the island’s economic viability as well. A de facto economy is in
most of the cases also dependent on a patron state, both politically and financially:
Transnistria’s almost 70% budget deficit is covered by Russian foreign aid (Kulyk
2012, April 20); Turkey supports Northern Cyprus with 400 mln. USD every year
(Turkish Daily News 2007, April 5), which is roughly 15% of its budget. Although
additional studies are to be conducted to conclude on de facto states’ economic
convergence with their patron states, assumptions introduced previously in the thesis
allow application of the theory to the study of Transnistria’s economy, taking into
account limitations defined in Section 2.2. The factor of dependency introduces an
interesting aspect of the research, as it is, in fact, a source of both vulnerability
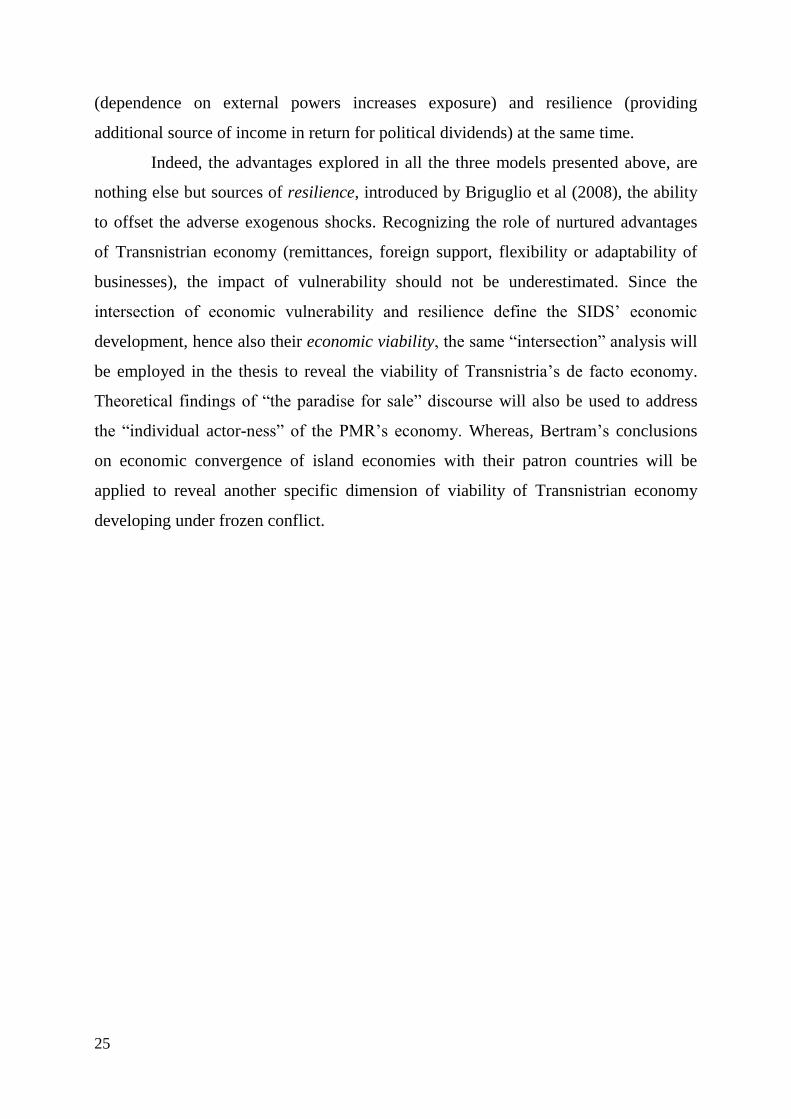
25
(dependence on external powers increases exposure) and resilience (providing
additional source of income in return for political dividends) at the same time.
Indeed, the advantages explored in all the three models presented above, are
nothing else but sources of resilience, introduced by Briguglio et al (2008), the ability
to offset the adverse exogenous shocks. Recognizing the role of nurtured advantages
of Transnistrian economy (remittances, foreign support, flexibility or adaptability of
businesses), the impact of vulnerability should not be underestimated. Since the
intersection of economic vulnerability and resilience define the SIDS’ economic
development, hence also their economic viability, the same “intersection” analysis will
be employed in the thesis to reveal the viability of Transnistria’s de facto economy.
Theoretical findings of “the paradise for sale” discourse will also be used to address
the “individual actor-ness” of the PMR’s economy. Whereas, Bertram’s conclusions
on economic convergence of island economies with their patron countries will be
applied to reveal another specific dimension of viability of Transnistrian economy
developing under frozen conflict.
26
3 Methodology for the Estimation of
Transnistria’s Economic Viability
As suggested in the previous Chapter, economic viability of Transnsitria may
be assessed though the juxtaposition of structural economic vulnerability and
economic resilience – notions introduced by Briguglio (1995, 2002). On the technical
level, his methodological findings led to development of an Economic Vulnerability
Index to measure vulnerability, while resilience was proxied by GDP per capita or
other socio-economic indicators for quantitative comparisons with vulnerability scores
(Briguglio 1995, Briguglio and Galea 2003). Later also an Economic Resilience Index
was developed (Briguglio et al 2008).
This methodology has been widely criticized for lacking clear structure and
validity (for example, see Armstrong and Read 2003). Therefore, an alternative
composition of an Economic Vulnerability Index for Transnistria will be considered
further in the thesis, as well as a relevant method to estimate resilience of Transnistrian
economy will be suggested and described. This will be, however, done within the
theoretical framework elaborated by Briguglio and presented in the previous chapter.
Finally, Briguglio’s approach to categorize economy by its vulnerability and
resilience, as estimates of its economic viability, will be closer discussed.
3.1 Measuring Economic Vulnerability
3.1.1 The History of The Economic Vulnerability Index
Almost two decades ago, vulnerability of small island developing states urged
vigorous academic research aimed at elaborating a credible and convenient universal
tool to measure the scale of economy’s exposure. Researches were launched, both
independently and under the auspices of international organizations, to develop a
composite index that would allow classification of countries by their vulnerability
profile. The importance of a quantitative indicator of vulnerability was first officially
recognized in the Barbados Program of Action adopted at the first Global Conference
27
on Sustainable Development of SIDS in Barbados in 1994: “Small island developing
States, in cooperation with national, regional and international organizations and
research centres, should continue work on the development of vulnerability indices
and other indicators that reflect the status of small island developing States and
integrate ecological fragility and economic vulnerability.” (UN 1994a).
One of the earliest indexes was introduced by Briguglio (1995) who suggested
an Economic Vulnerability Index composed of three indicators: exposure to foreign
economic conditions (economic openness), insularity and remoteness, and proneness
to natural disasters. Exposure to foreign economic conditions was measured by the
degree to which an economy depends on foreign trade (the ratio of exports and imports
to GDP). Insularity and remoteness in the EVI developed by Briguglio was proxied by
the ratio of transport costs to exports. Finally, the proneness to natural disasters was
estimated by the disaster damage calculated as money damage in relation to GDP of
the country concerned (Briguglio 1995:1618-1620).
Briguglio’s choice of components for the index was to a certain degree
subjective, which was partly admitted by the researcher himself, although he
maintained to be guided by considerations of simplicity, ease of comprehension, and
suitability for international comparison (1995:1618-1619). In view of the index’s poor
methodological structure, it was not recognized as a universal index for the UN use,
and further studies were encouraged by the organization.
Four years later, in 1999, Committee for Development Policy (CDP) of the
UN Department of Economic and Social Affairs took a decision to launch own studies
on construction of a vulnerability index, primarily as one of the three criteria14
identifying least developed countries (LDCs), but also aimed at measuring SIDS’
vulnerability. The UN Millennium Declaration reiterated the need of a special index
tailored to define SIDS vulnerability: “We also resolve to address the special needs of
small island developing States, by implementing the Barbados Programme of Action ...
We urge the international community to ensure that, in the development of a
vulnerability index, the special needs of small island developing States are taken into
14
LDCs are currently identified by the EVI, Human Assets Index (HAI) and Gross National Income (GNI) per
capita scores (UNDESA:2008).

28
account.” (UN 2000). In 1999, the UN Committee for Development Policy designed
the Economic Vulnerability Index, used for the UN triennial review of the list of LDCs
in 2000. The index was further refined for the reviews of 2003, 2006, 2009 and 2012.
Further comprehensive theoretical studies on the rationale of the EVI
developed by the UN CDP were led by French economist P.Guillaumont (2004,
2007a, 2007b, 2009, 2011). Reflecting on the index’s components, Guillaumont
defined the concept of economic vulnerability, explained major implications of the
EVI’s composition, and introduced some methodological refinements. Exploring
applicability of the EVI, Guillaumont designed a retrospective EVI index (2007a),
further refined by his colleague Cariolle (2011a), allowing to trace dynamics of
economic vulnerability over a certain period of time. The two researchers computed
retrospective EVI indexes for all the UN member countries in the period of 1975-2009,
and provided analysis of the time series obtained (Cariolle and Guillaumont 2011).
Taking into consideration the research objective of the thesis, the retrospective
EVI was chosen as the most relevant for the estimation of Transnistria’s vulnerability
dynamics after secession. Thus, the methodological framework developed by the UN
and refined by Guillamont and Cariolle will serve as main referential guidelines for the
calculations described in the next Section.
Before proceeding to the components of the Economic Vulnerability Index,
the concept of structural economic vulnerability has to be elaborated on.
3.1.2 The Concept of Structural Economic Vulnerability
The Economic Vulnerability Index, as developed by the UN CDP, measures
structural economic vulnerability or “structural handicaps to economic growth”
(Guillaumont 2009:5). Also Briguglio’s index was designed to capture structural
characteristics of the economy influencing economic development, although it failed
to choose relevant components to filter out purely structural factors.
According to Guillaumont (2009:4-5), structural economic vulnerability
results from factors that are independent from a country’s current political will
(exogenous) and should be distinguished from vulnerability deriving from policy,
which results from present political choices (mainly captured in the concept of
29
resilience, opposite in meaning, outlined in Section 3.2), and state fragility stemming
from bad policies and weak institutions. Indeed, structural features of the economy
(like pattern of industrial production or export specialization) are more rigid and deep-
rooted, therefore less subject to change or reversal. Correspondingly, it is important to
distinguish between structural and policy-induced factors affecting economic growth.
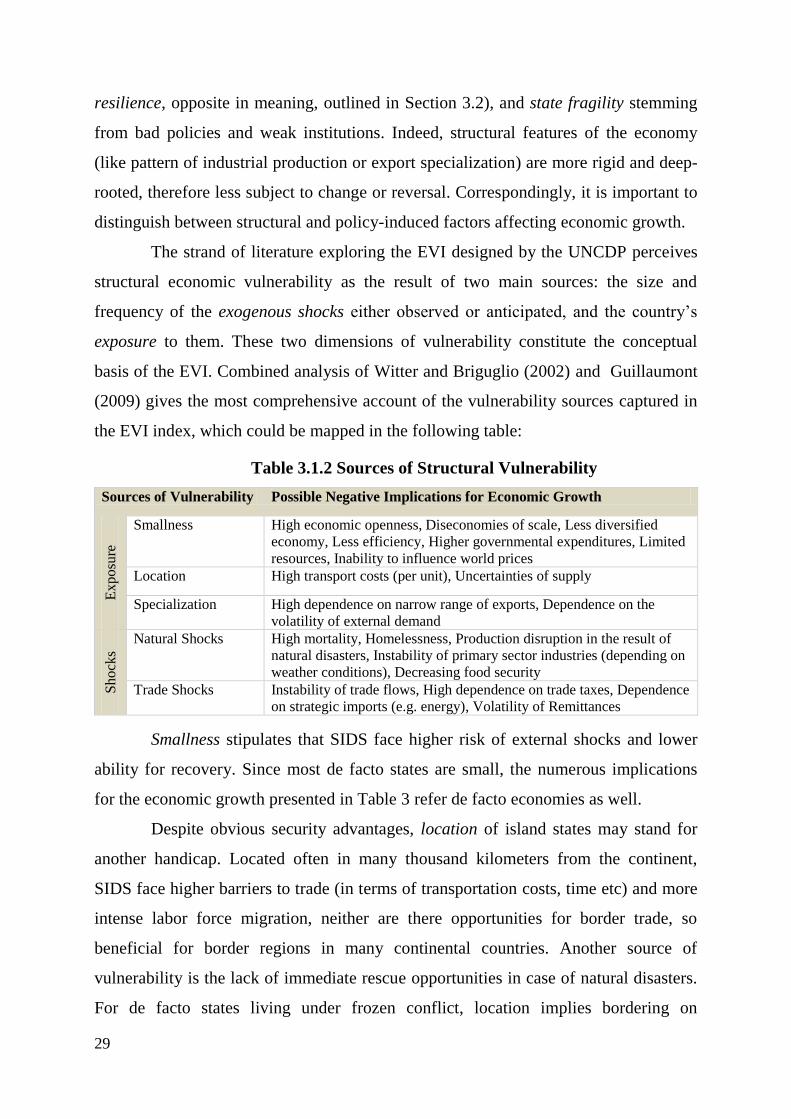
The strand of literature exploring the EVI designed by the UNCDP perceives
structural economic vulnerability as the result of two main sources: the size and
frequency of the exogenous shocks either observed or anticipated, and the country’s
exposure to them. These two dimensions of vulnerability constitute the conceptual
basis of the EVI. Combined analysis of Witter and Briguglio (2002) and Guillaumont
(2009) gives the most comprehensive account of the vulnerability sources captured in
the EVI index, which could be mapped in the following table:
Table 3.1.2 Sources of Structural Vulnerability
Sources of Vulnerability Possible Negative Implications for Economic Growth
Exposu
re
Smallness High economic openness, Diseconomies of scale, Less diversified
economy, Less efficiency, Higher governmental expenditures, Limited
resources, Inability to influence world prices
Location High transport costs (per unit), Uncertainties of supply
Specialization High dependence on narrow range of exports, Dependence on the
volatility of external demand
Shock
s
Natural Shocks High mortality, Homelessness, Production disruption in the result of
natural disasters, Instability of primary sector industries (depending on
weather conditions), Decreasing food security
Trade Shocks Instability of trade flows, High dependence on trade taxes, Dependence
on strategic imports (e.g. energy), Volatility of Remittances
Smallness stipulates that SIDS face higher risk of external shocks and lower
ability for recovery. Since most de facto states are small, the numerous implications
for the economic growth presented in Table 3 refer de facto economies as well.
Despite obvious security advantages, location of island states may stand for
another handicap. Located often in many thousand kilometers from the continent,
SIDS face higher barriers to trade (in terms of transportation costs, time etc) and more
intense labor force migration, neither are there opportunities for border trade, so
beneficial for border regions in many continental countries. Another source of
vulnerability is the lack of immediate rescue opportunities in case of natural disasters.
For de facto states living under frozen conflict, location implies bordering on
30
“enemies” or living in a “hostile” environment, which also increases indirect costs for
transportation and logistics (predefined routes or border crossings, additional checks).
SIDS are often dependent on a limited number of export industries that, in
turn, define misbalanced internal production structure. Influencing the trade pattern,
specialization reflects vulnerabilities equally eminent in SIDS and de facto states.
SIDS’s proneness to natural shocks is well documented and discussed earlier
in Chapter 2. De facto states also may be subject to natural disasters, and their small
agricultural sectors are vulnerable to changing weather conditions as well. However,
the scale of vulnerability due to natural shocks does not necessarily depend on the
geographic position only. If assumed that natural shock refers to any catastrophe
beyond de facto state’s control, also damage induced by the immediate conflict
following the secession and the frozen conflict evolving further may qualify to assess
natural shocks’ impact on economic growth.
Trade shocks are usually high for small island developing states. They are
destined to follow volatility of external demand, and protectionist measures would
have little to no effect on the merchandise trade pattern. The unrecognized states also
suffer from instability of foreign trade, as their status and the frozen conflict setting
may cause trade sanctions or other trade barriers.
Finally, de facto states’ structural economic vulnerabilities may stem from
some specific sources, not typical for SIDS. Smallness, concentrated production
pattern, narrow export specialization often result from secession from the parent state
(post-secession), while others are status and frozen conflict induced – like international
isolation resulting in trade instability or additional transportation costs.
To sum up, it is important to underline that the concept of the structural
economic vulnerability is surprisingly instrumental for assessment of de facto
economies. For unrecognized state, it is important that policy-induced factors are
excluded from the scope of the EVI. Focus on exogenous indicators makes it possible
to avoid assessment of de facto government’s policies (often corrupt or inefficient),
but rather estimate the very ability of the break-away region to survive and develop.
So, if calculated for de facto state, the EVI also captures vulnerability arising from
post-secession structural handicaps and vulnerability induced by de facto status and
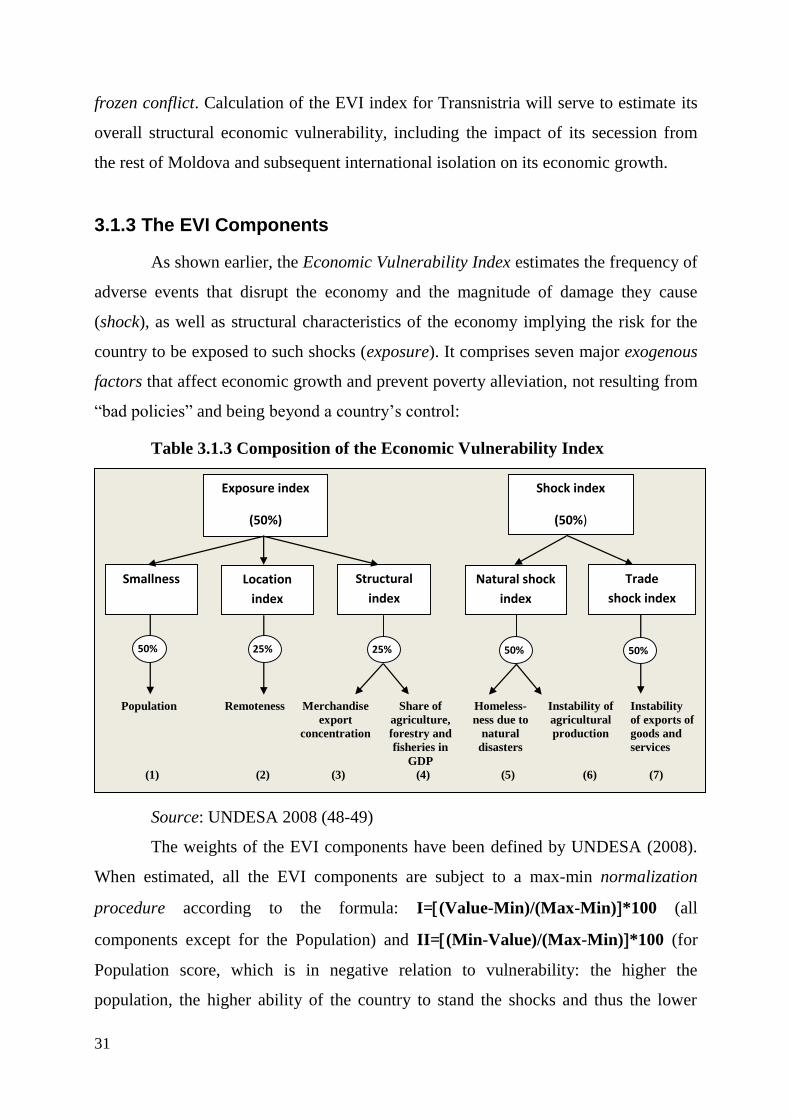
31
frozen conflict. Calculation of the EVI index for Transnistria will serve to estimate its
overall structural economic vulnerability, including the impact of its secession from
the rest of Moldova and subsequent international isolation on its economic growth.
3.1.3 The EVI Components
As shown earlier, the Economic Vulnerability Index estimates the frequency of
adverse events that disrupt the economy and the magnitude of damage they cause
(shock), as well as structural characteristics of the economy implying the risk for the
country to be exposed to such shocks (exposure). It comprises seven major exogenous
factors that affect economic growth and prevent poverty alleviation, not resulting from
“bad policies” and being beyond a country’s control:
Table 3.1.3 Composition of the Economic Vulnerability Index
Source: UNDESA 2008 (48-49)
The weights of the EVI components have been defined by UNDESA (2008).
When estimated, all the EVI components are subject to a max-min normalization
procedure according to the formula: I=(Value-Min)/(Max-Min)*100 (all
components except for the Population) and II=(Min-Value)/(Max-Min)*100 (for
Population score, which is in negative relation to vulnerability: the higher the
population, the higher ability of the country to stand the shocks and thus the lower
50% 25%
Exposure index
(50%)
Smallness Location
index
Structural
index
25% 50% 50%
Shock index
(50%)
Natural shock
index
Trade
shock index
Population Remoteness Merchandise
export
concentration
Share of
agriculture,
forestry and
fisheries in
GDP
Homeless-
ness due to
natural
disasters
Instability of
agricultural
production
Instability
of exports of
goods and
services
(1) (2) (3) (4) (5) (6) (7)
32
vulnerability) (Cariolle 2011a:8). Values stand for the data observed or indicators
calculated, Max and Min represent the highest and lowest value observed across the
reference countries in the same period of time (Max and Min values used by UNCDP
for triennial review 2009 and applied in this research are given in Appendix 1). (I) and
(II) are the new rescaled indices with values ranging from 0 to 100 (UNDESA
2008:42-43). Thus, the components of the EVI are transformed into relative indices
showing the country’s vulnerability in comparison with the rest of the world.
Exposure index: Smallness
- (1) Population
The UN CDP chose population as a proxy for smallness. The Smallness
component is measured by the logarithm of the number of the country’s inhabitants
normalized in a max/min procedure (UNDESA 2008:49-50). The calculation may be
described by the following formula:
S=(Min-Ln(Population))/(Max-Min)*100 (1)
Exposure index: Location index
- (2) Remoteness
The Location indicator in the EVI is proxied by “the minimum average trade-
weighted distance from the world markets” (UNDESA 2008:50-51). The latter is
defined when physical distances between the capital of the respective country and
main trading countries in the world (top exporters) are multiplied by the top exporters’
share in the total world exports and then added up until their cumulative share in the
world exports constitute at least 50% of the world market (UNDESA 2008:50). Then
the combination of the minimal trade-weighted distances is identified15
. This
combination is transformed into logarithms, and normalized.
Since landlocked countries face different difficulties (and with no immediate
access to the sea as the cheapest logistic solution, the countries bear higher
transportation costs) the Location component is adjusted by 15%16
if measure for a
landlocked country.
15
Cariolle set up the 33% threshold for the world market share in calculating the retrospective EVI (Cariolle
2011:11), which will be also applied for computing the EVI for Transnistria.
16 If it were regarded as sovereign, Transnistrian economy would qualify as landlocked country.

33
The series of calculations could be described by the following formula:
L=(Ln(MIN((Dti*expi/Exp), if (expi/Exp) ≥0,33)*0,85 + 0,15L) -
- Min)/(Max-Min)*100 (2), where:
Dti – distance from the country’s capital to capitals of world’s top exporters,
expi/Expi – share of the top world’s exporters in the world’s exports,
L – dummy17
equaling 1 when the country is landlocked, and 0 when it is not.
Exposure index: Structural index
This component of the EVI reflects the structure of the country’s GDP and
exports as constituting parts of its vulnerability profile.
- (3) Merchandize export concentration
UN’s EVI methodology employs the Herfindahl-Hirschmann index (HHI) to
calculate the export concentration using the shares of the product categories of the
Standard International Trade Classification (SITC) at the three-digit level in total
exports (UNDESA 2008:51). The HHI normally measures market concentration and
competition, estimating the average market shares of the companies acting on the
market in focus, thus describing the concentration of the market and reveals its market
structure (Bennett and Wei 2006). In view of this fact, the rationale behind using the
HHI’s formula for this component of the EVI reflects the necessity to catch the
country’s dependency on some particular industry (industries) and the level of trade
and industry diversification. High figures for such dependency reveal a structural
economic handicap as SIDS’ higher exposure to one industry (or limited number of)
induce market volatility. The UN suggests this formula to estimate the component:
H=(√(xi/Xt)2 -√1/n) / (1-√1/n) (3), where
H – merchandise export concentration,
xi/Xt – share of exports of the product i in total exports,
n – number of products exported at the the three-digit SITC level.
The score obtained in the calculations is then normalized through the min-max
procedure described earlier.
- (4) Share of agriculture, forestry and fisheries in GDP
17
Introduced by Cariolle (2011).
34
A country’s vulnerability is directly related to the share of primary industries
in GDP (UNDESA 2008:52). For the EVI only these industries were chosen, as they
are most dependent on weather or climate conditions (exogenous factors), while other
industries making use of natural resources (like oil and gas extraction) were not
considered, presuming that benefits of the mineral resources are more influenced by
internal policies than external factors. The formula for the component (4) is the
following:
A=at/GDPt (4), where
at – value of agricultural, fisheries and forestry production output,
GDP – gross domestic product in current prices.
Shock index
The shock component of the EVI falls into two subcategories – natural shock
index proxied by the number of people who became homeless due to natural disasters
(droughts, tsunami or typhoons), and trade shock index, estimated by instability of
agricultural production (due to smallness, seasonal fall in crops impacts SIDS food
security preventing growth) and instability of exports (both goods and services are
included, as SIDS often depend on tourism). Trade index reflects possible impact of
openness on economic growth, so typical for small countries.
Shock index: natural shock index
- (5) Homelessness due to natural disasters
Homelessness due to natural disasters is measured by the share of the
population displaced in the result of natural disasters over a period of time (UNDESA
2008:53). Where natural disasters are defined as “a situation or event, which
overwhelms local capacity, necessitating a request at the national or international
level for assistance; an unforeseen and often sudden event that causes great damage,
destruction and human suffering” (UNDESA 2008:70). In the UN CDP’s review of
2009, data series for calculation of Homelessness stood for the number of the homeless
due to natural disasters during 1990-2007 divided by the national population during
the middle of the period – 1998/99 (Cariolle 2011a:13-14).
Homelessness=1,n(D)/Pn/2, (5), where
D – number of homeless people,

35
n – number of years in the period considered,
Pn/2 – population of the country during the middle of the time period
considered.
The component estimates human costs of natural disasters, and therefore, the
impact of the natural disasters on the human capital-induced economic growth.18
- (6) Instability of agricultural production
Instability of agricultural production is another component of the natural shock
index. UN calculates the instability by employing the log-linear regression of a trend
equation for the agricultural production index (UNDESA 2008:54):
logY= + logYt-1 + t + et19
(6), where
Y – the agricultural production index,
- intersection of the regression line,
t – time variable, and
standard error S=√(et2)/(n-1) normalized in the min-max procedure gives
the indication of the Instability of agricultural production.
Shock index: trade shock index
- (7) Instability of exports of goods and services
Similarly, the following log-linear regression is used to estimate the instability
of exports of goods and services:
logX= + logXt-1 +t + et20
(7), where
X – total value of exports of goods and services deflated by import unit
values21
,
- intersection of the regression line,
t – time variable, and
18
Several attempts were made to better grasp the meaning of the component. In 2011 UN decided to proxy the
human dimension of the natural shocks indicator by victims of natural disasters, or “people killed or affected”
(UNDESA 2011). This renewed parameter will be used for the UN CDP review 2012.
19 If the log-linear regression is calculated for Transnistria in the period of 2001-2010, logYt-1 is insignificant,
approaching zero. This is due to the comparatively short period of existence of this de facto state, that do not
allow tracing the impact of the previous year’s crops on the subsequent year’s output volumes. Thus, if applied
to Transnistria, the above given formula will be transformed into logY= + t + et.
20For Transnistria the formula logX= + t + et will be used, for the same reasons as for the component (6).
21 Import Unit Values statistics is provided by the IMF and World Bank Financial Statistics.
36
standard error S=√(et2)/(n-1) normalized in the min-max procedure gives
the indication of the Instability of exports of goods and services.
A weighted sum of all the parameters (1) – (7) gives the EVI score for the
corresponding year.
3.1.4 Applying the EVI Methodology to a de facto State
It is important to revisit here the dilemma of unrecognized states in the
international law. Engaging in economic cooperation with de facto states, international
community does not include them in the international legal system, though. Thus, no
international statistics covers de facto states data, nor are composite indicators
calculated for these entities. By contrast, “national” statistics of the states is developed
with utmost diligence – partly with the support from different aid programs financed
by international organizations to increase transparency and ensure strategic planning of
conflict settlement, and partly by the secession advocates themselves, as an additional
tool of identity creation and state-building.
For example, United Nations Development Programme (UNDP) and the
World Bank have been assisting Somaliland to gather macroeconomic and social
economic indicators on the secessionist region to “keep track of socio-economic
developments in conflict and post-conflict countries” and in order to “prepare timely
and effective strategy to support post-conflict interventions” (Somaliland in Figures
2003). State statistical bodies of the unrecognized republics of Southern Ossetia and
Abkhazia are supported by Russia to conduct calculations of macroeconomic
indicators (Protocol 2009, February 27th
; Protocol 2009, February 29th
).
Moreover, there have been many attempts of de facto entities to apply the UN,
World Bank or IMF methodology and compute social and economic composite
indices. Thus, for example, the Republic of China (Taiwan) has been calculating its
HDI index (Human Development Index) since 1992 using the UNDP methodology
(DGBAS 2012). UNDP estimates the HDI for Palestina since late 1990s, despite
questionable status of Palestinian territories (UNDP 2004). The EVI has never been
calculated for a de facto state. However, Naudé et al (2008) applied the EVI

37
methodology to measure vulnerability on a subnational level, constructing a local
vulnerability index (LVI) for various districts of South Africa.
However, estimation of composite social and economic indicators for de facto
states poses a number of challenges. The main of them being (non)availability of
statistical data, (poor) validity of the data available, and (in)comparability of the
estimated indicators with parameters of other (sovereign) states. Due to poor
infrastructure or lack of expertise, gathering of statistical data in the unrecognized state
is notoriously challenging. Data may be unavailable simply because of lack of
registration routines. Once gathered, statistical data may lack validity. Propensity of
the unrecognized governments to politicize statistics may result in extensive data
rigging. Lack of experience and knowledge in processing of statistical information
may also affect data validity. Nevertheless, these challenges are encountered in all the
countries with poor governance. They cannot be a hindrance preventing statistical
research, but rather a limitation to the findings obtained.
Unlike the previous two, the challenge of (non)comparability is the sole
product of de facto status. Technically, limited sovereignty does not allow
comparisons with sovereign members of the UN on equal terms. But even leaving the
difference in definitions aside, de facto existence does impact statistics. It interferes
with terms of trade, as trading partners have to take into account embargos, increased
tariffs, or non-tariff barriers to trade. De facto states face market inefficiency due to
lack of transparency and specific economic structure22
. This leads to distortions of
macroeconomic indicators. In addition, when state functions of a de facto state are
outsourced from a patron or neighboring country, their statistical estimation would, in
fact, be a study of some other country’s performance (or indirectly, de facto state’s
dependence on a patron state23
). Thus, if compared with other (sovereign) countries,
composite indices calculated for de facto states should be interpreted with a careful
approach.
22
As a legacy of the “pre-secession” heritage, economic structure of de facto states may suffer from regional
planning of the parent state in the past (with unbalanced priorities for particular industries, extension of
production cycles far beyond the region etc).
23 More reflections on de facto state’s dependence and its assessment are given in Sections 2.3. and 3.3.

38
3.2 Defining Economic Resilience
3.2.1 The Concept of Resilience
Briguglio et al (2006:6-7) explain resilience as the ability of an economy to
recover quickly after adverse shocks (shock counteraction), and the ability of an
economy to adjust to the negative impacts of external economic shocks (shock
absorption). His understanding of the concept considers it as nurtured ability, by
contrast to structural economic vulnerability, which is inherent. Similar definition of
the concept is suggested by Guillaumont and Guillaumont Jeanneney (2011) who
perceive resilience as policy-induced (non-structural, and therefore more reversible)
ability to accommodate adverse external impacts.
The nurtured character of resilience points to the possibility to influence the
structural economic vulnerability by means of resilience, or, to be precise, through
resilience building. As Briguglio et al (2006:6) argue: “…vulnerable states should not
be complacent in the face of their economic vulnerability, but could, or should, adopt
policy measures to enable them to improve their ability to cope with external shocks”.
As an evidence to possibility of success despite structural disadvantages, the paper
considers the Singapore paradox, an example when resilience building policies of the
island overweighed handicaps stemming from smallness (islandness), and provided for
the impressive economic growth.
It should be noted, that due to reversibility, resilience exerts most impact on
dynamics of the economic viability (presuming that another component of viability –
structural economic vulnerability – is more “rigid”). Thus, it is resilience sources that
contribute most to keep up de facto state’s existence. Taking this in consideration,
conclusions in the result of current research depend largely on the assessment of the
nurtured dimension of viability.
The ability of resilience to be built by policies, and more importantly, to be
increased, clearly corresponds with the theoretical findings of SIDS researchers
outlined in Section 2.3. As discussed earlier in the thesis, the three main theories
considered (MIRAB, PROFIT and SITE) either point to specific economic niches that
are built up to foster economic growth (tourism, financial services), or other specific
39
individual sources of resilience (human capital, remittances, foreign aid, adaptability
of businesses). These advantages may also be classified as nurtured.
Finally, it should be noted, that policy-induced resilience cannot totally
exclude structural elements, as it may to a certain degree depend on the existing
(inherent) framework for decision-making. The distinction between economic
resilience and structural economic vulnerability is provisory and is strictly categorized
mainly for methodological purposes.
3.2.2 Identifying Methods to Assess Resilience of Transnistrian
economy
Following the studies dedicated to the design of the EVI index, Briguglio et al
(2006) constructed an Economic Resilience index, including four variables capturing
shock absorbing and shock counteracting elements: (1) macroeconomic stability; (2)
microeconomic market efficiency; (3) good political governance; (4) social and
environmental conditions. Whereby, each variable is proxied by several components,
which will be discussed later. As suggested earlier, along with the four resilience
variables listed, a fifth parameter is to be introduced in order to catch the specific
individual ability to offset adverse impacts of exogenous shocks.
Surprisingly or not, in the case of Transnistria, indicators of the index tend to
be highly politicized and subject to propaganda24
, except perhaps for the first
component of the index (macroeconomic stability), which may be less exposed to
speculations. The lack of comprehensive and reliable statistics does not allow
calculation of the Resilience index for Transnistria, developed by Briguglio et al
(2006). Therefore, a relevant qualitative method to assess the components of
Transnistria’s resilience is to be elaborated. To comply with the theoretical framework
suggested by Briguglio et al (2006) and chosen for the study, components of the
Economic Resilience index will be still utilized as parameters of Transnistria’s
economic resilience.
24
The statistical data to be used for the calculation of the EVI index should also be approached carefully.
However, in view of the structural nature of statistics used to estimate the EVI, it allows for comparatively less
data rigging, and therefore, may contribute to a higher validity.

40
In view of the research question’s complexity, semi-structured expert
interviews25
would be most relevant for the study. If the interview guide26
is designed
to correspond to the parameters of resilience, the answers constitute a most precise
assessment of the research question. Whereby, open questions in the interviews may
be utilized to define possible specific niches, constituting individual sources of
resilience of the Transnistrian economy.
Interviewing is used to assess these parameters of resilience: (2) micro-
economic market efficiency; (3) good political governance; (4) social development;
and (5) specific individual sources. Macroeconomic stability (1) may still be estimated
according to indicators suggested by Briguglio et al (2006). Assessment of
Transnistrian economic resilience will be structured in the following way:
Table 3.2.2 Resilience Assessment Scheme
Component of Resilience Quantitative Variable
Macro-economic stability (1) Fiscal deficit to GDP ratio
The inflation and unemployment rates
Relation of the external debt to GDP
Component of Resilience Topic for the Interview Questions
Microeconomic market efficiency (2) The size of government
Freedom to trade
Good governance (3) Impartiality of courts
Protection of intellectual property rights
Military interference in the rule of law
Political system and integrity of the legal system
Social Development (4) Education (adult literacy rate, school enrollment)
Health (life expectancy; quality of medical facilities,
housing)
Component of Resilience Topic for the Interview Questions Specific individual sources of resilience (5) Specific economic niches (open questions)
Other individual factors of resilience (open questions)
Taking into consideration sensitivity of the research question27
, and the fact
that the topic is little explored, priority will be given to the general judgments of the
25
Semi-structured interview is characterized by a sequence of themes to be covered and suggested questions,
whereas at the same time it is open for changes of sequence and forms of questions to follow up the answers
given. It implies a targeted approach to interviewees (Kvale 1996:124).
26 A list of questions or fairly specific topics to be covered in the interview (Bryman 2004:321).
27 Both economic viability of Transnistria and state-building in the break-away region as such is an issue fiercely
disputed by the conflicting parties and mediators in the settlement negotiations.

41
experts, instead of pressing for answers to all of the questions. To reveal resilience
dynamics over the period of 2001-2010, the interviewees will be asked to assess
economic developments observed in the region and name the main sources of
resilience in a flexible dialogue.
It is important that experts are chosen with a special diligence to ensure
validity of the results. Thus, the experts will have to represent all the conflicting
parties, main mediators (Moldova, Transnistria, Russia, Ukraine, OSCE) as well as
observing parties (EU, US). The number of interviewees will be limited to maximum
two from each party to simplify analysis of the results.
3.3 Estimation of Economic Viability
As suggested earlier, the economic viability of Transnistria will be assessed by
juxtaposition of its structural economic vulnerability and economic resilience. This
method, elaborated by Briguglio et al (2008) implies locating the country in one of the
four quadrants on a coordinate system with two axes standing for vulnerability and
resilience. The four quadrants represent different scenarios of economic development:
Vu
lner
abil
ity
I.Worst case
II.Self-made
III.Prodigal-son
IV.Best-case
Resilience
Figure 3.3 Juxtaposition of Vulnerability and Resilience
Source: Briguglio et al 2008
The thesis will employ the provisory EVI threshold of 40 (Briguglio et al
2008) to grade de facto economy into the relevant quadrants by vulnerability. While its
gradation by resilience will be estimated through a qualitative analysis
(“comparatively high”/”comparatively low”) of the interviews’ results. For the

42
research, the four scenarios of the economy’s development (“worst-case”, “self-made”,
“prodigal-son” and “best case”) will be assumed to correspond the four estimates of
the economic viability: “non-viable”, “viable by effort”, “viable by luck” and “viable”.
Thus, quantitative and qualitative methods are combined in the thesis to
assess Transnistrian economic viability28
as a cumulative function of vulnerability and
resilience. As discussed earlier, attributing vulnerability to exogenous factors beyond
the state’s control allows accounting also for the impact of vulnerabilities induced by
secession and de facto status upon economic growth. While the policy-induced
features of resilience reveal the ability of Transnistria to adjust to living in the non-
recognition.
The final variable to be revisited here is dependence on the patron country.
Dependence brings a number of dividends: funds to cover budget deficit, guaranteed
supply of strategic goods, and stable market for exports. This increases resilience of
the economy and strengthens economic viability. On the other hand, such advantages
make the economy less competitive and deteriorate de facto state’s ability to
independently withstand exogenous adversities (exogenous shocks). In addition, a
sudden loss of the patron state’s support would push de facto economy into a major
crisis (hence, dependence increases exposure to shocks). So, dependence on a patron
state expands not only resilience of de facto economy, but also its vulnerability,
although it is not accounted for in the EVI. This should be taken in consideration, so
that the results obtained in the study do not bring to misleading conclusions.
The methodology elaborated in the thesis facilitates application of tools,
developed for analysis of SIDS economies, to the research of de facto state’s economic
viability. It combines qualitative and quantitative approaches to accommodate the
findings of major theories of small island developing economies.
28
According to Bryman (2004:457), a multi-strategy research is justified when researchers cannot rely either on
a qualitative or quantitative method alone. Although the use of both quantitative and qualitative methods is
criticized for the attempt to combine two separate paradigms, the approach chosen for the thesis may be justified
by the need to reveal the “hidden” dimensions of de facto state’s viability.

43
4 Economic Viability of “The Island of
Transnistria”
4.1 Calculation of the EVI Components for
Transnistria
Calculation of the retrospective EVI for the PMR was constrained by the
availability of time series data. Taking advantage of the statistical yearbooks issued by
the State Statistics Service of the Ministry of Economy of the PMR (2006, 2011), the
period of 2001-2010 (ten years) was chosen for the research. Having applied formulas
(1) – (7) given in Section 3.1.3 to compute the components of the EVI, the following
scores were obtained (for detailed results of the calculations see Appendix 2):
Table 4.1 Retrospective EVI: Transnistria, by Components, 2001-2010
2001 2002 2003 2004 2005 2006 2007 2008 2009 2010
EVI 47,63 48,24 48,23 48,81 48,30 48,33 48,03 48,53 48,22 48,77
EXPOSURE INDEX 45,07 46,29 46,27 47,44 46,41 46,46 45,88 46,88 46,25 47,36
Population (Smallness) 86,76 86,77 86,79 86,90 86,92 86,93 86,94 86,95 86,96 86,97
Remoteness (Location
Index) 6,25 6,25 6,25 6,25 6,25 6,25 6,25 6,25 6,25 6,25
Structural Index 30,92 35,63 41,13 60,84 60,26 61,09 55,48 54,81 30,26 25,58
-Agricultural Production
share in GDP 0,17 5,00 4,83 9,17 5,00 5,17 2,83 6,83 4,50 9,00
-Merchandise export
consentration 30,75 30,63 36,30 51,68 55,26 55,92 52,65 47,98 25,76 16,58
SHOCK INDEX 50,19 50,19 50,19 50,19 50,19 50,19 50,19 50,19 50,19 50,19
Natural Shock Index 50,00 50,00 50,00 50,00 50,00 50,00 50,00 50,00 50,00 50,00
-Homelessness 0,00 0,00 0,00 0,00 0,00 0,00 0,00 0,00 0,00 0,00
-Instability of Agricultural
production 100,0 100,0 100,0 100,0 100,0 100,0 100,0 100,0 100,0 100,0
Trade Shock Index 50,38 50,38 50,38 50,38 50,38 50,38 50,38 50,38 50,38 50,38
Dynamics of the EVI scores over the ten year period reflected major trends in
Transnistrian economic development, justifying the use of the methodology. Although,
to tailor it to Transnistrian specifics, additional adjustments were necessary. Also
interpretations of the scores obtained for the EVI components reach beyond the SIDS
theory, and should be highlighted accordingly.

44
(1) Smallness: Transnistrian population statistics has been relatively stable
over the period. Consequently, dynamics of the indicator revealed practically
unchanged (and high) impact of Smallness upon the break-away region’s vulnerability.
Indeed, the PMR suffers substantially from inefficiencies stemming from Smallness:
inability to benefit from economies of scale (imported goods drive domestic products
out of the market), over-monopolization of the economy (with the “Sheriff” company
accounting for 16% of the GDP income and owning a wide range of companies from
KVINT brandy factory, bakeries, mobile phone operator, retail stores, to a football
club (Isachenko 2009)), high openness of the economy leading to higher vulnerability
to price fluctuations and adverse impact of the foreign trade policies (trade blockades
periodically initiated by Ukraine and Moldova), limited human capital reflecting the
poor efficiency of domestic bureaucracy and poor government (Protsyk 2009),
underdeveloped social infrastructure (the only university in the region does not
accommodate all the students willing to get higher education, for most advanced
surgeries Transnistrians travel to Moldova or other neighboring countries (Luskanova
2012 Telephone interview)).
The available population statistics does not, however, reflect actual emigration
trends. Hidden migration, by some estimates, amounts to almost 30% of the working
population in the period of 2001-2010 (Spanu 2012 Personal correspondence). If
taken into account, these data would push the Smallness component by 1,5, increasing
the region’s exposure to adverse exogenous factors.
(2) Remoteness: The component was calculated on the basis of WTO trade
statistics. In the absence of the official data on distances from Transnistria to the
capitals of main exporter’s, the distances from leading world exporters to the “parent
capital” Chisinau were utilized. In view of the 85km driving distance between the two
capitals, the data are believed not to interfere significantly with the results. Distance
data are provided by the French Research Centre in International Economics (Mayer
and Zignago 2011). For simplicity, only 10 top exporters were considered for
calculation of the minimal average distance from Transnistria to the world markets.
Remoteness scores for Transnistria have proven to be strikingly low. Indeed,
the break-away region enjoys an advantageous geographic position, situated not far

45
from the top world’s exporters Germany, Italy and the UK. On the other hand, the
methodology of calculations lacks relevance in the case of Transnistria, as it doesn’t
explain the geographic pattern of Transnistria’s trade. The largest bulk of foreign trade
(61%) is exercised with Russia, Moldova and Ukraine, and this share has been
growing primarily as a result of limited access to other foreign markets.
In addition, Remoteness is proxied to measure not only real transportation
costs that influence trade flows, but indirectly also other related costs or barriers
facilitating or decreasing export and import operations. In this regard, Transnistria
carries the burdens of increased costs both due to its landlocked location, and because
of its de facto status and the frozen conflict setting. Thus, for example, according to
Moldovan and Ukrainian agreements of 2006, all exporting and importing companies
of the unrecognized republic are bound to exercise customs procedures in Moldova
(ICG 2006). According to Gorelova and Selari (2009:34), these regulations within a
year raised costs by at least 50% and lowered profitability of local businesses, as they
inflicted additional operational costs, unscheduled shipment delays and often also
other administrative obstacles. The economic sanctions were labeled as leading to
“humanitarian catastrophe” in the region (NKR MFA 2006). In the calculations
conducted the 15% landlockedness adjustment was kept for simplicity reasons. The
additional costs are indeed much higher. According to Gorelova and Shelari (2009:34)
the “double registration” increased the customs costs by 50%, which means a
proportional “increase” of Transnistrian distance to the world’s markets. The so called
“railway war” of 2006, when Moldova stopped railway deliveries from Transnistria,
inflicted a total stop of imports and almost a 57% decrease of exports earlier shipped
by railway, the cheapest means of transport in the landlocked break-away region.
(3) Merchandise export concentration: The statistics available for
Transnistria’s exports allowed assessment of the product groups at one-digit level of
the SITC only. This, on the one hand, may have slightly distorted the results, but on
the other, could be more relevant for the small economy with comparatively lower
variety of goods produced by one industry sector.
The scores obtained for 2001-2010 proved to grow up until 2007, and
subsiding after the peak of almost 60% concentration to nearly 17% by the end of the

46
period. This, however, was not an evidence to positive structural changes in trade
pattern, but rather reflected the dramatic decline of total exports, and metallurgic
production in particular, in the aftermath of the global financial crisis of 2008.
The considerable volatility of the indicator points also to instability of the
production output. Also here, de facto status and frozen conflict exert their harmful
impact. For example, in 2011 the largest enterprise in Transnistria and Moldova, the
fifth largest mini-steel factory in Europe, the Moldovan Steel Works plant in Rybnitsa
MMZ suffered almost a 10 month standstill resulting allegedly from a customs dispute
with Moldova (Allin 2011:4).
The concentration of Transnistrian exports is perhaps better grasped in the
study of corporate monopolistic trends rather than in the export specialization.
According to International Crisis Group research (2006:4), the MMZ accounted for
over 60% of exports in 2006. Also textile factory Tirotex and monopolistic company
Sheriff play their key role in export concentration. The harming impact of the present
export specialization upon the region’s vulnerability was only partly revealed in the
indicator of the Merchandise export concentration score.
(4) Share of agriculture, forestry and fisheries in GDP: As Transnistrian
output of the fishery and forestry production is too insignificant, this component of the
EVI for Transnistria was proxied by the agricultural output share in GDP only.
This component of the EVI also proved to be volatile but insignificant. Apart
from fluctuating weather conditions, the floating share of agricultural output is partly
caused by the high openness of the economy and lack of the due state protection of the
sensitive and under-reformed sector from competitive imports. It should also be
mentioned here, that smuggling in food products is, according to the EUBAM, one of
the most common violation of the border regime between Transnistria and Moldova,
Ukraine (de Blasio 2012 Personal correspondence).
Over the 20 years since secession Transnistrian agricultural products have
been ousted from the market by imported goods. By FAO classification, Moldova
(including Transnistria) is represented in the group of high risk possessing very low
food security. According to Prime Minister of the PMR Stepanov, Transnistria
satisfies only 10-30% of its demand for meat, dairy products, fruits and vegetables

47
(Government of the PMR 2012, January 31). On the other hand, the remarkably low
share of agriculture in Transnistrian GDP does not allow the volatilities of the sector
spill over the structural economic vulnerability of the region.
The growing trend of the indicator scores may have grasped the recent priority
laid upon this sector of economy by the government. After this largely industrial
region of Moldova seceded from the rest of the country abundant in agricultural
products (in 2009 the share of agricultural products in Moldovan exports was 54%
(Gorelova 2009:87)), finally attempts are made to develop the sector to balance out the
production pattern (Luskanova 2012 Telephone interview).
The scores, increasing from 2008 on, may have also caught the foreign
(Russian) aid that has been channeled into this sector of economy since 2008.
According to Head of the Parliament of the PMR A.Kaminsky, by virtue of Russian-
financed loan mechanisms nearly 80% of Transnistrian agricultural machinery has
been modernized (Kaminsky 2011, July 12), increasing productivity of local farming.
(5) Homelessness due to natural disasters: So far, no major natural disasters
have been registered in Transnistria, since the geographic position of the region does
not imply tsunamis, volcanoes or extensive floods. This makes this EVI component
not suitable to measure the region’s proneness to shocks. If natural disasters represent
all the shocks that are beyond the state’s control inflicting harm primarily to the human
capital, Homelessness component could be proxied by the shocks induced by the
frozen conflict (the number of homeless, refugees or number of victims could stand
conflict induced shocks). Such an indicator measuring propensity to shocks due to the
ongoing frozen conflict as a structural handicap would be relevant also for other
secessionist regions not prone to natural disasters.
Transnistrian secession from the parent state was relatively mild, and despite
the frozen conflict conditions, the PMR has not lost a single life in a violent conflict
since 1992, when 300-500 people were killed, and around 100 thousand refugees fled
to adjacent countries (Helsinki Watch 1993:4-5). If the numbers were included in the
EVI, the results would be distorted by documenting the intense conflict proneness of
the region. This would contradict with the PMR’s peaceful existence over 20 years

48
now. It was, therefore, assumed that this component equaled zero – standing for low
probability of shocks costing human lives or inflicting refugees29
.
(6) Instability of agricultural production: The short period of 10 years does
not allow tracing volatility of this indicator, which was therefore assumed to be stable
over time. Since raw scores of the component turned out to be higher than Max value
introduced by the UN (34,6 while the upper boundary is 20), the normalized indicator
was assumed to equal 100.
The remarkable instability of agricultural output revealed crisis developments
in the sector. Agriculture creates little (sometimes even negative) value in
Transnistrian GDP (Shelari 2009:4). In the period of 2003-2008, share of agriculture in
the total economic growth constituted -5,4% (Statistical Yearbooks 2006, 2011).
(7) Instability of exports of goods and services proxies the trade shock index
for Transnistria. For the same reasons as for (6) it was assumed to be stable over time.
The high score of the trade shock index reflected both instability of domestic
supply and the region’s exposure to the foreign economic pressure. For example,
Gorelova (2009:85) listed at least five major conflicts between Moldova and
Transnistria implying income loss for both (including several “railroad wars”,
blockade of railroad shipments introduced in 2006 and partly lifted in 2012, obligatory
Moldova-registration for Transnistrian exporting and importing companies, special
customs regime introduced by Moldova).
For obvious reasons, not all the damage caused by external trade shocks can
be measured. Thus, for example, anti-smuggling measures are not directly reflected in
the vulnerability score. While establishment of the EU Border Assistance Mission to
Ukraine and Moldova in 2005, aimed to curb cross border smuggling at the
Ukrainian/Transnistrian border, constituted a major shock to the region’s “survival
economy”. Only in 2011 the Mission secured seizures of contraband goods – including
cigarettes, alcohol and vehicles – valued at EUR 3,2 million (de Blasio 2012 Personal
Correspondence). Forcing the shadow economy into the “white” is a major challenge
29
However, the zero score does not reflect the fears expressed by some researchers (for example, Popescu
2006b) regarding the hidden propensity of frozen conflicts to escalate. Further studies should be entertained to
adjust the Homelessness component to the frozen conflict specifics.
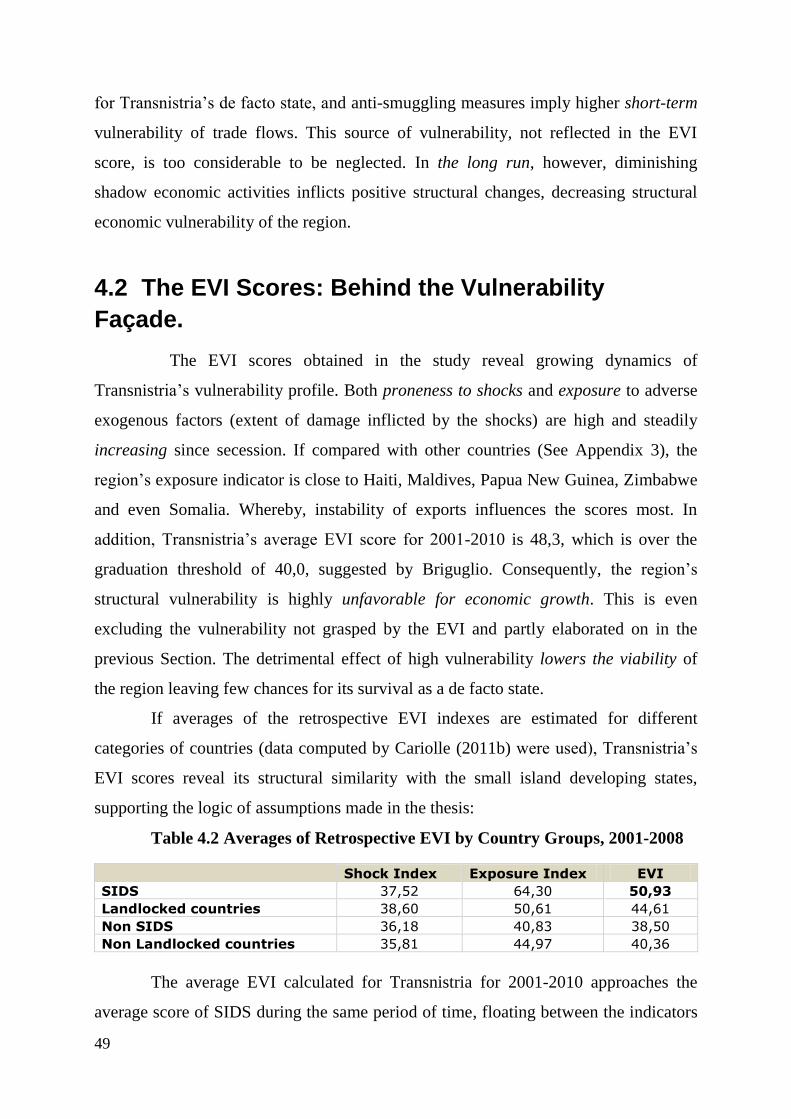
49
for Transnistria’s de facto state, and anti-smuggling measures imply higher short-term
vulnerability of trade flows. This source of vulnerability, not reflected in the EVI
score, is too considerable to be neglected. In the long run, however, diminishing
shadow economic activities inflicts positive structural changes, decreasing structural
economic vulnerability of the region.
4.2 The EVI Scores: Behind the Vulnerability
Façade.
The EVI scores obtained in the study reveal growing dynamics of
Transnistria’s vulnerability profile. Both proneness to shocks and exposure to adverse
exogenous factors (extent of damage inflicted by the shocks) are high and steadily
increasing since secession. If compared with other countries (See Appendix 3), the
region’s exposure indicator is close to Haiti, Maldives, Papua New Guinea, Zimbabwe
and even Somalia. Whereby, instability of exports influences the scores most. In
addition, Transnistria’s average EVI score for 2001-2010 is 48,3, which is over the
graduation threshold of 40,0, suggested by Briguglio. Consequently, the region’s
structural vulnerability is highly unfavorable for economic growth. This is even
excluding the vulnerability not grasped by the EVI and partly elaborated on in the
previous Section. The detrimental effect of high vulnerability lowers the viability of
the region leaving few chances for its survival as a de facto state.
If averages of the retrospective EVI indexes are estimated for different
categories of countries (data computed by Cariolle (2011b) were used), Transnistria’s
EVI scores reveal its structural similarity with the small island developing states,
supporting the logic of assumptions made in the thesis:
Table 4.2 Averages of Retrospective EVI by Country Groups, 2001-2008
Shock Index Exposure Index EVI
SIDS 37,52 64,30 50,93
Landlocked countries 38,60 50,61 44,61
Non SIDS 36,18 40,83 38,50
Non Landlocked countries 35,81 44,97 40,36
The average EVI calculated for Transnistria for 2001-2010 approaches the
average score of SIDS during the same period of time, floating between the indicators

50
of landlocked and island states, which demonstrate the highest structural
vulnerabilities in the world. Indeed, Transnistria bears the burdens common to small
economies and landlocked countries.
Interesting conclusions arise if the individual EVI components calculated for
Transnistria are compared with the EVI scores of some SIDS (see Appendix 3, Table
A.3.2). Close to other small island states by population (in 2006, the average SIDS
score being 80,93), Transnistria retains a clear advantage of proximity to the world
markets (PMR’s 6,25 for Remoteness by contrast with the SIDS average of 71,52),
however, constrained by the frozen conflict setting. Most concerns raise the PMR’s
Instability of exports (well above the SIDS average) and Structural Index (in 2006
being almost twice higher than SIDS average). By Structural index, the break-away
region is similar to Tuvalu where major government revenues come from sale of
stamps and coins and worker remittances, or to Solomon Islands surviving by
subsistence farming and fishing it development being constrained by violent ethnic
tensions. Transnistrian instability of agricultural production in 2006 documented
similarity with Cape Verde, an island in the Atlantic Ocean experiencing long periods
of droughts and by 82% dependent on imported foodstuffs. Transnistrian Instability of
exports is above average, while by Export concentration in 2006 the region was
closest to Samoa, where agriculture furnishes 90% of exports. All the small islands
used for comparisons are Least Developed Countries heavily dependent on foreign aid
(facts on small island states were borrowed from the UN-OHRLLS Country Profiles).
In addition to smallness and landlockedness, international pressure and
isolation of de facto state in a frozen conflict inflict higher and more unpredictable
fluctuations of trade volumes.
Although the EVI is not designed to measure external economic dependence
as a separate indicator of structural vulnerability, it is implicitly eminent in the EVI
components calculated for Transnistria. Foreign ownership on major income-
generating companies, Russian subsidies for development of agriculture, external trade
blockades or specific trade barriers are the factors that increase the region’s exposure
to adverse exogenous shocks, to mention a few.

51
Another significant factor standing behind a number of vulnerability sources is
the post secession legacy described earlier. High industrialization and narrow export
specialization stem from secession from the parent state. Whereas, before the
secession Transnistria was not only part of Moldovan economic system, it was part of
the (communist) system that collapsed. So, after secession the region faced a twofold
task: substitution for the loss of access to the parent state’s economy and transition to
market economy. As justly noted by Blakkisrud and Kolstø (2011:188), “nowhere
have the challenges been greater than in Transnistria, which not only was the sole
post-Soviet de facto state that did not inherit a set of statelike structures for ethno-
territorial autonomy, but also differed in being highly industrialized and having an
export-oriented economy”.
Summarizing the findings of the thesis, sources of Transnistria’s structural
economic vulnerability could be grouped into five main handicaps of the region:
Smallness
Landlockedness
“Islandness” (de facto status and frozen conflict setting)
Post-secession legacy
Dependence
These handicaps constitute the core obstacles to economic viability of the
region as a de facto state in the long run, unless addressed accordingly. It should also
be noted, that unlike the smallness and landlockedness, de facto status, frozen conflict
setting and dependence are reversible.
For Transnistria to be viable a twofold solution may be considered:
- Political solution: when adverse effects of smallness, landlockedness, de
facto status (and frozen conflict setting) and dependence are mitigated. This implies
either final settlement of the frozen conflict, or a “semi-solution” reached through
international negotiations and allowing a limited economic development for the
region. The trade-off between the two solutions attracts much attention across the
existing de facto states, but is unfortunately a question for a separate study.

52
- “The Singapore Paradox”-solution: when high vulnerability is offset by
a higher resilience, generated through sound state policies. The dynamics of
Transnistria’s resilience over the same period of 2001-2010 is addressed further.
4.3 Transnistria’s Resilience Profile
As suggested in the Section 3.2, to assess Transnistria’s resilience, expert
interviews were conducted. During March – May 2012 experts were asked to answer
the questions by e-mail or by phone, listing the region’s resilience sources according to
their importance. The interviewees were chosen to represent all the parties of the
“5+2” settlement negotiations, including Moldova, Transnistria, Ukraine, Russia,
OSCE and two observers – the EU and the USA. Whereas, major centers of expertise
(EUBAM Mission to Ukraine and Moldova, OSCE Mission to Moldova, some
national Ministries of Foreign Affairs and universities) were contacted to secure an in-
depth look into Transnistrian viability (for the full list of experts see Appendix 5). To
provide for validity of the results, equal number of experts from each of the parties
was interviewed. Due to time constraints, only one representative of the OSCE was
included in the research. However, since additional interview would also reflect the
OSCE official position, this is believed not to interfere significantly with the results.
The resilience parameters presented in Table 3.2.2 were used as an interview
guide. Whereby, open questions proved to be instrumental, as the specifics of
Transnistrian economy required a more flexible approach. Analysis of the interviews
was performed by employing meaning condensation30
to single out the main sources
of resilience.
The overall resilience estimation varied among the parties. While Russian
experts claimed that the break-away region possesses substantial resilience and is
viable (although experiencing problems typical for highly industrialized post-Soviet
territories), and Transnistrians were cautious but optimistic in conclusions, other
experts deemed the economy definitely non-viable but growing resilient due to
30
According to Kvale (1996:191-192), meaning condensation entails reduction of large interview texts into
briefer, more succinct formulations.
53
Russian subsidies. Surprisingly, the assessment of the main sources of resilience
demonstrated an overwhelming unanimity. The answers were cumulated into four
groups of major sources of Transnistria’s economic resilience (listed by importance):
- (1) financial support from Russia
- (2) heavy industry as a source for exports and budget revenues
- (3) shadow economy (money laundering and smuggling of goods)
- (4) remittances
The answers proved to list the specific individual sources of resilience only,
evidencing a higher individual “actor-ness” of de facto states in comparison with
sovereign small islands, when activity in specific economic niches prevails over
traditional economy. On the other hand, the estimated resilience profile revealed the
high level of adjustment to living in the non-recognition and frozen conflict in the
form of survival economy. Whereas good governance, social development,
microeconomic market efficiency – characteristic features of a well-functioning
economy – were not mentioned among the factors playing a role in Transnistrian
economic development.
Indeed, Russian financial support since 2007 amounts to almost 50 mln USD
annually (Lyndon 2011:2), and has increased lately with 30 mln USD aimed to
stabilize Transnistrian ruble. The financial flows are channeled to pay additional 15
USD to 137 thousand of Transnistrian pensioners monthly, as well as to cover the
budget deficit (BaltInfo April 3, 2012). A hidden but substantial support is rendered as
“silent acceptance“ of the non-payments for gas to Russian Gazprom.
Heavy industry brings budget revenues in form of taxes and dues. Whereas,
60% of the budget income comes from a few largest companies: the Moldovan
Metallurgical Plant MMZ in Rybnitsa, the Power Plant MGRES in Kuchurgan, as well
as from the monopolistic company Sheriff (Spanu 2012 Personal correspondence).
The trend of overconcentration of industrial production, on the other hand, undermines
resilience adding up to structural economic vulnerability of the region.
The companies mentioned above trade to Russia, Ukraine, Germany, USA and
other countries, competing with sovereign states on equal terms. The high
competitiveness of Transnistrian heavy industry is ascribed to the cheap (free) natural
54
gas. If the share of natural gas in a unit price of metallurgic production is around 40%
(Novytsky 2008), Russian demand to pay for the fuel would lead to at least a 40%
increase in prices for MMZ production, causing total loss of foreign markets. This
reveals another dimension of dependence on Russia.
Shadow economy has decreased lately thanks to the EU Border Assistance
Mission to Ukraine and Moldova some coordinated actions of Moldova-Ukraine
customs. Detections of smuggling and customs fraud contribute to the elimination of
the shadow schemes. Yet, it is still an income-generating activity for many of
Transnistrian businesses, and according to Gorelova and Selari (2009:3), annual
volume of shadow operations amounts to 1 bln USD (roughly 1/3 of the region’s GDP
in 2011). Interestingly enough, Russian experts interviewed noted that assessments of
the scale of the shadow economy are generally overdriven, while Transnistrian
population mostly survives by subsistence farming.
The role of remittances in the economy of Transnistria is barely studied. A
research of 2007 shows that the total amount of remittances amounted for 132 mln
USD (almost 15% of GDP). Most of the remittances were received from Russia
(80%), Turkey (10%), Italy (8%), USA and Cyprus (PRB 2007). Whereas, taking into
consideration the poor banking system in the region, a substantial amount is
transferred bypassing banks. According to the same study, average amounts
transferred range between 200 and 700 USD, which means that remittances are mainly
sources of survival rather than investments for the reformation and structural changes
in the economy.
According to Statistical Yearbooks of 2006 and 2011, in 2010 the number of
of people employed in the economy was by 87.000 people less than in 2001, which is
almost one third of the total labor force in 2001. This not only reveals the possible
scale of total remittances, but also shows decrease in human capital – a component of
structural economic vulnerability.
A separate topic not covered in the expert interviews research is the
macroeconomic stability. Facts show a disastrous macroeconomic situation in the
region. In 2012 Transnistrian fiscal deficit amounted to 67% (Ministry of Finance of
the PMR 2012), which is traditionally covered by foreign aid provided by Russia.

55
According to Shelari (2010:2), the average inflation rate for 2003-2008 was 24,6%,
unemployment rates floated around 16%. As documented by newly elected President
of the PMR E.Shevchuk, the total external debt of the country (non-payments for the
Russian gas) reached in 2012 the level of 3bln USD (Shevchuk 2012), thus driving the
relation of the external debt to GDP to almost 300%.
As comes from the research, resilience of Transnistrian economy is
comparatively low. Analysis of the interviews conducted shows that resilience-
building factors are almost all increasing structural vulnerability as well. Thus, for
example, Russian financial support is volatile, and cannot be relied on. Shadow
economy provides no budget revenues, and therefore has no positive impact on the
economic structure, distorting market information and leading to inefficiencies.
Remittances cannot substitute the indispensible strategic investments and do not
contribute to restructuring and reformation of the economy either. Heavy industry and
legal foreign trade appear to constitute the only resilience-building components
generating structural strength and decreasing vulnerability. The high concentration of
industrial production, though, blurs its positive impact upon the region’s economic
viability.
In addition, a bulk of resilience is generated by the frozen conflict setting and
de facto status. It is mainly the income from shadow economy and smuggling, but also
foreign financial support partly stems from the same setting. Obviously, since the
frozen conflict and non-recognition are among the region’s major handicaps
preventing economic development, this “source of resilience” also increases
vulnerability.
Finally, economic dependence on Russia protrudes as major factor behind the
main resilience sources. Foreign aid in the form of financial flows and loans, support
of Transnistrian currency, macroeconomic stabilization, investments in the biggest
companies MMZ and MGRES, as well as some social security guarantees are just a
few examples of such dependence. Despite the resilience-building targets, it increases
the break-away region’s exposure to adverse exogenous factors.

56
4.4 Economic Viability of Transnistria
To assess the economic viability of Transnistria, the research findings were
used to locate the economy on Briguglio’s map, juxtaposing its vulnerability and
resilience31
.
Structural economic vulnerability scores revealed a very high (and growing)
viability of the break-away region. The high EVI scores imply poor structural
conditions for the economy to grow. Countries with high vulnerability are not
necessarily “failed states”32
, though. The “Singapore Paradox” described by Briguglio
et al (2008) envisages the possibility of a spectacular economic development despite
high vulnerability by sound resilience-building efforts.
At the same time, assessments of the region’s economic resilience potential
were dubious: on the one hand, the resilience was estimated as very low, and on the
other, as growing enough to exist (by virtue of external support). Depending on the
resilience assessment, Transnistria’s economy can be located either in quadrant I.
(“non-viable”) or in quadrant II. (“viable by effort”):
Vu
lner
ab
ilit
y
I.Non-viable
II.Viable fy effort
III.Viable by luck
IV.Viable
Resilience
Figure 4.4 Juxtaposition of Economic Vulnerability and Resilience of
Transnistria, 2001-2010
31
Assumptions regarding applicability of the map to define economic viability require additional theorization
reaching beyond the scope of the thesis.
32 Used in the definition preferred by the Crisis States Research Network in London (2006) defining a “failed
state” as a condition of total “state collapse”, when a state can no longer perform its basic security and
development functions, and can no longer reproduce conditions for its own existence. The definition implies
clear difference between “poorly performing” states and “failed states”.

57
Location of the region’s economy on quadrant I. or quadrant II. depends on
the scope of efforts taken to support its existence, that is, by the scope of external
economic support (dependence), heavy industry, shadow economy and remittances. As
may be concluded from the research, the resilience-building registered in Transnistria
increases the region’s economic vulnerability: foreign aid is channeled to cover social
payments or budget expenditures, rather than structural reforms, adding little if some
value to the recipient economy; adverse impact of shadow economy is well
documented, while remittances offer no solution to the lack jobs at home.
The high economic dependence, as estimated in the course of the expert
interviews, is the main source of resilience and at the same time the largest handicap.
Indeed, Bertram’s (2004) findings outlined in Chapter 2 show that small island states
converge with patron economies rather than with each other, not only gaining
economic benefits in return for dependence but also increasing their vulnerability.
Whereas convergence is explained as a conscious choice of the dependent territory
seeking a stable economic growth and higher living standards for the people.
Transnistria’s economic (and political) dependence on Russia is a clear example of
“metropolis-periphery” relations, inflicting adverse structural changes to the dependent
economy. Thus, if dividends stemming from economic dependence for some reasons
fail, Transnistrian economy will be on the brink of collapse.
On the contrary, if the “Singapore paradox” is revisited, there is an alternative
way to address “islandness”: through building resilience and reducing vulnerability at
the same time. Now one of the largest exporters in the world, the small island of
Singapore has started its history of astonishing economic development with political
decisions on development of exporting industries, strengthening of human capital and
search for own niches on the world markets. These measures led to total restructuring
of the economy, and hence, to its lower exposure to adverse exogenous shocks.
According to a WTO report on the economic environment in Singapore, it has
managed to build a very strong resilience: “although its high degree of openness
leaves Singapore vulnerable to periodic external shocks, the economy's flexibility has
enabled it to adjust rapidly to these shocks by constantly improving productivity, and
thus international competitiveness, which in turn contributes to economic growth and

58
higher living standards” (WTO 2008:1). At the same time, the island state took
measures to “mitigate its vulnerability to external shocks” by “diversification across
markets and sectors” (WTO 2008:16).
In view of the catastrophic state of Transnistrian economy and its
unrecognized status, the region has limited capacity to mitigate its structural
vulnerability stemming from smallness, landlockedness, post-secession legacy and
dependence. But rather than taking resilience-building measures that bring short-time
effects and deteriorate economic vulnerability, state policies to restructure industrial
pattern, introduce market reforms and attract foreign investments could be prioritized.
The research allows concluding, that over the recent ten years the eternal dilemma of
choice between immediate needs (survival) and economic development in the long run
(viability) has been approached from a short-term perspective. The break-away region
has built up a minimal resilience at the level of survival to retain a subsistence
economy, at the cost of both vulnerability and viability in the long-term.
Implications of the poor viability potential promise few chances for a
prosperous future and may weaken Transnistria’s position in the settlement
negotiations.

59
Conclusions
Before drawing final conclusions, it should be reiterated that the aim of the
research was twofold.
Firstly, it attempted to explore Transnistrian economic viability. In view of the
modest scientific research on the topic and its high politicization, the study was meant
to fill in the knowledge gaps and present a well-grounded assessment of viability. By
assuming that de facto states bear main features of small island developing states, the
dynamics of economic viability under frozen conflict was traced over the period of
2001-2010 to assess region’s economy and predict the future development scenario.
Whereas, efforts to build a well-functioning economy were set in a wider state-
building context – as a product of living in the non-recognition, the strive for
international recognition and final settlement of the frozen conflict.
Secondly, the study intended to elaborate a methodology to be applied to
similar researches on other de facto states.
Compensating for the lack of methodology, the theories explaining economic
development of small island developing states were utilized in the thesis. Briguglio’s
dichotomy of vulnerability and resilience was employed as a framework to integrate
several theoretical and methodological findings: the UN’s Economic Vulnerability
Index assessing structural economic vulnerability, theories exploring resilience of
SIDS economies – MIRAB, PROFIT and SITE, as well as Bertram’s conclusion on
the convergence of small island states with their metropolitan economies. Unlike the
structural economic vulnerability assessed quantitatively, economic resilience of the
separatist republic was estimated qualitatively by conducting semi-structured expert
interviews.
The results of the research revealed comparatively high structural economic
vulnerability of Transnistria with the EVI growing from 47,63 to 48,77 in the period of
2001-2010. While the experts’ judgments on the economic resilience of the region
were dubious: ranging from low to growing enough to exist by virtue of mainly
external support.
60
Juxtaposition of the vulnerability scores and resilience assessments show the
low potential of economic viability in the Transnistrian economy. As comes from the
research, the economy is generally non-viable but made subsistent by efforts of its
patron state – Russian Federation, as well as by virtue of income from heavy industry,
exports, remittances and shadow economy. Extrapolation of the current trend promises
little hope for prosperous economic future for the separatist “island”.
Transnistria’s capability of surviving as a relatively independent social and
economic unit and developing into a well-functioning economy depends on the
resilience-building measures to be launched by the state leadership. By contrast with
the present resilience profile, priority should be given to the reforms strengthening
flexibility of the economy and mitigating its vulnerability. So far, efforts taken within
Transnistrian state-building project to build a strong economy were mismanaged to
undermine its vulnerability.
Implications of the empirical findings envisage further weakening of the
region’s position in settlement negotiations, or also little chances for international
recognition. However, to be validated, these statements require a separate research.
The methodology elaborated in the course of the thesis as well as the “island”
assumptions have proven to be generally instrumental. While the structural economic
vulnerability concept corresponded with de facto state’s conditions, the Briguglio’s
concept of resilience should be additionally modified to be applied in the situation of
non-recognition. Although the UN methodology of calculating the EVI appeared to be
well-adjusted for the assessment of de facto economy, further refinements are to be
introduced to better grasp the specifics of break-away regions under frozen conflict.
Application of expert interviews to estimate economic resilience proved to be highly
instrumental to balance the quantitative results with qualitative assessments and thus,
reach a higher validity of the general conclusions.
It should be noted, however, that the research was constrained by a number of
limitations. It is therefore important to keep in mind that small island economies and
de facto states are still different and challenges they face are of different origin and
causality, which is only partly revealed in the thesis. In addition, comparing economic
performance of a de facto state with achievements of a sovereign country is not fully

61
justified. Furthermore, the methodology used in the thesis was assumed to be
applicable in the “island situation” only and should be revised if a political solution on
the frozen conflict is reached. Finally, conclusions drawn here are based on the
research findings constrained by the available statistics. The results of the calculations
depended to a certain extent on the quality of the data provided.
To crown all, the research did not account for the complex geopolitical,
security and other dimensions of de facto existence under frozen conflict, limiting the
focus to the economic performance only. A more integrated study is necessary to give
a thorough assessment of the past developments, explain the present trends and predict
the future of the “Island of Transnistria”.
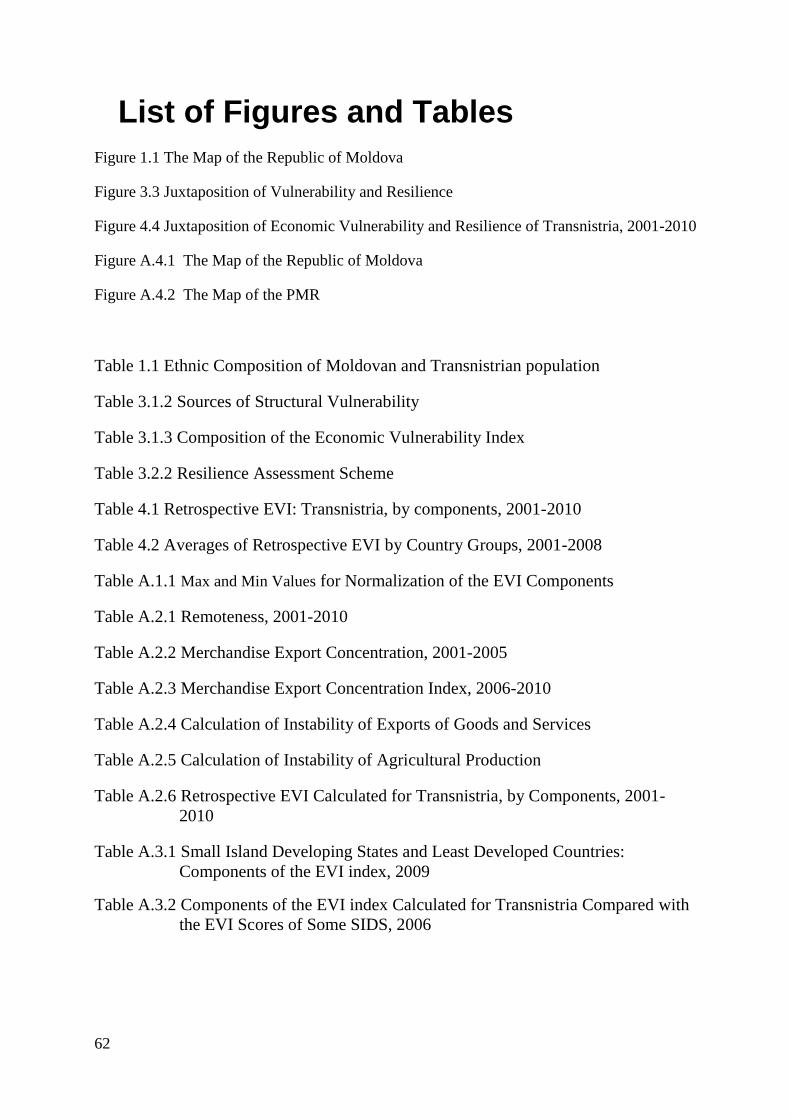
62
List of Figures and Tables
Figure 1.1 The Map of the Republic of Moldova
Figure 3.3 Juxtaposition of Vulnerability and Resilience
Figure 4.4 Juxtaposition of Economic Vulnerability and Resilience of Transnistria, 2001-2010
Figure A.4.1 The Map of the Republic of Moldova
Figure A.4.2 The Map of the PMR
Table 1.1 Ethnic Composition of Moldovan and Transnistrian population
Table 3.1.2 Sources of Structural Vulnerability
Table 3.1.3 Composition of the Economic Vulnerability Index
Table 3.2.2 Resilience Assessment Scheme
Table 4.1 Retrospective EVI: Transnistria, by components, 2001-2010
Table 4.2 Averages of Retrospective EVI by Country Groups, 2001-2008
Table A.1.1 Max and Min Values for Normalization of the EVI Components
Table A.2.1 Remoteness, 2001-2010
Table A.2.2 Merchandise Export Concentration, 2001-2005
Table A.2.3 Merchandise Export Concentration Index, 2006-2010
Table A.2.4 Calculation of Instability of Exports of Goods and Services
Table A.2.5 Calculation of Instability of Agricultural Production
Table A.2.6 Retrospective EVI Calculated for Transnistria, by Components, 2001-
2010
Table A.3.1 Small Island Developing States and Least Developed Countries:
Components of the EVI index, 2009
Table A.3.2 Components of the EVI index Calculated for Transnistria Compared with
the EVI Scores of Some SIDS, 2006

63
References
Abed, George T. (1990) “The Economic Viability of a Palestinian State” Journal of
Palestine Studies 19 (2): 3-28.
Anderson, Benedict R. (1983). Imagined Communities : Reflections on the Origin and
Spread of Nationalism. London: Verso.
Armstrong, Harvey W. and Robert Read (2000) “Comparing the Economic
Performance of Dependent Territories and Sovereign Microstates” Economic
Development and Cultural Change 48 (2): 285-306.
Armstrong, Harvey W. and Robert Read (2003) “The Determinants of Economic
Growth in Small States” The Round Table, 92 (368): 99-124.
Azzopardi, Rose Marie (2004). “Small Islands and Economic Viability”. Presented at
the Islands of the World VIII International Conference “Changins Islands – Changing
Worlds”, Kinmen Island, Taiwan, 1-7 November. Conference Paper.
Baldacchino, G. (2004) “The Coming of Age of Island Studies” Tijdschrift voor.
Economische en Sociale Geografie 95 (3): 272-283.
BaltInfo (2012, April 3). Transnistria received 140,5 mln USD from Russia in support.
/Приднестровье получило 140,5 млн. долларов от России помощи./ (2012, May
6th
) [online]. – URL: http://www.baltinfo.ru/2012/04/03/Pridnestrove-poluchilo-ot-
Rossii-1405-mln-rublei-pomoschi-269640
Bennett, Paul and Li Wei (2006) “Market structure, fragmentation, and market
quality” Journal of Financial Markets 9 (1): 49-78.
Bertram, Geoffrey (1999) “The MIRAB model twelve years on” The Contemporary
Pacific 11 (1): 105–38.
Bertram, Geoffrey (2004) “On the Convergence of Small Island Economies with Their
Metropolitan Patrons” World Development 32 (2): 343–364.
Bertram, Geoffrey and Ray F. Watters (1985) “The MIRAB economy in South Pacific
microstates” Pacific Viewpoint 26 (3): 497–519.
Blakkisrud, Helge and Pål Kolstø (2011) “From Secessionist Conflict Toward a
Functioning State: Processes of State- and Nation-Building in Transnistria” Post-
Soviet Affairs 27 (2): 178-210.
Bookman, Milica Z. (1993). The Economics of Secession. NY: St. Martin's Press.
Briguglio, Lino (1995) "Small island developing states and their economic
vulnerabilities" World Development 23 (9): 1615-1632.

64
Briguglio, Lino (2002) “The Economic Vulnerability of Small Island Developing
States” in Sustainable Development for Island Societies: Taiwan and the World, Asia-
Pacific Research Program w/SARCS Secretariat Publication, Taiwan, December 2002.
Briguglio, Lino, Gordon Cordina, Stephanie Bugeja and Nadia Farrugia (2006).
Conceptualizing and Measuring Economic Resilience. Malta: University of Malta,
Economics Department. Working paper.
Briguglio, Lino, Gordon Cordina, Nadia Farrugia and Stephanie Vella (2008).
Economic Vulnerability and Resilience - Concepts and Measurements. Helsinki:
United Nations University – World Institute for Development Economics Research
(UNU-WIDER). Research Paper No. 2008/55.
Briguglio, Lino and Waldemar Galea (2003). Updating the Economic Vulnerability
Index. Malta: Islands and Small States Institute, University of Malta. Occasional
Papers on Islands and Small States 2003 (4).
Brinkerhoff, Derick W. (2007). Capacity Development in Fragile States. Maastricht:
European Centre for Development (ECDPM). Discussion Paper No. 58D.
Bryman, Alan (2004). Social Research Methods. Oxford: Oxford University Press.
Buchanan, James M. and Roger L. Faith (1987) “Secession and the Limits of Taxation:
Toward a Theory of Internal Exit” American Economic Review 77 (): 1023-1031.
Cariolle, Jöel (2011a). The Economic Vulnerability Index: 2010 update. Clermont
Ferrand: Foundation for International Development Study and Research (FERDI).
FERDI Working Paper I 09 (March).
Cariolle, Jöel (2011b) L'indice de vulnérabilité économique: mise à jour 2010.
Clermont Ferrand: FERDI. Document de Travail.
Cariolle, Jöel and Patrick Guillaumont (2011). A Retrospective Economic
Vulnerability Index: 2010 update. Clermont Ferrand: Foundation for International
Development Study and Research (FERDI). Policy Brief 17 (March).
Caspersen, Nina (2009) “Playing the Recognition Game: External Actors and De Facto
States” The International Spectator: Italian Journal of International Affairs 44 (4): 47-
60.
Caspersen, Nina and Gareth Stansfield (Eds) (2011). Unrecognized states in the
international system. London: Routledge.
Center for Strategic Studies and Reforms – CSSR (2001) Evolution of the
Transnistrian economy: Critical Appraisal. (2012, April 16th
) [online]. – URL:
http://pdc.ceu.hu/archive/00002405
Clancy, Mary Alice C. and John Nagle (2009). “Frozen Conflicts, Minority Self-
Governance, Asymmetrical Autonomies – In Search of a Framework for Conflict

65
Management and Conflict Resolution”. Presented at the 6th Asia-Europe Roundtable,
University of Ulster, Londonderry/Derry, 10-12 June. Conference Paper.
Collier, Paul and Anke Hoeffler (2002) “The Political Economy of Secession,” in
Hurst Hannum and Eileen F. Babbitt (Eds) (2006): Negotiating Self-Determination.
Lanham, MD: Lexington Books.
Cooper, Andrew F. and Timothy M. Shaw (2009) “The Diplomacies of Small States at
the Start of the Twenty-first Century: How Vulnerable? How Resilient?” in Timothy
M. Shaw and Andrew F. Cooper (Eds) (2009): The Diplomacies of Small States:
Between Vulnerability and Resilience in the Global Political Economy. Basingstoke:
Palgrave Macmillan.
Crawford, James R. (2006). The Creation of States in International Law. Oxford:
Oxford University Press.
Crisis States Research Network (2006). Crisis, Fragile and Failed State Definitions
used by the CSRC. London: LSE, Department of International Development. Presented
at the Crisis States Workshop, March 2006.
De Blasio, Rosario (2012). Personal correspondence with author (EUBAM Mission to
Ukraine and Moldova). 7 May.
Directorate General of Budget, Accounting and Statistics (DGBAS) of the Republic of
China (Taiwan): Composite Indicators 1986-2010 (2012, February 28th
) [online]. –
URL: http://eng.stat.gov.tw/public/Attachment/142210335871.xls
Easterly, William and Kraay Aart (2000) “Small States, Small Problems? Income,
Growth, and Volatility in Small States” World Development 28 (11): 2013-2027.
Farrugia, Nadia (2004). “Economic Vulnerability: Developing a New Conceptual
Framework and Empirically Assessing Its Relationship with Economic Growth.”
Malta: University of Malta. Paper.
Fearon James D. and Pieter van Houten (2002). “The Politicization of Cultural and
Economic Difference. A Return to the Theory of Regional Autonomy Movements”.
Presented at the Laboratory in Comparative Ethnic Processes, Fifth Meeting, Stanford
University, 10-11 May. Draft.
Gorelova, Elena (2009). “Political Economy of Reintregration” in Matveev, Denis et
al. (Eds) Moldova-Transdniestria: Working Together for a Prosperous Future.
Economic Aspects. Chisinau: Cu Drag Publishing House.
Gorelova, Elena and Galina Shelari (2009). Costs of Transnistrian Conflict and
Benefits of Its Settlement (in Russian). Chisinau: Center for Strategic Research and
Reform. Report.

66
Government of the PMR (2012). Press release of January 31, 2012. (in Russian) (2012,
May 7th
) [online]. – URL: http://www.tv-pmr.com/news.php?id=13971
Gudim, Anatol (2006, July). Transnistria: Conflicts and Pragmatism of the Economy:
Center for Strategic Studies and Reforms, Chisinau. (2012, March 4th
) [online]. –
URL: http://pdc.ceu.hu/archive/00003500/01/transnistria.pdf
Guillaumont, Patrick (1999). On the Economic Vulnerability of Low Income
Countries. Clermont Ferrand: Centre for International Development Study and
Research (CERDI). Paper prepared for the International Task Force on Commodity
Risk Management in Developing Countries, World Bank.
Guillaumont, Patrick (2004). A Revised EVI. New York: UN. UN Document
CDP/2004/PLEN/16, 31/03/2004.
Guillaumont, Patrick (2007a). A Retrospective EVI: Methodological Aspects. Clermont
Ferrand: Centre for International Development Study and Research (CERDI). Working
Paper 01/2007.
Guillaumont, Patrick (2007b). "EVI and its Use. Design of an Economic Vulnerability
Index and its Use for International Development Policy". Presented at the UNU-
WIDER Conference on Fragile States-Fragile Groups, 15-16 June, Helsinki.
Guillaumont, Patrick (2008). An Economic Vulnerability Index: Its Design and Use for
International Development Policy. Helsinki: United Nations University – World
Institute for Development Economics Research (UNU-WIDER). Research Paper No.
2008/99.
Guillaumont, Patrick (2009) “An Economic Vulnerability Index: Its Design and Use
for International Development Policy”. Oxford Development Studies 37 (3): 193-228.
Guillaumont, Patrick (2011). The concept of structural economic vulnerability and its
relevance for the identification of the Least Developed Countries and other purposes
(nature, measurement, and evolution). NY: UN. CDP Background Paper No. 12.
Guillaumont, Patrick and Sylviane Guillaumont Jeanneney (2011) State fragility and
economic vulnerability: what is measured and why? Clermont Ferrand: Foundation for
International Development Study and Research (FERDI). Paper prepared for the
European Report on Development, FERDI Working Paper P.07.
Halabi, Yakub (2009) “Protracted Conflict, Existential Threat and Economic
Development” International Studies 46 (3): 319-348.
Helsinki Watch (1993). Human Rights in Moldova: The turbulent Dniester. New York
and Washington D.C.
67
Huliaras, Asteris (2002) “The Viability of Somaliland: Internal Constraints and
Regional Geopolitics” Journal of Contemporary African Studies 20 (2): 157-182.
ICG (International Crisis Group) (2003) Moldova: No Quick Fix. Chisinau/Brussels.
ICG Europe Report No.147.
ICG (International Crisis Group) (2004) Moldova: Regional Tensions over
Transdniestria. Chisinau/Brussels. ICG Europe Report No. 157.
ICG (International Crisis Group) (2006) Moldova’s Uncertain Future.
Chisinau/Brussels. ICG Europe Report No.175.
Ignatiev, Vitaliy (2012). Report of Deputy Minister of Foreign Affairs of the PMR
V.Ignatiev at the Meeting of the Enhanced Board of the Ministry of Foreign Affairs of
the PMR. /Доклад заместителя министра иностранных дел ПМР В.В. Игнатьева
на заседании расширенной Коллегии Министерства иностранных дел ПМР./
(2012, April 28th
) [online]. – URL: http://vestnik.mfa-
pmr.org/engine/print.php?newsid=70
IMF: International Financial Statistics. Balance of Payments - Unit Value of Imports.
Washington DC: International Monetary Fund. (2012, February 1st) [online]. – URL:
http://elibrary-data.imf.org/DataReport.aspx?c=1449327&d=33061&e=169393 and
http://data.un.org/Data.aspx?q=Import+unit+values&d=IFS&f=SeriesCode%3a75
Isachenko, Daria (2009) “On the Political Economy of Unrecognised Statebuilding
Projects” The International Spectator: Italian Journal of International Affairs, 44 (4):
61-75.
Kaminsky, Anatoliy (2011, July 13). President met with A. Kaminsky (in Russian).
(2012, January 2nd
) [online]. – URL: http://president.pmr-
gov.org/index.php?option=com_content&task=view&id=2389&Itemid=1
Kemp, Walter (2011). “ Out of the freezer: time for new approaches to conflict
settlement in the post-Soviet region”. Presented at The conference “20 years on from
the end of the Soviet Union: Prospects and opportunities for conflict resolution in the
post-Soviet space” held under the Chatham House Rule at the Locarno Suite of the
UK’s Foreign and Commonwealth Office, London, 4 July. Conference report.
King, Charles (2001) “The Benefits of Ethnic War: Understanding Eurasia’s
Unrecognized States” World Politics 53 (3): 524–552.
Kolstø, Pål (2006) “The Sustainability and Future of Unrecognized Quasi-States”
Journal of Peace Research 43 (6): 723–740.
Kolstø, Pål and Helge Blakkisrud (2008) “Living with Non-recognition: State- and
Nation-building in South Caucasian Quasi-states” Europe-Asia Studies 60 (3): 483-
509.

68
Kolstø, Pål, Andrei Edemsky and Natalya Kalashnikova (1993) ”The Dniester
Conflict: Between Irrendentism and Separatism'” Europe-Asia Studies 45 (6): 973-
1000.
Kulyk, Vitaliy (2012, April 20). Transnistria: Are We Loosing It? /Придністров’я: ми
його втрачаємо?/: Dzerkalo tyzhnia. Available: [online]. – URL:
http://dt.ua/POLITICS/pridnistrovya_mi_yogo_vtrachaemo-100881.html
Kulyk, Vitaliy and Valentyn Yakushyk (2008). “Yushchenko Plan on the Solution of
Transnistria Conflict and Prospects for Its Implementation (in Russian), in
Transnistria in the Macroregional Context of the Black Sea Rims. Sapporo: Slavic
Research Center, Hokkaido University.
Kuznets, Simon (1960) “The Economic Growth of Small Nations,” in E. A. G.
Robinson (Ed): The Economic Consequences of the Size of Nations. London:
Macmillan.
Kvale, Steinar (1996). Interviews: An Introduction to Qualitative Research
Interviewing. London: Sage Publications.
Lynch, Dov (2002) “Separatist States and Post-Soviet Conflicts” International Affairs
(Royal Institute of International Affairs 1944-) 78 (4): 831-848.
Lyndon, Allin (2011). “The Economics of the Transdniestrian Conflict Resolution:
Challenges and Opportunities”. Written Testimony for Helsinki Commission Public
Briefing on “Prospects for Unfreezing Moldova’s Frozen Conflict in Transnistria”,
June 14.
Mayer, Thierry and Soledad Zignago (2011) Notes on CEPII’s distances measures
(GeoDist). Paris: Center for International Prospective Studies (CEPII). Working Paper
2011-25.
McElroy, Jerome L. (2006) “Small Island Tourist Economies across the Life Cycle”
Asia Pacific Viewpoint 47 (1): 61-77.
Memorandum Kozaka (2003). Russian Draft Memorandum on the basic principles of
the state structure of a united state in Moldova (in Russian). (2012, January 4th
)
[online]. – URL: http://www.regnum.ru/news/458547.html
Ministry of Finance of the PMR (2012) Budget Draft for the PMR for 2012. (in
Russian). Tiraspol.
Ministry of National Planning and Coordination of the Republic of Somaliland (2003).
Somaliland in Figures. Hargeisa.
Naudé, Wim, Mark McGillivray and Stephanié Rossouw (2008). Measuring the
Vulnerability of Subnational Regions. Helsinki: United Nations University – World
69
Institute for Development Economics Research (UNU-WIDER). Research Paper
No.2008/54.
Newsru.com (2006) State Duma: Referendum in Transnistria Was Legitimate and
Russia Has to Take Its Results Into Account (in Russian). October 6, 2006. (2012,
May 9th
) [online]. – URL: http://www.newsru.com/russia/06oct2006/pmr.html
NKR MFA (2006) Economic Sanctions against Transnistria Inadmissible. Press-
release of March 13, 2006. (2012, May 8th
) [online]. – URL:
http://www.panarmenian.net/eng/world/news/16782
Nodia, Ghia (2004). Europeanization and (not) resolving secessionist conflicts. Journal
on Ethnopolitics and Minority Issues in Europe 2004 (1). (2012, January 6th
) [online].
– URL: http://www.ecmi.de/publications/detail/issue-12004-61/
Novytsky, Volodymyr (2008). “Report of Minister if Industrial Policy of Ukraine V.
Novytsky”. Presented at the Conference “Innovative introduction of energy efficient
technologies to secure a competitive industrial production”, Kyiv, 26-28 March 2008.
OSCE (2004). The Proposals and Recommendations of the Mediators from the OSCE,
the Russian Federation, and Ukraine with Regards to the Transnistrian Settlement.
Chisinau: OSCE Mission to Moldova. Report CIO.GAL/11/04.
Pavković, Aleksandar and Peter Radan (2007) Creating New States: Theory and
Practice of Secession. Hampshire, England: Ashgate Publishing.
Pegg, Scott (2008). “Opening the World Order to de facto States – Limits and
Potentialities for de facto States in the International Order”. Presented at the European
Parliament, Brussels, 15 May 2008. Conference Paper.
PRB (Transnistrian Regional Bank) (2007). Money Transfers in 2007. (2012, March
28th
) [online]. – URL: http://www.cbpmr.net/resource/prbvd1076.pdf
Popescu, Nicu (2006a) Democracy in Secessionism: Transnistria and Abkhazia’s
Domestic Policies. Central European University Center for Policy Studies, Open
Society Institute, Central European University, Budapest. (2012, February 18th
)
[online]. – URL: http://pdc.ceu.hu/archive/00003121/01/ popescu_f3.pdf
Popescu, Nicu (2006b). The EU and Transnistria. From Deadlock to Sustainable
Development. Budapest: Central European University. IPF Policy Brief.
Prasad, Naren (2004) “Escaping Regulation, Escaping convention: Development
Strategies for Small Economies” World Economics 5 (1): 41-65.
Premdas, Ralph R. (1990) "Secessionist Movements in Comparative Perspective," in
Ralph R. Premdas et al (Eds): Secessionist Movements in Comparative Perspective.
New York: St.Martin’s Press.
70
Protocol on Development of Cooperation and Mutual Support between the Federal
State Service for Statistics (the Russian Federation) and Department for State Statistics
of the Republic of Abkhazia (2009). /Протокол о развитии сотрудничества и
взаимопомощи между Федеральной службой государственной статистики (РФ) и
Управлением государственной статистики Республики Абхазия (2009)/ (2012,
March 27th
) [online]. – URL: http://www.gks.ru/free_doc/new_site/m-sotrudn/abx.htm
Protocol on Development of Cooperation and Mutual Support between the Federal
State Service for Statistics (the Russian Federation) and Department for State Statistics
of the Republic of South Ossetia (2009). /Протокол о развитии сотрудничества и
взаимопомощи между Федеральной службой государственной статистики (РФ) и
Управлением государственной статистики Республики Южная Осетия (2009)/
(2012, February 29th
) [online]. – URL: http://www.gks.ru/free_doc/new_site/m-
sotrudn/abx.htm
Protsyk, Oleh (2009) “Representation and Democracy in Eurasia’s Unrecognized
States: The Case of Transnistria” Post-Soviet Affairs 25 (3): 257–281.
RBK Ukraine (2006, March 15). Transnistrian Ministry of Economy: the Economic
Blockade to Cause Losses Reashing 30.7 mln US dollars. /Мінекономіки
Придністров’я: втрати економіки від економічної блокади досягли 30,7 млн
доларів./ (2012, February 1st) [online]. – URL:
http://www.rbc.ua/ukr/newsline/show/minekonomiki_pridnestrovya_poteri_regiona_ot
_ekonomicheskoy_blokady_dostigli_30_7_mln_doll__1142404939
Shelari, Galina (2009). Agrarian sector of the Republic of Moldova and
Transdniestria: reforms and results. Chisinau: Institute for Public Policy. Black Sea
Peacekeeping Network Report.
Shelari, Galina (2010). The Economy of Transnistria: view from the outside. Chisinau:
Institute for Public Policy. Black Sea Peacekeeping Network Report.
Shevchuk, Evgeniy (2012). Annual Presidential Address. (in Russian). (2012, April
22nd
) [online]. URL: http://dniester.ru/node/6764
Spanu, Vlad (2012). Personal correspondence with author (Moldova Foundation). 29
April.
Srinivasan, T.N. (1986) “The Costs and Benefits of Being a Small, Remote, Island,
Landlocked, or Ministate Economy” World Bank Research Observer 1 (2): 205-218.
Streeten, Paul (1993) "The special problems of small countries" World Development
21 (2): 197-202.
Statistical Yearbook of the Transnistrian Moldovan Republic - 2006: Statistical Data
for 2006-2011./Статистический ежегодник Приднестровской Молдавской
республики - 2011: Статистический сборник (за 2001–2005 гг.)/ Tiraspol: The
State Statistics Service of the Ministry of Economy of the PMR.
71
Statistical Yearbook of the Transnistrian Moldovan Republic - 2011: Statistical Data
for 2001-2006./Статистический ежегодник Приднестровской Молдавской
республики - 2006:Статистический сборник (за 2006–2010 гг.)/ Tiraspol: The
State Statistics Service of the Ministry of Economy of the PMR.
The Map of the PMR (in Russian). (2012, May 2nd
) [online]. URL: http://www.infokart.ru/wp-content/uploads/2011/08/pridnestrowie_karta.jpg
Troebst, Stefan (2002) “The Transdniestrian Moldovan Republic: From Conflict-
Driven State-Building to State-Driven Nation-Building,” European Yearbook of
Minority Issues 2 (2002/2003): 5-30.
Troebst, Stefan (2003) „Staatlichkeitskult im Pseudo-Staat. Nationales
Identitätsmanagement durch Geschichtspolitik in Transnistrien" Osteuropa 53 (7):
963-983.
Luskanova, Kornelia (2012). Telephone interview with author. March 3.
Turkish Daily News (2012, April 5, 2007). Turkey, Northern Cyprus Sign Economic
Development Deal. Available: [online]. – URL:
http://arama.hurriyet.com.tr/arsivnews.aspx?id=-603112
UN (1994a). “Programme of Action for the Sustainable Development of Small Island
Developing States (Barbados Programme of Action (BPOA))”. Presented at the Global
Conference, Bridgetown, Barbados, 25 April-6 May.
UN (1994b). Report of the Global Conference on the Sustainable Development of
Small Island Developing States. New York: UN General Assembly. Conference
Report A/CONF.167/9.
UN (2000). UN General Assembly resolution A/RES/55/2: United Nations Millennium
Declaration. New York: United Nations.
UNDESA (2008). Handbook on the Least Developed Country Category: Inclusion,
Graduation and Special Support Measures. New York: UN CDP.
UNDESA (2009). Handbook on the Least Developed Country Category: Inclusion,
Graduation and Special Support Measures. Statistical Tables. New York: UN CDP.
UNDESA (2011): LDC information: The criteria for identifying least developed
countries. Economic vulnerability index. (March 4th
, 2012) [online]. – URL:
http://www.un.org/en/development/desa/policy/cdp/ldc/ldc_criteria.shtml#evi
UNDESA: LDC information: The criteria for identifying least developed countries.
Overview. Updated September 2011. (2012, February 21st) [online]. – URL:
http://www.un.org/en/development/desa/policy/cdp/ldc/ldc_criteria.shtml#evi
72
UNDESA: The criteria for identifying least developed countries. Definitions and Main
Data Sources. Updated September 2011 (2012, February 1st) [online]. – URL:
http://www.un.org/en/development/desa/policy/cdp/ldc/ldc_definitions.shtml
UNDESA: Who are SIDS? (2012, January 21st) [online]. – URL:
http://www.un.org/esa/sustdev/sids/sidslist.htm
UNDP (2004). Palestine. Human Development Report 2004. Ramalah – Gaza:
Development Studies Programme.
UN Office of the High Representative for LDCs, LLDCs and SIDS (UN-OHRLLS)
(2011) Small Islands Big(ger) Stakes. New York: UN-OHRLLS.
Witter, Michael, Lino Briguglio, and Assad Bhuglah (2002). “Measuring and
Managing the Economic Vulnerability of Small Island Developing States”. Presented
at the Global Roundtable “Vulnerability and Small Island Developing States:
Exploring Mechanisms for Partnerships”, Montego Bay, Jamaica, 9-10 May, 2002.
Paper.
WTO (2008). 5th Trade Policy Review of Singapore. Geneva: World Trade
Organisation. WT/TPR/S/202, 9 June 2008.
WTO Trade Statistics: Time series. (2012, March 1st) [online]. – URL:
http://stat.wto.org/StatisticalProgram/WSDBStatProgramHome.aspx?Language=E
73
Appendixes
Appendix 1. Lower and Upper Boundaries of the EVI Components
Appendix 2. Components of the Retrospective EVI for Transnistria, 2001-2010
Appendix 3. Components of the Retrospective EVI for Some SIDS and LDCs
2006, 2009
Appendix 4. Maps
Appendix 5. List of Experts Interviewed
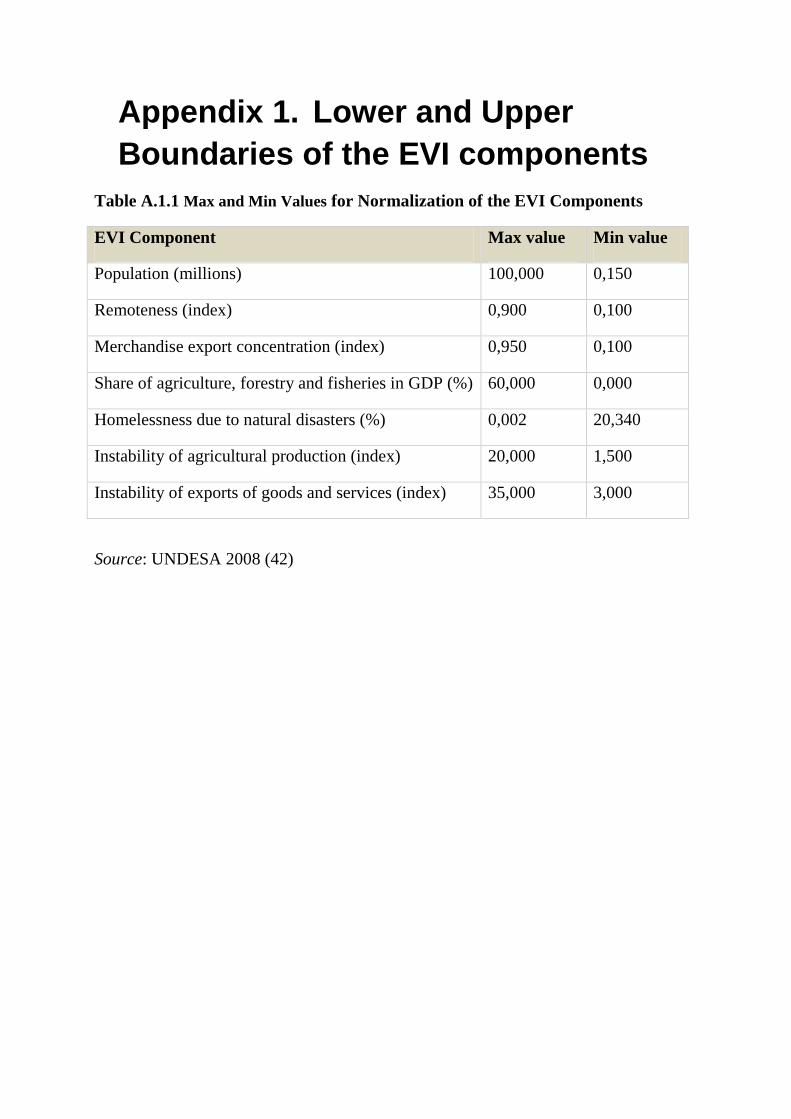
Appendix 1. Lower and Upper
Boundaries of the EVI components
Table A.1.1 Max and Min Values for Normalization of the EVI Components
EVI Component Max value Min value
Population (millions) 100,000 0,150
Remoteness (index) 0,900 0,100
Merchandise export concentration (index) 0,950 0,100
Share of agriculture, forestry and fisheries in GDP (%) 60,000 0,000
Homelessness due to natural disasters (%) 0,002 20,340
Instability of agricultural production (index) 20,000 1,500
Instability of exports of goods and services (index) 35,000 3,000
Source: UNDESA 2008 (42)

Appendix 2. Components of the Rectrospective EVI
Computed for Transnistria, 2001-2010
Table A.2.1 Remoteness, 2001-2010
2001
Distance
% of the
world
exports
Trade
weighted
distance
2002
Distance
% of the
world
exports
Trade
weighted
distance
2003
Distance
% of the
world
exports
Trade
weighted
distance
US 7650,435 11,78 900,974 US 7650,435 10,68 816,781 Germany 1656,77 9,91 164,140
Germany 1656,772 9,23 152,978 Germany 1656,772 9,49 157,161 US 7650,44 9,55 730,927
Japan 8546,010 6,52 556,983 Japan 8546,010 6,42 548,574 Japan 8546,01 6,22 531,526
France 1976,854 5,22 103,258 France 1976,854 5,11 101,011 China 6742,61 5,78 389,507
UK 2150,279 4,41 94,720 China 6742,606 5,02 338,165 France 1976,85 5,17 102,162
China 6742,606 4,30 289,807 UK 2150,279 4,32 92,806 UK 2150,28 4,03 86,631
Canada 7732,758 4,20 324,571 Italy 1413,827 3,92 55,409 Italy 1413,83 3,95 55,788
Italy 1413,827 3,95 55,834 Canada 7732,758 3,89 300,632 Netherlands 1813,74 3,90 70,774
Netherlands 1813,739 3,73 67,632 Netherlands 1813,739 3,76 68,185 Canada 7732,76 3,60 278,015
Hong Kong, China* 6742,606 3,09 208,090 Belgium 1831,669 3,33 60,979 Belgium 1831,67 3,37 61,720
MIN
972,319
873,716 819,23
LN
6,880
6,77 6,71
Raw
0,15
0,15 0,15
Minmax
6,25
6,25 6,25
*China distance for Hong Kong
Sources: Distances – Mayer and Zignago 2011, trade statistics – WTO Trade Statistics [online]., retrieved 2012, March 1st
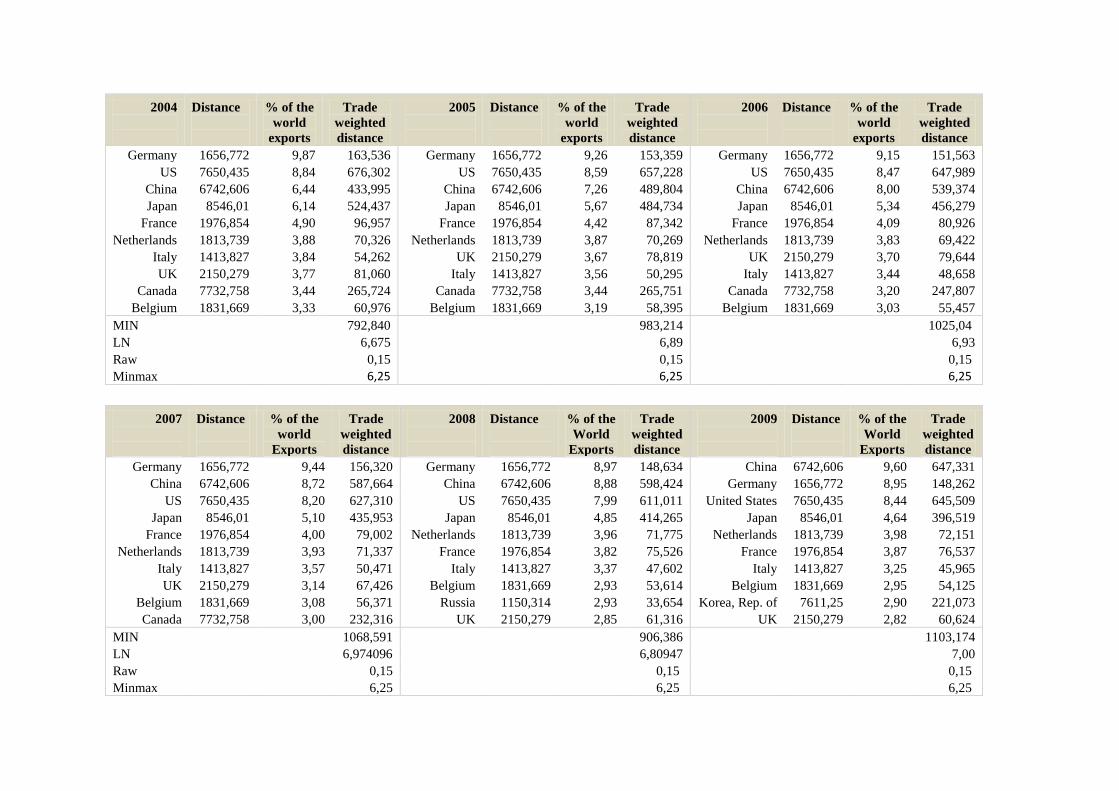
2004
Distance
% of the
world
exports
Trade
weighted
distance
2005
Distance
% of the
world
exports
Trade
weighted
distance
2006
Distance
% of the
world
exports
Trade
weighted
distance
Germany 1656,772 9,87 163,536 Germany 1656,772 9,26 153,359 Germany 1656,772 9,15 151,563
US 7650,435 8,84 676,302 US 7650,435 8,59 657,228 US 7650,435 8,47 647,989
China 6742,606 6,44 433,995 China 6742,606 7,26 489,804 China 6742,606 8,00 539,374
Japan 8546,01 6,14 524,437 Japan 8546,01 5,67 484,734 Japan 8546,01 5,34 456,279
France 1976,854 4,90 96,957 France 1976,854 4,42 87,342 France 1976,854 4,09 80,926
Netherlands 1813,739 3,88 70,326 Netherlands 1813,739 3,87 70,269 Netherlands 1813,739 3,83 69,422
Italy 1413,827 3,84 54,262 UK 2150,279 3,67 78,819 UK 2150,279 3,70 79,644
UK 2150,279 3,77 81,060 Italy 1413,827 3,56 50,295 Italy 1413,827 3,44 48,658
Canada 7732,758 3,44 265,724 Canada 7732,758 3,44 265,751 Canada 7732,758 3,20 247,807
Belgium 1831,669 3,33 60,976 Belgium 1831,669 3,19 58,395 Belgium 1831,669 3,03 55,457
MIN
792,840 983,214 1025,04
LN
6,675 6,89 6,93
Raw
0,15 0,15 0,15
Minmax
6,25 6,25 6,25
2007
Distance
% of the
world
Exports
Trade
weighted
distance
2008
Distance
% of the
World
Exports
Trade
weighted
distance
2009
Distance
% of the
World
Exports
Trade
weighted
distance
Germany 1656,772 9,44 156,320 Germany 1656,772 8,97 148,634 China 6742,606 9,60 647,331
China 6742,606 8,72 587,664 China 6742,606 8,88 598,424 Germany 1656,772 8,95 148,262
US 7650,435 8,20 627,310 US 7650,435 7,99 611,011 United States 7650,435 8,44 645,509
Japan 8546,01 5,10 435,953 Japan 8546,01 4,85 414,265 Japan 8546,01 4,64 396,519
France 1976,854 4,00 79,002 Netherlands 1813,739 3,96 71,775 Netherlands 1813,739 3,98 72,151
Netherlands 1813,739 3,93 71,337 France 1976,854 3,82 75,526 France 1976,854 3,87 76,537
Italy 1413,827 3,57 50,471 Italy 1413,827 3,37 47,602 Italy 1413,827 3,25 45,965
UK 2150,279 3,14 67,426 Belgium 1831,669 2,93 53,614 Belgium 1831,669 2,95 54,125
Belgium 1831,669 3,08 56,371 Russia 1150,314 2,93 33,654 Korea, Rep. of 7611,25 2,90 221,073
Canada 7732,758 3,00 232,316 UK 2150,279 2,85 61,316 UK 2150,279 2,82 60,624
MIN
1068,591 906,386 1103,174
LN
6,974096 6,80947 7,00
Raw
0,15 0,15 0,15
Minmax
6,25 6,25 6,25
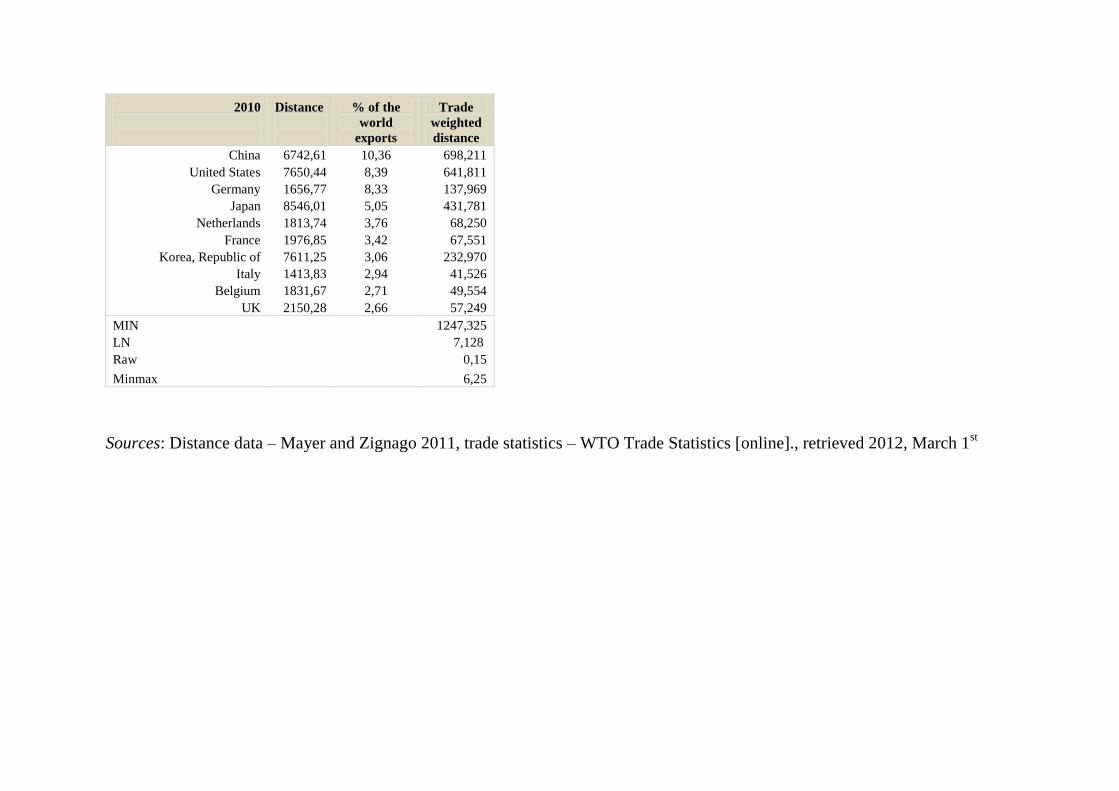
2010
Distance
% of the
world
exports
Trade
weighted
distance
China 6742,61 10,36 698,211
United States 7650,44 8,39 641,811
Germany 1656,77 8,33 137,969
Japan 8546,01 5,05 431,781
Netherlands 1813,74 3,76 68,250
France 1976,85 3,42 67,551
Korea, Republic of 7611,25 3,06 232,970
Italy 1413,83 2,94 41,526
Belgium 1831,67 2,71 49,554
UK 2150,28 2,66 57,249
MIN
1247,325
LN
7,128
Raw
0,15
Minmax
6,25
Sources: Distance data – Mayer and Zignago 2011, trade statistics – WTO Trade Statistics [online]., retrieved 2012, March 1st

Table A.2.2 Merchandise Export Concentration, 2001-2005
EXPORT STRUCTURE, mln USD
2001 (e/E)2 2002 (e/E)2 2003 (e/E)2 2004 (e/E)2 2005 (e/E)2
Food and live animals 0,1 0,0000001 0,1 0,0000002 0,5 0,0000014 0,1 0,0000000 0 0,0000000
Food products of plant origin 2,5 0,0000413 3,7 0,0002313 3,4 0,0000637 3,9 0,0000531 7,2 0,0001544
Oils and fats of plant origin 1,4 0,0000130 0,3 0,0000015 1 0,0000055 2,9 0,0000294 0 0,0000000
Ready food products, beverages and tobacco 18,6 0,0022863 16,4 0,0045436 29,2 0,0046984 22,4 0,0017530 15,6 0,0007247
Mineral fuels, lubricants and related materials 50,1 0,0165873 44,7 0,0337544 49,1 0,0132845 44,8 0,0070121 48,1 0,0068894
Chemicals and related materials 0,2 0,0000003 0,3 0,0000015 0,1 0,0000001 0,3 0,0000003 0,5 0,0000007
Gums and plastic 1,6 0,0000169 1,2 0,0000243 1,8 0,0000179 2,4 0,0000201 2,8 0,0000233
Leather and leather manufactured goods 0 0,0000000 0 0,0000000 0,1 0,0000001 0 0,0000000 0,1 0,0000000
Wooden goods 0,1 0,0000001 0 0,0000000 0,2 0,0000002 0 0,0000000 0 0,0000000
Wood materials, paper and cartboard 44,3 0,0129691 0,3 0,0000015 0,7 0,0000027 0,1 0,0000000 0 0,0000000
Textile materials and garments 38 0,0095426 38,1 0,0245226 63,7 0,0223594 67,7 0,0160129 72,8 0,0157818
Shoes and hats 12 0,0009516 8,9 0,0013381 18,8 0,0019476 17,6 0,0010822 18,1 0,0009756
Stone, cement and azbest manufactured goods 0,7 0,0000032 0,7 0,0000083 0,8 0,0000035 1,1 0,0000042 1,1 0,0000036
Non precious metals and related goods 181,3 0,2172183 107,8 0,1963149 216,3 0,2578065 335,9 0,3941962 378,6 0,4268294
Machinery and equipment, electrotechnic, audio and
video commodities 31,7 0,0066408 16,9 0,0048249 26,2 0,0037825 32,1 0,0036000 31,4 0,0029360
Vehicles, vessels and flying objects 6,2 0,0002540 3,1 0,0001623 11 0,0006668 0,7 0,0000017 0,6 0,0000011
Miscellaneous manufactured articles 0,5 0,0000017 0,8 0,0000108 3,1 0,0000530 3,1 0,0000336 2,6 0,0000201
TOTAL 389,3 0,2665265 243,3 0,2657403 426 0,3046935 535,1 0,4237990 579,5 0,4543401
Raw (Herfindahl-Hirschmann Index) 0,36 0,36 0,41 0,54 0,57
Maxmin 30,75 30,63 36,30 51,68 55,26
Source: Merchandise export statistics – Statistical Yearbooks of the PMR 2006 and 2011
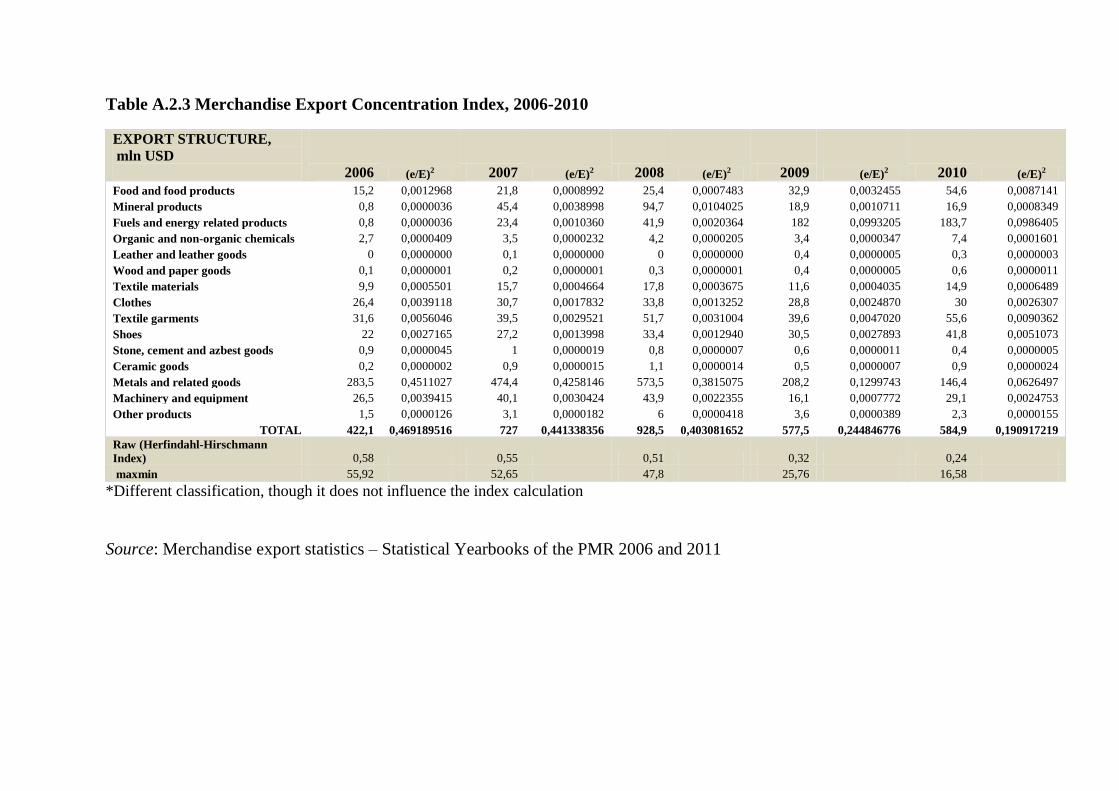
Table A.2.3 Merchandise Export Concentration Index, 2006-2010
EXPORT STRUCTURE,
mln USD
2006 (e/E)2 2007 (e/E)2 2008 (e/E)2 2009 (e/E)2 2010 (e/E)2
Food and food products 15,2 0,0012968 21,8 0,0008992 25,4 0,0007483 32,9 0,0032455 54,6 0,0087141
Mineral products 0,8 0,0000036 45,4 0,0038998 94,7 0,0104025 18,9 0,0010711 16,9 0,0008349
Fuels and energy related products 0,8 0,0000036 23,4 0,0010360 41,9 0,0020364 182 0,0993205 183,7 0,0986405
Organic and non-organic chemicals 2,7 0,0000409 3,5 0,0000232 4,2 0,0000205 3,4 0,0000347 7,4 0,0001601
Leather and leather goods 0 0,0000000 0,1 0,0000000 0 0,0000000 0,4 0,0000005 0,3 0,0000003
Wood and paper goods 0,1 0,0000001 0,2 0,0000001 0,3 0,0000001 0,4 0,0000005 0,6 0,0000011
Textile materials 9,9 0,0005501 15,7 0,0004664 17,8 0,0003675 11,6 0,0004035 14,9 0,0006489
Clothes 26,4 0,0039118 30,7 0,0017832 33,8 0,0013252 28,8 0,0024870 30 0,0026307
Textile garments 31,6 0,0056046 39,5 0,0029521 51,7 0,0031004 39,6 0,0047020 55,6 0,0090362
Shoes 22 0,0027165 27,2 0,0013998 33,4 0,0012940 30,5 0,0027893 41,8 0,0051073
Stone, cement and azbest goods 0,9 0,0000045 1 0,0000019 0,8 0,0000007 0,6 0,0000011 0,4 0,0000005
Ceramic goods 0,2 0,0000002 0,9 0,0000015 1,1 0,0000014 0,5 0,0000007 0,9 0,0000024
Metals and related goods 283,5 0,4511027 474,4 0,4258146 573,5 0,3815075 208,2 0,1299743 146,4 0,0626497
Machinery and equipment 26,5 0,0039415 40,1 0,0030424 43,9 0,0022355 16,1 0,0007772 29,1 0,0024753
Other products 1,5 0,0000126 3,1 0,0000182 6 0,0000418 3,6 0,0000389 2,3 0,0000155
TOTAL 422,1 0,469189516 727 0,441338356 928,5 0,403081652 577,5 0,244846776 584,9 0,190917219
Raw (Herfindahl-Hirschmann
Index) 0,58 0,55 0,51 0,32 0,24
maxmin 55,92 52,65 47,8 25,76 16,58
*Different classification, though it does not influence the index calculation
Source: Merchandise export statistics – Statistical Yearbooks of the PMR 2006 and 2011

Table A.2.4 Calculation of Instability of Exports of Goods and Services
2001 2002 2003 2004 2005 2006 2007 2008 2009 2010
Exports
(mln USD) 390,2 243,4 432,2 535,1 579,7 422,1 727,0 928,5 577,5 584,9
Import unit
values 76,3 75,3 81,0 94,3 100,0 105,4 116,5 137,7 115,4 115,7
Exports
deflated by
import unit
values 5,11 3,23 5,34 5,67 5,80 4,00 6,24 6,74 5,00 5,06
Ln(ExpDefl) 1,63 1,17 1,67 1,74 1,76 1,39 1,83 1,91 1,61 1,62
Source: Exports statistics – Statistical Yearbooks of the PMR 2006 and 2011, import
unit values – IMF International Financial Statistics
t Ln (Yt) Ln (Yt)
estimated Deviation
1 1,632 1,5228 0,10919
2 1,1732 1,5473 -0,37407
3 1,6744 1,5718 0,10264
4 1,736 1,5963 0,13967
5 1,7573 1,6208 0,13654
6 1,3875 1,6453 -0,25782
7 1,831 1,6698 0,16123
8 1,9084 1,6943 0,21410
9 1,6103 1,7188 -0,10850
10 1,6209 1,7433 -0,12240
Standard error 0,19
Maxmin 50,38

Table A.2.5 Calculation of Instability of Agricultural Production
2001 2002 2003 2004 2005 2006 2007 2008 2009 2010
Agricultural
Production Index 118 74,6 78,5 97 80 103 48,3 198 87,9 111,9
Ln (API) 4,77 4,31 4,36 4,57 4,38 4,63 3,88 5,29 4,48 4,72
Source: Exports statistics – Statistical Yearbooks of the PMR 2006 and 2011, import
unit values – IMF International Financial Statistics
t Ln (Yt) Ln (Yt)
estimated Deviation
1 4,770685 4,4265 0,344184624
2 4,312141 4,4286 -0,11645949
3 4,363099 4,4307 -0,06760138
4 4,574711 4,4328 0,141910979
5 4,382027 4,4349 -0,05287337
6 4,634729 4,4370 0,197728988
7 3,877432 4,4391 -0,56166844
8 5,288267 4,4412 0,847067031
9 4,4762 4,4433 0,032899805
10 4,717606 4,4454 0,272205615
Standard Error 0,35
Maxmin 178,92

Table A.2.6 Retrospective EVI Calculated for Transnistria, by Components, 2001-2010
2001 2002 2003 2004 2005 2006 2007 2008 2009 2010
EVI 47,63 48,24 48,23 48,81 48,30 48,33 48,03 48,53 48,22 48,77
EXPOSURE INDEX 45,07 46,29 46,27 47,44 46,41 46,46 45,88 46,88 46,25 47,36
Population (Smallness) 86,76 86,77 86,79 86,90 86,92 86,93 86,94 86,95 86,96 86,97
Remoteness (Location Index) 6,25 6,25 6,25 6,25 6,25 6,25 6,25 6,25 6,25 6,25
Structural Index 30,92 35,63 41,13 60,84 60,26 61,09 55,48 54,81 30,26 25,58
-Agricultural Production share in GDP 0,17 5,00 4,83 9,17 5,00 5,17 2,83 6,83 4,50 9,00
-Merchandise export consentration 30,75 30,63 36,30 51,68 55,26 55,92 52,65 47,98 25,76 16,58
SHOCK INDEX 50,19 50,19 50,19 50,19 50,19 50,19 50,19 50,19 50,19 50,19
Natural Shock Index 50,00 50,00 50,00 50,00 50,00 50,00 50,00 50,00 50,00 50,00
-Homelessness 0,00 0,00 0,00 0,00 0,00 0,00 0,00 0,00 0,00 0,00
-Instability of Agricultural production 100,00 100,00 100,00 100,00 100,00 100,00 100,00 100,00 100,00 100,00
Trade Shock Index 50,38 50,38 50,38 50,38 50,38 50,38 50,38 50,38 50,38 50,38

Appendix 3. Components of the EVI Index of some SIDS
and LDCs
Table A.3.1 Small Island Developing States and Least Developed Countries: Components of the EVI index, 2009
EVI
Expo-
sure
index
Popu-
lation
Remote
-ness
Structu
-ral
index
Export
concen-
tration
Shares,
agricult
ure&fis
heries
Shock
index
Natural
Shock
index
Home-
less
Instabi-
lity of
Agr.
Instabi-
lity of
Exports
Afghanistan 39,5 33,8 19,5 51,8 44,7 23,8 65,6 45,2 51,2 63,8 38,6 39,2
Bangladesh 23,2 17,4 0,0 36,2 33,4 35,3 31,4 29,0 44,6 76,3 13,0 13,4
Burundi 56,8 54,1 37,3 80,5 61,3 59,6 63,1 59,5 44,0 68,0 20,0 75,0
Cambodia 55,6 37,1 29,5 47,1 42,2 31,2 53,2 74,2 50,3 76,8 23,8 98,1
Comoros 56,9 67,6 73,1 62,2 62,1 44,6 79,5 46,2 21,8 43,2 0,5 70,6
Haiti 52,2 44,6 35,8 44,5 62,3 73,6 51,0 59,8 39,7 73,3 6,1 79,9
India 17,5 12,0 0,0 30,3 17,7 5,0 30,3 23,1 37,3 68,0 6,7 8,9
Madagascar 37,2 35,6 24,6 65,5 27,6 11,8 43,5 38,8 43,9 82,3 5,4 33,6
Mongolia 52,7 52,4 55,8 58,9 39,1 39,6 38,6 53,1 34,8 14,3 55,3 71,3
Pakistan 22,3 12,1 0,0 24,1 24,4 15,3 33,6 32,4 47,7 87,7 7,7 17,1
Papua New Guinea 44,6 52,7 42,1 80,1 46,5 34,4 58,7 36,4 41,7 82,1 1,2 31,2
Rwanda 55,0 51,4 35,4 77,7 57,2 45,3 69,1 58,7 62,0 43,2 80,8 55,3
Solomon Islands 58,0 78,5 81,3 75,2 76,4 78,6 74,2 37,4 37,8 55,9 19,6 37,1
Somalia 62,6 47,1 37,1 44,6 69,7 39,4 100,0 78,1 56,3 88,6 24,0 100,0
Timor-Leste 56,7 56,8 68,1 58,7 32,4 18,8 46,0 56,6 33,7 49,0 18,4 79,4
Togo 42,8 42,8 41,4 42,9 45,6 22,3 68,9 42,7 49,5 74,2 24,7 36,0
Zimbabwe 64,3 45,7 30,8 100,0 21,0 14,5 27,5 83,0 66,0 61,5 70,4 100,0
Source: UNDESA 2009 (5-6)

Table A.3.2 Components of the EVI index Calculated for Transnistria Compared with the EVI Scores of Some SIDS, 2006
EVI
Expo-
sure
index
Popu-
lation
Remote
-ness
Structu
-ral
index
Export
concen-
tration
Shares,
agricult
ure&fis
heries
Shock
index
Natural
Shock
index
Home-
less
Instabi-
lity of
Agr.
Instabi-
lity of
Exports
Transnistria
48,33
46,46
86,93
6,25
61,09
55,92
5,17
50,19
50,00
0,00
100,00
50,38
SIDS, average
56,17
67,07
80,93
71,52
34,90
44,11
25,70
45,28
46,28
54,58
37,99
44,27
Cape Verde 57,92 62,54 81,28 59,96 27,65 44,98 10,33 53,30 73,97 69,79 78,16 32,62
Comoros 63,60 76,74 74,30 78,36 80,00 91,88 68,11 50,46 24,08 40,76 7,39 76,84
Guinea-Bissau 66,18 70,54 63,73 58,99 95,70 91,40 100,00 61,83 29,35 43,79 14,92 94,30
Haiti 56,81 44,00 37,86 66,55 33,73 20,34 47,11 69,63 39,59 72,56 6,63 99,66
Kiribati 83,65 81,09 100,00 78,00 46,36 63,91 28,82 86,20 72,41 85,10 59,72 100,00
Maldives 51,98 72,53 87,91 86,03 28,27 43,74 12,80 31,43 54,70 95,87 13,54 8,16
Papua New Guinea 44,15 50,53 43,56 75,99 39,02 32,20 45,83 37,77 40,75 80,97 0,53 34,79
Samoa 64,65 80,83 96,78 89,33 40,46 59,09 21,82 48,47 65,09 97,64 32,54 31,85
Sao Tome and
Principe 58,15 81,63 99,35 65,06 62,77 97,27 28,27 34,67 14,94 0,00 29,87 54,40
Solomon Islands 56,89 76,14 82,18 82,94 57,26 39,65 74,86 37,64 50,10 55,97 44,23 25,18
Timor-Leste 60,84 56,04 71,66 46,08 34,75 18,70 50,80 65,65 31,30 44,31 18,29 100,00
Tuvalu 91,85 87,17 100,00 82,94 65,72 100,00 31,44 96,53 93,06 86,12 100,00 100,00
Vanuatu, Republic
of 64,25 77,02 94,73 82,94 35,69 35,75 35,62 51,48 62,44 85,40 39,49 40,51
Source: Guillaumont (2008:29-30) (except the EVI scores for Transnistria calculated in the thesis)
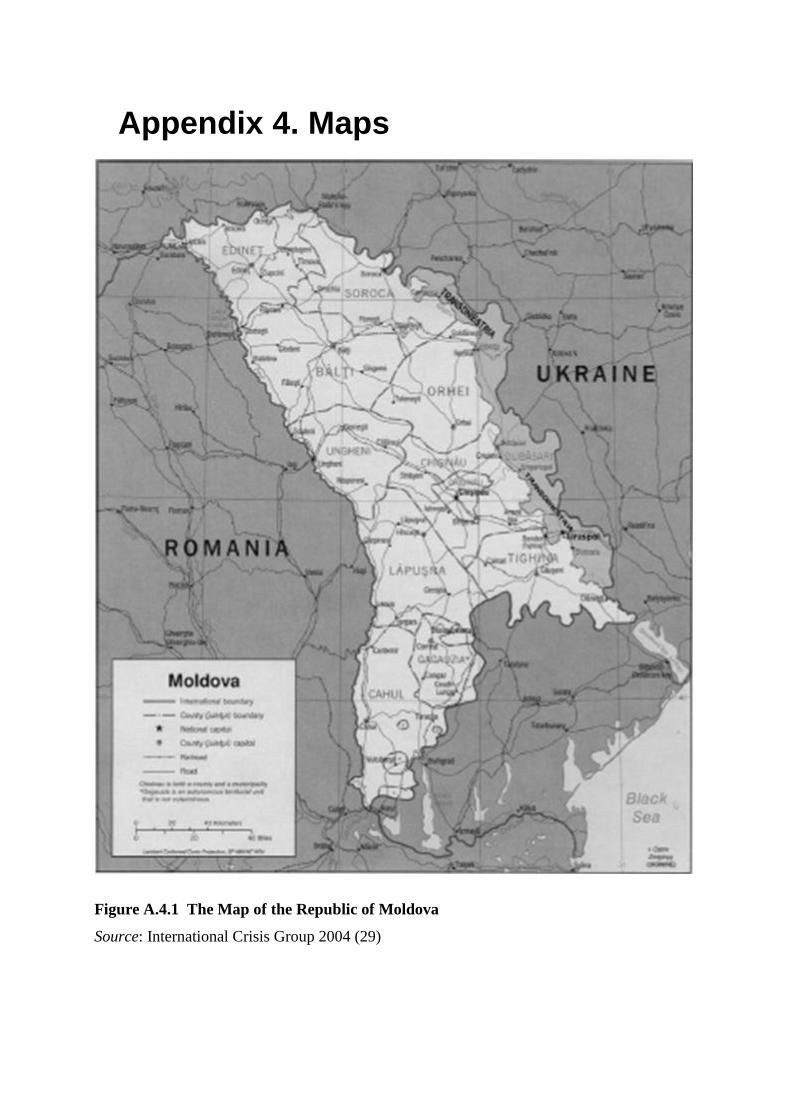
Appendix 4. Maps
Figure A.4.1 The Map of the Republic of Moldova
Source: International Crisis Group 2004 (29)
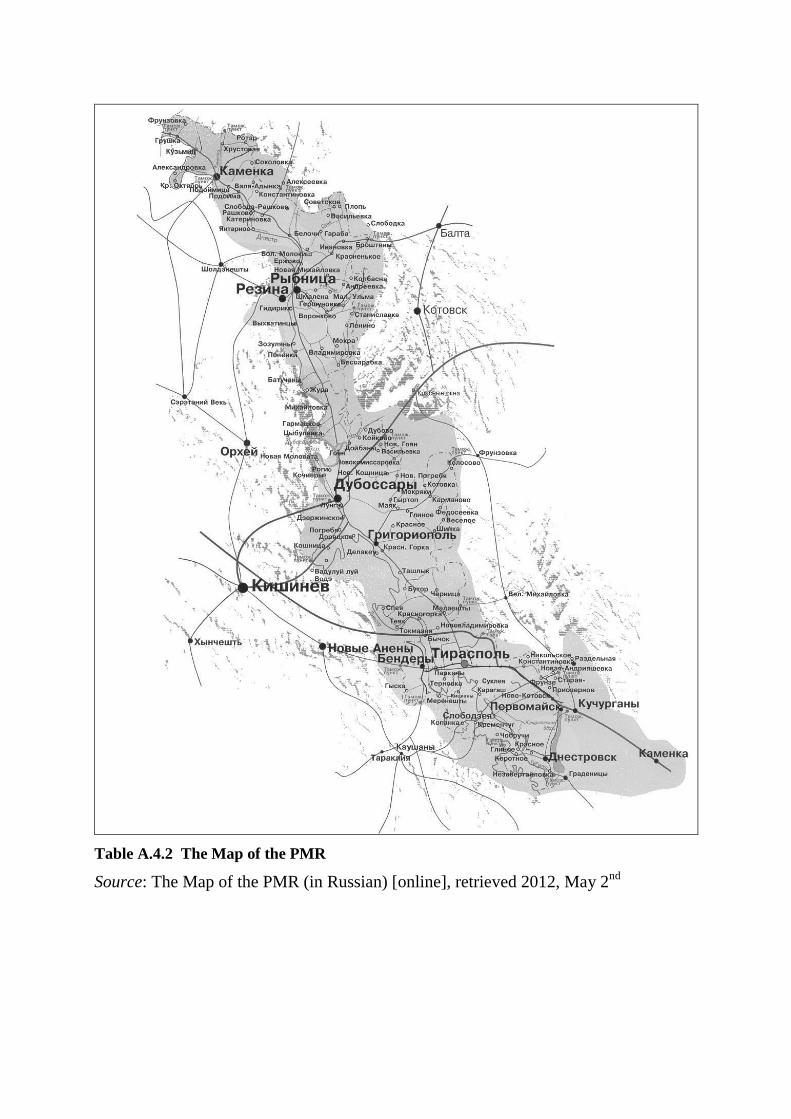
Table A.4.2 The Map of the PMR
Source: The Map of the PMR (in Russian) [online], retrieved 2012, May 2nd
Appendix 5. List of Experts
Interviewed
EU/USA:
Rosario De Blasio, Operational Quality Control Coordinator and Technical Advisor to
the Head of Mission, EUBAM Mission to Ukraine and Moldova, Odesa, Ukraine
Marcin Kosienkowsky, Assistant Professor at the International Relations Department,
Institute of Political Science, Faculty of Social Sciences, The John Paul II Catholic
University of Lublin, Poland
Nicu Popescu, Senior Research Fellow, European Council on Foreign Relations,
London, UK
Vlad Spanu, President of Moldova Foundation, Washington DC, USA
Moldova:
Leonid Litra, Deputy Director, Institute for Development and Social Initiatives
“Viitorul”, Chisinau, Moldova
Eugen Revenco, Head of the Foreign Policy Association, Chisinau, Moldova
OSSE:
Per Enerud, Mission Spokesman, OSCE Mission to Moldova, Chisinau, Moldova
Russian Federation:
Alexander Karavaev, Deputy Director of the Post-Soviet Research Center, Moscow
State University, Moscow, Russian Federation
Sergey Markedonov, Head of the International Department, Institute of the Political
and Military Analysis, Moscow, Russian Federation
Transnistria/Moldova:
Ludmila Safronova, Chief Lecturer, Department for Finance and Credit, Tiraspol
Taras Shevchenko State University, Tiraspol, Transnistria/Moldova
Artem Tchornyy, Secretary of the Ukrainian Community in Norway, Oslo, Norway
Ukraine:
Kornelia Luskanova, Councellor, Ministry of Foreign Affairs of Ukraine
Vitaliy Kulyk, Director of Center of Civil Society Problems Research, Kyiv, Ukraine