economic update: financial modeling workshop · economic update: financial modeling workshop ....
TRANSCRIPT

Economic Update: Financial Modeling Workshop
Richard Waycott
President & CEO Almond Board of California

THANK YOU

Workshop Agenda
• Dr. Karen Klonsky – Grower Costs • John Talbot – Driving Demand means Better
Grower Returns • Bill Harp – Industry Profitability for a
Sustainable Future

Cost of Production Increases in Almond Production
Dr. Karen Klonsky
Specialist in Cooperative Extension Dept. of Agricultural and Resource Economics
University of California - Davis

CA Almond Production Costs and US Agriculture Cost Trends
Various cost and return studies from UCCE http://coststudies.ucdavis.edu National Agricultural Statistic Service, USDA. Agricultural Prices CA Chapter of the American Society of Farm Managers and Rural Appraisers. Trends in Land and Lease Values

Market Outlook
“The trend of almond production in California has been upward due to increased plantings. Imports of almonds and competition of other nuts are factors which influence CA almond prices. Present acreage appears to be sufficient to fulfill market needs. Therefore, caution should be exercised in making new plantings.”
Guess the year?

Market Outlook 1950
“The trend of almond production in California has been upward due to increased plantings. Imports of almonds and competition of other nuts are factors which influence CA almond prices. Present acreage appears to be sufficient to fulfill market needs. Therefore, caution should be exercised in making new plantings.”

Historic Cost and Return Studies San Joaquin Valley North
1938 1950 Yield range (lbs./acre) 200 – 2,000 1,100 – 2,000 Expected yield 1,400 1,500 Labor rate ($/hour) $.30 $.85 Labor cost ($/acre) $54 $139 Water $4.50 (18 inches) $4.00 (30 inches) Materials $23 $34 Cash overhead $9 $21 Depreciation and interest @5% $39 $54 Total cost per acre $127 $247 Land value per acre $200 $350 Trees per acre value (30 yr. life) $300 $150

Costs per Acre to Produce Almonds
San Joaquin Valley 2013- $4,195
Non-Cash Overhead
7%
Land 17%
Trees 9%
Cash Overhead
10%
Harvest 8% Labor
9%
Custom 5%
Fuel 3% Water 3%
Materials 21%
Pollination 8%
Other 35%

Cost per Acre to Produce Almonds
0
500
1000
1500
2000
2500
3000
3500
4000
4500
1980 1986 1992 1998 2002 2006 2011 2013
CustomPollinationMaterialsFuelLaborHarvestWaterCash OverheadTreesLandNon-Cash Overhead
2,164 2,091 2,189
2,894 2,865
3,717 3,975
4,195

Pollination Per Acre
24 60 60
100 113
250 280
340
0
50
100
150
200
250
300
350
400
1980 1986 1992 1998 2002 2006 2011 2013
$ pe
r Acr
e

Quantity of Hives/Cost
YEAR # Of Hives COST PER HIVE
TOTAL COST
2013 2 170 340 2011 2 140 280 2006 2 125 250 2002 2.5 45.2 113 1998 2.5 40 100 1992 2 30 60 1989 2 25 50 1986 2 25 50 1980 2 12 24

Fertilizer and Pesticide Cost Per Acre
304 396
292
508 432
546
673
867
0100200300400500600700800900
1000
1980 1986 1992 1998 2002 2006 2011 2013
$ pe
r Acr
e

Water Cost Per Acre
22
75
149
92 101
205
151 151
0
50
100
150
200
250
1980 1986 1992 1998 2002 2006 2011 2013
$ pe
r Acr
e

Fuel Cost per Acre
79
55 55 53 56
78
105
142
0
20
40
60
80
100
120
140
160
1980 1986 1992 1998 2002 2006 2011 2013
$ pe
r Acr
e

Labor Cost per Acre
106
293
242
333 292
333
386 388
0
50
100
150
200
250
300
350
400
450
1980 1986 1992 1998 2002 2006 2011 2013
$ pe
r Acr
e
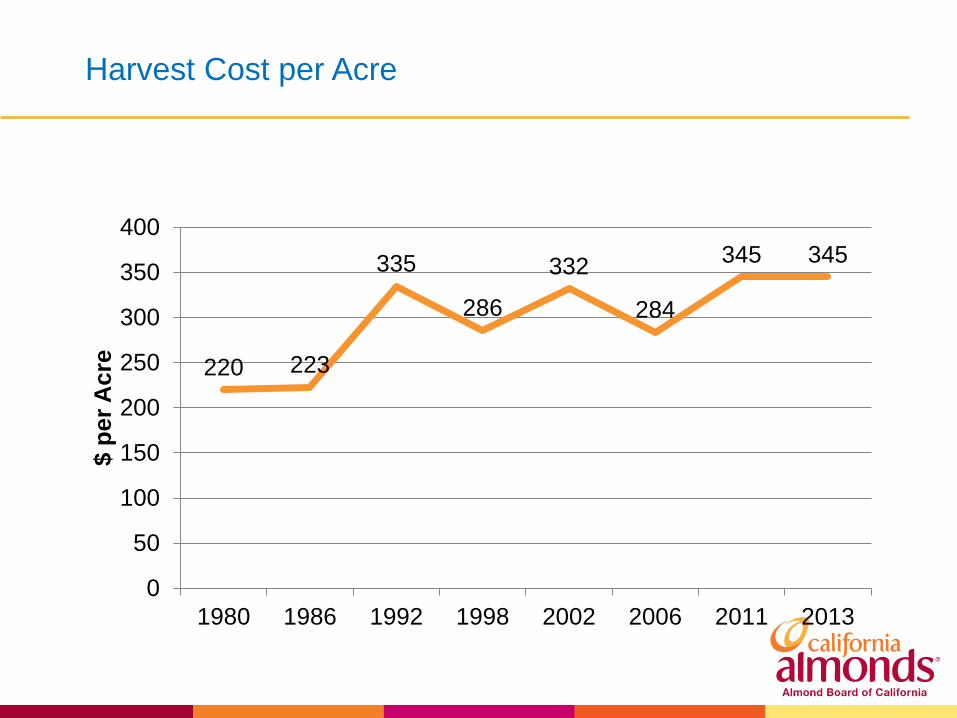
Harvest Cost per Acre
220 223
335
286
332
284
345 345
0
50
100
150
200
250
300
350
400
1980 1986 1992 1998 2002 2006 2011 2013
$ pe
r Acr
e

Almond Price per Pound
2.48 2.08
1.56 1.41
0.86 0.97 0.91 1.11
1.57
2.21
2.81
2.06 1.75
1.45 1.65 1.75
1.99
2.58
0
0.5
1
1.5
2
2.5
3Price per Pound
Source: NASS 2012 California Acreage Report

Revenue & Cost per Acre
0
1000
2000
3000
4000
5000
6000
7000
1980 1986 1992 1998 2002 2006 2011 2013
Operating CostTotal CostRevenue

Price & Cost per Pound
$0.00
$0.50
$1.00
$1.50
$2.00
$2.50
$3.00
$3.50
1980 1986 1992 1998 2002 2006 2011 2013
pricetotal costoperating cost

Prices Paid by US Farmers
(various time periods)

Prime Interest Rate
0%
2%
4%
6%
8%
10%
12%
14%
16%
18%
20%
1965 1970 1975 1980 1985 1990 1995 2000 2005 2010
Source: Federal Reserve Board

Diesel Prices CA and US
050
100150200250300350400450500
Jan-96
Jan-97
Jan-98
Jan-99
Jan-00
Jan-01
Jan-02
Jan-03
Jan-04
Jan-05
Jan-06
Jan-07
Jan-08
Jan-09
Jan-10
Jan-11
Jan-12
Jan-13
Cen
ts p
er g
allo
n California
US
Source: US Energy Information Administration. www.eia.gov

Indexes of prices paid by US farmers 1990-1992 = 100
100
150
200
250
300
350
400
1994 1997 2000 2003 2006 2009 2012
Pesticides
Fuels Machinery
Fertilizer
Source: http://usda.mannlib.cornell.edu/MannUsda/viewDocumentInfo.do?documentID=1002
*

Indexes of prices paid by US farmers 1990-1992 = 100
100
125
150
175
200
225
250
275
300
94 95 96 97 98 99 '00 '01 '02 '03 04 05 06 07 08 09 10 11 12 13
Farm machinery
Autos and trucks
Building materials
Source: National Agricultural Statistical Service, USDA

Indexes of prices paid by US farmers 1990-1992 = 100
100
125
150
175
200
225
250
275
300
Farm labor wages Family living expenses
Pesticides
Source: NASS Agricultural Prices http://www.nass.usda.gov/publications Source: National Agricultural Statistical Service, USDA

Workman’s Compensation RateFruit Orchards
1993 1995 1997 1999 2001 2003 2005 2008 2010 2012
18.53
15.04 14.9316.36 15.8514.70
15.18
18.3917.08
20.23
27.48
18.75 19.68
15.6214.47
17.46
20.43
18.0519.55
$/Per $100 in Payroll
Source: State Fund Base Rate January 1

Almond Orchard Values- Merced
0
5,000
10,000
15,000
20,000
25,000
1991 1994 1997 2000 2003 2006 2009 2012
$ pe
r Acr
e
Source: “Trends in Agricultural Land & Lease Values” CA Chapter, American Society of Farm Managers & Rural Appraisers

Almond Orchard Values- Stanislaus MID & TID
0
5,000
10,000
15,000
20,000
25,000
30,000
35,000
1991 1994 1997 2000 2003 2006 2009 2012
$ pe
r Acr
e
Source: “Trends in Agricultural Land & Lease Values” CA Chapter, American Society of Farm Managers & Rural Appraisers

Costs per Acre to Produce Almonds
San Joaquin Valley 2013- $4,540
Non-Cash Overhead
6%
Land 16%
Trees 8%
Cash Overhead
9%
Harvest 8%
Labor 9%
Custom 12% Fuel
3% Water 3%
Materials 19%
Pollination 7%
Other 32%

ADVERTISEMENT
Cost and return studies for California commodities are available for downloading at :
http://coststudies.ucdavis.edu

Economic Update: Financial Modeling
Workshop John Talbot Vice President,
Global Market Development (ABC)
Factors That Influence Demand
• Historical Perspective
• Measuring Success
• Changing Market Dynamics

How Do We Measure Demand?
• Demand is not simply a function of shipments, or even consumption. Demand is a consumer's willingness and desire to pay a price for a specific product
• For our purposes, the best way to look at demand is as a function of selling a certain volume at a certain price
• Therefore:
Demand = Shipments X Farm Price = Grower Revenue
Note: This is more accurately a reflection of trade demand

$0.00
$1.00
$2.00
$3.00
$4.00
$5.00
$6.00
0
1000
2000
3000
4000
5000
6000
Shipments
Revenue
Farm Price
Ship
men
ts (M
lbs)
R
even
ue* (
$M)
Farm
Pric
e
• With awareness of health benefits, almond use as a snack grows • As a snack, almonds have greater upside growth potential in volume and price
With Advent of Health Positioning Demand Growth Accelerates

$0.00
$1.00
$2.00
$3.00
$4.00
$5.00
$6.00
0
1000
2000
3000
4000
5000
6000
Shipments
Revenue
Farm Price
Ship
men
ts (M
lbs)
R
even
ue* (
$M)
Farm
Pric
e
• Demand pulls us through short crop correction cycles • Past 10 years are evidence of strong demand growth
Rising Price Indicates Strong Demand

1. Equilibrium growth where supply, demand and pricing all gradually increase
2. One or more years of short crop 3. Market reacts (sometimes over-
reacts) and price goes up 4. Profit goes up 5. Growers invest in additional
planting 6. As crop rebounds price begins
to decline 7. Supply increases further as new
plantings mature 8. Ongoing demand growth
enables price to begin rising
Equilibrium Growth
Short Crop
Price Increase
Profit Rises
Additional Planting
Price Decline
Supply Increase
Demand Drives
Price Up
Demand Growth Fuels the Cycle
1.
The Short Crop Correction Cycle

$0.00
$1.00
$2.00
$3.00
$4.00
$5.00
$6.00
0
1000
2000
3000
4000
5000
6000
Shipments
Revenue
Farm Price
Ship
men
ts (M
lbs)
R
even
ue* (
$M)
Farm
Pric
e
• Demand pulls us through short crop correction cycles • Past 10 years are evidence of strong demand growth
Rising Price + Increased Supply = Optimal Growth

$0.00
$1.00
$2.00
$3.00
$4.00
$5.00
$6.00
0
1000
2000
3000
4000
5000
6000
Shipments
Revenue
Farm Price
Ship
men
ts (M
lbs)
G
row
er R
even
ue* (
$M)
Farm
Pric
e
* Grower Revenue = Shipments X Farm Price
• Increased supply + rising price = strong demand = record grower revenue
Grower Revenue Quadruples in Last 10 Years

Measuring Success
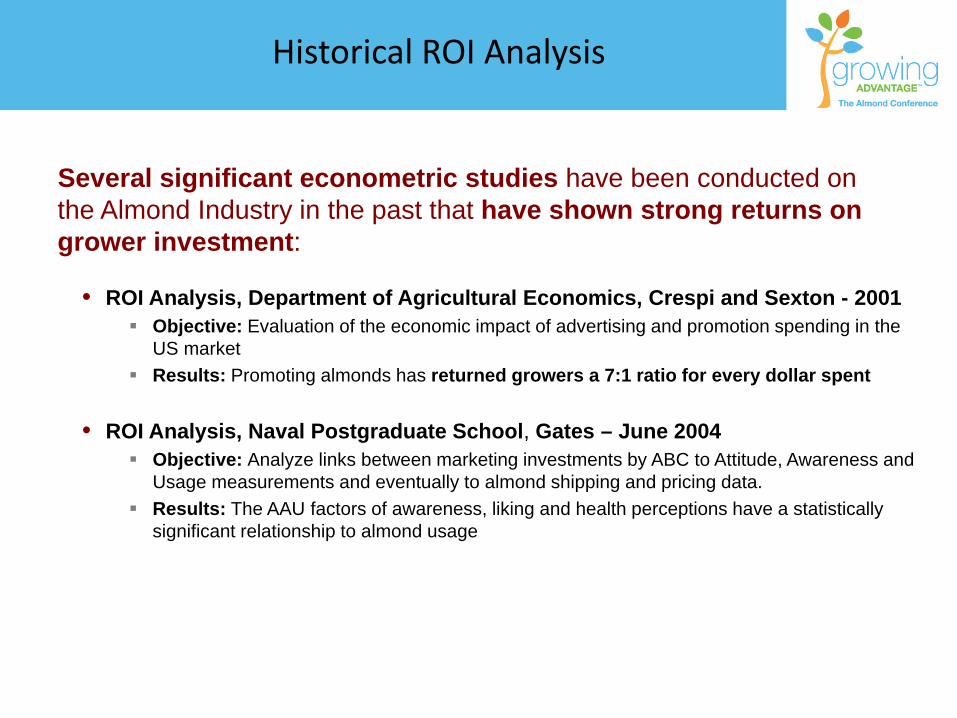
Several significant econometric studies have been conducted on the Almond Industry in the past that have shown strong returns on grower investment:
• ROI Analysis, Department of Agricultural Economics, Crespi and Sexton - 2001
Objective: Evaluation of the economic impact of advertising and promotion spending in the US market
Results: Promoting almonds has returned growers a 7:1 ratio for every dollar spent
• ROI Analysis, Naval Postgraduate School, Gates – June 2004 Objective: Analyze links between marketing investments by ABC to Attitude, Awareness and
Usage measurements and eventually to almond shipping and pricing data. Results: The AAU factors of awareness, liking and health perceptions have a statistically
significant relationship to almond usage
Historical ROI Analysis

100
120
140
160
180
200
220
240
260
280
300
2001 2002 2003 2004 2005 2006 2007 2008 2009 2010 2011 2012 2013
ABC Marketing $ Per Capita Consumption Shipments AwarenessAlmond Liking Health Perceptions Purchases Per Month
Index
US Marketing Metrics

100
120
140
160
180
200
220
240
260
280
300
2001 2002 2003 2004 2005 2006 2007 2008 2009 2010 2011 2012 2013
ABC Marketing $ Per Capita Consumption Shipments AwarenessAlmond Liking Health Perceptions Purchases Per Month
Index
Baseline ABC Spending $8M
US Marketing Metrics

100
120
140
160
180
200
220
240
260
280
300
2001 2002 2003 2004 2005 2006 2007 2008 2009 2010 2011 2012 2013
ABC Marketing $ Per Capita Consumption Shipments AwarenessAlmond Liking Health Perceptions Purchases Per Month
Index
US Marketing Metrics

100
120
140
160
180
200
220
240
260
280
300
2001 2002 2003 2004 2005 2006 2007 2008 2009 2010 2011 2012 2013
ABC Marketing $ Per Capita Consumption Shipments AwarenessAlmond Liking Health Perceptions Purchases Per Month
Index
US Marketing Metrics

100
120
140
160
180
200
220
240
260
280
300
2001 2002 2003 2004 2005 2006 2007 2008 2009 2010 2011 2012 2013
ABC Marketing $ Per Capita Consumption Shipments AwarenessAlmond Liking Health Perceptions Purchases Per Month
Index
US Marketing Metrics

100
120
140
160
180
200
220
240
260
280
300
2001 2002 2003 2004 2005 2006 2007 2008 2009 2010 2011 2012 2013
ABC Marketing $ Per Capita Consumption Shipments AwarenessAlmond Liking Health Perceptions Purchases Per Month
Index
US Marketing Metrics

100
120
140
160
180
200
220
240
260
280
300
2001 2002 2003 2004 2005 2006 2007 2008 2009 2010 2011 2012 2013
ABC Marketing $ Per Capita Consumption Shipments AwarenessAlmond Liking Health Perceptions Purchases Per Month
Index
US Marketing Metrics

100
120
140
160
180
200
220
240
260
280
300
2001 2002 2003 2004 2005 2006 2007 2008 2009 2010 2011 2012 2013
ABC Marketing $ Per Capita Consumption Shipments AwarenessAlmond Liking Health Perceptions Purchases Per Month
Index
US Marketing Metrics

North America EU3 China India S. Korea
Opportunity Assessment X X X X X
Positioning/Segmentation analysis X X X X X
Shipment and trans-shipment analysis X X X X X
Per capita consumption X X X X X
Attitudes, Awareness and Usage X X X X X
Advertising Effectiveness X X X X n/a
Retail Sales Volume and Value X X Unavailable Unavailable In Consideration
New CPG Product Introductions X X X X X
US menu trends X n/a n/a n/a n/a
ABC uses a variety of analytical tools to assess opportunities and barriers, measure program success, market performance, and consumer demand
ABC Uses Rigorous Program Analysis Approach

Future Growth • 80% expected to come from US, China and India • 70% expected to be in Snacking category
588
208
125 121
46 45 44 26 24 0
100
200
300
400
500
600
700
USA China India Germany Korea Russia Canada UK France
Established Markets Emerging Markets +7.1% CAGR* +17.0% CAGR* M
illio
ns P
ound
s
* 2010 to 2013 compound average growth
Size/Growth of Target Markets

New Market Dynamics – What is Changing?

With snacking comes tremendous competition as consumers have more choices in a broader competitive set
Increased Competition

Lots of Interest in Healthy Snacking

Global Product Launches with Healthy Positioning
0
5000
10000
15000
20000
25000
30000
2007 2008 2009 2010 2011 2012 2013
Protein Snacks
Fruit Snacks
Veggie Snacks
Yogurt Snacks
Gluten Free Snacks
Products With Healthy Positioning on the Rise

The healthy snacking category is highly competitive with heavy advertising spending by large CPG brands
Notes: Almond Board of California reported as Nielsen reported estimated spending for 2012. Source: Nielsen AdViews 2012.
AdViews estimated advertising spend by brand/product
Total 2012 $USD
Chobani Yogurt and Chobani champions $44 million
Sun Chips $20 million
Chex Mix Snacks $15 million
Kashi TLC granola bars $27 million
Nature Valley bars – oat and dark chocolate $20 million
Aggressive Spending Targeted at Our Consumers

The humble chickpea is having a heyday as demand for hummus sky rockets
• Background: Long a staple of Middle Eastern cuisine, hummus is earning a growing following among Americans seeking more-healthful snacks. The chickpea dip is low in fat and high in protein.
• Investment: Sabra who has increased revenue from $16 million to $800 million in just six years invests heavily in advertising, PR and innovation.
• Results: IRI Sales show "refrigerated flavored spreads"—a segment dominated by hummus—totaled $530 million at U.S. food retailers last year, up 11% from a year earlier and a 25% jump over 2010
• Return to grower: Growing demand for hummus has pushed up prices for chickpeas, spurring farmers in the heart of tobacco country to increase production. The average price that farmers received for chickpeas was 35 cents a pound last year, a 40% increase in the last 5 years.
Case Study: Hummus

Established Markets
Emerging Markets
Almonds are developing a strong global presence in an increasingly dynamic global marketplace with extensive cultural, trade and regulatory differences
NORTH AMERICA Canada U.S.
EUROPE UK, France, Germany
ASIA China, India, S. Korea
SOUTH AMERICA Brazil
Exploratory Markets
Global Marketplace

• ABC’s health positioning and consumer marketing efforts have had a significant impact on growing almond demand
• Not every detail of every market can be measured but overall there is a positive ROI for our marketing investment
• We have a model and approach to growing demand that is working
• Our market is becoming more competitive and the challenges more complex
HOWEVER,
Conclusions – The Approach is Working

Economic Update: Economics of
Growing Almonds
Bill Harp Almond Grower

CYs 2010 – 2012: Grower Return all Regions by Bill Harp, an Almond Grower
CY 2010 CY 2011 CY 2012 Average
Yield Per Acre 2,200 2,658 2,385 2,414 Bearing Acres 740,000 760,000 790,000 763,333 Total Reported Production 1,628,192,255 2,020,387,592 1,884,028,757 1,844,202,868
Total Paid Weight: 1,610,062,409 1,979,975,964 1,847,507,894 1,812,515,422
Total Paid Weight/Acre: 2,176 2,605 2,339 2,373
Grower Price/Lb: $1.79 $1.99 $2.58 $2.12
Paid Grower Revenue/Acre: $3,895 $5,184 $6,035 $5,038
Growing Costs/Acre per UC Davis Studies: $2,543 $2,675 $3,021 $2,746
Net Estimated Grower Cost: $2,543 $2,675 $3,021 $2,746
Net Grower Return/Acre: $1,352 $2,509 $3,014 $2,291
Grower Return for Entire State
Non-Cash Overhead
6%
Land 16%
Trees 8%
Cash Overhead 9%
Harvest 8% Labor
9% Fuel 3%
Materials 22%
Pollination 7%
Custom 12%
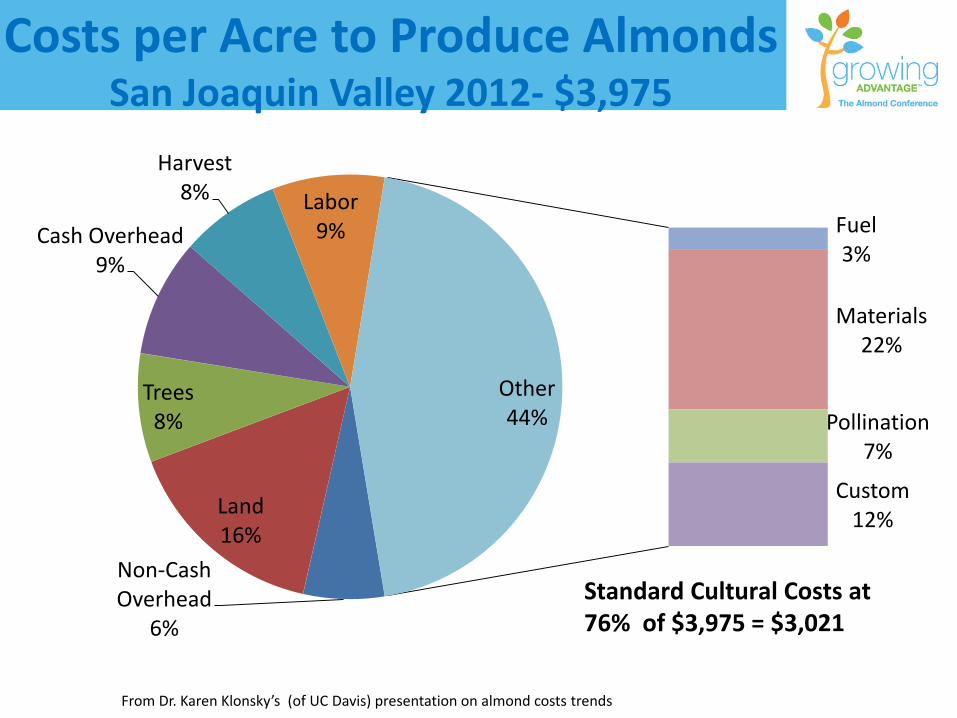
Other 44%
Standard Cultural Costs at 76% of $3,975 = $3,021
Costs per Acre to Produce Almonds San Joaquin Valley 2012- $3,975
From Dr. Karen Klonsky’s (of UC Davis) presentation on almond costs trends

0
500
1000
1500
2000
2500
3000
3500
4000
4500
5000
1980 1986 1992 1998 2002 2006 2011 2013
CustomPollinationMaterialsFuelLaborHarvestCash OverheadTreesLandNon-Cash Overhead
2,164 2,091
2,189
2,894 2,865
3,717
3,975
4,540
Cost per Acre to Produce Almonds
From Dr. Karen Klonsky’s (of UC Davis) presentation on almond costs trends

Almond Grower ROA Definition
• The yearly return of one bearing acre divided by the market value of one bearing acre
Grower Return $
Market Value $
Grower Return = Revenue - Cost
$2,291
$23,000 9.96%
Average CY 2010-2012 ROA

Almond Grower ROA Target Range
• Almond Grower ROA Target Range1
– 10-20% Yearly Return on Assets (excluding asset appreciation) – Only 5-10% ROA after taxes, so reasonable – Supported by the expectations of other growers’ knowledge of
the risks associated with Almonds Orchards based on at least a 20-25 year life
1. Grower’s Perspective: As an independent California Almond Grower and Investor, my opinion of an acceptable (“fair and reasonable”) Almond Grower ROA is as follows.

Projection of Bearing Acreage Increase based Known & Estimated Plantings and Removals
2011 2012 2013 2014 2015 2016 2017Actual
Forecasted Bearing Acres 760,000 780,000 794,797 803,733 844,733 885,733 926,733
Acres Planted 3 years prior: (as originally Reported) 22,832 18,623 14,960 35,000 35,000 35,000
Adj. Planted Acreage: 60% more than Orig. Reported 36,696 29,797 23,936 56,000 56,000 56,000
Expected Removals (average of 2004-2011) 16,696 15,000 15,000 15,000 15,000 15,000
Net Increase in Bearing Acres (estimated) vs prior year: 20,000 14,797 8,936 41,000 41,000 41,000
Acres Planted and are Standing as of 2011 that are more than 20 years old (1990 or earlier planting): 110,337 Acres Planted and are Standing as of 2011 that are more than 17 to 20 years old (1991-1993 plantings): 38,584
Average Net Increase in Bearing Acres 2004-2012: 26,250 acresLargest Net Increase in Bearing Acres from one crop year to the next: 40,000 acres (In 2008 & 2009 Crop Years).
Projected Bearing Acres 2012 - 2017
Estimated PlantingsAlready Reported Plantings

810,000
831,464
849,890
871,905
740,000
760,000
780,000
800,000
820,000
840,000
860,000
880,000
900,000
920,000
FY 13/14 FY14/15 FY 15/16 FY 16/17
BEARING ACREAGE PROJECTIONS
Opinion IOpinion IIOpinion IIIABC PROJECTIONAVG PROJECTION
Compared to 926,733
Comparison to previous Projections
Almond Bearing Acreage Projections CY 2013/2014 – 2016/2017 - Almond Board Staff

California Almond Demand History
Period whenTarget ROA
3 Year 5 Year 10 Year 15 Year Achieved
'09-'11 '07-'11 '02 - '11 '97 - '11 '04 - '07
Actual Demand GrowthDomestic 10.2% 8.4% 9.0% 10.0% 4.8%Export 12.1% 14.7% 9.5% 9.2% 8.2%
Total 11.5% 12.7% 9.3% 9.3% 7.0%
Recent Crop Year Demand Growth Averages
Actual 2012 Crop Year Shipment Growth = -1.7% Actual 2011 Crop Year Demand Growth = 13.9%

It Appears Future Demand/Shipment Growth will be Restricted by Acreage Growth
UnrestrictedConservative
2,400 2,500 2,600 2,700 Demand Growth
Projected Demand GrowthDomestic 1.8% 2.6% 3.3% 4.1% 6.5%Export 2.5% 3.3% 4.1% 4.9% 6.3%
Total 2.0% 2.8% 3.6% 4.3% 6.3%(6.3% CAGR)
= Demand Growth Forecast based on Research & Recent History = Actual Avg. 2008 - 2010 = Deloitte 2011 Study = Assumes Industry must carry-out 13% of Total Supply each year.
2012 - 2017 Demand Growth based on Projected Bearing Acres
Acres @ Random Yield/Acre Averages 2012 - 2017Restricted Growth Based on Projected Bearing
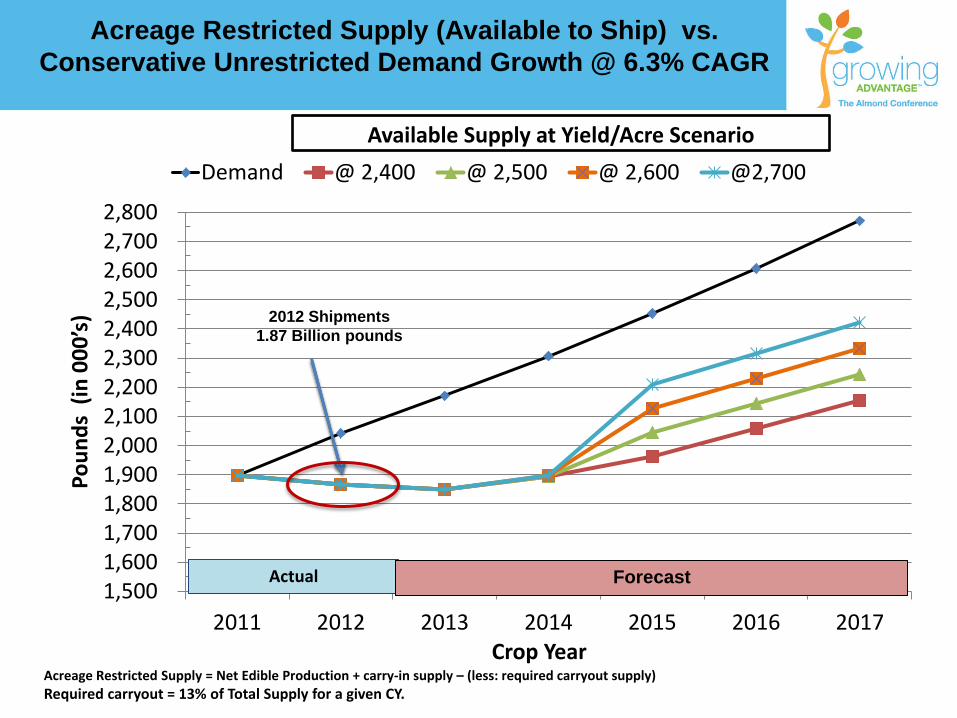
Acreage Restricted Supply (Available to Ship) vs. Conservative Unrestricted Demand Growth @ 6.3% CAGR
1,500 1,600 1,700 1,800 1,900 2,000 2,100 2,200 2,300 2,400 2,500 2,600 2,700 2,800
2011 2012 2013 2014 2015 2016 2017
Poun
ds (
in 0
00’s)
Crop Year
Demand @ 2,400 @ 2,500 @ 2,600 @2,700
Actual Forecast
Available Supply at Yield/Acre Scenario
Acreage Restricted Supply = Net Edible Production + carry-in supply – (less: required carryout supply) Required carryout = 13% of Total Supply for a given CY.
2012 Shipments 1.87 Billion pounds

1,809
1,935
1,978
2,030
2,109
2,188
2,267
1,800
1,900
2,000
2,100
2,200
2,300
2,400
2,500
FY 13/14 FY14/15 FY 15/16 FY 16/17 FY 17/18 FY 18/19 FY 19/20
PRODUCTION PROJECTIONS
Opinion I Opinion II Opinion IIIABC PROJECTION AVG PROJECTION
Almond Production Projections (millions of net pounds)
CY 2013/2014 – 2019/2020
Compared to 1,898 MM #s in previous graph

Almond Production Projections with Drought Implications (millions of net pounds) CY 2013/2014 – 2016/2017
1,813
1,925 1,925
1,987
1,700
1,800
1,900
2,000
2,100
FY 13/14 FY14/15 FY 15/16 FY 16/17
PRODUCTION PROJECTIONS W/DROUGHT IMPLICATIONS
ABC PROJECTION
AVG PROJECTION
Opinion I
Opinion II
Opinion III
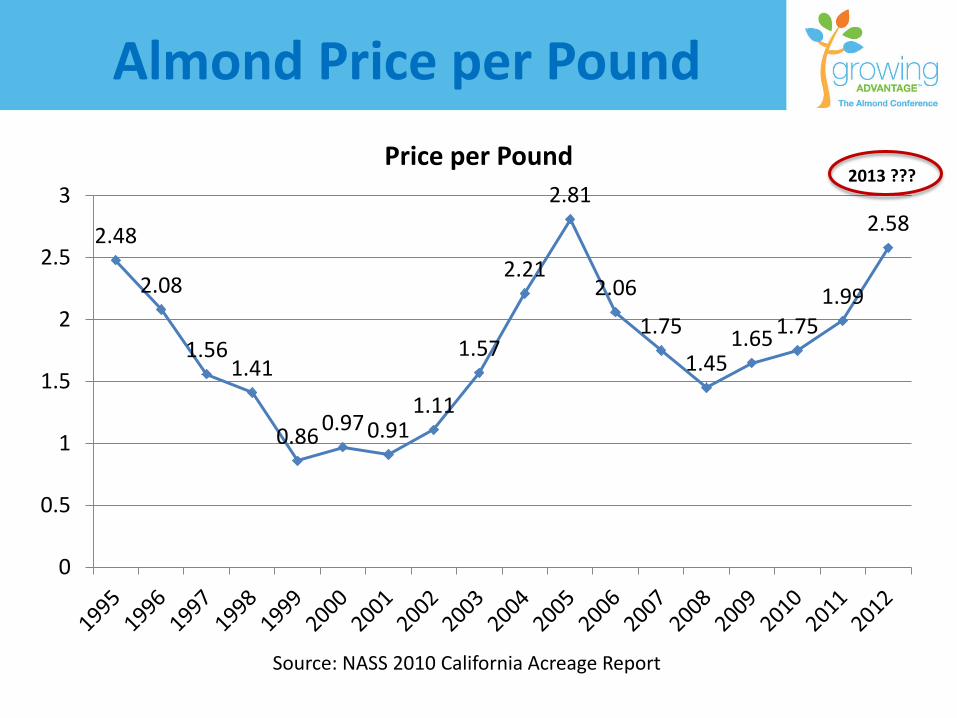
2.48
2.08
1.56 1.41
0.86 0.97 0.91 1.11
1.57
2.21
2.81
2.06
1.75 1.45
1.65 1.75 1.99
2.58
0
0.5
1
1.5
2
2.5
3Price per Pound
2013 ???
Almond Price per Pound
Source: NASS 2010 California Acreage Report

Outlook for 2013-2017 • Optimism for Grower Returns for 2013-20171:
– 10-20% Grower ROAs are possible with projected almond supply and demand fundamentals, but costs are higher and “break-even” price per pound is higher
– Growers need to stay informed, aware, and involved to support our capable
Almond Handlers and they need to know their costs
– Growers should review monthly information and reports from the Almond Board, they should understand how the Almond Board staff/marketing committee programs operate to build the type of demand that contributes to higher prices levels which are needed to achieve adequate ROA
– Growers should research and study Almond Market Dynamics and apply principles to practice on a regular basis
– Supply Management is the new “Reserve” as long as demand is strong
1. Grower’s Perspective: As an independent California Almond Grower and Investor,