economic roundup issue 4, 2012 - treasury
TRANSCRIPT

ECONOMIC ROUNDUP
THE TREASURY
ISSUE 4, 2012SPECIAL EDITION: CHINA
© Commonwealth of Australia 2012
ISBN 978-0-642-74869-0
This publication is available for your use under a Creative Commons Attribution 3.0 Australia licence, with the exception of the Commonwealth Coat of Arms, the Treasury logo, photographs, images, signatures and otherwise as stated.
The full licence terms are available from http://creativecommons.org/licenses/by/3.0/au/legalcode.
Use of Treasury material under a Creative Commons Attribution 3.0 Australia licence requires you to attribute the work (but not in any way that suggests that the Treasury endorses you or your use of the work).
Treasury material used ‘as supplied’
Provided you have not modified or transformed Treasury material in any way including, for example, by changing the Treasury text; calculating percentage changes; graphing or charting data; or deriving new statistics from published Treasury statistics — then Treasury prefers the following attribution:
Source: The Australian Government the Treasury
Derivative material
If you have modified or transformed Treasury material, or derived new material from those of the Treasury in any way, then Treasury prefers the following attribution:
Based on The Australian Government the Treasury data
Use of the Coat of Arms
The terms under which the Coat of Arms can be used are set out on the It’s an Honour website (see www.itsanhonour.gov.au)
Other Uses
Inquiries regarding this licence and any other use of this document are welcome at: Manager Communications The Treasury Langton Crescent Parkes ACT 2600 Email: [email protected]

iii
CONTENTS
REFLECTIONS ON OUR SHARED PAST AND FUTURE – DR MARTIN
PARKINSON, PSM 5
AUSTRALIA-CHINA: NOT JUST 40 YEARS – WILSON AU-YEUNG, ALISON
KEYS, AND PAUL FISCHER 7
CHINA IN A NEW PERIOD OF TRANSITION – VEASNA KONG, ADAM
MCKISSACK, AND DONG ZHANG 43
THE FAMILIAR PATTERN OF CHINESE CONSUMPTION GROWTH – PAUL
HUBBARD, SAMUEL HURLEY, AND DHRUV SHARMA 63
CHINA: PROSPECTS FOR EXPORT-DRIVEN GROWTH – BRENDAN COATES, DOUGAL HORTON, AND LACHLAN MCNAMEE 79


5
Reflections on our shared past and future By Dr Martin Parkinson, PSM
Forty years ago, on 21 December 1972, in a prescient move by then Prime Minister Gough Whitlam, Australia established diplomatic relations with the People’s Republic of China.
Back then, our bilateral trade was worth around $100 million. Fewer than 500 Chinese visitors came to Australia and there were no Chinese students studying here. Only a handful of Australians either visited or studied in China.
The establishment of diplomatic relations marked a turning point in our relationship and was followed by a raft of agreements, dialogues and a deeper relationship between the two countries. From our perspective, Australia was one of the first countries to establish a Treasury representative in China, back in 1994. Since that time, Treasury has seen the economic relationship with China expand rapidly and our ties with counterpart Chinese institutions deepen significantly.
Now, 40 years on, China is Australia’s largest trading partner, with total bilateral trade worth over $121 billion last year. China was our third largest source of short-term visitors in 2011 (over half a million) and is our biggest source of international students (almost 50,000 student visas granted in 2011-12). This flow of people is not just one-way — over 369,000 Australians, almost 2 per cent of our population, visited China last year. To put this in context, as a share of population, that’s equivalent to over 20 million Chinese visitors to Australia annually.
This is more than just a reflection of how far our bilateral relationship has come. It is also the story of China’s own development and growth.
It is a myth that you can see the Great Wall of China from the moon — no man-made structure is visible from such a distance. But what should be seen as greatness by any independent observer is China lifting over 660 million people out of poverty in only 30 years. Deng Xiaoping’s opening up and reform policies in 1978 have driven growth-enhancing reforms sufficient to make China the world’s largest exporter and second largest economy in purchasing power parity terms.
As its economic weight has grown, so too has its strategic weight, and China is returning to its historic place as one of the most significant players on the world stage. This has led to considerable debate about the implications for the global order.
For Australia, this has found us in the position where our largest trading partner is not one of our major strategic partners. As a result, there has been much speculation and the suggestion that we must choose between our historical partnerships or alliances and our largest trade partner.
Those who focus on the inevitability of that choice fail to understand the depth of our present relationships. To my mind, the strong trade, economic and growing cultural links with China sit very comfortably next to our deep cultural, economic and security ties with the United States.
The US and UK will continue to be important economic and strategic partners for Australia. This will not change any time soon — as at the end of 2011, the US and the UK held 27 per cent and 23 per cent of our total stock of investment respectively, while China represented less than 1 per cent.

6
Our unequivocal security relationships are founded on common concepts and experiences of shared history and values which change only slowly and often together. Most Australians would consider these relationships to be instinctive, and they are also fundamental to the national interest.
But our relationship with China will continue to develop and deepen, and not just on economic and trade issues. Our cultural ties (including our people-to-people links built through families and through tourism, education and sporting exchanges), science, immigration, technology and research links, and defence and political exchanges are all growing apace, resulting in a more rounded relationship. Mandarin is now the second most common language spoken at home in Australia. Such exchanges make us richer and are changing the face of Australia, resulting in greater diversity and a greater appreciation of the region in which we live.
Australia and China may not always share the same positions or views on issues. But our relationship is mature enough that we can acknowledge and express our differences while seeking to build on the positive aspects, not least our shared interest in regional stability and security — an interest that we both also share with the US.
Some have expressed the concern that Australia is too dependent on China economically, that we are placing all our eggs in one basket, and that a downturn in China will have disastrous effects on Australia. Certainly, Australia would not be immune to a serious downturn in China, but Australia’s sensitivity to economic conditions in our major trading partners is neither new nor avoidable, and we have a proven record of coping with slowing growth in key export markets (such as Japan) and other external shocks (such as the Asian Financial Crisis and Global Financial Crisis). Forgoing the opportunities of engaging with China because of timidity would ultimately make us poorer.
Furthermore, although China’s economy has certainly slowed from the heady days of double-digit growth, its economic expansion still has some considerable way to run, with industrialisation and urbanisation contributing to its ongoing growth. A more economically and environmentally sustainable growth rate of 7-8 per cent would still see the Chinese economy roughly doubling in size in a decade. And according to the International Monetary Fund, China is on track to become the world’s largest economy by the end of this decade in purchasing power parity terms.
This is not to say it will be all smooth sailing. China faces economic and demographic challenges. As is the case in Australia, sustained economic growth depends fundamentally on productivity growth. In China, there is still plenty of scope for reforms in finance, state owned enterprises and the labour market to boost productivity. We know from our own experience of ‘reform and opening up’ Australia’s financial and labour markets in the 1980s that this means placing long-term national interest above vested interests. Fortunately, China’s policymakers are aware of the challenges they face — and the comprehensive economic reforms outlined in the 12th Five Year Programme (2011-2015) provide a guide for how to get there — although they will nevertheless have to make some tough economic and political decisions along the way. But they are far from alone in that regard, especially given current global challenges.
This special China edition of Treasury’s quarterly Economic Roundup, published to coincide with the 40th anniversary of the establishment of diplomatic relations, begins with an overview of our bilateral relationship, with an emphasis on the economic aspects of that relationship, followed by three articles examining some of the key medium-term economic issues facing China: structural challenges and China’s evolving growth model; the so-called ‘rebalancing’ towards greater consumption-driven growth; and the competitiveness of, and prospects for, its export sector. How China responds to these issues is obviously important for China itself, but will also have profound and lasting implications for Australia, presenting opportunities and challenges in our bilateral relationship, and for Australia domestically — opportunities and challenges to which I am confident Australia will rise to meet.

7
Australia-China: Not just 40 years Wilson Au-Yeung, Alison Keys and Paul Fischer1
This article looks back at the relationship between Australia and China, particularly following the normalisation of relations in 1972.
1 The authors are from Macroeconomic Group, the Australian Treasury. This article has
benefited from comments and suggestions provided by Jared Bullen, Owen Freestone, Samuel Hurley, Jason McDonald, Adam McKissack, Stewart Nixon and Barry Sterland. We would also like to thank Rebecca Bowden for her research assistance and acknowledge input provided by Sally Deane and Taliessin Reaburn from Austrade. The views in this article are those of the authors and not necessarily those of the Australian Treasury.

Australia-China: Not just 40 years
8
Introduction
On the eve of the 40th anniversary of the establishment of diplomatic relations between Australia and the People’s Republic of China (PRC), this article looks back at the evolution of the relationship between our two countries, particularly following the normalisation of relations in 1972.
Diplomatic Relations
Chinese links with Australia extend well beyond the last 40 years at an official and non-official level. Examples of early official contact include the Chinese Consul-General arriving in Melbourne in 1909. Dr Lin Sen visited Australia in 1930, shortly before becoming President of the then National Government of China. Australia (briefly) had a trade commissioner in China from 1921-22. This was followed in 1934 by a ‘Mission to the Far East’, led by then Deputy Prime Minister JG Latham — a trade mission, which was also Australia’s first attempt at direct political engagement with China. In 1941, Australia appointed its first diplomatic official to China, based in the then-capital of Chungking (now Chongqing).
When the PRC was founded in 1949, rather than recognise the PRC, Australia retained diplomatic relations with the previous regime which had established itself on Taiwan. However, as early as 1954, Gough Whitlam advocated recognition — the first Australian Member of Parliament to do so (Whitlam, 2010). The Australian Labor Party adopted the policy of recognising the PRC in 1955, but it was another 17 years before the ALP was elected into government, led by Whitlam himself, on 2 December 1972. Less than three weeks later, on 21 December, Australia and China signed the joint communiqué establishing diplomatic relations.
Under the Communiqué, the two Governments agreed to:
…develop their diplomatic relations, friendship and co-operation between the two countries on the basis of the principles of mutual respect for sovereignty and territorial integrity, mutual non-aggression, non-interference in each other’s internal affairs, equality and mutual benefit, and peaceful coexistence.
From China’s perspective, the critical issue was Australia’s recognition that the Government of the PRC was the sole government of China:
The Australian Government recognizes the Government of the People’s Republic of China as the sole legal Government of China, acknowledges the position of the Chinese Government that Taiwan is a province of the People’s Republic of China, and has decided to remove its official representation from Taiwan before January 25, 1973.

Australia-China: not just 40 years
9
With this done, Australia and the PRC (henceforth referred to as ‘China’) could embark on the ‘normalisation’ of their relationship. The Australian Embassy, in ‘Peking’ (now Beijing), was opened on 12 January 1973. Later that year, Gough Whitlam became the first Australian Prime Minister to visit China, establishing the foundations of our present-day bilateral relationship, supported by all subsequent governments. Also in that year, we signed the Trade Agreement between the Government of Australia and the Government of the People’s Republic of China, which served as the basis for our bilateral trade and economic relationship, supplemented over time by extensive additional agreements, memoranda of understanding, and dialogues.
While trade and investment form the bedrock of our official bilateral relationship, it is of course much broader than that, with agreements, dialogues and links that cover most, if not all, aspects of the relationship — agriculture, resources, tourism, culture, climate change, human rights, customs, to name just a few.
An extensive program of high-level visits ensures regular exchanges at ministerial level and above. In 2003, President Hu Jintao became the first Chinese leader to address a joint sitting of the Australian Parliament (before him, only US presidents George HW Bush, Bill Clinton and George W Bush — the day before Hu — had been extended that honour). In 2012 alone, the Deputy Prime Minister and Treasurer, Minister for Foreign Affairs, Minister for Trade and Competitiveness, Minister for the Arts and Minister for Regional Development, Minister for Resources, Energy and Tourism, Minister for Defence, Minister for Science, Minister for Climate Change, and Minister for Environment and Water all visited China. The Prime Minister visited in 2011, while the Governor-General visited in 2010. State and Territory premiers and ministers are also regular visitors to China — and we have 82 ‘sister’ relationships with Chinese provinces and cities.
But it is a two-way exchange. General Secretary of the Chinese Communist Party and President-to-be Xi Jinping visited Australia in 2010 (as Vice President), and remarked that he has visited all mainland Australian states and territories. Vice Premier and expected next Premier Li Keqiang visited Australia in 2009. The remaining five Politburo Standing Committee members — making up China’s seven most senior leaders — have also all visited Australia at various points in their careers.
Cultural relations and people-to-people links
Australia-China links at the grassroots level are also important. These cultural and people-to-people links serve as the day-to-day ties between the two countries. Tourism and education are a significant part of this, but the contribution made by Chinese migrants to Australian life and culture over many years should not be understated.

Australia-China: not just 40 years
10
There were reports of Chinese traders reaching the north coast of Australia as early as the 1750s — and possibly earlier — while the first large-scale contact took place in the 19th century, when large numbers of Chinese miners came to Australia during the gold rushes of the 1850s (Victoria) and 1860s (New South Wales). By 1861, around 40,000 Chinese were living in Australia, representing 3.3 per cent of our population.
Regrettably, in a shameful episode of Australian history, the Immigration Restriction Act 1901 and related ‘white Australia’ policies subsequently saw Chinese and other ethnic groups denied entry to Australia, persecuted, and/or removed from Australia from the time of Federation. The final vestiges of these policies were removed in 1973.
Nevertheless, despite persecution, many Chinese remained in Australia and when the policies were lifted, more arrived. Australia is all the richer for their contributions in all fields of life, including politics (former Melbourne Lord Mayor John So, for example); medical science (Dr Victor Chang); and real estate (LJ Hooker was the descendent of an early Chinese migrant, and his real name was Leslie Joseph Tingyou), to name just a few. China’s contribution to Australia’s culinary traditions should also not be forgotten — there are few towns in Australia without a Chinese restaurant.
Australians too have been in China since the 19th century. William Mayers, from Tasmania, went to study in China in 1859 and was involved in negotiations to bring the first railway and steam engine to China; Australian journalist George Ernest Morrison was a correspondent for The Times in China from 1897-1912, became an adviser to the then Chinese Government, and represented China at the WWI peace talks in Versailles in 1919; and from the 1920s through to 1949, other Australians lived and worked in China, including journalists, missionaries, and business people.
Our cultural links are being developed both organically, through direct contact between our citizens as a result of migration, tourism, business and education links, as well as through official efforts. The Australian and Chinese governments are working to promote cultural awareness and mutual understanding, including through the reciprocal Year of Australian Culture in China and Year of Chinese Culture in Australia, in 2010-11 and 2011-12 respectively. Over the course of these two years, each country was able to showcase a range of cultural events, from the traditional to the contemporary, from music to sport — an AFL exhibition match was played in Shanghai in 2010 between the Melbourne Demons and the Brisbane Lions, with Mandarin commentary provided for the 7,000 or so spectators by a young Melbourne-based Chinese Australian.
Australia’s 2011 census highlighted just how important the Chinese community is in Australia, with around 4 per cent or 865,000 Australian residents identifying themselves as having Chinese ancestry, and Mandarin the second most common language spoken at home (with Cantonese ranked fifth).

Australia-China: not just 40 years
11
The growing level of understanding and trust that has developed through the personal links between Australia and China has the potential to help keep our overall relationship on track when — as is inevitable — we have our occasional ups and downs.
Economic Relations
Australia and China’s economic relationship has grown rapidly in recent times, especially the trade relationship. From small beginnings, the trade relationship is now one of the key strands linking the two countries. China is Australia’s largest trading partner, in terms of both exports and imports, while Australia is China’s sixth-largest merchandise trading partner, ranking just outside the top ten in terms of exports and fifth in imports (DFAT, 2012).
While Chinese investment into Australia remains low compared with investment from other countries, it has grown fast in recent years and there is scope for it to continue to increase to the benefit of both countries.
Australian businesses have also invested in China, with a number of notable successes. As China continues its economic liberalisation, and capital flows become easier, there will be further opportunities for Australian businesses to invest and expand operations in China.
Australia’s early trade relationship with China
Trade with China dates back a long way. However, in the early days of Federation it was relatively small, with China accounting for only around 0.3 per cent of Australia’s total merchandise trade flows in 1901.
During the first decade of Federation, tea and rice were the main Australian imports from China, accounting for almost half of our imports from China (Chart 1). Silk was another significant import, with a share of just under 10 per cent. These imported goods were largely paid for through the export to China of precious metals such as silver and gold bullion, copper ingot and pig lead, and to a lesser degree, the export of grains (Chart 2).
In the second decade of the 20th century, apparel and textiles (largely silk at this stage) overtook tea and rice as Australia’s primary imports from China. Their share, peaking at 43 per cent of imports in 1918-19, averaged around 35 per cent between 1910 and 1920.

Australia-China: not just 40 years
12
Chart 1: Composition of Australian imports from China
0
20
40
60
80
100
0
20
40
60
80
100
1899 1911 1923-24 1935-36 1947-48 1959-60Other Tea SugarDrugs, Chemicals & Fertiliser Oils Nuts, edibleRice Bristles Apparel and Textile
Per centPer cent
Source: Australian Bureau of Statistics (ABS) Cat. No. 5409.0 and Treasury.
During this period, beyond the export of metals (pig lead, silver and gold); agricultural goods were also becoming an increasingly important Australian export to China. Butter, which made up less than 2 per cent of our merchandise exports to China at Federation, rose and peaked at around 34 per cent in 1917-18, with an average share of around 20 per cent during this decade. In 1901, around 35,000 pounds of butter was exported to China, increasing to 950,825 pounds by 1917-18, a 27-fold increase in volumes from Federation.
Wheat also became an increasingly important part of the trade relationship from 1920, accounting for almost a third of Australian exports to China by value between 1920 and 1930, increasing to over 90 per cent in the early 1930s, and accounting for an average of around 70 per cent throughout the 1930s. During this period, apparel and textiles continued to be our main import from China; however, the importance of silk declined markedly.
Bilateral trade fell during the Second World War and did not pick up significantly until 1946-47. The post-war resurgence of trade saw the emergence of wool as a key export to China. Wool accounted for over a third of Australian exports to China, rising to around 99 per cent of our exports to China in 1953-54, before settling to around 83.5 per cent by the end of the 1950s. Meanwhile, wheat and flour exports became relatively less important until the start of the 1960s.2
2 The only exception is in 1949-50, where the combined share of wheat and flour would be
around three quarters of total merchandise exports to China.
Australia-China: not just 40 years
13
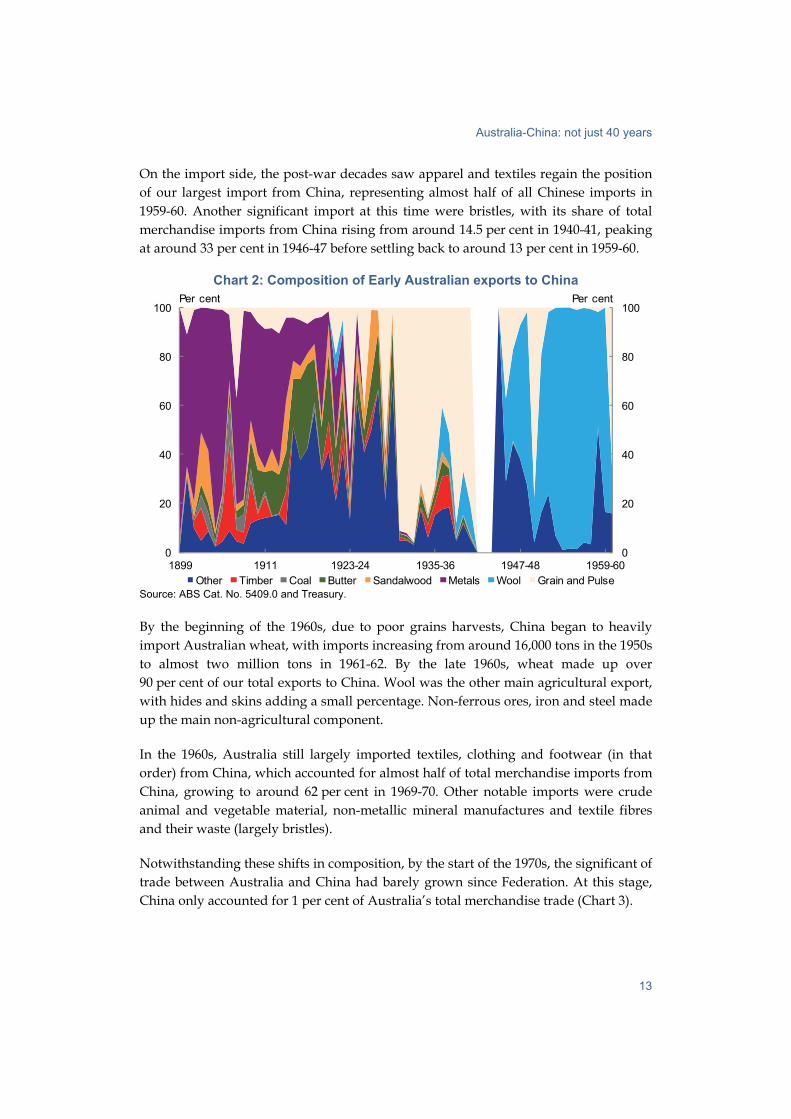
On the import side, the post-war decades saw apparel and textiles regain the position of our largest import from China, representing almost half of all Chinese imports in 1959-60. Another significant import at this time were bristles, with its share of total merchandise imports from China rising from around 14.5 per cent in 1940-41, peaking at around 33 per cent in 1946-47 before settling back to around 13 per cent in 1959-60.
Chart 2: Composition of Early Australian exports to China
0
20
40
60
80
100
0
20
40
60
80
100
1899 1911 1923-24 1935-36 1947-48 1959-60Other Timber Coal Butter Sandalwood Metals Wool Grain and Pulse
Per centPer cent
Source: ABS Cat. No. 5409.0 and Treasury.
By the beginning of the 1960s, due to poor grains harvests, China began to heavily import Australian wheat, with imports increasing from around 16,000 tons in the 1950s to almost two million tons in 1961-62. By the late 1960s, wheat made up over 90 per cent of our total exports to China. Wool was the other main agricultural export, with hides and skins adding a small percentage. Non-ferrous ores, iron and steel made up the main non-agricultural component.
In the 1960s, Australia still largely imported textiles, clothing and footwear (in that order) from China, which accounted for almost half of total merchandise imports from China, growing to around 62 per cent in 1969-70. Other notable imports were crude animal and vegetable material, non-metallic mineral manufactures and textile fibres and their waste (largely bristles).
Notwithstanding these shifts in composition, by the start of the 1970s, the significant of trade between Australia and China had barely grown since Federation. At this stage, China only accounted for 1 per cent of Australia’s total merchandise trade (Chart 3).
Australia-China: not just 40 years
14
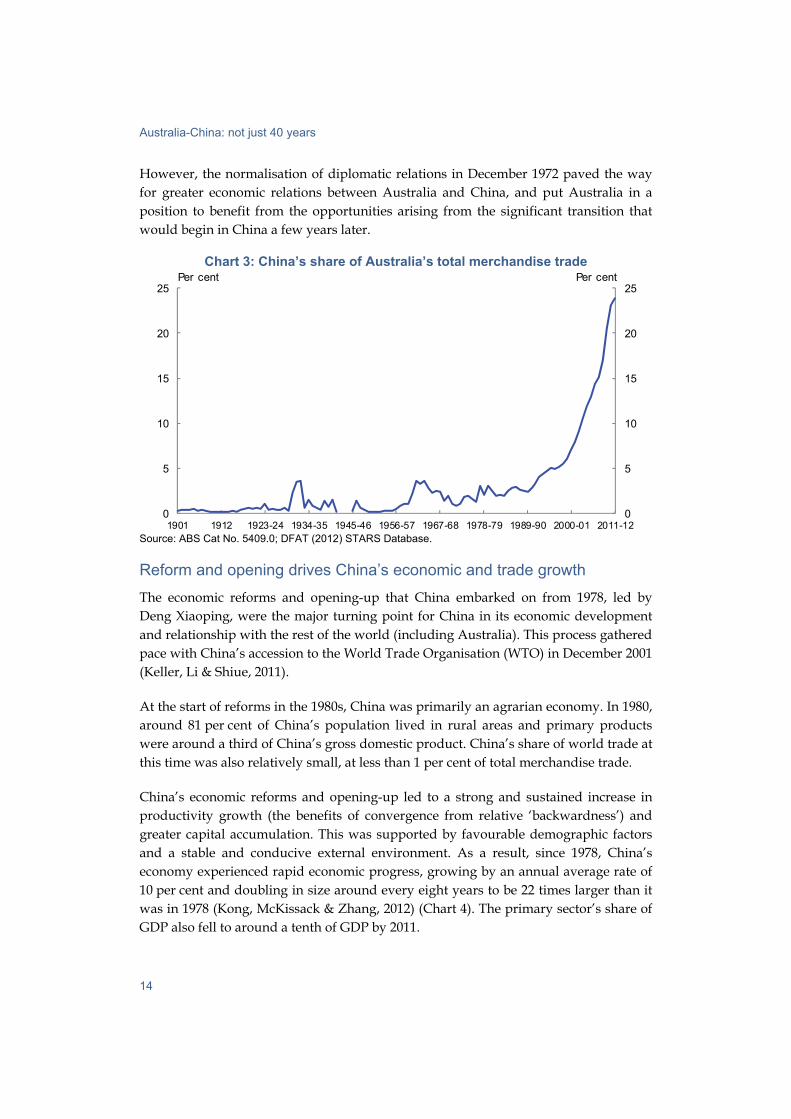
However, the normalisation of diplomatic relations in December 1972 paved the way for greater economic relations between Australia and China, and put Australia in a position to benefit from the opportunities arising from the significant transition that would begin in China a few years later.
Chart 3: China’s share of Australia’s total merchandise trade
0
5
10
15
20
25
0
5
10
15
20
25
1901 1912 1923-24 1934-35 1945-46 1956-57 1967-68 1978-79 1989-90 2000-01 2011-12
Per centPer cent
Source: ABS Cat No. 5409.0; DFAT (2012) STARS Database.
Reform and opening drives China’s economic and trade growth
The economic reforms and opening-up that China embarked on from 1978, led by Deng Xiaoping, were the major turning point for China in its economic development and relationship with the rest of the world (including Australia). This process gathered pace with China’s accession to the World Trade Organisation (WTO) in December 2001 (Keller, Li & Shiue, 2011).
At the start of reforms in the 1980s, China was primarily an agrarian economy. In 1980, around 81 per cent of China’s population lived in rural areas and primary products were around a third of China’s gross domestic product. China’s share of world trade at this time was also relatively small, at less than 1 per cent of total merchandise trade.
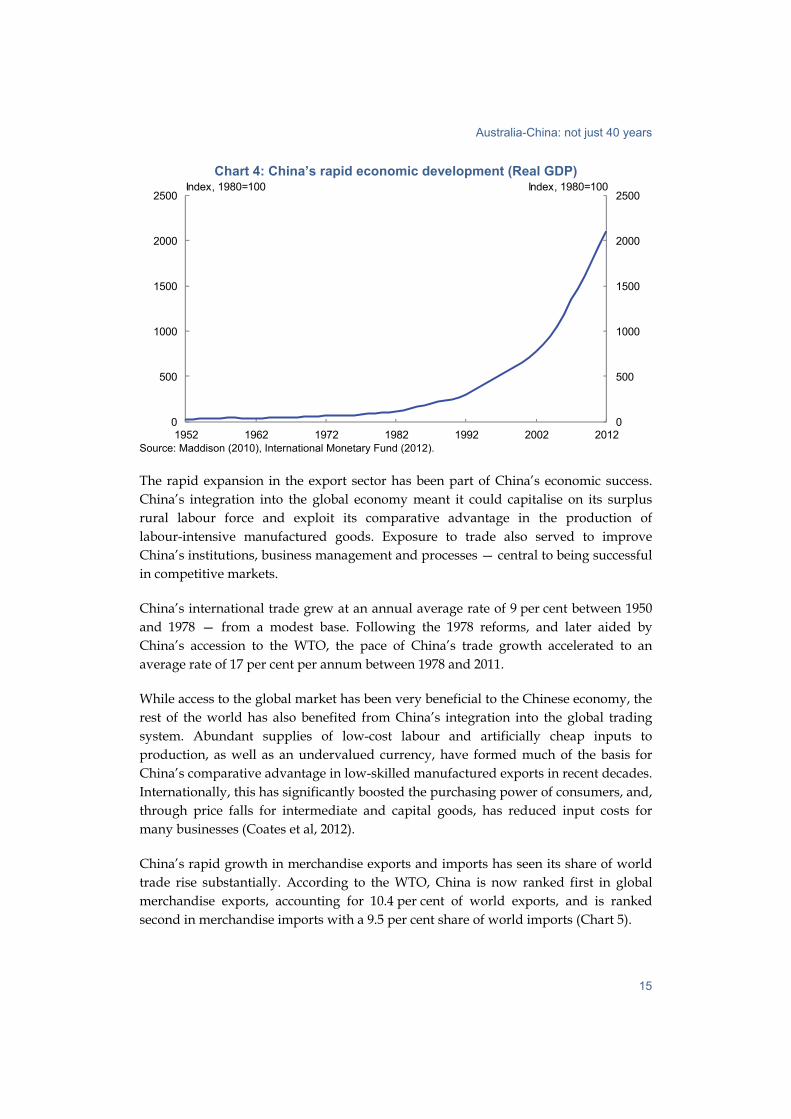
China’s economic reforms and opening-up led to a strong and sustained increase in productivity growth (the benefits of convergence from relative ‘backwardness’) and greater capital accumulation. This was supported by favourable demographic factors and a stable and conducive external environment. As a result, since 1978, China’s economy experienced rapid economic progress, growing by an annual average rate of 10 per cent and doubling in size around every eight years to be 22 times larger than it was in 1978 (Kong, McKissack & Zhang, 2012) (Chart 4). The primary sector’s share of GDP also fell to around a tenth of GDP by 2011.
Australia-China: not just 40 years
15
Chart 4: China’s rapid economic development (Real GDP)
0
500
1000
1500
2000
2500
0
500
1000
1500
2000
2500
1952 1962 1972 1982 1992 2002 2012
Index, 1980=100Index, 1980=100
Source: Maddison (2010), International Monetary Fund (2012).
The rapid expansion in the export sector has been part of China’s economic success. China’s integration into the global economy meant it could capitalise on its surplus rural labour force and exploit its comparative advantage in the production of labour-intensive manufactured goods. Exposure to trade also served to improve China’s institutions, business management and processes — central to being successful in competitive markets.
China’s international trade grew at an annual average rate of 9 per cent between 1950 and 1978 — from a modest base. Following the 1978 reforms, and later aided by China’s accession to the WTO, the pace of China’s trade growth accelerated to an average rate of 17 per cent per annum between 1978 and 2011.
While access to the global market has been very beneficial to the Chinese economy, the rest of the world has also benefited from China’s integration into the global trading system. Abundant supplies of low-cost labour and artificially cheap inputs to production, as well as an undervalued currency, have formed much of the basis for China’s comparative advantage in low-skilled manufactured exports in recent decades. Internationally, this has significantly boosted the purchasing power of consumers, and, through price falls for intermediate and capital goods, has reduced input costs for many businesses (Coates et al, 2012).
China’s rapid growth in merchandise exports and imports has seen its share of world trade rise substantially. According to the WTO, China is now ranked first in global merchandise exports, accounting for 10.4 per cent of world exports, and is ranked second in merchandise imports with a 9.5 per cent share of world imports (Chart 5).

Australia-China: not just 40 years
16
Chart 5: China’s Share of World Merchandise Trade
0
2
4
6
8
10
12
0
2
4
6
8
10
12
1951 1956 1961 1966 1971 1976 1981 1986 1991 1996 2001 2006 2011
Per cent of w orld total Per cent of w orld total
Trade Import
Export
Source: World Trade Organisation, statistical database.
Accompanying the rapid growth in China’s manufacturing industry has been the significant migration of labour from rural to urban areas, with people following employment opportunities. The proportion of China’s total population living in urban areas rose from around 19 per cent in 1980, to more than 50 per cent today (Chart 6). This urbanisation process has had significant implications for Australia’s resource sector, which are discussed later on.
Chart 6: China’s Urbanisation Rate
0
20
40
60
80
0
20
40
60
80
1970 1980 1990 2000 2010 2020 2030 2040 2050
Per centPer cent
Source: United Nations (2012).
Australia-China: not just 40 years
17
Australia’s rapidly growing trade relationship with China
The complementarity of Australia’s and China’s economies has resulted in extraordinary growth in bilateral trade over the past forty years. Merchandise trade has grown from around $100 million in 1972 to $114 billion in 2011, while services trade — negligible in 1972 — is now worth over $7 billion. China’s share of Australia’s total merchandise trade rose from 1 per cent in 1972 to almost 25 per cent in 2011-12.
With this strong and growing trade and economic relationship, Australia and China agreed on 18 April 2005 to commence negotiations into a Free Trade Agreement. Eighteen rounds of negotiations have taken place, but the negotiations are complex, covering an array of sensitive issues including agricultural tariffs and quotas, manufactured goods, services, temporary entry for skilled workers and foreign investment.
Our trade and economic relationship has nevertheless continued to develop apace. Indeed, the value of one day’s trade in 2011-12 was worth more than one year’s trade in the early 1970s.
Importing manufactures
China’s main exports to Australia since Federation have been manufactured goods. From 1980 to the present, manufactured goods have made up over 90 per cent of our imports from China on average. Of this, over 90 per cent has been ‘elaborately transformed manufactures’ (ETMs).
The initial phase of ETM imports from China was dominated by textiles, clothing and footwear. In 1984-85, it made up more than 53 per cent of total merchandise imports from China and the majority of ETM imports. By 1989-90, textiles, clothing and footwear accounted for 42 per cent of total merchandise imports, and 49 per cent of ETM imports (Chart 7).

Australia-China: not just 40 years
18
Chart 7: Share of Imported Chinese Elaborately Transformed Manufactures
0
10
20
30
40
50
60
70
80
90
100
0
10
20
30
40
50
60
70
80
90
100
1980-81 1984-85 1989-90 1993-94 1997-98 2001-02 2005-06 2009-10
Others Engineering products Household equipment Textiles clothing & footwear
Per centPer cent
Source: ABS Cat. No. 5409.0 and DFAT (2011). Note: Authors’ calculation prior to 1989-90 due to break in data series.
Over time, China has gradually shifted up the production value chain towards more sophisticated products (Coates, Horton & McNamee, 2012). Consistent with this, the composition of ETMs that Australia imports from China has also changed with household appliances making up a greater share since the early 1980s.
But China’s manufacturing is moving beyond household appliances to more high-tech products and machinery — and we are increasingly importing these items as well. By the mid-1990s, engineering products from China began to become relatively more important, surpassing the more traditional sources of manufactured imports from China. This saw the share of engineering products to total ETM imports rise from 9.6 per cent in 1989-90 to around 50 per cent in 2010-11. Office and telecommunications equipment made up the largest share, accounting for over 50 per cent of imported engineering products from China since 2001-02 (Chart 8).

Australia-China: not just 40 years
19
Chart 8: Component Share of Imported Engineering Products from China
0
20
40
60
80
100
0
20
40
60
80
100
1989-90 1996-97 2003-04 2010-11
Professional scientific & controlling instruments & apparatus
Road motor vehicle, transport equipment & parts
Machinery for specialised industries
Other engineering products
Office & telecommunications equipment & parts
Per centPer cent
Source: DFAT (2011).
In 2011, Australia imported over $42 billion worth of goods from China, of which the largest were telecommunications equipment and parts, computers and clothing, each valued at over $4 billion. Other major imports include furniture and furnishings ($1.8 billion). These imports include international brand name products manufactured in China (such as Apple computers and iPhones) as well as Chinese brands such as Haier (a Chinese multinational electronics and home appliances producer with the largest share of the world’s white goods market). Earlier this year, Rio Tinto and China’s Xiangtan Electric Manufacturing Corporation celebrated the completion of four custom 230-tonne trucks for use in the Pilbara (Foley, 2012).
The expansion of global supply capacity from China’s integration into the world economy exerted downward pressure on prices across a range of manufactured tradable goods.
Goods that are made outside of China have also generally become cheaper. Other export-focused countries, many in Southern or East Asia, have become part of a regionally integrated supply chain with China, allowing greater specialisation and scale in production of manufactures, and promoting increased competition for these products globally.
The ‘made in China’ tag has been common for some time now on manufactured products found in Australian homes. Australia imports around 25 per cent of its manufactured imports from China, and the fall in manufacturing prices has made many of these imports cheaper. The price of imported household electrical items has

Australia-China: not just 40 years
20
fallen by around 60 per cent in nominal terms since the end of 2001, while the price of imported toys, books and leisure goods has dropped by more than 35 per cent over the same period. Even the price of cars, measured by the price of non-industrial transport equipment, has fallen by 18 per cent since the end of 2001. Prices have fallen further in real terms given the rise in Australian wages over this period.
Australian businesses that rely on imports of capital goods have also benefited from lower import prices. The average price of capital goods has fallen almost continuously for around twenty years. On the same comparison used for consumption goods, capital goods are 49 per cent cheaper than they were at the end of 2001.
While other factors have contributed to falling import prices over the past decade, China’s integration into the global economy has been the dominant driver. In Australia, this has seen the share of Australian manufacturing imports from China rise from 10 per cent to 25 per cent.
Exporting resources
China’s rapid economic development over the past decade has generated large increases in demand for resources such as iron ore and coal, which has been partly met by Australian exporters. In fact, the surge in Australian resources exports to China has been so large that it has outweighed the rapid rise in Australia’s imports of Chinese goods, with Australia one of the only developed countries to routinely run a trade surplus with China.
China’s primary resource needs are for energy for electricity and transportation, building materials for urban areas and infrastructure, raw material inputs to make manufactured items and food.
The demand for building material and inputs to manufacturing generate demand for iron ore. Although China is one of the world’s largest producers of iron ore, its own sources are not sufficient to economically supply its huge iron smelting industry, so it must supplement its domestic supplies with imports. As it accounts for around half of the world’s pig iron production 3 , China needs around 60 per cent of the global seaborne supply of iron ore. Australia is the largest exporter of iron ore to China, providing over 45 per cent of Chinese imports.
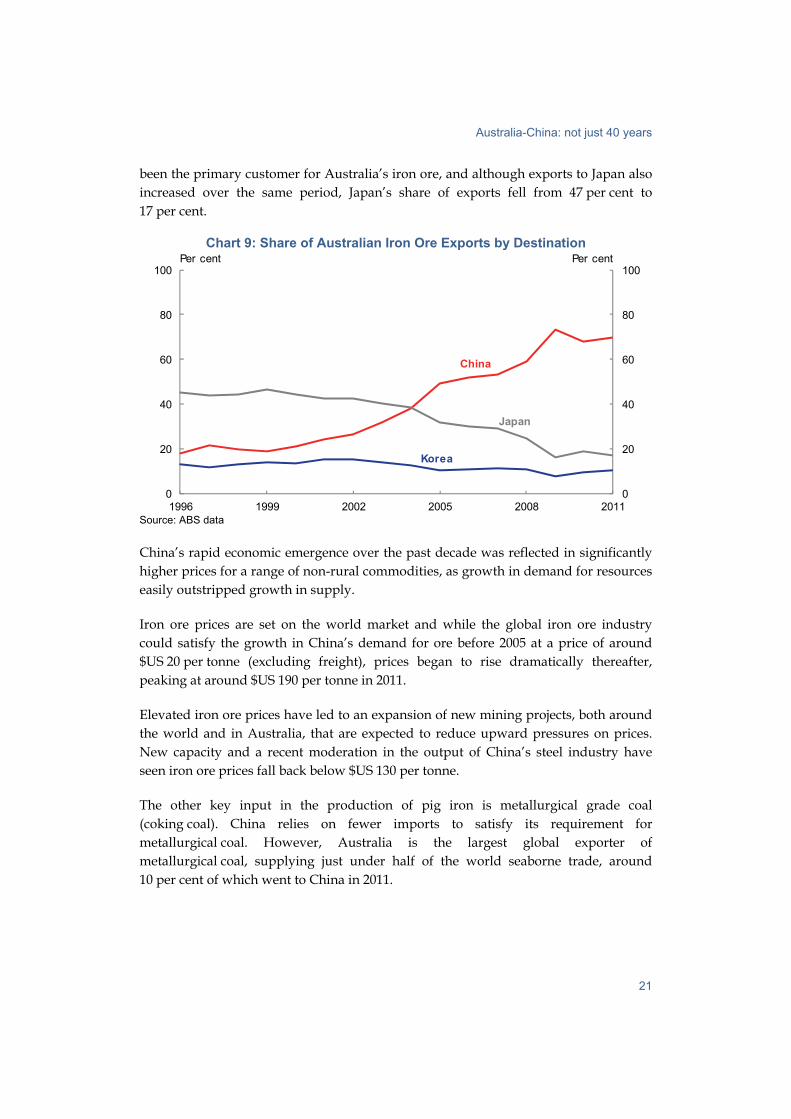
The steady rise of the Chinese iron smelting industry attracted an increasing share of Australia’s iron ore exports from 1999 onwards (Chart 9). Between 1999 and 2011, annual iron ore exports to China grew at an average rate of 23 per cent each year, growing from 26 million tonnes to 305 million tonnes. Prior to this period, Japan had
3 Pig iron is produced by smelting iron ore with coke, the primary method by which iron is
extracted from natural sources.
Australia-China: not just 40 years
21
been the primary customer for Australia’s iron ore, and although exports to Japan also increased over the same period, Japan’s share of exports fell from 47 per cent to 17 per cent.
Chart 9: Share of Australian Iron Ore Exports by Destination
0
20
40
60
80
100
0
20
40
60
80
100
1996 1999 2002 2005 2008 2011
Per centPer cent
Korea
Japan
China
Source: ABS data
China’s rapid economic emergence over the past decade was reflected in significantly higher prices for a range of non-rural commodities, as growth in demand for resources easily outstripped growth in supply.
Iron ore prices are set on the world market and while the global iron ore industry could satisfy the growth in China’s demand for ore before 2005 at a price of around $US 20 per tonne (excluding freight), prices began to rise dramatically thereafter, peaking at around $US 190 per tonne in 2011.
Elevated iron ore prices have led to an expansion of new mining projects, both around the world and in Australia, that are expected to reduce upward pressures on prices. New capacity and a recent moderation in the output of China’s steel industry have seen iron ore prices fall back below $US 130 per tonne.
The other key input in the production of pig iron is metallurgical grade coal (coking coal). China relies on fewer imports to satisfy its requirement for metallurgical coal. However, Australia is the largest global exporter of metallurgical coal, supplying just under half of the world seaborne trade, around 10 per cent of which went to China in 2011.
Australia-China: not just 40 years
22
China has also started to import significant amounts of Australian thermal coal for electricity generation in the past four years, accounting for 13 per cent of exports in 2011.
Like iron ore, Chinese demand has had a considerable effect in the global metallurgical and thermal coal markets. However, because China has been able to expand its domestic production of coal to better match its own demand, a smaller share of Australia’s exports have been diverted away from more traditional destinations.
Strong demand for coal started to drive prices up around 2004. The typical thermal coal contract price rose from around $US 27 per tonne (excluding freight) to $US 125 per tonne by 2008, while metallurgical coal contract prices increased from around $US 46 per tonne in 2004 to a peak of $US 330 per tonne in mid-2011. Over 2012, spot prices for both metallurgical and thermal coal have moderated, although prices remain high by historical standards. Lower prices reflect the slower growth in Chinese steel production, weaker growth in Chinese electricity consumption and supply expansions from coal producers around the world responding to the increase in prices.
Rising export prices and falling import prices both contribute to increasing purchasing power in Australia. The ratio of the two prices is referred to as the terms of trade and measures what volume of imports Australia can afford by selling a given volume of exports. The terms of trade is the most cited summary measure of the benefits Australia has enjoyed as a result of the resources boom.
The recent moderation in commodity prices has lowered Australia’s terms of trade. Nevertheless, they remain around 90 per cent higher than their average level from the 1990s, prior to the resources boom.
Australia’s position as a resource supplier to China is due to a number of factors including geology, location and political stability.
Australia’s geology contributes to our relative advantage not just because of the quantity of minerals that are found locally, but also their proximity to the ocean where they can be cheaply loaded onto ships that transport material at very low cost. Although these deposits are located in remote parts of the country, like the Pilbara for iron ore and the Bowen Basin for coal, in most cases they are still close to the coast.
While marine transport is cheaper than overland transport, our proximity to China is enough to give Australia a competitive advantage over the next largest iron ore exporting nation, Brazil. The difference in freight costs between the two routes is around 10 per cent of the cost of the ore.

Australia-China: not just 40 years
23
Australia’s stable political environment also reduces sovereign risk, encouraging long-term investments. For commodities that are globally traded, investors also require confidence that access to world markets is not at risk from changes in trade policy. Australian trade policy includes a strong commitment to open trade. The relaxation of iron ore trade restrictions in 1960 provided the impetus for the development of the iron ore industry in the Pilbara region. Although originally exploited to provide ore to the Japanese market, the development of the Pilbara to become the world’s largest provider of seaborne ore has paralleled the liberalisation of Australia’s trade policies.
Recent moves by India to restrict iron ore exports in response to domestic concerns about their own iron smelting industry highlight the alternative approaches that can be adopted in other countries with significant iron ore reserves. These changes will potentially limit returns to Indian miners and put upward pressure on world iron ore prices, even if they have benefits for Indian iron smelters.
The close links between Australia and China are also increasingly important for the rest of the world. Because iron is overwhelmingly the most commonly used metal in the world, the transport of iron ore from the Pilbara to Chinese ports like Qinhuangdao is one of the key trade relationships in the global economy today. Much of the metal that is found in Chinese manufactured goods started its journey in Western Australia, ending up in almost any conceivable destination.
Trade in Services with China
China’s rapid industrialisation and urbanisation has led to strong growth in resources trade over the past decade. However, growing incomes in China have also resulted in a sizable middle class — 150 million by one estimate (Kharas and Gertz, 2010) — and a strengthening relationship in services trade.
In 1972, when we established diplomatic relations, our services trade was negligible. At that time, there were fewer than 500 arrivals from China, and there were no Chinese students in Australia. Only a few Australians either visited or studied in China. Today, tourism and education are significant Australian services exports to China and a central part of our people-to-people links, and China is our largest services export market overall (Chart 10).

Australia-China: not just 40 years
24
Chart 10: Trade in Services with China
0
2000
4000
6000
8000
0
2000
4000
6000
8000
1990-91 1994-95 1998-99 2002-03 2006-07 2010-11
$million$million
Total services trade, $m
Exports to China, $m
Imports from China, $m
Source: ABS Cat No. 5368.0 and 5368.0.55.003 and Year Book Australia (various editions).
Inbound travellers
China is one of Australia’s most important inbound traveller markets. It was our highest source of tourism income in 2011, with total inbound economic value (TIEV) of $3.5 billion, and our third largest market in terms of visitor arrivals, at 542,000 (overtaking the US) (Chart 11). It is currently on track to overtake the UK this year, with 515,000 arrivals from China in January-October this year compared with 440,200 from the UK. This would place China second behind New Zealand.
The number of Chinese visitors to Australia has grown strongly since 1972, supported in 1999 by Australia (along with New Zealand) becoming the first western country to be granted Approved Destination Status (ADS). (The ADS is a bilateral tourism arrangement between the Chinese Government and a destination whereby Chinese tourists are permitted to undertake leisure travel in groups to that destination.) Australia’s management of ADS is considered ‘best practice’ by the China National Tourism Administration, and we have received nearly 830,000 tourists under the ADS scheme as at June 2012.

Australia-China: not just 40 years
25
Chart 11: Arrivals from China into Australia
0
100
200
300
400
500
600
100
200
300
400
500
600
1986 1991 1996 2001 2006 2011
Arrivals per year ('000) Arrivals per year ('000)
Source: ABS Cat. No. 3401.0.
Australia and China are now seeking to build further on the tourism relationship, with a Memorandum of Understanding (MOU) on Strengthening Tourism Cooperation signed in 2011 between the Australian Department of Resources, Energy and Tourism and the China National Tourism Administration. The MOU continues the ADS scheme, but seeks to build broader cooperation on tourism issues, including in emerging travel segments such as individual, education and company paid incentive travel, as well as acknowledging other areas of cooperation including industry development and the safety of tourists.
While ADS group travel will remain important, particularly for first-time travellers to Australia, independent travel is growing strongly, with over 177,000 non-ADS tourist visas issued to Chinese citizens in 2011-12. This represents growth of almost 120 per cent compared with five years ago, while ADS visitor numbers have grown around 40 per cent over the same period.
The increasing number of airlines and routes between Australia and China are also expanding our tourism and people-to-people links. No longer are travellers limited to flights between Beijing, Shanghai, Sydney and Melbourne — direct flights now include Guangzhou, Brisbane and Perth, with further direct flights covering Cairns and Chengdu to commence soon. These links open up regional development opportunities for both our countries.
The Tourism Forecasting Committee estimates that arrivals from China will continue to grow, to reach over 1 million arrivals by 2020.

Australia-China: not just 40 years
26
Education
Students also make up a significant proportion of visitors to Australia.
The first five Chinese students to study in Australia after the establishment of diplomatic relations arrived in 1975 (Rudd, 2011). The number of Chinese students studying in Australia increased rapidly from the late 1980s, following the introduction of policies in Australia that allowed universities and other educational institutions to offer places to full fee-paying overseas students and the lifting of limits on the number of international students (Hall and Hooper, 2008).
There has been a further significant increase in the number of Chinese students coming to Australia over the past decade. In 2011-12, Australia granted just under 50,000 student visas to Chinese citizens — a fifth of all student visa grants and well above the next largest nationality (around 34,000 student visas granted to Indian citizens) (Department of Immigration and Citizenship, 2012). This is more than double the number of student visas granted to Chinese citizens in 2002-03 (around 22,600).
The high number of Chinese students in Australia has led to strong links between Australian and Chinese institutions. A study by Universities Australia has recently found that with 885 formal agreements between Australian and Chinese institutions, Australia now has more links with Chinese institutions than with any other nationality. There are also 146 offshore programs offered in China by Australian institutions and their Chinese partners (Evans, 2012). The Southeast University-Monash University Joint Graduate School established earlier this year in Suzhou, for example, will graduate students with degrees from both Southeast University and Monash. These links between our universities and our students are likely to continue to develop over time and contribute towards the building of relationships between future leaders of our two countries.
China’s expanding middle class will continue to seek greater access to educational opportunities as a driver for more highly skilled and better paid jobs. Enrolments in higher education in China grew from an estimated 2.18 million to 9 million between 1992 and 2002 (DFAT, 2005) and to 34 million by 2010 (National Bureau of Statistics of China, 2011). This ongoing rapid growth presents a challenge for domestic Chinese educational institutions to meet the growing demand. A growing number of Chinese are also showing a preference towards studying abroad, with one survey finding that 85 per cent of Chinese high net worth individuals intended to send their children overseas to study (Industrial Bank and Hurun Report, 2012). However, in 2010 just 2 per cent of Chinese tertiary students were enrolled abroad, suggesting that there is significant room for growth (Organisation for Economic Co-operation and Development, 2012).

Australia-China: not just 40 years
27
Australia’s international education sector has been undergoing a period of change, driven by adjustments to our migration policy, changing perceptions of the education market, the increased value of the dollar and the growth of overseas competitors (ABS, 2011). Together, these have contributed to a 10 per cent decrease in the number of student visas granted to Chinese citizens when compared with the high point of 2008-09 — although this compares well with the overall decrease of around 20 per cent, and almost 50 per cent decrease in Indian student visa grants) (Department of Immigration and Citizenship, 2012). However, student visa applications have now stabilised. Going forward, Chinese (and indeed world) demand for education services is likely to continue to grow, but in an increasingly competitive market, Australia will need to work to ensure it remains an attractive destination for Chinese students.
These tourism and education links are not just one-way. Whilst only a handful of Australians visited or studied in China in 1972, Australians made over 369,000 visits to China in 2011. Absolute Australian student numbers in China appear small at only 3,300, but this is roughly twice as many on a per capita basis than Chinese students in Australia. Numbers are likely to increase further with the focus on Asian languages as set out in the Australia in the Asian Century White Paper.
Financial services
In addition to education and tourism, Australia is also building a strong presence in China’s financial services sector. All of the ‘big four’ banks have a branch presence in China, and we also have a long-standing interest in insurance and a growing interest in funds management and securities, with the Macquarie Group, AMP, Insurance Australia Group and Australian Super all active in China.
The Westpac Banking Corporation (Westpac) was the first Australian bank to establish a presence in China with the opening of a representative office in Beijing in 1982. The Australia and New Zealand Banking Group (ANZ) now has the largest presence, with four branches, three sub-branches, stakes in two Chinese banks, and a fully-owned rural bank. Australian financial institutions in China have welcomed China’s efforts to increase efficiency, transparency and accountability in the financial services sector.
The Australian financial sector has built a strong reputation in China, supported by its resilience through the Global Financial Crisis (GFC), with the ‘big four’ banks all retaining AA credit ratings by Standard & Poor’s through the GFC. As China opens its financial services sector further, Australian institutions should be well placed to build on their businesses in China. Financial integration between Australia and China is also increasing, with the March 2012 signing of a $30 billion (RMB 200 billion) currency swap agreement between the Reserve Bank of Australia and the People’s Bank of China.

Australia-China: not just 40 years
28
Given Australia’s strength in financial services, and the potential for substantial growth in the Australia-China trade and investment relationship, there is significant scope to develop RMB-related business opportunities in Australia. The Australian Government’s most recent moves in support of this include the establishment of an annual RMB trade and investment dialogue between private-sector representatives and government officials from Australia and Hong Kong, commencing in Sydney in 2013; and preliminary discussions with the Chinese Government to establish direct trading between the AUD and RMB.
Chinese banks and financial institutions are also increasingly active in Australia, with policy and commercial banks (including the People’s Bank of China, Bank of China, and Industrial and Commercial Bank of China) active in loans, trade finance and transactional services, and securities and investment banking services.
Other services
Australian architects are also making a significant impact on the Chinese landscape, designing seven of China’s Olympic venues, including the landmark ‘Water Cube’ in Beijing. Australia’s GHD Architects has offices in Beijing, Changsha and Wuhan, and has provided design and consulting services on a number of water, resources, energy and urban planning projects. Australian companies have recently won a number of significant projects, including for development of a 40 square kilometre heritage area in Nanjing and a 3,800 square kilometre ‘airport city’ in Guangzhou.
Other Australian professional services — accounting firms and law firms, for example — are also represented in China, as are environmental services, the food and beverage industry, and others.
Investment
A thriving bilateral investment relationship is emblematic of deeper economic integration between two countries. Investment flows enable both countries to expand on established trade ties, with the recipient country gaining access to (among other things) additional capital, expertise and overseas markets, and the investor country benefiting from (among other things) local experience, expanded global networks and greater integration with its trade partner.
Australia’s investment relationship with China began a lot earlier than is commonly appreciated. Some of the earliest examples date back to the large influx of Chinese migrants during the gold rushes of the 1850s and 1860s, when many Chinese set up businesses providing accommodation, food, equipment, medicine and tailoring services to name a few. The development of Melbourne’s Chinatown for example, which is the longest continuous Chinese settlement in the western world, serves as an early example of Chinese investment that continues to thrive today, having evolved

Australia-China: not just 40 years
29
into a primary destination for top class restaurants from China and countries the world over.
A number of Chinese Australians also used their experience in Australia to establish businesses back in China — Ma Ying Piu, for example, worked under retailer David Jones before establishing the renowned Sincere Department Stores in Hong Kong and mainland China.
In terms of more traditionally recognisable investments, one of the first Chinese investments in Australia occurred some 25 years ago, when the China Metallurgical Import and Export Corporation (now known as Sinosteel) acquired a 40 per cent interest in a joint venture with Hamersley Iron (now part of Rio Tinto) to develop the Channar iron ore mine in the Pilbara. The mine, which produced its first 20 thousand tonne shipment to China in early 1990, has since produced around 200 million tonnes.
The investment agreement took many years to negotiate and required its own state government legislation. The initial agreement, which was championed by the highest levels of government at the time, resulted in production of only 10 million tonnes per annum. By contrast, the extension of the joint venture in December 2010 to raise production by a further 50 million tonnes per annum received considerably less attention.
Although Chinese investment in Australia grew quite slowly for some time after the Channar project, it has surged in recent years as Chinese investment worldwide has taken off, supported by China’s ‘go global’ policy, first outlined in the late 1990s. The stock of Chinese investment in Australia on 31 December 2011 was $19.0 billion, more than three times the level in 2007 (ABS catalogue 5352.0). The Government has approved around 380 business proposals over the last five years and over $80 billion of total Chinese investment (including investment in Australian businesses as well as real estate investment). Australia has been China’s top overseas foreign direct investment destination (excluding Hong Kong and selected tax havens) since the start of the ‘go global’ policy (Larum and Qian, 2012). China has been ranked in the top three sources of proposed investment for the last four years, which demonstrates the significant shift that has occurred in Australia’s sources of foreign investment.
The rapid increase in Chinese investment in a short span of time has generated much attention in the Australian public, with concerns in some parts of the community (Henry, 2012; Hurst, Cai and Findlay, 2012; and Cai, 2012). This is in spite of the positive impact that foreign investment has had on the Australian economy, leading Ken Henry (2012) to comment that it is a little ironic that these concerns should be expressed so loudly in Australia. But caution amongst some sectors of the public towards foreign investment is nothing new. Back in the 1970s, there were concerns over American investment, which eventually led to the establishment of the

Australia-China: not just 40 years
30
Foreign Investment Review Board. In the 1980s, Japanese investment was also under the spotlight.
However, despite the recent growth, China is still only our 13th largest investor, with less than 1 per cent of the total stock of inward investment. This pales in comparison to traditional investors including the United States (27 per cent) and the United Kingdom (23 per cent) which combine to make up half of the total stock of foreign investment in Australia (Chart 12). Of the Asian economies, Japan (6 per cent) remains the largest foreign investor in Australia. Looking at direct investment into Australia, China is ranked 9th ($13.3 billion and 2.6 per cent of the total stock), but is still well behind the $122.4 billion from United States investors. In terms of China’s own investment portfolio, although Australia has been one of its top overseas foreign investment destinations, the quantum remains limited in nature, accounting for only 2.5 per cent of China’s overseas direct investment in 2010 (Yu, 2012).
Chart 12: Share of stock of investment in Australia by source country (2011)
0
5
10
15
20
25
30
0
5
10
15
20
25
30
US
A
UK
Japa
n
Sin
gapo
re
Net
herla
nds
Sw
itzer
land
Hon
g K
ong
New
Zea
land
Can
ada
Luxe
mbo
urg
Ger
man
y
Fra
nce
Chi
na(M
ainl
and)
Mal
aysi
a
Tha
iland
Per centPer cent
Source: ABS Cat. No. 5352.0.

Australia-China: not just 40 years
31
Box 1: Chinese investment successes
Following are two examples which highlight the benefits that Chinese investment brings to both our countries
Karara iron ore project — magnetite mining
Traditionally, the iron ore industry in Australia has exploited a high-grade iron ore called hematite, which accounts for roughly 96 per cent of Australia’s iron ore production. Australia also has an abundance of a lower grade iron ore called magnetite but, because of the abundance of hematite, Australia has not exploited magnetite.
Chinese investors, however, have shown the necessary skill and willingness to mine and process magnetite in Australia. Effectively, a new iron ore industry is being established because of Chinese investment. The overall result is that iron ore production in Australia increases. This increases the potential supply of iron ore to China while benefiting the Australian economy.
An example of this is the Karara iron ore project in Western Australia, which is being developed through a partnership between Gindalbie Metals Ltd and Chinese enterprise AnSteel. The project is aiming for initial production of 8 million tonnes a year of magnetite concentrate (2 million tonnes a year of hematite) and eventually around 30 million tonnes a year for 30 years. The initial estimated construction cost of the project was $2.57 billion, which includes additional capacity for key infrastructure to allow for mine production to be increased in the future. Gindalbie states that the project’s economic impact is as follows:
Total construction workforce: over 1,500 people.
Permanent workforce: approximately 500 people.
Indirect jobs: additional 300 jobs in the Mid West region of Western Australia, with significant business opportunities.
Export revenue: approximately $1 billion a year, rising to around $3 billion a year.
Royalties: approximately $50 million a year, rising to around $150 million a year for 30 years.
In August 2011, China’s Bright Food Group reached agreement to acquire a 75 per cent equity stake in Food Holdings Pty Ltd (commonly known as Manassen Foods) for an implied value of over $500 million. Under the agreement, the remaining 25 per cent equity will be retained by current shareholders, including Roy Manassen.
The Bright Food Group is a multinational food and beverages manufacturing company headquartered in Shanghai, and was the second-largest China-based food manufacturing company measured by 2011 revenues. It has an extensive network of production, distribution and retail stores, as well as large farms, dairy farms and tea plantations across China. It has an established nationwide network for food production, distribution logistics and retailing businesses and trading arrangements with many multinational companies.

Australia-China: not just 40 years
32
Box 1: Chinese investment successes (continued)
Manassen has the Margaret River label and acts as a distributor for a range of brands that includes Carr’s, Ryvita, Laughing Cow, Jelly Belly, Sharwood’s and Castello Cheese.
The companies claim Bright Food’s investment and strategic partnership with Manassen will bring significant strategic benefits and opportunities for Manassen to access China and broader Asian markets. It will provide significant export benefits for Manassen through a more sophisticated understanding of Chinese consumers and Bright Food’s promotion of Australian produce in the Chinese market.
Bright Food has signalled its commitment to building its presence in Australia by working in partnership with Australian growers, suppliers, customers and the shareholders and management team of Manassen Foods. The partnership provides growth opportunities for both companies and the opening of a permanent Bright Food office in Sydney signals its commitment to long-term investment in Australia.
In the other direction, Australia started to invest in China in 1979 — one of the earlier countries to do so (Yu, 2012). But our investment in China remains low compared to our trade relationship. China was Australia’s 12th largest destination for investment abroad at the end of 2011, with a total stock of $17 billion invested there. Of this, $6.4 billion was foreign direct investment, making China Australia’s 10th largest destination. While Australian investment in China has increased in recent years, at 1.4 per cent of total stock, it remains a very small fraction of the investment directed to developed economies.
China’s foreign investment policy is managed jointly by the National Development and Reform Commission and the Ministry of Commerce, and includes a catalogue that identifies ‘encouraged’, and ‘restricted’ sectors for investment, reflecting China’s economic priorities as outlined in China’s 12th Five Year Programme (sectors not listed in either category are by default ‘permitted’). For example, investment in high-end manufacturing, new technologies, modern services industries, clean energy and environmentally sustainable industries is ‘encouraged’; investment in other services areas including telecommunications, banking and insurance, are generally restricted, as is investment in many areas of the agriculture, mining and energy resources sectors. Nevertheless, Australian companies have made some inroads, even in these areas — Rio Tinto holds a 49 per cent stake in a joint venture with Chinalco for mineral exploration in China. Mining services companies such as Worley Parson also have a significant presence.

Australia-China: not just 40 years
33
Box 2: Australian investment successes
Following are two examples of Australian investment successes in China, which exemplify the diversity of our investment and expertise.
Rubicon Water
Rubicon Water improves the productivity of the world’s farmers in an environmentally sustainable way. They do this by delivering advanced technology to managers of open channel irrigation networks that enables them to operate and manage their water resources at high levels of efficiency and control.
Rubicon Water is the only company in the world designing and manufacturing technology specifically for gravity-fed irrigation management, and conducts ongoing research with the University of Melbourne. The technology, called Total Channel Control® (TCC) automates and optimises existing irrigation channel infrastructure using solar-powered water control gates, ultrasonic flow meters and radio communications networks and sophisticated control software.
It entered China in 2009, seeing market potential given the Chinese Government’s ambitious targets to improve irrigation productivity and water efficiency (currently it is about 50 per cent) and strengthen agricultural water management.
After three years, TCC technology is now installed in six irrigation districts in four provinces. The China Irrigation and Drainage Development Center has been impressed with the results of these projects and has recommended that Rubicon Water be used by large irrigation districts to modernize their infrastructure and achieve the government’s information transformation and water savings goals.
Cochlear
The Cochlear bionic ear implant is the invention of Professor Graeme Clark, Laureate Professor of Otolaryngology and Director of the Bionic Ear Institute at the University of Melbourne. The implant can enable a profoundly deaf person to achieve almost normal hearing.
Cochlear entered the Chinese market in 1995 and has established itself in Beijing and Shanghai. There are currently more than 11,500 Cochlear implant recipients in China, and around 70 medical centres capable of undertaking Cochlear implant surgery.
Cochlear has been delivering ‘Auditory-Verbal Therapy’ to Chinese trainers together with the China Rehabilitation Research Centre for Deaf Children and sponsored some young trainers from all over China to attend the course in Beijing. They set up two Cochlear Education and Training Centres to train the teachers from specialised schools for the deaf and the parents of the young recipients.
In April 2012, Cochlear won a national welfare project tender which ordered 2,823 cochlear implants worth $28 million in total, marking a milestone for their business development in China.

Australia-China: not just 40 years
34
Box 2: Australian investment successes (continued)
CSL
CSL Behring is a global leader biopharmaceutical company that researches, develops and manufactures speciality life-saving and life-enhancing therapies for people with primary immune deficiencies, bleeding disorders, hereditary angioedema and inherited respiratory disease. CSL products are also used to prevent haemolytic disease in newborns, speed recovery from heart surgery, prevent infection in people undergoing solid organ transplant and help victims of shock and burns.
CSL’s China operation is headquartered in Shanghai with regional offices in Beijing, Guangzhou, Chengdu and Wuhan that employ over 120 staff. The China operations team includes sales and marketing, finance, human resources, regulatory, quality, medical and supply chain professionals and is supported by Cardinal Healthcare China — also based in Shanghai — a major third party Healthcare logistics company that manage CSL’s specialist national product distribution.
CSL Behring has been supplying the China healthcare sector with speciality products for over 25 years and is the leading supplier of serum albumin to clinicians and patients within the National China Hospital network (albumin is the main protein of human blood plasma and medically prescribed in the critical care setting).
CSL Behring’s continuing priority is to develop innovative therapies and patient programs that make a real and lasting difference to the lives of people in China and around the world.
Australian — and other foreign — investment in China will likely increase as China continues to open up its economy to foreign investment.
Looking ahead
The economic relationship between our two countries is expected to continue to grow. Most forecasters, including Treasury, expect continuing strong economic growth in China in the years to come. However, a number of commentators have raised doubts regarding the sustainability of the Chinese economic growth ‘miracle’ going forward, pointing to the slowdown in Chinese economic growth since the beginning of the year as evidence that the ‘miracle’ is coming to an end. Whilst the pace of economic growth has moderated, this is only partly due to structural factors. The weak external environment has been a more important factor, amid the ongoing fallout from the global financial crisis and the European sovereign debt crisis.
The consensus view is that China still has significant potential to grow, particularly through the ongoing process of ‘catch-up’, as China’s overall urbanisation and productivity levels still lag significantly behind those of advanced economies. It must be remembered though that China remains an emerging economy and fluctuations around this underlying potential are to be expected, due to the emergence of

Australia-China: not just 40 years
35
imbalances and policy missteps. However, these fluctuations are likely to be around a solid trend growth line.
Within this decade, the International Monetary Fund (2012) projects China to overtake the United States to become the largest economy in the world on a real purchasing power parity basis (although on a market exchange basis, this will occur much later). The Australia in the Asian Century White Paper projects the Chinese economy to grow at an annual average growth rate of 7 per cent from 2012 to 2025, a pace that is consistent with projections made by a number of other institutions and private sector forecasters.4
Although this represents a slowdown from the stellar ‘double-digit’ growth that China has experienced over the past 30 years, given China’s stage of development and the size of its economy, an annual average growth rate of 7 per cent is still very impressive. Moreover, this robust pace of growth appears to be much more sustainable than the continuation of the double-digit pace of past decades. Even at this more moderate rate of growth, China continues to be one of the fastest growing economies in the world and remains a key contributor to global economic growth.
Despite such rapid economic growth, by 2025, China’s GDP per capita is still expected to be significantly below US levels (40 per cent) and advanced Asian economies such as Japan and Korea, strengthening the argument that there is still some way to go in China’s catch-up process (Chart 12).
4 For example, the joint report China 2030 by the World Bank and China’s State Council
Development Research Centre (2012) projects annual average growth of 8.6 per cent over 2011-2015, slowing to 5.9 per cent over 2021-2025, which implies an annual average growth rate of around 7 per cent over 2012-2025.

Australia-China: not just 40 years
36
Chart 13: China’s GPP per capita relative to the US
0
20
40
60
80
100
0
20
40
60
80
100
1950 1965 1980 1995 2010 2025
India
China
Japan
Korea
Per centPer cent
Source: Conference Board (2012), International Monetary Fund (2012), Maddison (2010) and Treasury5.
Amongst Chinese authorities, there is a growing awareness that such economic growth projections cannot be realised under the current economic growth model (which was appropriate in the initial stages of development), acknowledging that the economy is unbalanced and unsustainable.6
The structural transformation that is underway in China will change the nature of Australian opportunities in China (Garnaut, 2011). A transition to a less investment-reliant and more environmentally sustainable growth model will reduce the growth of China’s resource demand over coming decades. Australia is expected to remain a significant supplier of resources to China, particularly of iron ore, because of our position as a low-cost source. However, unless China’s resource demand climbs unexpectedly, as it did in the previous decade (or we see the rapid emergence of India (Garnaut, 2012)), the global expansion in low-cost supply that is currently underway and more moderate demand growth in China is expected to reduce the likelihood of commodity prices returning to the record levels experienced in recent years.
Beyond resources, there is also likely to be increasing demand for Australian exports in the services sector and in high-end food, beverages and leisure from the increasing size of the middle class in China, as incomes rise — Kharas and Gertz (2010) estimate that by 2021 there could be over 670 million middle class consumers, compared to 150 million today.
5 Projections are based on the methodology of Au-Yeung, Kouparitsas, Luu and Sharma, 2013
(forthcoming) 6 Chinese Premier Wen Jiaobao said China was still in the process of industrialisation and
urbanisation, and faced serious problems from unbalanced, uncoordinated and unsustainable development (Xinhua, 2012).

Australia-China: not just 40 years
37
China is already Australia’s largest services market, with tourism and education dominating our exports to date. With further economic liberalisation in China, financial and other professional services such as legal and accounting services can also look forward to expanding their presence and operations in China. Many other opportunities lie ahead in areas such as clean energy and environmental services, with China’s 12th Five Year Programme emphasising sustainability and a reduction in energy intensity per unit of GDP. Health services are another potential growth area.
However, as pointed out by Parkinson (2012), although there are significant opportunities arising from the rising middle class in China and from the transformation the economy is undertaking, there are also significant challenges. While Australia had an obvious comparative advantage in the natural resources sector, allowing Australia to readily benefit from the rise of China, our services sector holds no such obvious advantage for China’s middle classes. In an increasingly competitive and globalised world, Australia will be competing with the rest of the world to continue the deepening of our economic relationship with China. But with the right policy settings, we have every reason to be confident that Australia will meet the challenges.

Australia-China: not just 40 years
38
References
Au-Yeung, W, Kouparitsas, M, Luu, N, and Sharma, D, 2013 (forthcoming), Long-term international GDP projections, Treasury Working Paper, Canberra.
Australia Bureau of Statistics (ABS), 2012, Overseas Arrivals and Departures, cat. no. 3401.0, October 2012, Canberra.
ABS, 2011, Australian Social Trends, December 2011, cat. no. 4102.0, Canberra.
ABS, Annual Statement of the Trade of the Commonwealth of Australia with the United Kingdom, British Possessions, and Foreign Countries and of the Customs and Exercise Revenue, cat. no.5409.0, various years accessed, Sydney.
ABS, Australian Statistics of Overseas Imports and Exports and Customs and Excise Revenue, cat. no.5409.0, various years accessed, Melbourne.
ABS, Overseas Trade — Australian Statistics of Overseas Imports and Exports and Customs and Excise Revenue, cat. no. 5409.0, various years accessed, Canberra.
ABS, Overseas Trade and Customs and Excise Revenue, cat. no. 5409.0, various years accessed, Canberra.
ABS, Overseas Trade, cat. no. 5409.0, various years accessed, Canberra.
Australian Chamber of Commerce, 2012, Australian Financial Services Business in China, Australian Chambers of Commerce (China).
Australian Education International, 2012, Monthly Summary of International Student Enrolments Data, October, Australian Education International.
Australian Government, 2012, Australia in the Asian Century White Paper, Canberra.
Australian National University and China Institute of Contemporary International Relations (ANU-CICIR), 2012, Australia and China — A Joint Report on the Bilateral Relationship, Canberra.
Cai, P Yuan, 2012, The media and narrative and public debate, East Asia Forum Quarterly, vol. 4, no.2, April-June 2012.
Caulfield, R, 2011, How Australian architects can succeed in China, 8 August 2011, viewed at 20 November 2012 (see http://architectureau.com/articles/how-australian-architects-can-succeed-in-china/).

Australia-China: not just 40 years
39
Coates, B, Horton, D and McNamee, L, 2012, China: prospects for ‘export-driven’ growth, Economic roundup, issue 4, The Treasury, Canberra.
Conference Board, 2012, The Conference Board total economy database™, January 2012, The Conference Board, Inc., www.conference-board.org.
Department of Foreign Affairs and Trade (DFAT), 2005, Education without Borders — International Trade in Education, Department of Foreign Affairs and Trade, Canberra.
DFAT, 2011, DFAT Trade in Primary and Manufactured Products, Canberra.
DFAT, 2012, China Fact Sheet, as at June 2012, Canberra (see http://www.dfat.gov.au/geo/fs/chin.pdf).
DFAT, 2012, DFAT STARS database, based on UN Comtrade data and ABS Cat No 5368.0, August 2012 data.
Department of Immigration and Citizenship, Student Visa Grants for 2002-03 Program Year, Department of Immigration and Citizenship, Canberra, (see http://www.immi.gov.au/media/statistics/study/_pdf/2002-03-offshore-onshore-grants.pdf).
Department of Immigration and Citizenship, 2012, Student visa program trends: 2005-06 to 2011-12, Department of Immigration and Citizenship, Canberra (see http://www.immi.gov.au/media/statistics/study/_pdf/student-visa-program-trends-2011-12.pdf).
Department of Resources, Energy and Tourism, 2012, Tourism Research Australia, Forecast 2012 Issue 1, Department of Resources, Energy and Tourism, Canberra (see www.ret.gov.au/tourism/Documents/tra/Forecasts/2012/2012ForecastIssue1.pdf).
Evans, C, 2012, Speech to Group of Eight — China Nine University Presidents’ Forum, 2 August 2012, Sydney.
Foley, M, 2012, Rio partners Chinese truck supplier, threatens OEM stranglehold, Australian Journal of Mining (see http://www.theajmonline.com.au/mining_news/news/2012/july/july-12-2012/rio-partners-chinese-truck-supplier-threatens-oem-stranglehold).
Garnaut, R, 2011, Australian opportunities through the Chinese structural transformation, Australian Economic Review, vol. 44, issue 4, pp 437-45.
Garnaut, R, 2012, The contemporary China resources boom, The Australian Journal of Agricultural and Resource Economics, vol. 26, issue 2, pp 222-43.

Australia-China: not just 40 years
40
Hall, G and Hooper, K, 2008, Australia’s exports of education services, Reserve Bank of Australia Bulletin, June 2008, Reserve Bank of Australia, Sydney.
Henry, K, 2012, Comments on foreign investment in Australia, Remarks at ANU Global Investment Conference, 5 September 2012.
Hurst, L, Yuan, P and Findlay, C, 2012, Chinese direct investment in Australia: public reaction, policy response, investor adaption, EABER Working Paper Series, No 81, October 2012.
Industrial Bank and Hurun Report, 2012, The Chinese luxury consumer white paper, Industrial Bank Co Ltd and Hurun Report, Beijing.
International Monetary Fund, 2012, World Economic Outlook Database, October 2012, Washington.
Keller, W, Li, B and C H Shiue, 2011, China’s foreign trade: Perspectives from the past 150 years, The World Economy, vol. 34, pp 853-92.
Kharas, H and Gertz, G, 2010, The new global middle class: A cross-over from West to East, in C Li (ed.), China’s emerging middle class: beyond economic transformation, Brookings Institution Press, Washington, DC.
Kong, V, McKissack, A and Zhang, D, 2012, China in a new period of transition, Treasury Economic Roundup, Issue 4, Canberra.
Larum, J and Qian, J, 2012, A long march: the Australia-China investment relationship, Australia China Business Council, October 2012.
Maddison, A, 2010, Statistics on world population, GDP and per capita GDP, 1-2008 AD, Historical statistics, Groningen Growth and Development Centre (see www.ggdc.net).
Ministry of Education, People’s Republic of China (information provided November 2012).
National Bureau of Statistics of China, 2011, China Statistical Yearbook 2011, China Statistics Press (see http://www.stats.gov.cn/tjsj/ndsj/2011/indexeh.htm).
Organisation for Economic Co-operation and Development, 2012, Education at a Glance 2012: OECD Indicators, OECD Publishing, September 2012.
Parkinson, M, 2012, Challenges and opportunities for the Australian economy, Speech to the John Curtin Institute of Public Policy Breakfast Forum, 5 October 2012.
Australia-China: not just 40 years
41
Rudd, K, 2011, 40 Years: The Australia-China Relationship, Speech to the Australia-China Forum, Canberra, 2 November 2011.
Spearrit, P, 1996, Hooker, Leslie Joseph (1903-1976) in The Australian Dictionary of Biography (see http://adb.anu.edu.au/biography/hooker-sir-leslie-joseph-10537).
Tourism Australia, 2012, China Market Profile 2012 (see www.tourism.australia.com/en-au/markets/North-Asia.aspx).
United Nations, 2012, World Urbanization Prospects, 2011 Revisions, August 2012, New York.
Whitlam, GE, 2010, The Road to China, Cosmos Books, Hong Kong.
World Bank and Development Research Centre of the State Council, the People’s Republic of China, 2012, China 2030: Building a modern, harmonious and creative high-income society, World Bank, Washington, DC.
World Trade Organisation, statistical database, viewed 22 November 2012 (see http://stat.wto.org/StatisticalProgram/WSDBStatProgramHome.aspx?Language=E).
Xinhua, 2012, Chinese premier says China committed to sustainable growth, 25 April 2012 (see english.xinhuanet.com).
Yu, C Sen, 2012, Sino-Australian economic relations: a general review, in Reilly, J and Jingdong, Y (eds), Australia and China at 40, UNSW Press, Sydney.


43
China in a new period of transition Veasna Kong, Adam McKissack and Dong Zhang1
China’s economic transformation since 1978 has been remarkable. At the commencement of the reform period, China’s per capita GDP was lower than India’s, Pakistan’s, Indonesia’s, and Thailand’s, and about 3 per cent of that of the US. Today, it is multiples above Indian, Pakistani and Indonesian levels, and equivalent to 20 per cent of that of the US. Through a process of reform and opening-up, the utilisation of a vast endowment of labour, the rapid accumulation of capital and technological catch-up, China has been transformed from a rural agrarian economy to an urban industrial force.
However, the structural transformations associated with industrialisation are giving rise to economic challenges and pressure for policy change. Following over three decades of rapid growth, China has reached a period where a heavy reliance on investment and exports has led to the build-up of a number of economic, social, and environmental challenges that need to be addressed. While there remains potential for further impressive growth, the favourable conditions that China has benefited from in the past are, in many respects, reaching their ‘use by date’. This presents a range of policy challenges for China’s incoming leadership.
1 The authors are from the International Economy Division, the Australian Treasury and
Treasury’s Beijing Post. This article has benefited from comments and suggestions provided by
Barry Sterland, Jason McDonald, Owen Freestone, Paul Hubbard, Samuel Hurley and
Dhruv Sharma. The views in this article are those of the authors and not necessarily those of
the Australian Treasury.

China in a new period of transition
44
Introduction
It was over thirty years ago now, under the stewardship of Deng Xiaoping and his policy of reform and opening-up, that China embarked on its path to economic modernisation. While the principal factors behind China’s success are not unique compared with other countries, what makes China’s case special is the sheer size and pace at which this transformation has taken place. In the decade to 1990, China contributed an average of 10 per cent to world growth; between 1991 and 2000, it contributed almost one fifth; and in the decade to 2010, the contribution increased to around one quarter. In the process China has lifted 600 million people out of poverty and transformed city skylines across the country. Based on current trends, China could overtake the US as the world’s largest economy by 2020.
China’s economic transformation since 1978 has been remarkable. A relaxation of state controls and the creation of market incentives allowed the private sector to prosper and encouraged improvements in resource allocation and overall economic efficiency. Policies encouraging foreign trade and investment have allowed China to achieve significant gains from its greater integration with the world economy and international competiveness. A more open economy allowed China to exploit its comparative advantages, including favourable demographics and a vast pool of surplus rural labour. In addition, accession to the WTO, and an active state capable of quickly mobilising resources have helped enable China to grow at an unprecedented rate.
Now at a more mature phase of its industrialisation, and amid growing structural challenges in the economy, it is widely acknowledged that China needs to adapt its growth model if it is to sustain a rapid pace of development. This paper discusses how China’s growth model has transformed the economy over the past 30 years, the acknowledged problems with the current model, and some of the key policy challenges facing the economy as China ushers in a new leadership and undergoes a new economic transition.
Characteristics of China’s growth — past and present
China’s economic development since the establishment of the People’s Republic of China in 1949 can be characterised by two distinct periods of performance — the pre-reform period before 1978, and the reform period post 1978.
During the pre-reform period, China pursued an autarchic socialist command economy system based on the Soviet model, with a strong focus on government directed resource allocation, development of heavy industry, large state-run enterprise and price controls. This period was a tumultuous time for China, including episodes of economic or political turmoil such as the Great Leap Forward (1958-60) and Cultural Revolution (1966-76). It was not until the commencement of economic reforms in the

China in a new period of transition
45
late 1970s, under the leadership of Deng Xiaoping, that economic growth gathered momentum. Decentralisation and a more reformist policy stance have improved the efficiency of the economy. The state’s control of the economy was loosened, market incentives were created, private enterprise was encouraged, protectionist policies were relaxed, and the economy was opened to greater foreign trade and investment. These strategies laid the groundwork for China’s rapid growth, enabling China to exploit its comparative advantages and harness the opportunities flowing from a more open economy.
Convergence and catch-up
At the commencement of the reform period, China was a poor, insular economy, with per capita GDP lower than India’s and only 3 per cent of that of the US. Since 1978, China’s economy has grown by an annual average rate of 10 per cent, doubling in size around every eight years to be 22 times larger than it was 1978. This exceptional performance has propelled China to three decades of rapid economic convergence or ‘catch-up’, a process in which relatively fast per capita income growth is experienced in poorer economies, resulting in the narrowing of income disparities with high-income economies.
Chart 1: China’s convergence Panel A: GDP per capita
0
20
40
60
80
100
0
20
40
60
80
100
1950 1960 1970 1980 1990 2000 2010
Per cent of US Per cent of US
Japan
Hong Kong
Taiw an
South Korea
Malaysia
ChinaIndia
Source: The Conference Board Total Economy Database and authors. Note: GDP per capita in purchasing power parity (PPP) terms.
Panel B: Evolution of labour productivity relative to the US
0
100
200
300
400
500
600
0
100
200
300
400
500
600
1960 1970 1980 1990 2000 2010
South Korea
India
Japan
China
Index (1960=100) Index (1960=100)
Source: The Conference Board Total Economy Database and authors.
Over the past few decades, a number of economies have demonstrated economic convergence, including Japan, Hong Kong, Taiwan and South Korea (Chart 1, Panel A). While China’s growth performance has been remarkable, China’s economic catch-up is comparable with that experienced in South Korea from the mid-1960s, and Japan from the mid-1950s (Liu and McDonald, 2010). Indeed, the principal factors

China in a new period of transition
46
behind China’s success are similar to those that have previously driven growth elsewhere in East Asia. These include very high rates of physical capital accumulation and mass mobilisation of labour towards industries of comparative advantage, augmented by improvements in human capital, export-led growth through the production of low cost manufactured goods for international markets, and the process of technological catch-up.
These developments have seen labour productivity — a key driver of growth of incomes — improve significantly since the commencement of the reform period (Chart 1, Panel B). Labour productivity has risen from around 3 per cent of the US level in 1978 to around 16 per cent in 2011. This is equivalent to a nine-fold increase in China’s labour productivity between 1978 and 2011, more than any other economy in the world.
Convergence is partly determined by a country’s ability to take advantage of the ideas and knowledge possessed by higher income economies. During the pre-reform period, China’s ability to both import and adopt new technology was limited. This reflected China’s relative isolation from western economies as well as an institutional environment hostile to markets. The pre-reform period was thus a period of technological divergence and during the early stages of reform, industrial equipment was up to 30 years behind international standards (World Bank 1983, cited in Chai 1998).
Box 1. Accounting for China’s growth
While many studies have attempted to explain China’s past growth experience, whether growth has mainly been driven by productivity gains or factor accumulation remains the subject of considerable debate.
Typically utilising the standard growth accounting framework, studies have attempted to decompose GDP growth into its factor inputs, namely the contributions from labour, capital and ‘total factor productivity’ (TFP). TFP is a measure that captures many residual components, among which are technological progress and efficiency in the use of inputs.
Wu (2011) categorises China growth accounting studies into two camps, either representing China ‘bulls’ or ‘bears’. The bulls, typified by Bosworth and Collins (2008), attribute over two fifths of China’s reform period growth to TFP, equivalent to annual TFP growth of 3.6 per cent during 1978-2004. According to Bosworth and Collins (2008, p.53, 64), the large gains from TFP sets China ‘apart from the East Asian miracle of the 1970s and 1980s, which was more heavily based on investment in physical capital’. They conclude that the ‘supply-side prospects for continued rapid growth in China … in terms of labor, physical capital and reallocation across sectors, are very good’.
Wu (2011) is less positive about China’s productivity performance. After accounting

China in a new period of transition
47
The relative backwardness of China’s economy prior to the reform period, and China’s ability to exploit this, enabled China to absorb technologies and know-how more quickly and at a lower cost than those economies at the technological frontier (Lin, 2011). This ability to adopt higher quality technology and accumulate capital, combined with significant increases in educational attainment, favourable demographics, and vastly improved labour force utilisation, have enabled China to narrow its income disparity with high-income economies.
for data deficiencies, Wu (2011) finds that the contribution from TFP to growth between 1978-2008 has generally been low. According to his study, growth in the reform period was mainly attributed to high levels of physical capital accumulation, which implies China could be another example of the so called ‘East Asian miracle’ (Krugman, 1994).
Chart 1: Growth accounts Panel A: Bosworth and Collins
0
2
4
6
8
10
12
0
2
4
6
8
10
12
78-04 78-93 93-04
TFPPhysical capitalEmploymentEducation
Percentage points Percentage points
Source: Bosworth and Collins, 2008.
Panel B: Wu
-4
-2
0
2
4
6
8
10
-2
0
2
4
6
8
10
1978-84 1984-91 1991-01 2001-08
Labour quantityHuman capitalPhysical capitalTFP
Percentage points Percentage points
Source: Wu, 2011.
Studies that fall in-between these two extremes include those by Wang and Yao (2003) and Kuijis (2009), who estimate TFP growth of 2.4 per cent per annum (1978-99) and 3 per cent (1978-94) respectively.
If the bulls are correct, and TFP has been the largest contributor to growth, the expected slowing in factor accumulation does not spell the end of the road for China’s growth model. On the other hand, if China’s growth has been mainly driven by factor accumulation, then China’s growth model of recent decades may have run its course. There are limits to the growth that can be achieved by simply adding capital and labour. Long run growth depends largely on continuous productivity gains — in effect how these inputs are used. As Krugman (1994) argued in the context of the East Asian miracle, growth based on factor accumulation is inherently unsustainable. Instead, China would need a significantly improved TFP performance in order to maintain the momentum of growth as its labour supply growth and capital accumulation inevitably slow.

China in a new period of transition
48
The demographic dividend and reallocation of labour
China’s strong economic performance over the past 30 years has been assisted by favourable demographics, with the working age population growing at a much faster rate than overall population growth. This has given rise to a ‘demographic dividend’, a period associated with a declining birth rate (an important driver of which is the ‘One Child Policy’ introduced in 1978), which has for a period meant a larger working age population relative to young and elderly dependents (the dependency ratio) (Chart 2, Panel B).
Chart 2: Demographic transition Panel A: Working age population
-1.5
-1
-0.5
0
0.5
1
1.5
2
2.5
3
3.5
0
0.2
0.4
0.6
0.8
1
1.2
1950 1975 2000 2025 2050
Billions
Working age population (LHS)
Annual grow th (RHS)
Per cent, yoy
Source: UN population statistics and authors. Note: working age is 15-64.
Panel B: Dependency ratios
0
10
20
30
40
50
60
70
80
0
10
20
30
40
50
60
70
80
1950 1975 2000 2025 2050
RatioRatio
Dependency ratio
Child dependency ratio
Old age dependency ratio
Source: UN population statistics and authors. Note: old age 65+, child 0-14
China has benefitted from the demographic dividend through a number of channels. Firstly relatively fast growth in the working age population, which according to the UN, has increased from 550 million 1978 to 980 million in 2011, has made available a large labour supply to help drive the industrialisation process. Secondly, with a greater capacity to save than their young and elderly dependents (ADB, 2011), the large and growing working age population has contributed to the rise in savings, which has helped to finance investment and capital accumulation, and in turn, economic growth. Thirdly, the decline in the young age dependency ratio is also likely to have assisted in improving human capital, as fewer child dependents allows for greater investment in each child (Bloom, Canning and Sevilla, 2001). All things being equal, with a policy environment able to take advantage of the demographic dividend, a rising working age share of the population has helped China to achieve rapid GDP growth.
China’s demographic dividend has also coincided with the large scale movement of rural surplus labour from the low productivity agricultural sector to high productivity industrial and service sectors. At the commencement of the reform period, China had

China in a new period of transition
49
significant untapped potential in labour-intensive industries, with about 70 per cent of people employed working in the agricultural sector. With much of the agricultural labour force underemployed, large productivity gains were possible from the mobilisation of rural labour to secondary and tertiary industries (Chart 3) (Garnaut and Huang, 2006).
Chart 3: Labour shares by sector
0
20
40
60
80
100
0
20
40
60
80
100
1952 1960 1968 1976 1984 1992 2000 2008
Primary Secondary Tertiary
Per cent of total employment Per cent of total employment
Source: CEIC China database and authors.
From the mid-1980s, rural workers began to migrate en masse to urban centres for employment in manufacturing, construction and service industries as residency restrictions were relaxed and the economy and private sector began to gain momentum, particularly in coastal areas. By 1993, the number of rural migrant workers increased to over 60 million, up from around 30 million in 1989 (Shi, 2006). Following a deceleration in rural-urban migration in the late 1990s, due to state owned enterprise (SOE) restructuring, the Asian Financial Crisis, and a tightening of administrative restrictions on rural migrants, rural-urban migration picked up after accession to the WTO in 2001, with the migrant workforce roughly doubling to reach around 150 million in 2010 (Rush, 2011).
However, a demographic profile that was once supportive of growth will increasingly become a burden on the economy. The working age population is expected to peak around 2016 and slowly decline thereafter, reflecting the effect of the One Child Policy and ageing working age population (Chart 2, Panel A). As the child dependency ratio stabilises at lower levels in coming years, the dominant factor influencing the dependency ratio will be the ageing population, with the proportion of aged people expected to grow rapidly in coming years. According to UN data, in 1978, 5 per cent of the population was aged 65 or over. This reached 8 per cent in 2011, and is expected to rise to 12 per cent by 2020, equivalent to an increase of around 50 million people and growth of around 50 per cent. In contrast, the working age population is expected to

China in a new period of transition
50
increase by around 12 million people, or just 1 per cent between 2011-2020. This trend, which will continue to alter China’s demographic profile in coming years, is expected to be among the most dramatic demographic transitions ever experienced in history (World Bank, 2012). This has led to suggestions that China will ‘grow old before it grows rich’. As the population ages, demand for health and social welfare will rise, posing challenges to social and fiscal policy. Furthermore, an ageing population is likely to reduce household savings, a significant source of investment funds.
According to Garnaut and Huang (2006, p. 18), ‘development in China was broadly consistent with the insights from the Lewis model during the first 25 years of China’s economic reform’. The Lewis model (Lewis, 1954) postulates that during the early stages of industrialisation an economy benefits from a period of economic growth with virtually no rise in real wages because of the surplus supply of rural labour. With the marginal productivity of the surplus rural labour below the prevailing subsistence income level, this surplus supply of rural labour helps to develop the modern sector (manufacturing and services) by suppressing wages. This contributes to high returns on capital, rapid growth in the modern sector and therefore economic growth. However, at some point, a Lewis Turning Point (LTP) (or more realistically a ‘turning period’) is reached when the supply of surplus rural labour is fully absorbed by the modern sector, placing generalised upward real wage pressure on the economy.
Whether China has reached the LTP remains the subject of much debate. Despite the uncertainty surrounding the exact timing of China’s LTP, it is apparent that the forces driving China towards the LTP will continue to build-up, which will have a number of implications for the development of the economy. During the LTP, profits are squeezed, lowering corporate savings and investment as the benefits to China of cheap rural labour diminish. This combination of lower profits and savings is likely to see investment slow, leading to slower growth in the absence of offsetting productivity gains. As real wages rise further, households’ share of total income is likely to rise. The combination of lower corporate savings, higher real wages and reduced international competiveness in some markets will increase consumption and lower the tendency for China to have current account surpluses. Moreover, income inequality could narrow, and comparative advantages in labour intensive industries are likely to dissipate, necessitating a shift to more innovative and higher value added industries (Garnaut, 2010). China will thus need to boost productivity in order to maintain the momentum of growth.
Integration in world trade
A defining feature of China’s growth performance has been the expansion of its international trade and integration with global markets since 1978. The economic modernisation instigated in 1978 saw a change in attitude towards international trade. Adopting an ‘opening-up’ policy, China followed the East Asian export-led growth

China in a new period of transition
51
model, tapping into growing world export markets while at the same time, taking advantage of the know-how and technological advances forged by high-income economies before it.
China’s exports have risen rapidly over the past 30 years, and over the past 15 years alone — aided by accession to the WTO in 2001 — China’s exports have risen more than tenfold, with the average annual rate of growth in nominal merchandise exports between 2002 and 2008 almost doubling that of the 1990s (Coates, Horton and McNamee, 2012). This increase has seen China become the world’s largest exporter, surpassing both the United States and Germany to now account for over 10 per cent of world exports (Chart 4, Panel B).
Chart 4: China emergence as the world’s factory
A number of factors in addition to the abundance of low cost labour have formed the basis of China’s international competitiveness in manufacturing exports. While China has liberalised most product markets, forcing firms to compete directly in domestic markets, China continues to provide subsidies in the form of artificially low prices for key factor inputs, such as land, labour, capital, energy and the environment. These government interventions — products of China’s push to promote GDP growth — have had the effect of lowering production costs, elevating profits and returns on investment, and have created incentives in favour of production in the industrial sector.
China’s greater openness to international trade and investment has helped to develop the economy through a number of key channels. First, access to growing international markets for cheap, labour-intensive manufactured goods enabled China to exploit a
Panel A: The world’s de-facto factory — manufacturing output
0
0.5
1
1.5
2
0
0.5
1
1.5
2
1978 1990 2000 2010
UK
China
Germany
Japan
USA
USD trillions USD trillions
Source: UN Statistics Division.
Panel B: The world’s largest source of merchandise exports
0
2
4
6
8
10
12
14
0
2
4
6
8
10
12
14
1978 1986 1994 2002 2010
USA
Per cent of w orld
Germany
Japan
UK
South Korea
China
Per cent of w orld
Source: WTO statistics database and authors.

China in a new period of transition
52
significant comparative advantage that had previously been idle. It has also encouraged the large scale reallocation of labour from low-productivity agriculture into high productivity industrial sector. Second, a more open economy has enabled China to absorb advanced foreign technology and know-how, thereby improving productivity. And third, a more open economy has introduced more competition, promoting efficiency and innovation (Woo, 1997).
Investment-led growth
High levels of investment have been another feature of China’s growth performance over the past three decades (Chart 5, Panel A). China commenced the reform period with relatively low capital, allowing for large returns to investment and productivity gains over the reform period simply through adding capital to the economy. Kuijis and Wang (2005) estimate that growth in the capital stock, which has averaged 10 per cent per year between 1978 and 2004, has contributed more than half of GDP growth. Between 1993 and 2004, the contribution of capital accumulation to GDP growth is estimated to have been even higher at 62 per cent, although estimates vary considerably (see Box 1).
Chart 5: Investment Panel A: Investment shares of GDP
0
10
20
30
40
50
60
0
10
20
30
40
50
60
1982 1986 1990 1994 1998 2002 2006 2010
Per cent of GDP Per cent of GDP
China
ASEAN-5 Japan
NIEs
Source: IMF WEO, October 2012. Note: ASEAN-5 comprise of Indonesia, Thailand, Malaysia, Philippines and Vietnam. NIEs comprise of South Korea, Hong Kong, Taiwan and Singapore. Investment here refers to gross capital formation.
Panel B: Gross saving by sector
-10
0
10
20
30
40
50
60
-10
0
10
20
30
40
50
60
1992 1997 2002 2007
HouseholdCorporateGovernment
Per cent of GDP Per cent of GDP
Source: CEIC China database and authors.
In the first decade of the reform period, investment (gross fixed capital formation) averaged around 28 per cent of GDP. However, investment’s share of GDP has since increased consistently, averaging almost 40 per cent in the decade to 2010 to stand at 46 per cent in 2011, above the historical peaks experienced in Japan (37 per cent, 1973), South Korea (38 per cent, 1991) and Thailand (42 per cent, 1991). While high, the

China in a new period of transition
53
significant rise in investment’s share of GDP is an experience largely typical for an emerging economy, reflecting the low initial capital stock and large returns to investment (Hubbard, Hurley and Sharma, 2012).
China’s extraordinary investment growth over the past three decades has been supported by government policies that have favoured investment and the industrial sector. Capital has been channelled on favourable terms from savers to large enterprises and SOEs, aiding capital accumulation during the industrialisation process. Furthermore, reforms to property rights allowing private housing in the late 1990s and an incentive structure that encourages local governments to invest heavily in search of rapid economic growth has also contributed to high levels of investment in China.
Another factor enabling China to invest to an unprecedented scale is its vast stock of savings, which is high by international standards and has grown considerably over the past few decades. Since the 1980s, saving as a share of GDP has risen from less than 40 per cent to about 50 per cent in 2011, outsizing investment for the past 18 years. The rise in saving has been driven by all three sectors of the economy — corporate, household and government (Chart 5, Panel B). The household sector is China’s largest source of saving, accounting for on average almost half of China’s national savings since 1992. However, contrary to some perceptions, corporate saving has accounted for most of the increase in China’s national savings since 1992.
A new period of transition
China’s current growth model, underpinned by high savings and low factor prices that favour investment and exports, has served China well for three decades. However, while China still possesses significant catch-up potential and will continue to benefit from some of the favourable conditions that have driven its economy for some time to come, the benefits are fading, and a number of factors are likely to weigh on growth going forward.
Externally, the favourable conditions that allowed China to yield large gains from ‘opening-up’ appear to be diminishing. In particular, the outlook for the external environment remains highly uncertain, and with domestic wages on the rise, and growing competition from low cost producers elsewhere, China can no longer depend on exports to the extent it has become accustomed to (see Coates, Horton and McNamee, 2012).
While China has invested on an unprecedented scale over the past three decades, China experienced an even larger rise in its savings. Domestically this imbalance manifests as a low household consumption share of GDP, while externally, it implies a widening of the current account surplus. The capital intensive nature of growth — underpinned by distortions that favour industrial production over services and
China in a new period of transition
54
household consumption, alongside suppressed wages as a result of the surplus rural labour and relatively weaker import growth — has contributed to large current account surpluses. But with an external environment unable to absorb the growing production to the extent it used to, the need to adjust to a less export-reliant growth model has intensified.
Domestically, the capital intensive nature of growth has contributed to the low household consumption share of GDP, which has fallen by 11 percentage points between 2000 and 2011. Even though this could stabilise as China exhausts its supply of surplus labour, there remain formidable policy challenges (Hubbard, Hurley and Sharma, 2012).
While there remains significant scope for strong investment growth, there are question marks over the sustainability of current patterns of investment. In a remarkably short period of time, aided by distorted factor prices, China has been able to build the infrastructure that high income economies took many more years to build. In the past five years alone, China has built more high-speed rail lines than exist in France (Broderick, 2012), and in 2011, China built more residential floor space than exists in Australia (Berkelmans and Wang, 2012). However, as China approaches the standard of living enjoyed in high income economies, a continuation of these patterns of investment increasingly comes at the risk of overinvestment and excess capacity, with consequent risks to economic stability.
Furthermore, as China’s economy matures and approaches the technological frontier, the scope for TFP gains from the adoption and transfer of advanced technologies will begin to fade. These challenges are set against a background of the ageing population and looming exhaustion of surplus rural labour, which suggest that China can no longer rely on the ‘easy’ productivity gains associated with favourable demographics and from shifting labour from agriculture to the modern sector.
In the popular debate, China’s transition to a new growth model is often focussed on the need to increase households’ share of income and reduce the current account surplus. In truth, there are a number of challenges arising from China’s extraordinary rise that need to be addressed, including regional economic and social disparities, rising income inequality, and growing stresses on the environment. A central theme, however, is that they are all to varying degrees related to the underlying institutional and economic structure of the economy that have driven China’s export- and investment-led growth. A more sustainable growth model, therefore largely centres on the need to address distortions, incentive structures and rent seeking behaviour that prevent more inclusive and sustainable growth.
Factor market reforms will play a key role in addressing these economic challenges, facilitating China’s transition to a more sustainable growth model. Since the late 1970s,

China in a new period of transition
55
China’s rapid growth has been closely associated with economic reforms that liberalised almost all product markets, providing price signals for consumption and production decisions. However, price controls remain in place on virtually all factors — capital, land, labour, and energy — which distort incentives in the economy. While supporting SOEs, the tradable sector and investment, factor price distortions have contributed to excess capacity in some sectors, environmental degradation and income inequality.
Financial sector reforms
In its China 2030 report, the World Bank (2012, p. 123) describes the Chinese financial system as ‘repressed, unbalanced, costly and potentially unstable’. The current structure of the financial system, characterised by the artificially low cost of capital, state intervention and the dominance of the banking sector in the allocation of capital, has served China well in the past, mobilising high national savings to fund rapid investment, and thereby growth (World Bank, 2012). Indeed, ‘financial repression’2, which can generally be described as the set of financial policies that channel to the state and its interests funds that would otherwise go elsewhere, has been a key element of China’s development strategy over the past three decades (Johansson, 2012). This has enabled China to allocate capital on favourable terms to preferred sectors of the economy. However, there is wide recognition that carefully sequenced financial reforms are required if China is to place growth on a more sustainable footing.
Real deposit rates have been negative for prolonged periods over the past decade, and effectively provide a subsidy from households to the corporate and state sector (Chart 6, Panel A). Rather than being determined by market forces, lending rates are bound by a floor of 30 per cent below the benchmark lending rate, while deposit rates are now capped at 20 per cent above the benchmark deposit rate. The lending rate floor and deposit rate ceiling, which is especially important given the limited alternative savings vehicles, have played a key role in promoting rapid growth through capital accumulation and supporting manufacturing capacity for exports, while securing banks’ profitability with a guaranteed interest margin. China’s banks have benefited from guaranteed net interest margins for many years, peaking at 3.6 per cent during 2006 and 2007, and accounting for at least 70 per cent of banks’ operating income (Chart 6, Panel B). This has contributed to the nearly doubling of after-tax net profits of Chinese banks in the past five years.
This strategy, aided by China’s closed capital account, has worked well in many respects, including helping to ensure a stable funding environment and the stability of the banking system over the past decade. However, the benefits of such a strategy are 2 Reinhart and Sbrancia (2011) define financial repression as consisting of 1. Explicit or indirect control of
interest rates 2. Government ownership of the domestic banks with significant barriers to entry 3. Creation or maintenance of a captive market for government debt and 4. Capital controls.
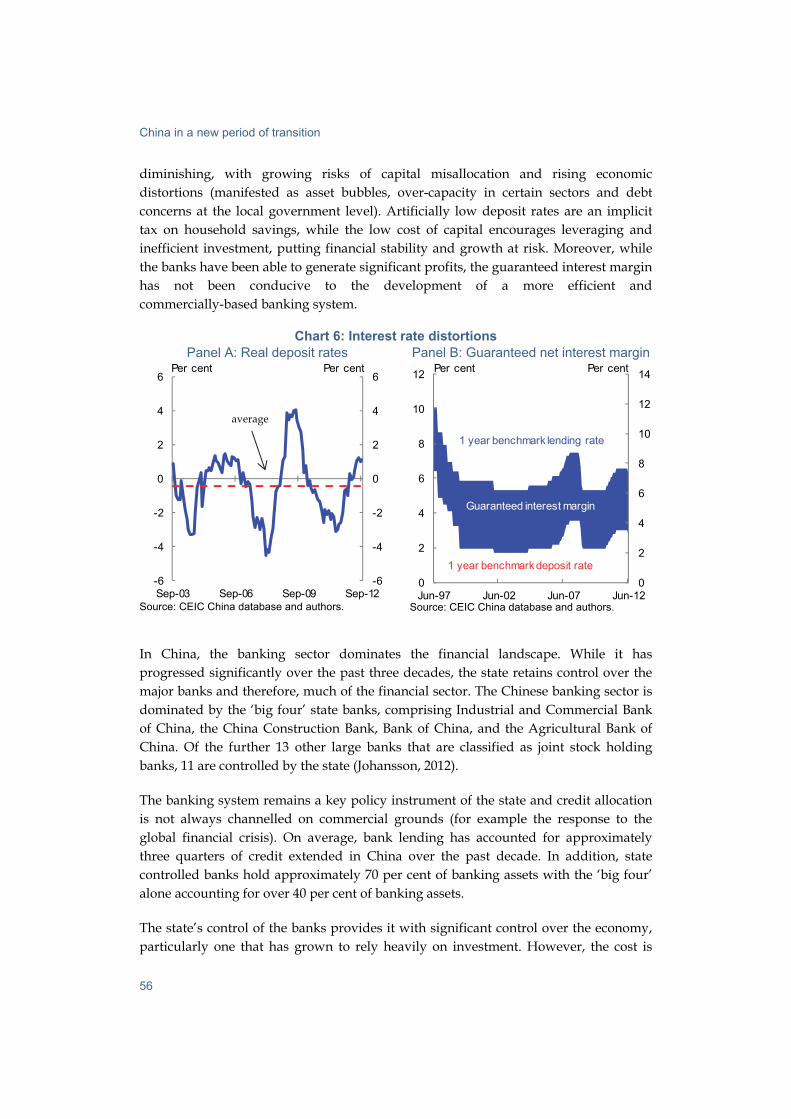
China in a new period of transition
56
diminishing, with growing risks of capital misallocation and rising economic distortions (manifested as asset bubbles, over-capacity in certain sectors and debt concerns at the local government level). Artificially low deposit rates are an implicit tax on household savings, while the low cost of capital encourages leveraging and inefficient investment, putting financial stability and growth at risk. Moreover, while the banks have been able to generate significant profits, the guaranteed interest margin has not been conducive to the development of a more efficient and commercially-based banking system.
Chart 6: Interest rate distortions Panel A: Real deposit rates
-6
-4
-2
0
2
4
6
-6
-4
-2
0
2
4
6
Sep-03 Sep-06 Sep-09 Sep-12
Per centPer cent
Source: CEIC China database and authors.
Panel B: Guaranteed net interest margin
0
2
4
6
8
10
12
14
0
2
4
6
8
10
12
Jun-97 Jun-02 Jun-07 Jun-12
Per centPer cent
1 year benchmark lending rate
1 year benchmark deposit rate
Guaranteed interest margin
Source: CEIC China database and authors.
In China, the banking sector dominates the financial landscape. While it has progressed significantly over the past three decades, the state retains control over the major banks and therefore, much of the financial sector. The Chinese banking sector is dominated by the ‘big four’ state banks, comprising Industrial and Commercial Bank of China, the China Construction Bank, Bank of China, and the Agricultural Bank of China. Of the further 13 other large banks that are classified as joint stock holding banks, 11 are controlled by the state (Johansson, 2012).
The banking system remains a key policy instrument of the state and credit allocation is not always channelled on commercial grounds (for example the response to the global financial crisis). On average, bank lending has accounted for approximately three quarters of credit extended in China over the past decade. In addition, state controlled banks hold approximately 70 per cent of banking assets with the ‘big four’ alone accounting for over 40 per cent of banking assets.
The state’s control of the banks provides it with significant control over the economy, particularly one that has grown to rely heavily on investment. However, the cost is
average

China in a new period of transition
57
that the financial sector does not effectively price risk, leading to problems of capital misallocation. The main beneficiaries of this system are SOEs, local governments, infrastructure developers and other institutional borrowers. The losers are the Chinese savers including households, whose savings effectively subsidise investment funded by the banks. The banks offer returns that are typically low, and often below the rate of inflation, implying that there is a significant financial transfer from households to banks, SOEs and other institutional borrowers.
SOE reforms
The future of SOE reforms is central to China’s transition towards a new model of growth that will rely critically on dynamic modern enterprises that are innovative, efficient, and competitive. Much of the past reforms were aimed at making SOEs market oriented business entities through withdrawing them from competitive industries, encouraging the growth of the non-state sector, and pushing remaining SOEs to improve corporate governance. These reforms, if thoroughly carried out, could lay a solid microeconomic foundation for China’s sustainable growth. However, to date their success has been mixed, highlighting that SOE reforms are still very much a work-in-progress.
On the surface, SOEs have made a turnaround in their financial performance since the late 1990s, when at one stage the whole sector was close to loss making. The average return on equity (ROE) of SOEs rose from below 2 per cent in 1998 to above 15 per cent in 2007. After a two-year fall following the onset of the global financial crisis, the average ROE in 2010 recovered to just below the pre-GFC level.
However, SOEs’ remarkable change of fortune has been significantly aided by preferential policies and regulations in their favour. The state has also created administrative monopolies that restrict entry and competition from non-state firms in a wide range of activities, such as services and industries that it regards as strategically important. As a result, SOEs continue to dominate in electricity, petroleum, aviation, banking and telecommunications industries.
In addition, SOEs continue to receive explicit and implicit state subsidies, including low effective tax rates, low dividend payouts, and little or no royalties on resource extraction. Compared to non-state firms, SOEs are in a much better position to receive subsidies on key inputs such as energy, water, land, and cheap capital from China’s state owned banks.
Protection, subsidies, and preferential treatment have artificially propped up SOE profitability, which, if calculated on the costs of doing businesses by non-state firms, could be much lower or possibly negative. According to an estimate made by Unirule (2011), an independent Chinese think tank, the average real ROE of SOEs from 2001 to

China in a new period of transition
58
2009 is negative if benefits from various preferential policies and fiscal subsidies were stripped from SOEs’ profits, and the real cost of land, resource and capital were included as expenses. Despite numerous advantages for the state sector, ROE of SOEs is much lower than in the private sector. According to the World Bank (2012, p.111), ‘in 2009, the average ROE of non-state firms remained 9.9 percentage points above that of SOEs’.
SOE profits have been largely retained for internal uses. Until very recently, SOEs were not required to distribute any dividends. While this is changing, the payout rates remain low. Not surprisingly, SOEs tend to use their retained profits for investment and internal welfare, which in turn has contributed to inefficiency and resource misallocation. At the heart of the challenge for SOE reforms is the need to transform the relationship between the state and SOEs, to separate the state’s role as a provider of public goods and services from the SOEs’ role as commercial entities responsible for their own profits and losses. Of course, there is also scope to increase the role of the private sector in some sectors to promote competition and new investment.
Politics of reform
At the 18th National Party Congress this year, the Chinese Communist Party held the first phase of the transition to its ‘fifth generation’ of leaders, a transition that will see a comprehensive turnover of the principal figures responsible for China’s economic policies.
While the shape of economic policies under the new leadership remains uncertain, China’s leadership has a growing sense of the economic imperative to undertake further structural reform. The leadership is fully aware that the Party’s survival is dependent on continuing economic and social progress.
Previous economic reform exercises in China have involved the state loosening controls on the economy to create space for the private sector to drive economic growth and employment. For example, Deng’s opening-up of the economy in 1978 and China’s subsequent accession to the WTO in 2001 allowed the non-state sector to grow and exploit business opportunities, including in international trade. The SOE reforms of the 1990s unlocked resources in the economy and opened up domestic markets to greater private sector participation.
Under China’s state capitalism model, the private sector has been allowed to grow within the parameters set by the state, while the state has maintained control over key strategic sectors of the economy. China’s financial system is dominated by the activities of the big, state-owned policy banks. Interest rates are regulated, credit is rationed and banks have been given direction on who they should lend to. SOEs dominate other core sectors, such as communications, energy and resources. These

China in a new period of transition
59
controls are consistent with China’s political model, which retains a central planning ethos.
The ability to direct capital and control strategic sectors of the economy are powerful economic levers, as well as sources of political power. The ability of a central decision-making process to efficiently guide capital in an increasingly large and complex economy is now being called into question, and most of China’s pressing economic reforms involve further expansion of the role of the private sector. This is evident in a number of areas. In respect to the financial sector, there is a recognised need to better price risk and allow commercial considerations to guide the allocation of capital. Continuing state influence in the allocation of capital runs the risk of capital misallocation, mispricing of assets and bad debts.
Similarly, as China seeks to promote new growth drivers, including in the services sector, it needs to allow non-state investment to compete equally with SOEs in these industries.
Of course, letting go of these areas of control to make more room for the market raises a number of difficulties. A significant amount of wealth has been generated in China around the current model, creating strong vested interests. While there would be many winners from reform there would be a powerful group of losers. Moreover, ceding power to the market would lead to a watering down of Party influence.
All countries seeking to take on structural reform face these sorts of issues. There are always groups that benefit from the status quo, and the benefits of reform are often diffuse. But a feature of the Chinese system is that the leadership derives its power more directly from those who stand to lose from a process of further market-oriented reform.
Conclusion
Following three decades of rapid growth, China has reached a period where the build-up of a number of economic, social, and environmental challenges need to be addressed. There is no doubting the potential for further impressive growth in the Chinese economy as China seeks to continue the process of catch up. But the older means of realising these benefits are in many respects approaching their ‘use by date’. The limits of the current growth model are already starting to bite on the Chinese economy, and will become more evident over the next decade. This presents a range of policy challenges for China’s incoming leadership, whose ability to adapt to the new economic landscape will be tested by a range of economic and political obstacles to reform.

China in a new period of transition
60
China has a complex domestic reform agenda ahead if it is to shift to a more sustainable growth model and transition from a middle- to high-income country. It will need to manage the contradiction between market and command elements of the economy, and overcome conflicting interests. Given the complexities that structural change entails, and the serious challenges they pose to both the current economic and political models, China’s leaders will be particularly cautious during the new period of transition.
China has, since the late 1970s, been ‘crossing the river by feeling the stones’, basically an approach of taking reform in small incremental steps. Whether China has enough time to pursue reform at such a pace remains to be seen. Many commentators believe that pressures building up within China’s economy suggest a more urgent case for reform. China’s new leadership faces significant challenges, and its actions in the coming years could prove to be ‘make or break’ for the sustainability of China’s growth model in the decades ahead.

China in a new period of transition
61
References
Asian Development Bank (2011), ‘Asian Development Outlook 2011 Update, Preparing for Demographic Transition’, pp. 35-68, Asian Development Bank, Manila.
Berkelmans, L and Wang, H (2012), ‘Chinese Urban Residential Construction to 2040’, Reserve Bank of Australia, Research discussion paper, 2012-04.
Bloom, E D, Canning, D, Sevilla, J (2001), ‘Economic Growth and the Demographic Transition’, National Bureau of Economic Research, Working paper series, wp8685.
Bosworth, B and Collins, M S, (2008), ‘Accounting for Growth: Comparing China and India’, Journal of Economic Perspectives, Volume 22, Number 1, Winter 2008.
Broderick, F (2012), ‘Is China’s High-Speed Rail System Slowing Down?’, East Asia Forum, http://www.eastasiaforum.org/2012/07/20/is-china-s-high-speed-rail-system-slowing-down/.
Chai, C H J (1998), ‘China: Transition to a Market Economy’, Clarendon Press, Oxford.
Coates, B, Horton, D and McNamee, L (2012), ‘China: Prospects for export-driven growth’, Economic Roundup, Issue 4.
Garnaut, R (2010), ‘Macroeconomic implications of the turning point’, presented at ‘debating the Lewis turning point in China’, Institute of Population and Labor Economics (CASS) and China Center for Economic Research (PKU), Beijing, April 6.
Garnaut, R and Huang, Y (2006), ‘Continued rapid growth and the turning point in China’s economic development’, in Garnaut, R and Song, L (eds), The Turning Point in China’s Economic Development, p. 17, Asia Pacific Press, Canberra.
Hubbard, P, Hurley, S, and Sharma, D (2012), ‘The familiar pattern of Chinese consumption growth’, Economic Roundup, issue 4.
Johansson, A (2012), ‘Financial Repression and China’s Economic Imbalances’, in McKay, H and Song, L (eds), Rebalancing and Sustaining Growth in China, ANU E Press, Canberra.
Kuijis, L (2009), ‘China through 2020 — a Macroeconomic Scenario’, World Bank China, Research working paper, No. 9.
Kuijis, L and Wang, T (2005), ‘China’s Pattern of Growth: Moving to Sustainability and Reducing Inequality’, The World Bank, Policy research paper 3767.

China in a new period of transition
62
Krugman, P (1994), ‘The Myth of Asia’s Miracle’, Foreign Affairs, Volume 73.
Lewis, W A (1954), ‘Economic Development with Unlimited Supplies of Labor’, Manchester School of Economic and Social Studies, Vol. 22.
Lin, Y, J (2011), ‘Demystifying the Chinese Economy’, The World Bank, Cambridge University Press.
Liu, J and McDonald, T (2010), ‘China: growth, urbanisation and mineral resource demand’, Economic Roundup, Issue 2, p. 59.
Park, D and Shin, K (2011), ‘Impact of Population Aging on Asia’s Future Growth’, ADB Economic Working Paper Series, Asian Development Bank.
Reinhart, M C, and Sbrancia B M, ‘The Liquidation of Government Debt’, Peterson Institute for International Economics, Working Paper No. 11-10.
Rush, A (2011), ‘China’s Labour Market’, Reserve Bank of Australia, Bulletin, September 2011.
Shi, L (2008), ‘Rural Migrant Workers in China: Scenario, Challenges and Public Policy’, International Labour Organisation, Working Paper No. 89.
Tianze Report (天 告则报 ) (2011), ‘State-owned enterprises: nature, performance, and reforms’ (国有企 的性业 质、表 与改革现 guoyou qiye de xingzhi, biaoxian yu gaige), http://www.china-review.com/as.asp?ss=yes&author=天 研究所则经济 .
Woo, T, W (1997), ‘Chinese Economic Growth: Sources and Prospects’, in Fouquin, M and Lemoine, F (eds), The Chinese Economy, Economica, London.
World Bank 2012, ‘China 2030: Building a modern, harmonious, and creative high-income society’, The World Bank and Development Research Centre of the State Council, the People’s Republic of China.
Wang, Y and Yao, Y (2003), ‘Sources of China’s economic growth 1952-1999: incorporating human capital accumulation’, China Economic Review, 14/32-52.
Wu, X W (2011), ‘Accounting for China’s Growth in 1952-2008: China’s growth performance debate revisited with a newly constructed data set’, The Research Institute of Economy, Trade and Industry, Discussion paper series 11-E-003.

63
The Familiar Pattern of Chinese Consumption Growth Paul Hubbard, Samuel Hurley and Dhruv Sharma1
Since the beginning of China’s ‘reform and opening up’, high rates of investment spending have dramatically expanded the productive capacity of the Chinese economy, and accommodated the migration of hundreds of millions of rural agricultural labourers to the industrial and services sectors. This has underwritten a sustained boom in Chinese household consumption, even though it has declined as a share of Chinese GDP.
While unique in its magnitude, China appears to be following the same development path of Japan, Korea and Singapore. As the migration of the labour force from agriculture to urban-based industry runs its course, and as higher-income consumers demand more labour-intensive services, household incomes — and with it household consumption — is likely to stabilise as a share of GDP.
1 The authors are from the International Economy Division, the Australian Treasury. This
article has benefited from comments and suggestions provided by Owen Freestone, Dougal Horton, Jason McDonald, Barry Sterland, Hui Yao and Dong Zhang. The views in this article are those of the authors and not necessarily those of the Australian Treasury.

The familiar pattern of Chinese consumption growth
64
Household consumption and investment have both grown very strongly since China’s initial reforms and opening up in the late 1970s. On average, however, investment has grown at a faster rate than consumption, which sees private consumption in China now making up an historically low proportion of GDP.
Against this backdrop, the Chinese authorities are committed to establishing a ‘long-term mechanism for increasing consumer demand’ (Xinhua, 2012) as part of a wide-ranging strategy to transition China’s economy towards a more sustainable growth model as China enters the next stage of its development.
Comparing China with the development experience of other emerging and developed East and Southeast Asian economies, this article shows that a rapid fall in the consumption share of GDP is a typical part of the early stages of their economic development. In line with these previous experiences, the private consumption share of GDP tends to stabilise as per capita incomes reach ‘middle income’ levels.
This paper suggests that China is likely to follow a similar path over the long term. Trends in Chinese consumption are largely explained by changes in household income, which in China is predominantly labour income (Sharma & Yao, forthcoming). As China exhausts its supply of surplus labour we expect households’ share of national income — and the household share of consumption — to gradually rise, even without policy intervention directed to consumers. As part of this, a labour-intensive services sector will continue to grow to meet the demands of increasingly affluent consumers.
This implies that rather than adopting measures explicitly to boost Chinese consumption directly, structural reforms that improve the allocation of labour and capital are the best ways to support household income growth, and therefore, consumption growth, in the long term.
China’s Consumption and Investment Booms
In 1978, only one in five Chinese citizens lived in a city. Rural agriculture employed two thirds of the labour force, but contributed only one-third of GDP.
China’s economic structure today has been radically transformed. Agriculture now employs just a third of the labour force, and accounts for around ten per cent of output. For the first time in China’s history, more Chinese live in cities than in rural areas, with access to higher-productivity employment and higher wages.
Chinese real per capita household consumption expenditure increased more than 10 times over this period, growing by more than 7 per cent annually on average, much higher than any other major economy over this period.

The familiar pattern of Chinese consumption growth
65
But overall household consumption growth was slower in real terms than growth in investment, which grew more than 10 per cent per year on average since 1979 (Chart 1).
Chart 1: Investment and household consumption growth, 1979 — 2011
-5
0
5
10
15
20
25
30
35
-5
0
5
10
15
20
25
30
35
1979 1981 1983 1985 1987 1989 1991 1993 1995 1997 1999 2001 2003 2005 2007 2009 2011
Percentage change Percentage change
Investment
Household consumption
GDP
Source: World Bank Global Development Indicators
Indeed, the shift out of rural agriculture to urban industry could not have been possible without a corresponding increase in investment. That is, the strong growth in consumption depended on the investment boom, which provided greater employment opportunities and higher incomes for China’s labour force, as well as the infrastructure needed to integrate China’s regions into a national economy, and China’s national economy into the global economy. Rapid urbanisation without high investment would have led to ‘mega-slums’ rather than ‘mega-cities’.
Since 1978, investment has generally accounted for at least one third of China’s GDP. In two periods, 1993-1995 and from 2003 to the present, investment as a proportion of GDP was above 40 per cent. Investment growth in 2009 was particularly high, as China enacted a RMB 4 trillion (equivalent to 13 per cent of GDP) stimulus package — focused on infrastructure — which helped stabilise Chinese GDP growth in response to the global financial crisis and the 2008 Sichuan Earthquake. This pushed the investment share to almost half of GDP by 2011, although investment growth has slowed substantially after stimulus was withdrawn.
‘Global imbalances’ and Chinese ‘rebalancing’?
In the years leading up to 2001, China’s high investment levels absorbed most of the country’s savings, meaning that China did not initially feature in the International Monetary Fund’s (IMF) concerns over ‘global imbalances’ (IMF, 2005). But strong

The familiar pattern of Chinese consumption growth
66
growth in trade following China’s accession to the World Trade Organization in late 2001 (Coates, et al., 2012), combined with strong growth in the global economy (Ma, et al., 2012, p. 72), generated huge trade surpluses for China, contributing to a peak current account surplus of 10.1 per cent of GDP in 2007.
Chart 2: China’s current account balance, 1981 — 2011
-6
-4
-2
0
2
4
6
8
10
12
-6
-4
-2
0
2
4
6
8
10
12
1981 1986 1991 1996 2001 2006 2011
Per cent of GDPPer cent of GDP
Surplus
Deficit
Source: IMF World Economic Outlook, October 2012
Describing the ‘surging trade surplus’ as ‘China’s main short term macro challenge’, in November 2006, the World Bank started to publicly advise China that its ‘key economic challenge is to rebalance the economy’. This was to be achieved through a raft of structural reforms including, but not limited to, ‘a larger role for consumption instead of investment and exports’ as a component of demand (World Bank, November 2006, p. 15).
This drew on the earlier work of Kuijs and Wang (2005) who had found that China’s growth since the mid-1990s had come from large-scale investment in industry rather than a continuation of the previous trend of urban job creation. They attributed this to government policies — particularly in relation to energy, finance and labour — that implicitly subsidised current industrial production over services or domestic consumption.
They estimated that with ‘rebalanced policies’ — that is a removal of these implicit subsidies — China could still achieve 8 per cent growth through total factor productivity growth and employment growth, offsetting a decline in the investment share. These structural challenges are further explored in ‘China in a new period of transition’ elsewhere in this volume (Kong, et al., 2012).

The familiar pattern of Chinese consumption growth
67
The Chinese authorities have also publicly voiced their concerns. While not adopting the term ‘rebalancing’,2 Premier Wen Jiabao told a press conference in March 2007 that the economy was ‘unstable, unbalanced, uncoordinated and unsustainable’ (Xinhua, 2007). Among other causes, the Premier noted that ‘China’s economic growth relies too much on investment and export’. The 12th Five Year Programme for National Economic and Social Development, adopted by the National People’s Congress in 2011, formally recognises that there are ‘imbalanced, incompatible and non-sustainable elements within China’s development’ which include ‘an imbalance between investment and consumption’ (National People’s Congress, 2011).
As such, Chinese authorities appear to have accepted the logic that Chinese growth cannot be sustained indefinitely by export or investment growth alone. In his final address as Chinese Communist Party General Secretary, Hu Jintao called for a ‘long-term mechanism for increasing consumer demand’ (Xinhua, 2012).3 Consistent with their generally cautious approach to economic reform, changes are likely to be gradual.
A New Twist on the Familiar Pattern of Economic Growth
Although China’s private consumption share is historically low, its development pattern is broadly in line with the Asian post-war growth experience (Kong, et al., 2012). Across developing Asia, the consumption share of GDP fell markedly during the post-war period (Chart 3). While China’s household consumption share has tended to be at the lower end of the spectrum among East and Southeast Asian economies, it has not consistently been the lowest.
Over this period, the largest falls in household consumption share came from Korea and Singapore, both of which had household consumption shares of over 80 per cent of GDP until the mid-1960s. Private consumption in Korea and Singapore now accounts for 53 per cent and 39 per cent respectively of GDP. Japan, which at the start of this period already had by far the highest per capita income levels, experienced the smallest fall in consumption — followed by a rise to 60 per cent after 1990. The latter coincided with peak of Japanese investment, after which followed Japan’s so-called ‘lost decade’.
2 The term ‘rebalancing’ can be translated into Chinese as 重新平衡 (chongxin pingheng) and is
used in Chinese in the context of resolving global macroeconomic imbalances, rather than in the context of ‘rebalancing’ China’s economy toward consumption.
3 ‘We should firmly maintain the strategic focus of boosting domestic demand, speed up the establishment of a long-term mechanism for increasing consumer demand, unleash the potential of individual consumption, increase investment at a proper pace, and expand the domestic market’ (Xinhua, 2012).

The familiar pattern of Chinese consumption growth
68
Chart 3: Household Consumption Shares, Asian economies, 1950 — 2011
30
40
50
60
70
80
90
100
30
40
50
60
70
80
90
100
1956 1961 1966 1971 1976 1981 1986 1991 1996 2001 2006 2011
Share of GDPShare of GDP
Korea
Singapore
China
Malaysia
Hong KongThailand
Japan
Korea
Singapore
China
Malaysia
Hong KongThailand
Japan
Source: IMF International Financial Statistics, author calculations
These stylised trends in aggregate consumption have become a feature of the post-war pattern of economic development experienced across much of Asia. At very low levels of per capita income — close to subsistence levels — almost all output is for consumption (Chart 3). Generally, households are only barely able to cover spending on the necessities of life, leaving little scope for domestic saving and investment. Lacking the infrastructure or the policies to take advantage of trade, the economy is primarily focused on agriculture.
As the economy begins to grow, we observe the consumption share of GDP fall precipitously — reflecting the large scale of investment needed for industrialisation and urbanisation. Household incomes rise, but as long as there is a large pool of surplus labour in the less-productive agricultural sector of the economy, wages remain very low. Capital, which at low income levels is the relatively scarce factor of production, makes high returns and so attracts even more resources for further investment. Integration into global trading networks provides an opportunity for rapid ‘export-led’ economic growth (Coates, et al., 2012)
This ‘high growth’ dynamic comes to an end once the surplus agricultural labour is exhausted (Eichengreen, et al., 2011). After reaching the ‘Lewis turning point’, labour becomes scarce, so real wages are bid up (Lewis, 1955). Household income can then grow, with spending extending beyond basic goods, towards more complex products and services. We observe for Korea, Hong Kong, Japan and Singapore that consumption shares eventually level out, and can even rise over time, particularly as the demand for and cost of government social services begins to rise (Chart 4). While China, like Malaysia and Thailand, remains at an early stage of this development

The familiar pattern of Chinese consumption growth
69
process, its policy challenge is particularly complex and it is faced by a rapidly aging demographic profile (see Kong, et al. (2012) for further discussion).
Chart 4: Household Consumption Shares, Asian economies, by income
40
50
60
70
80
90
100
40
50
60
70
80
90
100
0 5,000 10,000 15,000 20,000 25,000 30,000 35,000 40,000 45,000
Per capita GDP (Constant 2000 US Dollars)
Hong Kong
Japan
Singapore
Korea
Malaysia
Thailand
Percent of GDP Percent of GDP
China
Source: IMF International Financial Statistics, author calculations (data are for 1960-2010, except for Singapore 1961-2010)
Including government consumption with private consumption shows that China’s total consumption is around half of GDP, slightly below that of Singapore (Chart 5). In contrast to China’s low private consumption share of GDP, government consumption has historically been amongst the highest of economies in the region. Of the countries listed, only Korea (15 per cent) and Japan (21 per cent) devoted a higher proportion of GDP to government consumption than China (14 per cent) in 2011.
Chart 5: Household and Government Consumption, Asian economies, 2011
0 10 20 30 40 50 60 70 80 90 100
China
Singapore
Malaysia
Thailand
Korea
Hong Kong
Japan
Per cent of GDP
Household Consumption Government Consumption
Source: IMF International Financial Statistics, author calculations.

The familiar pattern of Chinese consumption growth
70
Is China on the same path?
If China follows a similar development path to other Asian economies, then its consumption share of GDP is likely to stabilise, and probably rise, over the coming decades. The next section examines whether there are compelling reasons to think that China may not follow this stylised path, and may in some way be an ‘outlier’ with respect to consumption.
Ordinary Chinese consumers
In a Treasury working paper Sharma and Yao (forthcoming) model Chinese household consumption behaviour according to a standard economic consumption model. In particular, the working paper considers whether constraints on the availability of credit, due to relatively underdeveloped financial markets in China, significantly affect Chinese household consumption.
The authors find that in the long run, household consumption is explained almost entirely by household wealth, as predicted by standard consumption theory. That is, the results suggest that there is nothing unique about Chinese household consumption behaviour — given the share of national income that households receive.
The paper also considers the possible effects of credit constraints on Chinese consumers, due to the fact that China’s financial markets remain at an early stage of development. Credit constraints are found to have some explanatory power for Chinese household consumption, suggesting that financial sector reform will play an important role in allowing households to better adjust to economic fluctuations. Of course, financial sector reforms would also boost future household incomes and wealth, and would therefore likely lead to higher consumption indirectly as well. The paper also finds that credit constraints and financial market sophistication influence the consumption of durables more so than non-durables.
Regional consumption trends
Supporting evidence can also be found by considering regional variations in Chinese consumption trends. Provincial data can be aggregated into four discrete ‘regional’ blocks — East, Northeast, Central and West, with the largest and most developed economies in the Eastern region (Chart 6).

The familiar pattern of Chinese consumption growth
71
Chart 6: Nominal expenditure-based GDP breakdown by province (2010)
-1
0
1
2
3
4
5
-1
0
1
2
3
4
5
Gua
ngdo
ngJi
angs
uS
hand
ong
Zhe
jiang
Heb
eiS
hang
hai
Fuj
ian
Bei
jing
Tia
njin
Hai
nan
Liao
ning
Hei
long
jiang
Jilin
Hen
anH
unan
Hub
eiA
nhui
Jian
gxi
Sha
nxi
Sic
huan
Inne
r Mon
golia
Gua
ngxi
Sha
anxi
Cho
ngqi
ngY
unna
nX
injia
ngG
uizh
ouG
ansu
Nin
gxia
Qin
ghai
Tib
et
RMB trillionsRMB trillionsNet exports
Stocks
Investment
Government consumption
Household Consumption
NORTHEASTEAST CENTRAL WEST
Source: Economist Intelligence Unit, 2010.
All regions have experienced a marked fall in consumption share over recent decades (Chart 7 Panel A). Since the beginning of China’s ‘reform and opening up’, the average fall in the consumption share of GDP across China’s provinces has been above 20 percentage points, with the capital, Beijing, and the commercial hub, Shanghai, the only places to record a rise over that time.
To date these developments have been largely in line with a falling household income share of GDP. In each of the four regions, household income as a share of GDP has fallen steadily from mid-1990s levels (Chart 7 Panel B). This has occurred despite robust growth in incomes over that time period, reflecting faster growth in other sectors and other factors which have tended to reduce labour’s share of total income.

The familiar pattern of Chinese consumption growth
72
Chart 7: Shares of Gross Regional Product Panel A: Private Consumption Panel B: Disposable income
Source: Economist Intelligence Unit, author calculations.
The strength of the relationship between disposable income and consumption shares is also evident across province-level data. Chart 8 plots the consumption share of GDP for each province against its disposable income as a share of GDP for three years: 1996, 2003 and 2009. Over time, the consumption share has declined steadily and consistently across provinces, mirroring falls in the disposable income share of GDP.
Chart 8: Disposable income and consumption shares of GDP
10
20
30
40
50
60
70
80
90
100
10
20
30
40
50
60
70
80
90
100
20 30 40 50 60 70 80
Disposable income to GDP Disposable income to GDP
Falling income share of GDP
Falling consumptiion share of GDP
2009
2003
1996
Household consumption to GDP Source: Economist Intelligence Unit, author calculations.
0
20
40
60
80
100
0
20
40
60
80
100
1960 1970 1980 1990 2000 2010
Per centPer cent
Central
West
East
Northeast
20
30
40
50
60
70
80
20
30
40
50
60
70
80
1996 1998 2000 2002 2004 2006 2008 2010
Per cent Per cent
EastCentral West
Northeast

The familiar pattern of Chinese consumption growth
73
The outlook for household incomes
The above analysis suggests that consumption in the Chinese economy is primarily driven by trends in households’ share of disposal income, rather than any factors unique to Chinese consumers. This suggests that the outlook for Chinese consumption depends on the outlook for household income.
As household income in China is predominantly derived from labour, structural factors that affect the returns to labour (wages) are likely to drive changes in overall consumption. And lower returns to capital will shift income away from the corporate and state sectors that have saved and re-invested their profits (Ma, et al., 2012, p. 75), towards households, which should support greater household consumption
Indeed, there is already evidence that China is seeing the kinds of structural shifts that will bid up wages, increase the household share of income, and therefore stabilise the share of household consumption, consistent with the pattern observed elsewhere in Asia.
These shifts include the end of China’s cheap, surplus pool of labour (Kong, et al., 2012), as well as the greater development of the labour-intensive services sector, in response to the evolving preferences of Chinese consumers as they become wealthier. Evidence from regional wage differentials provides further evidence of the structural shifts that are already underway.
Wage pressure in China’s regions
Regional patterns of GDP and wages growth suggest that changing patterns of labour demand are already leading to more widely spread economic and income growth across China. For example, in the Eastern provinces, where nominal wages are significantly higher on average than in the rest of China, producers are already facing pressure from low-cost competitors offshore (Coates, et al., 2012).
This is being compounded by the emergence of genuine competition from lower-cost producers domestically from other regions in China, aided by rapid infrastructure and other investment as part of the Central and Western development plans and in response to the global financial crisis (National Development and Reform Commission, 2012).
Reports of labour shortages in some Eastern cities and provinces have intensified in recent years, with increasingly industrialised and well-connected urban centres in some Central and Western provinces emerging as viable locations for low-cost production.
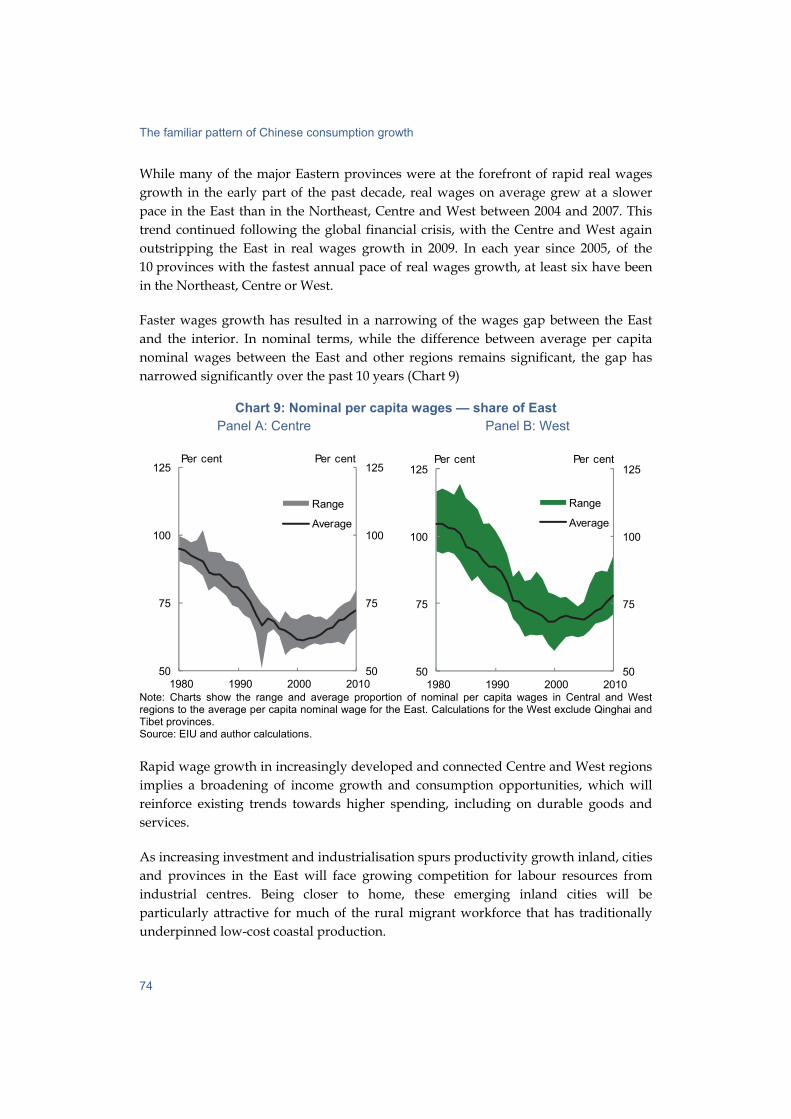
The familiar pattern of Chinese consumption growth
74
While many of the major Eastern provinces were at the forefront of rapid real wages growth in the early part of the past decade, real wages on average grew at a slower pace in the East than in the Northeast, Centre and West between 2004 and 2007. This trend continued following the global financial crisis, with the Centre and West again outstripping the East in real wages growth in 2009. In each year since 2005, of the 10 provinces with the fastest annual pace of real wages growth, at least six have been in the Northeast, Centre or West.
Faster wages growth has resulted in a narrowing of the wages gap between the East and the interior. In nominal terms, while the difference between average per capita nominal wages between the East and other regions remains significant, the gap has narrowed significantly over the past 10 years (Chart 9)
Chart 9: Nominal per capita wages — share of East Panel A: Centre Panel B: West
Note: Charts show the range and average proportion of nominal per capita wages in Central and West regions to the average per capita nominal wage for the East. Calculations for the West exclude Qinghai and Tibet provinces. Source: EIU and author calculations.
Rapid wage growth in increasingly developed and connected Centre and West regions implies a broadening of income growth and consumption opportunities, which will reinforce existing trends towards higher spending, including on durable goods and services.
As increasing investment and industrialisation spurs productivity growth inland, cities and provinces in the East will face growing competition for labour resources from industrial centres. Being closer to home, these emerging inland cities will be particularly attractive for much of the rural migrant workforce that has traditionally underpinned low-cost coastal production.
50
75
100
125
50
75
100
125
1980 1990 2000 2010
Per centPer cent
Range
Average
50
75
100
125
50
75
100
125
1980 1990 2000 2010
Per centPer cent
Range
Average

The familiar pattern of Chinese consumption growth
75
Higher incomes tend toward consumption of labour-intensive services
Higher wages will also affect the composition of consumption spending, with an increased share of household spending going to labour-intensive services. China’s tertiary (services) sector has already expanded rapidly as a share of GDP since reforms began in the 1980s (Chart 10 Panel A).
Chart 10: Service sector growth in China and selected Asian economies Panel A: China’s GDP shares Panel B: Service sector share
Source: CEIC China Database. Source: World Bank World Development Indicators (Services Share), Conference Board 2010 Total Economy Database (Income). Notes: Data are for 1960-2010A larger services share of GDP implies a progressively greater share of employment in the more labour-intensive services sector industries.
This trend reinforces the anticipated trend of a greater labour income share of GDP — and therefore a larger share of household consumption — over time. Comparison with the development of economies such as Japan and Korea show that China is approaching income levels where the services sector share of GDP begins to expand rapidly (Chart 10, Panel B). However, there are also countries which have not yet moved beyond middle income levels, possibly partly on account of policies that inhibit the development of their domestic services sector.
The same trend can be observed in China by looking at household consumption data by income level. As a proportion of total consumption outlays, urban households with the lowest income dedicate relatively more to food, while higher income households spend relatively less on food. Correspondingly, wealthier households spend relatively more on more complex goods and services (represented in Chart 11 as a combination of spending on transport and communication and education, recreation and cultural services).
0
25
50
75
100
0
25
50
75
100
1960 1970 1980 1990 2000 2010
Tertiary (Services)
Secondary
Primary
Per cent of GDP Per cent of GDP
20
30
40
50
60
70
80
20
30
40
50
60
70
80
- 10,000 20,000 30,000 40,000Per Capita GDP (2010 EKS$)
China
Japan
Thailand
Per cent of GDPPer cent of GDP
Korea
Malaysia

The familiar pattern of Chinese consumption growth
76
Chart 11: Average share of urban consumption expenditure, by income quartile
Panel A: Food Panel B: Services
Source: CEIC and author calculations Note: Services includes transport, communication, education, recreation and cultural services.
The shift in spending patterns towards progressively more complex goods and services at higher income levels has crucial implications for the structure of the Chinese economy. As incomes grow, the increased demand for services will further increase the demand for high-skilled and high-wage labour, reinforcing the trend toward higher household consumption.
This progression towards a more service-oriented economy will require appropriate policy settings. For example, the current tax system tends to penalise firms operating in the tertiary sector through double taxation, with the mooted change to a value-added system likely to be a positive development in transitioning the economy towards the service sector.
Conclusion
This paper suggests that the rapid decrease in private consumption as a share of China’s GDP is not exceptional but broadly consistent with China’s current stage of development. While private consumption in China over the past thirty years has increased rapidly, the growth in investment has been even more rapid.
However, on present demographic and structural trends, it is likely that market forces will see an end to this pattern as investment growth eases as the Chinese economy continues to develop. Instead, private consumption will become an increasingly
0
10
20
30
40
50
60
70
0
10
20
30
40
50
60
70
Lowest Lowermiddle
Uppermiddle
Highest
1991-1994 1995-1999
Per cent Per cent
0
5
10
15
20
25
30
35
0
5
10
15
20
25
30
35
Lowest Lowermiddle
Uppermiddle
Highest
2000-2004 2004-2009
Per cent Per cent
The familiar pattern of Chinese consumption growth
77
important source of domestic demand and driver of economic growth in China, just as occurred in Korea, Hong Kong, Japan and Singapore before it.
References
Coates, B, Horton, D, and McNamee, L. 2012 ‘China: Prospects for “export-led” growth’. Economic Roundup, Issue 4.
Eichengreen, B, Park D, and Shin K. 2011‘When fast growing economies slow down: International Evidence and Implications for China.’ NBER Working Paper Series. NBER Working Paper 16919.
IMF 2005 September ‘Global Imbalances: A Savings and Investment Perspective’. World Economy Outlook.
Kong, V, McKissack, A and Zhang, D 2012 ‘China in a new period of Transition’ Economic Roundup (4).
Kuijs, L, and Wang, T 2005 ‘China's Pattern of Growth: Moving to sustainability and reducing inequality’ In Research Working Paper No 2. World Bank China Office.
Lewis, A 1955 The Theory of Economic Growth. London: Taylor and Francis.
Ma, G McCauley, R, and Lam, L 2012 ‘Narrowing China's Current Account Surplus: The role of saving, investment and the renminbi’ In H. McKay and L. Song (Eds.), Rebalancing and Sustaining Growth in China (pp. 65-91). Canberra: ANU E Press.
National Development and Reform Commission 2012, March 5 Full Text: Report on China's Economic and Social Development Plan. Viewed 26 November 2012, (see http://www.china.org.cn/china/NPC_CPPCC_2012/2012-03/14/content_24893766.htm).
National People's Congress 2011 China's Twelfth Year Plan (2011-2015) — the Full English Version, Translation by Delegation of the European Union in China. 11 May, viewed 20 November 2012 (see http://cbi.typepad.com/files/full-translation-5-yr-plan-2011-2015.doc).
Sharma, D and Yao, H (forthcoming) Modelling Chinese Consumption. Treasury Working Paper Series.
World Bank 2006 China Quarterly Update, November 2006.

The familiar pattern of Chinese consumption growth
78
Xinhua 2007 Premier: China confident in maintaining economic growth. 16 March Viewed 19 November 2012 (see http://news.xinhuanet.com/english/2007-03/16/content_5856569.htm).
Xinhua (2012, November 17) Full text of Hu Jintao's report at 18th Party Congress, Accelerating the Improvement of the Socialist Market Economy. Viewed 19 November 2012 (see http://www.china.org.cn/china/Off_the_Wire/2012-11/17/content_27145433.htm).
Xinhua (2012, 11 8) Hu vows to boost domestic demand. Viewed 22 November, 2012 (see http://news.xinhuanet.com/english/special/18cpcnc/2012-11/08/c_131959135.htm).

79
China: prospects for export-driven growth Brendan Coates, Dougal Horton, and Lachlan McNamee1
China’s rise as a merchandise exporter in recent decades is unparalleled. Supported by a rapidly growing urban workforce, massive investments in productivity-enhancing infrastructure and technologies, a range of subsidies and incentives, and a favourable external economic environment, Chinese merchandise exports reached a staggering 36 per cent of China’s GDP in 2006. However, this remarkable export performance, which is somewhat exaggerated by China’s assembly role in global supply chains, is unlikely to continue, as Chinese exports reach saturation point in some export markets and domestic wages continue to rise. Instead, future export growth will increasingly be led by shifts in China’s exports towards more sophisticated goods and services as China adopts more advanced manufacturing technologies, and towards emerging economy destinations. This will underpin continued rises in China’s productivity and living standards, allowing consumer spending to become a more important internal driver of growth, as the economy reduces its reliance on export and investment demand.
1 The authors are, or were, from the International Economy Division, the Australian Treasury.
This article has benefited from comments and suggestions provided by Owen Freestone, Jason McDonald, Adam McKissack, and Wilson Au-Yeung. The views in this article are those of the authors and not necessarily those of the Australian Treasury.
China: prospects for export-driven growth
80
Introduction
Following in the footsteps of other Asian economies such as Japan, South Korea, Hong Kong, and Taiwan, China’s rapid industrialisation and economic growth has been underpinned by its export sector. This has seen a rapid expansion in China’s international trade, with merchandise exports directly accounting for approximately one-fifth of Chinese economic growth over the past decade. Over this period, investments to expand industrial capacity in China’s export-oriented industries have also been an important contributor to the investment boom.
The importance of China’s export sector, however, extends well beyond its direct contribution to China’s GDP, which is sometimes overstated (see Box 1). Rather, China’s ‘export-led growth’ model has played a much broader role in transmitting new technologies and business practices to the wider economy, leading to substantial productivity gains. This has helped to drive China’s economic growth to an annual average rate of 10 per cent since the reform period began 30 years ago.2
Notwithstanding concerns regarding China’s trade practices amongst its trading partners, the rest of the world has largely benefited from this growth strategy, especially through lower prices for many internationally tradable goods, for both consumers and businesses.
In recent years, however, a number of commentators have suggested that China can no longer depend on exports as a driver of economic growth (for example, World Bank, 2012; Deer and Song, 2012; Akyuz, 2011; Guo and N’Diaye, 2009). China’s comparative advantage in low-skilled manufacturing is threatened by the upward adjustment in its exchange rate and rising costs, particularly for labour. With China already accounting for over one tenth of global merchandise exports, future export growth is likely to slow as China approaches saturation point, at least in its existing export mix. Furthermore, the significant imbalances that emerged over the past decade — including China’s large external trade and current account surpluses — highlights the unsustainability of a growth model that has been heavily reliant on investment and export demand.3
Future Chinese economic growth derived from exports is likely to be largely driven by manufacturers moving up the value chain to secure a greater role in the production, design, and marketing of industrial products and services. Moreover, new engines of growth in higher value-added industries will be increasingly more technology- and knowledge-intensive, placing a high premium on effective innovation and investment in education and research and development (Spence, 2011).
2 For a broader discussion of export-led growth see de Melo and Robinson (1990). 3 Eichengreen et al (2012) find that economies that maintain undervalued exchange rates and
have low consumption shares of GDP are more likely to experience a sharp slowdown in growth rates as they pass through middle-income levels.

China: prospects for export-driven growth
81
The relative decline in exports as a driver of GDP growth, and the shifting structure of Chinese exports, are inevitable steps in China’s economic development, similar to the experiences of former export-oriented emerging economies. The challenge will be to support these structural transitions while avoiding sudden slowdowns and possible crises (World Bank, 2012). If China can get the policy mix right, this will support growing household incomes, which should see consumer spending become an increasingly important internal driver of China’s growth as living standards rise.
This paper examines these issues. The first section investigates the emergence of China as a leading exporter of manufactured goods, and broader trends in Chinese exports over the past decade. The second section assesses the impact that rising wages and other input costs, and renminbi (RMB) appreciation, are having on China’s export competitiveness. The third section examines the shifts in China’s industrial structure and export mix, and examines prospects for future export-led growth. The fourth section considers the implications of these transitions for China and the region, as well as the global economy, and the final section concludes.
4 For example, US gross merchandise exports were equivalent to 9 per cent of GDP in 2010,
14 per cent for Japan, and 13 per cent for India. Accounting for trade in both goods and services, China’s gross exports were equivalent to 30 per cent of GDP in 2010, compared with 13 per cent for the US, 15 per cent for Japan, and 23 per cent for India (source: World Bank, World Development Indicators).
5 Koopman et al (2012) estimated the DVA share of Chinese exports by estimating separate input-output tables for China’s ordinary and processing exports to account for the important role of processing trade in China’s export mix. The DVA share of processing exports is typically much lower than for other exports.
Box 1: Estimating the direct contribution of exports to growth
Although nominal merchandise exports have fallen from a peak of 36 per cent of GDP in 2006 to 26 per cent in 2011, it is clear that China exhibits a degree of external dependence well in advance of the world’s other largest economies.4 This ratio, however, does not mean that exports account for 26 per cent of Chinese GDP, as a significant proportion of the value of Chinese merchandise exports comes from imported materials and components.
For example, Xing and Detert (2010) estimate that only US$6.50 (about 3.6 per cent) of the total manufacturing cost of an Apple iPhone in 2009 could be attributed to production activities inside China, yet the full shipping price (US$178.96) is reported in China’s gross exports. Instead, the bulk of its exported value is accounted for by the cost of components imported from elsewhere, such as Japan (34 per cent), Germany (16 per cent), and South Korea (13 per cent).
Hence, we adopt the estimates of the domestic value-added (DVA) share of Chinese merchandise exports generated by Koopman et al (2012) to provide a better estimate of the importance of exports to the Chinese economy.5 Measuring the DVA content of exports helps to capture China’s role in global supply chains. Based on this approach
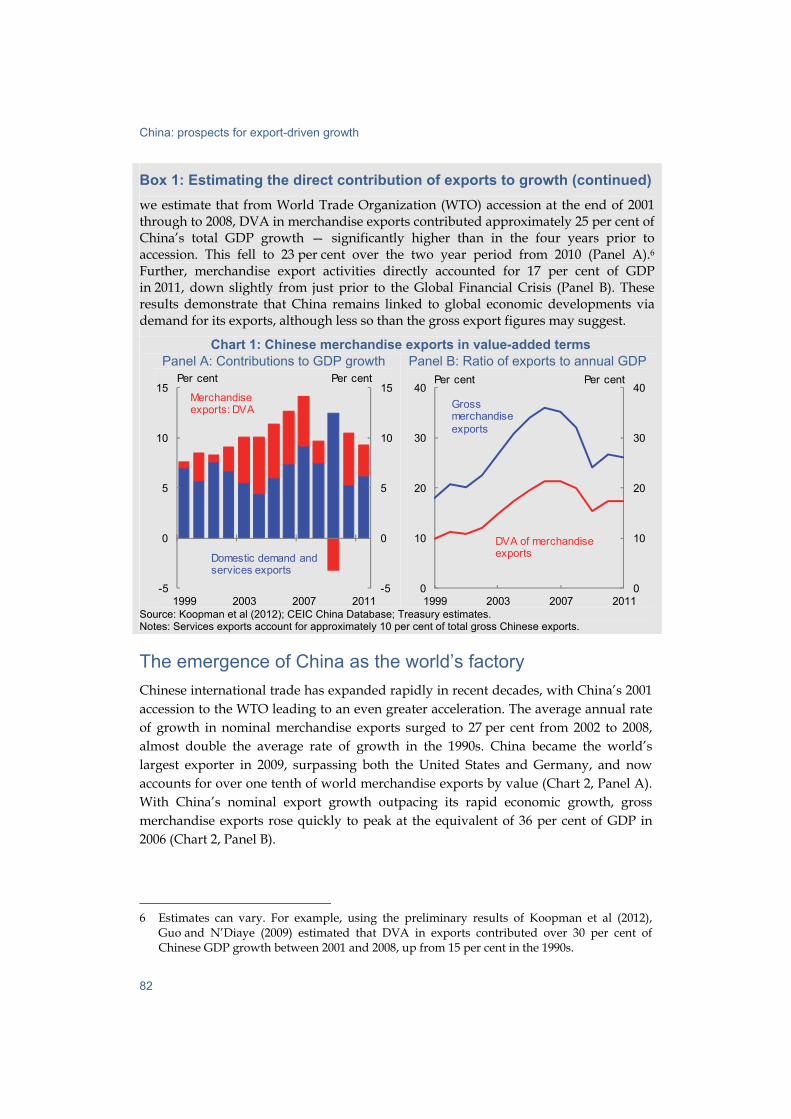
China: prospects for export-driven growth
82
The emergence of China as the world’s factory
Chinese international trade has expanded rapidly in recent decades, with China’s 2001 accession to the WTO leading to an even greater acceleration. The average annual rate of growth in nominal merchandise exports surged to 27 per cent from 2002 to 2008, almost double the average rate of growth in the 1990s. China became the world’s largest exporter in 2009, surpassing both the United States and Germany, and now accounts for over one tenth of world merchandise exports by value (Chart 2, Panel A). With China’s nominal export growth outpacing its rapid economic growth, gross merchandise exports rose quickly to peak at the equivalent of 36 per cent of GDP in 2006 (Chart 2, Panel B).
6 Estimates can vary. For example, using the preliminary results of Koopman et al (2012),
Guo and N’Diaye (2009) estimated that DVA in exports contributed over 30 per cent of Chinese GDP growth between 2001 and 2008, up from 15 per cent in the 1990s.
Box 1: Estimating the direct contribution of exports to growth (continued)
we estimate that from World Trade Organization (WTO) accession at the end of 2001 through to 2008, DVA in merchandise exports contributed approximately 25 per cent of China’s total GDP growth — significantly higher than in the four years prior to accession. This fell to 23 per cent over the two year period from 2010 (Panel A).6 Further, merchandise export activities directly accounted for 17 per cent of GDP in 2011, down slightly from just prior to the Global Financial Crisis (Panel B). These results demonstrate that China remains linked to global economic developments via demand for its exports, although less so than the gross export figures may suggest.
Chart 1: Chinese merchandise exports in value-added terms Panel A: Contributions to GDP growth
-5
0
5
10
15
-5
0
5
10
15
1999 2003 2007 2011
Per centPer cent
Merchandise exports: DVA
Domestic demand and services exports
Panel B: Ratio of exports to annual GDP
0
10
20
30
40
0
10
20
30
40
1999 2003 2007 2011
Gross merchandise exports
DVA of merchandise exports
Per cent Per cent
Source: Koopman et al (2012); CEIC China Database; Treasury estimates. Notes: Services exports account for approximately 10 per cent of total gross Chinese exports.

China: prospects for export-driven growth
83
Chart 2: China’s remarkable export growth Panel A: Share of global exports and GDP
0
3
6
9
12
15
0
3
6
9
12
15
1980 1990 2000 2010
Per centPer cent
China’s share of global GDP
China’s share of global merchandise exports
Panel B: As a per cent of Chinese GDP es
0
10
20
30
40
50
0
10
20
30
40
50
1980 1990 2000 2010
Per centPer cent
Merchandise exports
Source: World Bank World Development Indicators 2011; IMF World Economic Update, October 2012. Notes: GDP is in PPP dollars (Panel A), US dollars (Panel B).
Rapid export growth has been largely driven by China’s participation in vertically integrated global production supply chains — where different activities in the production of a single good are carried out in different economies.7 Chinese factories often form the final link — assembling and packaging the textile, light manufacturing, and electronic components that are primarily designed, produced, and marketed abroad. This is reflected in the high share of processing exports in total Chinese trade and is consistent with the outsourcing strategies of foreign firms that have shifted low-skilled, labour-intensive production processes to China (although as illustrated in Chart 3, Panel A, the value of ordinary exports has recently eclipsed that of processing exports).8
The abundant supply of comparatively low-cost labour and other factor inputs, the potential to utilise significant economies of scale, and the prospect of gaining access to China’s growing domestic market have made China an attractive target for foreign investment and outsourcing.9 Foreign funded firms account for just over half of Chinese merchandise exports, although this share has declined as local firms expand their productive capabilities and target foreign markets (Chart 3, Panel B).
7 In contrast to horizontal specialisation which has historically characterised most global trade,
whereby goods are produced in the one economy and then traded across borders. 8 For further discussion on the role of processing trade in China’s economic development see
Yu and Tian (2012), Lardy (2002), and Naughton (1996). 9 The establishment of Special Economic Zones from 1980 acted as a testing ground for
market-oriented reforms, which together with favourable tariff arrangements under China’s processing trade regime and the development of quality export facilities, encouraged foreign firms to set up manufacturing bases in China. The lowering of trade duties on imported components destined for goods to be exported also assisted this process.

China: prospects for export-driven growth
84
Chart 3: China’s processing exports Panel A: Share of merchandise exports by
trade regime, 12mma
30
40
50
60
70
30
40
50
60
70
2000 2003 2006 2009 2012
Per centPer cent
Ordinary trade: exports
Processing trade: exports
Panel B: Share of merchandise exports by foreign funded enterprises, 12mma
30
40
50
60
70
30
40
50
60
70
1997 2002 2007 2012
Per centPer cent
Foreign funded enterprises
Source: CEIC China Database; Treasury. Notes: 2012 data is year to October.
Trade, and the associated inflows of foreign direct investment, have helped China gain access to global markets and new technologies, which have been essential in China’s economic development. Foreign firms typically produce more sophisticated goods than domestic firms and are more productive (Xu and Lu, 2009).
Since China joined the WTO in 2001, Chinese producers have almost doubled their share of the combined United States, European Union and Japanese market for imported goods, to 18 per cent in 2011 (Chart 4, Panel A). Together, these markets accounted for around half of all Chinese merchandise exports during this period. Over the same period, Japan’s share of US imported goods fell from 11 to 6 per cent, and halved to 4 per cent of goods imported by the EU.
China has also gradually shifted up the production value chain towards more sophisticated products, such as heavy manufactured goods and electronics. China’s share of US, EU and Japanese imports of such goods more than tripled between 2001 and 2011, to 28 per cent (Chart 4, Panel B). Although gross export values inflate these market shares due to China’s role as a final stage assembler in global supply chains, these results coincide with the growing value-added share of Chinese producers in total exports of merchandise goods, discussed in greater detail below.
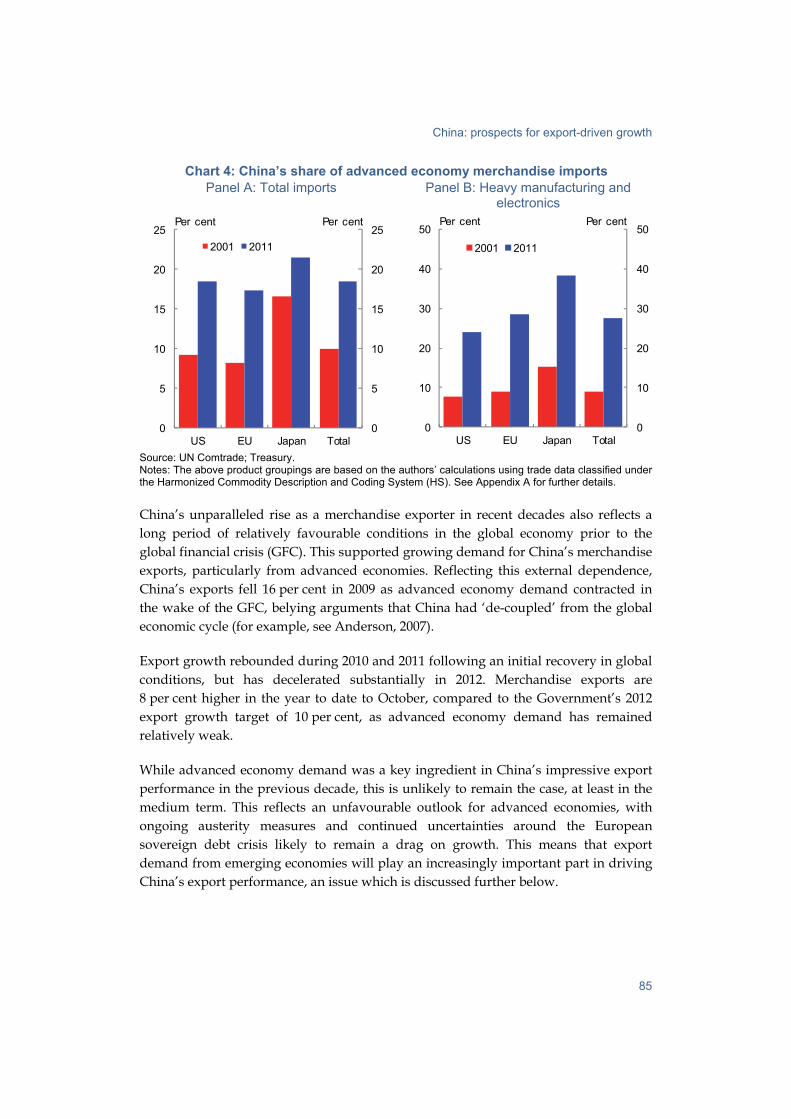
China: prospects for export-driven growth
85
Chart 4: China’s share of advanced economy merchandise imports Panel A: Total imports
0
5
10
15
20
25
0
5
10
15
20
25
US EU Japan Total
2001 2011
Per cent Per cent
Panel B: Heavy manufacturing and electronics
0
10
20
30
40
50
0
10
20
30
40
50
US EU Japan Total
2001 2011
Per cent Per cent
Source: UN Comtrade; Treasury. Notes: The above product groupings are based on the authors’ calculations using trade data classified under the Harmonized Commodity Description and Coding System (HS). See Appendix A for further details.
China’s unparalleled rise as a merchandise exporter in recent decades also reflects a long period of relatively favourable conditions in the global economy prior to the global financial crisis (GFC). This supported growing demand for China’s merchandise exports, particularly from advanced economies. Reflecting this external dependence, China’s exports fell 16 per cent in 2009 as advanced economy demand contracted in the wake of the GFC, belying arguments that China had ‘de-coupled’ from the global economic cycle (for example, see Anderson, 2007).
Export growth rebounded during 2010 and 2011 following an initial recovery in global conditions, but has decelerated substantially in 2012. Merchandise exports are 8 per cent higher in the year to date to October, compared to the Government’s 2012 export growth target of 10 per cent, as advanced economy demand has remained relatively weak.
While advanced economy demand was a key ingredient in China’s impressive export performance in the previous decade, this is unlikely to remain the case, at least in the medium term. This reflects an unfavourable outlook for advanced economies, with ongoing austerity measures and continued uncertainties around the European sovereign debt crisis likely to remain a drag on growth. This means that export demand from emerging economies will play an increasingly important part in driving China’s export performance, an issue which is discussed further below.
China: prospects for export-driven growth
86
Shifts in China’s export competitiveness
Abundant supplies of low-cost labour and artificially cheap inputs to production, as well as an undervalued currency, have formed much of the basis for China’s comparative advantage in low-skilled and labour-intensive manufactured exports in recent decades. Yet as the Chinese economy develops, labour and other input costs are rising, particularly in the more advanced export-focused coastal regions. These pressures on costs and competitiveness have been compounded by the gradual appreciation in the RMB. China’s real effective exchange rate has appreciated by almost 30 per cent since major exchange rate reforms in mid-2005. As these trends continue — and as other low-cost emerging markets continue to make productivity-enhancing investments in their own export sectors — China is likely to become less competitive in low-cost manufactured exports, bringing into question the prospects for future export-led growth.
Rising wages and other factor input costs
The large-scale migration of rural surplus labour to the urban manufacturing sector has provided manufacturers in China access to a deep pool of low-cost labour. This has driven China’s rise as the final-stage assembler in global manufacturing supply chains and the subsequent rapid growth of labour-intensive manufactured exports. However, as the availability of rural surplus labour shrinks and the Chinese Government continues to grant minimum wage increases, China’s low-cost wage advantage is gradually dissipating.10 Nominal wages have grown by an annual average rate of almost 15 per cent since China’s accession to the WTO in 2001.
At the same time, efficiency gains resulting from past rounds of market reforms and the migration of excess labour from the lower-productivity agriculture sector to the higher-productivity manufacturing sector are slowing. 11
Recent studies suggest that Chinese unit labour costs (ULC), which adjust labour costs for productivity, have risen since the early to mid-2000s as productivity gains have been insufficient to offset wage rises. Ceglowski and Golub (2011), for example, found that between 1998 and 2003 productivity gains substantially outpaced wage growth, leading to a fall in ULC of between 1.5 and 5.2 per cent on average per year in RMB terms. Between 2003 and 2008-09, however, these trends reversed and ULC rose by
10 Labour shortages in urban areas may also reflect institutional barriers to labour migration
(Golly and Meng, 2011). 11 Consistent with the experiences of other developing economies over the last half century,
Chinese labour productivity growth is expected to continue slowing as the Chinese economy converges towards advanced economy status. Au-Yeung et al (2013) forecast labour productivity growth will steadily decline from the middle of this decade, although will continue to substantially outpace that of most other Asian emerging and advanced economies until at least 2050.

China: prospects for export-driven growth
87
between 1.8 and 7.4 per cent on average each year. ULC rose even faster in US dollar terms, by an annual average of 5 to 10.9 per cent, reflecting the appreciation of the RMB.
Historically, domestic prices of key inputs such as land, water, energy, and fuel have also been relatively low by international standards, partly reflecting government policies that have regulated below-market prices (World Bank, 2012).12 In recent years, however, China has begun to address factor market distortions, with a greater policy emphasis on market-based pricing and the scaling back of subsidies. For example, petroleum and diesel prices are now indexed to a weighted basket of international crude oil prices; natural gas prices are steadily increasing; and preferential power tariffs for energy-intensive industries are gradually being removed.
Domestic financial and capital market reforms, which are a crucial component of China’s broader structural reform agenda, may also increase the cost of capital, including for exporting firms.13 Over time, reforms will move towards the development of a market-based credit system and the subsequent removal of the implicit subsidy on the cost of capital for Chinese enterprises. While higher capital costs may not directly impact foreign-funded manufacturing firms, these firms may be indirectly impacted by the flow-on effects from local suppliers.
Exchange rate appreciation
Shifts in the nominal exchange rate could also affect Chinese export competitiveness. As the RMB appreciates, the prices of Chinese products rise in foreign currency terms. Since the de-facto currency peg against the US dollar was removed in favour of a link to a basket of currencies in July 2005, the RMB has appreciated by approximately 20 per cent on a nominal trade-weighted basis and by over 30 per cent against the US dollar.
The combined effects of exchange rate appreciation and increases in wages and other production costs can be seen in movements in the real effective exchange rate (REER).14
12 Industrial land is often provided for free to attract investment. The price of water is about
one third of that of international comparators, and petrol and electricity prices are also comparatively low. The total value of China’s factor market distortions could total almost 10 per cent of GDP (Ahuja et al, 2012).
13 In September 2012, the People’s Bank of China released details on financial reforms planned for the 12th Five Year Plan period (2011-2015). These include the marketisation of interest rates, a greater role for private capital in the domestic financial sector, and the reduction of government intervention in financial activity.
14 This trade-weighted multilateral rate measures relative prices and/or costs, expressed in a common currency. REERs are imperfect measures of external competitiveness. They do not take into account differences in the quality of each respective economy’s tradable goods and services, and are typically based on consumer price indicators or GDP deflators, thereby including prices of many non-tradable goods and services (Hawkins, 2006).

China: prospects for export-driven growth
88
Since mid-2005, China’s REER (as measured by the Bank for International Settlements) has risen almost 30 per cent. This appreciation is substantially greater than in many of China’s principal trade competitors in Asia. Over the same period, the REERs for Indonesia and Thailand have both risen by less than 20 per cent, and by only 1 per cent for Japan. India’s REER has fallen 3 per cent, and the REERs for Korea and Taiwan have both fallen by more than 15 per cent.
Impacts on China’s international competitiveness
Despite clear signs of rising labour and other input costs, the pass-through of currency appreciation and cost increases into the prices of China’s exports has been minimal to date. For example, according to the China import price index from the US Bureau of Labor Statistics (which adjusts for changes in the quality of imported goods) the growth in US prices of goods imported from China has been relatively subdued, with prices rising by just 6 per cent since July 2005 (Chart 5, Panel A).15 Moreover, as shown in Chart 5, Panel B, increases in the US prices of Chinese goods compare favourably with its Asian trading competitors.
Chart 5: China’s external competitiveness Panel A: Exchange rate
80
100
120
140
80
100
120
140
2004 2006 2008 2010 2012
US prices of Chinese imported goods
Nominaleffective exchange rate
USD-RMBRMBappreciation
Index 2004 =100 Index 2004 =100
Panel B: US prices of Asian imported goods
95
100
105
110
95
100
105
110
2004 2006 2008 2010 2012
China
Japan
ASEAN
Index 2004 =100 Index 2004 =100
Source: CEIC China Database; Reuters Ecowin; Treasury. Notes: 2012 data is year to October.
This surprisingly modest rise in the prices of Chinese goods partly reflects that approximately a third of the value of Chinese merchandise exports is produced offshore, with Chinese exporters benefiting from cheaper input costs for imported components (see Table 1) (Humpage and Jacobson, 2012). It also likely reflects the low 15 According to Amiti and David (2009), from 2006 to 2008 US imports of Chinese industrial
supplies saw the largest price increases, whereas prices of consumer and capital goods increased only modestly.

China: prospects for export-driven growth
89
wage share of the value of Chinese exports, especially for more sophisticated export goods, and demonstrates the importance of ongoing productivity gains to partially offset rising wages.
While apparently modest, the price inflation of Chinese merchandise goods in recent years has coincided with a tapering-off in China’s share of a number of major merchandise export markets, including the US, EU and Japan.
This mainly reflects a marginal fall in China’s share of the textile and light manufacturing markets (in the US, EU, and Japan), from almost 56 per cent in 2010 to 54 per cent in 2011 (after jumping from 34 per cent in 2001). Textiles and light manufactured goods are more labour-intensive in production than goods higher up the value chain and efficiency gains may be harder to come by. Thus, these products are more sensitive to rising labour costs. While China still commands a dominant market share in this category, there is evidence that other emerging economies are beginning to gain a foothold. For example, between 2001 and 2011 Vietnam’s share of these goods markets rose from 1.4 to 4.3 per cent.
While Chinese merchandise exporters may have experienced a modest loss of competitiveness in recent years, their share of world merchandise exports could not have increased indefinitely. China is, or could soon be, at the ‘Lewis Turning Point’ (or more likely, a ‘turning period’) whereby the gains from the migration of rural surplus labour to the manufacturing sector will diminish as the supply of rural labour tightens, placing upward pressure on industrial wages.16
Indeed, becoming less competitive in lower-end merchandise trade is an inevitable result of China’s ongoing economic development, as its economy shifts towards higher value industries requiring more expensive technologies and labour. As this process unfolds, and as alternative suppliers in lower-wage economies, such as Bangladesh and Vietnam, come on line, China is likely to continue to lose international competitiveness in lower-end, labour-intensive products.
A loss in competitiveness in some sectors, however, may free up resources for a shift to higher domestic value-added in others, and need not imply a decline in competitiveness for the economy overall. Over the longer term, rising wages and other costs causing less competitive industries to be replaced by more productive industries is inherently positive for prospects for sustainable Chinese economic growth.
Prospects for China’s exports sector
In the short-term, the decline in Chinese competitiveness in these low-end industries is likely to be gradual. China will continue to enjoy unparalleled economies of scale in 16 According to the IMF (2012b), China will cross this point between 2020 and 2025.

China: prospects for export-driven growth
90
production, its logistics performance remains superior to all comparable emerging economies (as measured by the World Bank’s Logistics Performance Index, 201217) and cost savings may still be available in China’s less developed western regions.
Over time, the impact of higher labour costs on existing export industries will be balanced by falling production costs in new, more advanced industries, as these emerging sectors benefit from the latest round of new technologies and capital investment. For many of these products, efficiency gains could help to partially offset ongoing strong wage growth.
This shift will also support a growing share of production taking place onshore, as manufacturers substitute domestically-produced components for imported parts, allowing Chinese exporters to capture a greater share of the export revenue.
Towards electronics and heavy machinery
The shift higher up the production value chain and towards greater value-adding activities is well underway, although this will be a relatively gradual process compared with the rapid industrial development in recent decades.
Chart 6: China’s share of global exports by product 2 digit HS export product categories ranked by China’s world market share in 2001
0 10 20 30 40 50 60 70 80
2001
Aircraft, arms and ammunition, vehicles, pharmaceuticals, optical, and electrical
Umbrellas, silk, leather, toys, games,and footwear
Share of w orld exports by product (per cent)
0 10 20 30 40 50 60 70 80
2010
Share of w orld exports by product (per cent)
Source: UN Comtrade, Treasury. Notes: The above product groupings are based on the authors’ calculations using trade data classified under the Harmonized Commodity Description and Coding System (HS). See Appendix A for further details.
17 This index is a multi-dimensional assessment of logistics performance across 155 countries
and has six components: the efficiency of the cross-border clearance process, including customs; the quality of trade- and transport-related infrastructure; the ease of arranging competitively-priced shipments; the competence and quality of logistics services; and the ability to track and trace consignments.
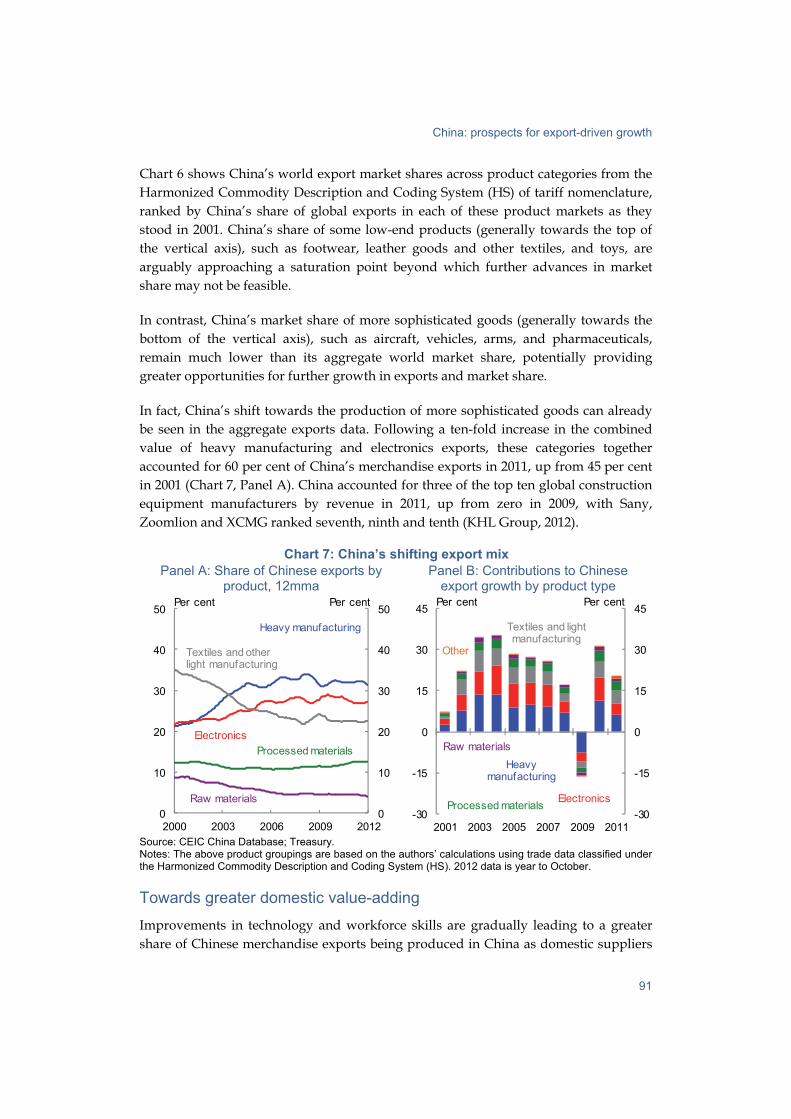
China: prospects for export-driven growth
91
Chart 6 shows China’s world export market shares across product categories from the Harmonized Commodity Description and Coding System (HS) of tariff nomenclature, ranked by China’s share of global exports in each of these product markets as they stood in 2001. China’s share of some low-end products (generally towards the top of the vertical axis), such as footwear, leather goods and other textiles, and toys, are arguably approaching a saturation point beyond which further advances in market share may not be feasible.
In contrast, China’s market share of more sophisticated goods (generally towards the bottom of the vertical axis), such as aircraft, vehicles, arms, and pharmaceuticals, remain much lower than its aggregate world market share, potentially providing greater opportunities for further growth in exports and market share.
In fact, China’s shift towards the production of more sophisticated goods can already be seen in the aggregate exports data. Following a ten-fold increase in the combined value of heavy manufacturing and electronics exports, these categories together accounted for 60 per cent of China’s merchandise exports in 2011, up from 45 per cent in 2001 (Chart 7, Panel A). China accounted for three of the top ten global construction equipment manufacturers by revenue in 2011, up from zero in 2009, with Sany, Zoomlion and XCMG ranked seventh, ninth and tenth (KHL Group, 2012).
Chart 7: China’s shifting export mix Panel A: Share of Chinese exports by
product, 12mma
0
10
20
30
40
50
0
10
20
30
40
50
2000 2003 2006 2009 2012
Per centPer cent
Raw materials
Processed materials
Textiles and other light manufacturing
Electronics
Heavy manufacturing
Panel B: Contributions to Chinese export growth by product type
-30
-15
0
15
30
45
-30
-15
0
15
30
45
2001 2003 2005 2007 2009 2011
Per cent Per cent
Heavymanufacturing
Raw materials
Processed materialsElectronics
Textiles and light manufacturing
Other
Source: CEIC China Database; Treasury. Notes: The above product groupings are based on the authors’ calculations using trade data classified under the Harmonized Commodity Description and Coding System (HS). 2012 data is year to October.
Towards greater domestic value-adding
Improvements in technology and workforce skills are gradually leading to a greater share of Chinese merchandise exports being produced in China as domestic suppliers

China: prospects for export-driven growth
92
increase their production capabilities and quality over time. For example, improvements in the quality and precision of Chinese metal fabrication facilities and processes have allowed China to produce capital goods of increasing quality, with Chinese exporters sourcing an increasing share of components via domestic supply chains (Economist Intelligence Unit, 2011).
The domestic value-added share of Chinese exports increased from 54 per cent in 1997 to 61 per cent in 2007, reflecting upgrades to China’s industrial structure (Koopman et al, 2012) (Table 1). Moreover, the ratio of processing exports to imports in processing trade — a measure of the contribution of domestic value-adding activities to processing exports — has since risen from 1.7 to 1.8, suggesting that the share of the final value of China’s processing exports generated domestically has increased further since 2007.
Table 1: Domestic value-added content of China’s merchandise exports Domestic value-added share of merchandise exports
1997 2002 2007
Ordinary exports 94.8 89.6 84.0
Processed exports 21.0 25.4 37.3
All merchandise exports 54.0 53.9 60.6
Source: Koopman et al (2012).
The shift towards ordinary, or non-processing, trade (see Chart 3, Panel A) also supports the contribution of exports to GDP growth. Ordinary Chinese trade is dominated by domestic firms that control a greater part of the production supply chain and produce a greater share of the components used in the production of the final exported product. This means that, dollar for dollar, ordinary exports generate far more domestic activity than the equivalent gross value of processing exports.
Table 1 also shows, however, that the domestic value-added share of ordinary exports has been falling, reflecting a greater use of more sophisticated imported components in ordinary exports. Thus, China’s more advanced export mix in recent years may overstate China’s current capacity to produce highly sophisticated goods (Xu and Lu, 2009).
Towards services
Although examined only briefly here, increased trade in services — which already accounts for 10 per cent of total Chinese exports — will provide further opportunities for exports to support Chinese growth. Services are the fastest-growing component of global trade, accounting for 20 per cent of the world’s total exports in 2010 (Department of Foreign Affairs and Trade, 2012). As economies progress from middle- to higher-income status, the share of GDP accounted for by services tends to increase, reflecting the high income elasticity of demand for services. The share of services in
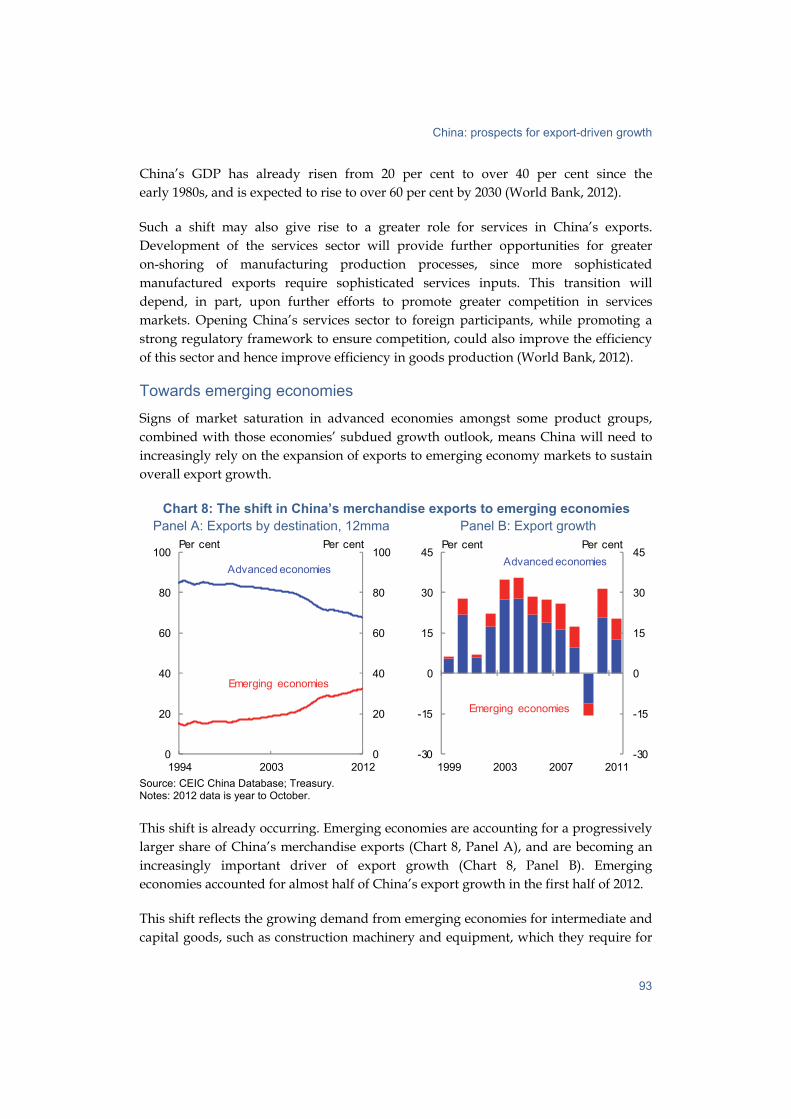
China: prospects for export-driven growth
93
China’s GDP has already risen from 20 per cent to over 40 per cent since the early 1980s, and is expected to rise to over 60 per cent by 2030 (World Bank, 2012).
Such a shift may also give rise to a greater role for services in China’s exports. Development of the services sector will provide further opportunities for greater on-shoring of manufacturing production processes, since more sophisticated manufactured exports require sophisticated services inputs. This transition will depend, in part, upon further efforts to promote greater competition in services markets. Opening China’s services sector to foreign participants, while promoting a strong regulatory framework to ensure competition, could also improve the efficiency of this sector and hence improve efficiency in goods production (World Bank, 2012).
Towards emerging economies
Signs of market saturation in advanced economies amongst some product groups, combined with those economies’ subdued growth outlook, means China will need to increasingly rely on the expansion of exports to emerging economy markets to sustain overall export growth.
Chart 8: The shift in China’s merchandise exports to emerging economies Panel A: Exports by destination, 12mma
0
20
40
60
80
100
0
20
40
60
80
100
1994 2003 2012
Advanced economies
Emerging economies
Per cent Per cent
Panel B: Export growth
-30
-15
0
15
30
45
-30
-15
0
15
30
45
1999 2003 2007 2011
Per centPer cent
Advanced economies
Emerging economies
Source: CEIC China Database; Treasury. Notes: 2012 data is year to October.
This shift is already occurring. Emerging economies are accounting for a progressively larger share of China’s merchandise exports (Chart 8, Panel A), and are becoming an increasingly important driver of export growth (Chart 8, Panel B). Emerging economies accounted for almost half of China’s export growth in the first half of 2012.
This shift reflects the growing demand from emerging economies for intermediate and capital goods, such as construction machinery and equipment, which they require for

China: prospects for export-driven growth
94
their own industrial-led development. Heavy manufacturing exports to emerging economies have grown from 4 per cent of total Chinese merchandise exports in 2000 to 11 per cent in 2011, while exports of electronics have risen from 3 to 7 per cent over the same period (Chart 9, Panel A).
While the share of Chinese exports accounted for by heavy manufacturing and electronics shipped to advanced economies has grown rapidly in recent decades, those shares began to decline from the mid-2000s as emerging economy markets have become more important (Chart 9, Panel B). Thus, as China’s export structure increasingly gears towards the production of these more complex goods, and away from light manufacturing, emerging economies will likely become progressively more important as a source of demand for China’s exports.
Chart 9: China’s shifting export mix, shares of total merchandise exports Panel A: Emerging economies
0
5
10
15
20
0
5
10
15
20
1993 2002 2011
Per centPer cent
Textiles and light manufacturing
Electronics
Heavy manufacturing
Panel B: Advanced economies
0
10
20
30
40
0
10
20
30
40
1993 2002 2011
Per centPer cent
Textiles and light manufacturing
Heavy manufacturing
Electronics
Source: UN Comtrade; Treasury.
Shifting away from export-driven growth?
The Chinese economy will continue to grow strongly in coming decades — albeit at a slower pace than the double-digit rates seen in previous years — as real GDP per capita converges towards that of more advanced Asian economies, such as Korea and Japan (Au-Yeung et al, 2013).
While China’s export sector is likely to continue to be instrumental in this economic convergence, the days of substantial trade surpluses and stellar growth in exports have probably passed. Domestic sources of demand, particularly private consumption, are likely to become increasingly large drivers of China’s GDP growth.
This ‘rebalancing’ will largely be an organic process, going hand-in-hand with rises in productivity, wages and household incomes, as Chinese industry moves into

China: prospects for export-driven growth
95
increasingly sophisticated goods and services, as outlined above, and produces more for the growing domestic market (Hubbard et al, 2012).
Policy settings, however, will also play a crucial role. China’s rapid industrialisation, and government policies designed to foster this process, have led to internal imbalances and deepening domestic structural risks. Combined with the restricted investment opportunities available in China, there are signs that China’s excess stock of domestic savings has been increasingly directed into low yielding and unproductive investments.18
In addressing these imbalances, Chinese authorities will need to continue to remove factor price distortions, undertake financial and credit market reforms, and support a more liberalised exchange rate regime (Kong et al, 2012). Over time, this will support increases in the wages and consumption shares of GDP, and a reduced reliance on external demand, moving the economy onto a more balanced and sustainable growth path.
However, should authorities resist this process through the artificial suppression of costs — for example, by maintaining direct subsidies on factor inputs and the low cost of capital, or suppressing nominal exchange rate appreciation — and other anti-market measures to support the industrial sector, this process may be derailed.
Instead, by allowing this adjustment to take place, through continuing to remove subsidies and promoting the sort of innovation and workforce skills that China needs to move up the value chain, household incomes should continue to grow as a share of the economy. This should see consumer spending become an increasingly important internal driver of China’s growth, and the economy becoming less reliant on external demand.
Implications for China, the region, and the global economy
China’s rise as a merchandise exporter has been unparalleled. While other Asian economies have seen periods of similarly rapid expansion, China’s development, with its vast population and labour force, has been on a much larger scale.
China’s rapid emergence in recent decades has profoundly altered the global economic landscape, as large expansions in China’s export supply have placed sustained downward pressure on the prices of global manufactured goods. Internationally, this
18 The unequal distribution of income between households, firms, and the government, as well
as distortions in China’s financial system, have led to an artificially high savings rate. The pace of reforms to address these distortions remains modest.

China: prospects for export-driven growth
96
has significantly boosted the purchasing power of consumers, and, through price falls for intermediate and capital goods, has reduced input costs for many businesses. 19
Likewise, the next stages in China’s economic development, as it shifts up the value chain, will have profound impacts not only on China, but on the Asian region and the world economy more broadly.
Over time, the forces that placed downward pressure on prices of lower-end global manufactured goods, including China’s rapid urbanisation and the initial catch-up in technology, will dissipate, as wages and other input costs continue to rise.
However, China’s transition towards — and growing specialisation in — heavy manufacturing and electronics will see the supply of these goods expand, as China increasingly competes with the exports of more advanced economies, such as Korea and Japan. As China’s extensive manufacturing capabilities turn to the production of these more sophisticated manufactured goods, downward pressure could increasingly be placed on the global prices of these goods.
This shift, however, will remain gradual. While China has begun to move up the export value chain, the degree of export competition between advanced economies and China — as measured by the similarity of their respective export baskets — remains limited (Economist Intelligence Unit, 2011).
Moreover, China’s continued rise will present opportunities for the export sectors of advanced economies. Already, China’s emergence as the world’s pre-eminent exporter of lower-end and processed manufactured goods has supported greater regional integration and specialisation in global supply chains. As links within these supply chains, advanced economies are engaged in higher-value-adding processing, such as the design and marketing of these goods.
In the same way, China’s move towards more sophisticated manufactured exports is likely to give rise to a new set of opportunities for firms in advanced economies. Countries such as Australia will be able to link into these emerging global supply chains, including through the provision of related technical and professional services. Indeed, China has already overtaken the US and Japan to become Australia’s largest services export market, accounting for 11.3 per cent of total services exports in 2011 (although this is mostly accounted for by education and tourism).20
19 More recently, however, concerns have risen over the impact of China’s growing demand for
commodities on global inflation via the rise in commodity prices over the past decade. 20 While Australian services exports to China fell 3.7 per cent in 2011, services exports to China
have risen 11.8 per cent per annum since 2006 (Department of Foreign Affairs and Trade, 2012). Australia’s exports of services accounted for 16 per cent of total exports in 2011.

China: prospects for export-driven growth
97
While it is difficult to make accurate predictions about sectors that may be affected by shifting patterns in Chinese growth and development, Australia is in a good position to capture some of these new opportunities. Australian firms must continue to forge stronger links with Asian supply chains and focus on innovation and their ‘Asia knowledge’ to develop products and services that are valued in the region. In a broader sense, Australia must maintain an outward orientation to foreign investment, focus on workforce skills, and harness the power of markets to allocate resources more efficiently and to drive innovation and investment (Australian Government, 2012).
China’s rising cost base will also present new opportunities for economies with relatively low wages and favourable logistics and infrastructure. For example, according to the outcomes of the World Bank’s Logistics Performance Index (2012), possible beneficiaries of China’s rising manufacturing cost base include Malaysia, Thailand, India, Philippines, South Africa, Brazil, and Vietnam, which all recorded favourable indices for their relatively low levels of per capita GDP (Chart 10).
Chart 10: Logistics performance and per capita incomes
2.0
2.5
3.0
3.5
4.0
4.5
2.0
2.5
3.0
3.5
4.0
4.5
0 10,000 20,000 30,000 40,000 50,000
GDP per capita (EKS$2011, PPP)
Logistics performance index
China
India
Philippines
Malaysia
Vietnam
South Africa
Indonesia
Thailand
Brazil
Logistics performance index
Source: World Bank, Connecting to Compete: Trade Logistics in the Global Economy, 2012; The Conference Board Total Economy Database, January 2012. Notes: GDP per capita is in US$2011 weighted using output at Èltetö-Köves-Szulc (EKS) purchasing-power-parity (PPP) exchange rates.
The composition of China’s exports, and their contribution to economic growth, will also remain important for global commodities demand, particularly coal and iron ore, and energy resources. Embodied metals exports will become an increasingly important driver of domestic steel demand as China moves up the value chain towards more sophisticated, metals-intensive manufactured goods, such as advanced machinery and automobiles (Rio Tinto, 2012).21
21 Roberts and Rush (2010) estimated that in 2007, 10 per cent of the domestic Chinese supply
of metals products was directly embodied in manufactured exports.

China: prospects for export-driven growth
98
Moreover, investments to upgrade and expand the industrial capabilities of China’s manufacturing industries are likely to be another key driver of future Chinese steel demand, alongside infrastructure and property construction as China’s urban population continues to grow.
Conclusion
China’s export sector has proved pivotal to Chinese economic growth and industrialisation over recent decades. Its development has led to the dissemination of new technologies and business practices to the wider economy, driving productivity gains and wage growth, and has supported the ongoing transition of China’s productive capabilities higher up the value chain.
In the coming decade, the direct contribution of the export sector to economic growth will inevitably decline. Rising labour and other input costs, currency appreciation, and modest growth prospects in advanced economy markets will all present challenges to future export growth, especially for low-skilled manufactured goods. And with China already accounting for over one tenth of global merchandise exports, future export growth will be harder to come by as China approaches saturation point in some of its existing export markets.
Exports will continue, however, to play an important role in China’s economic development. Despite rising rapidly, Chinese per capita incomes remain well below those of advanced economies and its export mix remains relatively unsophisticated. Over time, China’s export industries will continue to shift towards higher value-adding activities and more sophisticated goods and services as productivity rises, and towards emerging economy markets. These transitions will continue to support increases in household incomes and consumption, even as aggregate growth slows from the double-digit rates seen in previous years.
The relative decline in exports as a driver of GDP growth, and the shifting structure of China’s exports, are inevitable steps on China’s path of further economic development, following in the footsteps of former export-oriented emerging economies such as Hong Kong, Korea and Japan. The challenge for the Chinese authorities will be to support these structural transitions with appropriate policy settings, while avoiding sudden slowdowns.
This will require continued innovation and improvements in workforce skills, the ongoing removal of factor price distortions, reforms to financial and credit markets, and the liberalisation of the exchange rate. Over time, these efforts will support increases in the wages and consumption shares of GDP, and a reduced reliance on external demand, moving the economy onto a more balanced and sustainable growth path.

China: prospects for export-driven growth
99
References
Adams, F G, Gangnes, B, and Shachmurove, Y 2004, ‘Why is China so competitive? Measuring and explaining China’s competitiveness’, Research Collection School of Economics (Open Access) Paper 782.
Ahuja, A, Chalk, N, Nabar, M, N’Diaye, P, and Porter, N 2012, ‘An end to China’s imbalances?’, IMF Working Paper No.12/100, April.
Akyuz, Y 2011, ‘Export Dependence and Sustainability of Growth in China’, China & World Economy, vol 19, no. 1, pp 1-23.
Amiti, M and Davis, D R 2009, ‘What’s behind volatile import prices from China’, Current Issues in Economics and Finance, vol 15, no. 1, January.
Anderson, J 2007, ‘Is China export-led?’, UBS Investment Research, Asian Focus, 26 September. Available from: www.ubs.com/economics.
Australian Government 2012, ‘Australia in the Asian Century’, October.
Au-Yeung W, Kouparitsas M, Luu, N, and Sharma D (forthcoming) 2013, Long-term international GDP projections, Treasury Working Paper.
Ceglowski, J and Golub, S 2011: Does China still have a labor cost advantage?, CESifo working paper: Trade Policy, No. 3579, September.
Coates, B and Luu, N 2012, ‘China’s emergence in global commodity markets’, Economic Roundup, Issue 1, pp 1-30.
Craig, A, Elias, S, and Noone, C 2011, ‘Destinations and Uses of East Asian Merchandise Exports’, RBA Bulletin, June Quarter, pp 9-14.
Deer, L and Song, L 2012, ‘China’s approach to rebalancing: a conceptual and policy framework’, China & World Economy, vol 20, no. 1, pp 1-26.
De Melo, J and Robinson, S 1990, ‘Productivity and externalities: Models of export-led growth’, World Bank working paper WPS 387, March.
Department of Foreign Affairs and Trade 2012, Trade in Services, Australia, 2011, July.
Economist Intelligence Unit 2011, ‘Heavy duty: China’s next wave of exports’, August, The Economist Intelligence Unit Limited.

China: prospects for export-driven growth
100
Eichengreen, B, Park, D, and Shin, K 2012, ‘When fast-growing economies slow down: International evidence & implications for China’, Asian Economic Papers 11:1, pp 42-87.
Golly, J and Meng, X 2011 ‘Has China run out of surplus labour’, China Economic Review, vol 22, no. 4, pp 555-572.
Guo, K and N’Diaye, P 2009, ‘Is China’s export-oriented growth sustainable?’ IMF Working Paper No. 09/172, IMF, Washington, DC.
Hawkins, A 2006, ‘The concept of competitiveness’, Treasury Working Paper No. 2006-02, April.
Hubbard, P, Hurley, S, and Sharma, D 2012, ‘The familiar pattern of Chinese consumption growth’, Economic Roundup, Issue 4.
Humpage, O and Jacobson, M 2012, ‘Pass-through and the renminbi’s appreciation’, Federal Reserve Bank of Cleveland Economic Trends, January.
IMF 2012a, ‘Regional Economic Outlook: Asia and Pacific’, Chapter 4: Is China rebalancing? Implications for Asia, April, International Monetary Fund.
IMF 2012b, ‘China: 2012 Article IV Consultation, Staff Report,’ Country Report No. 12/195, July, International Monetary Fund.
KHL Group 2012, iC Yellow Table 5-year Toplist: Ranking of the world’s 50 largest equipment manufacturers 2008-2012, April. Available from http://www.khl.com.
Kong, V, McKissack, A, and Zhang, D 2012, ‘China in a new period of transition’, Economic Roundup, Issue 4.
Koopman, R, Wang, Z, and Wei, S-J 2012, ‘Estimating domestic content in exports when processing trade is pervasive’, Journal of Development Economics, vol 99, no. 1, pp 178-189.
Lardy, N 2002, Integrating China into the Global Economy, Brookings Institution Press, Washington, DC.
McKay, H and Song, L 2012, ‘Rebalancing the Chinese Economy to Sustain Long-Term Growth’, in McKay, H and Song, L (eds.), Rebalancing and Sustaining Growth in China, ANU E Press, Canberra, pp 1-18.
McKay, H and Song, L 2010, ‘China as a global manufacturing powerhouse: strategic considerations and structural adjustment’, China & World Economy, vol 18, no. 1, pp 1-32.

China: prospects for export-driven growth
101
Naughton, B 1996, ‘China’s emergence and prospects as a trading nation’, Brookings Papers on Economic Activity, vol 1996, no. 2, pp 273-344.
Rio Tinto 2012, Unparalleled sector leadership, Iron Ore, June. Available at: http://www.riotinto.com/documents/20120619_-_Investor_briefing_-_Global_IO_Strategy_FINAL_AF_edits.pdf.
Roberts, I, and Rush, A 2010, ‘Sources of Chinese demand for resource commodities’, Reserve Bank of Australia Research Discussion Paper 2010-08, November.
Schott, P 2006, ‘The relative sophistication of Chinese exports’, NBER Working Paper No. 12173, April.
Spence, M 2011, The next convergence: the future of economic growth in a multispeed world, Macmillan, New York.
Tyers, R 2012, ‘Looking inward for transformative growth in China’, Centre for Applied Macroeconomic Analysis Working Paper No. 15/2012, March.
Wei, S-J 2012, ‘Testimony before the U.S.-China Economics and Security Review Commission Hearing on the Evolving U.S.-China Trade and Investment Relationship’, June 14. Available at: http://www4.gsb.columbia.edu/filemgr?&file_id=7311138.
World Bank 2012, China 2030: Building a modern, harmonious and creative high-income society, The World Bank / Development Research Centre of the State Council, the People’s Republic of China.
World Bank 2012a, Connecting to Compete: Trade Logistics in the Global Economy, The International Bank for Reconstruction and Development/The World Bank.
Xing, Y, and Detert, N 2010, ‘How the iPhone widens the United States trade deficit with the People’s Republic of China’, ADBI Working Paper No. 257, December.
Xu, B 2010, ‘The sophistication of Chinese exports: is China special?’, China Economic Review, vol 21, pp 482-93.
Xu, B, and Lu, J 2009, ‘Foreign direct investment, processing trade, and the sophistication of China’s exports’, China Economic Review, Vol. 20, pp 425-439.
Yu, M, and Tian, W 2012, ‘China’s Processing Trade: A firm-level analysis’, in McKay, H and Song, L (eds.), Rebalancing and Sustaining Growth in China, ANU E Press, Canberra, pp 111-148.

China: prospects for export-driven growth
102
Appendix A: Chinese exports by product
In our analysis of the shifts in the direction and composition of Chinese merchandise exports, we have used the Harmonized Commodity Description and Coding System (HS) of tariff nomenclature. The HS system is an internationally standardized system of names and numbers for classifying traded products developed and maintained by the World Customs Organization (WCO). Imports and exports are recorded on the date when the goods are cleared through customs.
We classify trade in products under the HS classification system into the following high level product groupings, which accord with the two digit product classification codes used in the HS classification system. This data was downloaded from the China General Administration of Customs via the CEIC China Database and from the United Nations Commodity Trade Statistics Database.
Raw materials: refers to the sum of: live animal product (01-05); vegetable product (06-14); animal or vegetable fat or oil (15); mineral product (25-27); and wood and article, and charcoal (44-46).
Processed materials: refers to the sum of: prepared foodstuff, beverage and tobacco (16-24); product of chemical or allied industry (28-38); plastics, rubber and article thereof (39-40); pulp of wood, paper, and paperboard (47-49); and articles of stone, cement or glass (68-70).
Textiles and other light manufacturing: refers to the sum of: raw hide, skin and leather (41-43); textile and textile article (50-63); footwear, headgear and umbrellas (64-67); and miscellaneous manufactured article (94-96).
Electronics: refers to the sum of: electrical equipment (85); and optical equipment, clocks and musical instruments (90-92).
Heavy manufacturing: refers to the sum of: vehicle, aircraft, vessel and transport equipment (86-89); arms and ammunition (93); nuclear reactor, boiler and machinery (84); and base metals and articles thereof (72-83).
Other: refers to the sum of: pearl, precious stones and metals (71); art, collector’s piece and antiques (97-98); and commodities not classified according to kind (99).