economic role of marine transportation in …mdot.ms.gov/documents/intermodal...
TRANSCRIPT
report
Economic Role of Marine Transportation in Mississippi
prepared forMississippi DOTprepared by
Cambridge Systematics, Inc.730 Peachtree Street, Suite 1000Atlanta, Georgia 30308dateNovember 22, 20134

Economic Role of Marine Transportation in Mississippi
Table of Contents1.0 Introduction.................................................................1-1
1.1 Study Overview....................................................................1-11.2 Organization of Report.........................................................1-2
2.0 Statewide Port System Overview..................................2-12.1 Port Profiles..........................................................................2-5
Port of Aberdeen...................................................................2-5Port of Amory.......................................................................2-6Port of Bienville....................................................................2-7Port of Biloxi.........................................................................2-8Claiborne County Port...........................................................2-9Clay County Port...................................................................2-9Port of Greenville................................................................2-10Port of Gulfport...................................................................2-11Port of Itawamba................................................................2-13Lowndes County Port..........................................................2-14Port of Natchez...................................................................2-15Port of Pascagoula..............................................................2-16Port of Rosedale.................................................................2-18Port of Vicksburg................................................................2-19Yazoo Port..........................................................................2-20Yellow Creek State Inland Port...........................................2-22
3.0 Mississippi Port User Profile..........................................3-13.1 Mississippi Modal Dependence and National Modal
Shares..................................................................................3-13.2 Volumes by Industry.............................................................3-93.3 Port-Dependent Industries..................................................3-10
4.0 Economic Impact of Ports in Mississippi.........................4-14.1 Overview of Approach..........................................................4-14.2 Findings................................................................................4-2
Statewide Impact..................................................................4-3Individual Port Analysis.........................................................4-7
4.3 Conclusion............................................................................4-8
Cambridge Systematics, Inc. i8730.030

Economic Role of Marine Transportation in Mississippi
List of TablesTable 2.1 Total Tonnage by Port and Direction 2011 Tons 2-4Table 3.1 State and National Marine Mode Share by Industry Outbound
Tonnage 3-3Table 3.2 State and National Marine Mode Share by Industry Inbound
Tonnage 3-6Table 4.1 Summary of Annual Statewide Economic Impact of the Ports
in Mississippi, 2013 4-3Table 4.2 Direct Employment in Marine Transportation in Mississippi,
2014 4-3Table 4.3 Employment and Income at Port Dependent Businesses in
Mississippi by Industry, 2014 4-4Table 4.4 Employment Impact of Mississippi Ports by Source, 2014
4-4Table 4.5 Summary of Direct Economic Impacts of Individual Ports,
2014 4-7Table 4.6 Total Economic Impacts of Individual Ports in Mississippi,
2013 4-8
Cambridge Systematics, Inc. iii

Economic Role of Marine Transportation in Mississippi
List of FiguresFigure 2.1 Mississippi Port and Waterway System 2-2Figure 2.2 Mississippi Port Traffic by Direction 2011 Tons 2-3Figure 2.3 Top Waterborne Commodities in Mississippi 2011 Tons2-5Figure 2.4 East Pearl River Tonnage by Commodity 2011 2-8Figure 2.5 Port of Greenville Tonnage by Commodity 2011 2-11Figure 2.6 Port of Gulfport Tonnage by Commodity 2011 2-13Figure 2.7 Port of Natchez Tonnage by Commodity 2011 2-16Figure 2.8 Port of Pascagoula Tonnage by Commodity 2011 2-17Figure 2.9 Port of Rosedale Tonnage by Commodity 2011 2-18Figure 2.10 Port of Vicksburg Tonnage by Commodity 2011 2-20Figure 2.11 Lower Yazoo Tonnage by Commodity 2011 2-21Figure 3.1 State and National Marine Mode Share by Industry 2011
Freight Production Tonnage 3-4Figure 3.2 State and National Marine Mode Share by Industry 2011
Freight Attraction Tonnage 3-7Figure 3.3 Marine Freight Generation by Industry 3-9Figure 3.4 Top 5 Waterborne Freight Generating Industries in
Mississippi 2011 Tons 3-10Figure 3.5 Location of Port Dependent Manufacturing Establishments in
Northern Mississippi, 2013 3-12Figure 3.6 Location of Port Dependent Manufacturing Establishments in
Southern Mississippi, 2013 3-13Figure 3.7 Location of Port Dependent Agricultural Production and
Service Establishments in Northern Mississippi, 2013 3-14Figure 3.8 Location of Port Dependent Agricultural Production and
Service Establishments in Northern Mississippi, 2013 3-15Figure 3.9 Petroleum and Mining Employment by County, 2013 3-17Figure 3.10 Chemical Manufacturing Employment, by County, 2013
3-19Figure 3.11 Crop Production Employment, by County, 2013 3-21Figure 3.12 Animal Production in Mississippi by County, 2013 3-22Figure 4.1 Summary Approach to Estimating Economic Importance of
Ports 4-2Figure 4.2 Location of Port Dependent Businesses in Mississippi by
Industry and Employment Size 4-5
Cambridge Systematics, Inc. v
List of Figures, continued
Figure 4.3 Location of Port Benefited Businesses in Mississippi by Industry and Employment Size 4-6
vi Cambridge Systematics, Inc.
Economic Role of Marine Transportation in Mississippi
1.0 IntroductionMarine transportation is critical to the health of the Mississippi economy. Important industries within the state including agriculture, chemical manufacturing, energy, and steel rely on Mississippi’s extensive port and waterway network to receive raw materials and get goods to market. Barges traveling on the Mississippi River and Tenn-Tom Waterway provide Mississippi shippers with access to one of the most economical and environmentally friendly transportation modes available. These waterways connect the state to the entire Mississippi River system and its tributaries including the Ohio and Tennessee Rivers. They also provide connections to Gulf Coast ports such as New Orleans, Mobile, and Gulfport, which in turn give Mississippi access to global markets.
1.1 STUDY OVERVIEWThe Mississippi Department of Transportation (MDOT) commissioned this study to assess the economic role of ports and waterways in supporting and enhancing the state’s economy. The key objectives of the study are to: Profile the economic activity of the port facilities in Mississippi; Identify and assess port-dependent and port-benefited industries in
Mississippi; and To evaluate the economic impact of ports and waterways on the
state in terms of employment, tax revenue, economic output, and induced or multiplier effects.
The study team used a combination of port/shipper interviews, site visits, analysis of commodity flow data, and economic modeling to accomplish these goals. The results of the study provides insight to MDOT and other stakeholders to inform future investment decisions in Mississippi’s ports and waterways.Documenting the role of the ports in the State of Mississippi in the following steps. Step 1: Literature review and data collection: MDOT has some key resources and previous study efforts including the Statewide Goods Movement Study, Multiplan, previous statewide port studies and various specific port master plans and projects throughout the state. These served as our starting point Step 2: Stakeholder interviews: The CS team conducted primary data collection in the form of face-to-face and phone interviews with stakeholders which provided input for developing the existing and future port market opportunities. The interviews were used in validating secondary data, filling data and information gaps and providing the users’ perspective. The final list of interviewees included:
Cambridge Systematics, Inc. 1

Economic Role of Marine Transportation in Mississippi
– Ports;– Shippers (port users in the State);– Local/regional economic development agencies; and– Industrial and commercial developers including the utility
companies. Step 3: Summarize Port Economic Activity: For each port, CS examined essential statistics including size, governance, activity, tenants, users, employment, budget, revenue and other data relevant to economic analysis. An overview of each port and its activities was developed and served as a starting point for the port user profile and economic analysis. Step 4: Develop a Port User Profile: The data gleaned from the first three steps served as input into the Port User Profile for each of the ports and for the State. The port user profile documents what businesses rely on what port services and port assets in the state. The profile categorizes port users as port dependent and port benefited. This analysis is based on commodity flow data, stakeholder interviews and consultant team expertise.
1.2 ORGANIZATION OF REPORTThe remainder of this report is organized as follows: Section 2 presents an overview of the port system and marine
transportation in Mississippi; Section 3 profiles key marine freight users (industries) in
Mississippi, categorizing them as port-dependent and port-benefited. Maps are provided to show the location of these key industries and their jobs in relation to the ports and waterways that serve them; and
Section 4 presents the findings from the economic analysis including a summary of the methodology, data and findings. The economic role is described from a statewide perspective and for individual ports.
2 Cambridge Systematics, Inc.
Economic Role of Marine Transportation in Mississippi
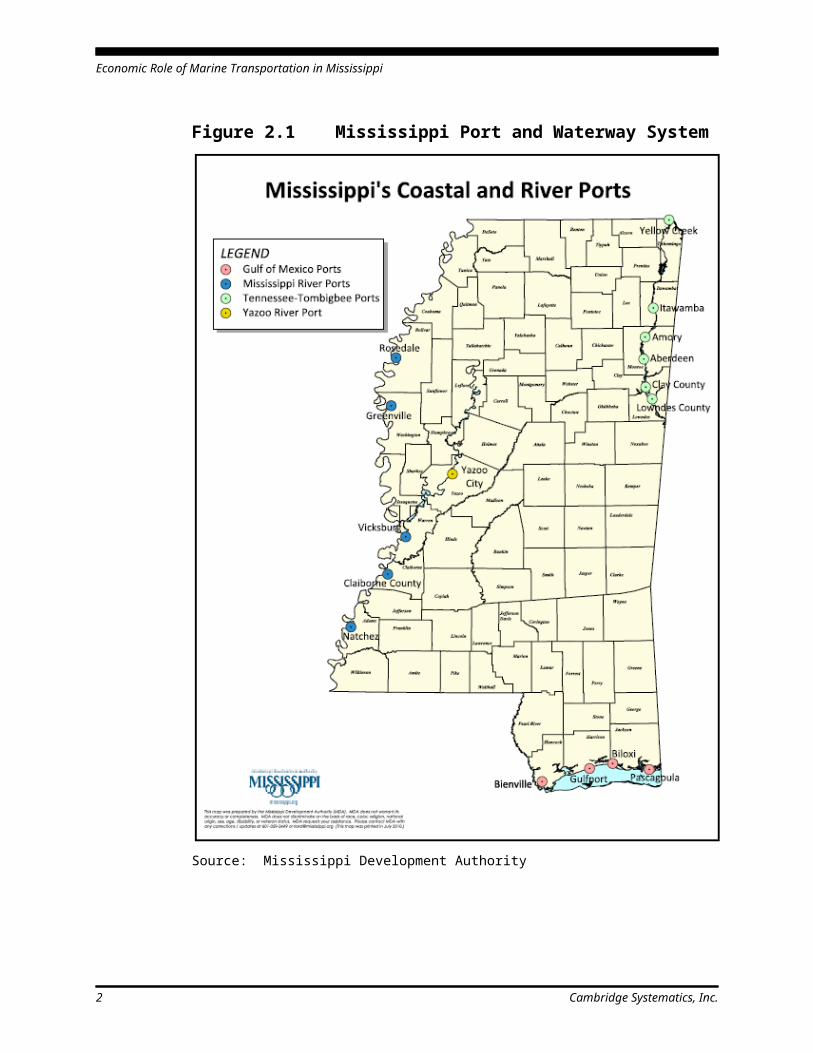
2.0 Statewide Port System OverviewThere are 16 public ports in Mississippi, as shown in Figure 2.1. They include: Gulf Coast ports – Gulfport, Biloxi, Bienville, and Pascagoula; Mississippi River ports – Rosedale, Greenville, Vicksburg, Claiborne
County, and Natchez; Tenn-Tom ports – Yellow Creek State Inland Port, Itawamba, Amory,
Aberdeen, Clay County, and Lowndes County; and Yazoo River Port, located in Yazoo County. The ports, as business enterprises, support significant employment and business spending in the state. In 2014, the ports employed 1,725 people in Mississippi and paid out almost $100 million in payroll spending. In addition the ports spent more than $150 million on goods and services from Mississippi based businesses.
Cambridge Systematics, Inc. 1
Economic Role of Marine Transportation in Mississippi
Figure 2.1 Mississippi Port and Waterway System
Source: Mississippi Development Authority
2 Cambridge Systematics, Inc.
Economic Role of Marine Transportation in Mississippi
A total of nearly 55 million tons of freight was shipped through Mississippi ports in 2011, including shipments by water to, from, and within individual ports. As shown in Figure 2.2, more than half of these shipments (about 31 million tons) were cargo receipts (shipments into a port). Another 37 percent (about 20 million tons) were goods being shipped out of the state’s ports, while the remaining 3.7 million tons was cargo being transferred within the same port.1
Figure 2.2 Mississippi Port Traffic by Direction2011 Tons
3105180157%
2012012937%
36667667%
Receipts Shipments IntraportSource: U.S. Army Corps of Engineers
1 Data for this analysis was drawn from the U.S. Army Corps of Engineers Waterborne Commerce of the United States. The Waterborne Commerce data provide statistics on foreign and domestic waterborne commerce moved on U.S. waters. Data are provided in tons by commodity for key ports, harbors, waterways, and canals. Part 2 covers the Gulf Coast and Mississippi River system. Commodities are reported at 4-digit Standard International Trade Classification (SITC) level. Data available for calendar years 2007-2011, broken down by port, year, and direction (receipts, shipments, intraport).
Cambridge Systematics, Inc. 3
Economic Role of Marine Transportation in Mississippi
Table 2.1 provides total tonnage in 2011 for each port by direction of traffic. Note that the Corps of Engineers does not break out tonnage statistics for the Tenn-Tom ports; instead, they are all combined. Also, the Corps does not publish statistics for the Port of Bienville, so the East Pearl River is used here as a proxy, although this includes some private terminals on the river that are not part of the port. As shown in the table, Pascagoula has by far the most tonnage of all Mississippi ports, with nearly 37 million tons in 2011. The vast majority of this tonnage (89 percent, or nearly 33 million tons) is petroleum and related products. The combined tonnage handled by Tenn-Tom ports totaled nearly 3 million tons in 2011, followed by Vicksburg (2.6 million tons) and Greenville (2.5 million tons). The Port of Gulfport rounds out the top five at 2.2 million tons. Gulfport is the state’s only container port and is a major port of entry for fruit shipments from Latin America.
Table 2.1 Total Tonnage by Port and Direction2011 Tons
Port Receipts Shipments Intraport TotalPascagoula 22,341,772 14,514,028 6,991 36,862,791
Tenn-Tom† 1,060,226 1,267,174 629,499 2,956,899
Vicksburg 1,870,542 669,027 83,141 2,622,710
Greenville 1,138,396 1,390,988 0 2,529,384
Gulfport 1,409,968 740,980 0 2,150,948
Biloxi 1,584,257 28,039 0 1,612,296
Rosedale 221,810 1,142,727 0 1,364,537
Lower Yazoo 1,094,910 193,854 0 1,288,764
Natchez 326,262 173,312 0 499,574
East Pearl River* 319,232 0 0 319,232
Upper Yazoo 3,658 0 0 3,658
Source: U.S. Army Corps of Engineers† Includes Aberdeen, Amory, Clay County, Itawamba, Lowndes County, and Yellow Creek.
* Used as proxy for Port of Bienville.
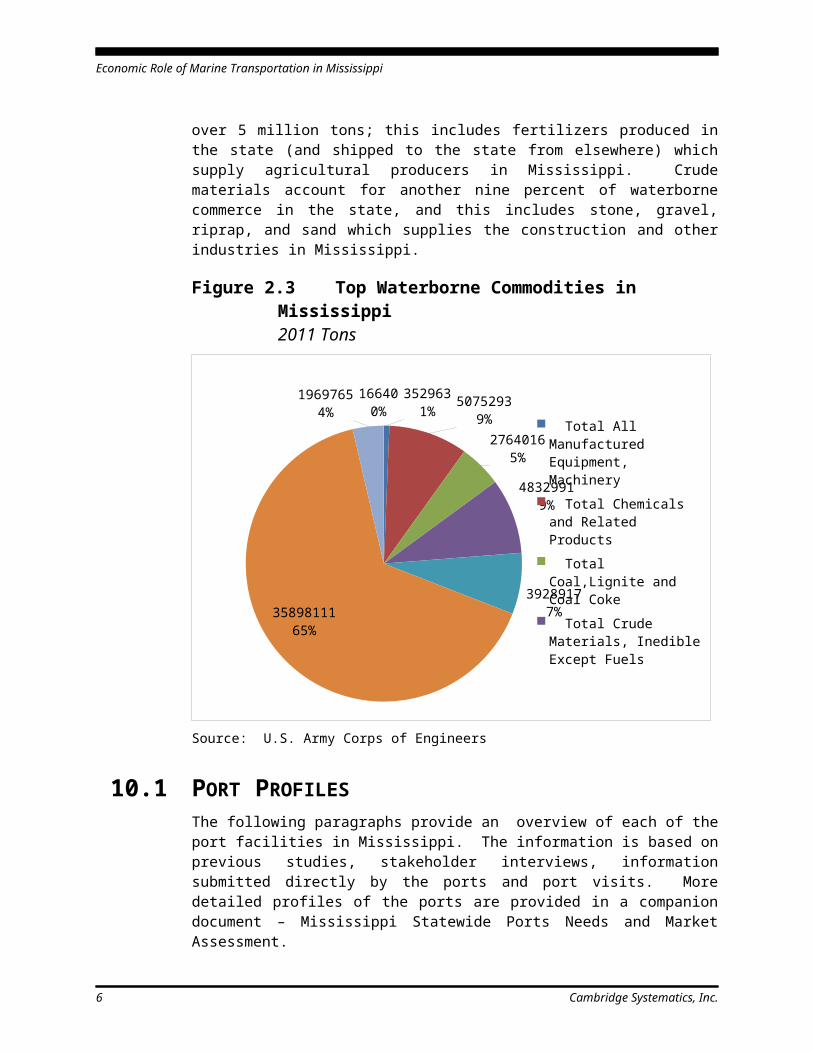
Figure 2.3 shows the commodity breakout for all waterborne shipments in Mississippi for 2011. Nearly two thirds of the total tonnage handled by the state’s ports is petroleum and related products. These commodities accounted for almost 36 million tons in 2011. The next largest commodity group is chemicals and related products at just over 5 million tons; this includes fertilizers produced in the state (and shipped to the state from elsewhere) which supply agricultural producers in Mississippi. Crude materials account for another nine percent of waterborne commerce in the state, and this includes stone,
4 Cambridge Systematics, Inc.
Economic Role of Marine Transportation in Mississippi
gravel, riprap, and sand which supplies the construction and other industries in Mississippi.
Figure 2.3 Top Waterborne Commodities in Mississippi2011 Tons
3529631%
50752939%
27640165%
48329919%
39289177%
3589811165%
19697654%
166400%
Total All Manufactured Equipment, Machinery
Total Chemicals and Related Products
Total Coal,Lignite and Coal Coke
Total Crude Materials, Inedible Except Fuels
Total Food and Farm Products
Total Petroleum and Petroleum Products
Total Primary Manufactured Goods
Total Unknown or Not Elsewhere Classified
Source: U.S. Army Corps of Engineers
2.1 PORT PROFILESThe following paragraphs provide an overview of each of the port facilities in Mississippi. The information is based on previous studies, stakeholder interviews, information submitted directly by the ports and port visits. More detailed profiles of the ports are provided in a companion document – Mississippi Statewide Ports Needs and Market Assessment.
Port of AberdeenThe Port of Aberdeen is located along the Tenn-Tom in Monroe County. The port has Class I rail access via Kansas City Southern, is adjacent to U.S. 45, and is about half an hour away from U.S. 78 which is designated as the future Interstate 22 from Memphis to Birmingham. The port has about 52 acres of land available for development; there is also ample adjacent land that is suitable for development should demand warrant it.
Cambridge Systematics, Inc. 5

Economic Role of Marine Transportation in Mississippi
The port currently has one active tenant. Enterprise Refined Products receives distillate fuel products by barge at the port, which are then distributed by truck to the surrounding Golden Triangle and northeastern Mississippi regions to more than 25 customers. Enterprise has automated truck bays which operate 24/7 transferring product to trucks. Products distributed include regular and premium gasoline, ultra low sulfur diesel, and ethanol. Enterprise employs about three staff at this facility and pays $2,000 monthly in rent, which constitutes the operating income of the port. The port has previously handled logs and some grain. Pearson Technologies also had a pilot biofuels project at the port but it is no longer operational; the port is looking to re-start it. Another biofuels company has been looking at developing a facility on the east bank of the Tenn-Tom; there is about 500 acres of Corps-owned land available there. The port is targeting biomass, chemicals, bentonite, and Yokohama-related business for future development.
Port of AmoryThe Port of Amory is also located in Monroe County at river mile 369.5, just upriver from Aberdeen. It has a rail spur which provides access to the BNSF, and the port has good connections to U.S. 278 as well as Mississippi Highway 6. The port has a 100,000 square foot industrial building, as well as facilities for bulk unloading to from barges to trucks, rail, and storage. There is an excavator, a 30-ton bridge crane, and a tugboat. Kinder Morgan runs the 24-acre terminal site under a lease agreement with the City of Amory. From September 2012 through August 2013 the port handled 309 barges, 3,265 railcars, and 7,240 trucks. The port employs 22 people directly with a payroll of over $1 million annually for Mississippi based employees. The Port of Amory has experienced rapid growth since 2005, when Tronox began operations in the area. Tronox is a global chemical manufacturing company specializing in titanium products. Other key businesses that rely on the port include Midcontinent Coal and Coke, which processes and sells coal and carbon products; and Enviva, which ships wood pellets by barge downriver for export to Sweden. Dumtar Paper has a private dock at Amory that is also run by Kinder Morgan. The predominant commodities handled at the port are titanium ores, pet coke, sand, anthracite coal, and wood pellets. The port also handles some fertilizer. Key activities by user are summarized below: Tronox: The terminal receives titanium ores and calcined pet coke
by barge. Ores are segregated according to type and placed in one of six storage domes. Calcined pet coke is then loaded directly to rail or trucks with no further processing. Ores are blended to customer specification and loaded out to either rail or truck. Calcined sand is also received by rail and transloaded to trucks for
6 Cambridge Systematics, Inc.

Economic Role of Marine Transportation in Mississippi
customer delivery. In the year ended August 31, 2013, the port handled 512,668 tons of titanium ore and pet coke, and 10,439 tons of sand.
Midcontinent Coal & Coke: Receives anthracite coal by barge and unloads it to a stockpile. The coal is dried and stored in a silo. Midcontinent also collects the fines and dust, pelletizes it, and stores it in another silo. Injection carbon and pelletized injection carbon are then blended and loaded to trucks for distribution. Midcontinent processed and shipped nearly 57,000 tons of injection carbon from September 1, 2012 through August 31, 2013.
Enviva: Enviva receives wood pellets by truck and transfers them directly to barges via dump chute. They transferred 123,509 of wood pellets in the year ended August 31, 2013.
The Port of Amory is looking to continue this growth pattern. Target industries include further development in the wood products and chemicals product lines, as well as automotive business related to the Toyota plant which is located 40 miles away.
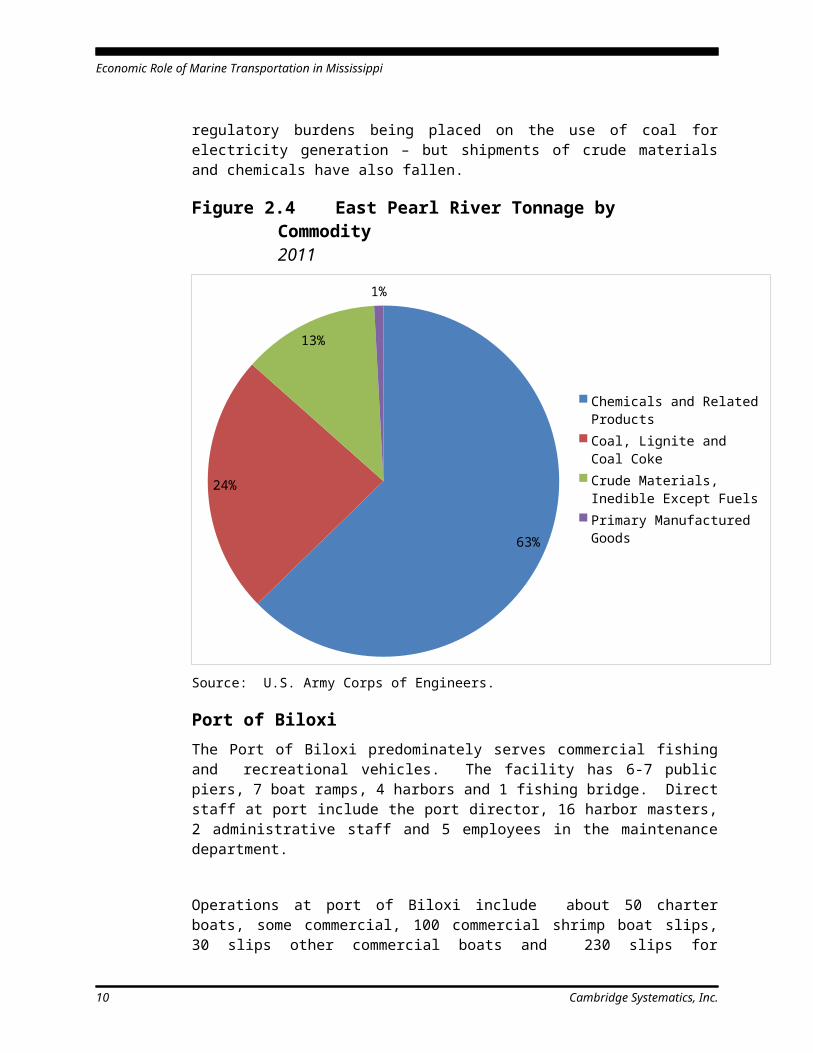
Port of BienvilleThe Port of Bienville is located in Hancock County in southwestern Mississippi, near mile marker 24 on Mulatto Bayou with access to the Gulf Intracoastal Waterway. The Port Bienville Industrial Park is owned and operated by the Hancock County Port and Harbor Commission. It is 3,600 acres in size, is connected to Interstate 10 via U.S. 90, and has a connection to the CSX Railroad via the Port Bienville Shortline Railroad. The port employs 34 people with an annual payroll of $1.4 million. Since the Corps of Engineers does not compile statistics specifically for the Port of Bienville, cargo tonnage for the East Pearl River is used instead. It should be noted that these statistics may include shipments associated with private terminals along the waterway. As shown in Figure 2.4, nearly two thirds of East Pearl River commodity flows consists of chemicals and related products, which totaled over 200,000 tons in 2011. SNA Polychemie and SABIC both manufacture polymers at Port Bienville. Nearly one quarter of the remainder was coal, amounting to about 76,000 tons in 2011, followed by other non-edible crude materials such as aggregates and ores (12 percent, or about 40,000 tons). SSA Marine operates a bulk product terminal handling coal, ores, and other bulk materials at Port Bienville. Coastal Mining and Marine also mines sand and clay in the area which is shipped out by both barge and rail. A small portion of tonnage consists of primary manufactured goods – PSL North America imports steel through the port which it uses to make steel pipe. Total tonnage moved on the East Pearl River has been falling over the last several years, having peaked at 465,000 tons in 2008 but falling to
Cambridge Systematics, Inc. 7
Economic Role of Marine Transportation in Mississippi
319,000 tons in 2011. This has mostly been driven by a decline in coal tonnage – probably caused by falling prices for natural gas as well as new regulatory burdens being placed on the use of coal for electricity generation – but shipments of crude materials and chemicals have also fallen.
Figure 2.4 East Pearl River Tonnage by Commodity2011
63%
24%
13%
1%
Chemicals and Related ProductsCoal, Lignite and Coal CokeCrude Materials, Inedible Except FuelsPrimary Manufactured Goods
Source: U.S. Army Corps of Engineers.
Port of BiloxiThe Port of Biloxi predominately serves commercial fishing and recreational vehicles. The facility has 6-7 public piers, 7 boat ramps, 4 harbors and 1 fishing bridge. Direct staff at port include the port director, 16 harbor masters, 2 administrative staff and 5 employees in the maintenance department.
Operations at port of Biloxi include about 50 charter boats, some commercial, 100 commercial shrimp boat slips, 30 slips other commercial boats and 230 slips for recreation vessels. There are four seafood processing facilities that are serviced from the boats operating from the Port of Biloxi.
8 Cambridge Systematics, Inc.
Economic Role of Marine Transportation in Mississippi
In addition to fishing activities, the port also host numerous events that contribute significantly to tourism activities. Some of the annual events include: Smoke in the Sound which is a race boat event at the end of April; National Billfish tournament; Blue Marlin Tournament; and Southern King Fish Tournament.
Claiborne County PortClaiborne County Port is located on the Mississippi River in southwestern Mississippi, at river mile 404.8. It has highway access to U.S. 61, and has been used to load and unload timber for a company in Alabama and special project cargo for Entergy Nuclear; however the port is not currently active. However, the Port Commission and the Claiborne County Economic Development District have been working closely with Entergy Nuclear over the last few years to facilitate Entergy’s recent upgrades and expansions of its Grand Gulf nuclear power station, including entering a lease agreement allowing Entergy to use the port for expansion projects.
Clay County PortClay County Port is located at river mile 339 on the Tenn-Tom Waterway. It is approximately eight miles from West Point, and 10 miles from the Yokohama tire plant. The port has no rail service but is located close to U.S. 45 and MS 50. The port employs 15 people with an annual payroll of $1.25 million for Mississippi based employees. The port receives 3 inbound barges per week on average. The key commodities handled at the port are: Rock salt – The port receives about 175,000 tons of rock salt each
year from Louisiana; the salt is used as a production input for the Echo and Tronox chemical plants located in the area.
Grains – Clay County Port handles about 135,000 tons of grain per year, including local production of corn, soybeans, and wheat. The port receives some of this product inbound from St. Louis, but most of it is outbound. Seventy percent of the soybeans go to New Orleans for export. The rest go to a crushing plant in Tennessee. Almost all the wheat handled at the port is exported.
Nitrogen – The port began importing nitrogen for fertilizer in the last year, and recently constructed a new 9,000 ton warehouse for Crop Production Services, which is partnering with Agrichem to distribute a new fertilizer product from Clay County.
Cambridge Systematics, Inc. 9
Economic Role of Marine Transportation in Mississippi
Industrial boilers – Babcock and Wilcox manufactures large industrial boilers in the region. The boilers are moved by heavy haul truck to Clay County Port where they are transferred to barge either for export or domestic shipment to the north. Because of their size and weight, these shipments are completely dependent on the port.
Clay County Port has experienced steady growth over the last five years. In 2012 the port had $72 million in revenue and generated $14,000 in property taxes (including private tenants). Tom Soya Grain employs 14 staff at the port; the Echo and Tronox plants employ several hundred between them. Port officials indicated there is a new project that will invest about $1.2 million, though details were not available. The port is also hoping to capture some shipments of construction materials for the new Yokohama plant.
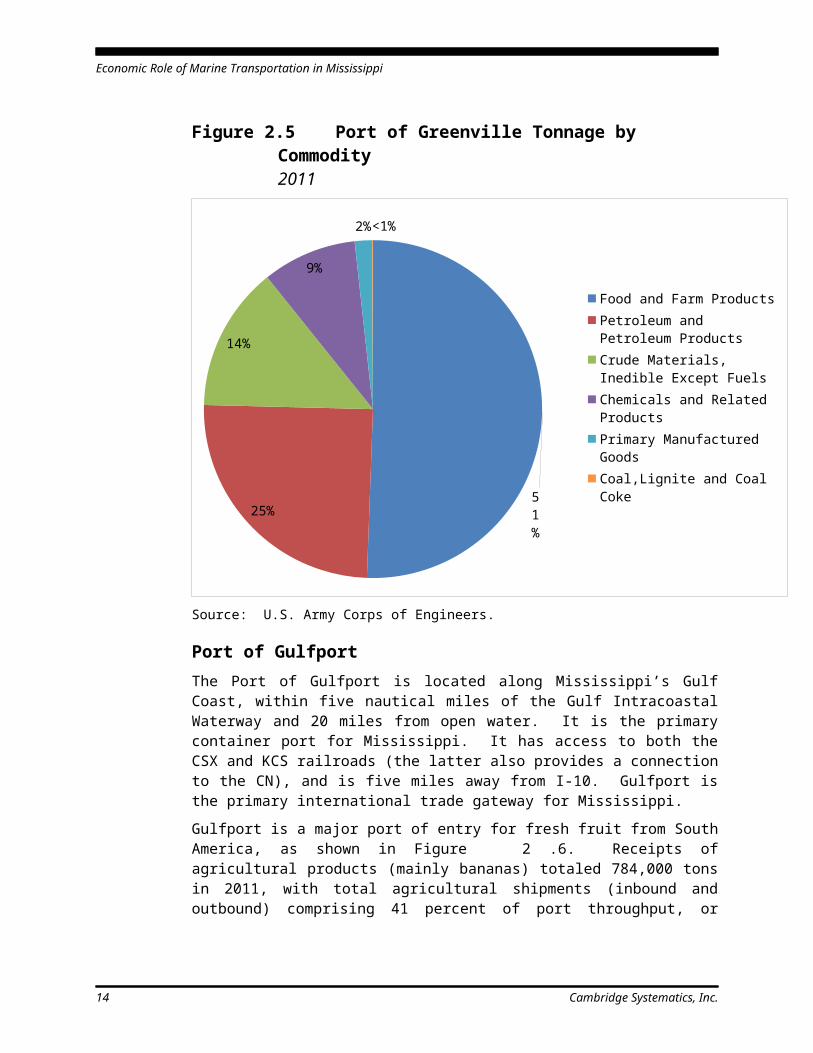
Port of GreenvilleThe Port of Greenville is located at river mile 537 on Lake Ferguson in Washington County. The port’s market area includes Washington, Bolivar, Sunflower, Humphries, Montgomery, Carroll, and Leflore Counties. As shown in Figure 2.5, the primary commodities handled by the port are: Food and farm products, which account for half of the tonnage
shipped in 2011, or 1.3 million tons. Farmers Grain Terminal and Producers Rice Mill both load barges with grain and farm products produced in the Delta. Farmers Grain alone loads about 500 barges annually and employs 75 people full time (140 during harvest season).
Petroleum and petroleum products, which made up one quarter of tonnage in 2011. Delta Terminal and Transmontaigne receive distillate products (gasoline and diesel mostly) by barge at their terminals in Greenville, from where the product is distributed by truck throughout the region – these commodities accounted for nearly 572,000 tons in 2011. Dynergy Midstream also receives liquefied natural gas at the port.
Crude materials (mostly aggregates and scrap iron/steel) made up 14 percent of port throughput in 2011. APAC Mississippi and Martin Marietta Aggregates both operate terminals at the port where they receive limestone, sand and gravel, and other mineral products which are used to make asphalts and paving materials as well as distributed regionally for road building and other construction projects.
Chemicals and chemical products made up most of the remainder at nine percent of the total in 2011, or 228,000 tons. Most of this is fertilizer which arrives by barge and is sold on to
10 Cambridge Systematics, Inc.
Economic Role of Marine Transportation in Mississippi
wholesalers and co-ops who supply farms in the region. Gavilon Fertilizer and Terral River Service are the two fertilizer tenants at the port.
Figure 2.5 Port of Greenville Tonnage by Commodity2011
51%
25%
14%
9%
2%<1%
Food and Farm ProductsPetroleum and Petroleum ProductsCrude Materials, Inedible Except FuelsChemicals and Related ProductsPrimary Manufactured GoodsCoal,Lignite and Coal Coke
Source: U.S. Army Corps of Engineers.
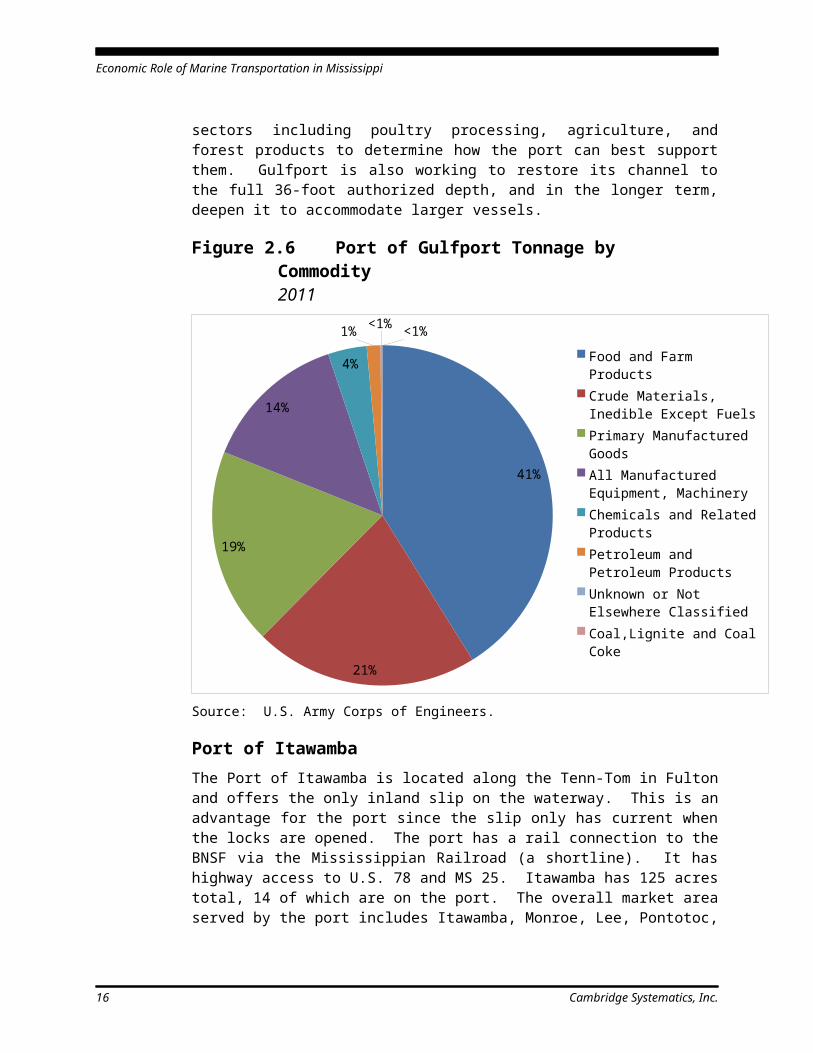
Port of GulfportThe Port of Gulfport is located along Mississippi’s Gulf Coast, within five nautical miles of the Gulf Intracoastal Waterway and 20 miles from open water. It is the primary container port for Mississippi. It has access to both the CSX and KCS railroads (the latter also provides a connection to the CN), and is five miles away from I-10. Gulfport is the primary international trade gateway for Mississippi.Gulfport is a major port of entry for fresh fruit from South America, as shown in Figure 2.6. Receipts of agricultural products (mainly bananas) totaled 784,000 tons in 2011, with total agricultural shipments (inbound and outbound) comprising 41 percent of port throughput, or 871,000 tons. Dole recently renewed its lease at Gulfport to import bananas and other fruit. The next largest commodity group is crude materials, which is mostly made up of incoming sand, gravel and rock, and non-ferrous ores and
Cambridge Systematics, Inc. 11
Economic Role of Marine Transportation in Mississippi
scrap. This trade totaled about 458,000 tons in 2011, or 21 percent of the total. Primary manufactured goods and machinery constituted a further 19 percent and 14 percent respectively. The former includes significant volumes of outgoing paper products (392,000 tons in 2011), while the latter is a relatively balanced trade including textiles, vehicles, and machinery. Crowley Maritime operates a roll-on/roll-off (RO/RO) liner service to Gulfport which calls on various Latin American ports. Other tenants include Dupont, Gulf Coast Shipyard Group, Inc. and McDermott. The Port of Gulfport is in the midst of a major expansion project designed to help it recover from the effects of Hurricane Katrina (which wrought significant damage on the port) and expand its cargo handling capabilities and business opportunities. This $570 million project is expected to be complete in 2016, with construction activity ramping up over the next year or so. The port has filled in 84 acres in the Mississippi Sound (which expanded the West pier) and is in the process of developing another 50 acres (for a proposed fourth terminal). The restoration project is focused on five key goals: creating new jobs, deepening the port’s channel, maintaining current tenants, increasing the port’s capacity, and fostering new commercial development.2 Overall the port anticipates freeing up about 100 acres for new commercial development on the port. The port hopes to capture some of the cargo growth that will result from the Panama Canal expansion project and has recently signed memoranda of understanding with two prospective new tenants who will operate in the Asian and European trade lanes. Gulfport is also looking to diversify its cargo base to include more bulk and break bulk cargo, instead of focusing solely on containers. The port is consulting with Mississippi-based businesses in various sectors including poultry processing, agriculture, and forest products to determine how the port can best support them. Gulfport is also working to restore its channel to the full 36-foot authorized depth, and in the longer term, deepen it to accommodate larger vessels.
2 Mississippi State Port Authority, Status Report on the Port of Gulfport Restoration Project, September 2013.
12 Cambridge Systematics, Inc.
Economic Role of Marine Transportation in Mississippi
Figure 2.6 Port of Gulfport Tonnage by Commodity2011
41%
21%
19%
14%
4%
1% <1% <1%
Food and Farm ProductsCrude Materials, Inedible Except FuelsPrimary Manufactured GoodsAll Manufactured Equipment, MachineryChemicals and Related ProductsPetroleum and Petroleum ProductsUnknown or Not Elsewhere ClassifiedCoal,Lignite and Coal Coke
Source: U.S. Army Corps of Engineers.
Port of ItawambaThe Port of Itawamba is located along the Tenn-Tom in Fulton and offers the only inland slip on the waterway. This is an advantage for the port since the slip only has current when the locks are opened. The port has a rail connection to the BNSF via the Mississippian Railroad (a shortline). It has highway access to U.S. 78 and MS 25. Itawamba has 125 acres total, 14 of which are on the port. The overall market area served by the port includes Itawamba, Monroe, Lee, Pontotoc, Tishomingo, and Prentiss Counties in Mississippi as well as parts of northwest Alabama. The Port of Itawamba specializes in the movement of several key commodities: Fabricated steel products – Ferguson Pipe has a distribution center
in the area that employs about 50 people. Steel pipe arrives by both barge and rail. Pipe arriving by barge comes upriver from the Port of Mobile, where it is imported from South Korea and Turkey. Virtually all of it (95 percent) is trucked out of the distribution center. Ferguson specifically located there because of the transportation connections, and to be near Mueller Copper Tube, which is an important supplier. Mueller employs about 500 people
Cambridge Systematics, Inc. 13

Economic Role of Marine Transportation in Mississippi
in the area but is not a user of the port – rather, they leverage their water access to obtain lower rail rates. Monotech also uses the port to move industrial scrubbers; they employ about 40 people in the area but the market for scrubbers has slowed down recently.
Bark and wood chips are shipped out of the port by barge to St. Louis and other points north where they are processed into mulch.
Aggregates move outbound from local quarries to Columbus, Gulfport, and New Orleans.
Tire treads are shipped to Packaging Corporation of America in Counce, TN which uses them to make packaging products.
Sims Metal Management has a property leased on the port but does not use it right now; however, they still use port facilities to load metal products such as scrap steel.
Itawamba’s growth plans revolve around a planned container-on-barge (COB) service. The port received a Marine Highways grant from the Federal Maritime Commission to start this service. Ocean-going barges will arrive at Mobile, where containers will be transferred to river barges and moved upriver with stops along the Tenn-Tom. They are looking to begin COB service in January 2014. The port has secured tentative slot agreements with some freight forwarders. Itawamba estimates there are 125,000 forty foot-equivalent units (FEUs) within a 60 mile radius that could be captured by COB (this accounts for the presence of a rail terminal in Birmingham which officials expect will capture the other half of the market). The port is targeting furniture as a key market opportunity for the COB service; they also expect to have some backhaul opportunities. The port estimates that COB from Mobile will be $150-$300 cheaper per container than intermodal rail from Los Angeles to Memphis with a dray move for the final leg.
Lowndes County PortLowndes County Port is located at river mile 330 along the Tennessee-Tombigbee Waterway. It began operations in the late 1980s. There are terminals on both banks of the waterway. The east bank is a public terminal owned by the Lowndes County Port Authority and operated by Logistic Services/SSA; it is 165 acres and has a rail spur in addition to truck and barge access. The west bank is 90 acres and is operated by Kinder Morgan for Severstal Steel. The west bank only has truck access on the land side at this time. Other important commodities include aggregate, pet coke, chemicals, outgoing steel coils, and logs which are used by the KiOR biofuels facility. The port receives fee income from users and tenants (land leases and tonnage assessments), which generates about $400,000 annually in operating income to the port authority.
14 Cambridge Systematics, Inc.
Economic Role of Marine Transportation in Mississippi
Key commodities on the east bank include wood chips, wood fiber, chemicals, coal, lime rock, and steel. Cargo crossing the docks on the west bank consists of raw material for Severstal such as pig iron and scrap steel. Tonnage on the east bank averages about 400,000 tons per year. The west bank terminal handled about 550,000 tons of steel, scrap, and pig iron in 2012. Key port tenants include: Severstal Steel receives scrap steel, pig iron, and other raw
materials by barge, trucks them to its steel mill located about eight miles away, and processes them into steel coils. Incoming scrap steel and pig iron is the biggest commodity by weight at Lowndes County, estimated at about 650,000 tons for 2013. Severstal employs about 15 people on the port, 650 at the mill, and about 1,300 total including contract employees.
Southern Ionics, an inorganic chemicals manufacturer, receives chemicals by barge on the east bank.
Baldor makes electric motors at a facility it leases on the port, although it is not a user of port facilities. The company employs about 300 people in Columbus making steel and cast iron frame AC motors.
KiOR uses logs delivered to its facility on the east bank to make wood chips for biofuel power generation. In 2013, the port handled about 200,000 tons of logs. KiOR employs around 60 staff at the port.
Southern Wood Fiber makes wood shavings at its location on the port industrial park.
The port has continued to reinvest in itself over the years and works with organizations like the Golden Triangle Development Link to market the area and attract investment. The port recently leased a 30-acre site to a well-known company that intends to invest $40 million. KiOR may also expand its biofuels operations at the port. The port is working to acquire land for an airport industrial park to complement its other multimodal assets. The port is also dredging the channel at Southern Ionics and Logistic Services, and is looking to develop a third river terminal facility about two miles to the south of the current one. This new facility would be rail served. Finally, the port authority is actively working with the Port of Itawamba to help establish a container-on-barge service – Lowndes County would like this service to stop in Columbus as Weyerhauser has expressed some interest in using it.
Port of NatchezThe Port of Natchez is located in Adams County in southwestern Mississippi, at river mile 361 on the Mississippi River. The channel has a natural depth of 50 feet with no need for dredging. The port’s market area includes Adams, Amite, Claiborne, Franklin, Jefferson,
Cambridge Systematics, Inc. 15
Economic Role of Marine Transportation in Mississippi
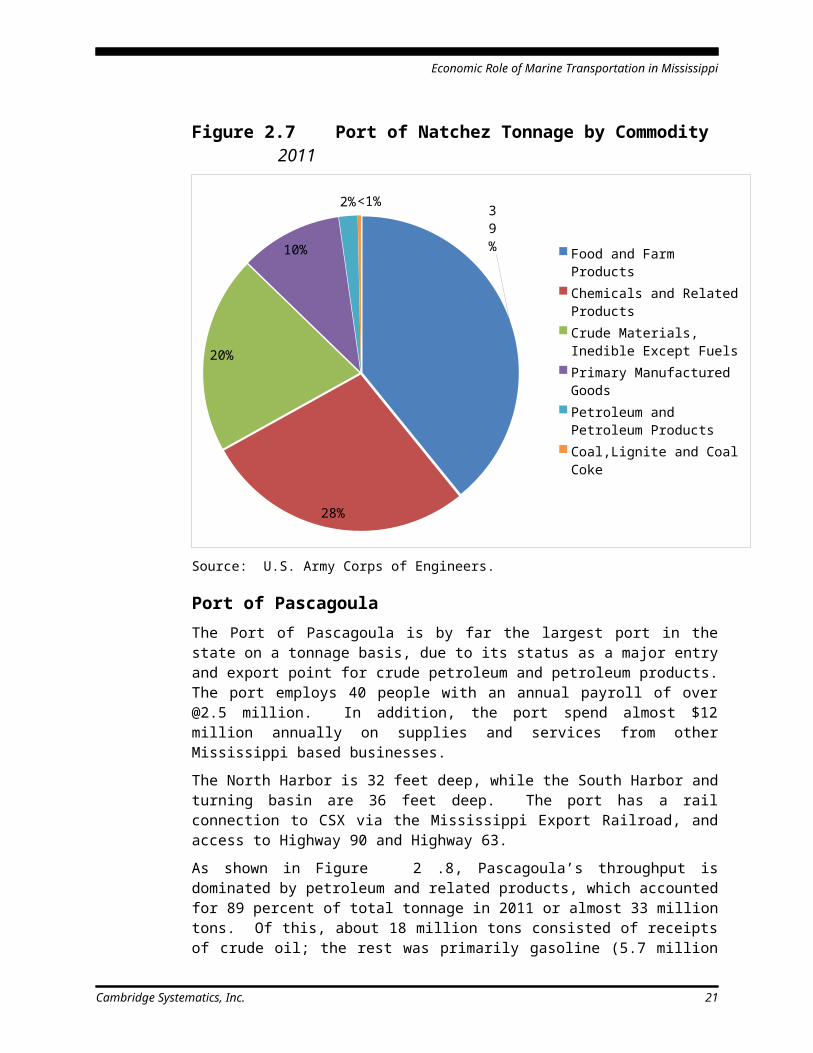
Lawrence, Lincoln, Pike, Walthall, and Wilkinson Counties in Mississippi, as well as parts of Louisiana. In 2011, the port handled just under half a million tons of freight. As shown in Figure 2.7, this tonnage was dominated by food and farm products (39 percent of the total, or about 196,000 tons) and chemicals (28 percent, or nearly 139,000 tons). Most of the chemical traffic was receipts of sodium hydroxide and inorganic chemicals; farm product throughput was driven by corn, sorghum, soybeans, and rice. Most of the corn was incoming, while the other grains tend to be outbound. Most of the remainder consisted of crude materials (20 percent, or about 102,000 tons) and manufactured goods (11 percent, or 52,000 tons). Crude materials shipments mostly include incoming quantities of limestone, phosphates, sand and gravel; and outbound shipments of scrap iron and steel. Cement is the major manufactured product shipped through the Port of Natchez. Total tonnage at the port reached nearly 647,000 tons in 2007, but has been hovering around 500,000 tons annually since then. Chemicals have been a growth commodity for the port, while shipments of crude materials, manufactured goods, and food and farm products have been declining.
Figure 2.7 Port of Natchez Tonnage by Commodity2011
39%
28%
20%
10%
2%<1%
Food and Farm ProductsChemicals and Related ProductsCrude Materials, Inedible Except FuelsPrimary Manufactured GoodsPetroleum and Petroleum ProductsCoal,Lignite and Coal Coke
Source: U.S. Army Corps of Engineers.
16 Cambridge Systematics, Inc.

Economic Role of Marine Transportation in Mississippi
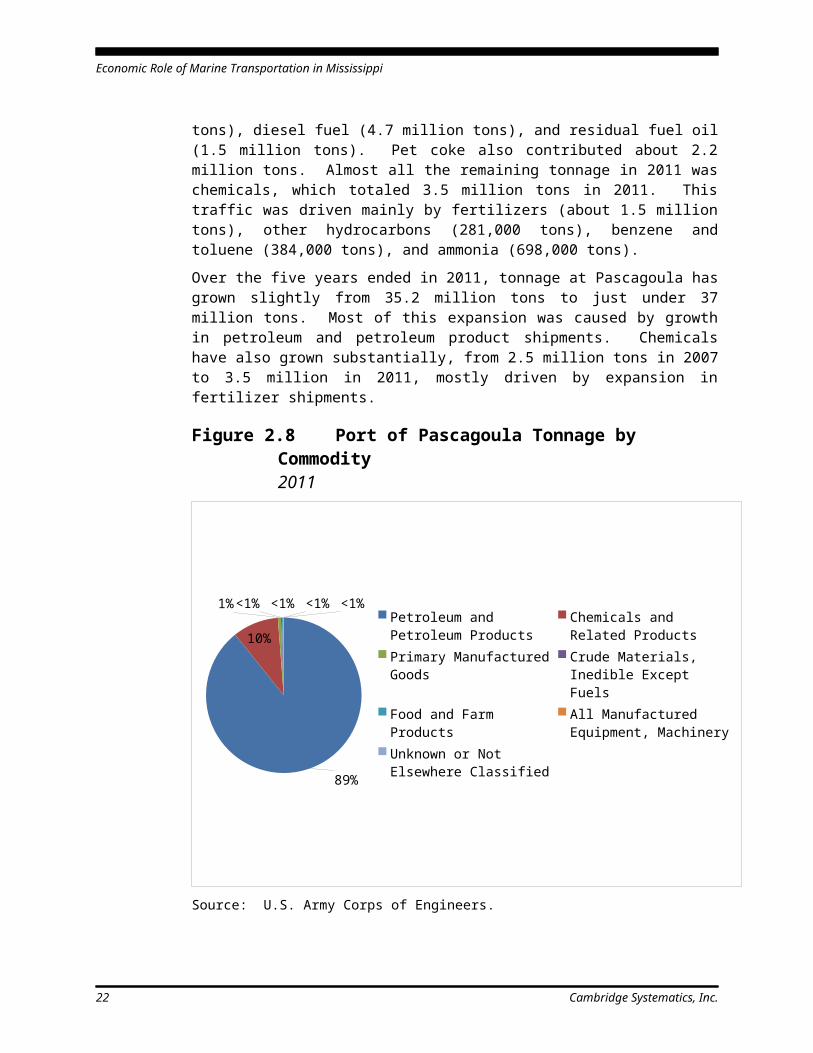
Port of PascagoulaThe Port of Pascagoula is by far the largest port in the state on a tonnage basis, due to its status as a major entry and export point for crude petroleum and petroleum products. The port employs 40 people with an annual payroll of over @2.5 million. In addition, the port spend almost $12 million annually on supplies and services from other Mississippi based businesses. The North Harbor is 32 feet deep, while the South Harbor and turning basin are 36 feet deep. The port has a rail connection to CSX via the Mississippi Export Railroad, and access to Highway 90 and Highway 63. As shown in Figure 2.8, Pascagoula’s throughput is dominated by petroleum and related products, which accounted for 89 percent of total tonnage in 2011 or almost 33 million tons. Of this, about 18 million tons consisted of receipts of crude oil; the rest was primarily gasoline (5.7 million tons), diesel fuel (4.7 million tons), and residual fuel oil (1.5 million tons). Pet coke also contributed about 2.2 million tons. Almost all the remaining tonnage in 2011 was chemicals, which totaled 3.5 million tons in 2011. This traffic was driven mainly by fertilizers (about 1.5 million tons), other hydrocarbons (281,000 tons), benzene and toluene (384,000 tons), and ammonia (698,000 tons). Over the five years ended in 2011, tonnage at Pascagoula has grown slightly from 35.2 million tons to just under 37 million tons. Most of this expansion was caused by growth in petroleum and petroleum product shipments. Chemicals have also grown substantially, from 2.5 million tons in 2007 to 3.5 million in 2011, mostly driven by expansion in fertilizer shipments.
Cambridge Systematics, Inc. 17
Economic Role of Marine Transportation in Mississippi
Figure 2.8 Port of Pascagoula Tonnage by Commodity2011
89%
10%
1% <1% <1% <1% <1%
Petroleum and Petroleum ProductsChemicals and Related ProductsPrimary Manufactured GoodsCrude Materials, Inedible Except FuelsFood and Farm ProductsAll Manufactured Equipment, MachineryUnknown or Not Elsewhere Classified
Source: U.S. Army Corps of Engineers.
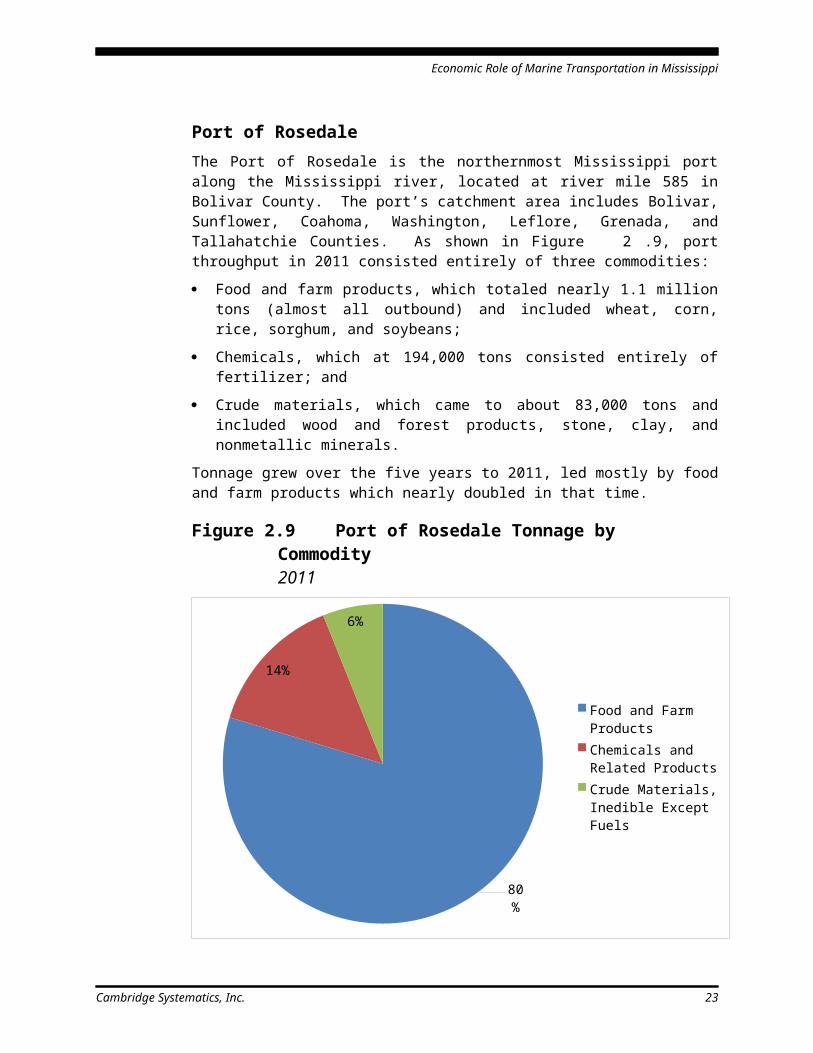
Port of RosedaleThe Port of Rosedale is the northernmost Mississippi port along the Mississippi river, located at river mile 585 in Bolivar County. The port’s catchment area includes Bolivar, Sunflower, Coahoma, Washington, Leflore, Grenada, and Tallahatchie Counties. As shown in Figure 2.9, port throughput in 2011 consisted entirely of three commodities: Food and farm products, which totaled nearly 1.1 million tons
(almost all outbound) and included wheat, corn, rice, sorghum, and soybeans;
Chemicals, which at 194,000 tons consisted entirely of fertilizer; and
Crude materials, which came to about 83,000 tons and included wood and forest products, stone, clay, and nonmetallic minerals.
Tonnage grew over the five years to 2011, led mostly by food and farm products which nearly doubled in that time.
18 Cambridge Systematics, Inc.
Economic Role of Marine Transportation in Mississippi
Figure 2.9 Port of Rosedale Tonnage by Commodity2011
80%
14%
6%
Food and Farm ProductsChemicals and Related ProductsCrude Materials, Inedible Except Fuels
Source: U.S. Army Corps of Engineers.
The Port of Rosedale employs six people directly. Key tenants/users include: Jantran, which does barge towing and fleeting at the port and
employs 275 people; Cives Steel, which employs 145 staff; Gavilon Grain, which has a 2 million bushel storage bin and employs
10-12 people; and Bunge, an agribusiness and food ingredient company which has
about 10 employees at its Rosedale facility.Louis Dreyfus built a new grain terminal on a site it just leased from the port and employs 14 people. Archer Daniels Midland has an option to lease 15 acres adjacent to the port and there is a 250 acre industrial park with water and sewer connections. Jesco manufactures grease and lubricants there. The port also has significant off port users of the public grain elevator. The port would like to dredge and widen parts of the channel to open up more land for development. They are presently in the process of getting permits to dredge the channel and place the spoil in the northern part of the channel to raise the land above flood stage.
Cambridge Systematics, Inc. 19
Economic Role of Marine Transportation in Mississippi
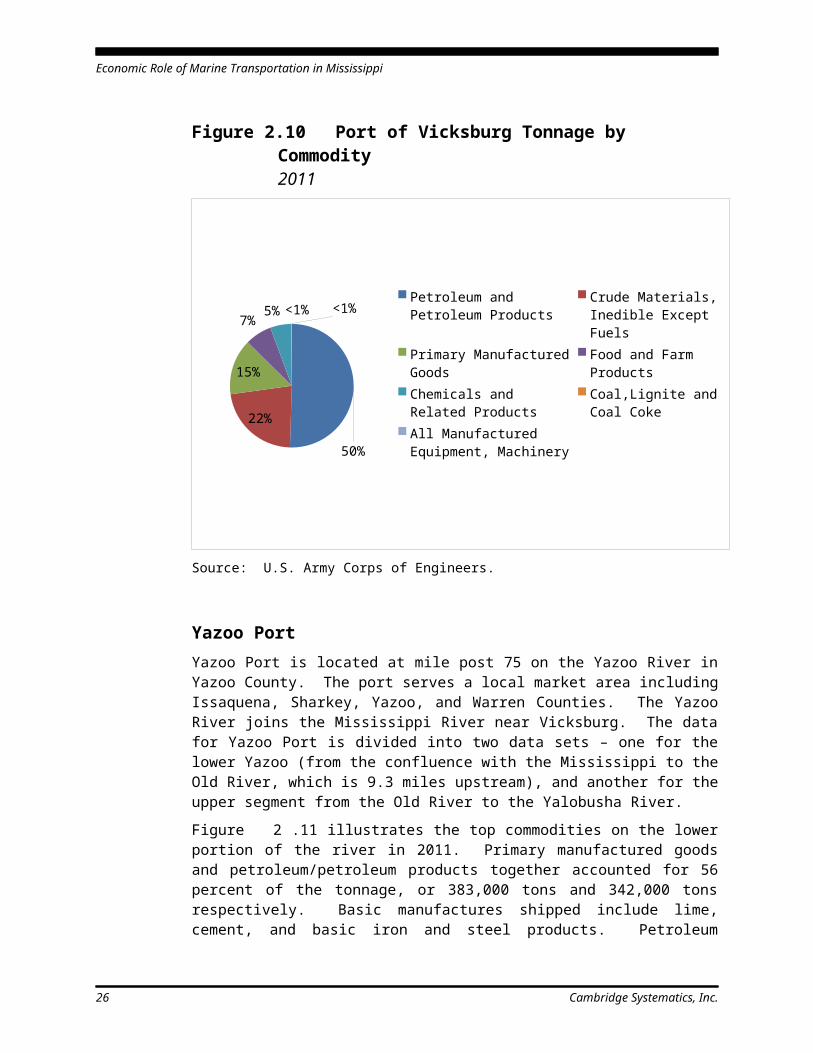
Port of VicksburgThe Port of Vicksburg is located near the intersection of the Mississippi and Yazoo Rivers in Warren County. It is part of a designated Foreign Trade Zone, has rail service via KCS, and is situated 6 miles from I-20. Figure 2.10 highlights the top commodities shipped through the port in 2011. Petroleum and petroleum products made up over half the total tonnage, or 1.3 million tons. This mostly consisted of receipts of crude petroleum and distillate fuels, and outgoing shipments of lube oil and greases. Other important commodities include crude materials (311,000 tons), which was primarily wood, stone, sand, and gravel; primary manufactured goods (383,000 tons), consisting mainly of lime, cement, and iron and steel products; and food and farm products (183,000 tons), which was mostly corn and soybeans. Chemical products round out the top five commodities handled at the port and consists mostly of fertilizers. Tonnage steadily fell at the port from 2007 to 2011, from about 3.6 million tons to 2.6 million tons. This was almost entirely driven by declining petroleum product and crude oil volumes. According to the port, steel coils for Severstal have more recently become an important commodity. The port receives revenue from Kinder Morgan (which operates the terminal) and hunting leases. Kinder Morgan pays a base fee plus a tonnage-based assessment. The port’s operating budget is between $800,000 and $900,000 annually. The port generates about $1.5 million in city and county property taxes each year. Most tenants own their land, so the port does not receive much lease income from them. Key port users include: Ergon Refinery, Ergon Marine, Magnolia Marine, Specialty Process Fabricators, Kinder Morgan, Anderson-Tully Lumber, and Armstrong (a flooring manufacturer). Other firms that benefit from the port include Vicksmetal, Armco, Steel Summit, and Alcoa. In all, the port’s tenants employ about 2,500 people. The port’s market area includes Mississippi, Alabama, Louisiana, and Tennessee. Pig iron is delivered to the port from South America, and Alcoa receives aluminum ingots at Vicksburg which are then trucked to its Louisiana facility. The Port of Vicksburg’s most pressing competitive concern right now is a lack of available land. According to the port, they have lost around 12 opportunities because of this. The port is seeking to acquire about 1,000 acres of property to develop a new port facility next to its existing terminals. also like to have a 4-lane port access road that would bypass the residential area that trucks currently use – but this would cost an estimated $70 million. The road would open up more land for development.
20 Cambridge Systematics, Inc.

Economic Role of Marine Transportation in Mississippi
Figure 2.10 Port of Vicksburg Tonnage by Commodity2011
50%
22%
15%
7%
5%
<1% <1%
Petroleum and Petroleum ProductsCrude Materials, Inedible Except FuelsPrimary Manufactured GoodsFood and Farm ProductsChemicals and Related ProductsCoal,Lignite and Coal CokeAll Manufactured Equipment, Machinery
Source: U.S. Army Corps of Engineers.
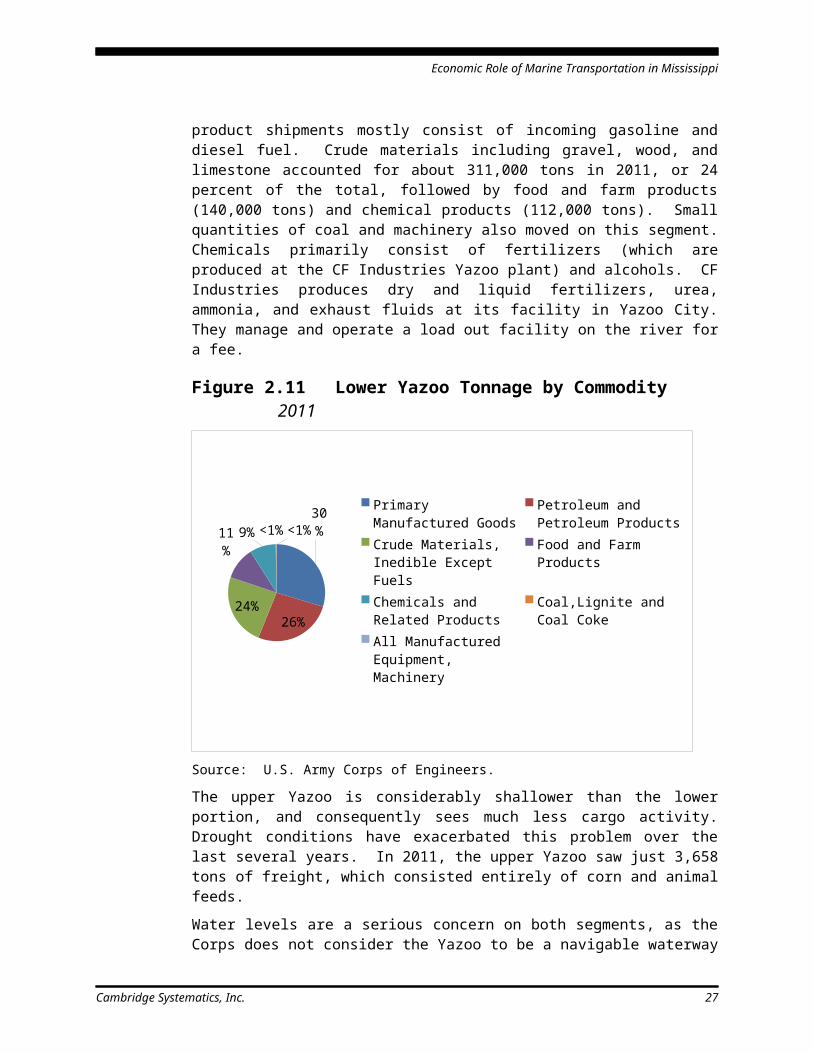
Yazoo PortYazoo Port is located at mile post 75 on the Yazoo River in Yazoo County. The port serves a local market area including Issaquena, Sharkey, Yazoo, and Warren Counties. The Yazoo River joins the Mississippi River near Vicksburg. The data for Yazoo Port is divided into two data sets – one for the lower Yazoo (from the confluence with the Mississippi to the Old River, which is 9.3 miles upstream), and another for the upper segment from the Old River to the Yalobusha River.Figure 2.11 illustrates the top commodities on the lower portion of the river in 2011. Primary manufactured goods and petroleum/petroleum products together accounted for 56 percent of the tonnage, or 383,000 tons and 342,000 tons respectively. Basic manufactures shipped include lime, cement, and basic iron and steel products. Petroleum product shipments mostly consist of incoming gasoline and diesel fuel. Crude materials including gravel, wood, and limestone accounted for about 311,000 tons in 2011, or 24 percent of the total, followed by food and farm products (140,000 tons) and chemical products (112,000 tons). Small quantities of coal and machinery also moved on this segment. Chemicals primarily consist of fertilizers (which are produced at the CF Industries Yazoo plant) and alcohols. CF Industries
Cambridge Systematics, Inc. 21
Economic Role of Marine Transportation in Mississippi
produces dry and liquid fertilizers, urea, ammonia, and exhaust fluids at its facility in Yazoo City. They manage and operate a load out facility on the river for a fee.
Figure 2.11 Lower Yazoo Tonnage by Commodity2011
30%
26%
24%
11%
9%
<1% <1%
Primary Manufactured GoodsPetroleum and Petroleum ProductsCrude Materials, Inedible Except FuelsFood and Farm ProductsChemicals and Related ProductsCoal,Lignite and Coal CokeAll Manufactured Equipment, Machinery
Source: U.S. Army Corps of Engineers.
The upper Yazoo is considerably shallower than the lower portion, and consequently sees much less cargo activity. Drought conditions have exacerbated this problem over the last several years. In 2011, the upper Yazoo saw just 3,658 tons of freight, which consisted entirely of corn and animal feeds. Water levels are a serious concern on both segments, as the Corps does not consider the Yazoo to be a navigable waterway and therefore does not provide channel maintenance funding. CF Industries can only use the waterway when water levels permit it; in 2013, they were able to do so until the end of July, when they had to begin trucking products to Vicksburg for barge load out at an average cost of $10 more per ton. Although CF only ships 5-10 percent of its product by barge, having a more reliable channel would help them obtain lower rates from the CN railroad, to whom they are captive. The combination of persistent drought conditions and lack of federal dredge funding has contributed to a pattern of falling tonnage on both segments of the Yazoo River. On the lower Yazoo, total tonnage dropped by about 18 percent from 2007 to 2011, from nearly 1.6 million tons to about 1.3 million tons. On the upper Yazoo, which is even more at the mercy of fluctuating water levels, throughput dwindled from 55,580 tons in 2007 to 3,658 tons in 2011.
22 Cambridge Systematics, Inc.
Economic Role of Marine Transportation in Mississippi
Yellow Creek State Inland PortYellow Creek Port sits at the confluence of the Tennessee River and the Tenn-Tom in the northeastern corner of the state, and is one of two ports owned by the State of Mississippi. The port’s market area includes Tishomingo, Alcorn, Prentiss, and Itawamba Counties in Mississippi, and parts of northwest Alabama and south central Tennessee. The Port Authority employs 10 people who run the public terminal at Yellow Creek. The port is funded entirely by tonnage assessments and lease income. In the fiscal year ended June 30, 2013, the port’s total income from all sources was about $3.3 million, from which the port netted income after expenses of nearly $2.4 million. On-port industries employ about 450 people and generate about $180,000 per year in tax revenue. The port has experienced significant growth over the last 10 years as regional economic growth brought new tenants, particularly in steel and related industries. The new steel business and available port infrastructure has led to the growth of a major steel cluster at and around the port. The port is home to several steel fabrication and processing companies, not all of whom use the port but many of whom located there to be close to a supplier who does use it. Consequently, the key commodities handled at the port right now are steel and fabricated steel products. Steel coils arrive by both barge and rail (about a 50/50 split). Fabricated steel pipe, duct work, and pilings produced in the area are then shipped out mostly by truck (80 percent) but some by barge and rail (10 percent each). In FY 2013, the port handled 47 incoming barges loaded with steel coils, totaling about 65,000 tons. Other key commodities include pipe, sheet piling, rail car parts, pressure vessels, and industrial boilers and scrubbers. Overall the port processes about 400,000 tons annually. The original 12-acre site on which the port sits is completely built out. Consequently, the port is looking to expand its facilities by adding another load out facility with additional lay down and storage areas, along with other projects like paving and improving rail access. They are also working to develop the 900-acre Northeast Mississippi Waterfront Industrial Park (NEMWIP) at Burnsville. They are using a Multimodal Fund grant to construct a rail link to the NEMWIP. Tishomingo County also owns a former nuclear power site with a dock across the Tenn-Tom; the port would like to develop it for industrial uses.
Cambridge Systematics, Inc. 23
Economic Role of Marine Transportation in Mississippi
3.0 Mississippi Port User ProfileThis section identifies and profiles the port users by examining how Mississippi industries use and rely upon the waterborne transportation system. Evaluation of the amount of total freight moved by the marine mode by industry at the state and national level reveals the relative dependence of Mississippi industries on the state’s ports and waterways. This evaluation is done for both inbound and outbound shipments. FAF3 data were used to evaluate the marine mode share of Mississippi industries for both inbound and outbound shipments. FAF3 was also used to assess marine mode shares by industry at the national level, for comparison to Mississippi. The FAF3 is a publicly available dataset that provides origin-destination freight tonnage and value by commodity and by mode for the state and the country. The FAF3 is based in 2007, includes 2011 provisional data, and forecasts through 2040 in five-year increments. Corps of Engineers Waterborne Commerce data were used to analyze the actual tonnage shipped by water (inbound and outbound combined) for each industry. This provides a clearer picture of which Mississippi industries depend the most on ports and waterways. The Corps data provides incoming, outgoing, and intraport tonnage by port/waterway for 2011 and historical data to 2007. A commodity-industry crosswalk is applied to both the Corps data and the FAF3 data to estimate marine mode shares and tonnages by industry.
3.1 MISSISSIPPI MODAL DEPENDENCE AND NATIONAL MODAL SHARESInbound and outbound mode share by water was estimated for Mississippi and the nation as a whole to understand which industries in the state rely the most on waterborne transportation and how they compare to national averages. This comparison was made using FAF3 commodity flow data, which provides total tons by commodity and mode for both Mississippi and the nation. Although commodity groups are not the same as industries, it is possible to associate certain commodities with industries that are known to use or produce them. The primary industry classification system is the North American Industry Classification System (NAICS), which categorizes industries according to the goods or services they provide. The study team used
Cambridge Systematics, Inc. 1
Economic Role of Marine Transportation in Mississippi
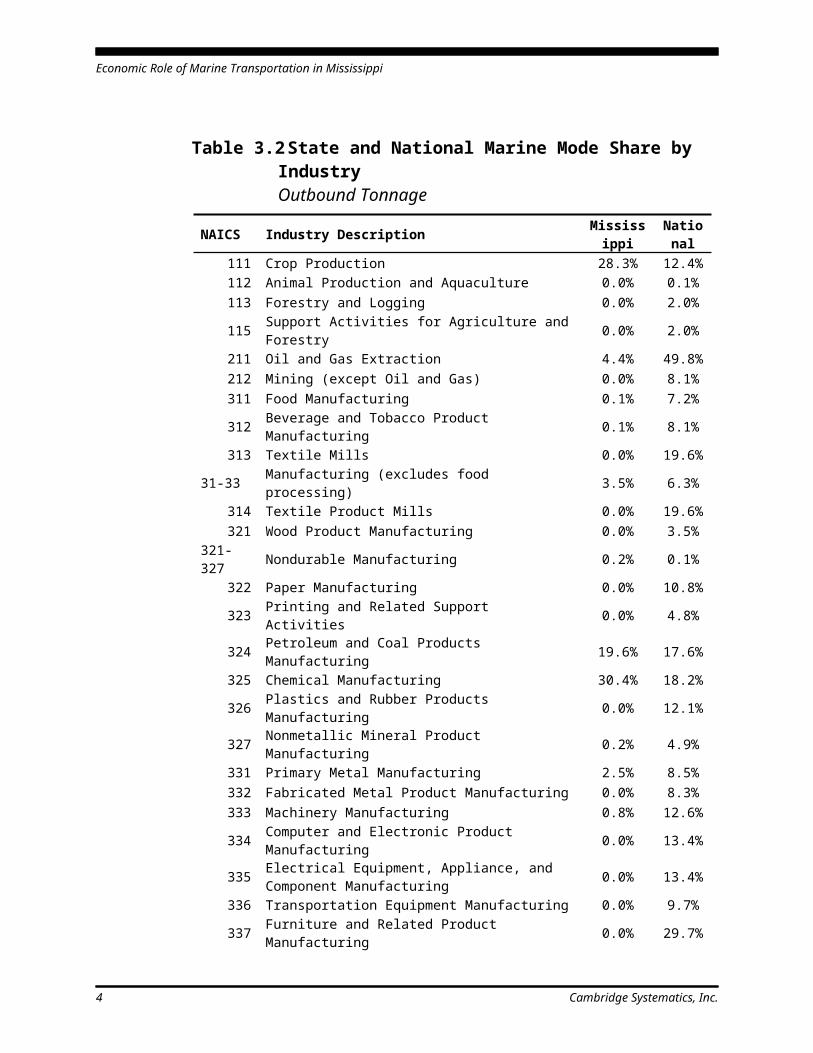
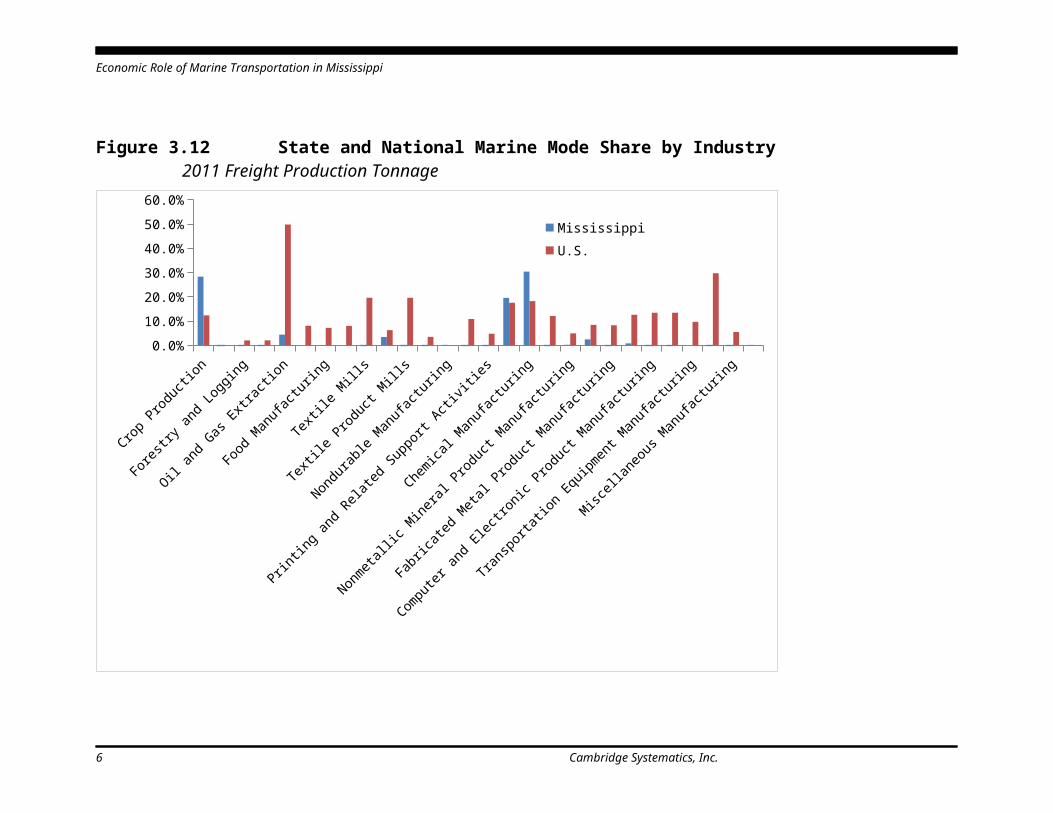
a crosswalk methodology to convert attraction (inbound) and production (outbound) tonnage by commodity from FAF3 to attraction and production tonnage by NAICS industry.The results for freight production (outbound tonnage) are shown in Table 3.2 and graphically in Figure 3.12. As shown in the table and chart, Mississippi’s crop production, chemical manufacturing, and petroleum and coal product manufacturing industries are highly dependent on waterborne transportation to get products to market. Twenty eight percent of crop tonnage produced in the state is transported by water. This includes grains such as corn and soybeans which are frequently shipped downriver to Gulf Coast ports for export. Chemical manufacturers are even more dependent on marine transportation, with more than 30 percent of their tonnage being shipped by water. This category includes producers of fertilizers such as CF Industries in Yazoo City as well as other chemical products such as plastics and rubber and basic chemicals like sulfur. Nearly 20 percent of petroleum and coal manufactured products made in Mississippi are moved by water, compared to 17.6 percent nationally. Other industries that make use of Mississippi’s ports and waterways for outbound tonnage (though not as much as the national average) include oil and gas extraction, manufacturing except food processing, and primary metal manufacturing. This last category includes steel manufacturing, which has become a thriving industry along the Tenn-Tom Waterway. For instance, Severstal Steel in Columbus is the largest single user of the Lowndes County Port. The mill receives incoming steel scrap, pig iron, and other raw materials and turns them into steel coils, some of which are also shipped out by barge. There is also a significant metal fabrication cluster at the Yellow Creek State Inland Port in Iuka. Fabricators at Yellow Creek use steel coils, some of which are produced in Columbus, to make industrial boilers, scrubbers, and other steel components which are then sold on to construction and industrial customers. Boilers and scrubbers are often transported by water due to their heaviness and size, which frequently prevents transportation by road and rail.
2 Cambridge Systematics, Inc.
Economic Role of Marine Transportation in Mississippi
Table 3.2 State and National Marine Mode Share by IndustryOutbound Tonnage
NAICS Industry Description Mississippi National
111 Crop Production 28.3% 12.4%112 Animal Production and Aquaculture 0.0% 0.1%113 Forestry and Logging 0.0% 2.0%115 Support Activities for Agriculture and Forestry 0.0% 2.0%211 Oil and Gas Extraction 4.4% 49.8%212 Mining (except Oil and Gas) 0.0% 8.1%311 Food Manufacturing 0.1% 7.2%312 Beverage and Tobacco Product Manufacturing 0.1% 8.1%313 Textile Mills 0.0% 19.6%
31-33 Manufacturing (excludes food processing) 3.5% 6.3%314 Textile Product Mills 0.0% 19.6%321 Wood Product Manufacturing 0.0% 3.5%
321-327 Nondurable Manufacturing 0.2% 0.1%322 Paper Manufacturing 0.0% 10.8%323 Printing and Related Support Activities 0.0% 4.8%324 Petroleum and Coal Products Manufacturing 19.6% 17.6%325 Chemical Manufacturing 30.4% 18.2%326 Plastics and Rubber Products Manufacturing 0.0% 12.1%327 Nonmetallic Mineral Product Manufacturing 0.2% 4.9%331 Primary Metal Manufacturing 2.5% 8.5%332 Fabricated Metal Product Manufacturing 0.0% 8.3%333 Machinery Manufacturing 0.8% 12.6%334 Computer and Electronic Product Manufacturing 0.0% 13.4%
335 Electrical Equipment, Appliance, and Component Manufacturing 0.0% 13.4%
336 Transportation Equipment Manufacturing 0.0% 9.7%337 Furniture and Related Product Manufacturing 0.0% 29.7%339 Miscellaneous Manufacturing 0.0% 5.5%
48-49 Transportation and Warehousing 0.2% 0.1%
Total 8.8% 12.7%
Source: CS analysis of FAF3 data.
Cambridge Systematics, Inc. 3
Economic Role of Marine Transportation in Mississippi
Figure 3.12 State and National Marine Mode Share by Industry2011 Freight Production Tonnage
Crop Pro
duction
Fores
try an
d Loggi
ng
Oil and Gas
Extrac
tion
Food M
anufac
turing
Textile
Mills
Textile
Product Mills
Nondurable M
anufac
turing
Printing a
nd Related
Support
Activiti
es
Chemica
l Man
ufacturin
g
Nonmetallic
Minera
l Pro
duct Man
ufacturin
g
Fabric
ated M
etal P
roduct Man
ufacturin
g
Computer an
d Elect
ronic Pro
duct Man
ufacturin
g
Transporta
tion Equipmen
t Man
ufacturin
g
Miscella
neous M
anufac
turing
0.0%
10.0%
20.0%
30.0%
40.0%
50.0%
60.0%
Mississippi U.S.
4 Cambridge Systematics, Inc.
Economic Role of Marine Transportation in Mississippi
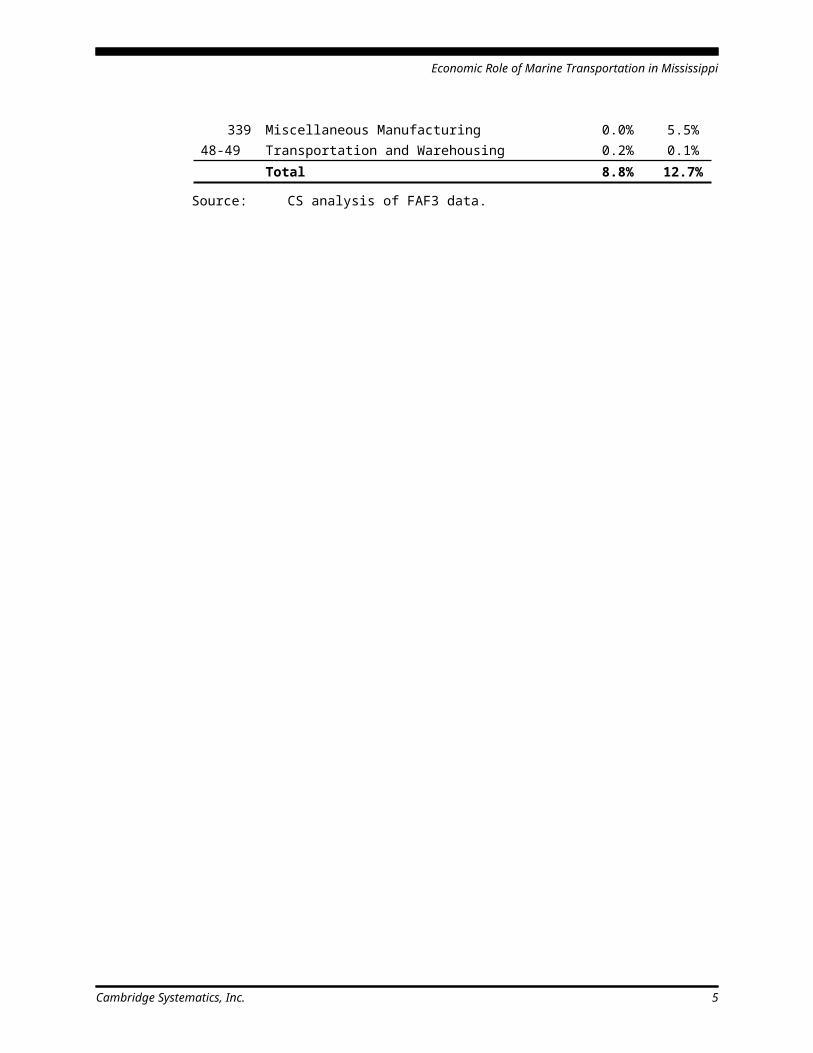
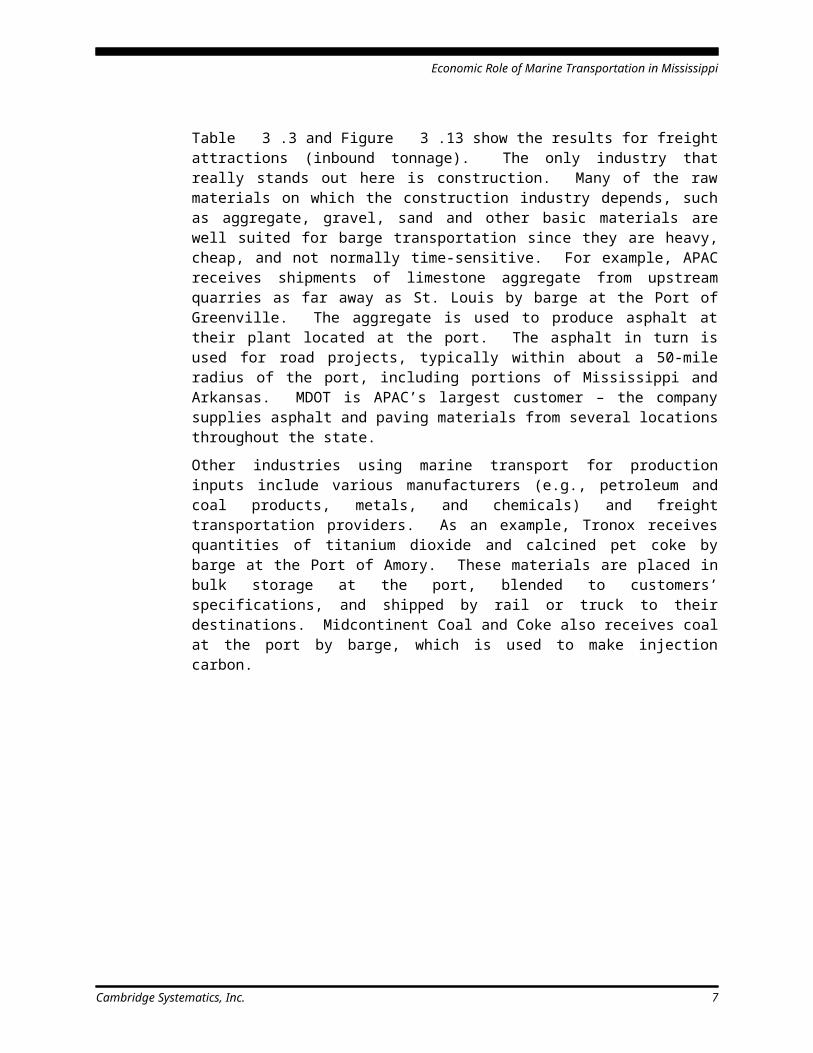
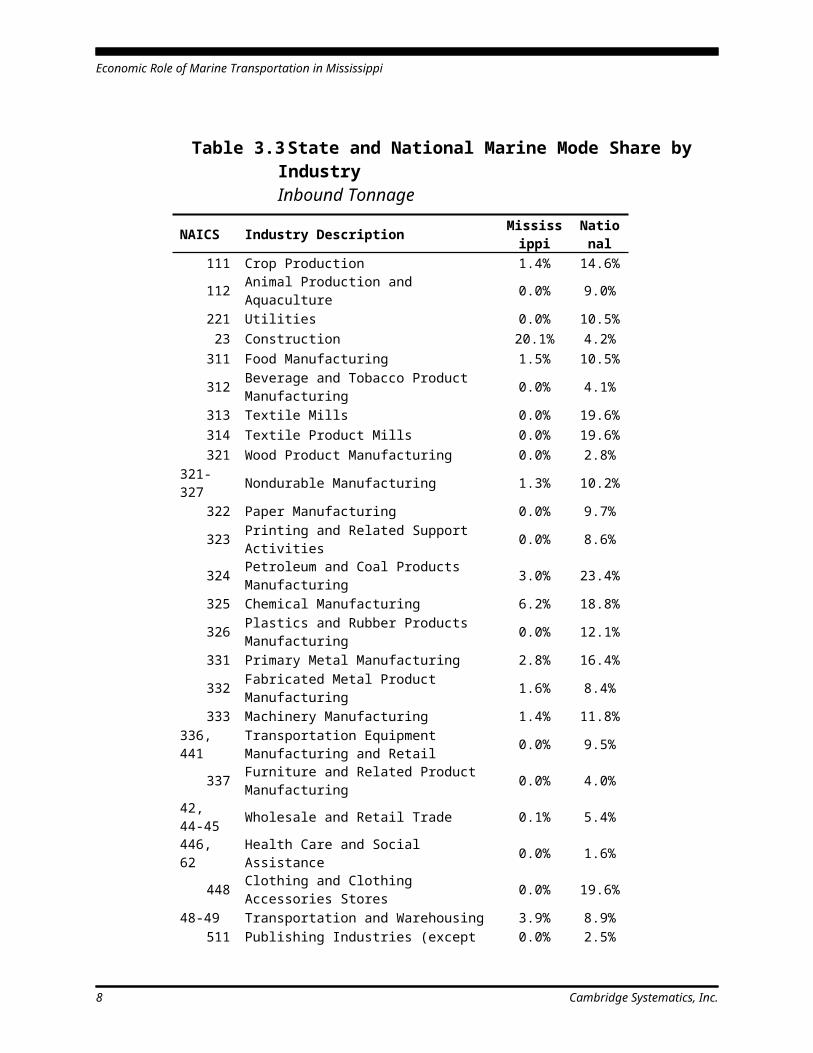
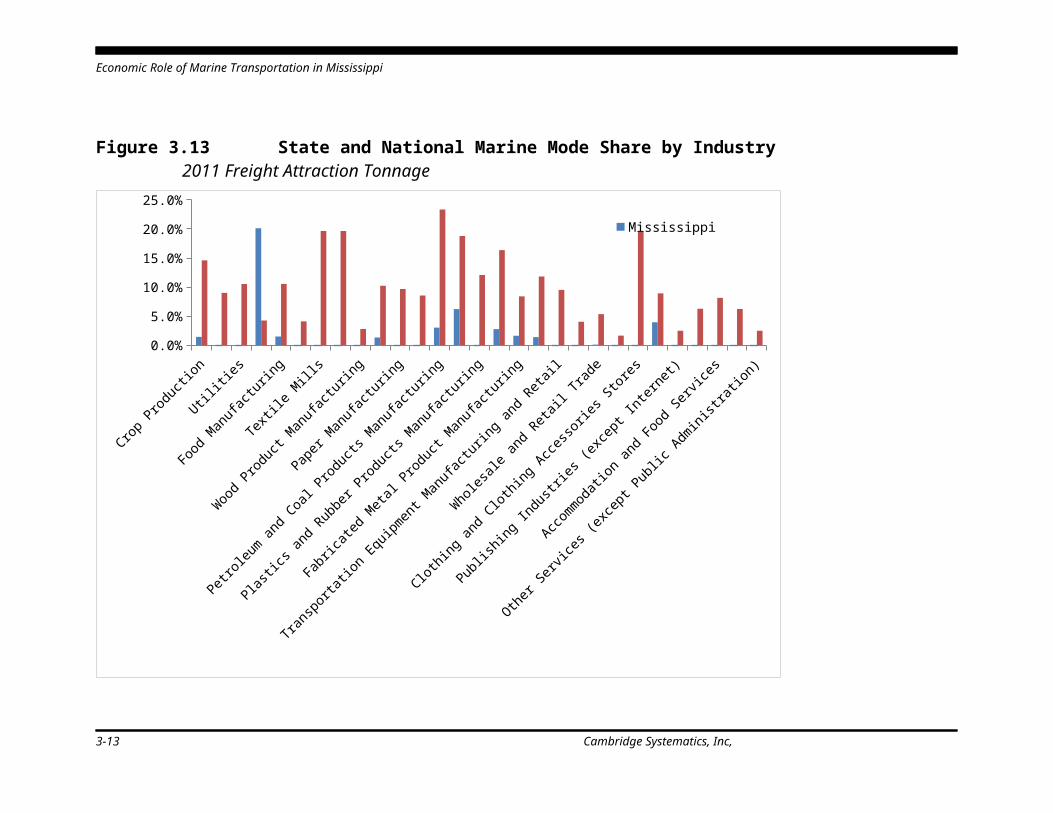
Table 3.3 and Figure 3.13 show the results for freight attractions (inbound tonnage). The only industry that really stands out here is construction. Many of the raw materials on which the construction industry depends, such as aggregate, gravel, sand and other basic materials are well suited for barge transportation since they are heavy, cheap, and not normally time-sensitive. For example, APAC receives shipments of limestone aggregate from upstream quarries as far away as St. Louis by barge at the Port of Greenville. The aggregate is used to produce asphalt at their plant located at the port. The asphalt in turn is used for road projects, typically within about a 50-mile radius of the port, including portions of Mississippi and Arkansas. MDOT is APAC’s largest customer – the company supplies asphalt and paving materials from several locations throughout the state. Other industries using marine transport for production inputs include various manufacturers (e.g., petroleum and coal products, metals, and chemicals) and freight transportation providers. As an example, Tronox receives quantities of titanium dioxide and calcined pet coke by barge at the Port of Amory. These materials are placed in bulk storage at the port, blended to customers’ specifications, and shipped by rail or truck to their destinations. Midcontinent Coal and Coke also receives coal at the port by barge, which is used to make injection carbon.
Cambridge Systematics, Inc. 5
Economic Role of Marine Transportation in Mississippi
Table 3.3 State and National Marine Mode Share by IndustryInbound Tonnage
NAICS Industry Description Mississippi National111 Crop Production 1.4% 14.6%112 Animal Production and Aquaculture 0.0% 9.0%221 Utilities 0.0% 10.5%
23 Construction 20.1% 4.2%311 Food Manufacturing 1.5% 10.5%312 Beverage and Tobacco Product Manufacturing 0.0% 4.1%313 Textile Mills 0.0% 19.6%314 Textile Product Mills 0.0% 19.6%321 Wood Product Manufacturing 0.0% 2.8%
321-327 Nondurable Manufacturing 1.3% 10.2%322 Paper Manufacturing 0.0% 9.7%323 Printing and Related Support Activities 0.0% 8.6%324 Petroleum and Coal Products Manufacturing 3.0% 23.4%325 Chemical Manufacturing 6.2% 18.8%326 Plastics and Rubber Products Manufacturing 0.0% 12.1%331 Primary Metal Manufacturing 2.8% 16.4%332 Fabricated Metal Product Manufacturing 1.6% 8.4%333 Machinery Manufacturing 1.4% 11.8%
336, 441 Transportation Equipment Manufacturing and Retail 0.0% 9.5%
337 Furniture and Related Product Manufacturing 0.0% 4.0%42, 44-45 Wholesale and Retail Trade 0.1% 5.4%446, 62 Health Care and Social Assistance 0.0% 1.6%
448 Clothing and Clothing Accessories Stores 0.0% 19.6%48-49 Transportation and Warehousing 3.9% 8.9%
511 Publishing Industries (except Internet) 0.0% 2.5%562 Waste Management and Remediation Services 0.0% 6.3%
72 Accommodation and Food Services 0.0% 8.2%
722 Food Services and Drinking Places 0.0% 6.2%
81 Other Services (except Public Administration) 0.0% 2.5%
Total 4.1% 12.7%
Source: CS analysis of FAF3 data.
6 Cambridge Systematics, Inc.
Economic Role of Marine Transportation in Mississippi
Figure 3.13 State and National Marine Mode Share by Industry2011 Freight Attraction Tonnage
Crop Pro
duction
Animal
Production and Aquacu
lture
Utilities
Constructi
on
Food M
anufac
turing
Bevera
ge an
d Tobacc
o Product Man
ufacturin
g
Textile
Mills
Textile
Product Mills
Wood Product Man
ufacturin
g
Nondurable M
anufac
turing
Paper
Manufac
turing
Printing a
nd Related
Support
Activiti
es
Petroleu
m and Coal
Products M
anufac
turing
Chemica
l Man
ufacturin
g
Plastics
and Rubber
Products M
anufac
turing
Primary
Meta
l Man
ufacturin
g
Fabric
ated M
etal P
roduct Man
ufacturin
g
Machinery
Man
ufacturin
g
Transporta
tion Equipmen
t Man
ufacturin
g and Reta
il
Furnitu
re an
d Related
Product M
anufac
turing
Wholesale
and Reta
il Trad
e
Health Care
and So
cial A
ssista
nce
Clothing and Clothing A
ccesso
ries S
tores
Transporta
tion and W
arehousin
g
Publishing In
dustries
(exce
pt Inter
net)
Waste M
anag
emen
t and Rem
ediati
on Servi
ces
Accommodati
on and Fo
od Servi
ces
Food Se
rvices
and Drin
king P
laces
Other Ser
vices
(excep
t Public
Administrati
on)0.0%
5.0%
10.0%
15.0%
20.0%
25.0%Mississippi U.S.
Cambridge Systematics, Inc. 3-14
Economic Role of Marine Transportation in Mississippi
3.2 VOLUMES BY INDUSTRYAs shown in the previous section, waterborne mode shares tend to be concentrated in a few key industries that are very dependent on marine transportation. This section applies a similar commodity to industry crosswalk to the Corps of Engineers Waterborne Commerce data to assess which industries are the most intense users of the Mississippi port and waterway network. The Mississippi industries that generate the most waterborne freight are summarized in Figure 3.14. These totals are compared to similar national statistics. As the chart shows, waterborne freight is heavily concentrated in the petroleum and coal products manufacturing, mining, chemical manufacturing, and farm output/food manufacturing industries. Mississippi’s petroleum and coal product manufacturing, chemical manufacturing, forestry and logging, and paper manufacturing firms all ship and receive more by water as compared to the rest of the country.
Figure 3.14 Marine Freight Generation by Industry
All others
Machinery manufacturing
Apparel manufacturing; Leather and allied product manufacturing
Primary metal manufacturing
Nonmetallic mineral product manufacturing
Paper manufacturing
Forestry and logging; Fishing, hunting, and trapping
Farm output and food manufacturing
Chemical manufacturing
Mining (except oil and gas)
Petroleum and coal products manufacturing
0% 10%20%30%40%50%60%70%
Mississippi National
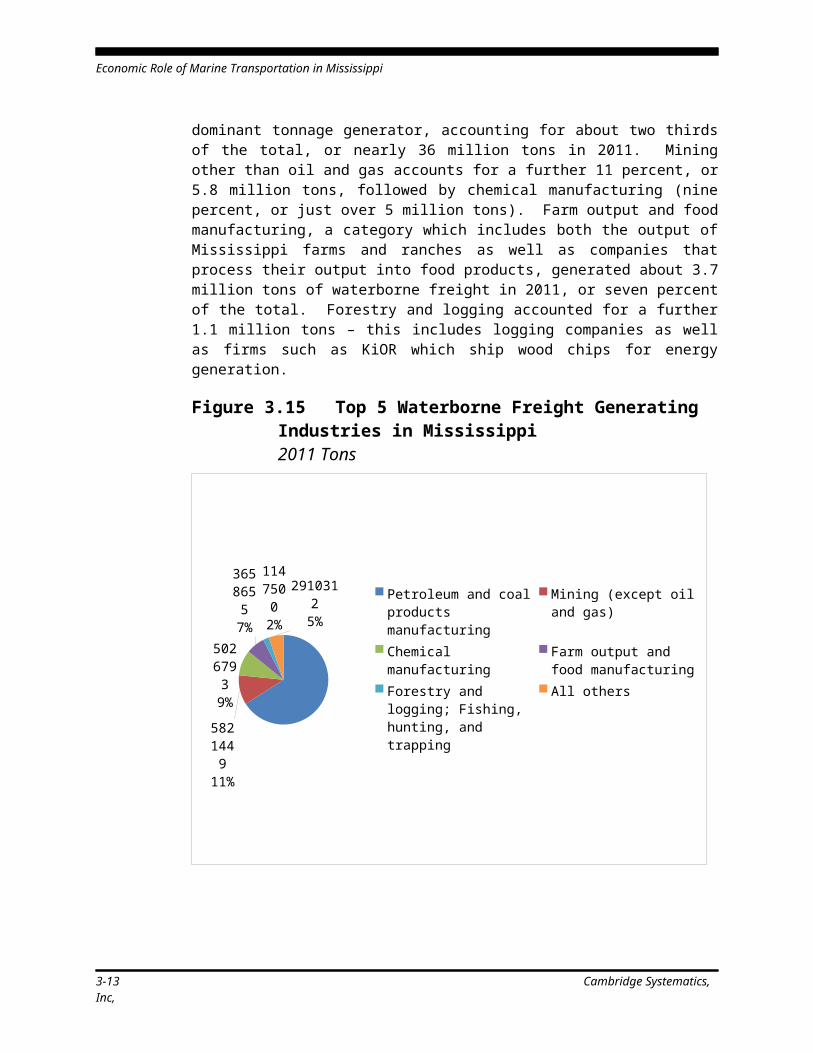
Figure 3.15 highlights the top five marine freight generating industries in Mississippi by total tons moved by water. Petroleum and coal products manufacturing is the dominant tonnage generator, accounting for about two thirds of the total, or nearly 36 million tons in 2011. Mining other than oil and gas accounts for a further 11 percent, or 5.8 million tons, followed by chemical manufacturing (nine percent, or just over 5 million tons). Farm output and food manufacturing, a category which includes both the output of Mississippi farms and ranches as well as companies that process their output into food products, generated about 3.7 million tons of waterborne freight in 2011, or seven percent of the total. Forestry and logging accounted
Cambridge Systematics, Inc. 3-14
Economic Role of Marine Transportation in Mississippi
for a further 1.1 million tons – this includes logging companies as well as firms such as KiOR which ship wood chips for energy generation.
Figure 3.15 Top 5 Waterborne Freight Generating Industries in Mississippi2011 Tons
3589811166%
582144911%
50267939%
365865
57%
114750
02%
29103125%
Petroleum and coal products manufacturingMining (except oil and gas)Chemical manufacturingFarm output and food manu-facturingForestry and logging; Fishing, hunting, and trappingAll others
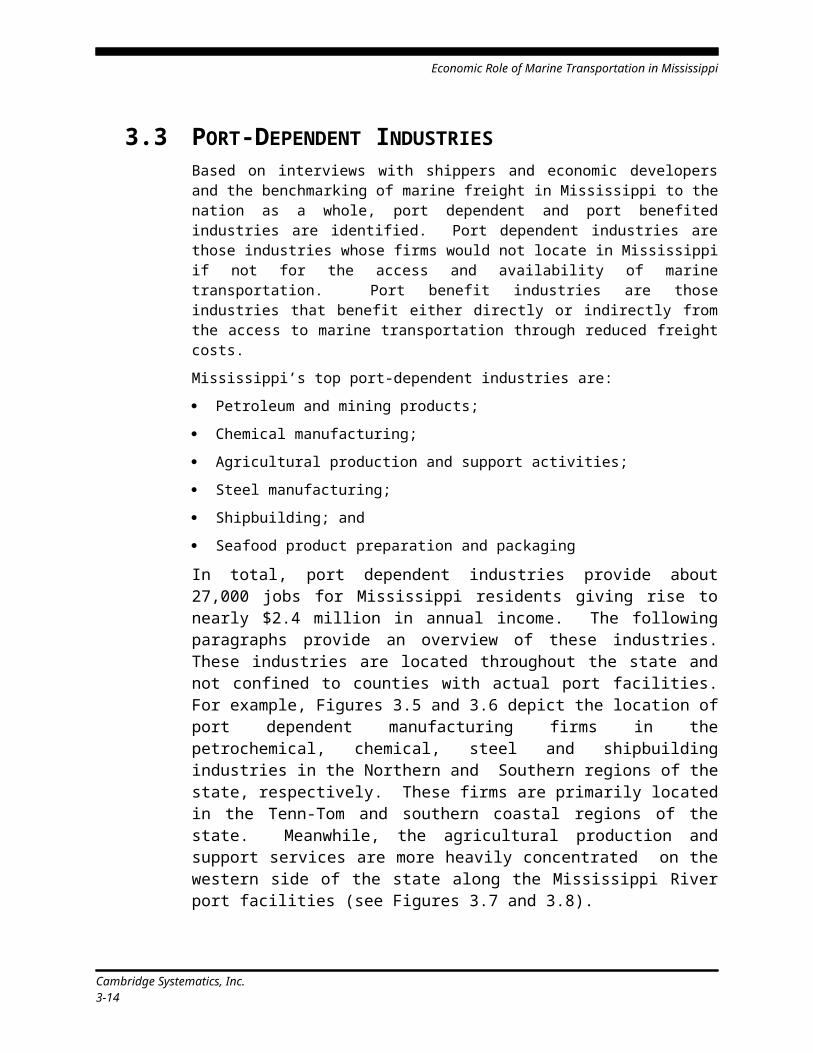
3.3 PORT-DEPENDENT INDUSTRIESBased on interviews with shippers and economic developers and the benchmarking of marine freight in Mississippi to the nation as a whole, port dependent and port benefited industries are identified. Port dependent industries are those industries whose firms would not locate in Mississippi if not for the access and availability of marine transportation. Port benefit industries are those industries that benefit either directly or indirectly from the access to marine transportation through reduced freight costs. Mississippi’s top port-dependent industries are: Petroleum and mining products; Chemical manufacturing; Agricultural production and support activities; Steel manufacturing; Shipbuilding; and
3-13 Cambridge Systematics, Inc,
Economic Role of Marine Transportation in Mississippi
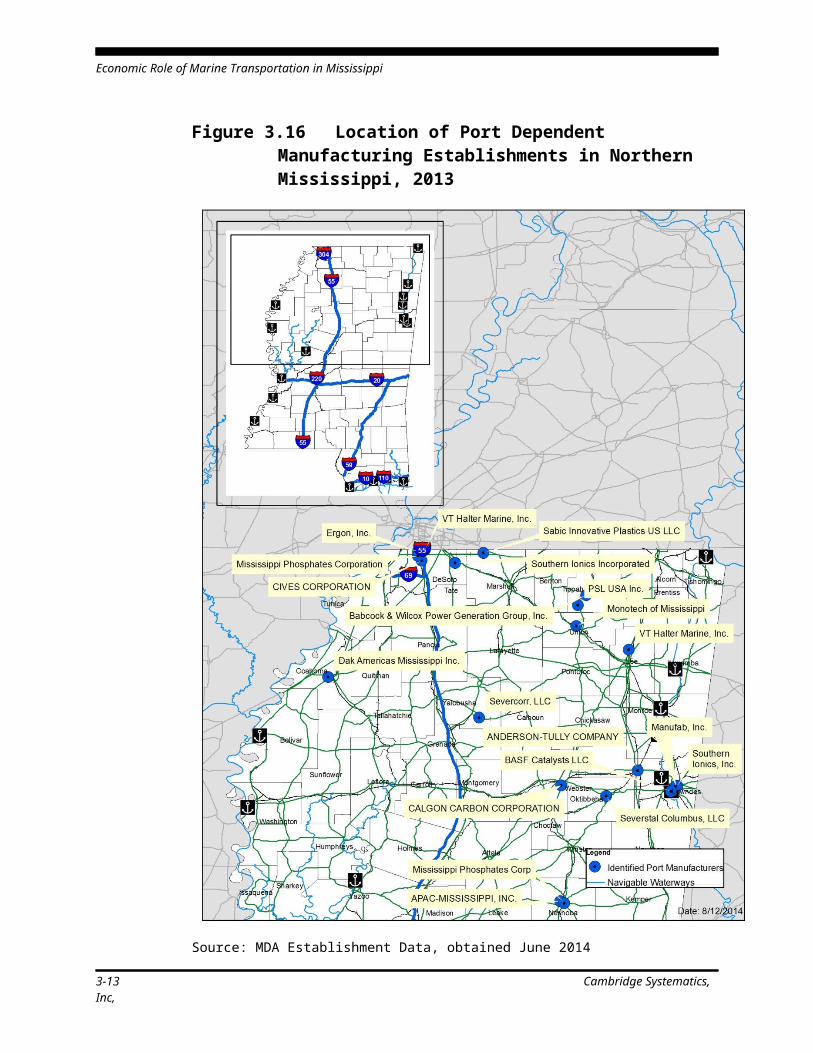
Seafood product preparation and packagingIn total, port dependent industries provide about 27,000 jobs for Mississippi residents giving rise to nearly $2.4 million in annual income. The following paragraphs provide an overview of these industries. These industries are located throughout the state and not confined to counties with actual port facilities. For example, Figures 3.5 and 3.6 depict the location of port dependent manufacturing firms in the petrochemical, chemical, steel and shipbuilding industries in the Northern and Southern regions of the state, respectively. These firms are primarily located in the Tenn-Tom and southern coastal regions of the state. Meanwhile, the agricultural production and support services are more heavily concentrated on the western side of the state along the Mississippi River port facilities (see Figures 3.7 and 3.8).
Cambridge Systematics, Inc. 3-14

Economic Role of Marine Transportation in Mississippi
Figure 3.16 Location of Port Dependent Manufacturing Establishments in Northern Mississippi, 2013
Source: MDA Establishment Data, obtained June 2014
3-13 Cambridge Systematics, Inc,
Economic Role of Marine Transportation in Mississippi
Figure 3.17 Location of Port Dependent Manufacturing Establishments in Southern Mississippi, 2013
Source: MDA Establishment Data, obtained June 2014
Cambridge Systematics, Inc. 3-14
Economic Role of Marine Transportation in Mississippi
Figure 3.18 Location of Port Dependent Agricultural Production and Service Establishments in Northern Mississippi, 2013
Source: MDA Establishment Data, obtained June 2014
3-13 Cambridge Systematics, Inc,
Economic Role of Marine Transportation in Mississippi
Figure 3.19 Location of Port Dependent Agricultural Production and Service Establishments in Northern Mississippi, 2013
Source: MDA Establishment Data, obtained June 2014
Petroleum & Mining Products
Cambridge Systematics, Inc. 3-14
Economic Role of Marine Transportation in Mississippi
The performance of this industry is unique, compared to the other industries. Despite the effects of Hurricane Katrina and recent national economic meltdown, this industry continues to show growth in both employment and output. In 2004, employment in the petroleum and coal industry was 2128, up from 1939 in 2000 and representing a growth of 9.8 percent. By 2014, employment increased to 2500, representing growth of more than 13 percent from 2004. Thus overall employment growth between 2000-2014 is 24.5 percent.Overall, the petroleum and coal industry increased real economic output from $0.16 billion in 2000 to $2.0 billion in 2010 (fixed 2000 dollars), representing growth of more than ten-fold. As shown in Figure 3.9, the petroleum and coal product mining industry employment is clustered in port counties, which accounts for over 90 percent of industry employment. This is not surprising given that the location of these industries are also clustered at or in close proximity to port facilities (see Figure 3.6). This indicates that the port facilities are critical to the industry’s continued competitiveness and growth in the state. As a basic industry of Mississippi, the petroleum and coal products industry is a net exporter of products to the international markets. The location quotient of the petroleum and coal industry increased from 1.8 in 2000 to 2.5 in 2010. This means that the industry's export earnings have increased over the same period. The location quotient trend indicates high future growth prospects for this industry. This growth potential combined with the industry’s high dependence on marine transportation makes port access for that industry critical.
3-13 Cambridge Systematics, Inc,
Economic Role of Marine Transportation in Mississippi
Figure 3.20 Petroleum and Mining Employment by County, 2013
Source: Cambridge Systematics based on MDA Establishment Data, obtained June 2014
Cambridge Systematics, Inc. 3-14

Economic Role of Marine Transportation in Mississippi
Chemical ManufacturingChemical manufacturing while small in terms of total employment has strategic importance as it is part of a larger petro-chemical cluster which includes plastics and rubber products. Following a national trend, chemical manufacturing employment in Mississippi has consistently declined since 2000. Employment declined by 23 percent from 8,018 in 2000 to 6,200 in 2013. The competitiveness of the industry and its potential growth prospects hinge on cost effective and efficient transportation options. Boulder and Harrison Counties contribute 12.5 percent each of industry employment, totaling 25 percent. Monroe County accounts for 10.3 percent and Forest and Jackson Counties employ 6.2 percent each.(see, Figure 3.10). As can be seen, all of the firms in the chemical manufacturing industry are located on a rail line with access to a port, stressing their dependency on both rail and marine transportation.
3-13 Cambridge Systematics, Inc,
Economic Role of Marine Transportation in Mississippi
Figure 3.21 Chemical Manufacturing Employment, by County, 2013
Source: Cambridge Systematics based on establishment data provided by MDA, June 2014
Crop Production
Cambridge Systematics, Inc. 3-14

Economic Role of Marine Transportation in Mississippi
Crop production is a very important industry in Mississippi, particularly for the Delta region. In 2013, the value of field crop production in Mississippi totaled more than $3 billion with soybeans accounting for about $1.2 billion. Animal production is very closely related to crop production as soybeans and corn are a critical input for the feed for animal production. In 2014, crop production accounted for about 3,900 jobs and animal production accounted for about 2,700 jobs. Support services for agricultural and animal production accounted for an additional 2,500 jobs.3 In addition, there are a lot of other business that support crop production including chemical manufacturing, equipment manufacturing and sales and transportation and warehousing. Figures 3.11 and 3.12 depict the location of crop and animal production employment in the state at the county level, respectively. As can be seen, crop production is concentrated in the delta region along the Mississippi River while animal production is more disperse throughout the state with poultry being concentrated delta and the south central portion of the state and aquaculture being located primarily in Harrison County.
3 U.S. Bureau of Labor Statistics, Quarterly Covered Employment and Wages
3-13 Cambridge Systematics, Inc,
Economic Role of Marine Transportation in Mississippi
Figure 3.22 Crop Production Employment, by County, 2013
Source: Cambridge Systematics based on establishment data provided by MDA, June 2014
Cambridge Systematics, Inc. 3-14
Economic Role of Marine Transportation in Mississippi
Figure 3.23 Animal Production in Mississippi by County, 2013
Source: Cambridge Systematics based on establishment data provided by MDA, June 2014
3-13 Cambridge Systematics, Inc,
Economic Role of Marine Transportation in Mississippi
4.0 Economic Impact of Ports in MississippiThe port summaries and user profile provide the foundation for the documenting the economic role of the state’s ports. Using that information, this section documents the economic role and impact of the ports in Mississippi.
4.1 OVERVIEW OF APPROACHIn general, ports and marine transportation impacts economic development in the following ways:Direct impacts are the result of opportunities to recruit industry which in turn enables employment, added value, larger markets, and reduced costs. Both port dependent and port benefited companies seek the best place to do business at the lowest possible cost – and, transportation is an important cost element for many companies.Indirect and multiplier impacts result from local purchases by port dependent companies and their employees. As these firms and their employees make purchases from other Mississippi businesses, they support additional jobs, generating additional income, output and tax revenue.Traditionally the economic impact of ports have been based on the value of commodities transported and the direct port employment and spending. However, for the purpose of the current study, the economic role of the ports is viewed from the perspective of those industries reliant on their services. In other words, if not for the ports, they would not be operating in their current locations. Therefore, the jobs at port dependent businesses as well as the direct port employment is used as the primary economic impact of ports. This data serves as the input he economic model. Figure 4.1 summarizes the approach for estimating the economic benefits of the ports in Mississippi. The process includes the following steps: Develop profiles of port dependent and port benefited industries
throughout the state and vet these findings with key stakeholders. Calculate direct employment of the ports and port dependent users
and the change in transportation costs absent marine transportation for port benefitted industries.
Model the total economic impact based on increased transportation costs for port users if marine transportation service is lost at that users port.
The economic modeling was conducted using REMI, an economic model of the state of Mississippi developed for and maintained by Mississippi Department of Transportation. The results of the economic
Cambridge Systematics, Inc. 1
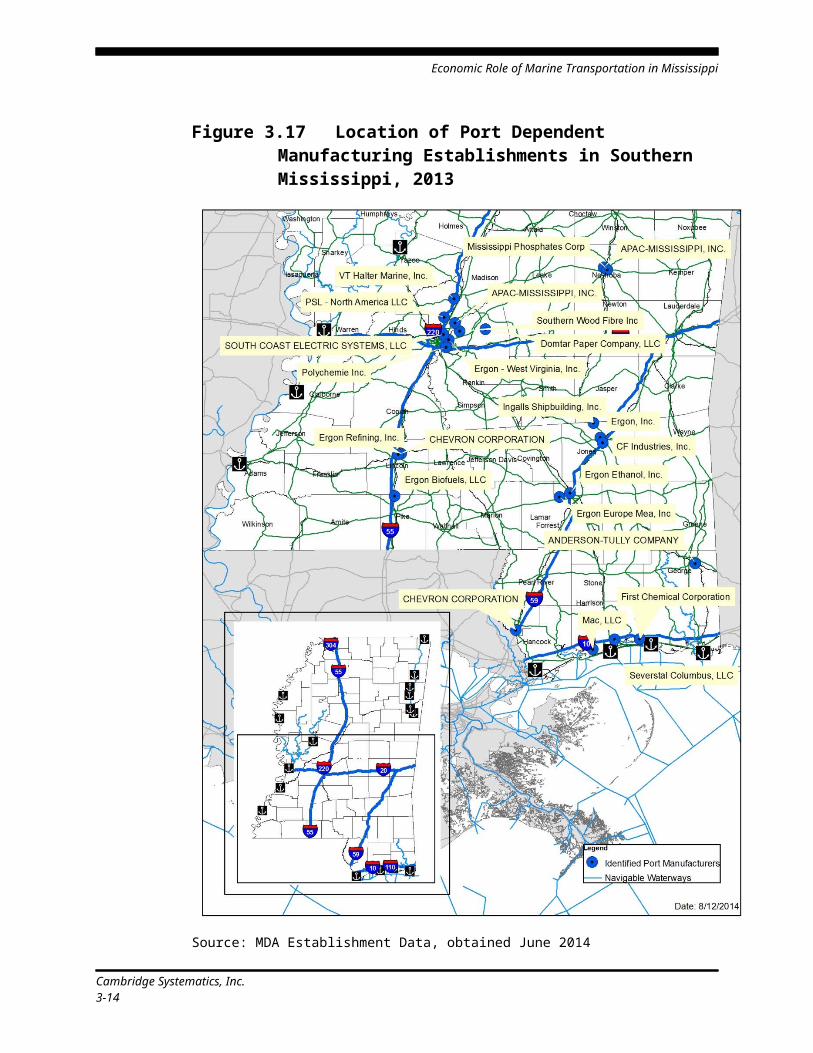
Economic Role of Marine Transportation in Mississippi
modeling exercise represent the direct, indirect and multiplier benefits arising from the availability of ports and marine transportation to Mississippi businesses.
Figure 4.24 Summary Approach to Estimating Economic Importance of Ports
4.2 FINDINGSThe economic analysis was conducted at the state level as well as at the port level for the ports that submitted the required data. For the state level analysis, the economic analysis focuses on the impact of marine transportation employment (direct employment at the ports) as well as the impact of the port users. For the individual port analyses, the economic analysis examines the impact of direct port operations including both employment and non-payroll spending on goods and services provided by Mississippi businesses as well as the employment of on-site port users.
2 Cambridge Systematics, Inc.

Economic Role of Marine Transportation in Mississippi
Statewide ImpactTable 4.1 summarizes the annual economic activity supported by ports in Mississippi. Mississippi’s ports support over 125,700 jobs annually in the State of Mississippi, resulting in nearly $5.4 billion in income and nearly $17 billion in economic output (as measured by gross state product) annually. This means that about 16 percent of the state’s economy and 1 out of every 10 jobs is supported by the ports.
Table 4.4 Summary of Annual Statewide Economic Impact of the Ports in Mississippi, 2013
Impact Measure ValueEmployment 125,715Income (in billions $2012) $5.4Gross State Product (in billions $2012) $16.8
Source: Cambridge Systematics analysis using REMI
The statewide impact of ports is estimated based on the employment associated with the port facilities and marine transportation in the state. First, the direct jobs reflect the number of people employed directly in marine transportation. Table 4.2 displays the breakdown of direct jobs, which total 1,725 in 2014. The majority (58%) of the direct jobs are in inland waterway transportation while just over 1 percent of direct port employment is in sea/coastal waterway transportation.
Table 4.5 Direct Employment in Marine Transportation in Mississippi, 2014Source Number of Jobs Inland waterway transportation 1,000 Sea/Coastal waterway transport 25 Water transport support activities 700
TOTAL 1,725
Source: U.S. Bureau of Labor Statistics, QCEW, December 2014
Cambridge Systematics, Inc. 3

Economic Role of Marine Transportation in Mississippi
The direct employment in marine transportation is small; however, the employment at businesses that depend on the ports is significant. In total, port dependent businesses provide 32,670 jobs in Mississippi with an average weekly salary of about $1,400. This translates into nearly $2.1 billion in personal income annually for Mississippi residents. A breakdown of these jobs and salary by industry is provided in Table 4.3. Table 4.4 provides a breakdown of the total job impact by source of the ports. Businesses that depend on or benefit from the ports are located throughout the state, as shown in Figures 4.2 and 4.3. This emphasis the fact that a port’s benefit can be far reaching and extend well beyond the local jurisdiction in which it is located.
Table 4.6 Employment and Income at Port Dependent Businesses in Mississippi by Industry, 2014
NAICS Code Industry EmploymentAverage
Weekly WageAverage Annual Income Impact
111 Crop production 3,900 429$ 87,001,200$ 211 Oil and gas extraction 940 2,646$ 129,336,480$ 311 Seafood preparation and packaging 2,220 571$ 65,916,240$ 324 Petroleum and coal manufacturing 2,420 2,374$ 298,744,160$ 325 Chemical manufacturing 6,120 1,265$ 402,573,600$ 331 Primary metal manufacturing 3,290 1,205$ 206,151,400$ 336 Ship and boat building 13,780 1,255$ 899,282,800$
TOTAL 32,670 1,392$ 2,089,005,880$
Source: U.S. Bureau of Labor Statistics, QCEW, December 2014
Table 4.7 Employment Impact of Mississippi Ports by Source, 2014
Source Number of Jobs Supported
Direct Jobs 1,725
Inland waterway transportation 1000 Sea/Coastal waterway transport 25 Water transport support activities 700Jobs at Port Dependent Businesses 32,670Jobs at Port Benefited Businesses 24,260Induced Jobs (REMI model) 67,060 From direct jobs 3,460
From port dependent businesses 63,600
TOTAL JOBS SUPPORTED BY PORTS IN MS 125,715
4 Cambridge Systematics, Inc.
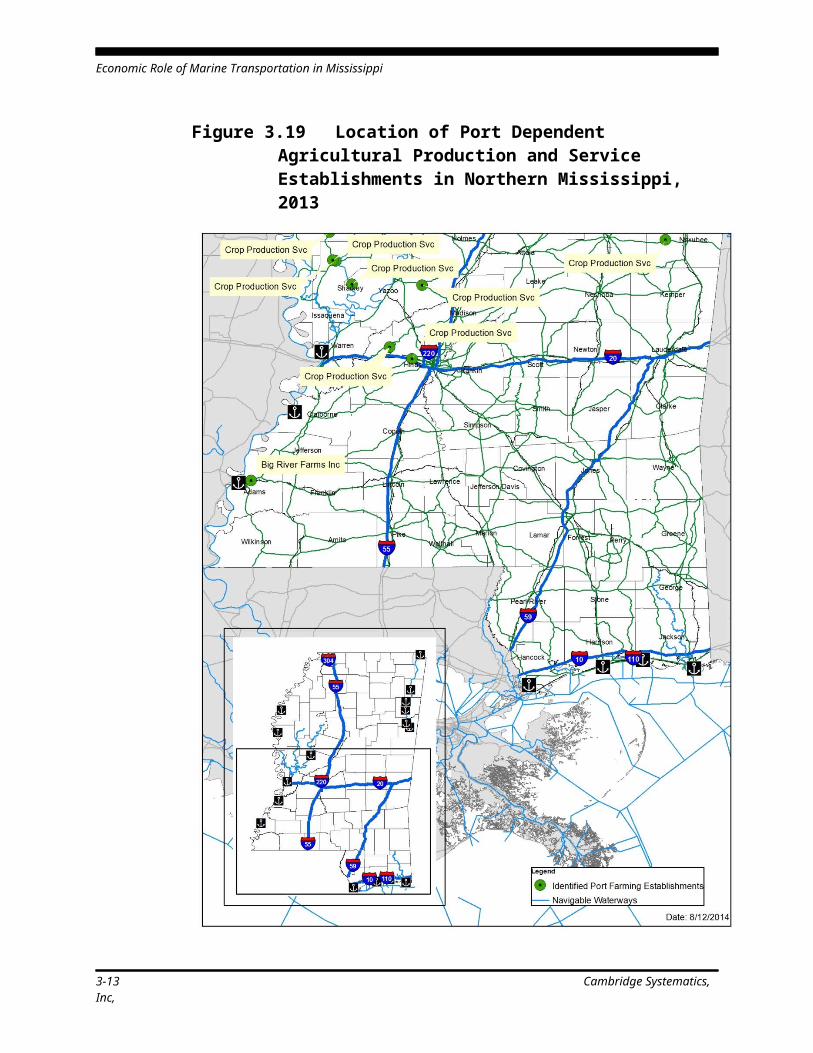
Economic Role of Marine Transportation in Mississippi
Source: Cambridge Systematics analysis using BLS, QCEW data, stakeholder input and REMI
Figure 4.25 Location of Port Dependent Businesses in Mississippi by Industry and Employment Size
Source: CS analysis of Army Corp of Engineer and MDA Establishment data, 2013
Cambridge Systematics, Inc. 5
Economic Role of Marine Transportation in Mississippi
Figure 4.26 Location of Port Benefited Businesses in Mississippi by Industry and Employment Size
Source: CS analysis of Army Corp of Engineer and MDA Establishment data, 2013
As can be seen, nearly every county in the state is home to a business that either depends on or is benefited by a port and marine transportation.
6 Cambridge Systematics, Inc.
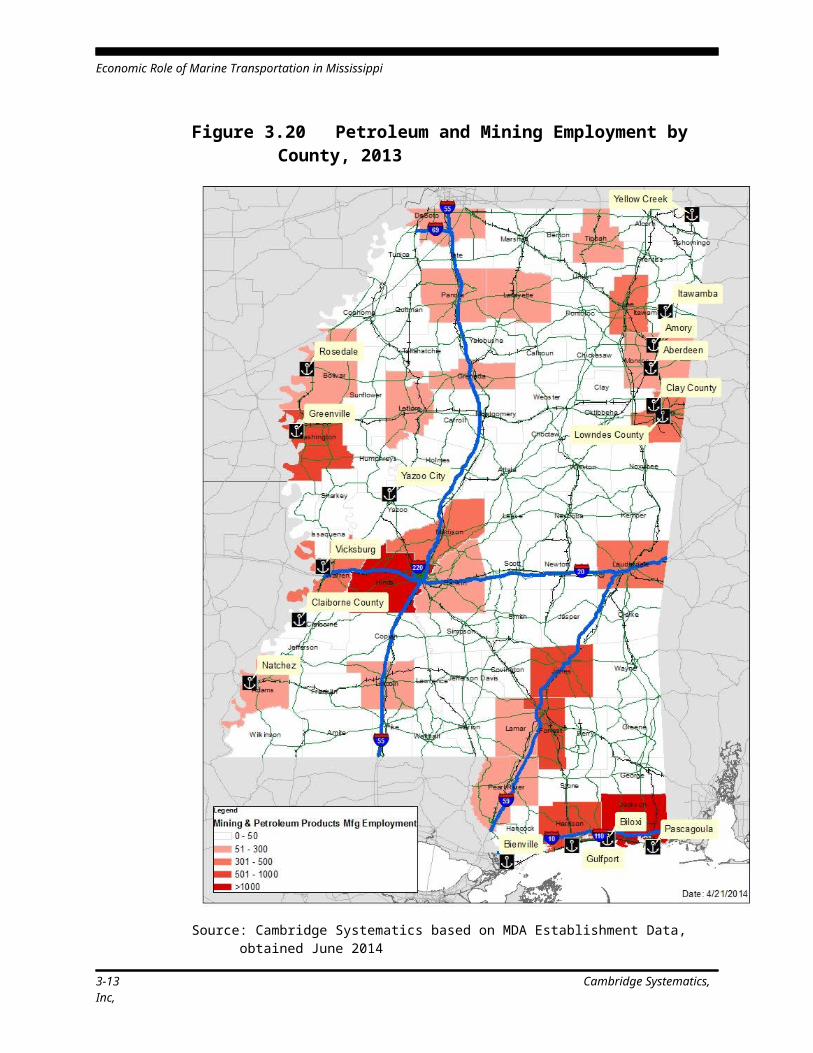
Economic Role of Marine Transportation in Mississippi
Individual Port AnalysisThe analysis of individual ports examined the impacts of the on-going port operations as well as the impact of direct port users located on port property. The justification for not including off port users is that many of those interviewed indicated that had a choice of port facilities and if one closed down or become disadvantageous to use, they would switch to an alternative site. Also, some users already utilize more than one port facility. To conduct the individual facility analysis, each port was asked to provide data on port operations and on-site tenants. While many ports readily made this available, many did not. Therefore, the analysis was only conducted for those reports providing adequate data. Furthermore, it should be noted that even for the ports reporting, some data were incomplete. For example, some ports had employment figures for some tenants but not all tenants. In addition, port users that are not located on the port are not included. For that reason, these estimates should be viewed as conservative estimates of the economic impact of these ports. Table 4.5 displays the data requested and provided by the ports. Data include number of employees working directly for the port as well as port expenditures on payroll and on Mississippi sourced goods and services. For the ports reporting, Bienville demonstrated the largest direct impact in terms of employment and payroll. Meanwhile, Vicksburg has the most on port employment of the ports examined.
Table 4.8 Summary of Direct Economic Impacts of Individual Ports, 2014
PortNumber of Employees
Annual Payroll (millions)
Non-payroll spending with MS based
businesses (millions)Employment at Port
based businessesAberdeen 0 0 0 3Amory 22 $1.00 $1.30 27Bienville 34 $1.40 $0.75 504Clay County 15 $1.25 $10.18 615Itawamba 9 $0.61 NA 246Lowndes County 1 NA $0.13 928Rosedale 5 $0.29 $0.33 520Vicksburg 2 $0.10 $0.30 3,000Yellow Creek State Inland Port 10 $0.61 $0.69 450
Source: Port reported data
NOTE: data only reported for those ports supplying the required information.
Cambridge Systematics, Inc. 7
Economic Role of Marine Transportation in Mississippi
The data on direct employment and spending were used as input into the MDOT’s REMI model to estimate the indirect and induced impacts. The economic impacts are measured in terms of total employment, personal income and gross State Product (GSP). Table 4.6 displays the findings by port. In total, nine of the state’s sixteen ports were examined. The total job impact of these nine ports is estimated to be about 24,000 or about 20 percent of the statewide impact total. This is due to the fact that many of the state’s largest ports including Pascagoula, Gulfport and Natchez were not included in the individual analysis but were included in the statewide assessment. Of the ports examined, Vicksburg has the most significant impact which is not surprising given their on-site tenants. Lowndes County, Clay County, Bienville and Rosedale round out the top five of the nine ports examined in terms of total economic impact.
Table 4.9 Total Economic Impacts of Individual Ports in Mississippi, 2013
Port Job ImpactIncome
Impact($2012)
Gross State Product impact
($2012)Aberdeen 11 244,610$ 760,736.17$ Amory 181 11,603,836$ 36,087,929$ Bienville 1,968 125,825,075$ 391,315,984$ Clay County 2,321 148,428,599$ 461,612,943$ Itawamba 932 59,596,739$ 185,345,857$ Lowndes County 3,396 217,134,290$ 675,287,643$ Rosedale 1,919 56,993,721$ 177,250,472$ Vicksburg 10,973 1,354,591,143$ 4,212,778,456$ Yellow Creek State Inland Port 1,683 107,588,473$ 334,600,152$
-$ TOTAL 23,384 2,082,006,486$ 6,475,040,172$
Source: Cambridge Systematics analysis using MDOT’s REMI model
4.3 CONCLUSIONMississippi’s ports are critical to the state’s economic well being. They provide essential marine transportation and other services to some of the state’s largest and most important industries including petroleum, chemical manufacturing, steel and metal manufacturing, agriculture and ship building to name a few. In many of their communities, the ports are the primary economic asset for recruiting and retaining businesses. Demonstrating their important economic role is that fact that the state’s ports support over 125,700 jobs annually in the State of
8 Cambridge Systematics, Inc.
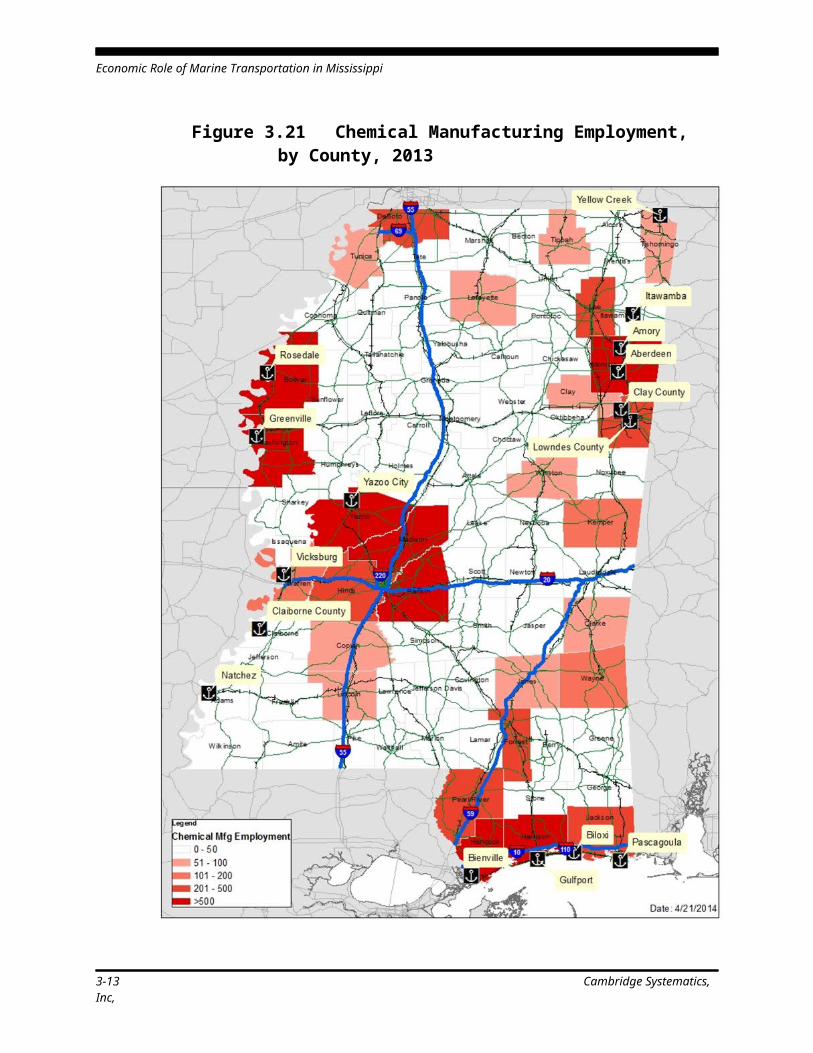
Economic Role of Marine Transportation in Mississippi
Mississippi, resulting in nearly $5.4 billion in income and nearly $17 billion in economic output (as measured by gross state product) annually. This means that about 16 percent of the state’s economy and 1 out of every 10 jobs is supported by the ports.Given the increased global competiveness many Mississippi businesses are facing, it is imperative that the state maintain its advantages. This is especially true with regards to freight transportation and market access. In a world of global markets, businesses must have cost effective and efficient means of moving its supplies and inputs as well as its finished goods both domestically and internationally. Marine transportation is an important element of the global supply chain and maintaining and enhancing that system is critical for continued economic vitality in Mississippi.
Cambridge Systematics, Inc. 9