economic report on africa 2017 - united nations · pdf file136 economic report on africa 2017...
TRANSCRIPT

134
ECO
NO
MIC
REP
ORT
ON
AFR
ICA
2017 5.URBANIZATION AND
INDUSTRIALIZATION IN PRACTICE
construction, urban infrastructure construction and urban-based business services, especially finance and information and communications technology (ICT).
ENSURING BALANCED SYSTEMS OF CITIES
Africa’s urban systems tend to be top heavy with a primary city that is expensive and crowded, and secondary cities that are too small to be viable alternatives for competitive industries. Yet policies to rebalance the urban system risk wasting resources.
Urbanization is an unstoppable force that is changing the economic geography of Africa. Under the right policy framework,
harnessing the momentum of urbanization can carry industry forward to a more prosperous and equitable future. Drawing on the conceptual framework of chapter 4, this chapter explores case studies to connect the forces of urbanization and industrialization in three ways.1
USING URBAN DEMAND TO DRIVE INDUSTRIAL DEVELOPMENT
Africa’s rising middle class is consuming more and different types of goods, as its members live increasingly in cities. Domestic and regional markets are expanding, creating opportunities for African industries to meet growing, and shifting, demand. Strategic and expanding sectors, supported by domestic policy, can leverage this demand to boost industrial development. Some present common opportunities to expand industries to meet urban domestic and regional demand while generating jobs and supporting development outcomes in the following areas: agro-processing, urban housing
Under the right policy framework, harnessing the momentum of urbanization can carry industry forward to a more prosperous and equitable future.

Still, policies that are well targeted can create viable industrial locations that meet the needs of industry without impinging on the economic power of large cities. Supporting the role of large cities to be centres of knowledge and innovation can help leverage their potential for industrial productivity. At the same time, secondary cities and well-located special economic zones (SEZs) with the right infrastructure can balance the needs of sectors for access to inputs, labour, markets and knowledge. Urban–rural linkages are also a key area for spatial targeting and infrastructure investment, where input-intensive industries can foster decentralized development and boost rural productivity. Managing the trade-offs among investment strategies requires policymakers to consider location-based comparative advantages.
OVERCOMING COMMON LAND-BASED BARRIERS TO AGGLOMERATION ECONOMIES
Agglomeration economies are powerful economic forces, as seen in the willingness of firms and people to endure difficult urban conditions to access the benefits of large cities. So, if the challenges are
tackled decisively, the potential benefits are large. These challenges include weak land and property markets, low foresight in allocating space for streets and industrial use, constrained multi-modal mobility and lack of integration of diverse people and activities.
The chapter concludes with the policy implications of linking urban and industrial development through integrated policies and highlighting the importance of coordination and financial support during policy implementation.
5.1 ELEVEN CASE STUDY COUNTRIES
The chapter considers actual practice and experience in Africa, using 11 case study countries (table 5.1) and evidence from other countries and cities. The countries come from the five subregions of Africa (East, Central, North, Southern and West) and exhibit varying levels of urbanization, urban population growth, and industrialization. Some countries are already majority urban (Cameroon, Republic of Congo, Côte d’Ivoire, Morocco and South Africa) while others are still predominantly rural. Most of the countries exhibit high rates of urban population growth, as well as “urban primacy,” understood as urban population concentration dominated by the largest city. The average share of population in the largest city in African countries is higher than a corresponding city in other regions.
The share of industry (employment and value added as a share of GDP) is generally low, but
with the Republic of Congo, Morocco and South Africa performing better. Value added by services as a share of GDP is over 50 per cent in seven of the countries and at or just below 40 per cent in the others. Countries are thus fast urbanizing in economies where industry is still at a fledgling stage and services are booming, often in non-tradeable and informal subsectors (see chapter 3).
The evidence from the case studies corroborates the bidirectional relationship between urbanization and industrialization, but points to significant scope to optimize the potential of urbanization to support industrial development through considered policies and interventions to augment enablers and minimize barriers.
One useful way to group countries—given that policy frameworks must reflect the situation of
Africa’s urban systems tend to be top heavy with a primary city that is expensive and crowded, and secondary cities that are too small to be viable alternatives for competitive industries.

136
ECO
NO
MIC
REP
ORT
ON
AFR
ICA
2017
each country and its position on the urbanization–industrialization spectrum—is to consider their position in exports and economic diversification. Countries fall into four basic groups with similar development challenges: pre-transition countries, transition countries, diversified economies and natural resource exporters (figure 5.1).2
Pre-transition countries (such as Ethiopia) have an opportunity to set a trajectory for well-planned development of cities, balanced development of urban systems and diversified labour-rich industrial target sectors. They also face challenges of limited public resources, low capacities (particularly outside primary cities) and low levels of infrastructure.
TABLE 5.1 Basic statistics on the 11 case study countries
CAM
ERO
ON
REPU
BLIC
O
F CO
NG
O
CÔTE
D’IV
OIR
E
ETH
IOPI
A
MA
DAG
ASC
AR
MO
ROCC
O
MO
ZAM
BIQ
UE
NIG
ERIA
RWA
ND
A
SOU
TH A
FRIC
A
SUD
AN
Population (millions) 23.3 4.6 22.7 99.4 24.2 34.4 28.0 182.2 11.6 55.0 40.2
Urbanization (% of total population) 54.4 65.4 54.2 19.5 35.1 60.2 32.2 47.8 28.8 64.8 33.8
Urban population growth rate (10-year average)
3.7 3.5 3.7 4.8 4.8 2.1 3.5 4.7 6.6 2.4 2.6
Share of urban population in largest city (%)
24.1 62.5 39.5 16.7 30.7 17.0 13.2 15.1 37.6 26.4 37.7
GDP per capita ($) 1,251 1,851 1,399 619 412 2,872 525 2,640 697 5,692 2,089
Industry value added (% of GDP) 27.8 54.7 21.5 16.3 18.1 29.3a 20.1 20.4 14.2 28.7 20.5
Industry value added growth rate (10-year average)
2.4 2.5c 1.8 14.8 5.9 3.1 6.3 2.3 9.3 1.1 2.4
Employment in industry (%, last year available) 9.1 20.6 NA 7.4 7.9 21.4 3.4 8.5 6.7 23.5 15.3
Natural resource rents (% of GDP, 2014) 9.9 48.2 7.3 12.7 10.9 2.7 13.6 12.5 6.1 7.6 6.4
Manufacturing value added (% of GDP) 13.4 7.3 12.5 4.1 14.4b 18.2 9.7 9.5 4.8 13.0 7.8
Services value added (% of GDP) 48.2 38.1 55.5 42.8 57.8 57.7 54.4 58.8 47.5 68.9 50.9
Source: World Development Indicators. Note: Darker cells = higher values in the series. a 2014; b 2008; c Seven-year average. All other data for 2015 (or 2006–2015 for 10-year average) unless otherwise specified.

137
URB
AN
IZAT
ION
AN
D IN
DU
STRI
ALI
ZATI
ON
IN P
RACT
ICE
Transition countries such as Cameroon, Mozambique and Rwanda tend to be early in the urbanization process but already experiencing some of the urban diseconomies. They can still channel emerging growth to invest in key infrastructure and create well placed and serviced industrial locations, linking industry to rural resources.
Diversified economies (such as Côte d’Ivoire, Morocco, Nigeria and South Africa) must manage the challenges of urban growth to maximize the benefits of agglomeration economies and the continued dynamism of their cities. They face crucial trade-offs between investing limited resources, primarily in established and growing cities and industries, or attempting to balance development and industrialize lagging regions.
Natural resource exporters (including the Republic of Congo but also to some degree Côte d’Ivoire, Nigeria and Mozambique) face some of the toughest challenges. Large, export-driven consumption cities tend to have high informality and inequality, and job-poor sectors can crowd out industries that generate more jobs and more balanced development. However, these exporters also have huge opportunities to use financial resources for infrastructure investments, leverage industrial
Burundi
BeninBurkina Faso
Botswana
Central African Republic
Cote d'Ivoire
Cameroon
Congo, Rep.
Egypt, Arab Rep.
Ethiopia
Gabon
Ghana
Guinea
Kenya
Morocco
Mozambique
Mauritania
Mauritius
Malawi
Namibia
Niger
Nigeria
RwandaSudan
Senegal
Seychelles
Chad
Tanzania
Togo
Tunisia
Uganda
South Africa
Congo, Dem. Rep.
Zimbabwe
5
50
500
5,000
50,000
25 35 45 55 65 75 85 95
EX
PO
RT
S P
ER
CA
PIT
A, 2
01
4
Economic Diversification, 2014 (Services and Manufacturing as % of GDP)
PRE-TRANSITION
TRANSITION
DIVERSIFIED
Level of urbanization
Highest
Lowest2nd quartile3rd quartile
NATURAL RESOURCE EXPORTERS
FIGURE 5.1 Four basic country groups based on exports and economic diversification
Source: World Development Indicators.
Foreign exchange from commodity exports can hinder the development of the job-rich tradeable sectors, but earnings from natural resources, if well invested in strategic infrastructure and services, can lay a foundation for economically productive cities.
138
ECO
NO
MIC
REP
ORT
ON
AFR
ICA
2017
linkages to successful export sectors and harness the power of consumption as a driver of industrial development.
The link between urban demand and domestic manufacturing can, however, be more difficult to develop in countries exporting natural resources. Natural resources present opportunities and obstacles for policymakers and can have an impact on the relationship between urbanization and industrialization, creating “consumption cities” characterized by high imports, low formal sector job creation and a predominance of low-productivity services, including informal sector services (chapter 3). Foreign exchange from commodity exports can hinder the development of other, more job-rich tradeable sectors (the Dutch disease). But earnings from natural resources, if well invested in strategic infrastructure and services, can lay a foundation for economically productive cities.
Even countries without major natural resource exports need an industrial policy to develop higher value addition to meet urban demand rather than simply exporting raw agricultural commodities. Uganda illustrates this need, which is common across Africa. It has been urbanizing without industrializing, while exporting agricultural commodities such as maize and coffee. Kampala’s rising population has found more employment in retailing and other services than in manufacturing. The informal sector dominates employment, accounting for 54 per cent of jobs and an estimated 55 per cent of enterprises employ only one person (Gollin and Haas, 2016).
Reconnecting urbanization and industrial job creation in Uganda and other countries will require urban management and industrial policy targeted to improve agricultural value added and to lift small and informal enterprises, no doubt through a combination of wider access to finance and other business services, stronger land and infrastructure policies and more training and education facilities.
Yet some opportunities are missed for fostering industrialization to meet urban demand, with imported goods assuming increasing importance (chapter 4). To take advantage of opportunities, well-implemented policies must support domestic industries and value chains to respond to rising demand.
The link between urban demand and domestic manufacturing can, however, be more difficult to develop in countries exporting natural resources.

139
URB
AN
IZAT
ION
AN
D IN
DU
STRI
ALI
ZATI
ON
IN P
RACT
ICE
5.2 USING URBAN DEMAND TO DRIVE INDUSTRIAL DEVELOPMENT
Africa, and that share is predicted to rise steeply to 30–50 per cent by 2040 (Tschirley, Haggblade and Reardon, 2013; Tschirley, Reardon, Dolislager and Snyde, 2014). The transformation of food purchasing holds opportunities and risks for value chains, including the many small and medium-sized
enterprises (SMEs) involved in transport, storage, processing and wholesale activities. Governments can improve the competitiveness of domestic supply chains by providing infrastructure, access to financial and other business services and assistance in cooperative agreements between farmers and buyers (Reardon et al., 2013; Sautier et al., 2006). Lead retailers can help upgrade the food production, transport and processing value chain with their buying power, resources and technical expertise (box 5.2), buttressed by policy action to support local job creation and pre-empt imports from meeting most urban demand.
To link domestic value chains to agro-processing and foster urban–rural linkages, bottlenecks in supplier quality and skills must be eased. Development of the domestic food value chain is often hampered by the low quality of inputs. Policies should aim to raise suppliers’ quality; however, marketing boards have virtually disappeared, leading to quality problems in many agricultural inputs across Africa (UNECA, 2013). Cameroon (cocoa) and Ethiopia (coffee) both produce commodities for domestic markets. Cameroon adds very little value to its exports, largely because poor growing and drying practices and bad roads lead to low-quality cocoa, loss of sellable products and late deliveries. In
Industrial targets tied to urbanization can tap into Africa’s rapid urban growth to develop domestic and regional markets for domestic industrial products. Africa’s urbanization is in many places accompanied by a growing consumer class with more purchasing power and preferences for manufactured goods, and changing consumption patterns have already created opportunities for domestic industry. This shift is now examined as it relates to the food, housing, infrastructure and business service sectors. But first, the automotive industry is discussed (box 5.1), as an illustration of the power of urban areas in generating demand, as not every country can, or even should, specialize in that industry.
GETTING PROCESSED-FOOD CONSUMPTION TO BOOST AGRO-INDUSTRY AND FOOD RETAILING
Agricultural productivity and urbanization are twin forces. But in the globalized world, imports often leave domestic farmers out of the system. To leverage the momentum of urban demand for agricultural development, policy support is needed for agricultural productivity and chain development, including backward linkages (finance and business services for farmers) and forward linkages (transport, storage and processing).
African cities are seeing a shift towards supermarket-based food purchasing, with supermarkets holding 10 per cent of the retail market in East and Southern
Africa’s urbanization is in many places accompanied by a growing consumer class with more purchasing power and preferences for manufactured goods, and changing consumption patterns have already created opportunities for domestic industry.
African cities are seeing a shift towards supermarket-based food purchasing, with supermarkets holding 10 per cent of the retail market in East and Southern Africa, and that share is predicted to rise steeply to 30–50 per cent by 2040.

140
ECO
NO
MIC
REP
ORT
ON
AFR
ICA
2017
BOx 5.1 GRANTING POLICY SUPPORT TO THE AUTOMOTIVE SECTOR
Automobile consumption in Africa is associated with rising incomes and urbanization (box figure 5.1). With the sector’s potential to meet the growing demand of the urban middle class for vehicles domestically or regionally, policies can target the sector to foster industrialization and generate learning for later entry to global value chains.
10,628.82
DRC
Cabo Verde
Cameroon
DRC
Congo
Egypt
Gabon
Gambia
GhanaKenyaLesotho
Liberia
Madagascar
Mauritius
MoroccoMozambique
Namibia
NigerNigeria
Senegal
Sierra Leone
South Africa
Swaziland
Tanzania
Uganda
Zambia
Burkina Faso
Cabo Verde
Cameroon
DRC
CongoEgypt
Gabon
Gambia
GhanaKenya
Lesotho
LiberiaMadagascar
Mauritius
Morocco
Mozambique
Namibia
Niger
Nigeria
Senegal
Sierra Leone
South Africa
Swaziland
Tanzania
Uganda
Zambia
0.01
0.02
0.05
0.14
0.37
1.00
2.70
7.29
19.68
53.14
143.49
387.42
200.00 540.00 1,458.00 3,936.60
Urban consumption per capita
Ruralconsumption per capita
Lineal (Urban consumption per capita)
Lineal (Rural consumption per capita)
BOx FIGURE 5.1 Urban and rural consumption of motor cars by GDP per capita, 2010
Source: Global Consumption Database.
BOx 5.2 POLICY TO HARNESS THE POWER OF LARGE RETAILERS IN SOUTH AFRICA’S SUPPLY CHAIN DEVELOPMENT
Massmart, a subsidiary of the giant US retailer Walmart, is the second-largest distributor of consumer goods in Africa and the leading retailer of general merchandise. Participation in supplier development was one of the government conditions upon which Walmart was allowed to enter South Africa.
In 2012 Massmart established a R200 million Supplier Development Fund to assist South African small and medium-size enterprises, particularly SMEs that are either black owned or local manufacturers, and to run for five years (2012–2017). Investing in farming, manufacturing and service firms, the fund aims to improve the quality of products, assist local suppliers to expand production capacity, help suppliers to reduce input costs,

141
URB
AN
IZAT
ION
AN
D IN
DU
STRI
ALI
ZATI
ON
IN P
RACT
ICE
BOx 5.1 GRANTING POLICY SUPPORT TO THE AUTOMOTIVE SECTOR BOx 5.1 CONT. GRANTING POLICY SUPPORT TO THE AUTOMOTIVE SECTOR
South Africa—the continent’s leading producer—illustrates the industry’s potential. Largely reflecting policies since 1995, it exported nearly 334,000 vehicles of all types and sold 284,000 domestically in 2015, alongside $3.9 billion-worth of component exports (Lamprecht, 2016). It has 150 component companies. Gauteng, though geographically the smallest province in South Africa, has the most automotive suppliers, mainly because it offers investors business opportunities, including well-developed infrastructure. The Gauteng Growth and Development Agency, the Automotive Industry Development Centre and the Automotive Supplier Park support the industry and are charged with promoting its trade and investment and with implementing projects.
Gauteng province has created an enabling environment for the automobile industry to keep growing. These include its logistical and transport facilities (Gautrain and rapid transit system), physical and economic infrastructure, modern production-testing facilities, administrative government presence (City of Tshwane), research and development (Council for Scientific and Industrial Research) and a financial hub (City of Johannesburg). By 2012 Gauteng province accounted for 29.6 per cent of South Africa’s light vehicle exports by original equipment manufacturers as a share of total exports (Automotive Industry Export Council, 2013).
An additional enabling factor is South Africa’s position as a major supplier of platinum and other group metals required by the automotive industry. The country meets 12 per cent of the global demand for catalytic converters and has 70 per cent of the world’s chromium used in catalysts and in producing modern auto exhausts (Automotive Industry Export Council, 2013).
One of the challenges for the country’s automotive industry is to increase local content. The Industrial Policy Action Plan 2016/2017–2018/19 stipulates an increase in local content to 70 per cent or more for high-volume models and 40–50 per cent for low-volume models (Automotive Industry Export Council, 2016).
Job creation has yet to become an important policy aspect. David Kaplan, former chief economist at South Africa’s Department of Trade and Industry, has remarked that “in practice, most of our industrial support favours capital-intensive activities—for example, two thirds of our industrial policy support goes to the automotive industry, which is not at all labour-intensive” (Altbeker, McKeown and Bernstein, 2012, p. 24). South Africa’s current Industrial Policy Action Plan (IPAP 2016/17–2018/19) emphasizes the need to shift towards manufacturing sectors such as agro-processing and clothing (Department of Trade and Industry, 2016).
Industrial policies have also fostered a large and fast-expanding automotive industry in Morocco, including a Renault factory in the economic free zone municipality of Melloussa, near Tangiers, in 2012. The industry is now the country’s largest export sector, dethroning phosphates. Automobile production is also on the rise in Algeria. Egypt has 15 car assembly plants targeting the domestic market (Oxford Business Group, 2016). And Kenya and Ethiopia have emerging vehicle assembly sectors.
enable Massmart to increase and diversify its local sourcing capacity, provide a route to market to locally produced products (locally and internationally), and establish and build long-term supplier partnerships. Sales of manufacturing SMEs to Massmart, mainly involved in food and beverages (packaged juice, biscuits, baked goods and maize meal) and building materials (paint, window and door frames, and clay and cement bricks) increased from R15 million in 2012 to R70 million in 2014 (Massmart Walmart, 2015).
BOx 5.2 CONT. POLICY TO HARNESS THE POWER OF LARGE RETAILERS IN SOUTH AFRICA’S SUPPLY CHAIN DEVELOPMENT

142
ECO
NO
MIC
REP
ORT
ON
AFR
ICA
2017
Ethiopia poor coffee production is a problem, but a growers’ cooperative has upgraded quality by working directly with farmers to build skills, generating exports of speciality coffees to high-income countries (UNECA, 2013).
Processing and export firms in both countries have indicated that weak government support hinders value chain development, and even when policies offer financial incentives for local processing (Ethiopia), they are ineffective owing to burdensome procedures (UNECA, 2013).
Across Africa policymakers should consider the full agricultural and agri-business value chain, providing support to agricultural productivity and quality, to transport, storage and logistics, and to agro-processing industries, while ensuring broader access to business services.
MEETING HOUSING NEEDS WITH URBAN PROGRAMMES
Morocco has had notable success in upgrading slums and relocating slum dwellers through its Cities without Slums (Villes Sans Bidonvilles) programme, declaring 54 cities to be slum free (out of an original target of 83 between 2004 and 2013) (Ibrahim, 2016). Through a three-pronged approach, the programme has moved slum dwellers to new housing (mostly apartment blocks), provided them with serviced plots to build their own homes and conducted on-site upgrading of infrastructure and services (Baverel, 2008). The programme has stimulated private construction demand by providing partial mortgage guarantees and subsidies partly funded through a new tax on cement, making
legal provision for microfinance institutions to lend for housing and bringing in $272 million from European development partners. Tax incentives to private developers of social housing have spurred competition, boosting quality and reducing costs (Ibrahim, 2016).
In Ethiopia, the Integrated Housing Development Programme targets urban and industrial goals by increasing the supply of urban housing, while supporting the construction sector. The programme was launched in 2005 in response to rapid urbanization, high urban poverty and a severe housing shortage in urban areas.3 Households open a savings account with the programme to become eligible for housing. The funds in this account can be used for down payments on a unit (ranging from 10 per cent to 40 per cent of the unit’s cost), and the balance is paid with a 20-year mortgage. New homes are allocated to beneficiaries through a lottery system where the first 30 per cent of housing goes to women.4 Smaller units are cross-subsidized up to 30 per cent by sales of larger units. The costs of infrastructure, land and financing are excluded from what the households pay under the programme, reflecting a public subsidy (World Bank, 2015). Between 2006 and 2010 the programme turned over 142,802 homes to households, 56 per cent in Addis Ababa (Ministry of Urban Development, Housing and Construction, 2015). Between 2010 and 2015, it built a further 90,000-plus homes there (Development Workshop, 2015).
Capacity building is part of the strategy for Ethiopia’s local enterprises to benefit from the resulting growth in the construction industry. By the end of the Growth and Transformation plan period of 2010/11–2014/15, 41 domestic construction contractors and 35 domestic construction consultants were qualified as internationally competitive (National Planning Commission of Federal Democratic Republic of Ethiopia (May 2016), Growth and Transformation Plan II 2015/16–2019/20; Addis Ababa). Construction of parts of
Across Africa, policymakers should consider the full agricultural and agri-business value chain, providing support to agricultural productivity and quality, to transport, storage and logistics, and to agro-processing industries, while ensuring broader access to business services.
In Ethiopia, the Intgrated Housing Development Programme targets urban and industrial goals by increasing the supply of urban housing, while supporting the construction sector.

143
URB
AN
IZAT
ION
AN
D IN
DU
STRI
ALI
ZATI
ON
IN P
RACT
ICE
building superstructures are often reserved for micro and small enterprises, which are vetted. If they pass, they are eligible for support, including workshop facilities, access to credit, training and subsidies on machinery.
However, the Integrated Housing Development Programme is not without criticism. While its housing is less expensive than that on the private market, it is still not affordable to most of the population, leading some of the buyers in the programme to rent out their units to cover the mortgage payments. In addition, the housing blocks do not comply with basic principles of urban design as they are often grouped in single-use developments on the urban periphery, placing a steep commuting burden on residents (Croese, Cirolia and Graham, 2016; Mota, 2015).5 The long-term financial viability of the project is also a concern (World Bank, 2015).
TYING URBAN INFRASTRUCTURE INVESTMENT TO DOMESTIC INDUSTRY THROUGH PROCUREMENT POLICIES AND OTHER SUPPORT
Expanding public investments in urban construction and infrastructure can support domestic industry. Ghana saw growth in the construction sector through investments in the early 2000s, including public investments in low-cost housing, major road infrastructure and the West African Gas Pipeline. Construction is intended to play a key role in that country’s industry-based economic growth under the current industrial policy framework (Ackah, Adjasi and Turkson, 2016). In South Africa, government spending is tied to industry through a domestic-procurement policy aiming for 75 per cent local content in public projects (IPAP 2016/17–2018/19). This target has not always been met, but local content policies for bus agencies have led to the domestic manufacture of more than 700 bus bodies (Industrial Development Corporation, 2016), alongside efforts to improve urban mobility.
In Mozambique, an explicit focus on sourcing government purchases locally has seen the fast growth of the construction sector to meet demand for investment in dams and roads (National Industrial Policy and Strategy 2015–2025). The country’s 11 cement plants increased production and took market share from manufacturers of imported
cement between 2011 and 2015. However, most of these plants still source raw materials from outside Mozambique given delays in delivery of local inputs.
In Cameroon public investments create some demand for industrial products: although domestic procurement targets are low, domestic capacity is often insufficient to meet needs, and qualification standards tend to be high for small and emerging enterprises (Kemajou et al., 2007).
Low-tech, labour-intensive infrastructure projects accessible to SMEs are a major opportunity for urban job creation. Although domestic capacity is often a barrier, lower-skilled labour-intensive technologies have high potential in some public investment sectors, including roads. Between 2005 and 2008, Ethiopia, through a cobblestone roads and pavement programme, created more than 90,000 jobs for young people, which led to the establishment of 2,000 small and medium enterprises. The project includes backward linkages to domestic inputs—cobblestones—and labour-intensive skills in quarrying, chiselling, transporting and paving. The programme, implemented in 140 towns and villages, built around 350 km of road (Asrat, 2014). The country created 845,900 jobs in housing and related projects, including cobblestones, during the planning period 2010/11–2014/15 (National Planning Commission of Ethiopia, Growth and Transformation Plan II 2015/16–2019/20).
The project is however a small segment of Ethiopia’s infrastructure investment in roads. Investment in road construction in 1997–2009 lifted road density by more than 70 per cent, while the portion of roads in good and serviceable condition increased from 22 per cent to 54 per cent (Shiferaw et al., 2012).
Expanding public investments in urban construction and infrastructure can support domestic industry. Ghana saw growth in the construction sector from public investments in the early 2000s, including public investments in low-cost housing, major road infrastructure and the West African Gas Pipeline.

144
ECO
NO
MIC
REP
ORT
ON
AFR
ICA
2017
Yet investment in infrastructure has been a growth engine for the Ethiopian economy: in 2011 the country’s public investment was the third highest in the world as a share of GDP (18.6 per cent), exceeded only by Turkmenistan (38.6 per cent) and Equatorial Guinea (24.3 per cent) (World Bank, 2013a). In 2013 this figure was 20.2 per cent. The construction sector as a share of GDP jumped from 4 per cent in 2009/10 to 8.5 per cent in 2014/15 (National Planning Commission of Ethiopia, Growth and Transformation Plan II 2015/16–2019/20).
LEVERAGING URBAN-BASED BUSINESS SERVICES FOR JOBS AND INDUSTRIAL PRODUCTIVITY
Urban-based business services are another catalytic sector linked to industrial productivity and job creation.6 Though small, ICT is an emerging sector with strong growth and employment potential. Freelancers, many young, access the global market of e-work opportunities. Egypt, Kenya, Nigeria and South Africa are in the top 25 countries in world freelance listings. Total employment in 2013 in ICT and business process outsourcing (BPO) in Mauritius was estimated at 15,000, and the sector contributed 6.5 per cent of GDP. South Africa’s BPO industry is already developed; Kenya is making headway; and similar developments are underway in other countries, including Botswana, Ghana and Senegal. Business incubators in information technology (IT) are growing across cities in Africa. Examples include MEST in Accra, Bongo Hive in Lusaka, iLab Liberia in Monrovia, Co-Creation Hub Nigeria in Lagos, ActivSpaces Cameron in Buea and Ihub in Nairobi (Benner, 2014).
For tradeable services to enhance manufacturing productivity, linkages must be in place and may not form naturally, as shown in Kenya, where service exports are relatively high but linkages to other sectors are lower than in similar countries (World Bank, 2016a). Integration of business services into the broader economy, including manufacturing, has been more successful in Rwanda (box 5.3).
Finance is a particularly important urban-based sector for SME growth. Sudan has taken steps to improve financial access, especially for industrial firms, including SMEs. As Sudan’s largest city and administrative capital, Khartoum could be the hub of a growing national financial sector. The city already has high demand for financial services, with one survey indicating 1.5 million urban inhabitants are interested in microfinance loans (World Bank, 2013b). Although financial intermediation is still low, Sudan’s Sharia-compliant system accounts for two-thirds of such transactions in Africa. Policy efforts in 2013 simplified the regulatory framework for financial access and new bank branches, and the central bank made preparations for mobile banking. Reforms target small enterprises, which make up 93 per cent of manufacturing firms, by requiring that commercial banks set aside 12 per cent of resources for microfinance loans (UNECA, 2015a; World Bank, 2013b). In 2014, 15.3 per cent of firms in Sudan identified finance as a major constraint, but this is less than the average for countries in North Africa (32.3 per cent) and all other subregions in Africa.7
Urban-based business services are another catalytic sector linked to industrial productivity and job creation.
Low-tech, labour-intensive infrastructure projects accessible to SMEs are a major opportunity for urban job creation. Although domestic capacity is often a barrier, lower-skilled labour-intensive technologies have high potential in some public investment sectors, including roads.

145
URB
AN
IZAT
ION
AN
D IN
DU
STRI
ALI
ZATI
ON
IN P
RACT
ICE
BOx 5.3 RWANDA’S TRADEABLE SERVICES AS AN ENGINE OF BROAD-BASED GROWTH
Urban-based business services can benefit the entire economy and contribute to a positive investment climate, as in Rwanda, which ranks third in Africa on the World Bank’s Doing Business, behind Mauritius and South Africa. It scores well partly because of the financial and ICT sectors. The business service sector in the country has been supported by investment facilitation, strong political commitment, strategy development and upgrading of the regulatory framework.
Rwanda first adopted a national IT policy in 1992, with current policies and plans focused on innovation, ICT infrastructure and exports (UNCTAD, 2014). The government has partnered with Carnegie Mellon University to establish an ICT Center for Excellence, and the College of Science and Technology at the University of Rwanda has developed several programmes in computer engineering and information technology.
The policy push on ICT has helped to increase ICT penetration, with the share of urban households owning a mobile phone rising from 26.5 per cent in 2005/06 to nearly 88 per cent in 2013/14. Over the same period the share of the urban population owning a computer went from 1.8 per cent to 12.2 per cent. ICT now contributes 2 per cent of GDP, increasing more than fourfold between 2006 and 2015 (NISR, 2015). Improvements in ICT have been linked to improvement in the overall business environment, for example, through the creation of an online business registration process. Online services have contributed to Doing Business environment classifying Rwanda’s among the best places to start a business.
Similarly, Rwanda’s financial services sector, driven by a strategic policy orientation set by the government, is expected to contribute to economic transformation through job creation and support to other sectors. Since 1994 the sector has grown to include 12 commercial banks, three microfinance banks, one development bank and one cooperative bank, in addition to a large number of non-bank financial institutions in insurance and pension schemes (Rwangombwa, 2016) and the nascent Rwanda capital market. Financial services in Rwanda grew from about $94 million in 2006 to over $256 million in 2015, accounting for 3 per cent of GDP over the period (NISR, 2016a). Financial inclusion, measured by the use of financial services, increased from 47 per cent in 2008 to 72 per cent in 2012 (MINECOFIN, 2013).
BOx TABLE 5.2 Employment growth and size of firms in Rwanda’s private formal business services
EMPLOYMENT IN 2011
EMPLOYMENT IN 2014
% GROWTH 2011–2014
% LARGE ENTERPRISES
% SMES % MICRO ENTERPRISES
ICT 1,621 1,824 13 6 56 38
Financial services
6,343 11,195 76 3 80 17
Source: Establishment Census 2014 and Integrated Business Enterprise Survey Report 2014 (NISR, 2015; NISR, 2016a). Note: Data on size of firms is for 2015.
New authorized loans for manufacturing activities by financial institutions operating in the country increased from RWF 20.1 billion in 2011 to RWF 51.2 billion in 2015. In construction, loans for public works and building activities amounted to RWF 237.3 billion in 2015, up from RWF 90.3 billion in 2011 (Rwangombwa, 2016).
The development of ICT sectors has been a key factor supporting related technology manufacturing. New firms include A-Link Technologies, a subsidiary of ChinaLink, which assembles relatively inexpensive Rwanda-branded mobile phones from imported materials (UNCTAD, 2014) and the South American technology firm Positivo BGH, which has opened a subsidiary in Rwanda to manufacture and sell personal computers and other electronic products in the country (Positivo BGH, 2015).

146
ECO
NO
MIC
REP
ORT
ON
AFR
ICA
2017
5.3 ENSURING BALANCED SYSTEMS OF CITIES
that critical economic driver. Policies to develop secondary cities risk wasting scarce resources when these cities have low competitive potential (Annez and Buckley, 2009).
Managing the trade-offs requires a close look at location-based areas of comparative advantage. Secondary cities can thrive by developing a specialized set of products and leveraging linkages to rural areas and large cities. For example, Garoua, Cameroon, is a moderately sized city but a major industrial player given its large cluster of agro-processing enterprises, many of them run by women (Sautier et al., 2006). Enabling conditions include a river port that offers access to regional markets and
MAKING DIVERSE URBAN SYSTEMS MORE RESILIENT TO ECONOMIC CHANGE
African countries often have unbalanced national urban systems with a very large primary city and less competitive smaller cities (chapter 4). As industries weigh location options, systems with few urban alternatives deprive industrial firms of locational opportunities. In response some African countries have policies to rebalance their urban systems (figure 5.2). Yet such policies can be problematic, particularly if they neglect much-needed investments in the primary city and undermine the functionality of
No data
0-10%
10-20%
20-30%
30-40%
40-50%
50-60%
60-70%
70-80%
80-100%
Egypt has an extensive New Cities programme in operation since the 1970s to redirect growth away from fertile cropland and overcrowded metro areas (described below).
Mozambique’s Ministry of Industry and the Special Economic Zones Office provides preferential conditions, including infrastructure, for companies willing to invest in rural and remote parts of the country to promote balanced territorial development. But most industrial projects still occur near Maputo and near the transborder corridor with South Africa.
Côte d’Ivoire is promoting regional centres as agro-indus-try growth poles (described below).
Senegal’s industrial firms are concentrated in Dakar, but the Accelerated Growth Strategy under the Export Creation Agency seeks to rebalance industrial facilities throughout the country through industrial zones (Cissa et al., 2016)
South Africa is promoting balanced territorial development to overcome an apartheid legacy, while attempting to balance the locational needs of industry (described below).
Rwanda’s economic strategy promotes six secondary cities and Kigali as poles of growth (described below).
Ethiopia’s development strategy promotes seven secondary cities and Addis Ababa as growth centres (described below).
FIGURE 5.2 Percentage of urban population in largest city and national policies to promote urban system balance, 2015
Source: World Development Indicators; Esri country boundaries.

147
URB
AN
IZAT
ION
AN
D IN
DU
STRI
ALI
ZATI
ON
IN P
RACT
ICE
the surrounding fertile agricultural land. Garoua emerged organically, based on its first-nature advantages, but a raft of countries has attempted to use policy to develop secondary cities and rebalance primary-heavy systems by developing industry outside the largest city. The best strategy for balancing a system of cities depends on each country’s context and opportunities. No policy prescription has yet to be a universal best practice in managing the difficult choices in regional development planning.
More balanced national urban systems offer greater opportunities and options for the location of industries. Nigeria, for example, has one of the most balanced urban systems in Africa, with seven cities with populations above 1 million and a dozen more with populations between 500,000 and 1 million. Many of Nigeria’s cities existed well before colonial times as trading posts and had roles and populations that changed with the shifting economic landscape. Lagos has grown to become Africa’s largest metropolis, and other coastal cities have risen in response to the petroleum industry. Abuja, planned as an administrative centre, is now an emerging manufacturing growth pole. Kano and other cities in the north have struggled with insecurity, but still play a dynamic role in industry and regional trade (Bloch et al., 2015), with Kano listed as one of McKinsey’s hot spots for growth by 2025 (McKinsey Global Institute, 2012).
Nigeria’s industrial zones have sometimes succeeded and sometimes failed, but in spite of problems in industrial zone implementation, manufacturing firms have clustered organically, such as the computer village in Otigba, Lagos, the auto parts fabricators in Nnewi and the footwear and garment cluster in Aba (Chete et al., 2016).
ATTEMPTING TO REBALANCE REGIONAL DEVELOPMENT
Despite urban primacy, secondary cities with a specialized industry cluster can offer the benefits of localization economies without the crowding effects of primary cities. They can also link rural commodities and markets, adding value and creating jobs. Some policies to develop secondary cities and more balanced urban systems are summarized in figure 5.2 and detailed in the text below.
NIGERIA
Working directly with target industries is one way to correctly target and support their locational needs in secondary cities. For example, Ogun State, Nigeria, has attracted a surge of industrial firms from Lagos, but initially did not have the housing for its workforce. Identified as a problem by Coleman Wires and Cables, the company built housing itself. In similar cases in Nigeria, where States have attracted companies without all the necessary infrastructure already in place, they have made agreements with firms on key investments, such as electrical lines.
UGANDA
A recent policy paper by the Government of Uganda and the New Climate Economy Partnership (2016) highlights the integrated spatial-economic approach that will inform the National Urban Plan and its implementation strategies under development, recognizing the time-limited opportunity to chart the country’s development this way: “Relative to 2040, at least three quarters of the country’s infrastructure, industry and urban areas are unbuilt,” (p. v).
The best strategy for balancing a system of cities depends on each country’s context and opportunities. No policy prescription has yet to be a universal best practice in managing the difficult choices in regional development planning.
Policies to rebalance urban systems can be problematic if they neglect much-needed investments in the primary city and undermine the functionality of critical economic drivers.

148
ECO
NO
MIC
REP
ORT
ON
AFR
ICA
2017
Uganda’s proposed growth plan takes into consideration the geography of regional value chains, freight routes and the differing roles of Kampala and secondary cities, identifying three “tier 1 cities” as well as Kampala for leading economic roles (figure 5.3). It lays stress on a compact and connected pattern of urban development for reducing the costs of infrastructure, increasing access to social services and limiting environmental impact. Implementation measures focus on green modes of transport within and between cities. The plan emphasizes the need to integrate economic and
spatial planning and to ensure coordination among key implementing agencies.
RWANDA
In Rwanda the national development framework has an explicit objective to set a balanced urban growth trajectory through developing secondary cities. Far from being anti-urban, Rwanda’s Vision 2020, adopted in 2000, aimed for a target of 35 per cent urbanization by then, to support off-farm job creation and economic structural transformation. The government has identified six secondary cities in addition to Kigali as economic poles of sustainable and inclusive economic growth. Rwanda’s secondary cities have been the focal point of initiatives to foster specialized economic activities based on existing comparative advantages. Development initiatives have included a gradual push to foster financial decentralization, establish one-stop
Rwanda
DRCKenya
EthiopiaSouth Sudan
Northern Uganda agricultural clusterHub for agriculture in the north of Uganda, focuses on agroprocessing and light industrial activities.
Mbale-Tororo industrial trading and processing zoneIndustrial zone focuses on agriculture, secondary manufacturing, trading and logistics services. Link to Kenya.
Kampala national metropolitan economic areaMultifunctional, service sector-led economic hub with international regional influence
Mbarara-Kabale regional trading corridorFocuses on industry and minerals with good connections to Rwanda and the DRC.
FIGURE 5.3 Compact and connected urban growth scenario, Uganda
Source: Government of Uganda (2016).
Rwanda’s Vision 2020 aimed for a target of 35 per cent urbanization by then, to support off-farm job creation and economic structural transformation.

149
URB
AN
IZAT
ION
AN
D IN
DU
STRI
ALI
ZATI
ON
IN P
RACT
ICE
centres to support property and business permits and set up agakiriro (job) centres. Each district has created a district development plan with a strategy for leveraging its potential, aligned with national policies.
Several secondary cities promote industrial development as an area of comparative advantage. For example, Huye, endowed with rich soil, has an expanding agri-business sector, supported by the National Institute of Scientific Research, National University of Rwanda and local seed research laboratories. In Nyagatare, granite quarries provide inputs for building materials. The East African Granite Industries, the largest player in the district’s quarrying and granite processing, produces tiles, kitchen and bath counter tops and other building supplies for local and regional markets. Rubavu, too, has leveraged natural advantages for development, drawing on Lake Kivu’s vast deposits of methane and carbon dioxide gases for power generation. A $200 million project is run by the US firm Contour Global to extract the methane and provide up to 100 megawatts of electricity.
The economic geography of the urban system is woven throughout Rwanda’s development vision. Secondary cities are only one component of the country’s urban and rural hierarchy, which includes district towns, urban subcentres, trading centres and umudugudu (villages), each with policy directives for achieving inclusive and growth-generating urban growth (Urban Planning Code, 2015). Further strategies to guide urbanization are in the recently approved National Urbanization Policy (2016). Rwanda’s secondary cities still face obstacles to economic competitiveness, including shortage of skilled workers, lower capacity among local government staff and infrastructure deficits.
ETHIOPIAEthiopia’s urban policies also focus on promoting planned secondary city development in advance of urbanization, largely as industrial enterprises are relatively clustered: in 2009/10 Addis Ababa had 11 times the number of manufacturing enterprises of the second city on this metric, Awassa (Gebreeyesus, 2016). Addis has in recent years seen major physical transformation through public and private investment in infrastructure and housing, but there is still much catch-up investment required for the city to overcome barriers to industry and business. Along with enabling Addis to leverage its competitive potential as a primary city, Ethiopia’s urban strategy identifies seven geographically dispersed cities as future growth centres for balanced growth. It aims for these cities to draw on the diverse economic potential of their regions and sustain the country’s rapid economic growth.
Road and railway links connecting secondary cities to each other and to their surrounding rural areas form a central plank for developing regional growth poles. During the first decade of this century, Ethiopia allocated 3 per cent of GDP to investment in roads, bringing the quality of the trunk network up to the level of other low-income countries in Africa (Foster and Morella, 2010). The Addis Ababa–Djibouti railway line was completed in late 2016 and inaugurated in January 2017. With 53 per cent of
the tracks replaced and with a maximum speed of 160 km an hour for passenger trains and 120 km an hour for cargo trains, the railway cuts travel time by two-thirds.8 Against the $42.8 per ton of freight cost by road, the railway is expected to cost $15.3–35.6 per ton.9
A related strategy is establishing industrial parks with accessible infrastructure and one-stop service centres and granting tax exemptions for investors. Each park is centred on a targeted industrial cluster, such as textiles, and located to access urban labour
Despite urban primacy, secondary cities with a specialized industry cluster can offer the benefits of localization economies without the crowding effects of primary cities. They can also link rural commodities and markets, adding value and creating jobs.
Ethiopia’s urban policies focus on promoting planned secondary city development in advance of urbanization, largely because industrial enterprises are relatively clustered.

150
ECO
NO
MIC
REP
ORT
ON
AFR
ICA
2017
in and around the city. There are industrial parks around Addis Ababa and Hawassa, and others are planned, including those for Adama, Arerti, Debre Berhan, Kombolcha, Dire Dawa and Mekelle (Ethiopian Investment Commission, 2016a). The Hawassa park as of 2016 had attracted 15 global apparel and textile companies (Ethiopian Investment Commission, 2016b), with an agreement to recruit and train 30,000 textile workers (Industrial Parks Development Corporation, 2016). Initial results of Ethiopia’s balanced development policies seem positive. The strategy also includes establishing Integrated Agro Industrial Parks, which will focus on promoting agro-processing for domestic and export markets by clustering related firms and by enabling them to access infrastructure and extension services, and ultimately benefit from economies of scale in market transactions.
CÔTE D’IVOIRE
The country’s National Development Plan (2016–2020) advances the theme of competitive cities by promoting more balanced development across
the country, reviving pre-conflict comparative advantages based on agro-climatic conditions and reducing congestion in Abidjan. It identifies some secondary cities as regional growth poles based on value-added industries linked to agricultural products. Policies to support agro-industrial development include setting up technical training centres and research centres in the growth poles. Former policies to relieve pressure on Abidjan have had some success through infrastructure provision: the rapid growth of San-Pédro—on the coast 340 km from Abidjan—is tied to the construction of a deep-water port for exporting cocoa and cocoa products.
In Egypt, crowding in urban centres, particularly greater Cairo and Alexandria, as well as urban expansion onto precious agricultural land, led the government to develop a New Cities programme from 1977, establishing 22 cities. Most new cities have fallen into one of three categories: primarily residential satellite cities around Cairo; twin cities intended to have an economic base but connected to an existing smaller city; and independent cities, some intended to have an industrial base.
Egypt’s first generation of new cities, built between 1977 and 1982, were primarily independent cities, and by 2014 achieved 18.4 per cent of their original population targets (2 million of 11 million). The second generation, built between 1986 and 1997, were built as satellite or twin cities and achieved 23 per cent of their intended population targets (2 million of 9 million). The third generation, built as twin cities primarily in 1999 and 2000, have reached only 2.2 per cent of targets, with five of seven cities in 2014 still uninhabited. Challenges to implementation have included highly centralized governance, lack of coordination or conflicting development priorities between central agencies and difficulties in distribution of land (UN-Habitat, 2015). Despite this, the government is moving forward with plans to create a new capital city in the desert east of Cairo with a target of 1.75 million permanent jobs and 1.1 million residential units (The Capital, 2015).
Kenya also has ambitions of creating a new city outside its capital, Nairobi, called Konza Techno City, with the vision to become “Africa’s Silicon Savannah.” Design plans were released in 2013 but construction is still at an early stage, and developers have expressed concerns about transport and electricity infrastructure, as well as land speculation (Ochieng, 2016).
South Africa announced plans for a new city called Vaal River in Sedibeng district, just south of Johannesburg, described as “South Africa’s first post-apartheid city” and costing potentially $800 million. This large investment is intended to help create a new economy for a region hurt by the collapse of the steel industry. But since the project’s announcement in May 2015, environmental issues have delayed the start of construction (le Cordeur, 2015; Sedibeng Ster, 2016). The competing need for infrastructure maintenance and investments to manage economic challenges in other parts of Gauteng province, including major economic and industrial growth poles, have caused some to question the large planned expenditures in lagging areas.
BOx 5.4 NEW CITIES IN EGYPT, KENYA AND SOUTH AFRICA
Côte d‘Ivoire’s National Development Plan identifies some secondary cities as regional growth poles based on value-added industries linked to agricultural products.

151
URB
AN
IZAT
ION
AN
D IN
DU
STRI
ALI
ZATI
ON
IN P
RACT
ICE
REPUBLIC OF CONGOA functional urban system requires good urban–rural and regional linkages. One report finds that “increasing the amount of roads per square kilometre of national land or the amount of navigable inland waterways per square kilometre, ceteris paribus, by one standard deviation reduces urban primacy by 10 per cent” (Nallari, Griffith and Yusuf, 2012). Exploiting such advantages, the Republic of Congo—where two specialized cities account for the vast majority of the urban population—is upgrading its roads. The cities are Brazzaville, the political and administrative centre, and Pointe Noire, the commercial and industrial centre with an urban economy based on offshore petroleum reserves.
A recently completed major highway linking the two urban centres, which also connects smaller towns and villages, will support economic complementarities. An infrastructure gap remains, however, between the agricultural sector and the urban centres. Given that agricultural products form the second-largest import category and the high demand for agricultural projects in neighbouring countries, investing more in infrastructure and facilitating the food value chain are needed to boost linkages to the agro-processing sector.
EGYPT, KENYA AND SOUTH AFRICA
The urban dysfunction of large cities has led some governments to propose new cities as an alternative (box 5.4). But there is a threshold for smaller cities to become competitive, which may require a larger population or more investments than feasible (Gelb, Tata, Ramachandran and Rossignol, 2015; O’Sullivan, 2007). They may also be beset by the institutional issues affecting existing cities.
FOSTERING SPATIALLY EQUITABLE DEVELOPMENT—BETTER IN THEORY THAN IN PRACTICE
Balanced territorial development, including industrializing lagging areas, is a strategy to reduce inequality and improve broad-based job growth. But it is not always compatible with the locational requirements of industry. This tricky trade-off is brought to light by South Africa, where policy is attempting to address the legacy of apartheid’s spatial and economic planning. As the National
Development Plan sums up: “Where we live and work matters. Apartheid planning consigned the majority of South Africans to places far away from work, where services could not be sustained and where it was difficult to access the benefits of society and participate in the economy…. The inefficiencies and inequities in South Africa’s settlement patterns are deeply entrenched. Bold measures are needed to reshape them” (p. 233).
In accord with the National Development Plan, South Africa’s Industrial Policy aims to promote industrial decentralization through SEZs to foster improved equity in marginalized areas. This is reflected in the current Industrial Policy Action Plan (2016/17–2018/19), which recommends pursuing the Cluster Development Program begun in 2015 by revitalizing old state-owned industrial parks in lagging regions, including townships (historically segregated urban areas) and rural areas. However, the challenges listed in the policy include “limited access to markets, …limited knowledge about strategy, lagging incorporation and use of technology, [and] limited knowledge on the effect of cluster development” (p. 63). The Cluster Development Programme makes available a grant of up to R10 million ($781,000) to clusters of five or more companies engaged in value chain development with support provided for improved collaboration, shared infrastructure and supplier development.
A roundtable meeting organized by South Africa’s Centre for Development and Enterprise in November 2011 to review that country’s experience with industrial development zones concluded that they had failed to achieve the desired employment and economic impacts, noting that SEZs “are badly suited to uplifting poor regions” (Altbeker, McKeown and Bernstein, 2012, p. 4). This sentiment is reflected in a review of Africa’s experience with SEZs, which
The urban dysfunction of large cities has led some governments to propose new cities as an alternative. But there is a threshold for smaller cities to become competitive, which may require a larger population or more investments than feasible.

152
ECO
NO
MIC
REP
ORT
ON
AFR
ICA
2017
concludes that “despite long-standing evidence to the contrary, governments try (and usually fail) to use zones as regional development tools. Almost all the countries under study located at least one zone in a lagging or remote region, but few have done enough to address the infrastructure connectivity, labor skills and supply access these regions lack. Not surprisingly, FDI shuns these locations in favor of agglomerations where they can access quality infrastructure, deep labor markets and knowledge spillovers” (Farole, 2011, p. 11). (And see box 4.3.)
SECURING CROSS-BORDER URBAN OPPORTUNITIES WITH THE RIGHT TRANSPORT AND LOGISTICS INFRASTRUCTURE
Regional integration offers opportunities for leveraging urbanization for industrial demand, including across borders. Infrastructure, particularly in transportation and logistics, is critical for linking regional cities and zones of industrial production.
Rwanda’s sluggish manufacturing sector growth has not kept pace with overall economic growth, in part due to the service-led growth strategy pursued by the government (see box 5.3). But manufacturing is important for job-rich development (see chapter 3). The country’s small size and low income mean that domestic markets are not large, but regional integration offers opportunities. For a land-locked country, infrastructure is an important component of regional integration. According to the African Regional Integration Index, Rwanda scores moderately on infrastructure integration (table 5.2). It has just joined the Economic Community of Central African States (ECCAS), which will provide
large opportunities, particularly as ECCAS countries are major importers of food products, many of which come from Europe and South Africa at high prices. Merchandise exports could expand by 7.8 per cent under a strategy to manufacture exports for ECCAS markets (UNECA, 2015b).
One opportunity for regional integration in Rwanda is the subnational economy of Gisenyi, a secondary city that shares a border with the much larger city of Goma, Democratic Republic of Congo. The cities already have a shared economy in which 25 per cent of the residents of Gisenyi work in Goma. Gisenyi could better serve Goma’s larger consumer market with improved cold storage facilities near the border or investments in a lake port in Kivu. Such infrastructure could also improve access to production inputs, cited as a barrier by Rwandan manufacturers (MINICOM, 2011).
On the other side of the Democratic Republic of Congo, the Republic of Congo has potential comparative advantages that could help it meet the larger cross-border demand for goods. Brazzaville has a particular advantage given its proximity to Kinshasa (just across the river), suggesting potential benefits to improving the border crossing: this takes the average citizen 2.5 hours because of administrative hurdles, despite a ferry ride lasting only five minutes.
TABLE 5.2 Rwanda’s scores and ranks on African Regional Integration Index, 2016
EAST AFRICAN COMMUNITY ECONOMIC COMMUNITY OF CENTRAL AFRICAN STATES
SCORE (SCALE OF 0¬–1)
RANK (OUT OF 5)
SCORE (SCALE OF 0–1)
RANK (OUT OF 11)
Overall 0.553 3 0.485 6
Regional infrastructure 0.366 4 0.416 6
Source: AU, AfDB and UNECA (2016).
Regional integration offers opportunities for leveraging urbanization for industrial demand including across borders.

153
URB
AN
IZAT
ION
AN
D IN
DU
STRI
ALI
ZATI
ON
IN P
RACT
ICE
5.4 OVERCOMING BARRIERS TO AGGLOMERATION ECONOMIES WITHIN CITIES
(figure 5.4), putting Africa’s cities at a competitive disadvantage.
Land is a cross-cutting issue for economic competitiveness: “In all [studied] countries there is a lack of a clear process for making land available for development and much of the urbanization and industrialization that is occurring is happening in the informal sector” (Roberts, 2014). Poorly functioning land markets lead to a disconnect between the productive potential of a city and the cost of land
The power of agglomeration economies gives large cities a major productive advantage. Firms in cities have better access to labour, markets, inputs and knowledge. But many large cities in Africa are underperforming, with the potential of agglomeration economies undercut by poorly functioning land and property markets, inadequate mobility options and disconnected and sprawling urban forms including residential segregation.
CITY COMPETITIVENESS AND INDUSTRIAL DEVELOPMENT HIT BY WEAK LAND AND PROPERTY MARKETS
The poor functioning of land and real estate markets poses fundamental challenges to cities, undercutting economies of agglomeration and undermining basic urban functions. African countries often score particularly low on the Quality of Land Administration Index, relative to other regions
Quality of land administration0=worst; 30=best
no data
0 - 5.0
5.1. - 7.0
7.1 10.0
10.1 - 12.0
12.1 - 15.0
15.1 - 18.0
18.1 - 22.0
22.1 - 24.0
25.1 - 30.0
FIGURE 5.4 Quality of land administration index, 2016
Source: Based on World Bank (2016b).
The power of agglomeration economies gives large cities a major productive advantage. Firms in cities have better access to labour, markets, inputs and knowledge.

154
ECO
NO
MIC
REP
ORT
ON
AFR
ICA
2017
there. For instance, the cost of non-residential land is not necessarily correlated with GDP per capita in Africa’s cities, with cities such as Tunis and Nouakchott with lower rents relative to per capita GDP and cities like Lusaka and Dakar with higher rents (figure 5.5).
Land is often tied to political power, making reform difficult. In Nairobi some of Africa’s largest and worst slums are entrenched, despite the fact that the UN agency created to solve such issues globally (UN-Habitat) has been headquartered in the city since 1996. Land tenure disputes have been at the root of violent conflicts in many of Africa’s cities and stand directly in the way of industrial development. In Addis Ababa conflict over land has prevented the implementation of spatial and industrial plans and created economic instability. In Nigeria land conflicts have presented problems for establishing industrial zones. Ogidigben Gas City is one example, with long delays due to longstanding violent conflict between ethnic groups involved in the land slated for the zone (Onabu, 2015; Blyth, 2015).
Tenure regularization efforts in Africa have had mostly mixed results, particularly when social equity is considered. There have been cases with positive impacts on women and the poor when they are directly considered in the regularization process. But, there are other cases where market pressures on newly titled areas have led to displacement of the poor and formation of new slums (Payne et al., 2015). In Uganda tenure reforms were undermined
0
10
20
30
40
50
60
70
Gab
oro
ne,
Bo
tsw
ana
Win
dh
oek
, Nam
ibia
Tu
nis
, Tu
nis
ia
Cas
abla
nca
, Mo
rocc
o
Rab
at, M
oro
cco
No
uak
cho
tt, M
auri
tan
ia
Lusa
ka, Z
amb
ia
Do
ual
a, C
amer
oo
n
Yao
un
dé,
Cam
ero
on
Dak
ar, S
eneg
al
Har
are,
Zim
bab
we
Dar
es
Sal
aam
, Tan
zan
ia
Bam
ako
, Mal
i
Kig
ali,
Rw
and
a
Kam
pal
a, U
gan
da
An
tan
anar
ivo
, Mad
agas
car
Lilo
ngw
e, M
alaw
i
Bla
nty
re, M
alaw
i
NO
N-R
ESI
DE
NT
IAL
RE
NT
S ($
)
GDP per capita (100 US$)
Offices (US$/square metres/month)
Retail (US$/square metres/month)
Industrial (US$/square metres/month)
FIGURE 5.5 Non-residential rents in selected cities, 2015
Source: Knight Frank (2015); World Development Indicators. Note: By descending order of per capita GDP.
Poorly functioning land markets lead to a disconnect between the productive potential of a city and the cost of land. For instance, the cost of non-residential land is not necessarily correlated with GDP per capita in Africa’s cities.

155
URB
AN
IZAT
ION
AN
D IN
DU
STRI
ALI
ZATI
ON
IN P
RACT
ICE
by mistrust of the government (World Bank, 2009), and in Cameroon moving from customary land holdings to formalized titles created openings for corruption and for disenfranchising vulnerable populations (Njoh, 2013). Rwanda’s comprehensive land regularization programme is one success (box 5.5).
Deficiency in land management also has a bearing on municipal revenues. Lack of up-to-date cadastres and valuation mechanisms for land and property impedes cities from realizing local revenues. A study of municipalities in Mozambique showed that property taxes there, where all land is owned by the government, amounted to 18 per cent of local revenues (against half of subnational revenues in countries in the Organisation for
Economic Co-operation and Development). The underperformance of land leases in Mozambique stems from poor performance in assessment, coverage and collection.
AGGLOMERATION ECONOMIES, INCLUDING INDUSTRIAL ACCESS TO LABOUR, HURT BY POOR MOBILITY
Agglomeration economies are undercut by poor connectivity and poor urban mobility. The inability of people to move easily through cities shrinks opportunities for labour pooling and knowledge sharing, which is critical for firm productivity. One study has revealed that the productivity gap in Kenya’s industrial sector is higher than in India or China, with the productivity differential between firms at the 80th and 20th percentile three times that in India and more than four times that in China (World Bank 2016).
Insufficient, poorly planned and disconnected road space alongside increasing motorization has led to choking levels of congestion in many cities. Road investments are often skewed towards highways and ring roads rather than urban connectivity, leading to only temporary relief as excess road space is quickly filled up by more drivers and as
BOx 5.5 COST-EFFECTIVE AND FAIR TENURE REGULARIZATION IN RWANDA
Rwanda has proven that large-scale land regularization is financially and administratively feasible. Following the Land Policy in 2004, a Land Tenure Regularization Programme identified and registered 8.4 million plots, with a trial period in 2008–2010 and full scaling up in 2010–2013 (Ministry of Infrastructure, 2015). The programme employed 110,000 Rwandans, with 99 per cent working in their own communities, while keeping the cost per title at approximately $7, which is extremely low for such programmes (DAI, n.d.). As of 2014, 81 per cent of identified plots had been approved for titling (freehold and leasehold) with only 0.1 per cent of the remaining unregistered parcels with unresolved disputes (Gillingham and Buckle, 2014).
The programme has improved gender equity through regulations and education resulting in the inclusion of married women’s names on plots and enhanced gender parity in inheritance rights (Ali, Deininger and Goldstein, 2013); 92 per cent of registered plots now include the name of a woman (DAI, n.d.).
The full impact on urban and economic development has yet to be evaluated. One study on peri-urban Kigali reports that 72 per cent of landholders have incentives to build or to transfer land as the situation has regularized (Fosudo, 2014), perhaps benefiting agricultural production in rural areas, where land ownership is highly fragmented. Tenure regularization has also sped urban development, ironically causing some concern that it is contributing to sprawl and the loss of scarce agricultural land (Ministry of Infrastructure, 2015). Rwanda’s new land use regulations to protect the most productive agricultural areas are still being rolled out (Ministry of Infrastructure, 2015).
Tenure regularization efforts in Africa have had only mixed results, particularly when social equity is considered. There have been cases with positive impacts on women and the poor when they are directly considered in the regularization process.
156
ECO
NO
MIC
REP
ORT
ON
AFR
ICA
2017
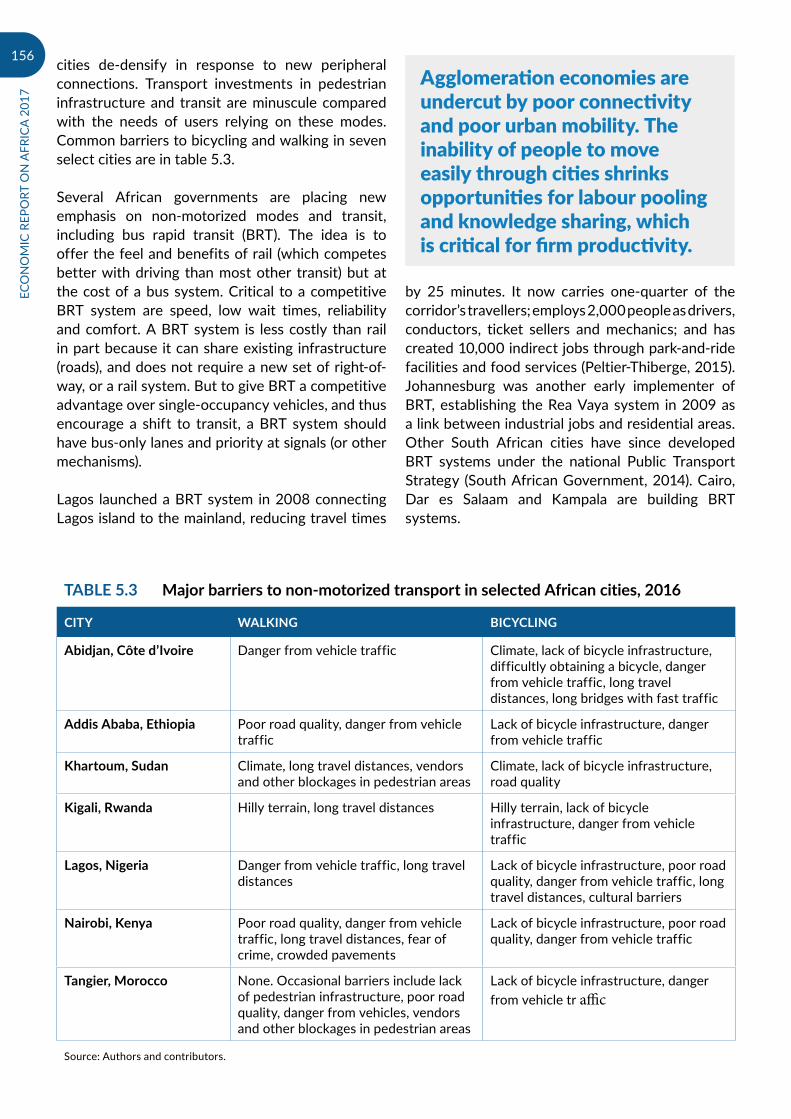
cities de-densify in response to new peripheral connections. Transport investments in pedestrian infrastructure and transit are minuscule compared with the needs of users relying on these modes. Common barriers to bicycling and walking in seven select cities are in table 5.3.
Several African governments are placing new emphasis on non-motorized modes and transit, including bus rapid transit (BRT). The idea is to offer the feel and benefits of rail (which competes better with driving than most other transit) but at the cost of a bus system. Critical to a competitive BRT system are speed, low wait times, reliability and comfort. A BRT system is less costly than rail in part because it can share existing infrastructure (roads), and does not require a new set of right-of-way, or a rail system. But to give BRT a competitive advantage over single-occupancy vehicles, and thus encourage a shift to transit, a BRT system should have bus-only lanes and priority at signals (or other mechanisms).
Lagos launched a BRT system in 2008 connecting Lagos island to the mainland, reducing travel times
by 25 minutes. It now carries one-quarter of the corridor’s travellers; employs 2,000 people as drivers, conductors, ticket sellers and mechanics; and has created 10,000 indirect jobs through park-and-ride facilities and food services (Peltier-Thiberge, 2015). Johannesburg was another early implementer of BRT, establishing the Rea Vaya system in 2009 as a link between industrial jobs and residential areas. Other South African cities have since developed BRT systems under the national Public Transport Strategy (South African Government, 2014). Cairo, Dar es Salaam and Kampala are building BRT systems.
TABLE 5.3 Major barriers to non-motorized transport in selected African cities, 2016
CITY WALKING BICYCLING
Abidjan, Côte d’Ivoire Danger from vehicle traffic Climate, lack of bicycle infrastructure, difficultly obtaining a bicycle, danger from vehicle traffic, long travel distances, long bridges with fast traffic
Addis Ababa, Ethiopia Poor road quality, danger from vehicle traffic
Lack of bicycle infrastructure, danger from vehicle traffic
Khartoum, Sudan Climate, long travel distances, vendors and other blockages in pedestrian areas
Climate, lack of bicycle infrastructure, road quality
Kigali, Rwanda Hilly terrain, long travel distances Hilly terrain, lack of bicycle infrastructure, danger from vehicle traffic
Lagos, Nigeria Danger from vehicle traffic, long travel distances
Lack of bicycle infrastructure, poor road quality, danger from vehicle traffic, long travel distances, cultural barriers
Nairobi, Kenya Poor road quality, danger from vehicle traffic, long travel distances, fear of crime, crowded pavements
Lack of bicycle infrastructure, poor road quality, danger from vehicle traffic
Tangier, Morocco None. Occasional barriers include lack of pedestrian infrastructure, poor road quality, danger from vehicles, vendors and other blockages in pedestrian areas
Lack of bicycle infrastructure, danger from vehicle tr affic
Source: Authors and contributors.
Agglomeration economies are undercut by poor connectivity and poor urban mobility. The inability of people to move easily through cities shrinks opportunities for labour pooling and knowledge sharing, which is critical for firm productivity.

157
URB
AN
IZAT
ION
AN
D IN
DU
STRI
ALI
ZATI
ON
IN P
RACT
ICE
Even non-BRT systems can improve transit service. In Rwanda, Kigali’s 2013 Transportation Master Plan introduced a system with buses circulating on predetermined routes and scheduled services. Nearly 85 per cent of people in Kigali City reported that they were satisfied with the public transport quality in 2013/14 (NISR, 2016b).
DISCONNECTED, LOW-DENSITY AND SINGLE-USE URBAN FORM—OFTEN A RELIC OF COLONIAL OR APARTHEID REGIMES
Restrictive zoning—frequently a hangover from colonial codes—and modern counterparts are sometimes at fault for disconnected cities. In many of Cameroon’s cities, older codes still separate land uses and housing types, and limit density. Strict building codes and long permitting processes drive prices up and restrict the supply of formal housing. The separation of uses contributes to low density and disconnected development, making infrastructure provision more costly and increasing travel distances, which takes a particular toll on women, who are vulnerable to crime while traveling and when staying at home in isolated neighbourhoods (Njoh, 2000).
In addition, the requirements for imported building materials instead of those locally available reduce opportunities in the domestic building materials sector, and regulations for building techniques cut women out of the shelter production process.
Reintegrating divided cities is not easy. Decentralized spatial planning in Johannesburg, South Africa, for example, has had mixed results (box 5.6).
CONNECTING SPECIAL ECONOMIC ZONES TO THE BENEFITS OF AGGLOMERATION
Special economic zones are a way to create pockets industrial competitiveness. At their best, they can contribute to improving the business environment
0
100
200
300
400
500
600
700
800
900
1,000
19
90
19
91
19
92
19
93
19
94
19
95
19
96
19
97
19
98
19
99
20
00
20
01
20
02
20
03
20
04
20
05
20
06
20
07
20
08
20
09
20
10
20
11
20
12
20
13
20
14
20
15
GA
RM
EN
T E
XP
OR
TS
(US$
MIL
LIO
NS)
POLITICAL CRISIS
FIGURE 5.6 Value of garment exports, Madagascar, 1990–2015
Source: UN Comtrade database.
The separation of uses contributes to low density and disconnected development, making infrastructure provision more costly and increasing travel distances.

158
ECO
NO
MIC
REP
ORT
ON
AFR
ICA
2017 BOx 5.6 JOHANNESBURG’S STRUGGLE TO OVERCOME THE SPATIAL JOBS–EMPLOYMENT
MISMATCH
Apartheid spatial planning has left South Africa’s cities with a legacy of division: “To varying degrees, each town or city in South Africa reflects not only an unequal distribution of infrastructure, amenities and accessibility, but the distances between the places in which the poor and the well-off live exacerbate that inequality. They also make for an inefficient spatial pattern, with the costs of installing and maintaining infrastructure unusually high and public transport difficult to provide” (Berrisford, 2011, p. 249).
Johannesburg faces spatial fragmentation, which has separated people from jobs. Access to labour is a major constraint on industrial development in South Africa in general (Altbeker, McKeown and Bernstein, 2012). Some 40 per cent of Johannesburg’s population is in Soweto, to the south-west, while the vast majority of formal sector jobs are to the north. The mining belt, which stretches east-west between the two, presents a major transport barrier between jobs and housing due to the apartheid planning of the city, which intentionally housed the black population downwind from the mines and separated from the heart of the city.
The Inner City, the traditional downtown, is declining economically as major corporation cluster in Sandton, a new central businesses district to the north. Gated communities are also expanding to the north, including a massive billion-dollar housing development called
Waterfall Estate (Steyn, 2016). Such developments make it clear that income segregation has yet to be abolished after apartheid.
City leaders have attempted to overcome these divisive spatial legacies. A BRT system, which opened in 2009 and is still expanding, connects Soweto to jobs in the north and quickly developed significant ridership, despite intermittent service delays. Yet the density of economic activity and land use have still to respond to the pull of the BRT corridor, with walking times to public transport actually increasing between 2003 and 2013 (box figure 5.2), and travel by bus still averages 92 minutes for the typical commuter in Gauteng province (Statistics South Africa, 2014).
The city’s new Spatial Development Framework, adopted in June 2016, prioritizes nodal development around the central transport corridors and policies to reconnect the city to achieve a more compact and inclusive urban fabric. If successful, it will also improve livability.
Johannesburg had formerly prioritized neighbourhood investments in marginalized areas with the goal of rebalancing spatial inequalities, but such strategies have not had a high return on investment in tax revenues, and the city is close to its debt limits. It has recently had to shift its strategy to pursue major investments only in areas of high return.
0
10
20
30
40
50
60
Up to 5 min 6-10 min 11-15 min >16 min
2003 2013
BOx FIGURE 5.2 Walking time to public transport by workers in Gauteng Province, 2003 and 2013
Source: Statistics South Africa (2014).

159
URB
AN
IZAT
ION
AN
D IN
DU
STRI
ALI
ZATI
ON
IN P
RACT
ICE
in the economy as a whole, through knowledge transfer and skills upgrading. This was the case in Mauritius. Its SEZ programme, initiated in 1970, led to skill and policy upgrades and played a role in structurally transforming the economy, partly because preferential policies were applied to qualifying firms independent of location, allowing them to select a location matching their spatial preferences and simultaneously broadening the reform of policies affecting the business climate (Altbeker, McKeown and Bernstein, 2012).
SEZs cannot, however, fully insulate industry from macroeconomic problems, as in Madagascar, where SEZs in place since 1989, have suffered as a result of poor overall business climate and weak institutional and policy coordination. A period of political crisis in 2009–2013 undermined progress in the garment sector (figure 5.6). And eligibility for the United States African Growth and Opportunity Act was removed for 2009–2014, prompting the departure of Asian firms (Morris, Staritz and Plank, 2014).
A World Bank project to support the garment industry in Antananarivo during this time was undermined by political instability and corruption related to land registries (Gelb et al., 2015). It is not yet clear whether the industry has begun to recover since the return to democracy in 2014 (see figure 5.6). As the global garment industry has become more vertically integrated, Madagascar’s remaining enterprises have struggled to develop backward linkages, in part due to a lack of government support (Morris, Staritz and Plank, 2014). And SEZs have not fostered industrial spillovers beyond Antananarivo, as originally hoped.
The location of SEZs should connect industries with skilled labour force. Knowledge spillovers can
go both ways, with cities benefiting from training and skilled workers from SEZs and vice versa. In the Beluluane Industrial Park near Matola, Mozambique, a shortage of workers with practical skills is a bottleneck for firms. Companies within the park are therefore allowed to bring in skilled workers from abroad for a limited time, leading to some transfer of skills, but not enough to fully meet firms’ needs. The difficulty of getting skilled mechanics and machine operators has led some industries to train locals in these fields. The Armando Emilio Guebuza Institute for Industry and Computing, close to the park, offers vocational training. The linkage to knowledge-based supportive sectors is also important for industrial productivity—companies in the park have identified the inefficiency of business services as a constraint.
SEZs are more likely to benefit from agglomeration economies if they are well located, as demonstrated by successful automotive SEZs in South Africa (And see box 3.1). The country’s automotive sector employed 31,260 in vehicle manufacturing in 2015, with another 82,100 in component manufacturing, earning $11.8 billion in exports (Lamprecht, 2016). The automotive cluster in Gauteng province has been supported with policies since 1995: automotive firms in Gauteng benefit from a large educated labour force, a top performing business services sector and proximity to materials suppliers, in addition to well-developed infrastructure for transport and logistics.
SEZs can provide access to localization economies if same-sector industries cluster there. Morocco has had success in the automotive sector, with an SEZ outside Tangier benefiting from the collective potential of infrastructure, market access (to European markets) and localization economies. The automotive industry was jumpstarted with a $2.1 billion investment by Renault on a 280 hectare site 30 km outside Tangier with railway and highway connectivity to the port. The factory started operations in 2012 and produced 288,053 vehicles in 2015. At the end of 2015, it directly employed
SEZs are more likely to benefit from agglomeration economies if they are well located as demonstrated by successful automotive SEZs in South Africa.
SEZs can provide access to localization economies if same-sector industries cluster there. Morocco has had success in the automotive sector, with an SEZ outside Tangier benefiting from the collective potential of infrastructure, market access to European markets and localization economies.

160
ECO
NO
MIC
REP
ORT
ON
AFR
ICA
2017
9,600 locally recruited workers and trained in the Automotive Careers Training Institute set up with the combined support of Renault and public investment. Renault largely exports vehicles to Europe (with plans to export to South America), but also sells in the domestic market. It had a 39 per cent market share in 2013 (Oxford Business Group, 2014).
The start of the auto industry boosted Morocco’s export capacity, increased port activities and gave birth to a supply chain of an array of inputs such as exterior and interior trim, stamping, plastic injection, seats, cable wiring, safety systems, sealing and air conditioning systems (Oxford Business Group, 2014). An estimated 30 international subcontractors followed Renault, establishing production in Tangier, primarily in the Tangier Automotive City Free Zone. Ford has also based component manufacturers in the area, which supply auto production facilities in
Spain. Eighty per cent of the country’s automotive sector enterprises are in Tangier, employing nearly 60,000 workers, with a smaller set of firms in Casablanca, producing more for the domestic market.
The auto industry in Tangier is part of a larger industrial hub with four free zones in and around Tangier: Tangier Free Zone, Renault’s Melloussa Zone, Tangier Automotive City and the Fnideq Commercial Free Zone. They stretch across 3,000 hectares allocated to industrial development, with 1,200 hectares already developed. Two other industrial zones in Tétouan are dedicated to light-manufacturing activities, local small and medium-sized enterprises and offshoring. These zones form a system of industrial development within an 80 km radius of the Tangier-Med port. Tangier also has several industrial parks on the city’s outskirts, making it a promising growth centre, driven by manufacturing, trade and logistical activities (Oxford Business Group, 2014).
Transport and logistical infrastructure includes the Tangier-Med port, with two terminals for cars and several rail connections to Rabat, Casablanca and Marrakech in the south, and Meknes, Fez and Oujda in the east. There is also a highway, since 2005 connecting Tangier with Rabat and other cities, the International Airport of Tangier and regular ferries to Spain, France and Italy.
Tangier has several industrial parks on the city’s outskirts making it a promising growth centre, driven by manufacturing, trade and logistical services.

161
URB
AN
IZAT
ION
AN
D IN
DU
STRI
ALI
ZATI
ON
IN P
RACT
ICE
5.5 INTEGRATED POLICIES TO LINK URBAN AND INDUSTRIAL DEVELOPMENT
themes emerge. Dysfunctions in infrastructure and land markets, market failures, negative externalities and coordination problems affect cities and industries, and all require government action. There are opportunities for synergies and efficiencies if industrial and urban policies and their implementation are coordinated, especially under national development plans, as in Ethiopia (box 5.7).
Many African countries today have defined long-term national visions, plans or strategies and reinstated the functions of national development
African national development frameworks have a renewed focus on urban issues, but the economic importance of African cities is greater than the policy focus they currently receive. Therefore, unguided urban development remains a major threat to long-term urban competitiveness and economic productivity.
Just as African governments face the connected challenges of urbanization and industrialization, so their policies to overcome them should work along parallel tracks. Countries that earlier transformed from agrarian to developed and urbanized economies, including the newly industrialized East Asian countries, had governments that helped cities and firms overcome barriers to structural transformation (Lin, 2012).
Africa is diverse, and no single best practice can be applied universally, though some common
BOx 5.7 NATIONAL DEVELOPMENT PLANNING IN ETHIOPIA
Although still at an early stage of both industrial and urban development, Ethiopia has set out a forward-thinking urban and industrial national development framework. The Plan for Accelerated and Sustained Development to End Poverty 2005/06–2009/10 was a turning point for the urban agenda in Ethiopia. It adjusted the policy scope of the previous industrial development strategy by broadening targeted industrial sectors and incorporating urban development (Gebreeyesus, 2016; UN-Habitat, 2014).
The plan was followed by a National Urban Development Policy (2005) and the preparation of the National Urban Development Strategy. The latter included an urban development package focused on investing in job creation through the housing and construction sector and an urban governance package targeted at overcoming the soft and hard infrastructure barriers constraining urban growth and industrial development.
The subsequent Growth and Transformation Plan of 2010/11–2014/15 and the Resilient and Green Growth and Governance package have both aligned with the national development vision of strong urban industrial sectors embedded in well-functioning cities, making “the urban agenda centre stage, particularly the role of cities in promoting industrialization, capital accumulation and stronger integration to global markets” (UN-Habitat, 2014, p. 40).
Ethiopia’s manufacturing value added, while still small, grew at an average of nearly 12 per cent a year over 2005–2015, or slightly higher than the economy as a whole (World Development Indicators). Ethiopia is the only African country with its share of employment in industry approaching its share of population in cities (Lesotho aside; see figure 3.9). The Ethiopian story is not an unequivocal success, however: the Addis Ababa metropolitan plan, drafted in 2012–2013, was met with major civil unrest, in large part tied to land rights.
African governments face the connected challenges of urbanization and industrialization, so their policies to overcome them should therefore work along parallel tracks.

162
ECO
NO
MIC
REP
ORT
ON
AFR
ICA
2017
planning ministries, commissions or authorities. Industrialization is now a core pillar of such planning initiatives (table 5.4).
POLICY IMPLICATIONS FROM CASE STUDIES
Drawing on the findings from the country experiences described in this chapter, we derive three policy implications.
USING URBAN DEMAND TO DRIVE INDUSTRIAL DEVELOPMENTTo foster industrialization, policies should deliberately target agro-industry and the associated value chains, urban housing construction, urban infrastructure construction and urban-based business services, especially ICT and finance. The ability of domestic enterprises to meet urban demand is not a given, and imports are often supplanting domestic manufacturing and job creation. To leverage the opportunities created by urban demand, governments must provide targeted support, including through infrastructure, skill building and supportive policies along the value chain.
DEVELOPING A PRODUCTIVE SYSTEM OF CITIES
Policy frameworks should consider investments in secondary cities close to the competitiveness threshold, build their industrial capabilities in areas of existing comparative advantage, support their connectivity to primary cities and continue to invest in primary cities as the most important poles of growth.
TABLE 5.4 Policy frameworks in selected countries
NATIONAL DEVELOPMENT PLAN INDUSTRIAL POLICY URBAN POLICY
Republic of Congo
Plan National de Développement (PND) 2012 – 2016
Incorporated in PND; Industrial Policy letter (for 2011–2016)
Incorporated in PND
Côte d’Ivoire
National Development Plan (NDP) 2016–2020
Investment Code (2012) Incorporated in NDP
Ethiopia The Second Growth and Transformation Plan 2015/16–2019/20
Ethiopian Industrial policy (2002); Industry Development Strategy
National Urban Policy (1995); Ethiopian Urban Development policy (2013)
Nigeria Nigeria Vision 20:2020 National Industrial Revolution Plan (2014)
National Urban Development Policy 1992 (updated 2012)
Rwanda Rwanda Vision 2020; Second Economic Development and Poverty Reduction Strategy (2013–2018)
National Industrial Policy (2011)
National Urbanization Policy; Urbanization and Rural Settlement Sector Strategic Plan (2012/13–2017/18)
South Africa South Africa’s National Development Plan (Vision 2030)
National Industrial Policy Framework; Industry Policy Action Plan (IPAP); 2016/17–2018/19
Integrated Urban Development Framework (IUDF); IUDF Implementation Plan 2016–2019; National Spatial Development Perspective
Source: Authors and contributors.
There are opportunities for synergies and efficiencies if industrial and urban policies and their implementation are coordinated, especially under national development plans.

163
URB
AN
IZAT
ION
AN
D IN
DU
STRI
ALI
ZATI
ON
IN P
RACT
ICE
Beyond boosting secondary cities, policies should ensure that resources are not wasted on lagging regions, and that existing cities are improved before attempts are made to create new cities.
OVERCOMING COMMON BARRIERS WITHIN CITIES TO AGGLOMERATION ECONOMIES
Many African cities need spatial development plans that are connected to economic development planning, especially as they face pressing challenges that have undermined their ability to capitalize on agglomeration economies. Special economic zones have had mixed results in creating pockets of competitiveness, and should be connected to well-functioning cities in order to access economies of agglomeration.
Cities need more policy focus. Despite new policy efforts to address urban issues, the pressing challenges of mobility, segregation and land management pose major constraints to urban productivity and competitiveness. Compared with the magnitude of urban constraints and the economic importance of cities, policies to address these urban issues are sparse, underdeveloped and uncoordinated.
Africa’s cities need strong guiding policy frameworks urgently. African policies and implementation generally have a long way to go to fully leverage the benefits of urban agglomeration economies for industrial value chains and the broader economy. This period is critical for investing in better functioning cities. The urbanization process occurs within a window of years, and cities developed without strong guiding policy frameworks will suffer for many decades to come, dragging down national economic performance with them.
FROM POLICY TO IMPLEMENTATION
Msami and Wangwe write that Africa is “awash with impressively written strategies, with effective implementation remaining by far the weakest link” (2016, p. 172).
COORDINATION
Policy coordination is critical. A study of 11 cases in the Economic Report on Africa 2014 finds that “industrial policy coordination at higher levels is minimal—and in some countries completely missing. One notable omission is that the private sector is often left out” (UNECA, 2014). When those managing cities and those managing industrial development work together, they can tackle shared problems such as traffic and mobility, workforce housing, land management and the provision of public services. For example, around the Bay of Nacala, in northern Mozambique, industrial development has proceeded rapidly, with long, fenced factories extending along the major highway and cutting off access for the residential areas on the other side (figure 5.7). The local governments in the area have created new sustainable urban development plans and are now working with GAZEDA, the national SEZ agency, to promote more connected urban form to support the area’s long-term development.
FINANCE
Policy implementation is, of course, impossible without financing. Local authorities deliver public services underlying the economic potential of cities, but their budgets are usually insufficient for fully implementing crucial public investments. But some locales have seen successes in decentralizing funding. In Rwanda expenditure on infrastructure
To foster industrialization, policies should deliberately target agro-industry and the associated value chains, urban housing construction, urban infrastructure construction and urban-based business services, especially ICT and finance.
Policy coordination is critical. When those managing cities and those managing industrial development work together, they can tackle shared problems such as traffic and mobility, workforce housing, land management and the provision of public services.
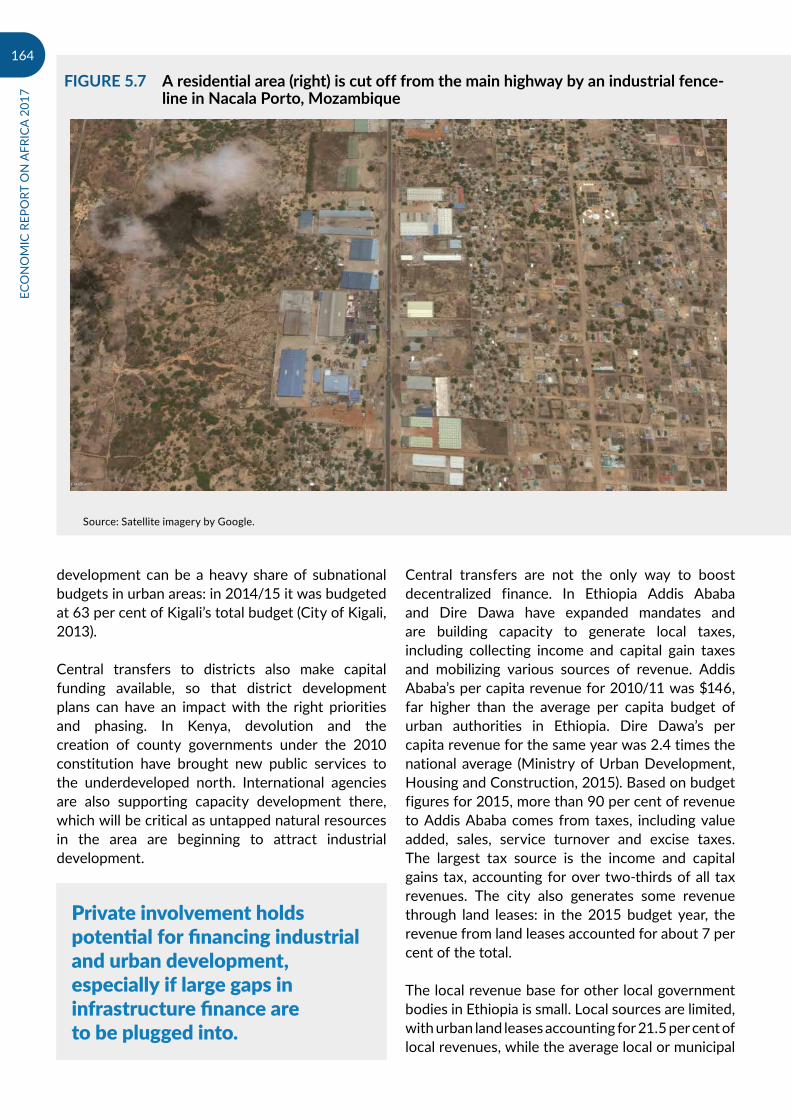
164
ECO
NO
MIC
REP
ORT
ON
AFR
ICA
2017
development can be a heavy share of subnational budgets in urban areas: in 2014/15 it was budgeted at 63 per cent of Kigali’s total budget (City of Kigali, 2013).
Central transfers to districts also make capital funding available, so that district development plans can have an impact with the right priorities and phasing. In Kenya, devolution and the creation of county governments under the 2010 constitution have brought new public services to the underdeveloped north. International agencies are also supporting capacity development there, which will be critical as untapped natural resources in the area are beginning to attract industrial development.
Central transfers are not the only way to boost decentralized finance. In Ethiopia Addis Ababa and Dire Dawa have expanded mandates and are building capacity to generate local taxes, including collecting income and capital gain taxes and mobilizing various sources of revenue. Addis Ababa’s per capita revenue for 2010/11 was $146, far higher than the average per capita budget of urban authorities in Ethiopia. Dire Dawa’s per capita revenue for the same year was 2.4 times the national average (Ministry of Urban Development, Housing and Construction, 2015). Based on budget figures for 2015, more than 90 per cent of revenue to Addis Ababa comes from taxes, including value added, sales, service turnover and excise taxes. The largest tax source is the income and capital gains tax, accounting for over two-thirds of all tax revenues. The city also generates some revenue through land leases: in the 2015 budget year, the revenue from land leases accounted for about 7 per cent of the total.
The local revenue base for other local government bodies in Ethiopia is small. Local sources are limited, with urban land leases accounting for 21.5 per cent of local revenues, while the average local or municipal
FIGURE 5.7 A residential area (right) is cut off from the main highway by an industrial fence-line in Nacala Porto, Mozambique
Source: Satellite imagery by Google.
Private involvement holds potential for financing industrial and urban development, especially if large gaps in infrastructure finance are to be plugged into.

165
URB
AN
IZAT
ION
AN
D IN
DU
STRI
ALI
ZATI
ON
IN P
RACT
ICE
revenue is only 15.6 per cent of its total budget. This makes local government bodies dependent on regional budget allocations for any significant urban investment in infrastructure expansion or improvement (Ministry of Construction, Housing and Urban Development, 2015).
Land value capture is an underused revenue tool that holds benefits for supporting productive cities and building the capacity for infrastructure finance. Taxes and fees on land value are generally considered the most economically efficient taxes because the gains to land owners arising from public investment and good urban management are windfalls and not based on actions by the owners. Many instruments can be used for land value capture, including value-based annual land taxes, local capital gains taxes, sales of development rights (for example, height-limit exemption fees) and special levies, where property owners pay directly towards the cost of specific improvements affecting them. Effective use of property taxes in particular can be the first step towards subnational creditworthiness and the ability to access infrastructure financing. However, these instruments can be politically difficult to implement given their high visibility and broad application (Walters, 2016). Governments have often settled for taxes that are easier to impose but cause economic distortions owing to their high cost on a limited tax base (UN-Habitat, 2016).
Despite the challenges, some African cities are improving their use of land taxes. In Sierra Leone the city of Makeni increased property revenues by 600–700 per cent in a single year after a programme that included surveying properties, valuation based on a clear and transparent formula, a public information campaign and billing by mail (Walters and Gauntner, 2016). In Somalia, through a programme that established a new GIS database of properties, an automated and transparent billing
system and updates to the legal framework for property tax collection, Hargesia’s property tax revenues rose to $1 million in 2015, a nearly 300 per cent increase from 2008. Other cities in Somaliland and Puntland have also seen substantial increases in revenues under the same programme (Engindeniz, Mohamoud and Glass, 2016). In several countries including Cameroon, Madagascar and Senegal, taxpayer engagement has improved revenues from property taxes, showing the benefits of involving taxpayers in developing the budget (Monkam and Moore, 2015).
Improved financial management and successful collection of land-based revenues, including property taxes, can be the first step towards subnational creditworthiness and the possibility of bond issuance. Municipal bonds are rare in Africa, with a few exceptions in Cameroon, Nigeria and South Africa. In 2014 the city of Dakar, Senegal, was prepared to borrow $41.8 million, with a seven-year term and with a partial guarantee from USAID’s Development Authority. The money was to be invested in building a market place that would benefit 3,500 vendors (USAID, 2014). Though the amount was modest, it was to be a major step in opening a new financing source for municipalities in Senegal. Eventually however, the initiative failed to get the national government’s approval, and it did not materialize (Swope and Kassé, 2015).
Private involvement holds potential for financing industrial and urban development, especially if large gaps in infrastructure finance are to be plugged into. In many cases, the private sector has access to private borrowing and the capacity to act more quickly than public agencies. The financial returns on industrial development can incentivize private participation under the right investment conditions. In Nigeria, firms have worked with state governments to deliver key infrastructure (including workforce housing) when it benefits them.
More traditional public–private partnerships also hold potential for establishing infrastructure. One example is the N4 toll road between South Africa’s Gauteng province and Mozambique’s Maputo Port, which has connected industries and markets, particularly in Mozambique. Established in 1996 the original concession agreement was completely privately financed with 20 per cent equity. The financing did not include a government subsidy, but the two national governments guaranteed the loan.
Improved financial management and successful collection of land-based revenues, including property taxes, can be the first step towards subnational creditworthiness and the possibility of bond issuance.

166
ECO
NO
MIC
REP
ORT
ON
AFR
ICA
2017
The 30-year concession allocates responsibility for financing, design, construction, rehabilitation and operation and maintenance to a private consortium, with reversion to government control in 2027. Despite payment risks, including competing lower quality transport routes and slower than expected economic growth in Mozambique, traffic volumes have been enough to ensure financial solvency, and payments from the South African portion have cross-subsidized the Mozambican portion of the road. Criticisms of the project include the exclusion of lower income road users, particularly small enterprises along the corridor (PPIAF, 2009; Farlam, 2005).
In Côte d’Ivoire, private participation in the financing of national development planning has been a success factor in the country’s post-2011 economic resurgence. The private share of investments shot up from 30 per cent in 2005 to nearly 70 per cent in 2015, even as total investments increased. One facilitating factor was the promotion in 2014 of public–private enterprises and the involvement of the private sector in a newly established code of investment. The 2016–2020 National Development Plan has slated 60 per cent of the $60 billion overall cost of implementation for private finance. A large part of the investments will be in upgrading and innovating infrastructure: water, roads and electricity production (AfDB, OECD and UNDP, 2016). Already, bond issuances for projects under the National Development Plan have been widely oversubscribed by development partners.
TO SUMMARIZE …The core components of successful implementation include:
ҋ Coordination among implementing agencies, especially those managing industrial development and those managing urban development, as well as between national and local levels, including a mechanism to institutionalize it.
ҋ Subnational government capacity (human, technical and financial) to implement policy mandates at this level.
ҋ Finance and financial management, including policy-based budgeting, decentralized financial management and land-based revenue generation.
ҋ Private participation in finance (including through public–private partnerships) and coordinated implementation.
Finally, even with the broad base of research on agglomeration economies and industrial development, empirical evidence for the effectiveness of policies, especially in Africa, is patchy. As countries develop and implement their policies, they should also monitor and evaluate such impacts, allowing them to adapt policy in near-real time and to develop a knowledge base of African good practices.
As countries develop and implement their policies, they should monitor and evaluate such impacts, allowing them to adapt policy in near-real time and to develop a knowledge base of African good practices.

167
URB
AN
IZAT
ION
AN
D IN
DU
STRI
ALI
ZATI
ON
IN P
RACT
ICE
REFERENCES
Blyth, H. 2015. “Conflict Briefing: Warri South West, Delta State.” Washington, DC: The Fund for Peace. Available at: http://library.fundforpeace.org/conflictbulletin-epz-ugborodo-1505.
Chete, L., J. Adeoti, F. Adeyinka and F. Ogundele. 2016. “Industrial Policy in Nigeria: Opportunities and Challenges in a Resource-rich Country.” In C. Newman (trans.), Manufacturing Transformation: Comparative Studies of Industrial Development in Africa and Emerging Asia. Helsinki: United Nations University, World Institute for Development Economics Research (UNU-WIDER).
City of Kigali. 2013. City of Kigali Budget for Fiscal Year 2014/2015. Kigali: Government of Rwanda.
Croese, S., L. Cirolia and N. Graham. 2016. “Towards Habitat III: Confronting the Disjuncture between Global Policy and Local Practice on Africa’s ‘Challenge of Slums’.” Habitat International 53: 237–242.
DAI (Development Alternatives Incorporated). No date. Support for Land Tenure Regularization. Available at: https://dai.com/our-work/projects/rwanda%E2%80%94support-land-tenure-regularisation.
Department of Trade and Industry. 2016. IPAP 2016/17–2018/19. Pretoria, South Africa: Government of South Africa.
Development Workshop. 2015. Learning from Integrated Housing Development Program in Addis Ababa. Available at: http://www.dw.angonet.org/forumitem/learning-in-tegrated-housing-development-program-addis-ababa.
Engindeniz, E., A. Mohamoud and E. Glass. 2016. Strengthening Local Governance and Municipal Finance through Property Taxation. Nairobi: UN-Habitat.
Ethiopian Investment Commission. 2016a. Extensive Development of Industrial Parks. Addis Ababa. Available at: http://www.investethiopia.gov.et/investment-opportunities/strategic-sectors/industry-zone-development.
———. 2016b. Hawassa Industrial Park Inaugurated. Addis Ababa. Available at: http://www.investethiopia.gov.et/information-center/news-and-events/343-ha-wassa-industrial-park-inaugurated.
Ethiopian Railways Corporation. 2011. Projects. Addis Ababa. Available at: http://www.erc.gov.et/index.php/projects/5-erc-projects/7-projects.html.
Farlam, P. 2005. Working Together: Assessing Public–private Partnerships in Africa. Johannesburg, South Africa: The South African Institute of International Affairs.
Farole, T. 2011. Special Economic Zones in Africa: Comparing Performance and Learning from Global Experience. Washington, DC: World Bank.
Foster, V., and E. Morella. 2010. “Ethiopia’s Infrastructure: A Continental Perspective.” Policy Research Working Paper. Washington, DC: World Bank.
Ackah, C., C. Adjasi and F. Turkson. 2016. “Industrial Policy in Ghana: Its Evolution and Impact.” In C. Newman, J. Page, J. Rand, A. Shimeles, M. Söderbom and F. Tarp (eds.), Manufacturing Transformation: Comparative Studies of Industrial Development in Africa and Emerging Asia (pp. 50-71). Helsinki: United Nations University, World Institute for Development Economics Research (UNU-WIDER).
AfDB (African Development Bank), OECD (Organisation for Economic Co-operation and Development) and UNDP (United Nations Development Programme). 2016. African Economic Outlook 2016: Sustainable Cities and Structural Transformation. Paris: OECD Publishing. Available at: http://www.africaneconomicoutlook.org/.
Ali, D., K. Deininger and M. Goldstein. 2013. “Environmental and Gender Impacts of Land Tenure Regularization in Africa: Pilot Evidence from Rwanda.” Journal of Development Economics 110: 262–275.
Altbeker, A., K. McKeown and A. Bernstein. 2012. “Special Economic Zones: Lessons for South Africa from International Evidence and Local Experience.” CDE Round Table. Johannesburg, South Africa: Centre for Development and Enterprise.
Annez, P., and R. Buckley. 2009. “Urbanization and Growth: Setting the Context.” In M. Spence, P. C. Annez and R. Buckley (eds.), Urbanization and Growth. Washington, DC: Commission on Growth and Development.
Asrat, F. 2014. Ethiopia Country Report for the 2014 Ministerial Conference on Youth Employment. Addis Ababa, Ethiopia: Ministry of Education.
AU (African Union), AfDB (African Development Bank) and UNECA (United Nations Economic Commission for Africa). 2016. African Regional Integration Index Report 2016. Addis Ababa, Ethiopia, and Abidjan, Côte d’Ivo-ire. Available at: http://www.uneca.org/sites/default/files/PublicationFiles/arii-report2016_en_web.pdf.
Automotive Industry Export Council. 2013. Automotive Export Manual 2013. Pretoria, South Africa.
———. 2016. Automotive Export Manual 2016. Pretoria, South Africa.
Baverel, A. 2008. “Best Practices in Slum Improvement: The Case of Casablanca.” Development Innovations Group 9 (4).
Benner, C. 2014. “Digital Dynamics: New Technologies and Work Transformations in African Cities.” In S. Parnell and S. Oldfield (eds.), The Routledge Handbook on Cities of the Global South. Abingdon, UK: Routledge.
Berrisford, S. 2011. “Unravelling Apartheid Spatial Planning Legislation in South Africa.” Urban Forum 22: 247–263.
Bloch, R., S. Fox, J. Monroy and A. Ojo. 2015. Urbanization and Urban Expansion in Nigeria. London: IFC International.

168
ECO
NO
MIC
REP
ORT
ON
AFR
ICA
2017
Fosudo, O. 2014. Land Tenure Regularization in Rwanda: The Outcome for Agricultural Land Use Change in Peri-urban Kigali. Enschede, The Netherlands: University of Twente.
Gebreeyesus, M. 2016. “Industrial Policy and Development in Ethiopia.” In C. Newman, J. Page, J. Rand, A. Shimeles, M. Söderbom and F. Tarp (eds.), Manufacturing Transformation: Comparative Studies of Industrial Development in Africa and Emerging Asia. Helsinki: United Nations University, World Institute for Development Economics Research (UNU-WIDER).
Gelb, A., G. Tata, V. Ramachandran and I. Rossignol. 2015. “When Agglomeration Theory Meets Development Reality: Preliminary Lessons from Twenty World Bank Private Sector Projects.” CGD Policy Paper 054. Washington, DC: Center for Global Development.
Gillingham, P., and F. Buckle. 2014. Rwanda Land Tenure Regularisation Case Study. London: Evidence on Demand.
Gollin, D., and A. Haas. 2016. Kampala, Where Urbanisation is Not Synonymous with Industrialization. London: International Growth Centre. Available at: http://www.theigc.org/blog/kampala-where-urbanisa-tion-is-not-synonymous-with-industrialisation/.
Government of Uganda and the New Climate Economy Partnership. 2016. Better Growth, Better Cities: Achieving Uganda’s Development Ambition. Kampala: Government of Uganda.
Ibrahim, W. 2016. Slum Eradication Policies in Marrakech, Morocco: Assessing the Semi-private-state Nexus of the Villes Sans Bidonvilles Program. Paper pre-pared for the World Bank Conference on Land and Poverty. Washington, DC: World Bank.
Industrial Development Corporation. 2016. Eighth IPAP Requires Break from the Past. Sandton, South Africa. Available at: http://www.idc.co.za/home/media-room/articles/859-eighth-ipap-requires-break-from-the-past.html.
Industrial Parks Development Corporation. 2016. Agreement Signed to Source, Recruit and Train 30,000 Workers for Hawassa Industrial Park. Available at: http://www.ipdc.gov.et/index.php/en/news-and-information.
Kemajou, A., O. Bergossi, T. Tatietse and T. Diboma. 2007. Is Industrial Development Incompatible with Constraints of Industrial Ecology in Cameroon? Douala, Cameroon: Université de Douala.
Knight Frank. 2015. Africa Report 2015: Real Estate Markets in a Continent of Growth and Opportunity. London: Knight Frank.
Lamprecht, N. 2016. South Africa Automotive Export Manual. Pretoria, South Africa: Automotive Industry Export Council.
le Cordeur, M. 2015. New Mega City for Gauteng. Fin24. Available at : http://www.fin24.com/Economy/Gauteng-launches-first-ever-post-apartheid-city-20150506.
Lin, J. 2012. The Quest for Prosperity: How Developing Economies Can Take Off. Princeton, NJ: Princeton University Press.
Massmart Walmart. 2015. Supplier Development Fund Annual Report 2014. Sandton, South Africa. Available at: http://www.massmart.co.za.
McKinsey Global Institute. 2010. Lions on the Move: The Progress and Potential of African Economies. McKinsey & Company.
———. 2012. Urban World: Cities and the Rise of the Consuming Class. McKinsey & Company.
MINECOFIN (Ministry of Finance and Economic Planning). 2013. Rwanda Financial Sector Strategy 2013–2018. Kigali, Rwanda: Government of Rwanda.
MINICOM (Ministry of Trade and Industry). 2011. Rwanda Industrial Survey. Kigali, Rwanda: Government of Rwanda.
Ministry of Construction, Housing and Urban Development. 2015. Habitat III Report. Kigali, Rwanda: Government of Rwanda.
Ministry of Infrastructure. 2015. Habitat III: Rwanda Report. Kigali, Rwanda: Government of Rwanda.
Ministry of Urban Development, Housing and Construction. 2015. National Report on Housing and Sustainable Urban Development. Addis Ababa, Ethiopia: Government of Ethiopia.
Monkam, N., and M. Moore. 2015. How Property Tax Would Benefit Africa. London: Africa Research Institute.
Morris, M., and J. Barnes. 2006. “Organising Cluster Cooperation and Learning Networks in South Africa.” African Studies 65 (1): 79–104.
Morris, M., and J. Barnes. 2007. “Regional Development and Cluster Management: Lessons from South Africa.” In A. J. Scott and G. Garofoli (eds.), Development on the Ground: Clusters, Networks, and Regions in Emerging Economies. London: Routledge.
Morris, M., C. Staritz and L. Plank. 2014. Regionalism, End Markets and Ownership Matter: Shifting Dynamics in the Apparel Export Industry in Sub-Saharan Africa. Vienna: Austrian Foundation for Development Research (ÖFSE).
Mota, N. 2015. From the Kebele to the Condominium: Accommodating Social and Spatial Practices in Ethiopia’s Politics of Affordable Housing. Delft, The Netherlands: Delft University of Technology.
Msami, J., and S. Wangwe. 2016. “Industrial Development in Tanzania.” In C. Newman, J. Page, J. Rand, A. Shimeles, M. Söderbom and F. Tarp (eds.), Manufacturing Transformation: Comparative Studies of Industrial Development in Africa and Emerging Asia. Helsinki: United Nations University, World Institute for Development Economics Research (UNU-WIDER).
Nallari, R., B. Griffith and S. Yusuf. 2012. Geography of Growth: Spatial Economics and Competitiveness. Washington, DC: World Bank.

169
URB
AN
IZAT
ION
AN
D IN
DU
STRI
ALI
ZATI
ON
IN P
RACT
ICE
NISR (National Institute of Statistics of Rwanda). 2015. Establishment Census 2014. Kigali, Rwanda.
———. 2016a. Gross Domestic Product—2016 Q1. Kigali, Rwanda.
———. 2016b. Rwanda Integrated Household Living Conditions Survey. Kigali, Rwanda.
Njoh, A. 2000. “Some Development Implications of Housing and Spatial Policies in Sub-Saharan African Countries with Emphasis on Cameroon.” International Planning Studies 5 (1): 25–44.
———. 2013. “Equity Fairness and Justice Implications of Land Tenure Formalization in Cameroon.” International Journal of Urban and Regional Research 37 (2): 750–768.
Ochieng, L. 2016. “Investors Raise Concerns over Multi-billion Konza City Plan.” Daily Nation. Available at: http://www.nation.co.ke/lifestyle/smartcompany/Investors-raise-concerns-over-multi-billion-Konza-City-plan/1226-3049122-dibjgez/index.html.
Onabu, O.-J. 2015. “Gas City Project: Jonathan Performs Groundbreaking in Delta.” This Day. Available at: http://allafrica.com/stories/201503271433.html.
Oxford Business Group. 2014. A Thriving City: Tangiers-Tétouan’s Sprawling Industrial Network Sprang Up in a Decade. London. Available at: https://www.oxfordbusinessgroup.com/analysis/thriving-city-tangiers-t%C3%A9touan%E2%80%99s-sprawl-ing-industrial-network-sprang-decade.
———. 2016. Egypt’s Domestic Automotive Industry Shows Promise. London. Available at: https://www.oxfordbusinessgroup.com/analysis/chang-ing-gears-while-prospects-domestic-automo-tive-sector-are-promising-there-are-challen-0.
Payne, G., J. Mitchell, L. Kozumbo, C. English and R. Baldwin. 2015. Legitimate Land Tenure and Property Rights: Fostering Compliance and Development Outcomes. London: Department for International Development (DFID).
Peltier-Thiberge, N. 2015. Lagos’ Bus Rapid Transit System: Decongesting and Depolluting Mega-cities. Washington, DC: World Bank. Available at: http://blogs.worldbank.org/transport/lagos-bus-rapid-transit-system-de-congesting-and-depolluting-mega-cities-0.
Positivo BGH. 2015. Positivo BGH. Kigali, Rwanda.
PPIAF (Public–Private Infrastructure Advisory Facility). 2009. Toolkit for Public-Private Partnerships in Roads and Highways [Module 6]. Washington, DC: World Bank.
Reardon, T., D. Tschirley, B. Minten, S. Haggblade, C. Timmer and S. Liverpool-Tasie. 2013. “The Emerging ‘Quiet Revolution’ in African Agrifood Systems.” Brief for Harnessing Innovation for African Agriculture and Food Systems: Meeting Challenges and Designing for the 21st Century. Addis Ababa: African Union.
Roberts, B. 2014. Managing Systems of Secondary Cities. Brussels: Cities Alliance.
Rwangombwa, J. 2016. Monetary Policy and Financial Stability Statement. Kigali, Rwanda: National Bank of Rwanda.
Sautier, D., H. Vermeulen, M. Fok and E. Biénabe. 2006. Case Studies of Agri-Processing and Contract Agriculture in Africa. RIMISP (Latin American Center for Rural Development). Available at: http://sarpn.org/docu-ments/d0002434/Agriculture_Africa_Nov2006.pdf.
Sedibeng Ster. 2016. “Vaal River City Development Update.” Vanderbijlpark, South Africa.
Shiferaw, A., M. Söderbom, E. Siba and G. Alemu. 2012. Road Infrastructure and Firm Level Productivity Dynamics in Ethiopia. London: International Growth Centre. Available at: http://www.theigc.org/project/road-infrastruc-ture-and-firm-level-productivity-dynamics-in-ethiopia/.
South African Government. 2014. Bus Rapid Transit System (BRT). Available at: http://www.gov.za/about-government/government-programmes/bus-rapid-transit-system-brt.
Statistics South Africa. 2014. National Household Travel Survey 2013: Statistical Release P0320. Pretoria, South Africa.
Steyn, L. 2016. “Waterfall Development a R16bn City in the Making.” Mail & Guardian. Available at: http://mg.co.za/article/2016-03-17-waterfall-development-a-r16bn-city-in-the-making.
Swope, C., and T. Kassé. 2015. “How Dakar (Almost) Got its First Municipal Bond to Market.” Citiscope. Available at: http://citiscope.org/story/2015/how-dakar-almost-got-its-first-municipal-bond-market.
The Capital. 2015. Available at: http://thecapitalcairo.com.
Tschirley, D., S. Haggblade and T. Reardon. 2013. Africa’s Emerging Food System Transformation. East Lansing, MI: Michigan State University, Global Center for Food Systems Innovation.
Tschirley, D., T. Reardon, M. Dolislager and J. Snyde. 2014. The Rise of a Middle Class in East and Southern Africa: Implications for Food System Transformation. Helsinki: United Nations University, World Institute for Development Economics Research (UNU-WIDER).
UNCTAD (United Nations Conference on Trade and Development). 2014. Services Policy Review: Rwanda. Geneva.
UNECA (United Nations Economic Commission for Africa). 2013. Economic Report on Africa 2013: Making the Most of Africa’s Commodities: Industrializing for Growth, Jobs and Economic Transformation. Addis Ababa.
———. 2014. Economic Report on Africa 2014: Dynamic Industrial Policy in Africa. Addis Ababa.
———. 2015a. Country Profile: Sudan. Addis Ababa.
———. 2015b. Country Profile: Rwanda. Addis Ababa.

170
ECO
NO
MIC
REP
ORT
ON
AFR
ICA
2017
UN-Habitat (United Nations Human Settlements Programme). 2014. Structural Transformation in Ethiopia: The Urban Dimension Building ‘Economically Productive, Socially Inclusive, Environmentally Sustainable and Well Governed’ Cities. Nairobi.
———. 2015. Preparation of the General and Detailed Plans of New Alamein: Preliminary Studies and Initial Assessment. Cairo.
———. 2016. Structural Transformation in Developing Countries: Cross Regional Analysis. Nairobi.
USAID (United States Agency for International Development. 2014. “Supported by USAID Guarantee, City of Dakar Announces First West African Municipal Bond at USAID Frontiers in Development.” Washington, DC. Available at: https://www.usaid.gov/news-information/press-releases/sep-18-2014-supported-usaid-guar-antee-city-dakar-announces-first-west-african.
Walters, L. 2016. Leveraging Land: Land-based Finance for Local Governments. Nairobi: UN-Habitat.
Walters, L., and L. Gauntner. 2016. “Sharing the Wealth: Private Land Value and Public Benefit.” In M. Kamiya and L.-Y. Zhang (eds.), Finance for City Leaders Handbook. Nairobi: UN-Habitat.
World Bank. 2009. Uganda—Post Conflict Land Policy and Administration Options: The Case of Northern Uganda. Washington, DC.
———. 2013a. Ethiopia Economic Update II Laying the Foundation for Achieving Middle Income Status. Washington, DC.
———. 2013b. Building Businesses for Sudan’s Poorest. Available at: http://www.world-bank.org/en/news/feature/2013/04/04/building-businesses-for-sudan-s-poorest.
———. 2015. Urbanization Review: Urban Institutions for a Middle-income Ethiopia. Washington, DC.
———. 2016a. Kenya Country Economic Memorandum: From Economic Growth to Jobs and Shared Prosperity. Washington, DC.
———. 2016b. Doing Business database. Available at: http://www.doingbusiness.org/.
ENDNOTES
1 Urbanization and industrialization can be mutu-ally reinforcing. However, the ways urbanization can better contribute to job-rich industrial growth are more of a concern for policymakers than the ways industry stimulates urbanization. For this reason, the former is the focus of this report.
2 This framework is described in McKinsey Global Institute (2010).
3 The programme also has objectives to support women’s access to property and create jobs, especially for young people.
4 People are registered and the lottery is admin-istered by town. Initially the programme was in Addis Ababa, and later adopted by other cities.
5 To mitigate this challenge, there is a government effort to improve public transport, including through light rail links, the first phase of which is already operational.
6 ICT in particular offers a pathway to youth inclu-sion in the formal job market with potential to contribute to the demographic dividend.
7 Based on World Bank Enterprise Surveys, using the most recent data from 2005–2015.
8 http://www.nazret.com/2017/01/11/ethiopia-djibouti-railway-officially-inaugu-rated/, accessed January 11, 2017.
9 https://www.icafrica.org/fileadmin/documents/Transport_Meeting/S4-Djibouti-Ethiopia_Railway-Final-EN.pdf; The Djibouti–Ethiopia Railway, Financing Transport for Growth in Africa; December 2007.