economic reforms and agriculture in bangladesh … · october 2012 assessment of impacts using...
TRANSCRIPT

October 2012
Assessment of Impacts using Economy-wide Simulation Models
Selim Raihan
ECONOMIC REFORMS AND AGRICULTURE IN BANGLADESH
InternationalLabourOrganization
December 2012

ECONOMIC REFORMS AND AGRICULTURE IN BANGLADESHAssessment of Impacts using Economy-wide Simulation Models
Selim Raihan
December 2012
October 2012InternationalLabourOrganization
Selim Raihan
Copyright © International Labour Organization 2012First published 2012
Publications of the International Labour Office enjoy copyright under Protocol 2 of the Universal Copyright Convention. Nevertheless, short excerpts from them may be reproduced without authorization, on condition that the source is indicated. For rights of reproduction or translation, application should be made to ILO Publications (Rights and Permissions), International Labour Office, CH-1211 Geneva 22, Switzerland, or by email: [email protected]. The International Labour Office welcomes such applications.
Libraries, institutions and other users registered with reproduction rights organizations may make copies in accordance with the licences issued to them for this purpose. Visit www.ifrro.org to find the reproduction rights organization in your country.
ILO Cataloguing in Publication Data
Raihan, Selim
Economic reforms and agriculture in Bangladesh: assessment of impacts using economy-wide simulation models / Selim Raihan; International Labour Organization; ILO Country Office for Bangladesh. - Dhaka: ILO, 2012
ISBN:9789221270928 (Print); 9789221270935 (web pdf)
International Labour Organization; ILO Country Office for Bangladesh
agriculture / economic reform / agricultural policy / trade liberalization / agricultural employment / Bangladesh07.02.1
The designations employed in ILO publications, which are in conformity with United Nations practice, and the presentation of material therein do not imply the expression of any opinion whatsoever on the part of the International Labour Office concerning the legal status of any country, area or territory or of its authorities, or concerning the delimitation of its frontiers.
The responsibility for opinions expressed in signed articles, studies and other contributions rests solely with their authors, and publication does not constitute an endorsement by the International Labour Office of the opinions expressed in them.
Reference to names of firms and commercial products and processes does not imply their endorsement by the International Labour Office, and any failure to mention a particular firm, commercial product or process is not a sign of disapproval.
ILO publications and electronic products can be obtained through major booksellers or ILO local offices in many countries, or direct from ILO Publications, International Labour Office, CH-1211 Geneva 22, Switzerland. Catalogues or lists of new publications are available free of charge from the above address, or by email: [email protected]
Visit our web site: www.ilo.org/publns
Design & layout: Masuma Pia/Matri
A matri production from Bangladesh

The effects of international trade either in goods or in services on the labour market are of great interest as well as concern for Bangladesh as the country has become increasingly integrated with the global economy. It is commonly believed that trade promises new and better jobs. However, trade may affect the labour market both negatively and positively in terms of job creation, wages and labour rights.
Agriculture plays an important role in Bangladesh’s economy and the country’s employment. The agricultural sector produces staple foods and crops mainly for domestic consumption and inputs for processing in the non-agricultural sector. Almost half of all workers in Bangladesh are employed in the agricultural sector. However, labour productivity in the agricultural sector remains very low. Because of a lack of competitiveness, agricultural goods do not figure significantly among Bangladesh’s exports, and the country has been a net importer of food. Furthermore, new employment creation in the sector has been shrinking significantly in recent years.
This report looks at the effects of reforms in trade and other policies that are linked to the agricultural sector in Bangladesh. It explores how these reforms might affect the Bangladesh economy in terms of output, imports, exports and - most importantly - employment. It underlines the need for Bangladesh to consider flanking measures like fiscal support and a slower pace of trade liberalization. The report also emphasizes complementary policies such as skills training for surplus agricultural labour, promoting rural-nonfarm activities and facilitating agricultural marketing operations.
This publication is an outcome of a European Union funded project, which is being implemented by the International Labour Organization (ILO), entitled “Assessing and Addressing the Effects of Trade on Employment (ETE)”. This project aims to provide its constituents with capacity building, sound research evidence and a platform for discussion and formulation of national policies related to trade and employment. We believe that the findings of this report will be of great interest to all, particularly policymakers and the social partners in Bangladesh, who are concerned about the challenges that developing countries face in a globalized world.
We would like to thank Dr. Selim Raihan for conducting this study. We hope that this report will generate useful discussions and contribute to policy reforms for inclusive and job-rich growth in Bangladesh.
Gagan Rajbhandari
Officer-in-charge ILO Country Office for Bangladesh
FOREWORD
David CheongChief Technical Adviser
Assessing and Addressing the Effects ofTrade on Employment (ETE) Project
ILO Geneva.

This research publication has been produced with the assistance of the European Union in the context of the ILO project “Assessing and Addressing the Effects of Trade on Employment (ETE)”.
The author wishes to thank Hasina Begum (National Project Coordinator, ETE) and David Cheong, (Chief Technical Advisor, ETE) for their comments and continuous support in undertaking the study. This work would not have been possible without the support of Marion Jansen (former Head, ILO Trade and Employment Programme) and Mr André Bogui (former Country Director, ILO Bangladesh office).
Substantial inputs were received from: Dr Shamshul Alam (Member, Planning Commission), Dr. Sayema Bidisha Haque (Assistant Professor, Dhaka University), Mr Gagan Rajbhandari (Officer in Charge, ILO Bangladesh office), Mr Mikail Shipar (Secretary, Ministry of Labour and Employment), Mr Ghulam Hussain (Secretary, Ministry of Commerce) and Members of the ETE Policy Working Group.
Logistics and assistance were provided by Mr Abdullah Mohammad Tawsif (Administrative Assistant, ETE) and Mr Ashibur Rahman and Pear Ali (SANEM) provided excellent assistance.
All errors and omissions remain the responsibility of the author.
ACKNOWLEDGEMENTS

This study considers several scenarios for economic reforms at the global, regional, and domestic level that have important implications for the agricultural sector and the overall economy of Bangladesh. The scenarios are related to global agricultural trade liberalization under a potential WTO Doha agreement, a bilateral FTA between Bangladesh and India, unilateral agricultural trade liberalization, an agricultural production subsidy policy, and growth in agricultural productivity. This study uses the Global Trade Analysis Project (GTAP) global general-equilibrium model and a national computable general equilibrium (CGE) model to explore employment effects in Bangladesh under different scenarios.
The simulation results suggest that global agricultural trade liberalization under a WTO−Doha agreement would lead to a rise in prices of agricultural products in the global market as well as in the domestic market. As a result there will be some positive effects on production and employment in the agricultural sector in Bangladesh. In particular, the cereal crop sub-sector would expand, and also this sector would generate significant new employment of unskilled labour. However, this scenario could also raise some concerns for the households that are net consumers and therefore likely to be adversely affected because of the rise in food prices. The policy implication that emerges from the global agricultural trade liberalization scenario is that government would have to facilitate the smooth marketing operations of agricultural products in the market so that the farmers, not the middlemen, receive the maximum benefits of higher prices on their output. Therefore, enforcing competition policy and laws would be very important. At the same time, the government’s safety net programme should address the problems of poorer households, which are likely to be burdened by high food prices. This study finds that the rural non-farm households, a significant part of which are poor, would experience a fall in real consumption. This is because rural non-farm households are not food producers, and they rely completely on the market for cereal crops and other agricultural food. Therefore, any price hike that would not be sufficiently counteracted by a rise in incomes would lead to declines in real consumption in these households. Bangladesh, being a net food importing country, should negotiate at the WTO for some compensatory measures.
A Bangladesh−India bilateral FTA would result in limited expansion in the agricultural sector. There would be expansion of the export-oriented manufacturing sector, but most of the import-competing activities would contract. The expansion of the agricultural and export-oriented sectors would be large enough to produce net employment generation. The government needs to take into consideration sectoral effects while persuing any bilateral FTA deal with any country. It is very important to identify clearly which sectors are likely to be gainers and which are likely to be the losers. For the losing sectors, policymakers may want to consider a strategic and slower pace of trade liberalization. Also, these sectors could receive temporary fiscal support.
Unilateral agricultural trade liberalization would increase imports of agricultural products. This would result in the contraction of the agricultural sector. Overall, the industrial and services sectors would contract also. There would be a large employment loss for unskilled labour, especially in the cereal crop, commercial crops, livestock rearing, poultry rearing, and fishing sub-sectors. In the case of unilateral agricultural trade liberalization, the government therefore would need to be careful. The agenda of agricultural trade liberalization needs to be consistent with the broad agenda of trade liberalization in other sectors of the economy. The major protected sub-sectors in agriculture are poultry and fishing. These two sectors have, in fact, grown over the last decade under significant trade protection. Any trade liberalization agenda for these sectors would need to be designed strategically.
SUMMARY

A rise in subsidies to the agricultural sector would increase production in the sector, while some industrial and services sub-sectors would contract. Overall employment of unskilled labour would increase because of greater employment generation in agricultural activities and lesser loss in employment in the industrial and services sectors. Jobs for skilled labour would be lost, however. A rise in subsidies to the agricultural sector would also provide extra incentives for investing in agriculture. However, it should also be kept in mind that such subsidies put a heavy burden on the government’s exchequer. Therefore, phased reduction of such subsidies would be warranted. To be effective, such subsidies need to be used judiciously. Subsidies in Bangladesh are often wrongly targeted, and therefore the actual objective of the subsidies is not achieved. Enhancing agricultural productivity, improving marketing opportunities, and ensuring effective implementation of competition policies and laws also can encourage producers to increase agricultural production, and at less cost to the government.
Finally, a rise in total factor productivity in the cereal crop sector would lead to a great expansion of that sub-sector. Rice milling and grain milling would expand as well. Imports would fall in all these sectors. The industrial and services sectors would expand somewhat. Overall, the agricultural sector would experience a large loss of jobs for unskilled labour. Therefore, even though employment would increase in the overall industrial and services sectors, the net employment effect on unskilled labour would be negative. However, there would be a net positive effect on the employment of skilled labour. Therefore, it is very important that, while investing in agricultural research to raise agricultural productivity, policymakers take measures to promote industrialization to absorb the labour released from the agricultural sectors. Promotion of rural non-farm productive activities can be very useful for the absorption of labour released from the crop sector.

CONTENTS
I. INTRODUCTION 1
2. METHODOLOGY 3
2.1. The GTAP Model 3
2.2. The CGE model for the Bangladesh economy 6
3. STRUCTURE OF THE BANGLADESH ECONOMY8
4. BANGLADESH'S TRADE AND AGRICULTURAL POLICIES 11
4.1. Global agricultural trade liberalization under a potential WTO Doha agreement 11
4.2. Bilateral free-trade agreement between Bangladesh and India 12
4.3. Unilateral agricultural trade liberalization 12
4.4. Agricultural production subsidy policy 14
4.5. Agricultural productivity 16
5. SCENARIOS CONSIDERED IN THE BANGLADESH CGE MODEL 17
6. RESULTS FROM THE BANGLADESH CGE MODEL 20
6.1. Macroeconomic effects 20
6.2. Sectoral effects 21
6.3. Effects on households 26
6.4. Effects on employment 26
7. POLICY IMPLICATIONS 32
REFERENCES 34
ANNEX 1: The Bangladesh Social Accounting Matrix 35
ANNEX 2: Mapping and classification scheme in the social accounting matrix of Bangladesh, 2007 36

LIST OF TABLES AND FIGURESLIST OF TABLES
Table 1: GTAP commodity aggregation in the present study 5
Table 2: GTAP region aggregation in the present study 5
Table 3: Structure of the Bangladesh economy in 2007 as reflected in the Social Accounting Matrix, 2007 9
Table 4: Sectoral employment numbers and shares from the employment satellite matrix, 2006-06 10
Table 5: Import-weighted tariff rates on agricultural products in Bangladesh 14
Table 6: Share of Bangladesh government subsidies by sector, 1998-2008 15
Table 7: Impacts of Doha Agriculture on export demand, export price, import price and import (% change from the base value) 17
Table 8: Impacts of Bangladesh–India Bilateral FTA on export demand, export price, import price, and imports (% change from the base value) 18
Table 9: Change in overall sectoral tariff rates in Bangladesh due to the FTA between Bangladesh and India (% change from the base value) 18
Table 10: Macroeconomic effects of five simulations (% change from the base value) 20
Table 11: Effects on sectoral prices and volumes of Doha Agriculture simulation (% change from the base value) 21
Table 12: Effects on sectoral prices and volumes of Bangladesh−India FTA simulation (% change from the base value) 22
Table 13: Effects on sectoral prices and volumes of Domestic Agricultural Trade Liberalization simulation (% change from the base value) 23
Table 14: Effects on sectoral prices and volumes of Agricultural Subsidy Policy simulation (% change from base value) 24
Table 15: Effects on sectoral prices and volumes of agricultural productivity simulation (% change from base value) 25
Table 16: Effects on household income and real consumption (% change from the base value) 26
Table 17: Effects on employment of Doha Agriculture simulation 27
Table 18: Effects on employment of Bilateral FTA between Bangladesh and India simulation 28
Table 19: Effects on employment of Domestic Agricultural Trade Liberalization simulation 29
Table 20: Effects on employment of Agricultural Subsidy Policy simulation 30
Table 21: Effects on employment of Agricultural Productivity simulation 31
LIST OF FIGURES
Figure 1: Government subsidies, Bangladesh: Volume and share of gross domestic product (GDP), 1999–2008 15
Figure 2: Cereal yield (kg per hectare) and crop production index (2000=100) 16
ACRONYMS
BIMSTEC Bay of Bengal Initiative for Multi-Sectoral Technical and Economic Cooperation
CDE Constant Difference of Elasticity
CES Constant Elasticity of Substitution
CET Constant Elasticity of Transformation
CGE Computable General Equilibrium
CPI Consumer Price Index
FTA Free Trade Agreement
GDP Gross Domestic Product
GEMPACK General Equilibrium Modelling Package
GFCF Gross Fixed Capital Formation
GTAP Global Trade Analysis Project
HS Harmonised System
HYV High Yielding Varieties
IPO Import Policy Order
IT Information Technology
L/C Letters of Credit
RMG Ready-made Garments
S&D Special and Differential
SAARC South Asian Association for Regional Cooperation
SAFTA South Asian Free Trade Area
SAM Social Accounting Matrix
SAPTA SAARC Preferential Trading Arrangement
WTO World Trade Organisation

1
Agriculture is a major economic activity in Bangladesh. It currently employs about 50 per cent of the country’s labour force and contributes about 20 per cent of country’s gross domestic product (GDP). It is increasingly becoming established in the economic literature that the development of a growing economy depends critically on the development of the agricultural sector (Andriesse et al., 2007; World Bank, 2008). In Bangladesh about 70 per cent of poor people live in the rural areas, and these poor people are concentrated in the agricultural sector. Hence, alleviation of poverty requires reducing poverty among farmers in the rural areas.
Growth in the agricultural sector has important links with the overall economy through various channels. First, agriculture provides a crucial supply of raw materials to many non-agricultural sectors. Second, consumption of agricultural commodities has important implications for the poverty of households in both rural and urban areas.Rice constitutes a major share in the expenditures of the poorer households, and, therefore, the demand for and supply of agricultural commodities, especially food items, and their prices greatly influence the welfare of poor households. Third, the rural sector is the dominant source of supply of unskilled labour to the economy.
Crop production is the main agricultural sub-sector, accounting for about 14 per cent of the country’s GDP. There are a number of crops produced in Bangladesh. Rice is the most important by far. It is the staple food of 160 million people and the major source of livelihood for 13 million farm households in the country. The dependence of poor people on cereals (rice and wheat) for their consumption is clearly illustrated by the fact that in Bangladesh the poorest 40 per cent of rural households, in terms of income, spend nearly 52 per cent of their budget on output from the crop sector, with 35 per cent going to rice and wheat alone. The corresponding numbers for the urban areas are 42 percent and 25 percent respectively. Even the wealthiest 10 per cent of households spend significant proportions of their budgets on crop sector output in both the rural and urban areas.
Bangladesh is the fourth largest rice-producing country in the world and also happens to be the fourth biggest rice-consuming country. Because of huge domestic consumption, the country is, in fact, a net rice-importing country. There are other agricultural crops (e.g. wheat, potato, lentils, vegetables, spices, tea), the domestic demand for which is met partly by production at home and partly by imports. As for agricultural exports, Bangladesh is a large exporter of jute. The country also exports fish, shrimp and vegetables.
Agriculture has taken centre stage in multilateral trade negotiations over the past 25 years. Despite major progress in improving the rules for trade, the overall achievement, in terms of increasing market access for agricultural goods, was considered “disappointing” at the end of the Uruguay Round (Martin and Winters, 1996). Although, under the World Trade Organization (WTO) Agreement on Agriculture, members committed to carrying out reforms, not much progress has so far been made to open markets further. Nevertheless, agriculture continues to be an active area of negotiation. While the modalities for future liberalization in the sector are being negotiated, the potential implications arising from such liberalization have drawn much attention. It is argued thatglobal agricultural trade liberalization would benefit a number of developing countries that have clear comparative advantage in the sector. However, not all developing countries are net exporters of agricultural products, and many of them actually depend on the world market for their supplies.
I . INTRODUCT ION
2
Thus, global agricultural trade liberalization would have important implications for the Bangladesh economy as a net importer of agricultural products.
Under bilateral trading arrangements, there is scope for increased bilateral trade in agricultural products. For example, under the India-Bangladesh bilateral free trade agreement (FTA), Bangladesh’s market access in India for its agricultural exports is likely to increase, while imports of agricultural products from India are likely to increase as well. Therefore, preferential liberalization in agricultural trade has important implications both for imported and for exported agricultural commodities. Increased market access for agricultural exports from Bangladesh under such trade agreements may lead to a rise in production and employment in those export-oriented sectors; whereas domestic import liberalization of the agricultural sector may dampen domestic output and employment in the import-competing agricultural sectors.
Thus, growth in the domestic agricultural sector does not rely only on domestic policies and programmes; global and regional trade policies also have important implications for this sector. Moreover, a variety of economic policies and programmes, such as domestic fiscal policies, import policies, and programmes for growth in agricultural productivity, also affect the development of the agricultural sector in an economy.
This study explores the links between major economic policy reforms and growth in the agricultural sector in Bangladesh. Overall, this study seeks to explore how economic policy reforms affect the agricultural sector in Bangladesh in terms of output, imports, exports, and employment. The study explores three trade liberalization scenarios (a global agricultural trade liberalization scenario under a WTO-Doha agreement, a Bangladesh-India bilateral FTA, and unilateral agricultural trade liberalization), one fiscal policy scenario (a rise in agricultural subsidies), and one technological change scenario (a rise in agricultural productivity).
The paper is organized as follows: section 2 discusses the methodology of the study; section 3 presents and analyses the structure of the Bangladesh economy; section 4 discusses the issues of economic reforms in Bangladesh and the simulation scenarios; section 5 presents the scenarios considered in the Bangladesh Computable General Equilibrium (CGE) model; section 6 presents the results from the Bangladesh CGE model; and section 7 discusses policy implications.

3
This study uses the Global Trade Analysis Project (GTAP) global general equilibrium model and a national computable general equilibrium (CGE) model to explore employment effects in Bangladesh under different scenarios. For the global agricultural trade liberalization and Bangladesh-India bilateral FTA scenarios, the scenarios are first run in the GTAP model. The changes in demand for exports, export prices, and import prices, as obtained from the GTAP model, are matched to the 41 social accounting matrix (SAM) sectors of Bangladesh. For the subsidy and productivity scenarios, the shocks are introduced directly to the CGE model and subsequent macro, sectoral, and meso implications are explored. The CGE simulation produces percentage changes in labour demand. These are then used to compute changes in employments, using an employment satellite matrix.
2.1 The GTAP ModelThe global CGE modelling framework of the GTAP (Hertel, 1997) is a useful tool for the ex ante analysis of the economic and trade consequences of multilateral or bilateral trade agreements. The GTAP model is a comparative static model, based on neoclassical theories.2 The GTAP model is a linearized model, and it uses a common global database for CGE analysis. The model assumes perfect competition in all markets, constant returns to scale in all production and trade activities, and profit maximizing behaviour by firms and utility maximizing behaviour by households. The model is solved using the GEMPACK software (Harrison and Pearson, 1996).
In the GTAP model each region has a single representative household, known as the regional household. The income of the regional household is generated through factor payments and tax revenues (including export and import taxes) net of subsidies. The regional household allocates expenditure to private household expenditure, government expenditure, and savings according to a Cobb-Douglas per capita utility function.3 Thus, each component of final demand maintains a constant share of total regional income.
The private household buys commodity bundles to maximise utility, subject to its expenditure constraint. In the GTAP model the constrained optimizing behaviour of the private household is represented by a constant difference of elasticity (CDE) expenditure function. The private household spends its income on consumption of both domestic and imported commodities and pays taxes. The consumption bundles are constant elasticity of substitution (CES) aggregates of domestic and imported goods, where the imported goods are also CES aggregates of imports from different regions. Taxes paid by the private household include commodity taxes for domestically produced and imported goods and income tax net of subsidies.
The government also spends its income on domestic and imported commodities, and it collects taxes. Taxes consist of commodity taxes on domestically produced and imported commodities. Like the private household’s, government consumption is a CES composite of domestically produced and imported goods.
The GTAP model considers the demand for investment in a particular region as savings. In a multi-country setting, the model is closed by assuming that regional savings are homogenous and contribute to a global pool of savings. This global savings is then allocated among regions for
2 Full documentation of the GTAP model and the database can be found in Hertel (1997) and also in Dimaranan and McDougall (2002).
3 Savings enter into the static utility function as a proxy for future consumption.
2 .METHODOLOGY

4
investment in response to changes in the expected rates of return in different regions. If all other markets in the multi-regional model are in equilibrium, if all firms earn zero profits, and if all households are on their budget constraint, such a treatment of savings and investment will lead to a situation in which global investment must equal global savings, and Walras' Law will be satisfied.
In the GTAP model producers receive payments for selling consumption goods and intermediate inputs both in the domestic market and to the rest of the world. Under the zero profit assumption employed in the model, these revenues must be precisely exhausted by spending on domestic intermediate inputs, imported intermediate inputs, factor income, and taxes paid to the regional household (taxes on both domestic and imported intermediate inputs and production taxes net of subsidies).
The GTAP model postulates a nested production technology, with the assumption that every industry produces a single output, and constant returns to scale prevail in all markets. Industries have a Leontief production technology to produce their outputs. Industries maximize profits by choosing two broad categories of inputs - namely, a composite of factors (value added) and a composite of intermediate inputs. The factor composite is a CES function of labour, capital, land, and natural resources. The intermediate composite is a Leontief function of material inputs, which are in turn a CES composite of domestically produced goods and imports. Imports come from all regions.
The GTAP model employs the Armington assumption, which makes it possible to distinguish imports by their origin and explains intra-industry trade of similar products. Following the Armington approach, the import shares of different regions depend on relative prices and the substitution elasticity between domestic and imported commodities.
Version 7 of the GTAP database uses 2004 as the base year. Several pre-simulations are conducted to update the base year to reflect the situation in 2007, using updated national economic and trade data and updated protection data. GTAP data on regions and commodities are aggregated to meet the objectives of this study. Version 7 of the GTAP database covers 57 commodities, 107 regions/countries, and 5 factors of production. The current study has aggregated 57 commodities into 27 and 129 regions into 12, as shown in Tables 1 and 2, respectively. In the GTAP database each industry produces one commodity. Given the focus of the present study on Bangladesh, other South Asian countries, and other least developed countries have been considered as separate countries/regions (see Table 2).

5
Table 1: GTAP commodity aggregation in the present study
Table 2: GTAP region aggregation in the present study
Sector code Constructed broad sectors consistent with SAM sectors of Bangladesh
GTAP sectors included
CRC Cereal crop sectors Paddy rice; other cereal grains; wheat CMC Commercial crops Vegetables, fruit, nuts; oil seeds; sugar cane,
sugar beet; plant -based fibres; other crops LIV Livestock rearing and poultry rearing Cattle, sheep, goats, horses; other animal
products SHP Fishing Fishing FST Forestry Forestry RCE Rice milling Processed rice FOD Grain milling and food processing Raw milk; meat: cattle, sheep, goats, horse;
other meat products; vegetable oils and fats; dairy products; sugar; other food products
LEA Leather industry Leather products CLT Cloth milling Textiles RMG Woven and knit ready-made garments Wearing apparel CIG Cigarette industry Beverages and tobacco products FUR Furniture industry Wood products PRN Paper, printing, and publishing Paper products, publishing PET Petroleum Petroleum, coal products CHE Chemical industry Chemical, rubber, plastic products MET Metal Ferrous metals; other metals; metal products MIS Toiletries, pharmaceuticals, fertilizer Industry, glass
industry, earth-ware and clay industry, cement, miscellaneous industries
Wool, silk -worm cocoons; motor vehicles and parts; other transport equipment; electronic equipment; machinery and equipment; other manufactures; other mineral products
MNQ Mining and quarrying Coal; oil; gas; other minerals CON Construction Construction ELW Electricity and water Electricity; water GDT Gas extraction and distribution Gas manufacture, distribution TRD Wholesale and retail trade Trade TRN Transport Other transport; sea transport; air transport PUB Public administration, defence, health services,
education services Public administration, defence, health, and education
BNK Bank, insurance, and real estate Other financial services; insurance; dwellings COM Communication and information technology and
e-commerce Communication
OSR Hotel and restaurant and other services Other business services, recreation, and other services
SAM=Social Accounting Matrix;GTAP=Global Trade Analysis Project
Source: GTAP Database 7.1
GTAP=Global Trade Analysis Project Source: GTAP Database 7.1
Aggregated regions Comprising regions Bangladesh Bangladesh India India Pakistan Pakistan Sri Lanka Sri Lanka Rest of South Asia Bhutan, Maldives, Nepal Thailand Thailand Other developed countries Other developed countries excluding North America and EU-25 Other developing countries Other developing countries excluding India, Pakistan, Sri Lanka, and Thailand Least developed countries Other least developed countries North America Canada, Mexico, United States of America EU-25 European Union ROW Rest of the world

6
2.2 The CGE model for the Bangladesh economyAll trade liberalization scenarios are run in a CGE framework. The advantage of this is that it traces the price effects of the exogenous shock. In an increasingly market-oriented economy, the variations in prices may be the most important sources of re-allocation of resources among competing activities, which then may alter the factorial income and, hence, the distribution of personal income. A SAM prepared for the year 2007 serves as the consistent and comprehensive database for the above-mentioned exercises.
The Bangladesh CGE model is built using the Partnership for Economic Policies (PEP) standard static model.4 In the Bangladesh CGE model, a representative firm in each industry maximizes profits subject to its production technology. The sectoral output follows a Leontief production function. Each industry’s value added consists of composite labour and composite capital, following a CES specification. Different categories of labour are combined following a CES technology with imperfect substitutability between different types of labour. Composite capital is a CES combination of the different categories of capital. It is assumed that intermediate inputs are perfectly complementary. They are combined following a Leontief production function.
Household incomes come from labour income, capital income, and transfers received from other agents. Subtracting direct taxes yields household’s disposable income. Household savings are a linear function of disposable income, which allows the marginal propensity to save to differ from the average propensity.
Corporate income consists of its share of capital income and of transfers received from other agents. Deducting business income taxes from total income yields the disposable income of each type of business. Likewise, business savings are the residual that remains after subtracting transfers to other agents from disposable income.
The government draws its income from household and business income taxes, taxes on products and on imports, and other taxes on production. Income taxes for both households and businesses are described as a linear function of total income. The current government budget surplus or deficit (positive or negative savings) is the difference between its revenue and its expenditures. The latter consists of transfers to agents and current expenditures on goods and services.
The rest of the world receives payments for the value of imports, part of the income of capital, and transfers from domestic agents. Foreign spending in the domestic economy consists of the value of exports and transfers to domestic agents. The difference between foreign receipts and spending is the amount of rest-of-the-world savings, which are equal in absolute value to the current account balance but are of opposite sign.
The demand for goods and services, whether domestically produced or imported, consists of household consumption demand, investment demand, demand by government, and demand as transport or trade margins. It is assumed that households have Stone-Geary utility functions (from which derives the Linear Expenditure System). Investment demand includes both gross fixed capital formation (GFCF) and changes in inventories.
Producers’ supply behaviour is represented by nested constant elasticity of transformation (CET) functions. On the upper level aggregate output is allocated to individual products; on the lower level the supply of each product is distributed between the domestic market and exports. The
4 See www.pep-net.org

7
model departs from the pure form of the small-country hypothesis. A local producer can increase his share of the world market only by offering a price that is advantageous relative to the (exogenous) world price. The ease with which his share can be increased depends on the degree of substitutability of the proposed product for competing products; in other words, it depends on the price-elasticity of export demand. Commodities demanded on the domestic market are composite goods, combinations of locally produced goods and imports. The imperfect substitutability between the two is represented by a CES aggregator function. Naturally, for goods with no competition from imports, the demand for the composite commodity is the demand for the domestically produced good.
The system requires equilibrium between the supply and demand of each commodity on the domestic market. The sum of supplies of every commodity made by local producers must equal domestic demand for that locally produced commodity. Finally, supply to the export market of each good must be matched by demand.
Also, there is equilibrium between total demand for capital and its available supply. However, the model works with two different assumptions in line with the features of two categories of labour market in the Bangladesh economy. Thus, the model assumes a flexible wage rate for skilled labour and a fixed wage rate for unskilled labour.
8
Table 3 presents the structure of the Bangladesh economy in 2007. Column 1 shows the sectoral shares of total value added. The share of agriculture in total value added is 19.88 per cent, with cereal and commercial crops the leading sub-sectors. The share of industry is 18 per cent, and the sub-sectors with high shares are rice milling, woven ready-made garments (RMG), and knit RMG. The share of the services sector (including construction) is 62.12 per cent, and the leading services sub-sectors are wholesale and retail trade, construction, and other services.
Column 2 of Table 3 shows export orientation by sector. The woven and knit RMG sectors are more than 80 per cent export-oriented. The other major export-oriented sectors are jute, leather, information technology (IT), public administration and defence, fishing, and the furniture and fertilizer industries.
Bangladesh’s export basket is highly concentrated, as is evident from the fact that woven and knit RMG account for about 74 per cent of total exports (column 3 of Table 3). The share attributable to fishing is 5.3 per cent. Leather and miscellaneous industries constitute 1.7 and 6.9 per cent of total exports, respectively. In the services sector public administration and defence constitute 5 per cent of total exports, while the IT sector has a very low share, only 0.16 per cent.
Column 4 of Table 3 suggests that the major import-oriented sectors are the chemical industry, petroleum, fertilizer industry, paper, printing and publishing industry, miscellaneous industry, toiletries, cloth milling, and yarn. As shown in column 5, the sectors with high import shares are miscellaneous industry, petroleum, food processing, and commercial crops. Finally, column 6 presents the import tariff rates of the respective sectors. The leading protected sectors (the sectors with the highest tariff rates) are fishing, toiletries, cigarette industry, cloth milling, grain milling, woven RMG, glass industry, paper, printing and publishing industry, mining and quarrying, yarn, petroleum, furniture industry, poultry raising, chemical industry, miscellaneous industry, and metal.
3. STRUCTURE OF THE BANGLADESH ECONOMY

99
Note: Vi=sectoral value added, TV=total value added, Ei=sectoral export, Oi=sectoral output, TE=total export, Mi=sectoral import, TM=total import, TAR=tariff rate, RMG=ready-made garments. All figures are expressed in percentages.Source: Social accounting matrix of Bangladesh for 2007.
Table 4 presents the structure of employment in the economy of Bangladesh. Even though the agricultural sector contributes less than 20 per cent to total value added (Table 3), it accounts for nearly 47 per cent of the total employed labour force of the country. The shares of the industry and services sector in the total employed labour force are 11.1 per cent and 41.9 per cent, respectively.
Table 3: Structure of the Bangladesh economy in 2007 as reflected in the Social Accounting Matrix, 20075
Sectors 1 2 3 4 5 6
Vi/TV Ei/Oi Ei/TE Mi/Oi Mi/TM TAR Agriculture 19.88 ― 6.47 ― 10.00 ― Cereal crop sectors 7.44 0.00 0.00 4.91 2.44 6.33 Commercial crops 4.53 2.73 1.13 26.03 7.56 5.53 Livestock rearing 1.45 0.01 0.00 0.01 0.00 6.78 Poultry rearing 0.90 0.00 0.00 0.58 0.06 15.09 Fishing 4.03 9.77 5.11 0.07 0.03 33.35 Forestry 1.54 0.00 0.00 0.00 0.00 0.00 Industry 18.00 ― 86.43 ― 76.32 ― Rice milling 3.09 0.03 0.02 1.22 0.70 6.23 Grain milling 0.36 0.08 0.01 0.11 0.01 24.28 Food processing 1.24 0.93 0.36 29.58 8.07 12.07 Leather industry 0.39 23.42 1.73 4.45 0.23 11.74 Yarn 0.03 42.21 0.38 508.65 3.18 18.23 Cloth milling 1.72 0.00 0.00 17.97 3.79 27.43 Woven RMG 2.39 91.71 37.61 11.68 3.36 21.27 Knitting 3.26 90.49 36.37 1.29 0.36 1.17 Toiletries 0.00 5.92 0.02 166.71 0.32 31.97 Cigarette industry 0.09 1.79 0.10 2.49 0.10 30.40 Furniture industry 0.21 28.38 1.13 31.16 0.87 16.31 Paper, printing, and publishing industry 0.06 4.99 0.05 209.81 1.51 20.76 Pharmaceuticals 0.34 2.22 0.15 20.03 0.96 2.05 Fertilizer industry 0.05 42.01 0.31 328.09 1.71 4.04 Petroleum 0.05 14.14 0.43 654.70 13.91 16.63 Chemical industry 0.11 12.04 0.28 395.22 6.49 14.62 Glass industry 0.04 5.86 0.05 33.97 0.20 21.03 Earth-ware and clay industry 0.19 0.06 0.00 14.46 0.31 7.22 Cement 0.16 0.28 0.02 6.70 0.39 11.07 Metal 0.96 3.38 0.76 16.10 2.53 14.12 Miscellaneous industry 2.08 25.20 6.87 145.63 27.89 14.40 Mining and quarrying 1.19 0.06 0.01 0.52 0.05 20.12 Services 62.12 ― 7.11 ― 13.68 ― Construction 8.42 0.00 0.00 0.00 0.00 0.00 Electricity and water generation 0.89 0.00 0.00 0.00 0.00 0.00 Gas extraction and distribution 0.28 0.00 0.00 0.00 0.00 0.00 Wholesale and retail trade 14.63 0.00 0.00 0.00 0.00 0.00 Transport 9.44 1.32 0.83 18.46 8.20 0.00 Health service 2.30 0.00 0.00 0.00 0.00 0.00 Education service 2.63 0.00 0.00 0.00 0.00 0.00 Public administration and defence 2.84 21.32 5.08 13.27 2.22 0.00 Bank, insurance, and real estate 1.63 1.29 0.16 15.41 1.35 0.00 Hotel and restaurant 0.70 0.00 0.00 0.00 0.00 0.00 Communication 1.32 3.34 0.32 2.29 0.16 0.00 Information technology and e--commerce 0.07 29.65 0.16 7.57 0.03 0.00 Other services 16.98 0.49 0.54 1.33 1.03 0.00 Total 100.00 ― 100.00 ― 100.00 ―
5 Annex 1 provides a brief description of the accounts of the SAM; annex 2 shows the mapping of 41 SAM sectors with the original 86 SAM sectors.

10
Note: UL=unskilled labour, SL=skilled labour, RMG=ready-made garments.Source: Employment satellite matrix (data from Labour Force Survey 2005-06).
Table 4: Sectoral employment numbers and shares from the employment satellite matrix, 2006-06
Sectors Number % share in total
UL+SL UL SL UL SL Agriculture 21 411 425 834 575 48.65 25.06 46.99 Cereal crop sectors 13 165 730 9 270 29.91 0.28 27.83 Commercial crops 3 239 420 1 580 7.36 0.05 6.85 Livestock rearing 20 775 57 356 443 4.72 10.70 5.14 Poultry rearing 1 562 291 238 709 3.55 7.17 3.80 Fishing 943 285 151 715 2.14 4.56 2.31 Forestry 423 142 76 858 0.96 2.31 1.06 Industry 489 2210 375 810 11.12 11.29 11.13 Rice milling 248 550 450 0.56 0.01 0.53 Grain milling 10 590 3 910 0.02 0.12 0.03 Food processing 245 770 21 130 0.56 0.63 0.56 Leather industry 91 960 7 040 0.21 0.21 0.21 Yarn 61 420 6 580 0.14 0.20 0.14 Cloth milling 650 190 23 810 1.48 0.72 1.42 Woven RMG 1 008 370 103 630 2.29 3.11 2.35 Knitting 93 170 4 830 0.21 0.15 0.21 Toiletries 14 990 2 010 0.03 0.06 0.04 Cigarette industry 121 660 7 340 0.28 0.22 0.27 Furniture industry 946 720 19 280 2.15 0.58 2.04 Paper, printing, and publishing industry 89640 28 360 0.20 0.85 0.25 Pharmaceuticals 54 700 9 300 0.12 0.28 0.14 Fertilizer industry 38540 10 460 0.09 0.31 0.10 Petroleum 7 460 2 540 0.02 0.08 0.02 Chemical industry 113 060 13 940 0.26 0.42 0.27 Glass industry 5 700 2 800 0.01 0.08 0.02 Earth-ware and clay industry 243 920 3 000 0.55 0.09 0.52 Cement 37 100 2 900 0.08 0.09 0.08 Metal 190 540 29 460 0.43 0.88 0.46 Miscellaneous industry 615 460 72 540 1.40 2.18 1.45 Services 17 706 829 2 119 371 40.23 63.65 41.88 Construction 1 453 000 71 000 3.30 2.13 3.22 Electricity and water generation 48 510 11 490 0.11 0.35 0.13 Gas extraction and distribution 4 770 3 230 0.01 0.10 0.02 Mining and quarrying 2 700 500 0.01 0.02 0.01 Wholesale and retail trade 7 035780 72 220 15.99 2.17 15.01 Transport 3 316 660 29 540 7.54 0.89 7.07 Health service 61 920 272 080 0.14 8.17 0.71 Education service 247 020 1 058 980 0.56 31.80 2.76 Public administration and defence 784 890 96 110 1.78 2.89 1.86 Bank, insurance, and real estate 291 529 216 471 0.66 6.50 1.07 Hotel and restaur ant 695 680 16 320 1.58 0.49 1.50 Communication 136 380 1 620 0.31 0.05 0.29 Information technology and e-commerce 4 250 4 750 0.01 0.14 0.02 Other services 3 626 440 265 560 8.24 7.98 8.22 Total 44 010 464 3 329 756 100.00 100.00 100.00
11
4.1 Global agricultural trade liberalization under a potential WTO Doha agreement
Agricultural trade liberalization is likely to affect the current pattern of global production and trade of many agricultural commodities in Bangladesh. Price increases following liberalization will be, on the whole, welfare-enhancing for a net exporting country, while for a net importing country this will be translated into a terms-of-trade shock with adverse welfare consequences. In light of anticipated price increases, concerns have been expressed about the effects on food security and poverty in countries dependent on food imports. However, since tariff reduction and removal of subsidies are two inherent components of global agricultural trade liberalization, they should be considered simultaneously in assessing welfare consequences. While tariff reductions may depress prices, subsidy cuts will tend to exert an opposite effect. The net result will depend on the relative strength of these two differing forces.
In World Trade Organizatin (WTO) terminology subsidies in general are categorized into “boxes”, which are given the colours of traffic lights: green (permitted), amber (slow down – i.e. to be reduced), and red (forbidden) (see chapter 2). In agriculture things are, as usual, more complicated. The Agreement on Agriculture has no red box, although domestic support exceeding the levels of the reduction commitments in the amber box is prohibited, and there is a blue box for subsidies tied to programmes that limit production. Also, there are exemptions for developing countries, which are sometimes called a Special and Differential (S&D) box, including provisions in Article 6.2 of the agreement.
While the Uruguay Round Agreement on Agriculture made some significant progress on rules of trade in agriculture by replacing quantitative restrictions with tariffs and by specifying initial commitments on the reduction of tariffs and subsidies, the momentum could not be maintained under subsequent WTO-sponsored negotiations. Domestic support to agriculture in the developed countries has not come down since the implementation of the commitments of the Uruguay Round began in 1995 (Naik, 2005). Although, in the Doha Ministerial Declaration, member countries vowed to achieve substantial improvements in market access through phasing-out of all forms of export subsidies and substantial reductions in trade-distorting domestic support (WTO, 2001, paragraph 13), no major breakthrough has been made since the conclusion of the Hong Kong Ministerial Conference, held in December 2005. While members are still negotiating modalities for further liberalization, consensus has been reached only on abolishing all export subsidies by 2013 (WTO, 2005, paragraph 6).6 In fact, export subsidies constitute a very insignificant portion of the total domestic support measures given to agriculture in the developed countries.
Despite the lack of progress related to agricultural liberalization in the post-Uruguay Round period, there is no denying that, since most agricultural commodities have long been the most protected commodities in world trade, any significant liberalization in this sector is likely to have huge welfare implications. How future global agricultural trade liberalization will affect the livelihood of and food security in poor developing countries that depend on food imports is, therefore, of great concern.
It is important to note that, at the WTO, Bangladesh, as a least developed country, is not bound to undertake any liberalization in its domestic agricultural sector in terms of tariff cuts or subsidy withdrawal. There are concerns, however, that reduction in agricultural domestic support measures by developed and developing countries might have important implications for net
6 In the case of cotton, export subsidies by the developed countries were supposed to be abolished in 2006.
4. BANGLADESH'S TRADE AND AGRICULTURAL POLICIES

12
food-importing countries such as Bangladesh. Several studies predict that, with the elimination of export and production subsidies, prices of agricultural commodities in general are likely to increase (Beghin et al., 2002; Diao et al., 2001; Dimaranan et al., 2003; Elbehri and Leetmaa, 2002; Francois et al., 2003; Hertel et al., 2000; van Meijl and van Tongeren, 2001). As a net importer of cereal crops, Bangladesh would experience a rise in import prices of cereal crops. However, Bangladesh would also experience a rise in export prices of some of its commercial crops.
4.2 Bilateral free-trade agreement between Bangladesh and IndiaBangladesh has entered into several regional free-trade agreements and is in the process of signing bilateral FTAs with a number of countries. In recent years interest in regional economic integration has increased in South Asia. With the stalemate of the WTO negotiations, the interest in regional trading arrangements may increase further. Regional integration in South Asia gained momentum in 1995 with the signing of the South Asian Association for Regional Cooperation (SAARC) Preferential Trading Arrangement (SAPTA). In early 2004 the SAARC member countries, including Bangladesh, agreed to form the South Asian Free Trade Area (SAFTA), which came into force 1 July 2006. Bangladesh is also a member of the Bay of Bengal Initiative for Multi-Sectoral Technical and Economic Cooperation (BIMSTEC), comprising countries from South Asia and South-East Asia. Recently, Bangladesh has been negotiating with India and Malaysia for bilateral FTAs.
Any FTA deal has two important aspects: the market access aspect (the export side) and the trade liberalization aspect (the import side). Like their effects on prices, the employment effects of these two aspects usually work in different directions. While increased exports may create new employment in the export-oriented sectors, increased imports, due to liberalization of trade, may reduce employment in the sectors that compete with imports. The net effect may depend on the relative strength of these two effects.
The bilateral FTA that Bangladesh and India are now negotiating will allow tariff-free trade between these two South Asian countries. Despite the fact that there is a South Asian Free Trade Area (SAFTA), progress in SAFTA has been quite slow. This slow pace has propelled certain member countries, such as India and Bangladesh, to negotiate bilateral FTAs. The Bangladesh–India bilateral FTA deal is supposed to increase the market access of Bangladesh’s export products in India and increase import flows from India to Bangladesh. Since 1996–97 Indian exports to Bangladesh have been growing at 9.1 per cent annually, above the general rate of growth of India’s total merchandise exports (8.4 per cent). However, India’s imports from Bangladesh over the same period have grown on average at only 3 per cent annually, compared with average growth of its total imports of 9.2 per cent. Consequently, Bangladesh’s bilateral trade deficit with India has been increasing rapidly, on average at about 9.5 per cent annually.
4.3. Unilateral agricultural trade liberalizationTrade liberalization also affects sectoral allocation of resources, factor returns, and, thus, the poverty of households. In Bangladesh trade liberalization has been one of the major policy reforms during the 1990s and 2000s. There are debates over the impacts of further liberalization of trade

13
on increases in efficiency, enhancing the performance of the export sectors, and poverty in Bangladesh.
Trade policy from 1972 through 1980 consisted of significant import controls. During the 1980s moderate import liberalization took place. In 1984 the import policy regime changed significantly with the abolition of the import-licensing system; imports were permitted against letters of credit (L/C). Since 1986 there have been significant changes in the contents and structure of the import procedures and the Import Policy Orders (IPOs). Before 1986 the IPOs contained a lengthy Positive List of importable goods. In 1986 the Positive List was replaced by two lists - the Negative List (for banned items) and the Restricted List (for items importable under certain prescribed conditions). Imports of any items outside the lists were allowed. These changes might be considered significant moves towards import liberalization, since no restrictions were then imposed on the import of items that did not appear in the IPOs. To increase the stability and certainty of trade policy, IPOs with relatively longer periods replaced the previous practice of issuing import policy annually. Since 1990 the Negative and Restricted Lists of importables have been combined into one list, namely the Consolidated List (Raihan, 2007).
The range of products subject to import bans or restrictions has been curtailed substantially, from as high as 752 in 1985-86 to only 63 in 2003-06. Import restrictions have been imposed for trade-related reasons (i.e. to provide protection to domestic industries) and for non-trade reasons (e.g. to protect the environment, public health and safety, or security).
Beginning in the late 1980s, the tariff regime has been increasingly liberalized. Between 1991-92 and 2004–05 the unweighted average tariff rate fell from 70 per cent to 13.5 per cent. Much of this reduction was achieved by lowering the maximum rate. In 1991–92, the maximum tariff rate was 350 per cent; by 2004–2005 the maximum rate had come down to only 25 per cent. The number of tariff bands was 24 in the 1980s, was 18 in the early 1990s, and is only 4 at present. The percentage of duty-free tariff lines more than doubled between 1992–93 and 1999–2000 (from 3.4 per cent to 8.4 per cent). Bangladesh has no tariff quotas, seasonal tariffs, or variable import levies. All these reforms have greatly simplified the tariff regime and helped streamline customs administration procedures. The drastic reduction in unweighted tariff rates during the 1990s also lowered import-weighted tariff rates. The import-weighted average tariff rate declined from 42.1 per cent in 1990–91 to 13.8 per cent in 1999–2000 and, further, to 11.48 per cent in 2003-04.
Import-weighted average tariff rates for agricultural products (HS code 01 to HS code 15) are presented in Table 5. Within the HS codes 01, 05, 07, 08, 09, 11, 12, 13, and 15, there have been significant cuts in tariff rates between 2002 and 2007.

14
4.4 Agricultural production subsidy policyThe government’s subsidy policy towards agriculture affects the production pattern in the agricultural sector and the livelihood of the people involved in this sector. In addition, an increased allocation of subsidy to the agricultural sector affects the pattern of overall allocation of resources among different sectors in the economy. In Bangladesh subsidies for the agricultural sector have been prominent, and there has been an increased allocation of subsidies to agriculture over time.
In general, economic theory holds that subsidies distort the market and produce inefficiencies. However, there are a number of cases in which governments have opted for subsidies with a view to achieving an equitable and “efficient” solution of economic problems. The Bangladesh government allocates a significant portion of its fiscal budget each year to subsidies. The total amount of government subsidies in 2006-07 was Taka 28.95 billion, which was a 93 per cent increase over the amount in the previous two-year period. This trend continued in 2007-08, when the amount rose again, by about 105 per cent to Taka 59.29 billion (Figure 1). These dramatic increases can be attributed mainly to the rapid rise in the international prices of food, fuel, and fertilizer, which are three of the main sectors receiving government subsidies.
Table 5: Import-weighted tariff rates on agricultural products in Bangladesh
HS code Product name 2002 2003 2004 2005 2006 2007 01 Live animals 17.36 8.69 10.38 11.47 11.47 11.45 02 Meat and edible meat offal 25.04 22.51 22.55 25.00 25.00 25.00 03 Fish and crustaceans, molluscs, and other aquatic
invertebrates 24.98 32.47 29.82 24.85 24.85 24.85
04 Dairy produce; birds' eggs; natural honey; edible products of animal origin, not elsewhere specified or included
26.94 26.89 25.43 23.57 23.57 23.46
05 Products of animal origin, not elsewhere specified or included
23.05 21.08 16.35 13.69 13.69 13.31
06 Live trees and other plants; bulbs, roots, and the like; cut flowers and ornamental foliage
2.34 1.70 2.42 2.29 2.29 2.11
07 Edible vegetables and certain roots and tubers 8.09 10.71 10.52 7.88 7.88 6.87 08 Edible fruit and nuts; peel of citrus fruits or melons 34.21 28.55 28.56 24.87 24.81 25.25 09 Coffee, tea, maté, and spices 34.98 30.76 28.34 8.63 20.81 18.52 10 Cereals 4.34 12.64 6.85 4.56 5.48 4.57 11 Products of the milling industry; malt; starches;
insulin; wheat gluten 11.18 10.92 9.62 2.49 7.79 6.88
12 Oil seeds and oleaginous fruits; miscellaneous grains, seeds, and fruit; industrial or medicinal plants; straw and fodder
5.40 7.31 3.76 0.17 0.13 0.12
13 Lac; gums, resins, and other vegetable saps and extracts
15.98 10.27 8.88 7.72 7.37 6.37
14 Vegetable plaiting materials; vegetable products not elsewhere specified or included
16.97 16.72 18.02 23.79 15.42 15.40
15 Animal or vegetable fats and oils and their cleavage products; prepared edible fats; animal or vegetable waxes
15.46 22.65 9.09 6.22 6.24 5.26
Source: Calculated from UN COMTRADE.

15
As the total amount of subsidies has increased hugely, the share received by various sectors as a portion of the total amount of subsidies provided has changed significantly over the past decade. As seen in Table 6, fertilizer and other agricultural subsidies made up about 12.2 per cent of total subsidies in 1998-99, but in 2007-08 this sector accounted for the lion’s share of subsidies, at about 65.8 per cent. Export subsidies were nil or negligible until 2002-03, when this sector suddenly received about 53 per cent of all subsidies. In 2007-08 this sector received 18.6 per cent of total subsidies. The shares of food and jute products have shrunk considerably over the years, while that of rural electrification, which was a small portion to begin with, has increased.
Figure 1: Government subsidies, Bangladesh: volume and share of gross domestic product (GDP), 1999-2008
Source: Ministry of Finance, Government of Bangladesh.
Items 1998- 99
1999- 2000
2000- 01
2001- 02
2002- 03
2003- 04
2004- 05
2005- 06
2006- 07
2007- 08
Food 60.39 61.84 60.08 49.50 30.51 25.44 22.16 18.20 14.02 12.41 Rural electrification 2.31 1.36 1.53 1.18 0.59 0.67 0.41 0.53 0.28 0.13 Jute goods 18.78 22.13 18.22 19.21 3.70 5.88 5.08 5.00 3.45 2.87 Export subsidy 0.00 0.09 0.00 0.00 53.05 49.87 33.05 36.24 24.61 18.55 Fertilizer and other agricultural activities
12.25 14.02 19.28 29.55 12.09 16.87 39.03 39.67 35.92 65.78
Others 6.26 0.57 0.88 0.57 0.05 1.27 0.28 0.37 21.71 0.26 Total 100.00 100.00 100.00 100.00 100.00 100.00 100.00 100.00 100.00 100.00
Table 6: Share of Bangladesh government subsidies by sector, 1998-2008
Source: Ministry of Finance, Government of Bangladesh.
0.29 0.24 0.30
0.570.47
0.740.53
0.96
1.84
0.000.200.400.600.801.001.201.401.601.802.00
0
10000
20000
30000
40000
50000
60000
70000
Shar
e in
GD
P
Mill
ion
Taka
Volume (million Taka)
Share in GDP

16
4.5 Agricultural productivity In Bangladesh food security is linked to the increased production of cereal crops, especially rice. Therefore, a rise in productivity in the agricultural sector affects not only agricultural production but also the pattern of allocation of resources between agricultural and non-agricultural sectors and households’ income and poverty.
Productivity in Bangladeshi agriculture has increased quite significantly over the last three decades or so. Figure 2 suggests that there has been a remarkable increase in cereal yield in terms of kg per hectare during this time. In 1972 cereal yield was around 1,500 kg per hectare. Yield had increased to about 3,800 kg per hectare by 2006. This rise in productivity has resulted in increased crop production during this period. The crop production index (considering 2000 as the base) was less than 50 in 1972 but reached 105 in 2004.
However, further increases in agricultural productivity remain crucial to ensuring food security in Bangladesh. The productivity of agriculture depends on various factors such as the use of high yielding varieties (HYV), improved management practices, efficient use of irrigation water, pest management, and soil health management. Other related factors that affect the productivity of agriculture include research and technological innovation for increased productivity, seed production and supply systems, efficient use of inputs, reduction in yield gap, crop diversification, adoption of integrated crop production technologies, farm mechanization, and subsidies to agriculture. Further increases in agricultural productivity are constrained by a number of challenges. These include climate change such as global warming and sea-level rise, soil degradations, pest infestation, lack of infrastructure and power supply, rapid population growth, and the scarcity of land, among others.
Figure 2: Cereal yield (kg per hectare) and crop production index (2000=100)
Data source: World Development Indicators of World Bank.
Cereal yield (kg per hectare)Crop production index (2000 = 100)
Kg/
hect
are
Inde
x (2
000
= 10
0)
120
100
80
60
40
20
0
4500
4000
3500
3000
2500
2000
1500
1000
500
0
1972
1974
1976
1978
1980
1982
1984
1986
1988
1990
1992
1994
1996
1998
2000
2002
2004
2006

17
Doha Agriculture: Using the GTAP model, we simulate a moderate Doha scenario for agricultural liberalization under which developed countries cut their agricultural tariffs by 36 per cent and the developing countries cut theirs by 24 per cent. Furthermore, both the developed and developing countries reduce domestic agricultural subsidies by one-third and completely eliminate agricultural export subsidies. As discussed above, understanding the impact on the Bangladesh economy of liberalization of global agricultural trade is important, as Bangladesh is a net importer of some major agricultural products. Table 7 provides the GTAP results for changes in export demand, export prices, import prices, and imports under this scenario. The GTAP simulation results project a rise in export demand for agricultural products. Also, import prices of major agricultural and food products would rise, and their imports would fall. These changes in export demand, export prices, import prices, and imports are introduced as shocks in the Bangladesh CGE model.
Table 7: Impacts of Doha Agriculture on export demand, export price, import price and import (% change from the base value)
Source: GTAP simulation results.
Sectors Export
demand Export price
Import price Imports
Cereal crops 85.3 0.68 3.35 -6.38 Commercial crops 4.94 0.58 0.88 -0.8 Livestock and poultry 0.19 0.57 0.7 -0.32 Fishing 2.12 -0.01 -0.02 -0.05 Rice milling 11.57 0.45 3.85 -8.09 Food processing -0.76 0.4 0.41 -0.11 Leather industry -1.45 0.31 0.11 0.19 Cloth milling -0.5 0.2 0.12 -0.06 Woven and knit ready -made garments -0.33 0.14 0.06 0.17 Cigarette industry 0.02 0.18 0.17 -0.04 Furniture industry 0.15 0.04 0.06 -0.06 Paper, printing, and publishing 0.02 0.04 0.04 -0.06 Petroleum -0.01 0.04 0.04 0.01 Chemical industry 0.09 0.05 0.07 -0.02 Metal 0.02 0.04 0.03 0.03 Miscellaneous industry -0.02 0.04 0.04 -0.01 Mining and quarrying 0.07 0.03 0.04 0 Transport 0.11 0.03 0.04 -0.06 Public administration, defence, health service, education service 0.1 0.03 0.04 0 Financial service 0.02 0.04 0.03 -0.03 Communication 0.04 0.03 0.04 -0.02 Other services 0.04 0.04 0.05 -0.05
Bangladesh–India Bilateral FTA: Using the GTAP model, we simulate a bilateral free trade agreement scenario in which Bangladesh and India bring their bilateral tariffs to zero. Table 8 provides the GTAP results for changes in export demand, export prices, import prices, and imports under this scenario. Under this FTA scenario there would be some increases in export demand, but there would be considerable increases in imports for most agricultural and industrial products. These changes in export demand, export prices, import prices, and imports are introduced as shocks in the Bangladesh CGE model.
5. SCENARIOS CONSIDERED IN THE BANGLADESH CGE MODEL

18
Table 8: Impacts of Bangladesh-India Bilateral FTA on export demand, export price, import price, and imports (% change from the base value)
Table 9: Change in overall sectoral tariff rates in Bangladesh due to the FTA between Bangladesh and India (% change from the base value)
Source: GTAP simulation results.
Table 9 shows the changes in overall sectoral tariff rates due to the FTA between Bangladesh and India. These changes in tariff rates are introduced as shock in the Bangladesh CGE model while running the simulation for the Bangladesh-India bilateral FTA.
Sectors Export
demand Export price
Import price
Import
Cereal crops 3.63 -0.64 0.19 1.35 Commercial crops 15.52 -0.54 0.09 6.13 Livestock and poultry 4.19 -0.53 0.01 -1.97 Fishing 1.28 -0.46 0.22 27.26 Rice milling 1.71 -0.34 0.23 58.95 Food processing 4.41 -0.55 0.05 2.97 Leather industry 4.89 -0.49 0.01 1.86 Cloth milling 6.02 -0.7 0.05 12.8 Woven and knit Ready-made garments 7.14 -0.98 0.12 44.22 Cigarette industry 2.82 -0.16 0.02 2.63 Furniture industry 9.67 -0.25 0.03 10.61 Paper, printing, and publishing 4.7 -0.54 0.03 6.29 Petroleum 23.81 -1.46 0 1.94 Chemical industry 25.71 -0.63 0.03 4.26 Metal 37.15 -0.76 0.05 9.94 Miscellaneous industry 3.3 -0.21 0.02 3.18 Mining and quarrying 417.41 -1.23 0.02 5.1 Transport -0.41 0.12 -0.01 -0.48 Public administration, defence, health service, education service -0.62 0.16 0 -0.68 Financial service -1.86 0.49 0 0.48 Communication -1.41 0.37 0 0.24 Other services -0.55 0.14 0 -0.35
Sectors % change in overall tariff rates Cereal crops -44.70 Commercial crops -57.65 Livestock and poultry -0.66 Fishing -85.20 Food processing -16.21 Leather industry -10.37 Cloth milling -28.73 Woven and knit ready -made garments -68.21 Cigarette industry -12.83 Furniture industry -23.31 Paper, printing, and publishing -26.64 Petroleum -18.06 Chemical industry -29.67 Metal -40.70 Miscellaneous industry -20.95 Mining and quarrying -35.56
Source: Calculated from GTAP simulation results.

19
Unilateral Agricultural Trade Liberalization: A scenario of domestic agricultural trade liberalization is run in which Bangladesh cuts tariffs on all agricultural sectors by 50 per cent. Understanding the impact of this scenario on the Bangladesh economy is important, as there are debates in the policy arena with respect to further liberalization of trade in the agricultural sectors in Bangladesh. As noted, over the last two decades the trade in the cereal crop sub-sector has been highly liberalized. However, there are still some significant protections on the commercial crop, livestock, and poultry sub-sectors.
Agricultural Production Subsidy Policy: In this scenario the existing subsidies in agricultural sectors are increased by 25 per cent. As discussed before, over the years allocation of subsidies towards the agricultural sector has increased quite significantly. This scenario will help us understand the allocation and efficiency effects of the increased amount of subsidies in the agricultural sector.
Agricultural Productivity: A scenario that includes a 10 per cent rise in total factor productivity in the cereal crop sector is considered. Raising agricultural productivity in general, and increasing the productivity in the cereal crop sector in particular, has been one of the major development agendas of the government. This scenario will help to explore the economy-wide impacts of such an increase in productivity in the cereal crop sector.
20
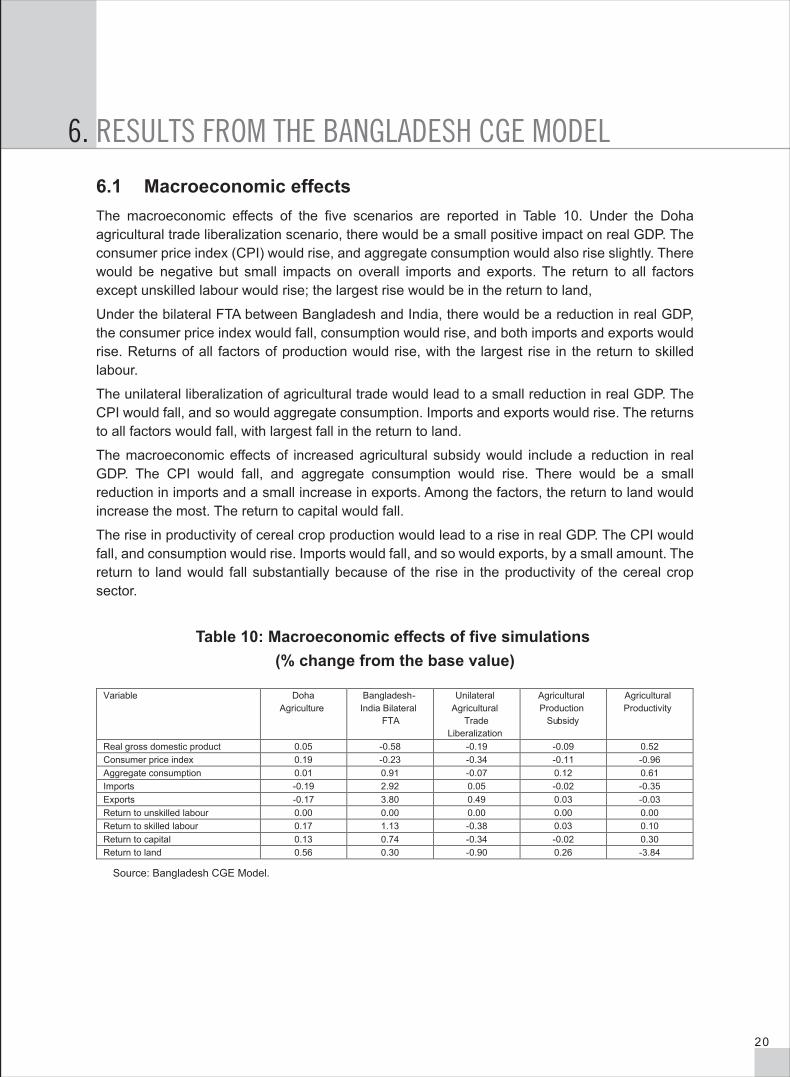
6.1 Macroeconomic effectsThe macroeconomic effects of the five scenarios are reported in Table 10. Under the Doha agricultural trade liberalization scenario, there would be a small positive impact on real GDP. The consumer price index (CPI) would rise, and aggregate consumption would also rise slightly. There would be negative but small impacts on overall imports and exports. The return to all factors except unskilled labour would rise; the largest rise would be in the return to land,
Under the bilateral FTA between Bangladesh and India, there would be a reduction in real GDP, the consumer price index would fall, consumption would rise, and both imports and exports would rise. Returns of all factors of production would rise, with the largest rise in the return to skilled labour.
The unilateral liberalization of agricultural trade would lead to a small reduction in real GDP. The CPI would fall, and so would aggregate consumption. Imports and exports would rise. The returns to all factors would fall, with largest fall in the return to land.
The macroeconomic effects of increased agricultural subsidy would include a reduction in real GDP. The CPI would fall, and aggregate consumption would rise. There would be a small reduction in imports and a small increase in exports. Among the factors, the return to land would increase the most. The return to capital would fall.
The rise in productivity of cereal crop production would lead to a rise in real GDP. The CPI would fall, and consumption would rise. Imports would fall, and so would exports, by a small amount. The return to land would fall substantially because of the rise in the productivity of the cereal crop sector.
Table 10: Macroeconomic effects of five simulations (% change from the base value)
Source: Bangladesh CGE Model.
Variable Doha Agriculture
Bangladesh-India Bilateral
FTA
Unilateral Agricultural
Trade Liberalization
Agricultural Production
Subsidy
Agricultural Productivity
Real gross domestic product 0.05 -0.58 -0.19 -0.09 0.52 Consumer price index 0.19 -0.23 -0.34 -0.11 -0.96 Aggregate consumption 0.01 0.91 -0.07 0.12 0.61 Imports -0.19 2.92 0.05 -0.02 -0.35 Exports -0.17 3.80 0.49 0.03 -0.03 Return to unskilled labour 0.00 0.00 0.00 0.00 0.00 Return to skilled labour 0.17 1.13 -0.38 0.03 0.10 Return to capital 0.13 0.74 -0.34 -0.02 0.30 Return to land 0.56 0.30 -0.90 0.26 -3.84
6. RESULTS FROM THE BANGLADESH CGE MODEL

21
6.2 Sectoral effectsThe sectoral price and volume effects of the Doha agriculture scenario are reported in Table 11. Prices of all products would rise. The increases would be largest for agricultural and food products. In general, agricultural sub-sectors and some industrial and services sub-sectors would expand. Also, imports would decline in some agricultural and rice milling sub-sectors. There would be some increase in exports of some agricultural products, while exports of most of the manufacturing sub-sectors would decline slightly.
Table 11: Effects on sectoral prices and volumes of Doha Agriculture simulation (% change from the base value)
Sectors PD PC PE_ FOB PL PVA O M DD E Q
Cereal crop 0.29 0.44 13.59 0.29 0.29 0.41 -5.73 0.41 28.81 0.10 Commercial crop 0.26 0.40 1.40 0.27 0.37 0.27 -1.01 0.21 2.48 -0.06 Livestock rearing 0.18 0.18 0.81 0.18 0.10 0.03 -1.00 0.03 1.28 0.03 Poultry rearing 0.19 0.19 0.08 0.19 0.10 0.00 0.39 0.00 -0.23 0.01 Shrimp farming and fishing 0.08 0.08 0.37 0.08 0.12 0.16 0.66 0.10 0.69 0.10 Forestry 0.11 0.11 n.a. 0.11 0.12 0.10 n.a. 0.10 n.a. 0.10 Rice milling 0.30 0.34 2.61 0.30 0.10 -0.01 -6.73 -0.01 4.66 -0.10 Grain milling 0.24 0.24 0.10 0.24 0.11 -0.03 0.45 -0.03 -0.30 -0.02 Food processing 0.16 0.23 0.12 0.16 0.11 0.14 -0.31 0.14 0.07 0.03 Leather industry 0.21 0.20 -0.10 0.21 0.10 -0.22 0.09 -0.09 -0.64 -0.08 Yarn industry 0.35 0.16 0.32 0.35 0.10 -0.60 -0.17 -0.58 -0.63 -0.21 Cloth milling 0.11 0.12 0.04 0.11 0.10 -0.04 -0.05 -0.04 -0.18 -0.05 Woven RMG 0.17 0.11 0.10 0.17 0.10 -0.24 0.07 -0.13 -0.25 0.00 Knit RMG 0.26 0.24 0.14 0.28 0.11 -0.31 0.30 -0.09 -0.33 -0.04 Toiletries 0.10 0.04 0.05 0.09 0.12 -0.04 0.12 -0.04 -0.10 0.07 Cigarette industry 0.19 0.20 0.18 0.11 0.12 0.07 -0.04 0.07 0.20 0.06 Furniture ind ustry -0.07 -0.03 0.42 -0.07 0.12 0.60 0.11 0.35 1.24 0.27 Paper, printing, and publishing industry 0.10 0.06 0.12 0.09 0.11 -0.02 0.07 -0.03 0.03 0.04 Pharmaceuticals 0.13 0.11 0.05 0.12 0.12 0.02 0.24 0.03 -0.10 0.06 Fertilizer industry 0.15 0.02 0.05 0.15 0.12 0.02 0.38 0.10 -0.09 0.34 Petroleum 0.10 0.08 0.04 0.09 0.13 0.00 0.06 0.01 -0.08 0.06 Chemical industry 0.08 0.08 0.29 0.08 0.12 0.09 0.06 0.05 0.42 0.06 Glass industry 0.11 0.08 0.04 0.10 0.11 0.01 0.21 0.02 -0.09 0.08 Earth-ware and clay industry 0.12 0.10 0.04 0.11 0.12 0.06 0.26 0.06 -0.07 0.09 Cement 0.11 0.10 0.01 0.11 0.12 0.14 0.33 0.14 -0.03 0.15 Metal 0.11 0.10 0.03 0.11 0.11 0.06 0.21 0.07 -0.07 0.09 Miscellaneous industry 0.15 0.08 0.05 0.15 0.11 -0.07 0.17 -0.02 -0.21 0.11 Mining and quarrying 0.11 0.11 0.23 0.11 0.13 0.10 0.23 0.10 0.30 0.10 Construction 0.10 0.10 n.a. 0.10 0.10 0.12 n.a. 0.12 n.a. 0.12 Electricity and water generation 0.12 0.12 n.a. 0.12 0.13 0.05 n.a. 0.05 n.a. 0.05 Gas extraction and distribution 0.13 0.13 n.a. 0.13 0.13 0.03 n.a. 0.03 n.a. 0.03 Trade 0.12 0.12 n.a. 0.12 0.13 0.02 n.a. 0.02 n.a. 0.02 Transport 0.10 0.09 0.09 0.10 0.10 0.01 0.11 0.01 -0.01 0.03 Health service 0.12 0.12 n.a. 0.12 0.15 0.01 n.a. 0.01 n.a. 0.01 Education service 0.14 0.14 n.a. 0.14 0.16 -0.04 n.a. -0.04 n.a. -0.04 Public administration and defence 0.13 0.12 0.14 0.13 0.15 -0.11 0.04 -0.11 -0.11 -0.09 Bank, insurance. and real estate 0.14 0.12 0.13 0.13 0.15 0.03 0.20 0.03 0.02 0.06 Hotel and restaurant 0.18 0.18 n.a. 0.18 0.11 0.01 n.a. 0.01 n.a. 0.01 Communications 0.15 0.15 0.18 0.13 0.14 0.02 0.16 0.02 0.10 0.02 Information technology 0.15 0.14 0.07 0.15 0.14 -0.04 0.24 -0.01 -0.14 0.02 Other services 0.09 0.09 0.16 0.09 0.09 0.06 0.12 0.06 0.17 0.06
Note: PD = price of local product (including all taxes and margins); PC=purchaser price of composite commodity (including all taxes and margins); PE_FOB=FOB price of exported commodity; PL=price of local product (excluding all taxes on products); PVA=price of industry value added; O=production; M=import; DD=domestic demand; E=export; Q=composite commodity demand; RMG=ready-made garments; n.a.=not applicable.Source: Bangladesh CGE model.

22
The effects of the Bangladesh-India bilateral FTA on sectoral prices include a rise in domestic prices of agricultural commodities and a fall in prices in both the industrial and services sub-sectors (Table 12). There would be increased imports in almost all sub-sectors. The sub-sectors with high import penetration would experience contraction. There would be a rise in major export categories such as woven and knit ready-made garments and leather, and these sectors would expand.
Table 12: Effects on sectoral prices and volumes of Bangladesh-India FTA simulation (% change from the base value)
Note: PD=price of local product (including all taxes and margins); PC=purchaser price of composite commodity (including all taxes and margins); PE_FOB=FOB price of exported commodity; PL=price of local product (excluding all taxes on products); PVA=price of industry value added; O=production; M=import; DD=domestic demand; E=export; Q=composite commodity demand; RMG=ready-made garments; n.a.=not applicable.Source: Bangladesh CGE model.
Sectors PD PC PE_ FOB PL PVA O M DD E Q
Cereal crop 0.20 0.07 0.36 0.21 0.28 0.27 5.86 0.27 0.57 0.54 Commercial crop 0.08 -0.60 2.71 0.08 0.28 -0.27 5.87 -0.41 4.89 0.95 Livestock rearing 0.30 0.30 0.55 0.30 0.58 0.38 1.04 0.38 0.87 0.38 Poultry rearing 0.14 0.14 -0.04 0.14 0.59 0.47 0.76 0.47 0.12 0.48 Shrimp farming and fishing 0.51 0.48 0.16 0.52 0.73 0.07 62.67 0.14 -0.58 0.20 Forestry 0.42 0.42 n.a. 0.42 0.67 -0.77 n.a. -0.77 n.a. -0.77 Rice milling 0.21 0.21 0.09 0.21 0.61 0.66 0.61 0.66 0.41 0.66 Grain milling 0.25 0.25 -0.03 0.25 0.65 0.65 1.15 0.65 0.09 0.65 Food processing -0.02 -0.46 0.53 -0.02 0.67 0.10 3.18 0.09 1.09 0.86 Leather industry -0.08 -0.15 0.74 -0.08 0.58 1.19 2.67 0.84 2.34 0.95 Yarn industry -0.06 0.05 -0.75 -0.06 0.62 2.25 2.58 2.78 1.51 2.60 Cloth milling -0.01 -1.25 1.29 -0.01 0.62 -0.44 11.57 -0.44 1.89 1.74 Woven RMG -5.12 -10.50 0.22 -5.20 0.63 4.15 8.24 -5.05 4.96 3.22 Knit RMG -1.13 -1.07 0.40 -1.19 0.65 4.32 0.68 1.65 4.60 1.53 Toiletries -0.66 -0.24 -0.60 -0.57 0.72 1.25 0.22 1.25 1.20 0.53 Cigarette industry -0.15 -0.31 0.41 -0.08 0.70 0.78 6.23 0.77 1.66 0.94 Furniture industry -1.33 -2.08 1.68 -1.33 0.68 1.56 3.54 -0.03 5.54 1.16 Paper, printing, an d publishing industry -0.55 -4.09 1.83 -0.54 0.68 -4.03 3.13 -4.24 -0.11 1.09 Pharmaceuticals -0.55 -0.46 -0.54 -0.51 0.69 1.13 0.20 1.13 1.08 0.97 Fertilizer industry 0.45 0.07 0.36 0.45 0.71 -0.63 0.23 -0.56 -0.72 0.12 Petroleum -1.49 -3.06 -0.42 -1.37 0.76 -0.65 1.32 -0.89 0.84 1.09 Chemical industry -1.28 -3.78 6.22 -1.27 0.69 -1.87 0.98 -3.56 10.02 0.23 Glass industry 0.07 0.05 -0.04 0.07 0.68 0.27 0.40 0.28 0.08 0.32 Earth-ware and clay industry 0.33 0.28 0.32 0.31 0.69 -0.67 -0.11 -0.67 -0.65 -0.59 Cement 0.44 0.41 0.83 0.43 0.71 -2.34 -1.59 -2.34 -1.64 -2.29 Metal -0.51 -1.28 9.26 -0.50 0.67 -2.30 5.47 -2.93 14.88 -1.62 Miscellaneous industry -0.26 -2.09 1.15 -0.26 0.65 -1.34 2.33 -1.98 0.54 0.98 Mining and quarrying 0.45 0.40 45.59 0.45 0.79 -1.54 10.74 -1.61 91.92 -1.53 Construction 0.06 0.06 n.a. 0.06 0.59 -1.73 n.a. -1.73 n.a. -1.73 Electricity and water generation 0.04 0.04 n.a. 0.04 0.77 0.53 n.a. 0.53 n.a. 0.53 Gas extraction and distribution 0.69 0.69 n.a. 0.69 0.77 0.25 n.a. 0.25 n.a. 0.25 Trade 0.41 0.41 n.a. 0.41 0.78 0.56 n.a. 0.56 n.a. 0.56 Transport 0.38 0.30 0.01 0.38 0.62 0.39 1.17 0.40 -0.19 0.52 Health service 0.49 0.49 n.a. 0.49 0.89 0.25 n.a. 0.25 n.a. 0.25 Education service 0.61 0.61 n.a. 0.61 1.01 -0.09 n.a. -0.09 n.a. -0.09 Public administration and defence 0.73 0.62 0.42 0.73 0.97 -0.75 0.52 -0.65 -1.14 -0.48 Bank, insurance and real estate 0.76 0.66 0.13 0.73 0.91 -0.22 0.97 -0.21 -1.16 -0.05 Hotel and restaurant 0.22 0.22 n.a. 0.22 0.66 0.50 n.a. 0.50 n.a. 0.50 Communications 0.80 0.78 0.40 0.67 0.83 -0.03 1.06 -0.02 -0.46 0.00 Information technology 0.77 0.69 0.34 0.77 0.83 -0.20 1.23 0.00 -0.68 0.12 Other services 0.43 0.43 0.05 0.42 0.51 0.23 0.91 0.23 -0.37 0.24

23
The sectoral effects of unilateral trade liberalization are reported in Table 13. Sectoral prices would fall, with the greatest impacts on agricultural products. Imports of agricultural products would increase, and this would result in the contraction of the agricultural sub-sectors. Also, overall industrial and services sectors would contract.
Table 13: Effects on sectoral prices and volumes of Domestic Agricultural Trade Liberalization simulation (% change from the base value)
Note: PD=price of local product (including all taxes and margins); PC=purchaser price of composite commodity (including all taxes and margins); PE_FOB=FOB price of exported commodity; PL=price of local product (excluding all taxes on products); PVA=price of industry value added; O=production; M=import; DD=domestic demand; E=export; Q=composite commodity demand ; RMG=ready-made garments; n.a.=not applicable.Source: Bangladesh CGE model.
Sectors PD PC PE_ FOB PL PVA O M DD E Q
Cereal crop -0.45 -0.57 -0.10 -0.45 -0.48 -0.40 -5.73 -0.40 0.30 -0.14 Commercial crop -0.57 -1.03 -0.08 -0.57 -0.62 -0.72 -1.01 -0.75 0.24 0.17 Livestock rearing -0.36 -0.36 -0.13 -0.36 -0.26 -0.06 -1.00 -0.06 0.40 -0.06 Poultry rearing -0.38 -0.42 -0.12 -0.38 -0.27 -0.16 0.39 -0.16 0.35 -0.07 Shrimp farming and fishing -0.32 -0.33 -0.11 -0.32 -0.30 -0.03 0.66 -0.07 0.35 -0.04 Forestry -0.27 -0.27 n.a. -0.27 -0.31 -0.37 n.a. -0.37 n.a. -0.37 Rice milling -0.43 -0.47 -0.16 -0.44 -0.26 -0.05 -6.73 -0.05 0.49 0.01 Grain milling -0.37 -0.39 -0.14 -0.37 -0.27 -0.06 0.45 -0.07 0.41 -0.04 Food processing -0.31 -0.24 -0.12 -0.31 -0.28 0.04 -0.31 0.03 0.37 -0.11 Leather industry -0.29 -0.28 -0.13 -0.29 -0.24 0.05 0.09 -0.02 0.27 -0.05 Yarn industry -0.85 -0.09 -0.88 -0.85 -0.24 1.82 -0.17 1.84 1.78 0.43 Cloth milling -0.24 -0.20 -0.15 -0.24 -0.24 0.15 -0.05 0.15 0.30 0.07 Woven RMG -0.29 -0.12 -0.22 -0.30 -0.25 0.43 0.07 0.31 0.45 -0.03 Knit RMG -0.55 -0.48 -0.33 -0.58 -0.26 0.61 0.30 0.19 0.65 0.07 Toiletries -0.20 -0.07 -0.10 -0.17 -0.31 0.06 0.12 0.05 0.19 -0.17 Cigarette industry -0.44 -0.43 -0.09 -0.25 -0.30 -0.12 -0.04 -0.13 0.17 -0.14 Furniture industry -0.27 -0.19 -0.14 -0.27 -0.29 0.12 0.11 0.06 0.28 -0.10 Paper, printing, and publishing industry -0.23 -0.07 -0.16 -0.22 -0.28 0.21 0.07 0.20 0.31 -0.09 Pharmaceuticals -0.25 -0.20 -0.09 -0.23 -0.30 -0.07 0.24 -0.08 0.18 -0.15 Fertilizer industry -0.32 -0.05 -0.17 -0.32 -0.31 0.17 0.38 0.05 0.34 -0.44 Petroleum -0.14 -0.02 -0.07 -0.12 -0.34 0.06 0.06 0.04 0.14 -0.16 Chemical industry -0.23 -0.04 -0.15 -0.22 -0.30 0.18 0.06 0.16 0.30 -0.18 Glass industry -0.24 -0.18 -0.10 -0.24 -0.29 -0.05 0.21 -0.07 0.19 -0.20 Earth-ware and clay industry -0.27 -0.24 -0.04 -0.26 -0.29 -0.30 0.26 -0.30 0.09 -0.37 Cement -0.26 -0.24 0.08 -0.25 -0.31 -0.76 0.33 -0.76 -0.17 -0.79 Metal -0.25 -0.22 -0.01 -0.25 -0.28 -0.40 0.21 -0.42 0.02 -0.49 Miscellaneous industry -0.34 -0.11 -0.15 -0.34 -0.27 0.04 0.17 -0.05 0.29 -0.46 Mining and quarrying -0.28 -0.28 -0.01 -0.28 -0.34 -0.47 0.23 -0.47 0.02 -0.48 Construction -0.24 -0.24 n.a. -0.24 -0.25 -0.62 n.a. -0.62 n.a. -0.62 Electricity and water generation -0.29 -0.29 n.a -0.27 -0.34 -0.10 n.a -0.10 n.a -0.10 Gas extraction and distribution -0.33 -0.33 n.a. -0.33 -0.34 -0.05 n.a. -0.05 n.a. -0.05 Trade -0.27 -0.27 n.a. -0.27 -0.30 -0.04 n.a. -0.04 n.a. -0.04 Transport -0.24 -0.21 -0.11 -0.24 -0.26 0.01 0.11 0.00 0.22 -0.06 Health service -0.29 -0.29 n.a. -0.29 -0.35 -0.02 n.a. -0.02 n.a. -0.02 Education service -0.31 -0.31 n.a. -0.31 -0.36 0.10 n.a. 0.10 n.a. 0.10 Public administration and defence -0.33 -0.28 -0.23 -0.33 -0.35 0.33 0.04 0.29 0.46 0.22 Bank, insurance and real estate -0.33 -0.28 -0.11 -0.32 -0.35 -0.11 0.20 -0.12 0.22 -0.19 Hotel and restaurant -0.38 -0.38 n.a. -0.38 -0.26 -0.02 n.a. -0.02 n.a. -0.02 Communications -0.38 -0.37 -0.13 -0.32 -0.33 -0.04 0.16 -0.05 0.26 -0.06 Information technology -0.36 -0.33 -0.17 -0.36 -0.33 0.12 0.24 0.02 0.34 -0.03 Other services -0.23 -0.23 -0.06 -0.22 -0.22 -0.14 0.12 -0.14 0.12 -0.15

24
Due to an increased subsidy in the agricultural sector, prices of agricultural commodities would fall and a very small effect on the prices of industrial and services sub-sectors would be observed (Table 14). The prices of value added would be increased most for the agricultural sub-sectors. Production in agricultural sub-sectors would increase, while some industrial and services sub-sectors would contract.
Table 14: Effects on sectoral prices and volumes of Agricultural Subsidy Policy simulation (% change from base value)
Note: PD=price of local product (including all taxes and margins); PC=purchaser price of composite commodity (including all taxes and margins); PE_FOB=FOB price of exported commodity; PL=price of local product (excluding all taxes on products); PVA=price of industry value added; O=production; M = import; DD=domestic demand; E=export; Q=composite commodity demand; RMG=ready-made garments; n.a.=not applicable.Source: Bangladesh CGE model.
Sectors PD PC PE_ FOB PL PVA O M DD E Q
Cereal crop -0.28 -0.28 -0.06 -0.01 0.13 0.27 0.26 0.27 0.17 0.27 Commercial crop -0.14 -0.16 0.02 0.07 0.17 0.05 0.20 0.05 -0.06 0.09 Livestock rearing -0.06 -0.06 -0.04 -0.06 -0.01 0.07 -0.04 0.07 0.11 0.07 Poultry rearing -0.09 -0.09 -0.05 -0.09 -0.01 0.08 -0.09 0.08 0.15 0.08 Shrimp farming and fishing -0.28 -0.28 -0.08 -0.11 0.00 0.17 -0.06 0.16 0.23 0.16 Forestry -0.03 -0.03 n.a. -0.01 -0.02 -0.19 n.a. -0.19 n.a. -0.19 Rice milling -0.32 -0.32 -0.12 -0.16 -0.01 0.29 -0.03 0.29 0.37 0.29 Grain milling -0.24 -0.24 -0.09 -0.11 0.00 0.23 0.01 0.23 0.27 0.23 Food processing -0.03 -0.02 -0.03 -0.03 0.00 0.10 0.04 0.10 0.10 0.08 Leather industry -0.01 -0.01 -0.02 -0.01 -0.01 0.04 0.04 0.05 0.03 0.05 Yarn industry -0.13 -0.01 -0.12 -0.12 0.00 0.25 0.02 0.25 0.25 0.04 Cloth milling -0.01 0.00 -0.01 -0.01 0.00 0.04 0.03 0.04 0.02 0.03 Woven RMG 0.00 0.00 0.00 0.00 0.00 0.00 0.02 0.01 0.00 0.02 Knit RMG -0.02 -0.02 -0.03 -0.02 0.00 0.05 0.03 0.06 0.05 0.06 Toiletries 0.00 0.00 -0.01 0.00 -0.01 0.03 0.03 0.03 0.02 0.03 Cigarette industry -0.01 -0.01 -0.02 -0.01 -0.01 0.06 0.05 0.06 0.04 0.06 Furniture industry -0.01 -0.01 -0.01 -0.01 -0.01 0.01 -0.01 0.01 0.01 0.00 Paper, printing, and publishing industry 0.00 0.00 -0.02 0.00 -0.01 0.05 0.05 0.05 0.03 0.05 Pharmaceuticals -0.01 -0.01 -0.02 -0.01 -0.01 0.06 0.04 0.06 0.04 0.06 Fertilizer industry 0.02 0.00 -0.04 0.02 -0.01 0.13 0.20 0.17 0.07 0.20 Petroleum 0.00 0.00 -0.01 0.00 -0.02 0.02 0.02 0.02 0.01 0.02 Chemical industry 0.00 0.00 0.01 0.00 -0.01 -0.05 -0.06 -0.05 -0.02 -0.06 Glass industry -0.01 0.00 0.00 0.00 -0.01 0.00 -0.01 0.00 0.00 0.00 Earth-ware and clay industry -0.01 -0.01 0.04 -0.01 -0.01 -0.17 -0.18 -0.17 -0.08 -0.17 Cement 0.00 0.00 0.13 0.00 -0.01 -0.51 -0.52 -0.51 -0.27 -0.51 Metal -0.01 -0.01 0.08 -0.01 -0.01 -0.31 -0.33 -0.32 -0.16 -0.32 Miscellaneous industry -0.02 -0.01 0.02 -0.02 0.00 -0.11 -0.17 -0.13 -0.04 -0.16 Mining and quarrying -0.01 -0.01 0.08 -0.01 -0.01 -0.30 -0.31 -0.30 -0.15 -0.30 Construction -0.01 -0.01 n.a. -0.01 -0.01 -0.39 n.a. -0.39 n.a. -0.39 Electricity and wate r generation -0.01 -0.01 n.a. -0.01 -0.01 0.04 n.a. 0.04 n.a. 0.04 Gas extraction and distribution -0.01 -0.01 n.a. -0.01 -0.02 0.04 n.a. 0.04 n.a. 0.04 Trade 0.00 0.00 n.a. 0.00 0.00 0.04 n.a. 0.04 n.a. 0.04 Transport 0.00 0.00 -0.01 0.00 0.00 0.04 0.03 0.04 0.03 0.04 Health service 0.00 0.00 n.a. 0.00 0.00 0.04 n.a. 0.04 n.a. 0.04 Education service 0.01 0.01 n.a. 0.01 0.02 0.02 n.a. 0.02 n.a. 0.02 Public administration and defence 0.01 0.01 0.00 0.01 0.02 -0.01 0.00 0.00 -0.01 0.00 Bank, insurance and real estate 0.00 0.00 0.01 0.00 0.01 -0.05 -0.05 -0.05 -0.03 -0.05 Hotel and restaurant -0.07 -0.07 n.a. -0.07 0.00 0.09 n.a. 0.09 n.a. 0.09 Communications 0.00 0.00 0.00 0.00 0.00 -0.02 -0.02 -0.02 -0.01 -0.02 Information technology 0.00 0.00 -0.01 0.00 0.00 0.02 0.02 0.02 0.01 0.02 Other services -0.01 -0.01 -0.01 -0.01 -0.01 0.01 0.00 0.01 0.01 0.01

25
The rise in the productivity of the cereal crop sub-sector would reduce the domestic prices of most of the agricultural and food products and would raise the prices of industrial and services products because of reallocation of demand (Table 15). The largest fall in the domestic price would be observed for the cereal crop sub-sector, which would also lead to a fall in the domestic price of rice milling by a large margin. The cereal crop sub-sector would experience the largest expansion. Also, other agricultural sub-sectors and food sub-sectors such as rice and grain milling would experience an expansion. Imports will fall in all these sub-sectors. The industrial and services sub-sectors would experience some expansion.
Table 15: Effects on sectoral prices and volumes of agricultural productivity simulation (% change from base value)
Note: PD=price of local product (including all taxes and margins); PC=purchaser price of composite commodity (including all taxes and margins); PE_FOB=FOB price of exported commodity; PL=price of local product (excluding all taxes on products); PVA=price of industry value added; O=production; M=import; DD=domestic demand; E=export; Q=composite commodity demand; RMG=ready-made garments; n.a.=not applicable.Source: Bangladesh CGE model.
Sectors PD PC PE_ FOB PL PVA O M DD E Q
Cereal crop -7.56 -7.23 -3.84 -7.64 -10.77 3.73 -11.51 3.73 12.45 2.95 Commercial crop -1.54 -1.22 -0.86 -1.56 -2.51 1.21 -1.96 1.17 2.62 0.48 Livestock rearing -0.79 -0.79 -0.39 -0.79 0.21 0.36 -1.22 0.36 1.17 0.36 Poultry rearing -1.62 -1.61 -0.76 -1.62 0.22 0.57 -2.66 0.57 2.33 0.55 Shrimp farming and fishing 0.15 0.15 0.09 0.15 0.20 -0.14 0.17 -0.13 -0.26 -0.13 Forestry 0.19 0.19 n.a 0.19 0.27 -0.21 n.a. -0.21 n.a. -0.21 Rice milling -4.07 -4.03 -2.23 -4.10 0.18 2.96 -5.31 2.96 7.01 2.85 Grain milling -2.72 -2.72 -1.48 -2.73 0.17 1.92 -3.58 1.92 4.57 1.91 Food processing -0.03 -0.03 0.00 -0.03 0.19 -0.05 -0.12 -0.06 0.00 -0.07 Leather industry 0.02 0.02 0.04 0.02 0.17 -0.09 -0.06 -0.10 -0.07 -0.09 Yarn industry -0.97 -0.10 -0.88 -0.97 0.13 1.69 -0.14 1.62 1.78 0.01 Cloth milling 0.07 0.06 0.08 0.07 0.13 -0.19 -0.07 -0.19 -0.17 -0.17 Woven RMG 0.13 0.05 0.12 0.13 0.15 -0.23 0.01 -0.22 -0.24 -0.07 Knit RMG -0.13 -0.12 -0.07 -0.14 0.16 0.14 -0.23 0.02 0.15 -0.01 Toiletries 0.11 0.04 0.10 0.10 0.23 -0.20 -0.03 -0.20 -0.20 -0.08 Cigarette industry 0.16 0.16 0.09 0.09 0.23 -0.18 -0.02 -0.18 -0.19 -0.18 Furniture industry 0.14 0.10 0.14 0.14 0.21 -0.26 -0.01 -0.26 -0.27 -0.18 Paper, printing, and publishing industry 0.14 0.04 0.06 0.14 0.20 -0.01 0.25 0.00 -0.13 0.18 Pharmaceuticals 0.09 0.08 0.08 0.09 0.22 -0.16 0.00 -0.15 -0.16 -0.13 Fertilizer industry 0.49 0.07 -0.27 0.49 0.25 1.36 2.85 1.94 0.55 2.71 Petroleum 0.09 0.01 0.03 0.08 0.29 0.01 0.17 0.02 -0.07 0.15 Chemical industry 0.14 0.02 0.12 0.14 0.22 -0.22 0.03 -0.22 -0.24 -0.01 Glass industry 0.16 0.12 0.14 0.16 0.20 -0.26 0.03 -0.26 -0.28 -0.17 Earth-ware and clay industry 0.19 0.16 0.16 0.18 0.22 -0.27 0.06 -0.27 -0.31 -0.22 Cement 0.16 0.15 0.18 0.15 0.25 -0.40 -0.13 -0.40 -0.36 -0.38 Metal 0.15 0.13 0.13 0.15 0.19 -0.22 0.05 -0.22 -0.26 -0.18 Miscellaneous industry 0.05 0.02 0.05 0.05 0.17 -0.11 -0.02 -0.11 -0.11 -0.04 Mining and quarrying 0.20 0.20 0.16 0.20 0.26 -0.25 0.10 -0.25 -0.32 -0.25 Construction 0.16 0.16 n.a. 0.16 0.19 -0.28 n.a. -0.28 n.a. -0.28 Electricity and water generation 0.22 0.22 n.a. 0.21 0.27 -0.04 n.a. -0.04 n.a. -0.04 Gas extraction and distribution 0.27 0.27 n.a. 0.27 0.28 -0.19 n.a. -0.19 n.a. -0.19 Trade 0.14 0.14 n.a. 0.14 0.16 0.63 n.a. 0.63 n.a. 0.63 Transport 0.15 0.13 -0.05 0.15 0.18 0.41 0.66 0.41 0.10 0.45 Health service 0.17 0.17 n.a. 0.17 0.20 -0.02 n.a. -0.02 n.a. -0.02 Education service 0.13 0.13 n.a. 0.13 0.13 -0.16 n.a. -0.16 n.a. -0.16 Public administration and defence 0.11 0.10 0.08 0.11 0.13 -0.12 0.07 -0.11 -0.16 -0.08 Bank, insurance and real estate 0.14 0.12 0.03 0.14 0.18 0.12 0.34 0.12 -0.05 0.15 Hotel and restaurant -0.76 -0.76 n.a. -0.76 0.15 0.37 n.a. 0.37 n.a. 0.37 Communications 0.22 0.21 0.10 0.18 0.20 -0.06 0.24 -0.06 -0.20 -0.05 Information technology 0.20 0.18 0.14 0.20 0.20 -0.22 0.12 -0.19 -0.28 -0.16 Other services 0.17 0.17 0.09 0.17 0.17 -0.06 0.21 -0.05 -0.18 -0.05
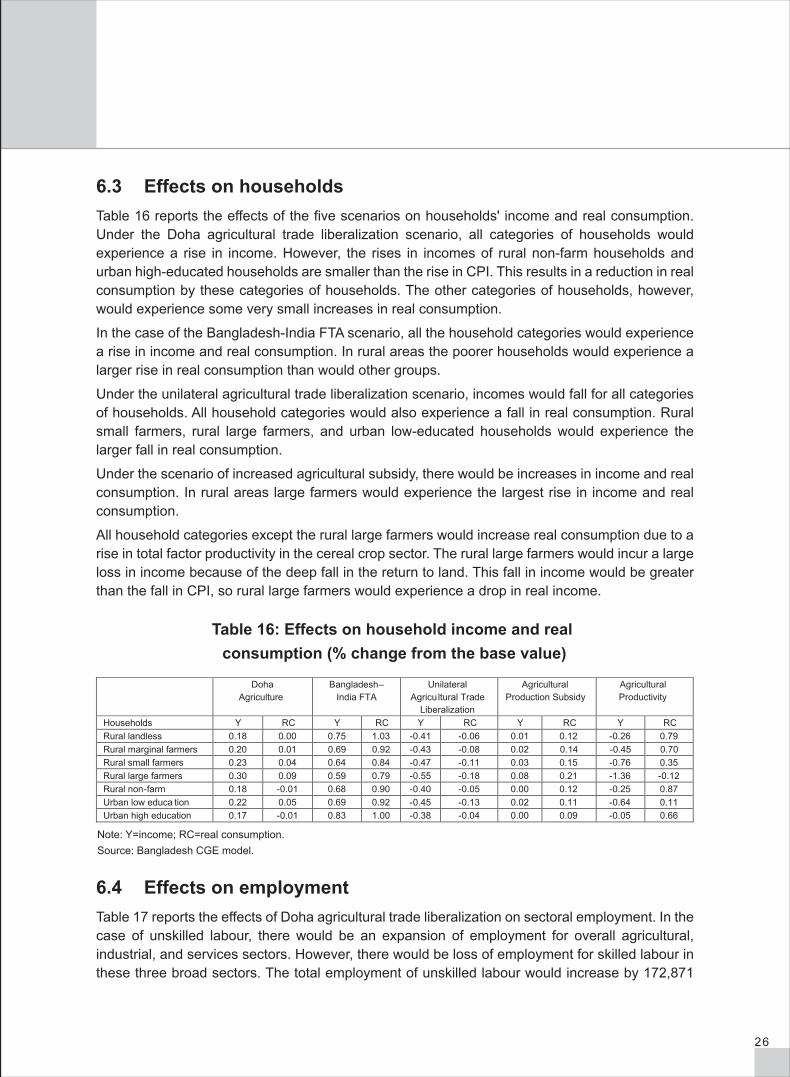
26
6.3 Effects on householdsTable 16 reports the effects of the five scenarios on households' income and real consumption. Under the Doha agricultural trade liberalization scenario, all categories of households would experience a rise in income. However, the rises in incomes of rural non-farm households and urban high-educated households are smaller than the rise in CPI. This results in a reduction in real consumption by these categories of households. The other categories of households, however, would experience some very small increases in real consumption.
In the case of the Bangladesh-India FTA scenario, all the household categories would experience a rise in income and real consumption. In rural areas the poorer households would experience a larger rise in real consumption than would other groups.
Under the unilateral agricultural trade liberalization scenario, incomes would fall for all categories of households. All household categories would also experience a fall in real consumption. Rural small farmers, rural large farmers, and urban low-educated households would experience the larger fall in real consumption.
Under the scenario of increased agricultural subsidy, there would be increases in income and real consumption. In rural areas large farmers would experience the largest rise in income and real consumption.
All household categories except the rural large farmers would increase real consumption due to a rise in total factor productivity in the cereal crop sector. The rural large farmers would incur a large loss in income because of the deep fall in the return to land. This fall in income would be greater than the fall in CPI, so rural large farmers would experience a drop in real income.
Table 16: Effects on household income and real consumption (% change from the base value)
Note: Y=income; RC=real consumption. Source: Bangladesh CGE model.
Doha Agriculture
Bangladesh– India FTA
Unilateral Agricultural Trade
Liberalization
Agricultural Production Subsidy
Agricultural Productivity
Households Y RC Y RC Y RC Y RC Y RC Rural landless 0.18 0.00 0.75 1.03 -0.41 -0.06 0.01 0.12 -0.26 0.79 Rural marginal farmers 0.20 0.01 0.69 0.92 -0.43 -0.08 0.02 0.14 -0.45 0.70 Rural small farmers 0.23 0.04 0.64 0.84 -0.47 -0.11 0.03 0.15 -0.76 0.35 Rural large farmers 0.30 0.09 0.59 0.79 -0.55 -0.18 0.08 0.21 -1.36 -0.12 Rural non-farm 0.18 -0.01 0.68 0.90 -0.40 -0.05 0.00 0.12 -0.25 0.87 Urban low educa tion 0.22 0.05 0.69 0.92 -0.45 -0.13 0.02 0.11 -0.64 0.11 Urban high education 0.17 -0.01 0.83 1.00 -0.38 -0.04 0.00 0.09 -0.05 0.66
6.4 Effects on employmentTable 17 reports the effects of Doha agricultural trade liberalization on sectoral employment. In the case of unskilled labour, there would be an expansion of employment for overall agricultural, industrial, and services sectors. However, there would be loss of employment for skilled labour in these three broad sectors. The total employment of unskilled labour would increase by 172,871

27
(0.39 per cent), while total employment of skilled labour would decline by 6,299 (0.19 per cent). The major employment-generating sub-sectors for unskilled labour would be cereal crop and commercial crop. In contrast, some of the leading export-oriented manufacturing industries, such as woven and knit ready-made garments and leather, would experience falls in employment of unskilled labour. Employment of skilled labour would decline in most of the sub-sectors.
Table 17: Effects on employment of Doha Agriculture simulation
Note: UL=unskilled labour; SL=skilled labour.Source: Bangladesh CGE model and employment satellite matrix.
Sectors Change in number % change from base value
UL SL UL SL Cereal crop sectors 106 633 46 0.81 0.50 Commercial crops 26 215 8 0.81 0.50 Livestock rearing 3 170 -554 0.15 -0.16 Poultry rearing 2 067 -419 0.13 -0.18 Fishing 2 483 -68 0.26 -0.05 Forestry 1 044 -47 0.25 -0.06 Rice milling 243 -1 0.10 -0.21 Grain milling 8 -9 0.08 -0.23 Food processing 598 -14 0.24 -0.06 Leather industry -111 -30 -0.12 -0.43 Yarn -316 -54 -0.51 -0.82 Cloth milling 296 -62 0.05 -0.26 Woven ready-made garments -1 486 -471 -0.15 -0.45 Knitting -196 -25 -0.21 -0.52 Toiletries 10 -5 0.07 -0.24 Cigarette industry 223 -9 0.18 -0.13 Furniture industry 6 733 77 0.71 0.40 Paper, printing, and publishing industry 77 -63 0.09 -0.22 Pharmaceuticals 74 -16 0.14 -0.17 Fertilizer industry 55 -17 0.14 -0.17 Petroleum 6 -6 0.08 -0.23 Chemical industry 232 -14 0.20 -0.10 Glass industry 7 -5 0.12 -0.19 Earth-ware and clay industry 428 -4 0.18 -0.13 Cement 95 -2 0.26 -0.05 Metal 322 -41 0.17 -0.14 Miscellaneous industry 183 -202 0.03 -0.28 Mining and quarrying 5 -1 0.20 -0.11 Construction 3 359 -55 0.23 -0.08 Electricity and water generation 70 -19 0.14 -0.16 Gas extraction and distribution 6 -6 0.13 -0.18 Wholesale and retail trade 8 880 -131 0.13 -0.18 Transport 3 852 -57 0.12 -0.19 Health service 73 -515 0.12 -0.19 Education service 193 -2 431 0.08 -0.23 Public administration and defence 27 -292 0.00 -0.30 Bank, insurance and real estate 417 -357 0.14 -0.16 Hotel and restaurant 743 -33 0.11 -0.20 Communication 172 -3 0.13 -0.18 Information technology and e-commerce 3 -12 0.06 -0.25 Other services 5 978 -380 0.16 -0.14 Agriculture 141 611 -1 035 0.66 -0.12 Industry 7 486 -973 0.15 -0.26 Services 2 3774 -4 291 0.13 -0.20 Total 172871 -6299 0.39 -0.19

28
In the case of the Bangladesh-India FTA, there would be a rise in total employment for unskilled labour by 325,661 (0.74 per cent) and a loss in employment for skilled labour by 41,828 (1.26 per cent) (Table 18). In the agricultural sectoremployment of unskilled labour would expand in the cereal crop, livestock, and poultry sub-sectors. In the industrial sector major employment-generating sub-sectors would be the woven ready-made garments and furniture sub-sectors.
Table 18: Effects on employment of Bilateral FTA between Bangladesh and India simulation
Note: UL=unskilled labour; SL=skilled labour.Source: Bangladesh CGE model and employment satellite matrix.
Sectors Change in number % change from base value
UL SL UL SL Cereal crop sectors 66 416 -139 0.50 -1.50 Commercial crops -664 -32 -0.02 -2.02 Livestock rearing 22 296 -3 365 1.07 -0.94 Poultry rearing 18 812 -1 947 1.20 -0.82 Fishing 6 276 -2 039 0.67 -1.34 Forestry 217 -1 495 0.05 -1.95 Rice milling 3 105 -3 1.25 -0.77 Grain milling 130 -31 1.23 -0.79 Food processing 1 708 -278 0.69 -1.31 Leather industry 1 634 -18 1.78 -0.25 Yarn 1 715 49 2.79 0.74 Cloth milli ng 565 -455 0.09 -1.91 Woven reday-made garments 47 722 27 38 4.73 2.64 Knitting 4 578 136 4.91 2.82 Toiletries 280 -3 1.87 -0.16 Cigarette industry 1 710 -45 1.41 -0.62 Furniture industry 20 736 29 2.19 0.15 Paper, printing, and publishing industry -3 092 -1 525 -3.45 -5.38 Pharmaceuticals 963 -25 1.76 -0.27 Fertilizer Industry 9 -206 0.02 -1.97 Petroleum -22 -58 -0.29 -2.28 Chemical industry -1 416 -449 -1.25 -3.22 Glass industry 50 -32 0.88 -1.14 Earth-ware and clay industry -114 -61 -0.05 -2.04 Cement -636 -107 -1.71 -3.68 Metal -3 272 -1084 -1.72 -3.68 Miscellaneous industry -4 724 -1 993 -0.77 -2.75 Mining and quarrying -28 -15 -1.04 -3.01 Construction -16 237 -2 195 -1.12 -3.09 Electricity and water generation 494 -115 1.02 -1.00 Gas extraction and distribution 35 -41 0.73 -1.28 Wholesale and retail trade 82 643 -6 10 1.17 -0.84 Transport 32 409 -3 07 0.98 -1.04 Health service 522 -3 182 0.84 -1.17 Education service 1 663 -14 149 0. -1.34 Public administration and defence -191 -1 941 -0.02 -2.02 Bank, insurance and real estate 1 229 -3 426 0.42 -1.58 Hotel and restaurant 7 434 -155 1.07 -0.95 Communication 763 -23 0.56 -1.45 Information technology and e-commerce 17 -77 0.39 -1.61 Other services 29 928 -3 152 0.83 -1.19 Agriculture 113 352 -9 018 0.53 -1.08 Industry 71 601 -34 37 1.46 -0.91 Services 140 708 -29 373 0.79 -1.39 Total 325 661 -41 828 0.74 -1.26

29
Under a unilateral agricultural trade liberalization scenario, there would be a large loss of employment of unskilled labour in the agricultural, industrial, and services sectors (Table 19). However, the employment of skilled labour would increase slightly. The total employment of unskilled labour would fall by 280,386 (0.64 per cent), while that of skilled labour would rise by 346 (0.01 per cent). Greatest job losses for unskilled labour would occur in the cereal crop and commercial crop sub-sectors.
Table 19: Effects on employment of Domestic Agricultural Trade Liberalization simulation
Note: UL=unskilled labour; SL=skilled labour.Source: Bangladesh CGE model and employment satellite matrix.
Sectors Change in number % change from base value
UL SL UL SL Cereal crop sectors -138 874 -70 -1.05 -0.75 Commercial crops -51 132 -20 -1.58 -1.28 Livestock rearing -8 136 -306 -0.39 -0.09 Poultry rearing -7 919 -481 -0.51 -0.20 Fishing -2 905 -3 -0.31 0.00 Forestry -3 241 -355 -0.77 -0.46 Rice milling -811 0 -0.33 -0.02 Grain milling -35 -1 -0.33 -0.02 Food processing -588 14 -0.24 0.07 Leather industry -200 6 -0.22 0.09 Yarn 975 125 1.59 1.90 Cloth milling -513 54 -0.08 0.23 Woven ready-made garments 1 871 511 0.19 0.49 Knitting 335 32 0.36 0.67 Toiletries -36 1 -0.24 0.06 Cigarette industry -5 18 -9 -0.43 -0.12 Furniture industry -1 651 25 -0.17 0.13 Paper, printing, and publishing industry -73 64 -0.08 0.23 Pharmaceuticals -208 -7 -0.38 -0.07 Fertilizer industry -62 15 -0.16 0.15 Petroleum -15 3 -0.20 0.11 Chemical industry -149 24 -0.13 0.17 Glass industry -19 -1 -0.34 -0.04 Earth-ware and clay industry -1 479 -9 -0.61 -0.30 Cement -402 -23 -1.08 -0.78 Metal -1 301 -111 -0.68 -0.38 Miscellaneous industry -1 376 60 -0.22 0.08 Mining and quarrying -20 -2 -0.75 -0.45 Construction -13 244 -431 -0.91 -0.61 Electricity and water generation -183 -8 -0.38 -0.07 Gas extraction and distribution -16 -1 -0.33 -0.03 Wholesale and retail trade -21 028 5 -0.30 0.01 Transport -8 691 13 -0.26 0.04 Health service -183 31 -0.29 0.01 Education service -451 1 312 -0.18 0.12 Public administration and defence 386 342 0.05 0.36 Bank, insurance and real estate -1 129 -176 -0.39 -0.08 Hotel and restaurant -1 848 7 -0.27 0.04 Communication -430 0 -0.32 -0.01 Information technology and e-commerce -7 7 -0.16 0.15 Other services -15 081 -293 -0.42 -0.11 Agriculture -212 207 -1 234 -0.99 -0.15 Industry -6 274 773 -0.13 0.21 Services -61 905 808 -0.35 0.04 Total -280 386 346 -0.64 0.01

30
Under the scenario of increased agricultural subsidy (Table 20), there would be a rise in overall employment of unskilled labour by 69,129 (0.16 per cent) because of greater employment generation in the agricultural sectors. In the industrial and services sectors, there would be a small loss of jobs. Employment of skilled labour would decrease slightly - by 494 (0.01 per cent). Employment of unskilled labour would increase in the major agricultural sub-sectors.
Table 20: Effects on employment of Agricultural Subsidy Policy simulation
Note: UL=unskilled labour; SL=skilled labour.Source: Bangladesh CGE model and employment satellite matrix.
Sectors Change in number % change from base value
UL SL UL SL Cereal crop sectors 60 401 40 0.46 0.44 Commercial crops 9 830 4 0.30 0.28 Livestock rearing 1 027 97 0.05 0.03 Poultry rearing 937 90 0.06 0.04 Fishing 1 425 195 0.15 0.13 Forestry -922 -185 -0.22 -0.24 Rice milling 687 1 0.28 0.25 Grain milling 23 8 0.21 0.19 Food processing 197 12 0.08 0.06 Leather industry 26 0 0.03 0.01 Yarn 150 15 0.24 0.22 Cloth milling 195 2 0.03 0.01 Woven ready-made garments -61 -29 -0.01 -0.03 Knitting 39 1 0.04 0.02 Toiletries 1 0 0.00 -0.02 Cigarette industry 43 1 0.04 0.01 Furniture industry -119 -7 -0.01 -0.03 Paper, printing, and publishing industry 28 3 0.03 0.01 Pharmaceuticals 19 1 0.03 0.01 Fertilizer industry 37 8 0.10 0.07 Petroleum -2 -1 -0.02 -0.05 Chemical industry -83 -13 -0.07 -0.10 Glass industry -1 -1 -0.02 -0.04 Earth-ware and clay industry -464 -6 -0.19 -0.21 Cement -201 -16 -0.54 -0.56 Metal -628 -104 -0.33 -0.35 Miscellaneous industry -747 -104 -0.12 -0.14 Mining and quarrying -9 -2 -0.33 -0.36 Construction -5 981 -308 -0.41 -0.43 Electricity and water generation -1 -3 0.00 -0.02 Gas extraction and distribution 0 -1 0.00 -0.02 Wholesale and retail trade 2 295 7 0.03 0.01 Transport 836 1 0.03 0.00 Health service 17 14 0.03 0.01 Education service 67 53 0.03 0.01 Public administration and defence 7 -21 0.00 -0.02 Bank, insurance and real estate -171 -175 -0.06 -0.08 Hotel and restaurant 551 9 0.08 0.06 Communication -45 -1 -0.03 -0.06
0 -1 0.00 -0.02 Other services -2 74 -79 -0.01 -0.03 Agriculture 72 697 242 0.34 0.03 Industry -870 -233 -0.02 -0.06 Services -2 697 -503 -0.02 -0.02 Total 69 129 -494 0.16 -0.01
Information technology and e-commerce

31
A rise in productivity in the cereal crop sub-sector would lead to a fall in employment of unskilled labour (Table 21). The employment losses in the cereal and commercial crop sub-sectors would be very large. Therefore, although employment would increase in the industrial and services sectors, the net employment effect for unskilled labour would be negative; the overall employment of unskilled labour would fall by 1,045,770 (2.38 per cent). However, there would be a net positive effect – although much smaller – on the employment of skilled labour, by 4,420 (0.13 per cent).
Table 21: Effects on employment of Agricultural Productivity simulation
Note: UL=unskilled labour; SL=skilled labour.Source: Bangladesh CGE model and employment satellite matrix.
Sectors Change in number % change from base value UL SL UL SL
Cereal crop sectors -1 094 406 -777 -8.31 -8.38 Commercial crops -83 801 -42 -2.59 -2.66 Livestock rearing 13 727 2 074 0.66 0.58 Poultry rearing 13 955 1 943 0.89 0.81 Fishing 1 102 58 0.12 0.04 Forestry 717 70 0.17 0.09 Rice milling 7 984 14 3.21 3.13 Grain milling 228 81 2.15 2.07 Food processing 473 24 0.19 0.11 Leather industry 129 4 0.14 0.06 Yarn 1 140 117 1.86 1.78 Cloth milling -218 -27 -0.03 -0.11 Woven rady-made garments -370 -119 -0.04 -0.12 Knitting 312 12 0.33 0.26 Toiletries 15 0 0.10 0.02 Cigarette industry 140 3 0.11 0.04 Furniture industry 161 -12 0.02 -0.06 Paper, printing, and publishing industry 234 52 0.26 0.18 Pharmaceuticals 79 6 0.14 0.07 Fertilizer industry 659 171 1.71 1.63 Petroleum 28 8 0.38 0.30 Chemical industry 87 0 0.08 0.00 Glass industry 1 -2 0.01 -0.07 Earth-ware and clay industry 66 -2 0.03 -0.05 Cement -25 -4 -0.07 -0.15 Metal 61 -14 0.03 -0.05 Miscellaneous industry 719 28 0.12 0.04 Mining and quarrying 2 0 0.07 -0.01 Construction -241 -67 -0.02 -0.10 Electricity and water generation 149 26 0.31 0.23 Gas extraction and distribution 8 3 0.17 0.09 Wholesale and retail trade 57 535 533 0.82 0.74 Transport 21 381 167 0.64 0.57 Health service 140 402 0.23 0.15 Education service -77 -1 159 -0.03 -0.11 Public administration and defence 142 -58 0.02 -0.06 Bank, insurance and real estate 946 532 0.32 0.25 Hotel and restaurant 3 908 79 0.56 0.48 Communication 240 2 0.18 0.10 Information technology and e-commerce 1 -3 0.02 -0.05 Other services 6 900 297 0.19 0.11 Agriculture -1 148 706 3 326 -5.36 0.40 Industry 11 904 340 0.24 0.09 Services 91 032 754 0.51 0.04 Total -1 045 770 4 420 -2.38 0.13

32
This study considers several scenarios for economic reforms at the global, regional, and domestic levels that have important implications for the agricultural sector and the overall economy of Bangladesh. The scenarios are related to global agricultural trade liberalization under a potential WTO Doha agreement, a bilateral FTA between Bangladesh and India, unilateral agricultural trade liberalization, an agricultural production subsidy policy, and growth in agricultural productivity.
Global agricultural trade liberalization under a WTO−Doha agreement would lead to a rise in prices of agricultural products in the global market as well as in the domestic market. As a result there will be some positive effects on the sectoral production and employment in the agricultural sector in Bangladesh. In particular, the cereal crop sub-sector would expand, and also this sector would generate significant new employment of unskilled labour. However, this scenario could also raise some concerns for the households that are net consumers and therefore likely to be adversely affected by the rise in food prices.
The policy implication that emerges from the global agricultural trade liberalization scenario is that government would have to facilitate the smooth marketing operations of agricultural products in the market so that the farmers, not the middlemen, receive the maximum benefits of higher prices on their produces. Therefore, enforcing competition policy and laws would be very important. At the same time, the government’s safety net programme should address the problem of poorer households, which are likely to be burdened by high food prices. This study finds that the rural non-farm households, a significant part of which are poor, would experience a fall in real consumption. This is because rural non-farm households are not food producers, and they rely completely on the market for cereal crops and other agricultural food. Therefore, any price hike that would not be sufficiently counteracted by a rise in incomes would lead to declines in real consumption in these households. Bangladesh, being a net food-importing country, should negotiate at the WTO for some compensatory measures.
A Bangladesh-India bilateral FTA would result in limited expansion in the agricultural sectors. There would be expansion of the export-oriented manufacturing sectors. Although most of the import-competing sectors would contract, the expansion of the agricultural and export-oriented sectors would be enough larger enough to produce net employment generation. The government needs to take into consideration sectoral effects when perusing any bilateral FTA deal with any country. It is very important to identify clearly which sectors are likely to gain and which are likely to lose. For the sake of losing sectors, policy-makers may want to consider a strategic and slower pace of trade liberalization. Also, these sectors could receive temporary fiscal support.
Domestic agricultural trade liberalization would increase imports of agricultural products. This would result in the contraction of the agricultural sectors. Overall, industrial and services sectors would contract also. There would be a large employment loss for unskilled labour, especially in the cereal crop, commercial crops, livestock rearing, poultry rearing, and fishing sub-sectors. Therefore, in the case of domestic agricultural trade liberalization, the governmentwould need to be careful. The agenda of agricultural trade liberalization needs to be consistent with the broad agenda of trade liberalization in other sectors of the economy. The major protected sub-sectors in agriculture are poultry and fishing. These two sectors have, in fact, grown over the last decade under significant trade protection. Any trade liberalization agenda for these sectors would need to be designed strategically.
7. POLICY IMPLICATIONS

33
A rise in subsidies to agricultural sectors would increase production in these sectors, while some industrial and services sectors would contract. Overall employment of unskilled labour would increase because of greater employment generation in the agricultural sectors and lesser loss in employment in the industrial and services sectors. Jobs for skilled labour would be lost, however. A rise in subsidies to agricultural sectors would also provide extra incentives for investing in agriculture. However, it should also be kept in mind that such subsidies put a heavy burden on government’s exchequer. Therefore, phased reduction of such subsidies would be warranted. To be effective, such subsidies need to be used judiciously. Subsidies in Bangladesh are often wrongly targeted, and therefore the actual objective of the subsidies is not achieved. Enhancing agricultural productivity, improving marketing opportunities, and ensuring effective implementation of competition policies and laws also can encourage producers to increase agricultural production, and at less cost to the government.
Finally, a rise in total factor productivity in the cereal crop sector would lead to a great expansion of that sub-sector. Rice milling and grain milling would expand as well. Imports would fall in all these sectors. The industrial and services sectors would expand somewhat. Overall, the agricultural sector would experience a large loss of jobs for unskilled labour. Therefore, even though employment would increase in the overall industrial and services sectors, the net employment effect on unskilled labour would be negative. However, there would be a net positive effect on the employment of skilled labour. It appears that a rise in total factor productivity in the cereal crop sector would cost jobs in the agricultural sector but increase jobs in other sectors. Therefore, it is very important that, while investing in agricultural research to raise agricultural productivity, the policy-makers take measures to promote industrialization to absorb the labour released from the agricultural sectors. Promotion of rural non-farm productive activities can be very useful for the absorption of labour released from the crop sector.

34
REFERENCES
Alarcon, J.V. 2002. Social accounting matrix-based modelling: extension to wellbeing and environment and computable general equilibrium models: applications using the 1975 and 1980 Ecuador and Bolivian 1989 and 1997 SAMs (The Hague, Institute of Social Studies).Andreessen, W.; Gilled, K.; Juggins, J.; Loffler, H.; Oosterveer, P.; Woodhill, J. 2007. The role of agriculture in achieving MDG1: an expert survey, (Wageningen, The Netherlands, Wageningen International).Beghin, J.C.; Roland-Holst, D.; van der Mensbrugghe, D. 2002. Global agricultural trade and the Doha Round: What are the implications for North and South?, Center for Agriculture and Rural Development Working Paper 02-WP 308, (Ames, Iowa, USA, Iowa State University).Diao X.; Somwaru, A.; Roe, T. 2001. A global analysis of agricultural trade reform in WTO member countries, Economic Development Center Paper, (St. Paul, Minnesota, USA, University of Minnesota).Dimaranan, B.V.; Hertel, T.; Keeney, R. 2003. OECD domestic support and the developing countries, GTAP Working Paper 19 (West Lafayette, Indiana, USA, Purdue University).Dimanaran, B.V.; McDougall, R.A. 2002. Global trade and assistance and protection: the GTAP 5 database, Centre for Global Trade Analysis, (West Lafayette, Indiana, USA, Purdue University).Elbehri, A.; Leetmaa, S. 2002. “How significant are export subsidies to agricultural trade? Trade and welfare implications of global reforms”, presented at 5th Annual Conference on Global Economic Analysis, June 5-7, Taipei.François, J.; van Meijl, H.; van Tongeren, F. 2003. Trade liberalization and developing countries under the Doha Round, Tinbergen Institute Discussion Paper 2003–060/2 (Rotterdam, University of Rotterdam).Harrison, W.J.; Pearson, K.R. 1996. “Computing solutions for large general equilibrium models using GemPACK,” in Computational Economics, Vol. 9, No. 2, pp. 83-127.Hertel, T.; Anderson, K.; Francois, J.; Martin, W. 2000. Agriculture and non-agricultural liberalization in the Millennium round, Centre for International Economic Studies (CIES) Policy Discussion Paper 0016, (Adelaide, Australia, University of Adelaide).Hertel, T.W. (ed.). 1997. Global trade analysis: modeling and applications (Cambridge: Cambridge University Press).Martin, W.; Winters, L.A. 1996. “The Uruguay Round: a milestone for developing countries”, in W. Martin and L.A. Winters (eds.): The Uruguay Round and the developing countries (Cambridge: Cambridge University Press).Naik, G. 2005. “Tackling agricultural subsidies in WTO negotiations”, in South Asian Yearbook of Trade and Development 2005 (New Delhi, Centre for Trade and Development). Raihan, S. 2007. Dynamics of trade liberalization in Bangladesh: analyses of policies and practices. (Dhaka, Pathak Samabesh).van Meijl, J.; van Tongeren, F. 2001. Multilateral trade liberalization and developing countries: a North–South perspective on agriculture and processing sectors, Report 6.01.07 (The Hague, Economics Research Institute).World Bank. 2008. World Development Report 2008 (Washington, DC).World Trade Organization (WTO). 2001. Doha ministerial declaration (Geneva).—. 2005. Hong Kong ministerial declaration (Geneva).
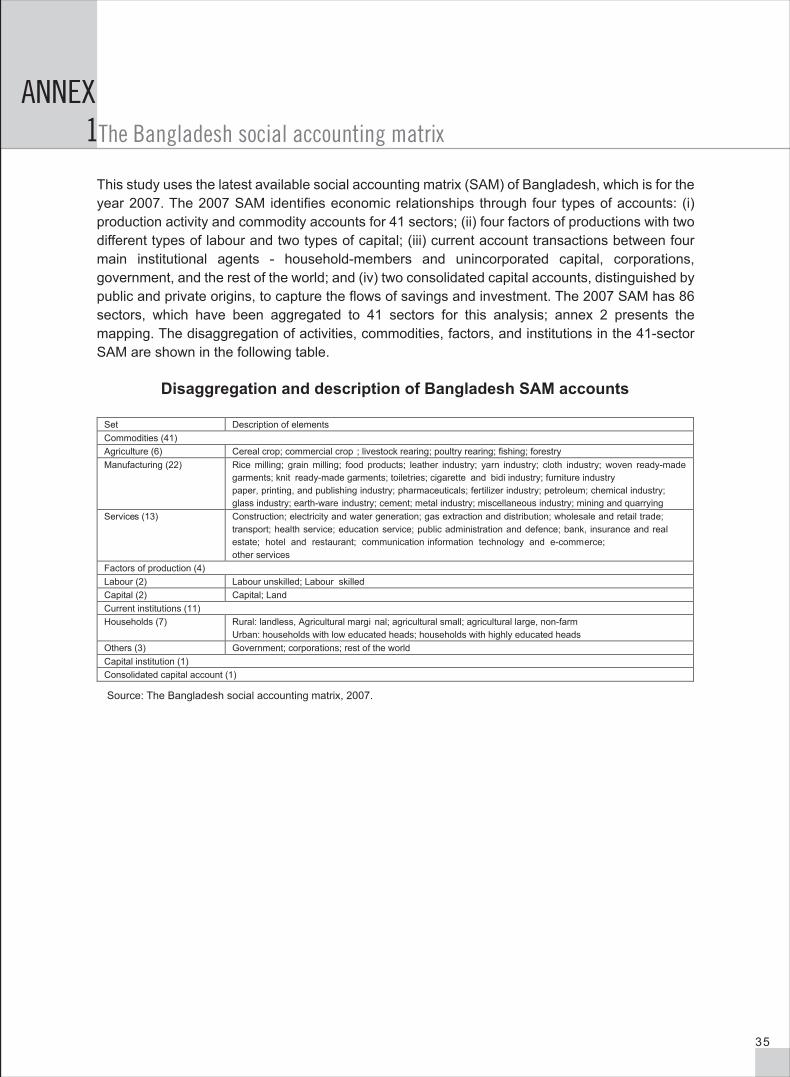
35
The Bangladesh social accounting matrix
This study uses the latest available social accounting matrix (SAM) of Bangladesh, which is for the year 2007. The 2007 SAM identifies economic relationships through four types of accounts: (i) production activity and commodity accounts for 41 sectors; (ii) four factors of productions with two different types of labour and two types of capital; (iii) current account transactions between four main institutional agents - household-members and unincorporated capital, corporations, government, and the rest of the world; and (iv) two consolidated capital accounts, distinguished by public and private origins, to capture the flows of savings and investment. The 2007 SAM has 86 sectors, which have been aggregated to 41 sectors for this analysis; annex 2 presents the mapping. The disaggregation of activities, commodities, factors, and institutions in the 41-sector SAM are shown in the following table.
Disaggregation and description of Bangladesh SAM accounts
Set Description of elements Commodities (41) Agriculture (6) Cereal crop; commercial crop ; livestock rearing; poultry rearing; fishing; forestry Manufacturing (22) Rice milling; grain milling; food products; leather industry; yarn industry; cloth industry; woven ready-made
garments; knit ready-made ga rments; toiletries; cigarette and bidi industry; furniture industry paper, printing, and publishing industry; pharmaceuticals; fertilizer industry; petroleum; chemical industry; glass industry; earth-ware industry; cement; metal industry; miscellaneous industry; mining and quarrying
Services (13) Construction; electricity and water generation; gas extraction and distribution; wholesale and retail trade; transport; health service; education service; public administration and defence; bank, insurance and real estate; hotel and restaurant; communication information technology and e-comm erce;other services
Factors of production (4) Labour (2) Labour unskilled; Labour skilled Capital (2) Capital; Land Current institutions (11) Households (7) Rural: landless, Agricultural margi nal; agricultural small; agricultural large, non-farm
Urban: households with low educated heads; households with highly educated heads Others (3) Government; corporations; rest of the world Capital institution (1) Consolidated capital account (1)
Source: The Bangladesh social accounting matrix, 2007.
ANNEX 1

36
Mapping and classification scheme in the social accounting matrix of Bangladesh, 2007
Activity-commodity (N=41) Activity-commodity (N=86) Cereal crop sectors Paddy cultivation, wheat cultivation, other grain cultivation Commercial crops Jute cultivation, sugarcane cultivation, potato cultivation, vegetable cultivation,
pulses cultivation, oilseed cultivation, fruit cultivation, cotton cultivation, tobacco cultivation, tea cultivation, spice culti vation, other crop cultivation
Livestock rearing Livestock rearing Poultry rearing Poultry rearing Fishing Shrimp farming, fishing Forestry Forestry Rice milling Rice milling Grain milling Grain milling Food processing Fish process, oil industry, sweetener industry, tea product, salt refining, food
processing Leather industry Tanning and finishing, leather industry Yarn Yarn industry Cloth milling Cloth milling, handloom cloth, dyeing and bleaching Ready-made garments Ready-made garments Knitt ing Knitting Toiletries Toiletries Cigarette industry Cigarette industry, bidi industry Furniture industry Saw and plane, furniture industry Paper, printing, and publishing Paper industry, printing, and publishing Pharmaceuticals Pharmaceuticals Fertilizer industry Fertilizer industry Petroleum Petroleum Chemical industry Basic chemical, chemical industry Glass industry Glass industry Earth-ware and clay industry Earth-ware industry, clay industry Cement Cement Metal Basic metal, metal manufacturer Miscellaneous industry Machinery and equipments, transport equipments, baling, jute fabrication,
miscellaneous industry Construction Urban building, rural building, power plant building, rural road building, port
road railway building, canal/dyke/ot her buildings Electricity and water Electricity and water Gas extraction and distribution Gas extraction and distribution Mining and quarrying Mining and quarrying Wholesale and retail trade Wholesale trade, retail trade Transport Air transport, water transport, land transport, railway transport, other transport Health service Health service Education service Education service Public administration & def. Public administration and defence Bank, insurance, and real estate Bank, insurance, and real estate Hotel and restaurant Hotel and restaurant Communications Communications Information technology and e-commerce Information technology and e-commerce Other services Housing service, professional service, entertainment, other services
ANNEX 2

ECONOMIC REFORMS AND AGRICULTURE IN BANGLADESHAssessment of Impacts using Economy-wide Simulation Models
Project funded bythe European Union