economic planning
TRANSCRIPT

Economic Planning
Planning is defined as conceiving, initiating, regulating and controlling economic activity by the state according to set priorities with a view to achieving well-defined objectives within a given time.
According to Professor Dickinson, economic planning is the making of major economic decisions by a determinate authority on the basis of a comprehensive survey of the economy as a whole. Such decisions include what and how much to produce; how, when and where it is to be produced; and to whom it is to be allocated.
With reference to underdeveloped countries, Subrata Ghatak defines economic planning as a conscious effort on the part of any government to follow a definite pattern of economic development in order to promote rapid and fundamental change in the economy and society.
Essentials of Economic Planning
According to Arthur Lewis, a development plan may consist of the following parts:
1. Survey of current economic conditions
2. List of proposed public expenditures
3. Discussion of likely development in private sector 4. Macro economic projections of the economy
5. Review of government policies
1. Survey of current economic conditions: The economic survey shows the changes in respect of population, NI, taxation, government expenditures and BOP, etc. It also tells us the changes needed or expected to occur in these economic variables. The economic survey is usually for one year.
2. List of proposed public expenditures: The proposals and suggestions for incurring public expenditures on development projects are invited from various government departments and agencies. After a thorough scrutiny of these recommendations, an order of priority is determined deciding what is to be included, what is to be postponed or rejected as the financial resources are less than required.

3. Discussion of likely development in private sector: It is said that both public and private sectors are inter-related and rate of economic development depends more on the working of the private sector than expenditures in public sector. The government reviews the performance of major industries in economic planning, and sets quantitative targets for the plan period. All this involves a brief in-depth analysis of the working and implications of market structure.
4. Macro economic projections of the economy: It refers to the preparation of aggregate models which are applied to the economy as a whole. These models deal with production and consumption as single aggregates. Aggregate models are used to determine the possible growth rates in NI, the division of national product among consumption, investment and exports, the required volume of domestic savings, imports and foreign assistance needed to carry out a given development programme. This involves massive calculations and paper works.
5. Review of government policies: The government through development policy can influence the decisions indirectly in the private sector.
Importance / Objectives of Economic Planning w.r.t. Mixed Economy & Under-Developed Countries
In the following section we will discuss the economic planning with reference to mixed economies and under-developed countries:
1. Efficient utilization of resources: The most essential function of economic planning is to ensure the best use of given resources within the country. Maximum social benefits can only be ensured when the available resources are allocated and utilized in the most efficient manner. Unused or slack utilization of resources will adversely affect the employment and productivity level of the economy. The government has to do some arrangements in order to bring equality between demand and supply. In the market economy, there are wasteful expenditures in the form of selling costs. Sometimes, few producers established their cartels in order to control the market. All this can be undone by the government through effective planning.
2. Market imperfections and price distortions: In market economies, there are certain market imperfections and price distortions both in commodity market and factor market. These distortions rise because of institutional arrangements. As the wage rate in some sectors of the economy exceeds the opportunity cost of the labour. This may be due to trade unions‘ influence. Moreover, the goods whose demand is less elastic their producers may pursue monopolistic behaviour. There may be dualistic approach in the money market. In the organized money market the rate of interest is kept artificially low or inexpensive credit facilities
are provided. While on the other hand, in less organized money market or in agriculture market, the ROI is extraordinary high. This situation also creates price distortion. These market imperfections can only be corrected by efficient economic planning.
3. Greater opportunities: The most common benefit that any democratic country enjoys is that the greater market opportunities are and should be provided to the producer and consumers. But this can be handicapped because of two reasons:
(a) Limited life span of an individual
(b) Limited resources at the disposal of an individual
4. Because of these common problems, the individuals undertake those projects which require small amount of resources and the profit can be earned within a short period of time. In this way, the individuals would hardly be prepared to launch big projects like construction of highways, power-stations, land-reclamation, anti water logging and salinity schemes, rail-roads, sea ports, telecommunication, etc. It is the duty of the modern government to provide greater resources at the disposal of individuals. At the same time the government has to reduce excessive-consumption or the disposal of resources in few hands. This can only be ensured under efficient economic planning.
5. Maximisation of National Income and Raising Living Standard: It is the responsibility of modern state to maximise the national income and raise the standard of living. It can only be ensured when the government correctly addresses the economic needs of the country and takes desired actions in economic planning.
6. Full Employment: In economically advanced countries, the government‘s aim is to provide full employment. All modern governments have, in fact, underwritten employment. If they cannot provide work, they have to give doles. Unemployment is the biggest by product of any capitalist society. The government can redistribute labour and create more work opportunities for both private and public sector.
7. Equitable distribution of income: Economic planning is the most powerful tool of equitable distribution of income. The price-mechanism rewards people according to the resources they possess but contains in itself no mechanism for equalization of the distribution of those resources. Therefore, there is a wide gap between haves and have-nots. Shocking economic inequalities are a marked feature of an unplanned economy. Reduction of economic inequalities is now the avowed aim of a modern welfare state and is impossible without the instrument of economic planning.

8. Public oriented goals: In market economy, only those goods are produced whose demands are backed by money offers. As a result the production of public goods / services, including health, research and education, old-age benefits, poor houses, orphan houses, clean water, sewerage and drainage, free entertainment, art and culture, historical assets, wildlife, forests, security, and defence, are altogether ignored or very less attention is paid. It is planning which distributes the resources between present consumption and future consumption, social development and economic development, etc. As a result the goals of planned economies are more welfare and public oriented.
9. Price Stability: The purpose of economic planning is to reduce the price instability created by business fluctuations. During the period of increasing demand, the price hikes are inevitable due to supply shortages. In under-developed countries, because of low productive capacity, low savings and investment, and traditional set up, the price starts rising very sharply, and its impact on the developing society is very deep. In order to eliminate the adverse effects of price instability and business fluctuations, the government comes forward and play a vital role in creating a favourable economic condition. This can only be done through wise economic planning.
10. Larger savings and investment: The ultimate task of any finance ministry is to boost up the savings and investment, esp. foreign investment. In UDCs on one hand there is a vicious circle of poverty, while on the other, there is an operation of international demonstration effect. In UDCs, there is a general tendency of demonstration effect within the people, and the whole economy‘s growth is hampered by dualism. Savings remain at the lowest level. The boost in investment, domestic or foreign, depends on the level and duration of economic stability. More stable and viable economic growth planning may motivate the investors in investing and thus increasing the level of employment in the economy.
11. Provision of Social Services: In UDCs, the provision of social services forms an important objective of planning. In the fifth five year plan, two important objectives were:
(a) Development of rural areas through various programmes and policies alongwith widespread extension of social services such as schooling, health and clean water facilities.
(b) Easing of urban problems like water supply, sewerage and drainage, electricity, gas supply, housing and transportation facilities, etc.
12. Aid to victims of catastrophe: The granting of assistance and the organisation of relief to victims of natural catastrophes, such as flood, earthquakes, tsunamis, tropical storms, drought, etc. are the main the responsibilities of any government.

Limitations of Economic Planning
The following obstacles come in the way of economic planning:
1. Measurement of labour force: In economic planning, the identification and enumeration of gainfully employed population is a difficult task, esp. in agriculture, where the employment is of part-time or seasonal nature. The important contributions to economic activities by women and children raise further complications. In backward economies, it is very difficult to distinguish between voluntary and involuntary unemployment.
2. Statistical data: The biggest problem with economic planning is that the planner has to work with a limited statistical data provided. Moreover, the planner has to work with these data, collected through different surveys, consensus, polls, etc., without much questioning about their reliability and accuracy.
3. Unused natural resources: The UDCs are identified of their unused natural resources like land, mines, rivers, forests, livestock, sea, etc. A resource such as land, a mineral deposit, a forest or a rive may not be used in production because it is economically inaccessible. A natural resource is valueless when its cost of extraction is greater than the price the product can command in the market. Therefore, the fullest possible use of natural resources is not a sensible aim of an economic planning, and the extent of the use of land or other natural resources is not a measure of economic efficiency. There are four types of resource idleness:
(a) Idleness reflecting the inability of the resource to contribute to profitable production,
(b) Withholding of the resources in the interests of monopolistic exploitation of the market,
(c) Employment of resources for commercial or private use, and
(d) Withholding of a natural resource from current production because the owner believes that it will make a more valuable contribution to production at a later date.
4. Population and real income: The biggest problem regarding human resources is that in UDCs, the population is growing at a very high rate. Moreover, most of the UDCs population heavily rely on agricultural income. The present rate of population growth in India and Pakistan is not significantly greater than in the United States. But the significant point of contrast is that in the South Asia and Central Asia, there is a heavy reliance on comparatively backward agriculture. Real income is vitally affected by the quality of the population.

5. Economic repercussions of social institutions: Certain social institutions, such as extended family system or joint family system, which are appropriate to a subsistence economy may impede economic growth directly by reducing the rewards of individuals who take advantage of the opportunities presented by wider markets. Subsistence economy is the economy in which people strive for the minimum necessities to support life. The extended family system acts as a serious obstacle to economic progress. A man is much less likely to be willing and able to save and invest, when he knows that he would have to maintain a large number of distance relatives. It minimises the inducement for people to improve their own position. It obstructs the spreading of banking habit since people are unwilling to have banking accounts as there is no willingness to save. However, the economic planner can overcome this situation by introducing private or public insurance or other arrangements to replace the traditional methods for the relief of personal distress or disability.
6. Implications of restrictive tendencies: Social, political and administrative restrictive measures are directed against foreigners on the basis of racial, national or tribal differences. Such restrictive measures are often directed also against the members of local population. It may put restrictions on the movement of people or on the acquisition and exercise of goods or services. It may also be connected with ‘xenophobia’, esp. in the tribal areas and villages. This problem is common in Pakistan and hampers the economic development in rural and tribal areas.
7. Wage rates and unemployment: In UDCs, the wage rate is relatively low and there is a high unemployment rate in the economy. Limited employment opportunities may create a pool of urban unemployed. These urban members do not enjoy the security of the extended family system, nor are they related to agricultural sector. They therefore are apt to constitute a more serious social and political problem then the rural unemployed.
8. Monopsony in the labour market: It is a common situation in UDCs in which there are very few employers and they exercise their monopsony powers in the labour market. Labour is more exploited when the wage rate is below the equilibrium point indicating the unsatisfied demands of labour. Whereas in advanced countries, the supply of labour is elastic and there is little scope for monopsonistic exploitation. The planner must address the labour issues like wage rates, overtime, bonus, allowances, perquisites, working hours, safety measures, health and medical facilities, life insurance, transportation, children education, pension and benevolent funds, old age benefits, income tax on salaries, etc.
9. Uneven distribution of entrepreneurial faculties: The material progress of a society is likely to be assisted greatly when there are dynamic entrepreneurial abilities. In economically backward countries, there are difficulties in the way of developing and utilising the entrepreneurial qualities. The government can support small and medium enterprises to come forward and develop new economic opportunities. The government must encourage, both on private and public level, new agricultural or industrial techniques, adoption or adaptation of

new improved methods, innovative activities, internship, on-the-job training, etc. in order to raise the level of economy.
10. Low level of capital in UDCs: The biggest problem of less developed countries is that there is a dearth of capital, whether it is physical or financial. The low level of capital is also indicated by statistics of consumption of energy for purposes of production. In developed countries, there is a high consumption of energy, whereas in UDCs, the energy consumption is considerably low. The general implication of low level of capital is a low level of output and a low level of consumption per head. In such economies, there is no assurance of a continuity in supply of goods. Transport costs are very high and limited availability of perishable or bulky goods. Because of low level of working capital and storage facilities, there is a danger of acute shortage of food crops.
11. Methods of production: The methods of production, farming, marketing and domestic operation are not usually the same in all the countries. What is an economic use of resources in one country may be uneconomic in another in which relative factor prices are comparatively different. It follows that the economic efficiency of methods of production and economic organisation in UDCs cannot be judged simply by comparing them with those familiar in advanced countries. The planner has to jot out all the possible opportunities and focus on major weaknesses, and must plan within the available resources.
12. International demonstration effect: In UDCs, there is a strong desire to enjoy as much of attractive way of living in the advanced countries as incomes permit. There is an international demonstration effect. Moreover, the under developed economy is divided into two extreme sections – traditional section and modern section. There are old and new production methods, educated and illiterate population, rich and poor, modern and backward, capitalistic and socialistic, donkey carts and motor cars existing side by side. This situation creates great atmosphere of conflict and contradiction, as a result the economic development is hampered.
13. Political instability: Most of UDCs, especially Asian and African countries, are known of their political instability, bureaucratic malfunctioning, corruption on administrative level, and nepotism, like India, Pakistan, Sri Lanka, Bangladesh, Afghanistan, Vietnam, Cambodia, Myanmar, Nigeria, Zimbabwe, Uganda, Somalia, Kenya, etc. Perhaps the biggest challenge for any economic planner is the political and administrative malfunctioning in his way of economic planning.

Elements of Economic Development
The economic development in advanced or under-developed countries depends on four elements:
1. Human resources: In poor countries GDP rises but at the same time the population also grows. Several developing countries are facing high birth rates with stagnant national income per head. It is hard for poor countries to overcome poverty with birth rates so high. In under-developed countries, the economic planners emphasise the following specific programmes:
(a) Control disease and improve health and nutrition,
(b) Improve education, reduce illiteracy and train workers, and
(c) Ensure that the labour force is well-equipped with necessary and competing skills.
2. Natural resources: Many poor countries have enormous amount of natural resources, but they are failed to explore them. The reason is that the government has not provided necessary incentives to the farmers and landowners to invest in capital and technologies that will increase their land‘s yield.
3. Capital formation: Capital formation or inducement to invest depends on the propensity to save. In less-developed countries, there is a very low saving tendency because of low income. Developed countries managed to save 20% of their output in capital formation. Whereas only 5% of the national income is saved in UDCs. Much of the savings goes to housing and basic needs and, therefore, a very small amount is left over for development.
Capital formation is the basic tool for economic development. It may take decades to invest in building up a country‘s infrastructure, information technologies, power-generating plants, and other capital goods industries. Developing countries must have to build up their infrastructure, or social overhead capital in order to set path for economic glory.
If there are so many obstacles in finding domestic savings for capital formation, then the country depends on foreign sources of funds. Less-developed countries have to welcomed the flow of foreign capital or foreign borrowings. As long as the exports of these countries grew at the same rate as borrowings, it is a favourable condition. But several poor countries needed all their earnings simply to pay interest on their foreign debts. This is an adverse situation. Such countries need to boost up their production in order to cope with their current indebtedness.

4. Technological change and innovations: The developing countries have a potential advantage in the economic development – i.e., they can be benefited from up-to-date technologies developed by advanced countries. They can climbed up to industrialisation more rapidly than those advanced countries who struggled for more than 500 years.
Vicious Cycle of Poverty
Many developing countries are caught up in vicious cycle of poverty. Low level of income prevents savings, retards capital growth, hinders productivity growth, and keeps income low. Successful development may require taking steps to break up the chain at many points. Other points in poverty are also self-reinforcing. Poverty is accompanied by low levels of education, literacy and skill; these in turn prevent the adaptation to new and improved technologies and lead to rapid population growth. The vicious cycle of poverty is depicted as below:
Overcoming the barriers of poverty often requires a concentrated effort on many fronts and a ‗big-push‘ is required to break the ‗vicious cycle‘ into ‗virtuous circle‘. If the country has stepped to invest more, improve health and education, develop labour skills, and curb population growth, she can break vicious cycle of poverty and stimulate a virtuous circle of rapid economic growth.

Stages of Economic Development
W.W. Rustow has defined and analysed in his book „The Stages of Economic Growth‟ the five stages of economic development:
1. Traditional society, 2. Pre-conditions for take-off, 3. Take-off stage, 4. Drive to maturity, and
5. Stage of mass production and mass consumption.
1. Traditional society: In the traditional long-lived social and economic system, the output per head is low and tends not to rise. Economic activities are static and national income is very low. The examples are Somalia, Bangladesh, Afghanistan, etc.
2. Pre-conditions for take-off: The second stage is ‗Pre-take-off‘. It is a period of transition in which the traditional systems are overcome, and the economy is capable of exploiting the fruits of modern science and technology. Pakistan, India, Sri Lanka, etc. are operating at this stage.
3. Take-off: Take-off represents the point at which the resistances to steady growth are finally overcome and the growth is normally inevitable. The economy generates its own investment and technological improvement at sufficiently high rates so as to make growth virtually self-sustaining. South Africa, UAE, etc. are the examples.
4. Drive to maturity: The fourth stage is the drive to maturity. It is the stage of increasing sophistication of the economy. Against the background of steady growth new industries are developed, there is less reliance on imports and more exporting activity. The economy demonstrate its capacity to move beyond the original industries which powered its take off, and to absorb and to apply efficiently the most advanced fruits of modern technology. China, South Korea, Malaysia, etc. are the examples.
5. Stage of mass production and mass consumption: The fourth stage ends in the attainment of fifth stage, which is the age of mass production. It is the stage in which there is an affluent population, and durable and sophisticated consumer goods. There are huge capital and technological intensive industries in such an economy. People are more quality conscious and comfort lovers. Wage rates are high. Health and safety issues are addressed by the government. The whole economy is dynamic. USA, UK, France, Germany, Japan, Canada, Italy, Netherlands, Denmark, etc. are the examples.

Approaches to Economic Development
The following approaches are developed in recent years to explain the economic development and answer the question how countries break out of the vicious cycle of poverty to virtuous circle of economic development:
1. The Take-off Approach: Take-off is one of the stages of economic growth. Different economies have been benefited from ‗take-off‘ approach in different periods, including England at the beginning of eighteenth century, the United States at the mid of nineteenth century, and Japan in early twentieth century. The take-off is impelled by leading sectors such as a rapid growing export market or an industry displaying large economies of scale. Once these leading sectors begin to flourish, a process of self-sustained growth (i.e. take-off) occurs. Growth leads to profits, profit are reinvested, capital, productivity and per capita income spur ahead. The virtuous cycle of economic development is under way.
2. The Backwardness Hypothesis and Convergence: The second approach emphasises the global context of economic development. Poor countries have important advantages that the pioneers of industrialisation had not. Developing nations can draw upon the capital, skills and technologies of advanced countries. Developing countries can buy modern textile machinery, efficient pumps, miracle seeds, chemical fertilisers and medical supplies. Because they can lean on the technologies of advanced countries. Today‘s developing nations can grow more rapidly than Great Britain, Western European Countries and United States in past. By drawing upon more productive technologies of the leaders, the developing countries would expect to see convergence towards the technological frontier.
3. Balanced Growth: Some writers suggest that growth is a balanced process with countries progressing steadily ahead. In their view, economic development resembles the tortoise making continual progress, rather than the hare, who runs in spurts and then rats when exhausted. Simon Kuznets examined the history of thirteen advanced countries and conceived that the balanced growth model is most consistent with the countries he studied. He noticed no significant rise or fall in economic growth as development progressed.
Note one further important difference between these approaches. The ‗take-off‘ theory suggests that there will be increasing divergence among countries (some flying rapidly, while others are unable to leave the ground). The ‗backward‘ hypothesis suggests ‗convergence‘, while the ‗balanced-growth‘ model suggests roughly ‗constant‘ differentials. In the following diagrams, advanced countries are represented by curve A, middle income countries by curve B and low-income countries by curve C. The curves show per capita income:

Issues in Economic Development
Following are the important issues in under developed countries:
1. Industrialisation vs. Agriculture: In most countries, incomes in urban areas are almost more than double in rural areas. Many nations jump to the conclusion that industrialisation is the cause rather than effect of affluence. To accelerate industrialisation at the expense of agriculture has led many analysis to rethink the role of farming. Industrialisation tends to be capital intensive, attract workers into crowded cities, and often produces high level of unemployment. Rising productivity on farms may require less capital, while providing productive for surplus labour.
2. Inward vs. Outward Orientation: This is a fundamental issue of economic development towards international trade. Should the developing countries be self-sufficient? If yes, the country has to replace imported goods and services with domestic production. This strategy is known as „import substitution‟ or „inward orientation‟.
If the country decides to pay for imports it needs by improving efficiency and competitiveness, developing foreign markets, and giving incentives for exporters. This is called „outward orientation‟ strategy. It is generally observed that by subsidising import substitution, competition is limited, innovation is dampened, productivity growth is slow down and country‘s real income falls to a lower level. Whereas, the outward orientation sets up a system of incentives that stimulates exports. This approach maintains a competitive FOREX rate, encourages exports, and minimises unnecessary government regulation of businesses esp. small and medium sized firms.
3. State vs. Market: The cultures of many developing countries are hostile to the operation of markets. Often competition among firms or profit seeking behaviour is contrary to traditional practices, religious beliefs, or vested interest. Yet decades of experience suggest that extensive reliance on markets provides the most effective way of managing an economy and promoting rapid economic growth.
The government has a vital role in establishing and maintaining a healthy economic environment. It must ensure law and order, enforce contracts, and orient its regulations towards competition and innovation. The government plays a leading role in investment in human capital through education, health and transportation, but the government should minimise its intervention or control in sectors where it has no comparative advantage. Government, should focus its efforts on areas where there are clear signs of market failure

Types of Economic Planning
Planning by Inducements
Planning by inducement is often referred to as „indicative planning‟ or „market incentives‟. In such type of planning, the market is manipulated through incentives and inducements. Accordingly, in this system there is persuasion rather than compulsion or deliberate enforcement of orders. Here the consumers are free to consume whatsoever they like, producers are free to produce whatsoever they wish. But such freedom of consumption and production are subject to certain controls and regulations. The consumers, producers and other factors of production are induced with the help of various fiscal and monetary devices. For example, if the planning authority wishes to boost the production of corn oil in Pakistan it will provide subsidies, tax holidays and loans to the firms involved in production of corn oil. To encourage savings and investment and discourage consumption a suitable package of fiscal and monetary policies can be introduced in the market. Therefore, the desirable results can be attained with the help of incentives and without the imposition of orders and instructions. Moreover, in such planning there is less sacrifice and less loss of liberty – economic as well as non-economic.
Merits of Planning by Inducements:
(a) Consumers’ sovereignty remain intact. Planning by inducements is more democratic as compare to planning by directions.
(b) There is a freedom of choice of profession.
(c) In planning by inducements, there is freedom of enterprise. Produces are free to produce whatever they like but within in the capacity of given rights.
(d) Planning by inducements is smooth and flexible. It is more popular because it enables to incorporate the changes in resources, technology and taste etc. even after the finalisation and implementation of plan.
(e) Under this sort of planning, the inertia attached with standardisation can be put to an end and producers are free to produce in accordance with the desire of consumers. Therefore, there is a variety of goods and services in the market.
(f) There are less administrative costs involved in planning by inducements.
(g) The problem of shortages and surpluses is solved as there is an existence of automated market system. The demand and supply is automatically adjusted and remain in balance under market economy.

Demerits of Planning by Inducements:
(a) It also fails to achieve 100% targets of economic planning.
(b) Under planning by inducements, there are profit motives more than welfare of public. Private entrepreneurs care for those products which yield high profits. Products or services with less profit or no profit do not attract private entrepreneurs. Such products or services include education, health, defence, security, etc.
(c) The producers may find the government policies regarding economic affairs not attractive enough to follow. There may be disputes among entrepreneurs and the government regarding tax rates, investment policies, interest rates, etc.
(d) The mechanism of market economy may cause the prices to inflate esp. with reference to under-developed countries or in case of oligopoly where there is a shortage of certain products like petroleum and gas.
(e) There may be disharmony between labour and producer, and there may be serious industrial disputes.
Planning by Directions
This type of planning is practised in socialist countries like China, Former USSR, Cuba, North Korea, etc. Under planning by direction, there is one central authority which plans, directs and orders the execution of the plan in accordance with the pre-determined targets and priorities. It determines the production figures, delivery schedules, quotas regarding the production of the goods, price controls, use of foreign exchange and allocation of resources like labour, etc. amongst different competing uses. Thus, such planning is comprehensive and encompasses the whole economy. Planning by directions is similar to military or defence plans which are carried through orders and instructions. Thus the strategy of planning through directions coincides with the military strategy. Alongwith the disintegration of former Soviet Union, the methodology of planning by directions has received certain serious setbacks. Now most of the UDCs are tend to adopt market economic system.
Demerits of Planning by Directions:
(a) Planning by direction is undemocratic since the people are ignored all along.
(b) It is bureaucratic and totalitarian. Under bureaucratic system, the individual‘s sovereignty is completely abolished. Corruption, red tapism, VIP system, tyranny and austerity are the by products of bureaucracy.
(c) Rationing and control result in black marketing.
(d) There are shortages of some goods and as well as surpluses of other goods. That is, there is an imbalance in production output.

(e) This sort of planning is inflexible. Once the plan is prepared, there is no room for alterations in later phases of planning. A part of the plan cannot be changed without simultaneous changes in many interconnected activities. Planning by direction is so complex that it is impossible to change even a part of it as it will involve in altering the whole plan.
(f) The fulfilment of plan cannot be guaranteed, as the planning by direction is hampered by black marketing and corruption.
(g) Planning by direction also leads to excessive standardisation which impinges on consumer sovereignty. In other words, under planning by direction the goods produced are standardised lacking the variety. As in case of USSR, the produced TV, Fridges and Automobiles were identical having no differentiation.
(h) It also involves huge administrative costs, as the planning by direction involves in elaborate census, numerous forms and army of clerks.
Physical and Financial Planning
Physical planning is concerned with physical allocation of resources on the one side, while with the product yields on the other side. Its aim is to bring physical balance in between investment and output. Accordingly, investment coefficients are computed. These coefficients show how much amount of investment will be required for a given amount of output. Moreover, in such planning it is also analysed that what will be the composition of investment to obtain an increase in output. As, how much iron, how much coal, oil and electricity will be required to produce some specific amount of steel. While making physical planning, an overall assessment is made regarding the real resources of the economy like raw material and manpower.
In financial planning, equilibrium is established between demand and supply to avoid inflation and bring economic stability. The difference between physical planning and financial planning is that the physical planning tells us the size of investment in terms of real resources, whereas the financial planning tells us the size of investment in terms of money. In financial planning, the planner determines how much money will have to be invested in order to achieve the pre-determined objectives. Total outlay is fixed in terms of money on the basis of growth rate to be achieved, the various targets of production, estimates of the required quantity of consumer goods and the various social services, expenditure on the necessary infra structure, etc. as well as revenue from taxations, borrowings and savings.
Centralised Planning and Decentralised Planning
Under centralised planning, all the economic decisions are taken by the central authority or the government. It is the government which formulates economic plans, determines objectives, sets targets and priorities. Every member has simply to carry out the instructions without questioning about its viability. There are more chances of failure as the individuals are not allowed to carryout the plans in accordance to their needs and preferences. It is the government who takes responsibility of the success or failure of the plan. It is the government who takes all the decisions of consumption,

production, wages and prices. What amount of investment is to be made?, What should be the price?, What should be the output?, How the products are to be distributed?, How much amount of loans is to be granted?, What should be the rate of interest?, etc. Centralised planning is mostly executed in socialist or communist countries.
Decentralised planning is connected with the capitalistic economies. The decentralised planning is implemented through market mechanism. Decentralised planning empowers the individuals or small groups to carryout their plans for achievement of a common goal. Under decentralised planning, the operation is from bottom to top. The planning authority formulates the plan by having made consultation with different administrative units of the economy. The plans regarding different industries are designed by the representatives of these industries. In such type of planning, the planning authority issues the instructions to central and local bodies regarding incentives given over to private sectors.
Structural and Functional Planning
The planning which is aimed at bringing changes in socioeconomic set-up of a country is termed as structural planning. This type of planning is attributed to the planning which was made in USSR in 1929 when the existing land-lord-system was abolished, collective farming was introduced, trade, industries and transport system was nationalised.
While functional planning is a type of planning where hardly any big change is brought about in the existing socio-economic set-up of the country. It means when planning is made in the presence of existing institutions is termed as functional planning. In France, Germany, UK, etc planning is being made in the existing framework of capitalism.
Indicative and Imperative Planning
Indicative or planning by inducements has already been discussed in a previous section. In the following section we will discuss the three components or approaches regarding indicative planning:
(a) Forecasting Approach: Under forecasting approach, the individuals are provided with the information, through making certain forecasts. Such forecasting serve as a guide to their decision making. The forecasting not only indicate about the feasible future, but they also specify a desirable future in terms of growth rate of the economy.
(b) Policy Approach: The second component of the indicative planning is concerned with policy approach. Through policy approach, the inconsistent policies of government departments are co-ordinated within a coherent model framework keeping in view the set objectives. Moreover, when

once the policies are co-ordinated, they will provide guidelines to the people, consumers and producers.
(c) Corporate Approach: The third way to demonstrate indicative planning is through corporative approach. This approach is practised in France. Here the co-ordination function of indicative planning envisages at two level. In the first place, it requires co-ordination of the behaviour of economic groups like business enterprises and trade unions, etc. which hold power in the market. In the second place, it co-ordinates the relation between private and public activities.
Imperative planning is the planning where the formulation and implementation of the plan is made by the central planning authority. It is also known as ‗directive planning‘. Under imperative planning, it is the duty of the state to provide necessary supplies like raw material, machines, manpower and entrepreneurs as all such resources are owned by the state. Under socialist economies, where the imperative planning is in practice the planners always prefer future consumption over present consumption. Thus under imperative planning the priorities laid down by the planners always supersede those of masses. There is no consumer sovereignty under imperative planning.
Democratic and Totalitarian Planning
Under democratic planning, the philosophy of democracy is followed. Since formulation to the execution of the plan, the people are taken into confidence. Whenever the plan is prepared, the ruling party makes a dialogue with the public firms and even with opposition party. The purpose of such arrangements is to satisfy different segments of the economy regarding growth and welfare programmes. After the formulation of the plan, an open discussion is make in the parliament. Under democratic planning, whole of the economic activities are performed through price mechanism. The government influences the private sector through fiscal and monetary policies. Moreover, the government passes anti-monopoly laws to protect the consumer‘s sovereignty.
In totalitarian planning, there is a central control, and all economic activities are governed by the central authority. In totalitarian planning, all of consumption, production, distribution and exchange like activities are controlled by the central planning authority. Totalitarian allows no consumer sovereignty and democratic freedom.

Fixed Plan and Rolling Plan
Fixed Plan
In a fixed plan, the contents of the plan are fixed in relation to a fixed time period. These contents consisting of targets, priorities, strategies and resources, etc. will not be changed during the particular time period for which the plan has been prepared except for severe unforeseen events.
Merits of Fixed Planning:
(a) There is a boldness in planning. This is the essence of planning that the planners and implementing machinery will not bow down before the obstacles.
(b) There is effective implementation of plan.
(c) The targets of fixed plan are certain and this certainty in objectives brings stability to the economy.
(d) Fixed plans ensure discipline for the planning process.
Demerits of Fixed Planning:
(a) Fixed plans are inflexible plan. They cannot be altered in later phases.
(b) There is no revision of economic objectives and targets as there is no alteration allowed under fixed planning.
(c) If the state is an under-developed country, the fixed plan would give the economy a hard time to achieve the basic objectives like employment, industrialisation, education, health, etc.
(d) Fixed plans, if not properly formulated and implemented, lead to wastage of resources.
Rolling Plan
Rolling planning refers to the rolling of a plan at intervals usually one year, so that it continues to be a plan of certain number of years. It is usually the medium term plan.
Merits of Rolling Plan:
(a) Rolling plans are flexible and can be altered in later phases.
(b) The rolling plan allows for revisions and adjustments. In rolling plan, review of the plan is a continuous exercise.

(c) Rolling plans enable the planners to keep the time horizon moving, alongwith making revisions and adjustments so as to prepare a new plan every year in accordance with the changing circumstances.
Demerits of Rolling Plan:
(a) Rolling plan is furnished with uncertainty, as there is no fixation of economic objectives.
(b) In rolling plans, the planners are always reluctant in taking difficult decisions or taking courageous decisions.
(c) Under rolling plan, there is a lack of commitment. As there is no fixity attached with the plans, the enthusiasm on the part of planning and administrative machinery will hardly be found.
Short-term, Medium and Long-term Planning
Short-term plans are also known as „controlling plans‟. They encompasses the period of one year, therefore, they are also known as „annual plans‟. In annual plans or budgets the financial aspects of the plan, i.e., financial sources and applications are shown. In the annual developmental plans the items pertaining to capital budgets, i.e., the capital revenue and expenditure are listed. The main objectives of short-term planning is to raise the revenue, attain the short-term economic targets, bring price stability, and remove deficit in BOP.
The medium-term plans last for the period of 3 to 7 years. But normally, the medium term plan is made for the period of five years. The medium-term planning is not only related to allocation of financial resources but also physical resources. The main objectives of medium-term economic planning are to raise per capita income, raise the level of employment, create self-sufficiency in the economy, reduce dependence over foreign aid and raise revenues through domestic sources, and to remove regional and intra-regional disparities.
Long-term plans last for the period of 10 to 30 years. They are also known as „perspective plans‟. The origin of long-term planning goes back to USSR where Goelro Plan 1920-35 was first formulated and implemented in 1920. The basic purpose of that plan was to electrify the rural areas. The basic philosophy behind long-term planning is to bring structural changes in the economy. Under long-term planning, there is greater freedom of choice and there is a wide scope of planning.

Corrective and Developmental Planning
The planning consisting of fiscal and monetary measures with the aim of removing the imbalances of the economy is known as „corrective planning‟. As to control inflation, if the government follows a very strict fiscal and monetary package; controls aggregate demand by checking consumption, investment and government expenditure – this will be the case of corrective planning.
On the other hand, the planning which is aimed at developing the whole economy is known as developmental planning. Development planning involves the application of a rational system of choices among feasible courses of investment and other development actions.
Capitalist and Socialist Planning
Capitalistic economy is also known as „free-enterprise economy‟. Under capitalism, there was no authority governing the planning activity. All the economic activities were controlled by the private sector. The state function was limited to tax collection and defence. There was no public welfare measures, no developmental planning and no labour rights. But with the capacity of time esp. after the great depression of 1930s and development of economic, social and political economic thoughts, the capitalist economies adopt the modern functions like:
(a) formulating and implementing monetary, fiscal and trade policies,
(b) promulgating anti-monopoly and anti-cartel laws,
(c) working for the sake of community‘s benefits,
(d) formulating and implementing development plans
(e) providing basic facilities of health, education, transportation, communication, and recreation, etc.
In socialism, the central planning board formulates the plan which covers the whole economy. The central planning board has unlimited powers regarding allocation of resources and production of goods and services. The central planning authority determines the goals and priorities regarding distribution of national income, employment, economic needs, capital accumulation and economic growth. Under socialism all factories, resources, financial institutions, shops, stores, ware houses, foreign and domestic trades, means of communication and transportation are under government control.

Planning under Mixed Economy
Most economists suggest the operation of mixed economy because both extreme capitalistic and socialistic system are not suitable. Capitalistic or free enterprise economy are characterised by lot of problems including misallocation of resources, market imperfections, monopolies, oligopolies, labour exploitation, widening gap between haves and have-nots, and consumer‘s exploitation. On the other hand, socialistic form of economy may create the problems like State‘s monopoly and supremacy, bureaucratic hold, corruption, red tapism, VIP-system, loss of consumer‘s sovereignty, standardisation of products, poor quality of products, less foreign trade, etc.
While in case of mixed economy, consumer‘s sovereignty, private property ownership and operation of price mechanism are ensured. The public sector also works parallel to private sector. The public sector in a mixed economy consists of those projects which require heavy funds like railways, air transportation, roads, bridges, fly-overs, underpasses, power generation, irrigation, telecommunication, research, etc. The government also addresses people‘s basic needs like employment, health, and education. In under-developed countries, the government also provides housing facilities to poor families. To avoid labour exploitation and consumer‘s exploitation, the government promulgates anti-monopoly and anti-cartel laws. In mixed economies, the government even adopts safety measures against pollution and unhealthy working conditions in factories, offices, etc. In case of agricultural sector, the government provides short term loans to farmers, and imports farm machines.
Economic Development
Economic development is fundamentally about enhancing a nation‘s factors of productive capacity, i.e., land, labour, capital, and technology, etc. By using its resources and powers to reduce the risks and costs, which could prohibit investment, the public sector often has been responsible for setting the stage for employment-generating investment by the private sector. The public sector generally seeks to increase incomes, the number of jobs, and the productivity of resources in regions, states, counties, cities, towns, and neighbourhoods. Its tools and strategies have often been effective in enhancing a community's:
labour force (workforce preparation, accessibility, cost)
infrastructure (accessibility, capacity, and service of basic utilities, as well as transportation and telecommunications)
business and community facilities (access, capacity, and service to business incubators, industrial/technology/science parks, schools/community colleges/universities, sports/tourist facilities)
environment (physical, psychological, cultural, and entrepreneurial)
economic structure (composition)
Institutional capacity (leadership, knowledge, skills) to support economic development and growth.
However, there can be trade-offs between economic development's goals of job creation and wealth generation. Increasing productivity, for instance, may eliminate some types of jobs in the short-run. Economic development encompasses a broad and expansive set of activities and tools that assist communities in growth and prosperity. The best economic development practitioners strive to bring quality jobs, new businesses and increased services (along with numerous other benefits) to communities through innovative approaches and outcome driven strategies.
Technology development has added a new dimension to the role of economic development professionals. The quest for increased technology can be confusing and challenging from many perspectives. Communities must judge to what extent they should strive to recruit and support the technology industry, how to determine the proper role of advanced technology on the organization‘s everyday activities and design ways to help local businesses tap into technology opportunities. Many communities have been able to incorporate technology into both their practices and programs while others have struggled to understand the capabilities of this industry. As the information age and technology sector maintain steady growth, the need for more advanced economic development activity is expanding as well. Technology development encompasses increased infrastructure capabilities, advanced financing options, innovative marketing processes and start-up business assistance.
Economic Development vs. Economic Growth
Development is a qualitative change, which entails changes in the structure of the economy, including innovations in institutions, behaviour, and technology
Growth is a quantitative change in the scale of the economy - in terms of investment, output, consumption, and income.
According to this view, economic development and economic growth are not necessarily the same thing. First, development is both a prerequisite to and a result of growth. Development, moreover, is

prior to growth in the sense that growth cannot continue long without the sort of innovations and structural changes noted above. But growth, in turn, will drive new changes in the economy, causing new products and firms to be created as well as countless small incremental innovations. Together, these advances allow an economy to increase its productivity, thereby enabling the production of more outputs with fewer inputs over the long haul. Environmental critics and sustainable development advocates, furthermore, often point out that development does not have to imply some types of growth. An economy, for instance, can be developing, but not growing by certain indicators. Indeed, the measure of productivity should not be solely monetary; it should also address the issues like how effectively scarce natural resources are being used? How well pollution is being reduced or prevented? Etc.
Stages of Economic Development
Professor W.W. Rustow has defined and analysed in his book ‗The stages of economic growth‘, the five stages of economic development:
1. The traditional society: In the traditional long-lived social and economic system, the output per head is very low and tends not to rise. There are still few examples of traditional societies in this 21st century, that is, Afghanistan, Somalia, Ethiopia, etc.
2. The pre-conditions for take-off: sometimes also referred to ‗preparatory period‘. It covers a long period of a century or more during which the preconditions for take-off are established. These conditions mainly comprise fundamental changes in the social, political and economic fields; for example, (i) a change in society‘s attitudes towards science, risk-taking and profit-earning, (ii) the adaptability of the labour force; (iii) political sovereignty; (iv) development of a centralised tax system and financial institutions; and (v) the construction of certain economic and social overheads like rail roads and educational institutions.
3. The take-off stage: This is the crucial stage which covers a relatively brief period of two or three decades in which the economy transforms itself in such a way that economic growth subsequently takes place more or less automatically. The take-off is defined as the interval during which the rate of investment increases in such a way that real output per capita rises and this initial increase carries with it radical changes in the techniques of production and the disposition of income flows which perpetuate the new scale of investment and perpetuate thereby the rising trend in per capita output.
4. The drive to maturity: It is the stage of increasing sophistication of the economy. Against the background of steady growth, new industries are developed, there is less reliance on imports and more exporting activity. The economy demonstrate its capacity to move beyond the original industries which powered its takeoff, and to absorb and to apply efficiently the most advanced fruits of modern technology.
5. The stage of mass production and mass consumption: The fourth stage ends in the attainment of fifth stage, which is the period of mass production and consumption. The economy is characterised by affluent population, availability of durable and sophisticated consumer goods, hi-tech industries, and production of diversified goods and services. USA, UK, Canada, France, Germany, Japan, Spain, Italy, etc are the examples.
Characteristics of Developing Economies
A developing country is one with real per capita income that is low relative to that in industrialised countries like US, Japan and those in Western Europe. Developing countries typically have population with poor health, low levels of literacy, inadequate dwellings, and meagre diets. Life expectancy is low and there is a low level of investment in human capital.

1. Deficiency of capital: One indication of the capital deficiency is the low amount of capital per head of population. Shortage of capital is reflected in the very low capital-labour ratio. Not only is the capital stock extremely small, but the current rate of capital formation is also very low, which is due to low inducement to invest and to the low propensity to save. Thus low level of per capita income limits the market size.
2. Excessive dependence on agriculture: Most of the less-developed countries are agrarians. In Pakistan, most of the people are engaged in agriculture. Whereas in developed countries 15% of the population is engaged in agriculture. The excessive dependence on agriculture in less developed countries is due to the fact that non-agricultural occupations have not grown in proportion with the growth in population. Hence, the surplus labour is to be absorbed in agriculture.
3. Inequalities in the distribution of income and wealth: In under-developed countries, there is a concentration of income in a few hands. In other terms, the income is insufficient to meet the requirements of the whole economy. Such income is diverted to non-productive investments such as jewellery and real-estates, and unproductive social expenditure.
4. Dualistic economy: Dualistic economy refers to the existence of two extreme classes in an economy, particularly less-developed economy. There are old and new production methods, educated and illiterate population, rich and poor, modern and backward, capitalists and socialists, donkey carts and motor cars existing side by side. This situation creates an atmosphere of great conflict and contradiction, and hampers the economic development in the long-run.
5. Lack of dynamic entrepreneurial abilities and highly skilled labour
6. Inadequate infrastructure: like airports, rail roads, highways, overheads, bridges, telecommunication facilities, sewerage and drainage, power generation, hospitals, etc.
7. Rapid population growth and disguised unemployment
8. Under-utilisation of natural resources
9. Poor consumption pattern: In less-developed countries, most of the people‘s income is spent on basic necessities of life. They are too poor to spend on other industrial goods and services.
Determinants of Economic Growth
(Factors of Economic Development in UDCs / Reasons of Failure of Under-Developed Countries)
The process of economic development is a highly complex phenomenon and is influenced by numerous and varied factors, such as political, social and cultural factors. The supply of natural resources and the growth of scientific and technological knowledge also have a strong bearing on the process of economic development. From the standpoint of economic analysis, the most important factors determining the rate of economic development are:
1. Availability of natural resources: The availability and use of natural resources within a country play a vital role in the economic development. Many poor countries have enormous amount of natural resources, but they are failed to explore them. The reason is that the government has not provided necessary incentives to the farmers and landowners to invest in capital and technologies that will increase their land‘s yield. In natural resources, minerals, oil and gas, forests, oceans and seas, livestock, land‘s fertility, and mountains are generally included. It must be noted here that the existence of natural resources is not a sufficient condition of economic growth. Many poor and under-developed countries are rich with natural resources but there is a problem of availability of capital required for their extraction. Such countries include Pakistan, India, Afghanistan, and several African and Latin American countries.

2. Rate of capital formation: The second important factor of economic development is the rate of capital formation. Keynes also ascribed the economic development of Europe to the accumulation of capital. According to him, Europe was so organised socially and economically as to secure the maximum accumulation of capital. The crux of the problem of economic development in any under-developed country lies in a rapid expansion of the rate of its capital investment so that it attains a rate of growth of output which exceeds the rate of growth of population by a significant margin. Only with such a rate of capital investment will the living standards begin to improve in a developing country.
Capital formation or inducement to invest depends on the propensity to save. In less-developed countries, there is a very low saving tendency because of low income. Developed countries managed to save 20% of their output in capital formation. Whereas only 5% of the national income is saved in UDCs. Much of the savings goes to housing and basic needs and, therefore, a very small amount is left over for development.
Capital formation is the basic tool for economic development. It may take decades to invest in building up a country‘s infrastructure, information technologies, power-generating plants, and other capital goods industries. Developing countries must have to build up their infrastructure, or social overhead capital in order to set path for economic glory.
If there are so many obstacles in finding domestic savings for capital formation, then the country depends on foreign sources of funds. Less-developed countries have to welcomed the flow of foreign capital or foreign borrowings. As long as the exports of these countries grew at the same rate as borrowings, it is a favourable condition. But several poor countries needed all their earnings simply to pay interest on their foreign debts. This is an adverse situation. Such countries need to boost up their production in order to cope with their current indebtedness.
3. Capital-output ratio: Apart from the ratio of capital formation to the aggregate national income, the growth of output depends upon the capital-output ratio. The capital-output ratio may be defined as the relationship of investment in a given economy or industry for a given time period to the output of that economy or industry for a similar time period. The productivity of capital depends on many factors such as the degree of technological development associated with capital investment, the efficiency of handling new types of equipment, the quality of managerial and organisation skill, the existence and the extent of the utilisation of economic overheads and the pattern and rate of investment. For instance, the higher the proportion of investment devoted to the production of direct commodities, the lower the capital-output ratio, and higher the proportion of investment devoted to public utilities, i.e., economic and social overheads, the higher shall be the capital-output ratio, and vice versa. Higher the investment devoted to heavy industry, the higher will be the capital-output ratio, and vice versa. Higher the rate of investment and greater the technological progress, the lower will be the capital-output ratio. The capital-output ratio also varies with the prices of inputs.
4. Technological progress: The key to economic development for any country is the technological progress. Greater the technological progress, the higher will be the economic progress. The great importance of technological progress in the economic progress of Western European countries was recognised by Karl Marx himself. The technological progress of a country includes development in research and development, means of transportation, telecommunication, energy-generation, oil and gas exploration, information technologies, integrated circuits manufacturing, etc. Again, without capital formation, the technological progress is impossible, because building huge hi-tech industries requires a huge investment and a favourable economic condition.
5. Dynamic entrepreneurship: The modern economists recognise the dynamic role of entrepreneurs in promoting the economic growth of the country. The efficient utilisation of entrepreneurial skills can only be ensured when there is presence of considerable profit motive. The entrepreneur maximises his profit by making innovations, i.e., by bringing out a new product, new technologies, new product lines, new market, new sources of raw materials and by adopting an

optimum combination of factors of production. Thus he is making the most significant contribution in the national income and in the technological progress.
The private enterprises in UDCs like India and Pakistan, has not taken them any far on the road of economic development. There is a lacking of entrepreneurial skills in under-developed countries. There is a lack of innovation. Entrepreneurs are more attracted by commerce than by industries. So it becomes the government‘s duty to ensure the supply of required type of entrepreneurship.
6. Human Resources: Besides efficient entrepreneurs, the economic development of a country depends on the supply of skilled and semi-skilled labour, and requires government‘s greatest contribution to the development of human resources. The development of human resources depends on the availability of hygienic food; quantity and quality of education centres and health centres; clean water; means of transportation and communication; entertainment; counselling services; loan facilities; scholarship; job security and old age benefits; etc.
In poor countries GDP rises but at the same time the population also grows. Several developing countries are facing high birth rates with stagnant national income per head. It is hard for poor countries to overcome poverty with birth rates so high. In under-developed countries, the economic planners emphasise the following specific programmes:
(a) Control disease and improve health and nutrition,
(b) Improve education, reduce illiteracy and train workers, and
(c) Ensure that the labour force is well-equipped with necessary and competing skills.
7. Rate of growth of population: The size and rate of population growth has an important bearing on the economic development of a country. A rapidly growing population aggravates the food problem, worsens the unemployment situation, adds to the number of unproductive consumers, keeps down per capita income and labour efficiency, and militates against capital formation. A rapid rate of population growth acts like a drag on economic development and slows down the pace of economic growth.
8. Price Mechanism: In under-developed economies, a very little emphasis is placed on price mechanism. The disequilibrium of prices has severe consequences on the efficiency of the economy. The resource utilisation becomes lack of optimality. The productive machinery of the community is hampered. There is no guarantee as regard to the quantity and quality of the production.
In order to speed up the economic development, price mechanism must go or confined to unimportant sectors of the economy like the purchase and sale of consumer goods.
9. Non-economic factors: Non-economic factors include social factors, demographical factors, institutional factors and political factors. The economic development depends on the political sovereignty, the complexion and competence of government, quality of administration, and political ideology of government.
Vicious Cycle of Poverty
Many developing countries are caught up in vicious cycle of poverty. Low level of income prevents savings, retards capital growth, hinders productivity growth, and keeps income low. Successful development may require taking steps to break up the chain at many points. Other points in poverty are also self-reinforcing. Poverty is accompanied by low levels of education, literacy and skill; these in turn prevent the adaptation to new and improved technologies and lead to rapid population growth. The vicious cycle of poverty is depicted as below:

Overcoming the barriers of poverty often requires a concentrated effort on many fronts and a ‗big-push‘ is required to break the ‗vicious cycle‘ into ‗virtuous circle‘. If the country has stepped to invest more, improve health and education, develop labour skills, and curb population growth, she can break vicious cycle of poverty and stimulate a virtuous circle of rapid economic growth.
Approaches to Economic Development
The following approaches are developed in recent years to explain the economic development and answer the question how countries break out of the vicious cycle of poverty to virtuous circle of economic development:
1. The Take-off Approach: Take-off is one of the stages of economic growth. Different economies have been benefited from ‗take-off‘ approach in different periods, including England at the beginning of eighteenth century, the United States at the mid of nineteenth century, and Japan in early twentieth century. The take-off is impelled by leading sectors such as a rapid growing export market or an industry displaying large economies of scale. Once these leading sectors begin to flourish, a process of self-sustained growth (i.e. take-off) occurs. Growth leads to profits, profit are reinvested, capital, productivity and per capita income spur ahead. The virtuous cycle of economic development is under way.
2. The Backwardness Hypothesis and Convergence: The second approach emphasises the global context of economic development. Poor countries have important advantages that the pioneers of industrialisation had not. Developing nations can draw upon the capital, skills and technologies of advanced countries. Developing countries can buy modern textile machinery, efficient pumps, miracle seeds, chemical fertilisers and medical supplies. Because they can lean on the technologies of advanced countries. Today‘s developing nations can grow more rapidly than Great Britain, Western European Countries and United States in past. By drawing upon more productive technologies of the leaders, the developing countries would expect to see convergence towards the technological frontier.
3. Balanced Growth: Some writers suggest that growth is a balanced process with countries progressing steadily ahead. In their view, economic development resembles the tortoise making continual progress, rather than the hare, who runs in spurts and then rats when exhausted. Simon Kuznets examined the history of thirteen advanced countries and conceived that the balanced growth model is most consistent with the countries he studied. He noticed no significant rise or fall in economic growth as development progressed.
Note one further important difference between these approaches. The ‗take-off‘ theory suggests that there will be increasing divergence among countries (some flying rapidly, while others are unable to leave the ground). The ‗backward‘ hypothesis suggests ‗convergence‘, while the ‗balanced-growth‘
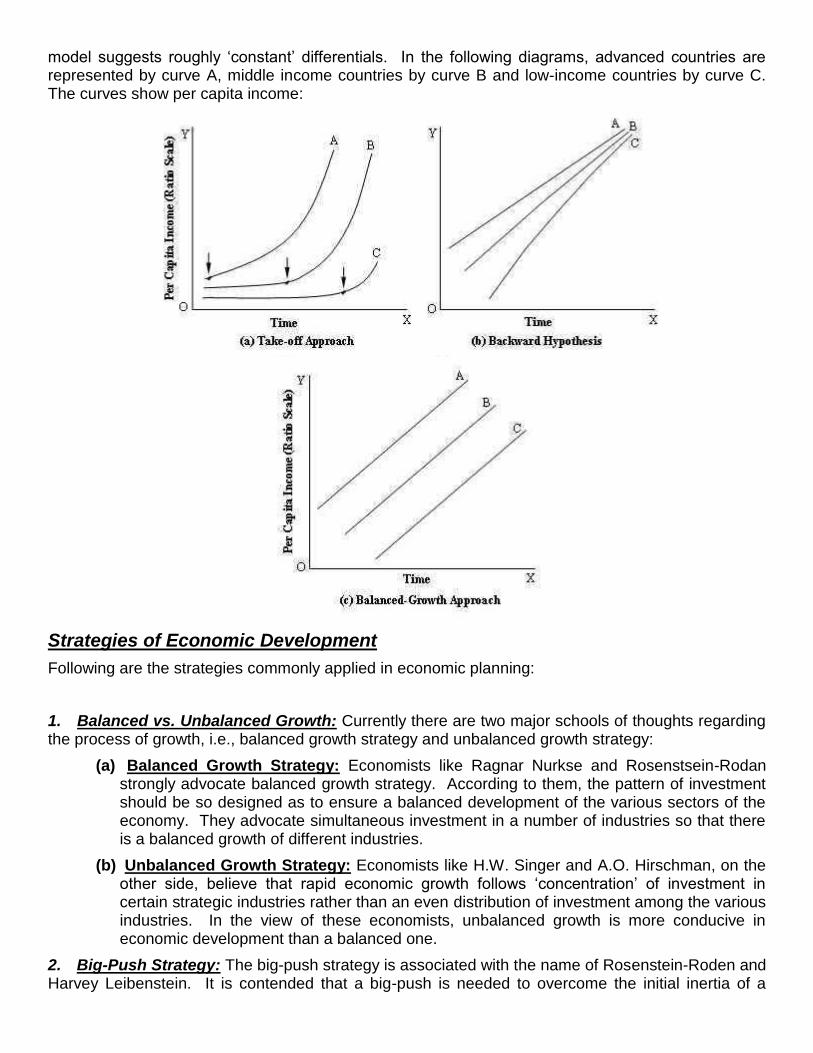
model suggests roughly ‗constant‘ differentials. In the following diagrams, advanced countries are represented by curve A, middle income countries by curve B and low-income countries by curve C. The curves show per capita income:
Strategies of Economic Development
Following are the strategies commonly applied in economic planning:
1. Balanced vs. Unbalanced Growth: Currently there are two major schools of thoughts regarding the process of growth, i.e., balanced growth strategy and unbalanced growth strategy:
(a) Balanced Growth Strategy: Economists like Ragnar Nurkse and Rosenstsein-Rodan strongly advocate balanced growth strategy. According to them, the pattern of investment should be so designed as to ensure a balanced development of the various sectors of the economy. They advocate simultaneous investment in a number of industries so that there is a balanced growth of different industries.
(b) Unbalanced Growth Strategy: Economists like H.W. Singer and A.O. Hirschman, on the other side, believe that rapid economic growth follows ‗concentration‘ of investment in certain strategic industries rather than an even distribution of investment among the various industries. In the view of these economists, unbalanced growth is more conducive in economic development than a balanced one.
2. Big-Push Strategy: The big-push strategy is associated with the name of Rosenstein-Roden and Harvey Leibenstein. It is contended that a big-push is needed to overcome the initial inertia of a

stranger economy. Rosenstein-Roden observes that there is a minimum level of resources that must be devoted to a development programme if it is to have any chance of success. Launching a country into self-sustaining growth is like getting an airplane off the ground. There is critical ground speed which must be passed before the craft can become airborne.
3. Balanced, Unbalanced and Big-Push (BUB) Strategy: The advocates of this strategy suggest that no single strategy will take us to the goal of economic development. Not only has the strategy to be changed from time to time as the situation may require, but it may be necessary sometimes to strike a balance between the alternative strategies. In the initial stage, which is characterised by unbalances, counter-unbalance strategy is to be adopted. But once an appropriate balance is attained by a fair dose of big-push, the strategy of balanced growth may be applied to further planning.
Issues in Economic Development
Following are the important issues in under developed countries:
1. Industrialisation vs. Agriculture: In most countries, incomes in urban areas are almost more than double in rural areas. Many nations jump to the conclusion that industrialisation is the cause rather than effect of affluence. To accelerate industrialisation at the expense of agriculture has led many analysis to rethink the role of farming. Industrialisation tends to be capital intensive, attract workers into crowded cities, and often produces high level of unemployment. Rising productivity on farms may require less capital, while providing productive for surplus labour.
2. Inward vs. Outward Orientation: This is a fundamental issue of economic development towards international trade. Should the developing countries be self-sufficient? If yes, the country has to replace imported goods and services with domestic production. This strategy is known as „import substitution‟ or „inward orientation‟.
If the country decides to pay for imports it needs by improving efficiency and competitiveness, developing foreign markets, and giving incentives for exporters. This is called „outward orientation‟ strategy. It is generally observed that by subsidising import substitution, competition is limited, innovation is dampened, productivity growth is slow down and country‘s real income falls to a lower level. Whereas, the outward orientation sets up a system of incentives that stimulates exports. This approach maintains a competitive FOREX rate, encourages exports, and minimises unnecessary government regulation of businesses esp. small and medium sized firms.
3. State vs. Market: The cultures of many developing countries are hostile to the operation of markets. Often competition among firms or profit seeking behaviour is contrary to traditional practices, religious beliefs, or vested interest. Yet decades of experience suggest that extensive reliance on markets provides the most effective way of managing an economy and promoting rapid economic growth.
The government has a vital role in establishing and maintaining a healthy economic environment. It must ensure law and order, enforce contracts, and orient its regulations towards competition and innovation. The government plays a leading role in investment in human capital through education, health and transportation, but the government should minimise its intervention or control in sectors where it has no comparative advantage. Government, should focus its efforts on areas where there are clear signs of market failure.

Models of Economic Growth
Classical Model of Economic Growth
Every nation strives after development. Economic progress is an essential component, but it is not the only component. Economic development is not purely an economic phenomenon. In an ultimate sense, it must encompass more than the material and financial side of people‘s lives. Economic development should therefore be perceived as a multidimensional process involving the reorganization and reorientation of entire economic and social systems. In addition to improvements in incomes and output, it typically involves radical changes in institutional, social, and administrative structures. Finally, although development is usually defined in a national context, its widespread realization may necessitate fundamental modification of the international economic and social system as well.
The classical theories of economic development consist of following four schools of thought:
1. Linear-stages-of-growth model: Theorists of the 1950s and 1960s viewed the process of development as a series of successive stages of economic growth through which all countries must pass. It was primarily an economic theory of development in which the right quantity and mixture of saving, investment, and foreign aid were all that was necessary to enable developing nations to proceed along an economic growth path that historically had been followed by the more developed countries. Development thus became synonymous with rapid, aggregate economic growth.
This linear-stages approach was largely replaced in the 1970s by two competing economic schools of thought – theories of structural change and international-dependence theories.
2. Theories and patterns of structural change: Theories and patterns of structural change uses modern economic theory and statistical analysis in an attempt to portray the internal process of structural change that a ―typical ‖developing country must undergo if it is to succeed in generating and sustaining a process of rapid economic growth.
Structural-change theory focuses on the mechanism by which under-developed economies transform their domestic economic structures from a heavy emphasis on traditional subsistence agriculture to a more modern, more urbanised, and more industrially diverse manufacturing and service economy. It employs the tools of neo-classical price and resource allocation theory and modern econometrics to describe how this transformation process takes place. Two well-known representative examples of the structural-change approach are the ‗two-sector surplus labour‘ theoretical model of Sir W. Arthur Lewis, and the ‗patterns of development‘ empirical analysis of Hollis B. Chenery and his co-authors.
3. International-dependence revolution: The international-dependence revolution was more radical and political in orientation. It viewed underdevelopment in terms of international and domestic power relationships, institutional and structural economic rigidities, and the resulting proliferation of dual economies and dual societies both within and among the nations of the world. Dependence theories tended to emphasize external and internal institutional and political constraints on economic development. Emphasis was placed on the need for major new policies to eradicate poverty, to provide more diversified employment opportunities, and to reduce income inequalities.
International-dependence models view developing countries as troubled by institutional, political, and economic rigidities, both domestic and international, and caught up in a dependence and dominance relationship with rich countries. Within this general approach there are three major streams of

thought – the neo-colonial dependence model, the false-paradigm model, and the dualistic-development thesis.
4. Neoclassical or free-market counterrevolution: This theory is also known as neo-liberal theory. Throughout of the 1980s and 1990s, the neoclassical or free-market counterrevolution approach prevailed. It emphasizes the beneficial role of free markets, open economies, and the privatisation of inefficient public enterprises. Failure to develop, according to this theory, is not due to exploitive internal and external forces as expounded by dependence theorists. Rather, it is primarily the result of too much government intervention and regulation of the economy.
In the 1980s, the political ascendancy of conservative governments in the United States, Canada, Britain, and West Germany brought a neoclassical counterrevolution in economic theory and policy. In developed nations, this counterrevolution favoured supply-side macroeconomic policies, rational expectations theories, and the privatisation of public corporations. In developing countries it called for freer markets and the dismantling of public ownership, central planning, and government regulation of economic activities. Neo-classicists obtained controlling votes on the boards of the world‘s two most powerful international financial agencies — the World Bank and the International Monetary Fund. In conjunction and with the simultaneous erosion of influence of organizations such as the International Labour Organization (ILO), the United Nations Development Program (UNDP), and the United Nations Conference on Trade and Development (UNCTAD), which more fully represent the views of LDC delegates.
The neo-classical approach states that underdevelopment arises from:
Poor resource allocation due to incorrect price policies, and
Government‘s intervention in the economic activities.
Neo-classical or neo-liberal approach states that economic growth can be put to spur by:
Permitting competitive free markets to flourish, Privatising state-owned enterprises, Promoting free trade and export expansions, Welcoming investors from developed economies, and
Eliminating the plethora of government regulations and price distortions in factor, product and market.
1. Linear-stages-of-growth model:
Following are the growth models studied under linear-stages:
(a) Rostow’s Stages of Growth: The stages-of-growth model of development is taken by most of the newly independent countries. According to Walt W. Rostow doctrine, the transition from underdevelopment to development can be described in terms of a series of steps or stages through which all countries must proceed. According to Rostow, it is possible to identify all societies, in their economic dimensions, as lying within one of five categories:
The traditional society, The pre-conditions to take-off into self-sustaining growth, The take-off, The drive to maturity, and
The age of high mass-consumption.

Rostow also clarified that these stages are not merely a way of generalising certain factual observations about the sequence of development of modern societies. He argued that the advanced countries had all passed the stage of take-off into self-sustaining growth and the under-developed countries that were still in either the traditional society or the pre-conditions stage. One of the principal strategies of development necessary for any take-off was the mobilisation of domestic and foreign saving in order to generate sufficient investment to accelerate economic growth.
(b) Harrod-Domar Model: This model, developed independently by RF Harrod and ED Domar in the l930s, suggests savings provide the funds which are borrowed for investment purposes.
The model suggests that the economy's rate of growth depends on:
the level of saving
the productivity of investment i.e. the capital output ratio
For example, if $10 worth of capital equipment produces each $1 of annual output, a capital-output ratio of 10 to 1 exists. A 3 to 1 capital-output ratio indicates that only $3 of capital is required to produce each $1 of output annually.
The Harrod-Domar model was developed to help analyse the business cycle. However, it was later adapted to 'explain' economic growth.
2. Structural-change theory:
Following economic growth model represents the structural-change theory:
(a) Lewis Theory of Development: It is one of the best-known early theoretical models of economic development that focused on the structural transformation of a primarily subsistence economy was that formulated by Noble-prize winner Sir W. Arthur Lewis in the mid 1950s. His theory was later modified by his followers. The Lewis two-sector economy model became the general theory of the development process in surplus-labour Third-World nations during most of the 1960s and 1970s. In the Lewis model, the underdeveloped economy consists of two sectors:
A traditional, overpopulated rural subsistence sector characterised by zero-marginal labour productivity. Lewis classify this as ‗surplus-labour‘ in the sense that it can be withdrawn from the agricultural sector without any loss of output, and
A high, productivity modern urban industrial sector into which labour from the subsistence sector is gradually transferred.
The primary focus of the model is on both the process of labour transfer and the growth of output and employment in the modern sector. Both labour transfer and modern-sector employment growth are brought about by output expansion in that sector.
(b) Patterns of Development: The patterns of development analysis of structural change focuses on the sequential process through which the economic, industrial and institutional structure of an underdeveloped economy is transformed over time to permit new industries to replace traditional agriculture as the engine of economic growth.

In addition to the accumulation of capital both physical and human, a set of interrelated changes in the economic structure of a country are required for the transition from a traditional economic system to a modern one.
These structural changes involve virtually all economic functions, including the transformation of production and changes in the composition of consumer demand, international trade and resource use as well as changes in socio-economic factors such as urbanisation, and the growth and distribution of a country‘s population.
3. International-dependence revolution:
Within this general approach, there are three major streams of thought:
(a) Neo-Colonial Dependence Model: It is an indirect outgrowth of Marxist thinking. It refers to the existence and continuance of underdevelopment in a highly unequal international capitalist system. The international system is dominated by unequal power relationships between the centre (the developed nations) and the periphery (the less developed countries). The poor nations attempt to become self-reliant and independent but this system makes it difficult and sometimes even impossible.
According to this theory, certain groups in the developing countries (including landlords, entrepreneurs, military rulers, merchants, salaried public officials, and trade union leaders) who enjoy high incomes, social status, and political power constitute a small elite ruling class whose principal interests are in perpetuation of the international capitalist system of inequality. Directly and indirectly, they serve (are dominated by)and are rewarded by (are dependent on) international special-interest power groups including multinational corporations, national bilateral-aid agencies, and multilateral assistance organizations like the World Bank or the International Monetary Fund (IMF). Therefore, a major restructuring of the world capitalist system is required to free dependent developing nations from the direct and indirect economic control of their developed-world and domestic oppressors.
Curiously, a very similar but obviously non-Marxist perspective statement was expounded by Pope John Paul II in his widely quoted 1988 encyclical letter:
“One must denounce the existence of economic, financial, and social mechanisms which, although they are manipulated by people, often function almost automatically, thus accentuating the situation of wealth for some and poverty for the rest. These mechanisms, which are manoeuvred directly or indirectly by the more developed countries, by their very functioning, favour the interests of the people manipulating them. But in the end they suffocate or condition the economies of the less developed countries.”
(b) False-Paradigm Model: The second and less radical international-dependence approach to development, the false-paradigm model, attributes underdevelopment to faulty and inappropriate advice provided by well-meaning but often uninformed, biased, and ethnocentric international ‗expert‘ advisers from developed-country assistance agencies and multinational donor organizations. These experts offer sophisticated concepts, elegant theoretical structures, and complex econometric models of development that often lead to inappropriate or incorrect policies. Because of institutional factors such as the central and remarkably resilient role of traditional social structures (i.e., tribe, caste, class, etc.), the highly unequal ownership of land and other property rights, the disproportionate control by local elites over domestic and international financial assets, and the very unequal access to credit, these policies, based as they often are on mainstream, Lewis-type surplus labour or Chenery-type structural-change

models, in many cases merely serve the vested interests of existing power groups, both domestic and international.
(c) Dualistic Development Thesis: Dualism is a concept widely discussed in development economics. It represents the existence and persistence of increasing divergences between rich and poor nations and rich and poor peoples on various levels. One of the elements of dualism is that there is a coexistence of wealthy, highly educated elites with masses of illiterate poor people within the same country or city. According to this theory, there is a coexistence of powerful and wealthy industrialized nations with weak, impoverished peasant societies in the international economy.
This coexistence is chronic and not merely transitional. It is not due to a temporary phenomenon, in which with the capacity of time, the discrepancy between superior and inferior elements would be eliminated.
4. Neo-classical counterrevolution:
This approach can be implemented through the following three models:
(a) Free-Market Analysis: Free-market analysis argues that markets alone are efficient if:
Product markets provide the best signals for investments in new activities, Labour markets respond to these new industries in appropriate ways, Producers know best what to produce and how to produce it efficiently, and
Product and factor prices reflect accurate scarcity values of goods and resources.
Under free-market, competition is effective not necessarily perfect. Technology is freely available and nearly costless to absorb. Information is correct and nearly costless to obtain.
(b) Public-Choice Theory: Public-choice theory, also known as „new political economy approach‟, goes even further to argue that government can do nothing right. This is because that politicians, bureaucrats, citizens and states act solely from a self-interested perspective, using their powers and the authority of government for their own selfish needs. Citizens use political influence to obtain special benefits (sometimes also referred to as „rent‟) from government policies, for example, import licenses, or rationed forex. Politicians use government resources to consolidate and maintain positions of power and authority. Bureaucrats use their positions to extract bribes from rent-seeking citizens and to operate protected business on the side. And finally state uses its power to confiscate private property from individuals. The net result is not only a misallocation of resources but also a general reduction in individual freedoms. The conclusion, therefore, is that minimal government is the best government.
(c) Market-Friendly Approach: The third approach is market-friendly approach, which is the most recent variant on the neoclassical counterrevolution. It is associated principally with the writings of the World Bank and its economists, many of whom were more in the free-market and public-choice camps during the 1980s. This approach recognizes that there are many imperfections in LDC product and factor markets and that governments do have a key role to play in facilitating the operation of markets through ‗non-selective‘ (market-friendly) interventions — for example, by investing in physical and social infrastructure, health care facilities, and educational institutions and by providing a suitable climate for private enterprise.

Karl Marx’s Model
Czarist Russia grew rapidly from 1880 to 1914; it was considerably less developed than industrialised countries like US and Great Britain. World War I brought great hardship to Russia and allowed the communists to seize power. From 1917 to 1933, the Soviet Union experimented with different socialist models before settling on central planning. Most economists believed until recently that the Soviet Union grew rapidly from 1928 until the mid 1960s. After the mid 1960s, growth in Soviet Union stagnated and output actually began to decline. In the late 1980s and early 1990s, open inflation erupted. Prices were well below market-clearing levels and acute shortages arose in what is called „repressed inflation‟. The repressive political system was unacceptable to the people in Soviet Union and some countries in Eastern Europe and was universally rejected in 1989.
The father of this repressive political system – Communism is Karl Marx (1818 – 1883). The centrepiece of Marx‘s work is an incisive analysis of the strengths and weaknesses of capitalism. He argued that it is the only labour power that gives value to a commodity. By imputing all the value of output to labour, Marx hoped to show that profits, which is the part of output that is produced by workers but received by capitalists, amount to „unearned income‟. According to Marx, this unearned income is unjustly received by capitalists. This injustice can be eliminated by transferring the ownership of factories and other means of production from capitalists to workers.
Marx saw capitalism as inevitably leading to Socialism. In Marx‘s world, technology enables capitalists to replace workers with machinery as a means of earning greater profits. As a result unemployment increases with the increased use of technological advances. This increasing accumulation of capital will reduce the rate of profit and investment opportunities, and therefore, the ruling capitalists will become imperialists. Karl Marx believed that the capitalist system could not continue this unbalanced growth. Marx predicted increasing inequality under capitalism. Business cycles would become ever more violent as mass poverty resulted in macro-economic under-consumption. Finally, a cataclysmic depression would sound the death knell of capitalism. The economic interpretation of history is one of Marx‘s lasting contributions to Western thought. Marx argued that economic interests lie behind and determine our values. His arguments against capitalism suggested communism would arise in the most highly developed industrial countries. Instead, it was backward, feudal Russia that adopted the Marxist vision.
Features of Karl Marx’s Socialist Model:
1. Government ownership of productive resources, 2. Planning is centralised, 3. Equal distribution of income, 4. Peaceful and democratic evolution, 5. Labour theory of value – value of a product represents the human labour used in production,
and
6. Theory of surplus value.
Theory of Surplus Value:
Marx propounded his theory of surplus value on the basis of his theory of value. He said that in order to enable labour to carry on the work of production, he should have some instruments of production and other facilities but he lacks these facilities. Hence, he has to sell his labour to the capitalist. It is, however, not necessary for the capitalist to pay labour the full value of the product produced by him. Here Karl Marx supported his theory on the basis of a classical theory, viz., the subsistence theory of value, according to which the level of wages is determined by the subsistence of the worker. The

work of labour force is not merely to produce value equal to its price but much more. This surplus value is the difference between the market value of the commodity and the cost of the factors used in the production of commodity. Karl Marx says that the manufacturer gets for his commodity more than what he has spent on labour and other costs. The excess of market value over the costs is the surplus value. This surplus is created because labour is paid much less than is due to it. He characterises the appropriation of the surplus value by the capitalist as robbery and exploitation. The capitalist class goes on becoming richer and richer through exploitation of the working class.

Harrod Domar Growth Model
As we know that one of the principal strategies of development is mobilisation of domestic and foreign saving in order to generate sufficient investment to accelerate economic growth. The economic mechanism by which more investment leads to more growth can be described in terms of Harrod-Domar growth model, often referred to as the AK model.
Every economy must save a certain proportion of the national income, if only to replace worn-out or impaired capital goods (buildings, equipment, and materials). However, in order to grow, new investments representing net additions to the capital stock are necessary. If we assume that there is some direct economic relationship between the size of the total capital stock, K, and total GNP, Y – for example, if $3 of capital is always necessary to produce a $1 stream of GNP – it follows that any net additions to the capital stock in the forms of new investment will bring about corresponding increases in the follow of national output, GNP. This relationship is known as „capital-output ratio‟
and is represented as „k‟. in the above case „k‟ is roughly 3:1.
If we further assume that the national savings ratio „S‟ is a fixed proportion of national output (e.g.
6%) and that total new investment is determined by the level of total savings. We can construct the following simple model of economic growth:
· Saving (S) is some proportion, s, of national income (Y) such that we have the simple equation:
S = s .Y ---------------------------- (i)
· Net investment (I) is defined as the change in the capital stock, K, and can be represented
by ΔK such that:
I = ΔK ----------------------------- (ii)
But because the total capital stock, K, bears a direct relationship to total national income or output, Y,
as expressed by the capital-output ratio, k, it follows that:
K = k Y
Or
ΔK = k ΔY
Or
ΔK = k.ΔY ------------------------------- (iii)
· Finally, because net national savings, S, must equal net investment, I, we can write this equality as:

S = I ------------------------------- (iv)
But from equations (i), (ii) and (iii), we finally get the following equation:
I = ΔK = k. ΔY
Therefore, we can rewrite the equation (iv) as follows:
S = s.Y = k.ΔY = ΔK = I --------------- (v)
Or simply
s.Y = k.ΔY -----------------------------------(vi)
Dividing both the sides of equation (vi) first Y and then by k, we obtain the following expression:
ΔY = s -------------------------------------- (vii) Y k
Note that the left-hand side of the equation i.e., ΔY / Y represents the rate of change or rate of
growth in GNP (i.e., the percentage change in GNP).
The Harrod Domar Model, more specifically says that in the absence of government, the growth rate of national income will directly or positively related to the savings ratio (i.e., the more an economy is able to save and invest out of a given GNP, the greater the growth of that GNP will be. Harrod Domar Model further states that the growth rate of national income will be inversely or negatively related to the economic capital-output ratio (i.e., the higher k is, the lower the rate of GNP growth will be).
The additional output can be obtained from an additional unit of investment and it can be measured
by the inverse of the capital-output ratio, k, because this inverse, 1 / k, is simply the output-capital or
output-investment ratio. It follows that multiplying the rate of new investment, s = I / Y, by its
productivity, 1 / k, will give the rate by which national income or GNP will increase.
For example, the national capital-output ratio in an under-developed country is, let say, 3 and the aggregate saving ratio (s) is 6% of GNP, it follows that this country can grow at a rate of 2% (i.e., 6%
/ 3 or s / k or ΔY / Y). Now suppose that the national saving rate increased from 6% to 15% through increased taxes, foreign aids, and / or general consumption sacrifices – GNP growth can be transferred from 2% to 5% (15% / 3).
According to Rostow and other theorists, the countries that were able to save 15% to 20% of GNP could grow at a much faster rate than those that saved less. Moreover, this growth would then be self-sustained. The mechanisms of economic growth and development, therefore, are simply a matter of increasing national savings and investment.
The main obstacle or constraint on development, according to this theory, was the relatively low level of new capital formation in most poor countries. But if a country wanted to grow at, let say, a rate of 7% per annum and if it could not generate savings and investment at a rate of 21% (i.e., 7% × 3) of

national income but could not only manage to save 15%, it could seek to fill this saving gap of 6% through either foreign aid or private foreign investment.
Limitations of the model:
1. Economic growth and economic development are not the same. Economic growth is a necessary but not sufficient condition for development
2. Harrod Domar model was formulated primarily to protect the developed countries from chronic unemployment, and was not meant for developing countries.
3. Practically it is difficult to stimulate the level of domestic savings particularly in the case of LDCs where incomes are low.
4. It fails to address the nature of unemployment exists in different countries. In developed countries, the unemployment is ‗cyclical unemployment‘, which is due to insufficient effective demand; whereas in developing countries, there is ‗disguised unemployment‘.
5. Borrowing from overseas to fill the gap caused by insufficient savings causes debt repayment problems later.
6. The law of diminishing returns would suggest that as investment increases the productivity of the capital will diminish and the capital to output ratio rise.
The Harrod-Domar model of economic growth cannot be rejected on the ground of above limitations. With slight modifications and reinterpretations, it can be made to furnish suitable guidelines even for the developing economies.

Schumpeter’s Model of Economic Growth
Joseph Schumpeter was a famous Austro-Hungarian economist, but never followed Austrian school of thought. His famous book was the Theory of Economic Development (1912), in which he first outlined his famous ‗theory of entrepreneurship‘. He argued that only daring entrepreneurs can create technical and financial innovations in the face of competition and falling profits, and that it was these spurts of activity which generated economic growth. After the World War I, Schumpeter joined the German Socialization Committee in Berlin - which then was composed of several Marxian scholars, and the Kiel School economists.
In 1919, Schumpeter became the Austrian Minister of Finance - unfortunately, presiding over the hyperinflation of the period, and thus was dismissed later that year. Schumpeter migrated in 1921 to the private sector and became the president of a small Viennese banking house. Ill luck dogged him: his bank collapsed in 1924. He drifted once again back into academia - taking up a teaching position at Bonn in 1925. In 1932, Schumpeter took up a position at Harvard, succeeding the Marshallian F.W. Taussig. Schumpeter ruled Harvard during the period of the ‗depression generation‘ of the 1930s and 1940s - when Samuelson, Tobin, Heilbroner, and Bergson were his students. His famous publications include Theory of Economic Development (1912), Business Cycles (1939), Capitalism, Socialism and Democracy (1942) and History of Economic Analysis (1954). He presented the theory of entrepreneurship, theory of business cycles, and theory of evolutionary economics.
In order to understand the Schumpeter‘s theory of economic development, it is necessary to understand the theory of evolutionary economics. The concept of evolution is an offspring of late 18th and early 19th century debates within philosophy and the social sciences. The theory of evolutionary economics is much more inspired by the Darwinian theory of natural selection. The general definition of evolution is the self-transformation process over time of a system. Such a system may be a population of living organisms, a collection of interacting individuals as in an economy or some of its parts, or even the set of ideas produced by the human mind. Therefore, an evolutionary theory is:
Dynamic — such that the dynamics of the processes, or some of their parts, can be represented;
Historical — in that it deals with historical processes which are irrevocable and path-dependent;
Self-transformation — in that it includes hypotheses relating to the source and driving force of the self-transformation of the system.
Schumpeter‘s theory of economic development is considered as a radical theory. It is considered radical in the context that it described the capitalist system as an evolutionary system. According to Schumpeter, capitalism is the system that internally generates changes and technological progresses. According to him, the process of economic development is inherently dynamic, as opposite to static nature of the theory of equilibrium. This does not mean that Schumpeter is against the theory of equilibrium. On the contrary it is the underlying base for his own capitalist dynamic model.
Schumpeter‘s model of economic development is not a substitute for the theory of equilibrium but rather a necessary complement. Without it, it is impossible to understand the functioning of an economic system. Schumpeter started through the ‗circular flow‘ as an essential block for building dynamic model. Schumpeter describes the circular flow with the following assumptions:
somewhere in the economic system a demand is ready awaiting every supply, and

nowhere in the system are there commodities without complements.
Under these conditions, all goods find a market, and the circular flow of economic life is closed. In a steady state, costs in this closed system are the price totals of the services of the production factors. Prices obtained for the products must equal these price totals. The ultimate logical consequence of this ideal model of the clearing market is that production must flow on essentially profitless – profit is a symptom of imperfection.
Schumpeter defines production as the combinations of materials and forces that are within our reach. The producer is not an inventor. All components that he needs for his product or service, whether physical or immaterial, already exist and are in most cases also readily available. The basic driving force behind structural economic growth is the introduction of new combinations of materials and forces, not the creation of new possibilities.
Development in the Schumpeterian sense is defined by the carrying out of new combinations. This concept covers the following five cases:
(i) The introduction of a new good – that is one with which consumers are not yet familiar – or a new quality of a good.
(ii) The introduction of a new method of production – that is one not yet tested.
(iii) The opening of a new market – that is a market into which the country in question has not previously entered.
(iv) The conquest of a new source of supply of raw materials or half-manufactured goods.
(v) The carrying out of the new organisation of any industry, like the breaking up of a monopoly position.

The basic structure from Schumpeter‘s model of economic development has two distinctive spheres. On the one hand is the semi-closed system of the circular flow that is either in equilibrium or striving for it. And, on the other hand, is the symbiotic pair of the entrepreneur and the sponsor that is always looking for ways to induce change in the peaceful yet boring routine-life of the circular flow. Both spheres function within an endless reservoir of new combinations, for example, scientific knowledge and technological inventions, but it is only the entrepreneur – backed by the capitalist – who is able to introduce new combinations and new routines in the circular flow.
According to Schumpeter, entrepreneur who initiates the process of innovation is the central of the process of economic development. Entrepreneurs are neither capitalists nor inventors; they see the potential of inventions and assume risk in innovating. Schumpeter regarded the entrepreneur as something of a social deviant and noted that migrants or aliens in any society have great potential to behave entrepreneurially. Schumpeter noted that increases of taxes, public policies favouring labour organisations, price controls, and licensing requirements that increase the costs of doing business are the greatest impediments to entrepreneurship. Under oppressive conditions, for example, the former Soviet Union, China, and present day Islamic societies, very few people innovate.
The creation of something new usually requires that something old be eliminated, for example, changes in the structure of demand or production result in structural unemployment. Economic growth cannot proceed without structural changes, i.e., economic development. Most technological progress is a result of activity specifically undertaken to develop new products, reduce costs, improve quality, or develop new markets.
Economic evolution is based on cyclical disruptions and breaks of economic structures, an endogenous transformation that results from the ‗process of creative destruction‘ as an essential feature of modern capitalism. This points at the internal logic of the cyclical restructuring of modern
capitalism for evolutionary change.
Business cycle refers to regular fluctuations in economic activity. In the 19th century, business cycles were not thought of as cycles at all but rather as spells of "crises" interrupting the smooth development of the economy. In later years, economists and non- economists alike began believing in the regularity of such crises, analysing how they were spaced apart and associated with changing economic structures. Schumpeter divided a business cycle into four process – boom, recession, depression and recovery. He also classified the business cycles in the following classes:
(a) Seasonal cycles – for a year
(b) Kitchin cycles – covering a period of 3 years
(c) Juglar cycles – covering a period of 10 years
(d) Kuznets cycles – covering a period of 15 to 20 years
(e) Kondratiev cycles – covering a period of 48 to 60 years, for example, Industrial Revolution (1787 – 1842), Bourgeois Kondratiev (1843 – 1897), and Neo-Mercantilist Kondratiev (1898 – 1950) with the expansion of electric power and the automobile industry.

Planning Techniques
Methodology of Planning:
The planner is gone through the following steps in economic planning:
(a) Collecting information: The most important aspect of economic planning is the collection of economic data. The data are not only comprised of economical data, but they also cover the demographical, geographical, and political data. The planner also considers non-quantitative data for economic planning. The planner or the team of planners must have an enough knowledge regarding the fields like sociology, religion, politics and ethics in addition to economics.
(b) Deciding nature and duration of the plan: Once the planning authority gets the knowledge in respect of the economy on the basis of necessary statistics, the next step is to determine the nature and size of the plan. In this connection, the planner has to decide between the planning on micro-basis and planning on macro-basis, functional or structural, centralised or decentralised, etc. Again it is to be decided that whether the planning will be on short-term basis, medium term, or long term. In most of the countries, the medium term plans are advocated. The medium term plan which mostly lasts for the period of 5 years is neither too short nor too long. In the period of five years the ruling party is in a position to implement upon its programmes, policies and manifesto.
(c) Setting the objectives: After the nature and the duration of plan, the next issue is of setting the objectives. In other worlds, it is an important task before the planner to decide regarding the social and economic objectives which will have to be attained in the specified period of the plan. Most of the objectives or goals of the plan are concerned with the attainment of higher growth rate of GNP, reduction of unemployment, removal of regional disparities, removal of illiteracy, development of agriculture and industrial sectors, etc. After identifying such objectives, planner arranges these objectives in order of their importance to the society and the economy as a whole.
(d) Determination of growth rate: This is the most important decision which the planner has to make while formulating the plan. It is about to determine the growth rate during the plan period, i.e., at what rate the economy will grow during this period. The economists agree that the growth rate of the economy should be one which could at least maintain the per capita income of the country. This would be possible if the growth rate of the economy or growth rate of GNP and growth rate of the population are equal. But this growth rate is least recommended. Rather, the planner will opt for that growth rate which is greater than the population rate. For example, if Pakistan wants to maintain its existing per capita income while population is growing at the rate of 3% p.a., then the required GNP growth rate should not be less than 3%. If we want to grow GNP by 3%, NI should grow @ 6%. If the capital output ratio (COR) is 1:3, then we will have to invest 18% of GNP. While determining the growth rate, the planner must keep in view the growth rate of other neighbouring or developing countries like India, China, Sri Lanka, Indonesia, Bangladesh, etc.
(e) Financial resources of the plan: The economic planner is aimed at utilising the resources of the country in such a way that the pre-determined objectives are attained. The real resources of a country consist of manpower, natural resources, technological advancement, infra-structure, good governance, entrepreneurial skills, etc. The planner also has to consider the various optional external resources in case the internal resources are short to fulfil the planning requirements. Such external resources consist of foreign aid and assistance, foreign grants, foreign direct investment, and foreign borrowings from various IFIs and rich countries.

(f) Sectoral allocation or determination of priorities: The resources at the disposal of a country are always short of the requirements. Therefore, a plan is aimed at utilising the resources in such a way that the maximum social benefit could be attained. Accordingly, the planner has to decide which project be taken-up and which project be postponed. In this way, the planner has to prepare a schedule on the basis of relative importance of projects. Then a choice has to be made regarding allocation of resources amongst different uses. Normally the planner has to decide between industrial sector development or agricultural sector development, private sector or public sector, labour-intensive technology or capital-intensive technology, etc. To settle the issue of ‗choice of priorities‘ amongst different alternatives, the planners have given the concept of ‗investment criteria‘.
(g) Role of the government: In most of the countries, the purpose of planning authority is to prepare the draft of the plan consisting of lot of proposals, schemes and projects. When once the plan is chalked out the proposals are sent to operating agencies, ministries and other government departments which are to implement the plan. The government agencies are inquired of their recommendations regarding the economic feasibility of different schemes and projects of the plan keeping in view the sectoral allocation and size of the plan. The operating agency, i.e. the government has to consider the role to be played by private sector and public sector. The government has to inform the planning agency regarding the prospective bottlenecks in the way of effective planning. These recommendations will be helpful in finalising the draft of the plan.
(h) Formulation of economic policies: The role of planners in planning methodology is not just confined to preparation of schemes and projects, they also have to devise economic policies which could provide a favourable atmosphere for the operation of the plan. Accordingly, economic policies play an important role in economic planning, they provide fuel to the engine of economic development.
(i) Plan execution: The last step is plan execution. For effective implementation of plan, following conditions are the pre-requisites:
(i) the government should be stable, honest, sincere and constructive,
(ii) the administrative system must be efficient, i.e. free of favouritism, corruption, bribery, red tapism, etc.
(iii) maintenance of law and order situation,
(iv) equal participation of private and public sectors in economic development,
(v) readily availability and computerised maintenance of government records, financial statements and cost statements,
(vi) vigilant and constructive opposition, etc.
Types of Economic Policies:
Following are types of economic policies considered in the economic policy formulation:
(a) Budgetary Policy: The planner would suggest to devise such a budgetary policy which could transfer the revenue surplus from revenue budget to capital budget. Moreover, the balanced budget would provide a guarantee for price stability.

(b) Tax Policy: The tax policy be stipulated in such a way that more revenues could be raised from taxes for the sake of public expenditures. Moreover, the tax policy should aim at removing income disparities and wasteful expenditures on luxurious consumption. Thus the taxes be imposed in accordance with the ability to pay.
(c) Credit Policy: The credit policy be formulated in such a way that short-term, medium-term and long-term credit could be made available to the different sectors of the economy. When the funds are obtained by the needy sectors of the economy, the pace of development will be accelerated and the plan targets will be realised.
(d) Foreign Trade and Foreign Exchange Policy: According to this policy a plan should seek to earn the sufficient amount of foreign exchange by boosting the exports and reducing the imports. When the foreign exchange resources of a country increase, the problem of debt repayment will also be alleviated.
(e) Tariff Policy: An economic plan should devise such a tariff policy that the unnecessary and luxurious imports could be checked. However, it should encourage the imports of essential consumer goods, capital goods, raw stuff and machinery which would be helpful in accelerating the pace of development. Moreover, tariff policy should aim at protecting the infant industries.
(f) Price Policy: The price stability provides guarantee to the success of a plan. Therefore, such a policy should be devised by the planners that monopolies could not grow, the limits be imposed on profit margins, government expenditures be controlled and competitive forces be restored in the economy.
(g) Wage Policy: An economic plan should aim at protecting the rights of the labour. They must be having job security, minimum wage laws and constitute labour unions. Civil and government servants should be given reasonable emoluments to attract personnel to public services. Exploitation of labour by producers should be discouraged.
(h) Manpower Policy: Manpower policy is an economic policy pursuing the regularisation of skilled, semi-skilled and unskilled persons to bring a balance between the demand and supply of labour. This will lead to maximum utilisation of manpower.
(i) Immigration Policy: Restrictions should be imposed on internal mobility of labour in horizontal, vertical and geographical forms. Brain drain should be checked in the early stages of development.
(j) Nationalisation Policy: As a result of severe market imperfections, the planner may pursue nationalisation policy in economic planning. The sector or the sectors that are causing market imperfections may be nationalised or taken into government control.
(k) Privatisation and Deregulation Policy: The purpose of this policy is to reduce the burden of governmental expenditures and the operational inefficiencies caused by state-owned enterprises. To improve investment conditions and to promote healthy competition, such state-owned enterprises are given under the control of private hands.
Planning Techniques:
There are several planning techniques used in different stages of planning. Some of them are discussed below:

(a) Capital-Output Ratio (COR): The Capital-Output Ratio (COR) is used during the planning stage of determination of growth rate. COR defines the relationship between capital and output. This concept shows that how much of capital is required for how much of output. Broadly speaking, it tells us that how much of investment is required to produce a certain level of consumption goods. We also found its traces in Harrod-Domar Model of economic growth. According to COR, the sustained growth rate can be represented by the following equation:
Where Gw = sustained growth rate;
s = saving ratio;
v = capital-output ratio (COR).
The above equation shows that if a developed country wishes to attain a sustained equilibrium growth rate the national income must grow at the proportion of saving ratio (s) to capital-output ratio (v).
In planning, the planner is concerned with additional amount of capital required for additional output, then the concept of marginal capital-output ratio (MCOR) or incremental capital-output ratio (ICOR) is used. Its equation is shown as below:
Where w = marginal capital-output ratio (MCOR) or incremental capital-output ratio (ICOR);
∆K = change in capital stock;
∆Y = change in output;
∆I = change in investment.
For example, if the ratio is 3:1, then it shows that to produce the goods worth Re. 1 will require to make the net investment worth Rs. 3. In other words, if the economy wants to increase the output by Rs. 1 billion with the COR 3, then the required addition to the capital stock to be provided by new investment will be Rs. 3 billion.
The economists and planners also use the concept of average capital-output ratio (ACOR). This concept shows the ratio of existing stock of capital and the level of output which results from such capital. In other words, if we divide the value of total capital stock by the total annual income, we will get ACOR. It is represented as follows:
Where K = existing capital stock;
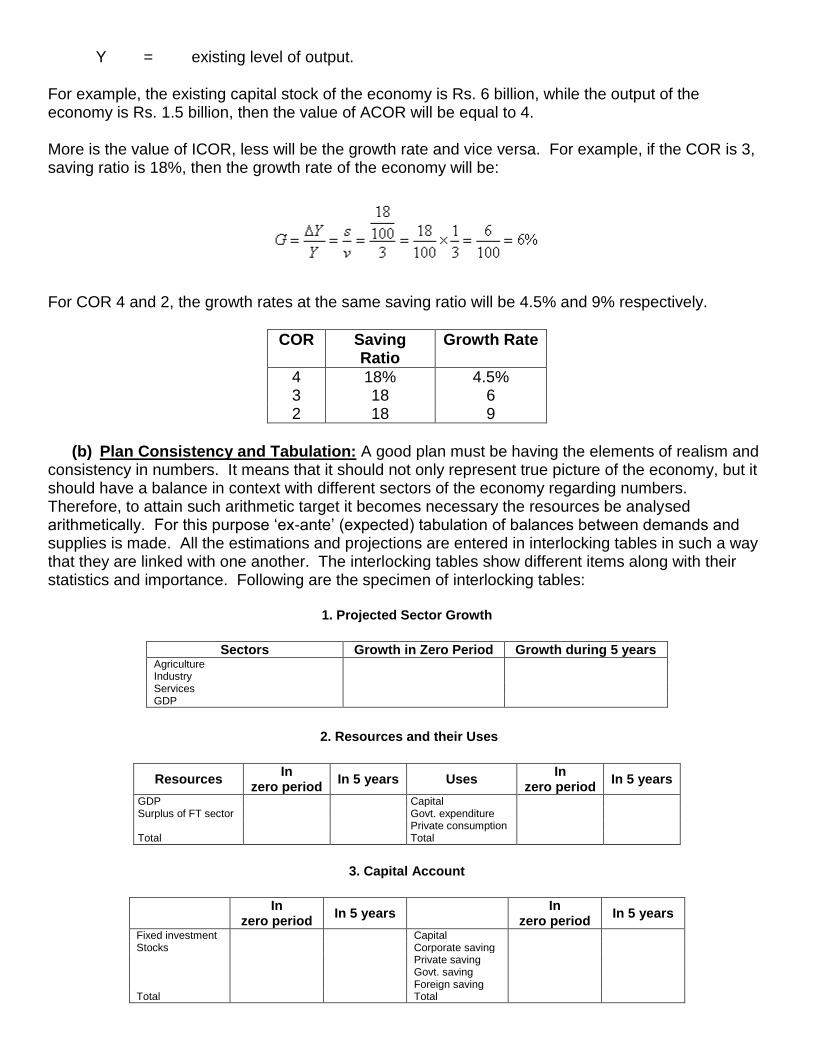
Y = existing level of output.
For example, the existing capital stock of the economy is Rs. 6 billion, while the output of the economy is Rs. 1.5 billion, then the value of ACOR will be equal to 4.
More is the value of ICOR, less will be the growth rate and vice versa. For example, if the COR is 3, saving ratio is 18%, then the growth rate of the economy will be:
For COR 4 and 2, the growth rates at the same saving ratio will be 4.5% and 9% respectively.
COR Saving Ratio
Growth Rate
4 18% 4.5%
3 18 6
2 18 9
(b) Plan Consistency and Tabulation: A good plan must be having the elements of realism and consistency in numbers. It means that it should not only represent true picture of the economy, but it should have a balance in context with different sectors of the economy regarding numbers. Therefore, to attain such arithmetic target it becomes necessary the resources be analysed arithmetically. For this purpose ‗ex-ante‘ (expected) tabulation of balances between demands and supplies is made. All the estimations and projections are entered in interlocking tables in such a way that they are linked with one another. The interlocking tables show different items along with their statistics and importance. Following are the specimen of interlocking tables:
1. Projected Sector Growth
Sectors Growth in Zero Period Growth during 5 years Agriculture Industry Services GDP
2. Resources and their Uses
Resources In
zero period In 5 years Uses
In zero period
In 5 years
GDP Capital Surplus of FT sector Govt. expenditure Private consumption Total Total
3. Capital Account
In
zero period In 5 years
In zero period
In 5 years
Fixed investment Capital Stocks Corporate saving Private saving Govt. saving Foreign saving Total Total

4. Government Current Account
Revenues In
zero period In 5 years Expenditures
In zero period
In 5 years
Taxes Govt. expenditures Other revenues Transfer payments Saving Total Total
(c) Input-Output Analysis: The purpose of Input Output (IO) Analysis is to provide a balance between input, output and final demand. It is also connected with plan consistency. Efficient planning requires that how much an industry produces must be equal to the demand for that particular commodity. On the same lines, each industry wishes to have an assurance of the inputs necessary for its output. It may happen that output of one industry may be an input of another industry. Thus, the purpose of IO Analysis is to observe such input output relationships. In other words, IO Analysis encompasses the inter-industry transactions. This technique was invented by Professor Leontief in 1951. It is also known as ‗inter-industry analysis‘.
The planner constructs input-output tables where the relevant transactions are recorded. Then with the help of transaction data, the input-output co-efficients are derived. Finally, the ‗Leontief Matrix‘ is inverted to obtain a general solution. IO Table shows the values of the flows of goods and services between different productive sectors especially inter-industry flows. In the following IO Table, we have a 3-sector economy where there are two inter-industry sectors, i.e. agriculture and industry, and one final demand sector:
Purchasing Sectors (All figures in million rupees)
Sectors (1)
Inputs to Agriculture
(2) Inputs to Industry
(3) Final demand (Household)
(4) Total Output
or Total Revenue
Selling
Sectors
Agriculture 500 1500 1000 3000 Industry 1000 2500 1500 5000 Value added (Payment to factors) 1500 1000 0 2500
Total Inputs or Total Cost
3000 5000 2500 10500
(d) Linear Programming: In economic planning, the planners wish to include in plans those methods, techniques and programmes which would ensure the optimal use of resources. Thus the programming that is used for the best or optimum use of resources is known as ‗linear programming‘. It is programming because it has been formulated in mathematical mould and its results are shown in terms of linear relationship. It is also known as ‗activity analysis‘. It helps the planner to allocate resources optimally among alternative uses within the specific constraints. It also helps to tackle the problems of investment planning. Linear programming can be applied in case of number of economic problems concerning with maximisation or minimisation subject to constraints. Through linear programming the profit function can be formulated. For e.g., for a firm producing bicycles and motor cycles, the profit maximisation function is construction as below:
Where = maximum profit
x1 = bicycles (profit of $45 per bicycle)

x2 = motor cycles (profit of $55 per motor cycle)
Following are the given constraints:
While x1,x2≥0 (non-negativity condition)
If x1=0, then x2=30; and if x2=0then x1=20
This linear relationship can be built into a graph:
(e) Project Appraisal: Project appraisal is widely used both in the developed as well as in under-developed countries both independently as well as an integrated scheme of national planning. The government formulate and evaluate investment projects in such a way as to be able to compare and evaluate alternative projects in terms of their contribution to the objectives of the nation. The team preparing project report consists of engineers and economists specialised in investment analysis and the relevant fields. The sociologists and natural environmentalists must also be included. There are different techniques of project evaluation, such as cost-benefit analysis, LM method, and UNIDO guideline:
(i) Cost-Benefit Analysis: This technique is also known as ‗social cost benefit analysis‘. In this technique, the costs of projects are evaluated. For the purpose of analysis the cost is disintegrated into various categories, viz., project costs, associated costs, real and nominal costs, primary or direct costs, secondary or indirect costs, etc. The benefits are also classified as real benefits, direct and indirect benefits, etc. The next step is to find the present value of costs and benefits applying a certain rate of interest. Then a comparison is made between the discounted benefits with the costs of projects to get the ratio of costs and benefits. If this ratio is one or more than one, the project is acceptable, otherwise rejected. This technique is known as ‗net present value (NPV) method‘. For this we need to calculate the present value (PV), which can be calculated as below:

Where C = annuity amount
i = interest rate or discount rate
The decision rule for a project under NPV method is to accept the project if the NPV is positive and reject if it is negative. Zero NPV implies that the government is indifferent between accepting or rejecting the project. This method can also be used to make a choice between two or more than two mutually exclusive projects. On the basis of NPV method, the various proposals would be ranked in order of NPV. The project with highest NPV would be preferable to the project with lowest NPV.
Suppose the government has two proposed projects, i.e. project A and project B.
Project A Project B
Initial investment 60,000 59,000
Cash inflow / profit: 2005 14,000 11,000
2006 15,000 14,000
2007 16,000 17,000
2008 18,000 18,000
2009 19,000 20,500
PV Factor 10% 10%
The NPV of both projects is calculated as below:
Net Present Value
Years Project A Project B
Cash Inflow
PV factor @ 10%
PV Cash Inflow
PV factor @ 10%
PV
2005 14,000 0.909 12,726 11,000 0.909 9,999 2006 15,000 0.826 12,390 14,000 0.826 11,564 2007 16,000 0.751 12,016 17,000 0.751 12,767 2008 18,000 0.683 12,294 18,000 0.683 12,294 2009 19,000 0.621 11,799 20,500 0.621 12,731 PV of Cash inflows 61,225 59,355 Less: Initial investment 60,000 59,000 Net Present Value 1225 355
In the above case, the planners will opt for project A, because the NPV of the project is positive and is greater than the NPV of project B. The economy will benefit more from project A than from project B.
(ii) The Little and Mirrless (LM) Method of Project Evaluation: There are two main features of LM method:

Foreign exchange used as a ‗measuring rod‘. Rather domestic prices, foreign exchange measures the true costs and benefits of commodities produced. Therefore, the net value of all the goods produced should be converted into its foreign exchange equivalents. The amount of savings in LDCs is less than the socially optimal level. Hence,
one additional unit of investment is more valuable than an extra unit of consumption at the margin.
(iii) UNIDO Guideline: LM method tries to convert all the benefits and costs to an index of government income, UNIDO translates such all benefits and costs to an index of present consumption. Thus the UNIDO method tries to find out the NPV of all consumption flows because of an additional unit of investment.
(f) Investment Criteria for Allocation of Resources: The 'investment criteria' is a useful planning technique used in sectoral allocation. Investment criteria refers to pattern of investment, choice of investment, choice of projects in various sectors, and choice of technique for a particular project.
(i) Capital Turn-Over Criterion: The H-D model hints out the values of different variables which would guarantee the UDCs to maximise their growth. According to it, the growth rate is represented as follows:
Where g = growth rate of output
S = saving income ratio
C = capital-output ratio (COR)
This equation states that to raise the growth, we are required to raise S or to lower the value of C. Professor Polak and Buchnan argued that given the scarcity of capital in LDCs the C should be minimised. This is called ‗capital turn-over criterion‘. According to Polak and Buchnan those investment projects should be chosen which have low C, i.e. high rate of capital turn over.
(ii) Social Marginal Productivity (SMP) Criterion: This criterion has been presented by Kahn and Chenery. They are of the view that it is necessary to consider the total net contribution of marginal unit of investment to national output, and not merely that portion of contribution which is gotten by private investors.
Efficient allocation consists of maximisation of national product and the principle to obtain this objective is to equate SMP of capital in different uses. SMP criterion is represented as:
Where V = annual value of total output
C = total annual cost of amortisation
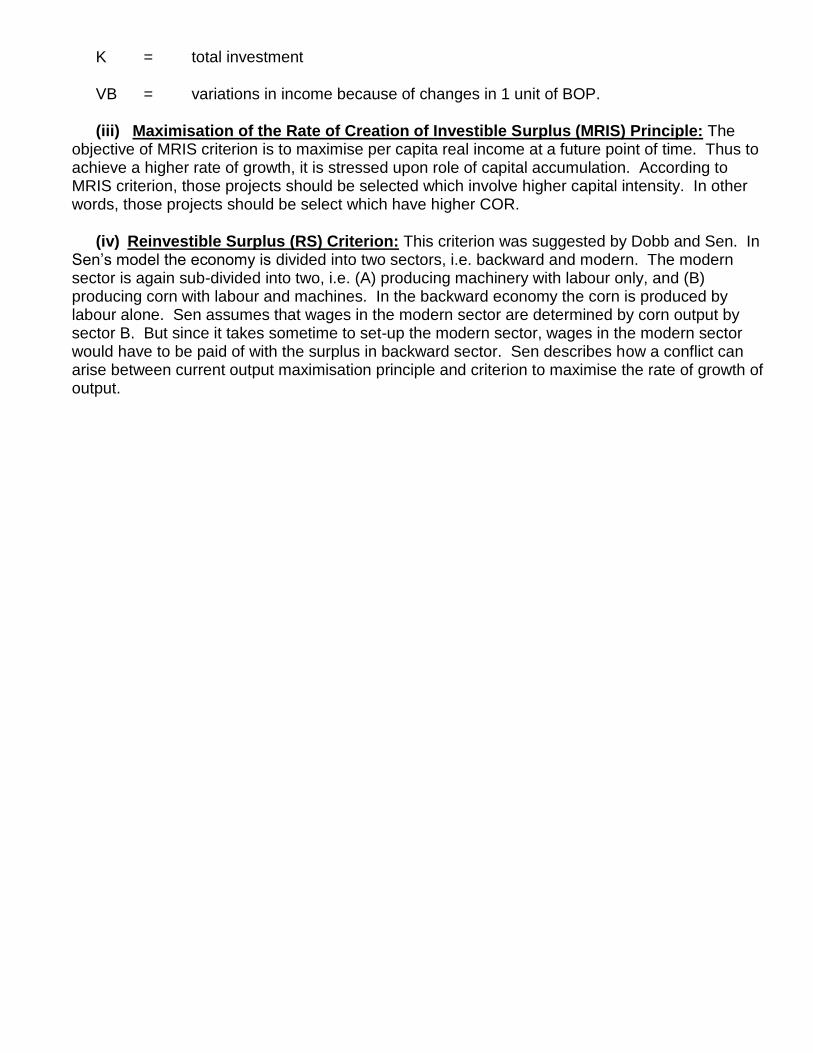
K = total investment
VB = variations in income because of changes in 1 unit of BOP.
(iii) Maximisation of the Rate of Creation of Investible Surplus (MRIS) Principle: The objective of MRIS criterion is to maximise per capita real income at a future point of time. Thus to achieve a higher rate of growth, it is stressed upon role of capital accumulation. According to MRIS criterion, those projects should be selected which involve higher capital intensity. In other words, those projects should be select which have higher COR.
(iv) Reinvestible Surplus (RS) Criterion: This criterion was suggested by Dobb and Sen. In Sen‘s model the economy is divided into two sectors, i.e. backward and modern. The modern sector is again sub-divided into two, i.e. (A) producing machinery with labour only, and (B) producing corn with labour and machines. In the backward economy the corn is produced by labour alone. Sen assumes that wages in the modern sector are determined by corn output by sector B. But since it takes sometime to set-up the modern sector, wages in the modern sector would have to be paid of with the surplus in backward sector. Sen describes how a conflict can arise between current output maximisation principle and criterion to maximise the rate of growth of output.

World Trade Organisation
History
At the United Nations conference held at Geneva in 1947, twenty three countries including United States of America signed General Agreement on Tariffs and Trade (GATT). During the same year, a charter was put on the table for setting up, within the United Nations Organisation, of a new agency to be called International Trade Organisation (ITO). Fifty nations signed the charter in Havana the following year, but it was never subsequently ratified by the required number of countries. The purpose of the agreement was to promote international trade free of barriers in the aftermath of World War II, and to draw up proposals for the implementation of policies based on those principles set in the agreement. It covered all the issues like tariffs, quotas, taxes, international commodity agreements and whatever was considered to have a bearing on the development of international trade, and was based on policies of non-discrimination and tariff reductions.
GATT has been expanded and updated through a series of multi-year conferences. The most famous have been the Kennedy Round (1963-1967), the Tokyo Round (1973-1979), and the Uruguay Round (1986-1994). The Uruguay Round ended with the decision to dissolve GATT and establish the more powerful and more institutionalised World Trade Organization (WTO) in 1995. The WTO replaced GATT as an international organization, but the General Agreement still exists as the WTO‘s umbrella treaty for trade in goods. Trade lawyers distinguish between the GATT 1994, the updated agreement, and the GATT 1947, the original agreement which is still the heart of GATT 1994.
Introduction
The WTO has nearly 150 members, accounting for over 97% of world trade. Around 30 others are negotiating membership. By definition, the World Trade Organization (WTO) deals with the rules of trade between nations at a global or near-global level. But there is more to it than that. There are a number of ways of looking at the WTO. It‘s an organization for liberalizing trade. It‘s a forum for governments to negotiate trade agreements. It‘s a place for them to settle trade disputes. It operates a system of trade rules. (But it is not a Superman, just in case anyone thought it could solve — or cause — all the world‘s problems!). The WTO is like a table. People sit round the table and negotiate, and resolve trade disputes.
Essentially, the WTO is a place where member governments try to sort out the trade problems they face with each other. Therefore, the first step is to talk. The WTO was born out of negotiations, and everything the WTO does is the result of negotiations. Where countries have faced trade barriers and wanted them lowered, the negotiations have helped to liberalize trade. But the WTO is not just about liberalizing trade, and in some circumstances its rules support maintaining trade barriers — for example to protect consumers or prevent the spread of disease.
WTO also ensures that individuals, companies and governments know what the trade rules are around the world, and gives them the confidence that there will be no sudden changes of policy. In other words, the rules have to be ―transparent‖ and predictable.
Principles / Characteristics of WTO Trading System
The World Trade Organisation is based on the following core-principles or characteristics:
1. Trade without discrimination:

The main principle in the charter of the World Trade Organisation is to promote international trade without any discrimination. This principle is further elaborated into two – MFN and national treatment:
(a) Most-favoured-nation (MFN) – treating other people equally: Under the WTO agreements, countries cannot normally discriminate between their trading partners. If a member country grants a special favour (such as a lower customs duty) to another member country, she has to do the same for all other WTO members.
This principle is also known as most-favoured-nation (MFN) treatment. It is so important that it is the first article of the GATT, which governs trade in goods. MFN is also a priority in the General Agreement on Trade in Services (GATS) and the Agreement on Trade-Related Aspects of Intellectual Property Rights (TRIPS).
However, some exceptions are allowed. For example, countries can set up a free trade agreement that applies only to goods traded within the group —discriminating against goods from outside. Or they can give developing countries special access to their markets. Or a country can raise barriers against products that are considered to be traded unfairly from specific countries. In general, MFN means that every time a country lowers a trade barrier or opens up a market, it has to do so for the same goods or services from all its trading partners — whether rich or poor, weak or strong.
(b) National treatment – Treating foreigners and locals equally: Imported and locally-produced goods should be treated equally — at least after the foreign goods have entered the market. The same should apply to foreign and domestic services, and to foreign and local trademarks, copyrights and patents.
National treatment only applies once a product, service or item of intellectual property has entered the market. Therefore, charging customs duty on an import is not a violation of national treatment even if locally-produced products are not charged an equivalent tax.
2. Freer trade:
First of all it should be noted here that the WTO is not for free trade at any cost. It is all about lowering trade barriers between trading countries. The barriers concerned include customs duties (or tariffs) and measures such as import bans or quotas that restrict quantities selectively. From time to time other issues such as red tape and exchange rate policies have also been discussed.
Opening markets can be beneficial, but it also requires adjustment. The WTO agreements allow countries to introduce changes gradually, through „progressive liberalization‟. Developing countries are usually given longer to fulfil their obligations.
3. Predictability:
Sometimes, promising not to raise a trade barrier can be as important as lowering one, because the promise gives businesses a clearer view of their future opportunities. With stability and predictability, investment is encouraged, jobs are created and consumers can fully enjoy the benefits of competition — choice and lower prices. The multilateral trading system is an attempt by governments to make the business environment stable and predictable.
One way of making investment stable and predictable is to „bind‟ the member countries to their commitments. For example, ceilings on customs tariff rates, etc. However, a country can change its bindings, but only after negotiating and compensating its trading partners.

There are other ways as well to improve predictability and stability. One way is to discourage the use of quotas and other measures used to set limits on quantities of imports. Another way is to make countries‘ trade rules as clear and transparent as possible. Many WTO agreements require governments to disclose their policies and practices publicly within the country or by notifying the WTO. The regular surveillance of national trade policies through the Trade Policy Review Mechanism provides a further means of encouraging transparency both domestically and at the multilateral level.
4. Promoting fair competition:
WTO is a system of rules dedicated to open, fair and undistorted competition. The rules on non-discrimination — MFN and national treatment — are designed to secure fair conditions of trade. So these rules also apply on dumping and subsidies. Many of the other WTO agreements aim to support fair competition, for example, in agriculture, intellectual property, services, etc.
5. Encouraging development and economic reform:
The WTO system contributes to development. On the other hand, developing countries need flexibility in the time they take to implement the system‘s agreements. Over 3/4th of WTO members are developing countries and countries in transition to market economies. During the seven and a half years of the Uruguay Round, over 60 of these countries implemented trade liberalization programmes autonomously. At the end of the Uruguay Round, developing countries were prepared to take on most of the obligations that are required of developed countries. But the agreements did give them transition periods to adjust to the more unfamiliar and, perhaps, difficult WTO provisions — particularly for the poorest or ‗least-developed‘ countries such as Bangladesh, Cambodia, Djibouti, Central African Republic, Guinea, Madagascar, Myanmar, Nepal, Uganda, etc. A ministerial decision adopted at the end of the round says better-off countries should accelerate implementing market access commitments on goods exported by the least-developed countries, and it seeks increased technical assistance for them. More recently, developed countries have started to allow duty-free and quota-free imports for almost all products from least-developed countries.
Benefits of World Trade Organisation
The following common benefits of the WTO‘s trading system doesn‘t claim that everything is perfect, otherwise there would be no need for further negotiations and for the system to evolve and reform continually:
1. The system helps promote peace. Peace is partly an outcome of two of the most fundamental principles of the trading system:
helping trade to flow smoothly, and
providing countries with a constructive and fair outlet for dealing with disputes over trade issues.
It is also an outcome of the international confidence and cooperation that the system creates and reinforces.
2. Disputes are handled constructively. As trade expands in volume, in the number of products traded, and in the numbers of countries and companies trading, there is a greater chance that disputes will arise. The WTO system helps resolve these disputes peacefully and constructively.

Around 300 disputes have been brought to the WTO since it was set up in 1995. Without a means of tackling these constructively and harmoniously, some could have led to more serious political conflict.
3. A system makes life easier for all. Decisions in the WTO are made by consensus. The WTO agreements were negotiated by all members, were approved by consensus and were ratified in all members‘ parliaments. The agreements apply to everyone. This makes life easier for all, in several different ways. Smaller countries can enjoy some increased bargaining power. Without a multilateral regime such as the WTO‘s system, the more powerful countries would be freer to impose their will unilaterally on their smaller trading partners. Smaller countries would have to deal with each of the major economic powers individually, and would be much less able to resist unwanted pressure.
In addition, smaller countries can perform more effectively if they make use of the opportunities to form alliances and to pool resources. Several are already doing this.
4. Freer trade cuts the costs of living. Protectionism is expensive as it raises prices through imposition of import duties and quotas. The WTO‘s global system lowers trade barriers through negotiation and applies the principle of non-discrimination. The result is reduced costs of production (because imports used in production are cheaper) and reduced prices of finished goods and services, and ultimately a lower cost of living.
5. It provides more choice of products and qualities. This expands the range of final products and services that are made by domestic producers, and it increases the range of technologies they can use. When mobile telephone equipment became available, services sprang up even in the countries that did not make the equipment. Sometimes, the success of an imported product or service on the domestic market can also encourage new local producers to compete, increasing the choice of brands available to consumers as well as increasing the range of goods and services produced locally.
6. Trade raises incomes. Lowering trade barriers allows trade to increase, which adds to incomes — national incomes and personal incomes. But some adjustment is necessary. Trade also poses challenges as domestic producers face competition from imports. But the fact that there is additional income means that resources are available for governments to redistribute the benefits from those who gain the most — for example to help companies and workers adapt by becoming more productive and competitive in what they were already doing, or by switching to new activities.
7. Trade stimulates economic growth. This is a difficult subject to tackle in simple terms. There is strong evidence that trade boosts economic growth, and that economic growth means more jobs. It is also true that some jobs are lost even when trade is expanding. But the picture is complicated by a number of factors. Nevertheless, the alternative – protectionism – is not the way to tackle employment problems. In fact, the protectionism hurts the employment in the long run. For example, the US car industry, when the US Government designed trade barriers to protect the jobs by restricting imports of Japanese Cars, the American cars became more expensive, fewer cars were sold and there were major job cuts.
8. The basic principles make life more efficient. One of the most important features of WTO is that it provides efficiency in the international trade mechanism. It helps to cut costs because of important principles enshrined in the system. Such principles include non-discriminatory trade, transparency, increased certainty in trade conditions, simplification and standardisation of

customs procedures, removal of red tapism, removal of bureaucracy, centralised databases of information, and such other measures that come under the head „trade facilitation‟.
9. Governments are shielded from lobbying. One of the lessons of the protectionism that dominated the early decades of the 20th Century was the damage that can be caused if narrow sectoral interests gain an unbalanced share of political influence. The result was increasingly restrictive policy which turned into a trade war.
Superficially, restricting imports looks like an effective way of supporting an economic sector. But it biases the economy against other sectors which shouldn‘t be penalized — if you protect your clothing industry, everyone else has to pay for more expensive clothes, which puts pressure on wages in all sectors.
Governments need to be armed against pressure from narrow interest groups, and the WTO system can help. The GATT-WTO system covers a wide range of sectors. So, if during a GATT-WTO trade negotiation one pressure group lobbies its government to be considered as a special case in need of protection, the government can reject the protectionist pressure by arguing that it needs a broad-ranging agreement that will benefit all sectors of the economy.
10. The system encourages good government. Under WTO rules, once a commitment has been made to liberalize a sector of trade, it is difficult to reverse. The rules also discourage a range of unwise policies. For businesses, that means greater certainty and clarity about trading conditions. For governments it can often mean good discipline.
The WTO agreements help in reducing corruption and bad government. But, quite often, governments use the WTO as a welcome external constraint on their policies. This cannot be done because it would violate the WTO agreements.
Criticism on World Trade Organisation
Criticisms of the WTO are often based on fundamental misunderstandings of the way the WTO works. Following are most common misunderstandings or criticisms on WTO:
1. The WTO dictates policy. According to critics, the WTO dictates the trade policy on its member countries. But that is not the case; in fact, it‘s the governments who dictate to the WTO. WTO is a member-driven organisation. The rules of WTO are based on agreements resulting from negotiations among member governments. These rules are ratified by members‘ parliaments. And all the decisions taken in the WTO are virtually made by consensus among all members.
2. The WTO is for free trade. There is another criticism on the World Trade Organisation is that it promotes free trade. According to critics, free trade could hamper the domestic production and serves the interests of giant global companies. Small domestic companies are unable to compete with such multinational companies and would not be able to survive. As a result, unemployment increases and national income decreases. It is true that it is one of the principles of WTO system that the member countries should lower their trade barriers and allow trade to flow more freely. But how low those barriers should go depends on the bargaining of member countries.
Moreover, the rules written into the agreements allow barriers to be lowered gradually so that domestic producers can adjust.

3. According to critics, the commercial interests take priority over development. Whereas, the WTO agreements are full of provisions taking the interests of development into account. Freer trade boosts economic growth and supports development. In that sense, commerce and development are good for each other.
4. Environmental issues. In WTO system, commercial interests do not take priority over environmental protection. Whereas, many provisions of WTO take environmental concerns specifically into account. For example, the preamble of the Marrakesh (Morocco) Agreement establishing the World Trade Organization includes among its objectives, optimal use of the world‘s resources, sustainable development and environmental protection.
5. Health and safety issues. Key clauses in the agreements (such as GATT Art. 20) specifically allow governments to take actions to protect human, animal or plant life or health. But these actions are disciplined, for example to prevent them being used as an excuse for protecting domestic producers — protectionism in disguise.
6. The WTO destroys jobs and worsens poverty. Another accusation on WTO is that WTO system destroys jobs and widens the gap between rich and poor. In other words, it promotes economic inequalities internationally. The accusation is inaccurate and simplistic. Trade can be a powerful force for creating jobs and reducing poverty. Sometimes adjustments are necessary to deal with job losses, and here the picture is complicated. In any case, the alternative of protectionism is not the solution. It should be borne in mind that the biggest beneficiary is the country that lowers its own trade barriers.
7. Small countries are powerless in the WTO. But small countries are not powerless in WTO. In fact, they would be weaker without WTO. The WTO increases their bargaining power. In recent years, developing countries have become considerably more active in WTO negotiations, submitting an unprecedented number of trade proposals. They expressed satisfaction with the process leading to the Doha declarations. All of this bears testimony to their confidence in the system.
8. The WTO is the tool of powerful lobbies. This is a common misunderstanding that the system of the World Trade Organisation supports the powerful countries such as US, EU, Japan, etc. Giant corporations get undue protection from the WTO. The answer is that the WTO is a common platform for all the governments. The WTO treats all the countries equally. Therefore, WTO is not the tool of powerful lobbies; in fact, it offers governments a means to reduce the influence of narrow vested interests. The most common feature of the WTO is the negotiations that took place between the governments. These negotiations create a balance of interests. Governments can find it easier to reject pressure from particular lobbying groups by arguing that it had to accept the overall package in the interests of the country as a whole.
The WTO does not support the giant multinational companies. The WTO is an organisation of governments. The private sector, non-governmental organizations and other lobbying groups do not participate in WTO activities except in special events such as seminars and symposiums.
9. Weaker countries are forced to join the WTO. Another criticism about the WTO is that the weaker or developing countries or poor countries are influenced by developed countries or by the WTO itself to join the WTO. In fact, weaker countries do have a choice to join the WTO or not. However, they are convinced to join the WTO, because they can enjoy the benefits that all WTO members grant to each other. They have the opportunity to trade, negotiate, and settle their disputes with advanced countries within the WTO. Whereas, outside the WTO, i.e.,

under bilateral agreements, smaller countries are weaker and cannot increase their bargaining power esp. with advanced countries.
10. The WTO is undemocratic. Some theorists claim that the system of the WTO is undemocratic. Whereas, decisions in the WTO are generally by consensus. In principle, that‘s even more democratic than majority rule because no decision is taken until everyone agrees.

WTO and the Developing Countries
In the World Trade Organisation, there are around 146 members from developing countries, i.e., about 2/3rd majority of the WTO. They play an increasingly important and active role in the WTO because of their numbers, because they are becoming more important in the global economy, and because they increasingly look to trade as a vital tool in their development efforts. Developing countries are a highly diverse group often with very different views and concerns. The WTO deals with the special needs of developing countries in three ways:
the WTO agreements contain special provisions on developing countries
the Committee on Trade and Development is the main body focusing on work in this area in the WTO, with some others dealing with specific topics such as trade and debt, and technology transfer
the WTO Secretariat provides technical assistance (mainly training of various kinds) for developing countries.
The WTO agreements include numerous provisions giving developing and least-developed countries special rights or extra leniency — „special and differential treatment‟. Among these are provisions that allow developed countries to treat developing countries more favourably than other WTO members.
The least-developed countries receive extra attention in the WTO. All the WTO agreements recognize that they must benefit from the greatest possible flexibility, and better-off members must make extra efforts to lower import barriers on least-developed countries‘ exports.
The specific work on developing countries within the WTO can be divided into two broad areas:
1. the work of the WTO committees, and
2. the training for government officials and others.
1. WTO Committees:
The WTO consists of the following committees:
(a) Trade and Development Committee: The WTO Committee on Trade and Development has a wide-ranging mandate. It has the following priorities regarding the developing countries:
· implementation of provisions favouring developing countries,
· guidelines for technical cooperation,
· increased participation of developing countries in the trading system, and
· the position of least-developed countries.
Member-countries also have to inform the WTO about special programmes involving trade concessions for products from developing countries, and about regional arrangements among developing countries.

(b) Sub-Committee on Least-Developed Countries: The Subcommittee on Least-Developed Countries reports to the Trade and Development Committee, but it is an important body in its own right. Its work focuses on two related issues:
· ways of integrating least-developed countries into the multilateral trading system
· technical cooperation.
The subcommittee also examines periodically how special provisions favouring least-developed countries in the WTO agreements are being implemented. The following are the WTO member countries categorized as least-developed countries by the UN:
Angola, Bangladesh, Burundi, Cambodia, Central African Republic, Chad, Congo, Djibouti, Gambia, Guinea, Guinea Bissau, Haiti, Madagascar, Malawi, Maldives, Mali, Mauritania, Mozambique, Myanmar, Nepal, Niger, Rwanda, Senegal, Solomon Islands, Tanzania, Uganda, Zambia, etc.
Some additional least-developed countries are in the process of accession to the WTO. They are: Bhutan, Ethiopia, Laos, Sudan, and Yemen.
2. WTO Technical Cooperation:
The second area of working on developing countries within the WTO is associated with the technical cooperation or the training of government officials and businessmen from developing countries. It is devoted entirely in helping developing countries and countries in transition from centrally-planned economies to operate successfully in the multilateral trading system. The objective is to help build the necessary institutions and to train officials. The subjects covered deal both with trade policies and with effective negotiation.
The WTO holds regular training sessions on trade policy in Geneva. In addition, it organizes about 400 technical cooperation activities annually, including seminars and workshops in various countries and courses in Geneva.
Targeted are developing countries and countries in transition from former socialist or communist systems, with a special emphasis on African countries. Seminars have also been organized in Asia, Latin America, the Caribbean, Middle East and Pacific.
Funding for technical cooperation and training comes from three sources: the WTO‘s regular budget, voluntary contributions from WTO members, and cost-sharing either by countries involved in an event or by international organizations.
Challenges to the Developing World
The developing countries under the new WTO regime are faced with a considerable increase in their obligations particularly in respect of government procurements, subsidies, anti-dumping, customs valuation and import licensing procedures. Again, the new obligations that they have accepted in the area of services and intellectual property rights could have adverse economic impact on their development.
The developing world, which consists of two-third majority of the total WTO membership, has not reaped plausible benefits under WTO regime. They also have a strong feeling that their voice is not

being heard, and the issues raised by them are not being addressed. However, some noticeable change of strategy at the WTO seems to have taken place in recent years.
Major share of the world trade is controlled by the developed world. According to a survey only 17 countries control 72% of the world trade. A major dilemma faced by the developing countries in the trade liberalisation process is that a country may be able to control the speed of trade liberalisation, but cannot determine by itself how fast its exports should grow. Exports performance depends on quality, price and competitiveness of exportable commodities. Also, to become competitive, investment is required in developing the infrastructure, technology, human resources, and enterprise capacity for new exports, which is a long-term process and not easily achieved. The interesting phenomenon is that the developed world continues to insist on free trade and services and bringing down the tariffs in order to ensure fair competition between local and imported products. While, on the other hand, the developed world itself continues to follow protectionist policies in the case of agriculture to safeguard its costly products against cheaper foodstuff from the developing world.
Suggestions to the Developing Countries:
The developing world has tried to raise its voice on various forums but without much success. Apart from raising hue and cry for better treatment by the WTO and the developed world it should have its own strategy for economic development. Following are the suggestions for the developing countries:
Identification of core strengths and competitive edge, Concentrate mainly on industries which use local raw material, Improve efficiencies, lower costs and upgrade quality of products in order to be able to make
them export oriented to earn valuable foreign exchange, Develop small and medium enterprises, Continue to improve productivity in agriculture / fishing in order to remain self reliant in food
production and earn good value for their exports, Develop human resource through education, training, healthcare and social justice, and
The Government should reduce its role in running business.
But, unfortunately, most of the developing countries to-day is plagued by inefficiency, corruption, dishonesty, low productivity and a lack of will and desire on the part of elected representatives to improve the status quo. The developing countries cannot prosper on the prescriptions laid down by the World Bank, IMF or regular dole from rich nations. South Asian economies, especially Malaysia, Singapore, South Korea and China are a glaring example of what can be achieved through following a pragmatic path. Even the Indian economy has grown rapidly over the past decade with real GDP growth averaging some 6% annually, in part due to continued structural reform, including trade liberalisation. In recent years, though, Pakistan has also shown a remarkable performance in real GDP growth rate: 8.4% during the fiscal year 2004-05, 6.4% during 2003-04 and 5.1% during 2002-03, but yet there are many reforms to be made especially in manufacturing and service sectors.
The developing countries have a tough task ahead. If they do not take corrective measures they will be rendered producers of raw materials and operating locally produced agro-based industries only. They will, obviously, miss the opportunity to benefit from global trade. According to a research report by David Dollar of the World Bank, the growth rate of the developing countries during 1990s has been 5% (3.5% excluding China against 2% of the rich countries. He believes that there is solid evidence available to prove that this has happened due to participation in the free trade and globalisation process.
According to WTO Annual Report 2002, poor countries need to grow their way out of poverty and trade can serve as a key engine of that growth. But currently products of developing countries face

many obstacles in entering the markets of rich countries. Rich counties need to do more to reduce trade-distorting subsidies and dismantle their existing barriers on competitive exports from developing countries.
Challenges faced by Pakistan
Two schools of thought prevail in Pakistan in regard to impact of WTO regime on the economy. One group favours WTO Trade Agreements completely as it believes that free trade will have a strong positive effect in enabling conditions for poverty reduction through employment opportunities, social welfare services, and infrastructure that can potentially benefit the poor. On the other hand, the second school of thought believes that everything going wrong in the developing world is the result of the WTO regime. They feel that the WTO has been formed to further the interests of the developed world only. The fact of the matter is that we lack any empirical study and the different opinions are based on assumptions only.
Major challenges faced by Pakistan are as follows:
Lowering of tariffs leading to cheaper imports would pose serious threat to the local industry, which, in spite of inefficiencies, has thrived to-date owing to protectionist policies,
An end to the quota system in textiles in early 2005 poses a serious challenge to our key foreign exchange driver,
Due to lowering of tariffs the taxes earned by the Government on imports are constantly showing a marked reduction as a percentage to total taxes collected,
Lack of a clear and transparent policy by the Government towards WTO regime – and lack of understanding of implications of Trade Agreements on our economic life.
Considering the challenges, the Government has identified the following industries with core strengths that need most attention for development:
Oil, gas and energy, Chemical, fertiliser and pharmaceuticals, Textile and allied industries, Light engineering, Information technology, Small and medium enterprises.
Other industries, which have been identified for improvements, are sports, surgical, cement, sugar, automobile, etc. These industries will cater both for local and export markets. Needless to mention that a number of industries will be at the risk of partial or complete closure, as they will not be able to compete with the onslaught of cheaper imports. The local electronics industry, where product replacements are extremely rapid, faces the risk of being phased out.
The industry, which needs our utmost attention, is textiles, as it contributes almost 60% to our exports. With the start of new open trade policy from January 2005, Pakistan is facing a serious problem of tough competition from China, India, Bangladesh and a number of other countries. Our machinery is old, productivity is low, costs are higher and the manpower is not well-trained. We need to invest at least US $ 6 to 7 billion in order to overcome these problems, and remain competitive in the world market through exporting value added products.
It is heartening to note that the Government is well aware of this problem, and constant efforts are being made to produce contamination free cotton, and modernise the present outdated machinery

and infrastructure. However, both the Government and the industry will have to move much faster in order to meet the foreign demands. If we are competitive with better quality of products and acceptable prices, we may be able to gain a greater share of the textile trade in the world market.
Conclusion
In the present scenario of the global trade, both developing and developed worlds have their roles to play. The WTO and the developed world must make further concessions for the developing countries, which are in majority and have a very small portion of the total world trade, and are not in a position to compete with the advanced industrialised nations. On the other hand, the developing world has its own responsibilities to share. They cannot continue to live on grant-in-aids and consider others responsible for all their ills, while squandering their own resources. They have to put in serious efforts for overall improvement in the quality of life of their impoverished masses, through sustained economic growth. This would help them achieve their due share in the global trade, rather than see it marginalized further.

Economic Planning in Pakistan
History of Economic Planning in Pakistan
The history of national economic planning in Pakistan is divided in the following periods:
1. Period of economic coordination (1947-53)
2. Period of planning board (1953-58)
3. Period of Planning Commission (1958-68)
4. Period of decline of Planning Commission (1968-77)
5. Period of revival of Planning Commission (1978-88)
6. Period of (1988-98)
7. Period of restructuring of economy (1999-2008)
1. Period of economic coordination (1947 – 1953): Pakistan‘s first planning board was established in 1950 with main emphasis on agriculture. Unfortunately, that plan was not well implemented on time. There were no targets fixed for the plan and the planning machinery was so weak to tackle with implementation. Therefore, the economic planning efforts during this period was a complete failure.
2. Period of planning board (1953 – 1958): The planning board of Pakistan was renamed as Planning Commission in 1953. The planning commission was facing the following serious problems:
Shortage of trained staff,
Non-availability of accurate and reliable data,
Uncertain conditions in the planning machinery
It was regarded as a rivalry between Ministry of Finance and the State Bank of Pakistan
Political instability

Annual economic planning was never seriously followed
Most of the economic advices were rejected by implementing authorities
Economic priorities were not given due importance
Budget decisions were also distorted
During this period, the First Five-Year Plan was made. Its implementation suffered due to rapid changes in government and a lack of political support.
3. Period of planning commission (1958 – 1968): The third period of the planning process began in October 1958 with the assumption of power by the military government of Ayub Khan. The new regime chooses to make economic development through a marked economy and reliance of the private sector as its primary objective. The new government gave proper attention to achieve the following targets:
Rapid industrialisation in the country,
Removal of food shortage,
Removal of political instability, and
To overcome the problem of deficit of balance of payment.
The status of the Planning Commission was raised to a Division in the President‘s secretariat. The President himself assumed the chairmanship of the Planning Commission and Deputy Chairman, with the ex-officio status of a minister, was made the operational head of the Commission. Provincial planning department was organised. The Planning Commission was also provided the secretariat for National Economic Council (NEC) which looked after the day-to-day work of NEC and was also responsible for final approval for annual development.
During this period the Second Five-Year Plan (1960-65) was made. It was so successful that Pakistan led to an example for hunger nations of the world. But unfortunately Pakistan had to fight war against India in 1965. Then there was a hue and cry against Ayub government and another government got the power.
4. Period of decline of planning commission (1968 – 1977): This is the period of decline of Planning Commission as an important decision-making body coincided with the fall of Ayub

Khan‘s government. During the Yahya Khan period (1969 – 1971), the serious planning on national level was completely ignored. The Third Five-Year Plan (1965 – 1970) was virtually abandoned by the Yahya Khan‘s government. In 1970, the Fourth Five-Year Plan (1970 – 1975) was made and it was also a big failure because of the worst political conditions and instable government policies. In 1972, the newly elected government of Z. A. Bhutto decided to run the economy through annual planning, rather than through a comprehensive five-year plan. During the same year, the Planning Commission was placed directly under the control of Ministry of Finance as a Division. During the period from 1972 to 1977, the Planning Commission, with very less powers, have very few favourable economic decisions. In other words, the Planning Commission was powerless and ineffective.
5. Period of revival of planning commission (1978 – 1988): After taking charge of the government, the Zia-ul-Haq‘s regime emphasised on the needs of five-year plans. In early 1980s, the Zia government took steps to revive the Planning Commission as an effective and authoritative economic decision-making body.
During this period, two Five-Year Plans were formulated, i.e., Fifth and Sixth. In 1978, the Fifth Five-Year Plan to cover the period of 1978 – 1983 was published. But the Government failed to pursue the plan mainly because of uncertain political as well as economic conditions at that time. The Sixth Five-Year Plan was formulated in 1983 to cover the period 1983 – 1988. At that time, Dr. Mahbub-ul-Haq was the Finance Minister. He formulated the plan and because of his great efforts, this plan was a success. During his tenure, the Planning Commission has played a vital role in effectively formulating and implementing the economic planning. Not only the Sixth Five-Year Plan, but also the annual plans were formulated by the Planning Commission.
6. The period of (1988 – 1999): The period of 1988 to 1999 the period of political and economic instability. During this period, four elected governments were dismissed by the President on the charges of corruption. The role of Planning Commission was over-shadowed by political decisions. Its role was just limited to the preparation and submission of reports. It has nothing to do with the implementation of planning.
The Seventh Five-Year Plan was formulated during the Zia-ul-Haq period. But after his death, in 1988, the newly elected government of Benazir Bhutto took over the charge and so the Seventh Five-Year Plan has never been implemented. After the fall of Benazir‘s government in 1990, Nawaz Sharif‘s government came into power. During his tenure, he introduced privatisation, deregulation, and economic reform aimed at reducing structural impediments to sound economic development. His top priority was to denationalise some 115 public industrial enterprises, abolishing the government's monopoly in the financial sector, and selling utilities to private interests. Although the Nawaz Sharif government made considerable progress in liberalising the economy, but it failed to address the problem of a growing budget deficit, which in turn led to a loss of confidence in the government on the part of foreign aid donors. In 1993, the Nawaz Sharif government was dismissed by the President on the charges of corruption. In the parliamentary elections of 1993, Benazir Bhutto, once again, became the Prime Minister of

Pakistan. Meanwhile, the so-called Seventh Five-Year Plan period came to an end. In 1994, the Planning Commission publish the Eighth Five-Year Plan to cover the period 1993 – 1998. In November 1996, once again, the PPP government was dismissed by the President on corruption charges. The parliamentary election was held in 1997 and, once again, Mian Nawaz Sharif elected as the Prime Minister of Pakistan. The targets of Eighth Five-Year Plan were also not well achieved. For example, the target of wheat was set at 18.3 million tons which could not be achieved by 1996-97 when its actual production was 16.6 million tons. It was achieved in the last year of the plan but it again slipped down to 17.8 million tons in the following year. Similarly the target of non-traditional oilseeds, grape and mustard was set at 0.4 million tons which was far below the national requirements. Likewise, the projected plan period target of agricultural credit of Rs 80.5 billion could not be achieved as the maximum credit given during the plan period was Rs 37.7 billion and most of which went to the influential feudal lords and politicians rather than to the common farmers. The Ninth Five-Year Plan was formulated by Nawaz Sharif government to cover the period 1998-2003. Following were the priorities of Ninth Five-Year Plan:
(a) Maintenance of fiscal deficit at a sustainable level,
(b) Maintenance of GDP growth at 7% p.a.
(c) Investment in physical infrastructure,
(d) Export-led industrialisation,
(e) End of agriculture-water dichotomy,
(f) Developing a civil society, etc.
7. Period of restructuring of economy (1999 – 2008): In October 1999, the Nawaz Sharif government was dismissed with the military coup by the Chief of Army Staff, General Pervez Musharraf. The entire country was in a state of jeopardy. Before that, the businessmen have already lost their confidence due to economic instability with the Nuclear Test, freezing of foreign currency accounts, devaluation of rupee, and the Kargil War in 1998. Therefore, the targets of Ninth Five-Year Plan were never been well implemented.
The era of General Pervez Musharraf is known as the era of economic and political restructuring. During this era, the economy grew at an average growth rate of 5.1% (started from 2.6% in 2000-01 to 7% in 2006-07 with historical growth rate of 9% in 2004-05). President General Pervez Musharraf invited Mr. Shaukat Aziz to take charge of the Ministry of Finance in November 1999. He quickly assembled a team of highly trained economists and extremely talented civil servants. To address the issue of the severe macroeconomic crisis and place the economy on a path of sustained higher growth, financial stability, and improved external balance of payments, the economic team launched a comprehensive set of economic stabilization and structural reform measures. The government believed that macroeconomic stability was vital for achieving higher and sustained economic growth, creating employment opportunities and preventing people from falling below the poverty line. It is with this view that

a series of structural reform measures were initiated in such areas as privatisation and deregulation, trade liberalization, banking sector reform, capital market reform, tax system and tax administration reform, agriculture sector reform etc. As a result, Pakistan‘s economy started showing signs of improvement by 2000-01 well before 9/11. Manufacturing sector grew 11% in 2000-01 against 3.6% in 1998-99, revenue collection increased to Rs. 396 billion against Rs. 308 billion, debt servicing declined from 64% to 57% of total revenue, export increased from $ 7.8 billion to $ 9.2 billion. These are undeniable facts and well documented in official publications. These improvements had taken place much before 9/11.
The economic team under the stewardship of Shaukat Aziz had not only salvaged a near bankrupt economy but had put it on a path of sustained high growth with financial stability and considerably improved external balance of payments. The country had witnessed a decline in poverty (from 33% to 24% of the total population) and an improvement in social indicators. As a result, Pakistan upgraded in the Human Development Index of the UNDP.
In 2005, the Government authorised the Planning Commission to issue the Tenth Five-Year Plan namely ‘Medium Term Development Framework 2005-10’. The Medium Term Development Framework (MTDF) 2005-10 had been conceived in the light of recent socio-economic performance of the country, continuing supportive public policies and challenges and opportunities emerging from the global economy. Wide-ranging economic and financial reforms had made the economy open, liberalised and market friendly. As a result, private sector had begun to play an active role in shaping structural changes in the economy. The principal objective of the MTDF was to attain high growth of 8.2 percent by the terminal year 2009-10 with a sustained annual average growth of 7.6 percent during the five-year period without compromising macroeconomic stability. The second key objective was to achieve higher level of investment to meet the targeted growth and to effectively address the perennial issues of poverty reduction, employment generation, better access to basic necessities of life including quality education and skill development for up grading the human resources, better health and environment for the common man. The third crucial objective was to attract foreign investment to a level required to become a fast growing economy like Malaysia. Last but not the least, the MTDF focused on growth which is just and equitable.
The plan had also anticipated the share of manufacturing sector in GDP to increase from 18.3% in 2004-05 to 21.9% in 2009-10. It was also anticipated that the production base would be expanded through the development of engineering goods, electronics, chemicals and other hi-tech industries. The Government was also anticipating fastest growth of IT/Telecom sector. Pakistan had seen an explosive growth in IT/Telecom sector in that era. The number of mobile phones achieved their 2007 targets two years earlier, and the recent deregulation of LDI, WLL and other sections had served to provide faster, better and wider coverage, all at lower cost. Nearly 60,000 IT professionals were operating in the country with an annual turnover of Rs. 12 billion of which 15% is exported. The plan had also estimated that our major exports (gross) will increase from Rs. 14.05 billion in 2004-05 to Rs. 28.12 billion in 2009-10.

The MTDF projected a rising growth rate for the agriculture sector from 4.8% in 2005-06 to 5.6% in the last year of the plan, i.e., 2009-10. The production of meat (beef, mutton, poultry meat) planned to be increased from 2,275 thousand tonnes in 2004-05 to 3,124 thousand tonnes in 2009-10, and milk production from 29,472 thousand tonnes in 2004-05 to 43,304 thousand tonnes in 2009-10.
The production of fisheries was projected at an average annual growth rate of 4.8 per cent. The fish production planned to be increased from 574 thousand tonnes in 2004-05 to 725 thousand tonnes in 2009-10.
Planning Machinery in Pakistan
Following are the planning agencies in Pakistan:
National Economic Council (NEC):
The planning machinery in Pakistan is headed by the NEC as the supreme policy making body in the economic sphere. It has the President as the Chairman and all Federal Ministers, incharge of development ministries and provincial governors as members. In addition, a number of other persons are invited to attend the meetings of the NEC as and when the agenda relates to matters concerning them.
Functions of NEC:
(a) To review the overall economic situation in the country
(b) To formulate plans with respect to financial, commercial and economic policies and economic development
(c) To approve the Five-Year Plans (MTDF), the Annual Development Plans (ADP), provincial development schemes in the public sector above a certain financial limit and all non-profit projects.
It may appoint committees or bodies of experts as may be necessary to assist the council in the performance of its functions. NEC discusses different cases and makes decisions. To ensure implementation of the decisions, the secretary of each Ministry is expected to keep a record of all the decisions conveyed to him and to watch the progress of action until it is completed. The Cabinet Secretary is also expected to watch the implementation of the council decisions.

Executive Committee of NEC (ECNEC):
The body directly below the NEC is the ECNEC. It is headed by the Federal Minister for Finance, Planning and Development. Its members include all Federal Ministers incharge of development ministries, provincial governors or their nominees and provincial ministers, incharge of planning and development departments.
Functions:
(a) To set up development schemes (both in the public and private sectors) pending their submission to the NEC.
(b) To allow moderate changes in the plan and sectoral adjustments within the overall plan allocation.
(c) To supervise the implementation of economic policies laid down by the Cabinet and the NEC.
Annual Plan Coordination Committee (APCC):
Another body concerned with economic policy is the APCC which is a purely advisory body responsible for advising the Cabinet and the NEC regarding the coordination of policies. It is headed by the Secretary General, Finance, Planning and Economic Coordination. All federal secretaries of development ministries, heads of provincial planning and development departments and heads of the State Bank, the Board of Industrial Management and PIDC are its members.
Central Development Working Party (CDWP):
Below ECNEC is the CDWP which is responsible for the scrutiny and sanction of development projects. The Secretary, Planning Division, is the president of CDWP. Its members include federal secretaries of the concerned departments, federal finance secretary and chairman of the provincial planning and development departments.
The development schemes of federal ministers costing over Rs. 10 million and of the provincial governments costing over Rs. 50 million are submitted to CDWP for approval.
The responsibility for the overall economic evaluation of Annual Plans remains with the Planning Division which places a report each year before the NEC evaluating economic achievements and failures. Mid-Plan reviews outlining the progress of the Five Year Plan are also published by the Planning Commission.

A Critical Appraisal of Planning Machinery in Pakistan
Following are main hindrances in the way of effective planning in Pakistan:
(a) Administrative obstacles of planning: One major obstacle which has stood in the way of establishing a sound, efficient and independent planning authority is the lack of an effective administrative machinery as this has greatly limited the tasks of development policy and planning. Some of the factors which still continue to be major hindrances and act as administrative obstacles and bottlenecks to planning are discussed below:
(i) Lack of competent personnel: One of the major obstacles in the way of an effective planning machinery is the lack of competent personnel. Good and highly qualified economists, technicians, planners, etc. do not join government service because of lack salaries and facilities.
(ii) Dilatory procedures: In Pakistan, documents and files must follow a prescribed series of steps through administrative layers. It has been pointed out that often there seems to be a disposition to shift the file and documents from one office to another, or from one ministry to another. The resultant delays are sometimes unbelievably long.
(iii) Lack of coordination: In many cases, the coordination of development activities has been extremely difficult because responsibility for different aspects of a project or programme are divided among many ministries and agencies. So it becomes, sometimes, very difficult to carry on programme according to policy.
(b) Inadequate preparatory work on projects: When a potentially desirable project has to be identified, a feasibility study has to be made to determine whether it is practicable and justified. A feasibility study involves a detailed examination of the economic, technical, financial, commercial and organisational aspects of a project.
According to Planning Commission of Pakistan, preparatory work on public projects in the country was frequently lacking. So due to inadequate preparatory work on projects, our plans have been failed in achieving their targets.
(c) Lack of implementation of plans: A major reason for the lack of implementation of the country‘s various five year plans has been the widespread failure of the governments of the day to maintain discipline, implicit in their plan. What is planned and what is done in many cases bears

little relationship to each other. At times it almost appears that plans are prepared by a planning agency in one corner of a government and policy is made by various bodies in other corners.
(d) Lack of evaluation of plan progress and project implementation: Flexibility is an essential element of development planning because in many cases changes in economic conditions make deviations from original plan unavoidable. A central planning agency must, therefore, constantly review and assess progress in relation to events.
Unfortunately, whenever evaluation has been prepared by the country‘s planning authorities, they have been issued long after the end of the period to which they refer. In many cases the mid-term reviews of five year plans have been published almost near the end of the plan period and the final reviews of the plan have come long after the new plan have been launched and, therefore, been of little use to formulating targets and policies for the new plan. The need for a good reporting system on plan and project implementation is, therefore, an essential prerequisite for a good evaluation system.
An Operational Approach to Plan/Project Appraisal
A development plan is essentially a forward looking policy framework which envisages a concrete and prioritised but somewhat flexible programme of action to be launched in a dynamic situation to attain specified economic and social objectives. A plan or a programme / project is ultimately as good as its implementation since it is the actual achievement of the results in line with the targets and not merely the targets set or the resources allocated that determine the degree of success or failure of the plan / programme as well as its impact on the socio-economic life of the people. Thus, it is clear that only the technically, financially and economically sound and viable projects, if properly executed in a coordinated manner, can provide a strong edifice for the successful implementation of the plan.
Most of the developing countries still need to further evolve their development planning processes by redefining their national objectives and searching for alternative strategies, programmes and projects because it has been realised by most of them by now that the development planning adopted so far could not achieve the desired results especially in the areas of social development and income distribution. Recent international experience also shows conclusively that the formulation of technically sound, economically viable and administratively feasible programmes / projects, their proper appraisal, implementation and management are amongst the palpably weaker areas of development planning. In numerous instances, projects included in the development plans have either not been optimally implemented or even if implemented, have failed to yield the expected results on time. Similarly, such other factors like deliberate under-estimating of costs and over-pitching of targets at the approval stage, coupled with recent increase in input prices, have adversely affected the overall plan implementation in most of the LDCs.

In recent years, increasing attention is being devoted to more systematic processes of planning and decision making as a means of addressing the concerns of developing countries about the pace and pattern of economic growth, the failure to achieve planned objectives, and the continuing financial and economic crises. This approach has reinforced the case for greater depth in and a more systematic and inter-related approach to the monitoring, evaluation and follow-up of all public policy actions. This renewed urge is shared both by national as well as international agencies in order to up-grade the developing countries‘ status.
The United Nations International Development Strategy (UNIDS), therefore, emphasises that, to provide increasing opportunities to all people for a better life, it is essential in the development planning to bring about more equitable distribution of income and wealth for promoting both social justice and efficiency of production, to raise substantially the level of employment, to achieve a greater degree of income security, to expand and improve facilities for education, health, nutrition, housing and social welfare, and to safeguard the environment. The International Development Strategy emphasises the importance of national evaluation system. According to UNIDS, every developing country is needed to establish a reliable and independent evaluation machinery or strengthening the existing one, in order to ensure the implementation of development programmes.
Plan Preparation and Implementation Cycle:
The process of development appraisal and performance evaluation is an intrinsic component of planning. The standard plan preparation and plan implementation cycle includes:
(a) Establishment of goals, objectives and targets;
(b) Formulation of strategies;
(c) Formulation of operating plans composed of policies and specific measures necessary to achieve the real targets;
(d) Implementation of policies and measures to the plan;
(e) Monitoring and evaluation of performance (both financial and physical) against targets;
(f) Adjustment of targets and/or plans as may be indicated by actual accomplishments and related developments.
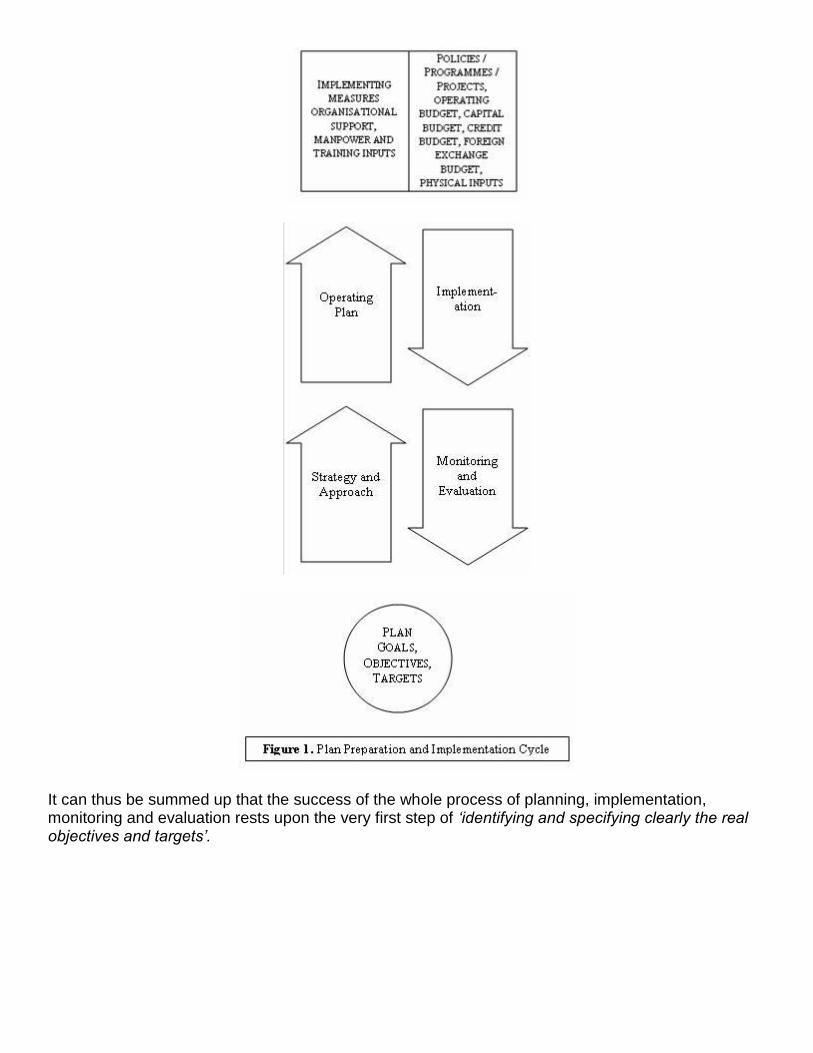
It can thus be summed up that the success of the whole process of planning, implementation, monitoring and evaluation rests upon the very first step of „identifying and specifying clearly the real objectives and targets‟.

Privatisation and Deregulation
Privatisation is a supply side approach to bringing about increases in economic growth. Supply side economics is the application of microeconomic policies intended to increase the overall supply of goods and services. By increasing the efficiency of the factor inputs in the production process output should increase. This should have the effect of shifting aggregate supply to the right and increasing the potential level of output as shown in the diagram below.
Arguments in favour of Privatisation:
Economists offer several arguments in favour of transferring government run firms to the private sector:
Opening up production and consumption to market forces increase competition, economic efficiency and consumer choice.
Breaking down monopolies into more competitive industries introduces competition into the goods markets.
Enables the privatised firms to compete for finance on the private capital markets both home and abroad.
Ensures that firms become accountable to their shareholders and their desire for profit. Ensures that businesses are run on commercial rather than political grounds. Reduces the burden on the government's finances to support nationalised industries.
Arguments against Privatisation:
The process of privatisation and deregulation is intended to increase the level of competition. However, this may not happen for a number of reasons:
Privatisation may simply create private sector monopolies with high barriers to new firms entering the industry. There are a number of reasons why these might exist:
o The existing firm has significant economies of scale that new firms cannot compete as in the case of natural monopolies
o The start up costs for new firms are prohibitive

Privatised firms make decisions based on commercial profit maximising grounds. Nationalised firms make decisions in the public interest. If the government wants to focus on poverty reduction and development then production can be organised appropriately. Privatisation may enable increased capital investment and reduction in the firm's long run average costs. However, it is argued that such a goal of productive efficiency through expanding the use of capital is not appropriate for some LDCs. Some of the problems associated with this might be:
o More sophisticated technology may need more maintenance
o Imported capital may worsen the countries balance of trade
o Lack of trained maintenance staff may prevent the capital being used effectively
Privatising strategic industries such as the copper industry means that government revenue will diminish as profits from copper sales are directed to the shareholders, many of whom, in the case of multinationals live abroad. Lower government revenue may mean lower government spending on education and health.
Privatisation Process in Pakistan
History and evolution of privatisation in Pakistan:
The concept of privatisation is not new to the policy makers of this country. It may be traced as back as in 50s, when Pakistan Industrial Development Corporation (PIDC) was established in 1952 to boost up the industrial development in the country. This premier Corporation established over 50 industrial undertakings in the length and breadth of the country and after their successful operation and management, these units were transferred from the public to the private sector. The tide of nationalisation, which swept the whole economy in the first half of 70s, was reversed in 1977. The privatisation of State Owned Enterprises (SOE) became an important instrument of economic policy of the government in late 80s. However, it was in 1991 that privatisation process in Pakistan became effective.
In this topic, we will limit our discussion only to the privatisation process post-1991. In 1990-91, the new government declared privatisation as its primary economic policy objective. The agenda of privatisation announced by the Government covered a wide spectrum of fields like industries, banks, development finance institutions, telecommunications and infrastructure facilities. The government announced the creation of a Privatisation Commission on 22nd January, 1991 to implement the disinvestment programme within the shortest possible time. The birth of Privatisation Commission institutionalised privatisation efforts in Pakistan.
While providing a legal cover to the privatisation process, the government at the same time also moved to protect the interests of the stakeholders, of which labour was given primary importance. A separate Inter-Ministerial Committee was constituted to deal with the labour employed in the SOEs and safeguard their rights. The Committee negotiated a package of incentives for labour employed in these enterprises with the representatives of workers. The agreement with labour was executed on October 15, 1991. The agreement has provided the basic parameters to safeguard the interests of labour and include minimum one year service guarantee after privatisation, reservation of 10% shares for the labour, opportunity to the employees to purchase the unit by putting competitive bid and several other concessions to the workers. It also provided a scheme of Golden Hand Shake (GHS) and Voluntary Separation Scheme (VSS) for the workers and officers of the public sector undertakings.

Overall results of the privatisation process in Pakistan are mixed. In certain sectors like power generation, financial institutions, cement and automobile the performance of the privatised units is satisfactory and the new management have succeeded in improving the quality of product and service as well as financial health of the units. The workers have also benefited in terms of higher salaries and better working conditions. In other sectors like edible oil and roti plants privatisation has not been very successful.
During January 1991 to June 2003 the Commission completed 132 transactions for Rs 101 billion. During the financial year 2003-2004, the Commission has successfully completed privatisation of 8 transactions including privatisation of Habib Bank Limited, AC Cement Rohri, Thatta Cement Limited, Kohinoor Oil Mills, and Capital Market Transactions (OGDCL, SSGC, POL, ARL, DG Khan Cement and NBP). The total sale proceeds realized during the year amounted to Rs.33.3 billion. Out of the sale proceeds received during the year, the Commission has remitted Rs.11.2 billion to the Government of Pakistan for debt retirement and poverty alleviation program. The Commission during period from July 2004 to April 25, 2005 has realized Rs. 33.8 billion from sale of GOP shares in PIA, PPL, KAPCO, Falleti‘s Hotel and 10% additional shares of Kohat Cement, Dandot Cement Ltd. By 25th April 2005, the Government of Pakistan had completed or approved 147 transactions at gross proceeds of Rs 168 billion. Some of the major transactions recently completed are:
Sale of 51% of GOP stake in Habib Bank Limited for Rs. 22.4 billion
51% shares of United Bank Limited sold in October, 2002. Payment of Rs.1.85 billion received.
75% shares of MCB Bank (formerly Muslim Commercial Bank) were sold in April, 1991 for Rs.2.42 billion. Remaining shares were divested during the years 2001 and 2002 for proceeds of Rs.1.29 billion.
Divestment of approx. 23% shares of National Bank of Pakistan through IPO/POs during the years 2001 to 2003.
70% shares of Bank Al-Falah (formerly Habib Credit & Exchange Bank) were sold in July, 1997 for Rs.1.63 billion. 2% shares were meant for the HCEBL employees 28% shares sold in block for Rs.1.2 billion.
Allied Bank Limited was privatised in 1991 with 51% shares being sold to the ABL employees.
Banker’s Equity Limited was privatised in June, 1996 with 26% shares for proceeds of Rs.618.7 million.
Sale of 5% ordinary shares of Oil & Gas Development Company Limited (OGDCL) through Capital Market for Rs. 6.8 billion.
Sale of Thatta Cement for Rs. 794 million
Sale of 10% shares of Sui Southern Gas Limited (SSGCL) for Rs. 1.7 billion through Capital Market
Sale of shares of Kohinoor Oil Mills Limited for Rs. 81 million
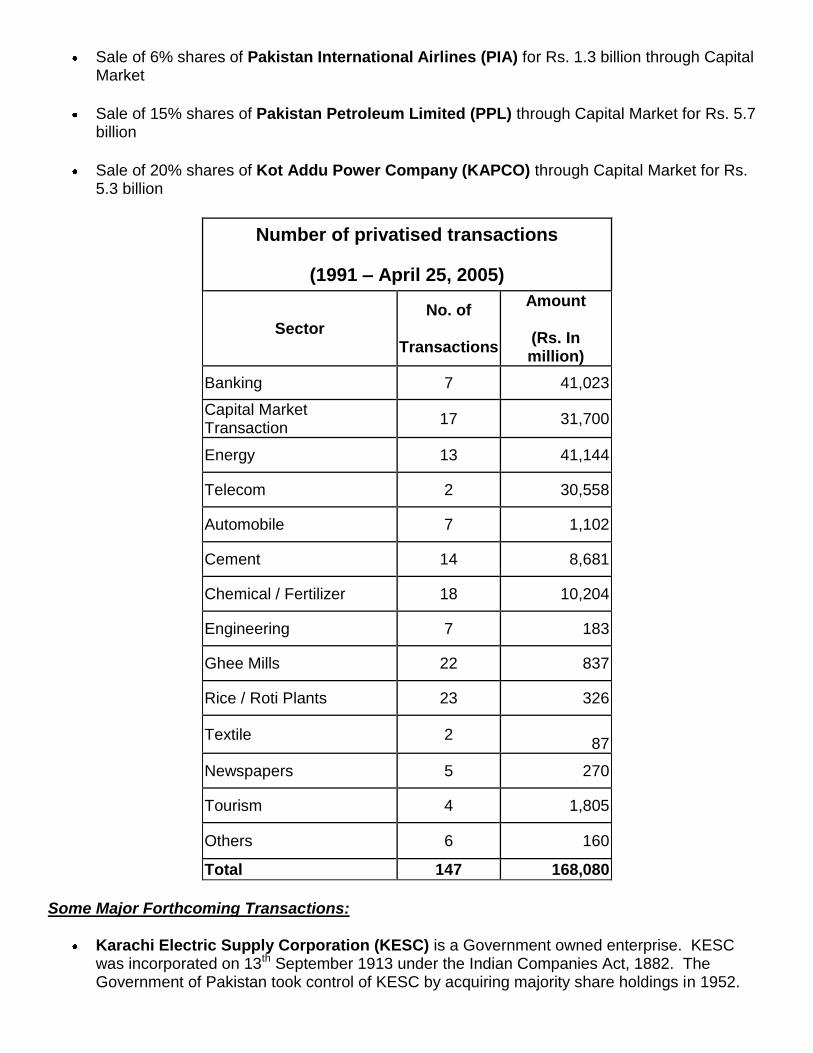
Sale of 6% shares of Pakistan International Airlines (PIA) for Rs. 1.3 billion through Capital Market
Sale of 15% shares of Pakistan Petroleum Limited (PPL) through Capital Market for Rs. 5.7 billion
Sale of 20% shares of Kot Addu Power Company (KAPCO) through Capital Market for Rs. 5.3 billion
Number of privatised transactions
(1991 – April 25, 2005)
Sector No. of
Transactions
Amount
(Rs. In million)
Banking 7 41,023
Capital Market Transaction
17 31,700
Energy 13 41,144
Telecom 2 30,558
Automobile 7 1,102
Cement 14 8,681
Chemical / Fertilizer 18 10,204
Engineering 7 183
Ghee Mills 22 837
Rice / Roti Plants 23 326
Textile 2
87
Newspapers 5 270
Tourism 4 1,805
Others 6 160
Total 147 168,080
Some Major Forthcoming Transactions:
Karachi Electric Supply Corporation (KESC) is a Government owned enterprise. KESC was incorporated on 13th September 1913 under the Indian Companies Act, 1882. The Government of Pakistan took control of KESC by acquiring majority share holdings in 1952.

KESC is being controlled by the Ministry of Water and Power. Before privatising the KESC, the financial health of KESC had to be improved in order to attract potential investors. During the FYs 2001 and 2002, Rs. 83 billion of debt was swapped for equity by the Government. Additionally, a capital reduction of Rs 57 billion was made to offset the accumulated losses. As a result the debt and interest burden on the Company were significantly reduced and the deficit on the reserves was eliminated.
Privatisation Commission had invited Expressions of Interest (EOIs) from qualified utility operators and strategic and financial investors in September 2003 for sale of up to 73% shares of KESC, with management control. Four parties submitted EOIs and were evaluated by the Commission. Three parties were pre-qualified and invited to sign the Confidentiality Agreement and undertake due diligence prior to bidding. The bidding for KESC was held on February 4, 2005. Two Parties i.e. Hasan Associate Consortium and Kanooz al Watan (Saudi Arabia) participated in the bid. Kanwooz Al Watan submitted the highest bid of Rs. 20.24 billion.
Oil and Gas Development Company Limited (OGDCL) is the largest exploration and production (E&P) company in Pakistan currently 100% owned and controlled by the Government of Pakistan. A strategic sale of 51% of the total shareholding along with transfer of management control is envisaged by the Government. Merrill Lynch International and KASB Securities are the financial advisor for this transaction. Expressions of Interest (EOI) for sale of 51% shares in OGDCL were invited in July 2002 and various oil companies submitting EOIs were invited for pre-qualification. The pre-qualification process has not been closed and fresh interest by new prospective/potential investors will be entertained by the Government. The pre-qualified parties that satisfy the necessary financial and technical standards will be invited to sign a confidentiality agreement further to which they will be provided with a copy of the Information Memorandum and allowed access to Data Room to undertake a comprehensive assessment of OGDCL.
Pakistan Petroleum Limited (PPL) was incorporated in 1950 whereby the company inherited the assets and liabilities of the Burmah Oil Company Limited and commenced operations from 1 July 1952. In July 2004, the Government successfully concluded a 15% offer for sale and IPO of the company on the domestic stock exchanges at Rs. 55 per share. The current shareholders of PPL are the Government of Pakistan (78.3%), International Finance Corporation (6.1%) and institutional and individual investors (15.6%). The Privatisation Commission plans to proceed with a strategic sale of 51% shareholding in PPL along with transfer of management control. Merrill Lynch International and KASB Securities are the financial advisors for the strategic sale. The privatisation of PPL is still under process.
Expected Transactions during the Year 2005
Name of SOEs / transactions Type of sale envisaged
Oil and Gas:
Pakistan State Oil (PSO) 51% shares alongwith management control

Banking and Finance:
National Investment Trust (NIT) Sale of management rights
Investment Corp. of Pakistan (ICP) Strategic sale
Power:
Faisalabad Electric Supply Co (FESCO) 56% shares alongwith management control
Genco 1 (Jamshoro) 51% shares alongwith management control
Industry and Real Estate:
Javedan Cement Company Ltd. 96.34% shares alongwith management control
Mustehkum Cement Ltd. 85.29% shares alongwith management control
Bolan Textile Mills Machinery sale
Lasbella Textile Mills Machinery sale
Malam Jabba Not yet determined
Pak-American Fertilizer Ltd. 94.3% shares alongwith management control
National Construction Ltd. (NCL) Not yet determined
Morafco Industries Faisalabad Not yet determined
Republic Motors Ltd. Not yet determined
Lyallpur Chemical Not yet determined
Hazara Phosphate Not yet determined
Tomato Paste Plant Asset sale
Printing Corporation of Pakistan Pvt. Ltd. Not yet determined
Karachi Shipyard and Engineering Works Ltd. Strategic sale with transfer of management control. % of shares being sold not yet determined.
Pakistan Steel Mills Corporation Not yet determined
Upcoming Transactions (Latest)
Privatisation Programme Under PPP Mode

Sr. No. Transaction Units
1. SME Bank Limited
2. National Power Construction Company (NPCC)
3. Faisalabad Electric supply Company (FESCO)
4. Peshawar Electric supply Company (PESCO)
5. Quetta Electric supply Company (QESCO)
6. Hyderabad Electric supply Company (HESCO)
7. Jamshoro Power Company Limited (JPCL)
8. Heavy Electrical Complex (HEC)
9. Pakistan Machine Tool Factory
10. Pakistan Mineral Development Corporation (PMDC)
11. Morafco Industries (Machinery as is where is basis)
12. Pakistan Railways
13. PTDC Motels and Restaurants
14. Utility Store Corporation and stores
15. Pakistan Post
16. Kot Addu Power Company (KAPCO)
17. National Insurance Company (Ex - National Insurance Corporation)
18. Pakistan Reinsurance Company (Ex - Pakistan Insurance Corporation)
19. State Life Insurance Corporation
20. Printing Corporation of Pakistan Limited
21. Services International Hotel
22. Sindh Engineering Limited
23. Republic Motors Limited

Need for Privatisation in Pakistan:
Dr. Ishrat Husain, the Governor of State Bank of Pakistan, in his speech at the Overseas Universities Alumni Club and the 21st Century Business & Economics Club on August 12th 2005, gives the exact answer to the questions arising about the rationale for privatisation in Pakistan. According to him, two decades later, after the nationalization of 1970s, it turned out that nationalization was not only unrealistic and flawed but the consequences were exactly opposite to what the intentions were. The collapse of the Soviet Union and the bankruptcy of the socialist model eroded the ideological underpinning of this strategy and the actual results on the ground in Pakistan and almost all the developing countries shattered the ideal and utopian dreams of the proponents of this philosophy. Pakistan‘s public enterprises including banks became a drain on the country‘s finances through continuous haemorrhaging and leakages and a drag on the economic growth impulses. The poor instead of benefiting were actually worse off as almost Rs.100 billion a year were spent out of the budget annually on plugging the losses of these corporations, banks and other enterprises. These public enterprises became the conduit for employing thousands of supporters of political parties that assumed power in the country in rapid succession and a source of patronage, perks and privileges for the ministers and the favoured bureaucrats appointed to manage these enterprises. These employees and managers had neither the managerial expertise nor technical competence to carry out the job. Instead of providing goods & services to the common citizens at competitive prices efficiently, the public enterprises turned into avenues for loot and plunder, inefficient provision of services and production of shoddy goods.
In the past, private entrepreneurs in Pakistan did not make ‗profits‘ in the real economic sense by earning a return on their investment in a competitive world. On the contrary, they earned ‗rents‘ through the maze of permits, licences, preferred credit by the banks, subsidies, privileges, concessions and specific SROs granted to few favoured firms. Naturally when one sees people becoming rich not through the dint of their hard work and enterprise but by manipulation, or bypassing the established rules and laws, we should not be surprised to see the venom against the so called ‗private profits‘.
The policy reforms introduced in Pakistan in 1991 has three key essentials – (i) Liberalisation, (ii) Deregulation, and (iii) Privatisation. But unfortunately, Pakistan could not follow through these reforms in a continuous and consistent manner despite the fact that both Benazir and Nawaz Sharif governments were fully committed to these reforms. For example, 12% shares of PTCL were first sold to the general public in 1993-94 and it has been on the privatisation agenda of every successive government since then.
According to a popular view in Pakistan it is okay to sell the loss making enterprises but retain the profit making entities such as PTCL and PSO in the public sector. The main economic logic behind this divestiture is that it will promote efficient allocation of scarce resources, optimal utilization of resources, making sound, timely and market responsive investment choices, winning and retaining customer‘s loyalty through better service standards and lower product prices or user charges and contributing to the expansion of the economy through taxes, dividends etc. The basic reason for privatising these enterprises is that the government should not be in the business of running businesses but regulating businesses. The role of the government should be that of a neutral umpire, who lays down the ground rules for businesses to operate and compete, to monitor and enforce these rules, to penalize those found guilty of contraventions and to adjudicate disputes between the competing business firms. If the government owned firm itself, there is a strong conflict of interest and the other competitors lose confidence in the neutrality of the umpire. Under these circumstances, the market becomes chaotic, disorderly and unruly as there is no neutral ‗person‘ to monitor and enforce the rules. The economy thus pays a heavy price for this loss of the market mechanism in the production, sale and distribution of goods and services. The present controversy between the PIA

and private airlines is a manifestation of this tendency. The same argument can be applied in case of PTCL. If the Government had continued to own and manage PTCL, the private sector competing firms would have felt that they would always remain at a disadvantage in relation to the PTCL. The constant fear that the government‘s coercive powers and full force of policy making ability would always be used to safeguard and enhance the interests of PTCL. This would have kept the private firms away from investment in the fixed telephone or wireless loop segments.
The fears about employment losses in the industry as a result of privatisation are also, by and large, unfounded. The example of the banking industry privatisation controverts those who claim that privatisation means jobs are lost. In 1997 when the restructuring, down-sizing and privatisation of the nationalized commercial banks picked up speed there were 105,000 employees working in the financial sector. After privatisation was completed, the banking industry has expanded and the work force has expanded to 114,000. It is true that the pattern of employment has changed and more productive and skilled workers have been taken in at the expense of low skilled or unskilled.
Telecom sector has already generated, after deregulation, hundreds of thousands of new jobs through public call offices, calling cards and pre-paid card companies, Internet Service Providers, mobile phone companies, broad band services, and other value added services under the private sector. As the penetration ratios in Pakistan are still quite low, there is going to be a large expansion in the telecom sector. Industry estimates that 100,000 new jobs will be added during next 3 – 5 years.
Conclusion:
Privatisation contributes to economic growth through productivity gains, efficient utilization of resources, better governance and expansion in output and employment. Profit making enterprises under the public sector may be making profits due to the unique market structure such as monopoly or other privileges or concessions conferred upon them by the government but it does so at the expense of the consumer who has to pay higher than market price for the product or the services. The ordinary consumer gets a benefit only through competition among private sector firms in form of lower prices and better services as has been demonstrated in the cases of banking, telecommunications and, more recently, air travel.
In a deregulated market environment, public ownership becomes a serious constraint as the rule – bound procedures and the rigidity in the structure do not allow public sector companies the flexibility to respond promptly to dynamic market conditions. Furthermore, the government‘s role as a regulator and neutral umpire becomes questionable once it is itself a participant in the game through its own company. This stifles competition and subverts expansion and growth by the private sector companies.

Sixth Five Year Plan (1983-88)
Before the end of Fifth Five Year Plan preparation for Sixth Five Year Plan was made. NEC approved the Plan well in time and implemented according to its schedule.
Size of the Plan:
The plan aimed at a financial outlay of Rs. 495 billion which was more than double the amount of Fifth Five Year Plan. Rs. 295 billion were decided to spend in the public sector and Rs. 200 billion were decided to spend in private sector. As regard to the proposed resources to finance the Plan two points were important:
(a) The share of net external resources in the gross investment would fall from 24% to 16% in the Sixth Five Year Plan.
(b) The compensating efforts in the domestic front were expected in the private sector, almost quadrupling the total private savings with little change in the size of the public savings.
Objectives:
(a) To make production sector of the economy powerful and stable.
(b) To accelerate the rate of economic development so that the standard of living of the people may be raised.
(c) To increase the agriculture production by using more fertilizers, better seeds and modern technology.
(d) To make the country self-sufficient in oil.
(e) To develop steel based engineering goods, modernisation of textiles, expansion of agro-based industries, etc.
(f) To provide maximum social services to increase the rate of literacy and to provide drinking water facilities, draining water facilities, etc.
(g) To create harmony among different sectors of the economy.
Targets:
(a) To increase GDP by 6.5% p.a.
(b) To increase family income by Rs. 900 p.a.
(c) To increase agriculture production by 5% p.a.

(d) To increase industrial production by 9% p.a.
(e) To provide jobs to 4 million people during the Plan period.
(f) To provide facilities of electricity to 88% of the village population.
(g) To increase exports from $ 2.43 billion to $ 4.91 billion by the end of the Plan.
(h) To construct 15000 km new roads from villages to cities.
(i) To lower dependence on foreign aid from 20 to 19% by the end of the Plan.
(j) To increase the efficiency of private sector, certain effective measures would be taken so that private sector may play its role effectively in the development of the economy.
(k) To enable 3 million acres of land for cultivation which had been destroyed by water logging and salinity.
It was decided to allocate 18.1% of the total expenditure to agriculture and water sector, 20% to power, 18.1% to transportation, 15.6% to industry 12.2% to minerals and 11.5% to social institutions. See the table below:
Sector-wise Division of Expenditure
(Rupees in billions)
Sectors Total
Expenditure
Percentage of
Total
Agriculture and Water 89.72 18.1
Sources of Power 100.00 20.0
Transportation 89.62 18.1
Industry 76.91 15.6
Minerals 6.05 1.2
Social Institutions
(health, education, etc.) 59.91 11.5
Other Sectors 75.79 15.3
Total 498.00 100.0
Strategy:
(a) High Growth Momentum: High rates of growth of GDP and other related macro economic variables are to be maintained:
(i) Emphasis on increased efficiency in agriculture, particularly self sufficiency in oil seeds, expanding the exports of rice, cotton and fruits, etc.

(ii) Balanced development of service industries, especially public services for basic human needs.
(iii) Balanced development of service industries, especially of private services for government servants and private people.
(b) Rural Transformation: Increased opportunities for small farmers and provision of infrastructure.
(c) Employment and Income Policies: Creation of about 4 million new jobs for emphasis on small scale production in agriculture and industry, rural works programme, vocational training with combination, income policy which related wages to productivity, indicated salaries from fixed income growth.
(d) Decentralisation: To increase share of provincial governments in development programme of public sector and also encouraging to local bodies to participate in investment plans.
(e) Backward Regions: Recognition of the tribal and Balochistan as economically backward regions and provision of special funds for specific development programmes in these regions.
(f) Self Reliance: Continuing import substitution and export promotion policies and reducing dependence on foreign aid.
Performance of the Plan (Failure and Achievements):
During the Plan period, GDP was expected to increase by 6.5% p.a. It was based on the performance of agriculture and manufacturing sectors. Because these sectors could not play their role effectively so the plan seemed helpless in achieving the targets and objectives.
Further aggregate growth rate of GNP and GDP were related to expected increase in the rate of savings and investment during the Plan period. The savings were expected to increase from 13% to 25% in Plan period and investment rate from 6.5% to 7.5% p.a. But unfortunately these targets could not be achieved in the Sixth Five Year Plan.
Rate of net borrowing and net real foreign saving was expected to decline (because of the decline in foreign remittances). It was decided to increase domestic savings because the Plan did not present any argument or evidence how the saving rate would increase and how much to be saved by the private sector. Basic problem with the plea was shortfall in remittances. Minor crops grew by only 3.6% p.a. as against a growth rate of 7% p.a. envisaged in the Plan.
The Sixth Five Year Plan was a mixed success. It was described as a qualified success by Planning and Development Division. It fulfilled most of the targets, though there were some failures. On the whole, it was a good plan.
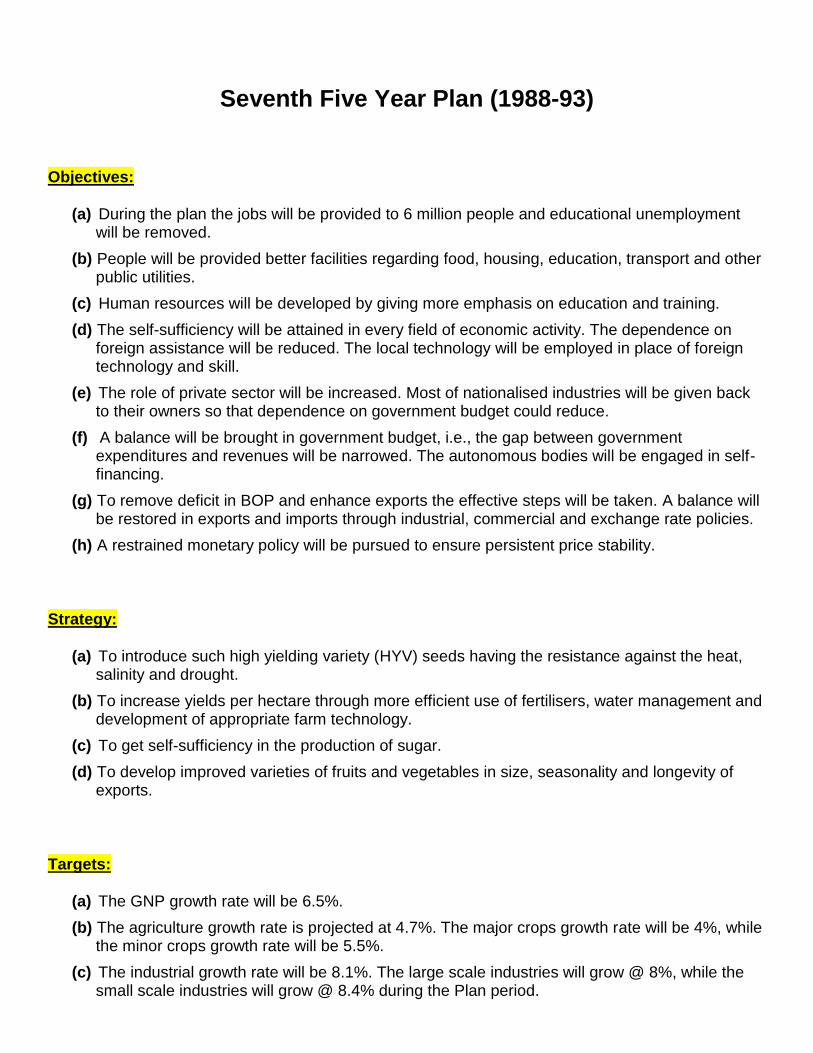
Seventh Five Year Plan (1988-93)
Objectives:
(a) During the plan the jobs will be provided to 6 million people and educational unemployment will be removed.
(b) People will be provided better facilities regarding food, housing, education, transport and other public utilities.
(c) Human resources will be developed by giving more emphasis on education and training.
(d) The self-sufficiency will be attained in every field of economic activity. The dependence on foreign assistance will be reduced. The local technology will be employed in place of foreign technology and skill.
(e) The role of private sector will be increased. Most of nationalised industries will be given back to their owners so that dependence on government budget could reduce.
(f) A balance will be brought in government budget, i.e., the gap between government expenditures and revenues will be narrowed. The autonomous bodies will be engaged in self-financing.
(g) To remove deficit in BOP and enhance exports the effective steps will be taken. A balance will be restored in exports and imports through industrial, commercial and exchange rate policies.
(h) A restrained monetary policy will be pursued to ensure persistent price stability.
Strategy:
(a) To introduce such high yielding variety (HYV) seeds having the resistance against the heat, salinity and drought.
(b) To increase yields per hectare through more efficient use of fertilisers, water management and development of appropriate farm technology.
(c) To get self-sufficiency in the production of sugar.
(d) To develop improved varieties of fruits and vegetables in size, seasonality and longevity of exports.
Targets:
(a) The GNP growth rate will be 6.5%.
(b) The agriculture growth rate is projected at 4.7%. The major crops growth rate will be 4%, while the minor crops growth rate will be 5.5%.
(c) The industrial growth rate will be 8.1%. The large scale industries will grow @ 8%, while the small scale industries will grow @ 8.4% during the Plan period.

(d) Means of transportation and communication will grow @ 6.7%.
(e) The literacy rate will move to 40%.
(f) The production of oil per day will move to 49000 barrel.
Priorities:
(a) The first priority will be given to energy sector. Accordingly, there will be a 56% increase in resources for energy development during the plan period.
(b) The second priority will be given to education. The expenditures on education will be doubled. More emphasis will be given on primary education.
(c) The third priority will be given to population planning. In this respect, there will be a 76% increase in resources for population planning.
Performance:
The Seventh Five Year Plan was prepared within a broad-based socioeconomic framework of a fifteen years perspective (1988-2003), emphasizing efficient growth in output on one hand and improving the quality of life on the other. Of the Perspective Plan total incremental targets, about 23.6% of GDP, 22% of investment, 23.8% of exports, 26.2% of imports and 21% of revenue, were envisaged to be attained during the Seventh Plan. It attempted to address the deficiencies in social sectors, education, health, women development, etc. as well as economic problems like fiscal and current account deficits, inflation and unemployment. Many policy reforms were launched during the Plan period and a new economic edifice on free enterprise, open market, privatisation and deregulation and liberalisation has been raised.
The tempo of growth was affected by unforeseen events on domestic and international fronts including economic contraction of Eastern Europe and the former Soviet Union, recession in Pakistan‘s export markets, the Gulf War, the delay in the settlement of the Afghan issue, the political uncertainties on the domestic front, frequent changes of government, civil disturbances in 1989-90 and floods of 1988-89 and 1992-93. However, the overall performance has been satisfactory.

Eighth Five Year Plan (1993-98)
The Eighth Five Year Plan was approved by the National Economic Council (NEC) on May 31, 1994. the primary aim of the plan is to attain a sustained economic growth in an environment of macroeconomic stability, equity and justice. The Eighth Plan aims to achieve the following five basic balances:
(a) Balance between planning for the public and private sectors.
(b) Inter and intra-sectoral balances,
(c) Balance between new investment and use of existing capital stock,
(d) Balance between project preparation and implementation,
(e) Balance between committed and available resources.
Objectives:
(a) To attain 7% p.a. growth in GDP (including 4.9% in agriculture and 9.9% in manufacturing sector) by mobilising domestic and foreign resources and efficient use of existing resources;
(b) To encourage participation of all people in the development process and a more equitable sharing of the benefits;
(c) To generate additional employment opportunities by expanding productive avenues through private initiative as well as Government policies and programmes;
(d) To alleviate poverty through an integrated approach of income generation, well dispersed access to social and community services, human resource development, extension of physical infrastructure, population welfare and special programmes for targeted groups and areas;
(e) To ensure greater self-reliance, particularly in food, energy, public finance and external balance;
(f) To conserve natural resources and ensuring protection of environment;
(g) To promote good governance; and
(h) To ensure macroeconomic stability and discipline.

Size:
On 1992-93 prices, the size of the plan was Rs. 1701 billion while its size goes to Rs. 2092 billion on 1993-94 prices.
Strategy:
(a) The development strategy of the Eighth Five Year Plan will focus on ensuring and strengthening individual initiative, private enterprise and market mechanism;
(b) Efficiency will be the criterion on all investments;
(c) Employment will be promoted by expanding productive revenues;
(d) Poverty alleviation and income distribution will be addressed through equitable and well-dispersed access to social and community services and dispersal of income generating activities;
(e) Public sector will also support and protect the poor and other vulnerable groups;
(f) Fiscal discipline and monetary stability will be ensured to encourage higher levels of saving and investment;
(g) Self-reliance will be promoted through expanding exports and foreign exchange earnings, attaining self-sufficiency in the production of food grains, and exploitation of indigenous source of energy and fuels. Import substitution would not be dismissed out of hand. Efforts would be made to bridge the gap between actual and potential capacity in selected sectors; and
(h) Local technologies development would be encouraged.
Targets:
(a) To attain 7% p.a. growth in GDP.
(b) The agriculture growth rate is projected at 4.9%. Wheat production to grow by 22%, cotton production to grow by 61% and rice production to grow by 31%.
(c) The industrial growth rate is projected at 9.9%. Fertilizers production to grow by 60%, cement production to grow by 54%, sugar to grow by 54%, petroleum products to grow by 50% and steel billets to grow by 124%.
(d) Population planning coverage to increase from 20% to 80%. Population growth rate to decline from 2.9% to 2.7%.
(e) Coverage of rural water supply to increase from 47% to 71%. Rural sanitation to go up from 14% to 32%.

(f) Gas production to grow by 38%, refining capacity to grow by 183%, Ghazi Barotha Hydel Power Project to construct, ongoing Hub Power Project to complete with the cooperation of private sector, thermal plants of WAPDA to privatise, and electrification of 19700 villages.
(g) Indus Highway to complete, Lahore-Islamabad Motorway to complete, Makran Coastal Highway to complete, to construct deep sea port at Gwadar with the collaboration of private sector, to increase telephone connections by 125%.
Performance:
The formal approval of the Eighth Plan is one year late. The economic growth in the first year of the Plan 1993-98 was only 4%. Due to consecutive damage to the cotton crop and decreased wheat production, and the worst political conditions in the country, the achievement of 7% GDP growth in the next four years becomes difficult. See the following table:
GDP Growth Rate during the Eighth Five Year Plan
Year GDP Growth Rate (%)
1993-94 4.4
1994-95 5.1
1995-96 6.6
1996-97 1.7
1997-98 3.5

Medium Term Development Framework (MTDF) 2005-10
The National Economic Council at its meeting held on May 27, 2005 approved the Annual Plan 2005-06 and authorized the Planning Commission to release it at the time of presentation of the Federal Budget. The Plan covers the 1st Year of Medium Term Development Framework (MTDF) 2005-10. It comprises Growth, Saving and Investment, Balance of Payments, Fiscal and Monetary Development, Poverty Reduction and Human Development and main features of PSDP and Sectoral Programmes. It is in line with the Government‘s agenda, priority and programmes highlighted in the MTDF. This agenda marks a paradigm shift towards the knowledge economy through an integrated approach. Financial and physical review of Annual Plan 2004-05 and projections and prospects for the year 2005-06 are given as follows:
Growth, Saving and Investment:
The Medium Term Development Framework (MTDF) 2005-10 has been conceived in the light of recent socio-economic performance of the country, continuing supportive public policies and challenges and opportunities emerging from the global economy. The targets of the year 2004-05 have been surpassed. The low growth trend experienced during 1990s has been reversed. Wide-ranging economic and financial reforms have made the economy open, liberalized and market friendly. As a result, private sector has begun to play an active role in shaping structural changes in the economy.
The principal objective of the MTDF is to attain high growth of 8.2 percent by the terminal year 2009-10 with a sustained annual average growth of 7.6 percent during the five-year period without compromising macroeconomic stability. The second key objective is to achieve higher level of investment to meet the targeted growth and to effectively address the perennial issues of poverty reduction, employment generation, better access to basic necessities of life including quality education and skill development for upgrading the human resources, better health and environment for the common man. The third crucial objective is to attract foreign investment to a level required to become a fast growing economy like Malaysia. Last but not the least, the MTDF will focus on growth which is just and equitable.
Growth Strategy:
The key elements of the MTDF strategy are as under:
(a) In agriculture, not only crops but livestock and fisheries will also be developed where a substantial improvements in yields, product quality and market efficiency are required to meet the growing demand for domestic consumption and exports.
(b) In manufacturing , the production base would be expanded through the development of engineering goods, electronics, chemicals and other high technology-based and value added industries. Its share in GDP will be increased from 18.3 percent in 2004-05 to 21.9 percent in 2009-10.
(c) The social and physical infrastructure would be expanded by investing more in water, energy, education and health and encouraging private sector to move into these sectors.
(d) Adequate infrastructure and supply of trained and skilled manpower would be ensured to meet the requirements of a fast growing economy.

(e) To generate employment and to reduce poverty, investment will be encouraged in agriculture and livestock, SMEs, housing and construction sectors.
(f) In the export sector, efforts will be made to increase the role of technology and improve comparative export sophistication.
(g) To encourage higher investment and savings, efforts would be made to provide the enabling environment to foster local and foreign investment and enhance both public and private savings.
Sectoral Growth:
With an average growth rate of 7.6 percent of real GDP targeted for the five-year period of MTDF, it is envisaged that it would be gradually rising from 7.0 percent in 2005-06 to 8.2 percent in the terminal year 2009-10. The agriculture sector is projected to attain a growth rate of 5.6 percent by the terminal year and on an average would grow at a rate of 5.2 percent per annum during the MTDF period. The manufacturing sector is projected to row at the average rate of 11.6 percent per annum. To achieve this growth target, the government would have to make all out efforts to further boost production in various sub-sectors like textiles, food and beverages, electronics, automobiles, chemicals (including fertilizers) and engineering goods. The services sector which consists of transport and communication, trade, banking and insurance, ownership of dwellings, public administration and defence and personal and community services is projected to row from 6.8 percent in 2005-06 to 7.9 percent in 2009-10, giving an average growth rate of 7.3 percent per annum for the MTDF period.
GDP and Sectoral Growth Rates
(Percentage)
Sectors 2004-05 2005-06
(Projections)
2009-10
(Projections)
Average
2005-10
GDP 8.4 7.0 8.2 7.6
Agriculture 7.5 4.8 5.6 5.2
Manufacturing 12.5 11.0 12.2 11.6
Services 7.9 6.8 7.9 7.3

Investment and Savings:
The growth rate of GDP depends on the level of investment, addition to the labour force, HRD and technological change. Traditionally, in projecting the growth rate of GDP, investment is considered to be the binding constraint. Depending upon the targeted growth rate, the level of investment is determined through the parameter of incremental capital output ratio (ICOR). The MTDF projections keep this in view, but are essentially the result of the Planning Commission‘s macro model.
The ICOR for Pakistan on the average has been estimated at 3.9 from 1980-81 to 2002-03. The ICOR during the 1980s has been 3.5; the growth rate during the 1980s was 6.5 percent and the total factor productivity increased by 2.6 percentage points per annum. Over the last couple of years, growth rate has increased sharply. The ICOR declined to 2.5 in the 2003-04. In the past, under-utilised capacity existed in the power, cement, automobiles, consumer durables and textiles industries and only recently high growth rate has been achieved due to better capacity utilization in these industries. Current y in power and automotive sectors, capacity has been fu y utilized, whereas in the cement industry very little idle capacity exists. Nevertheless, there may still exist under-utilised capacity in textiles and construction related input industries.
The ICOR can be brought down if the future growth is concentrated in the sectors with lower capital-output ratios and through factor productivity improvement. The capital output ratios are lower in agriculture, small-scale manufacturing , construction, wholesale and retail trade and services sectors. They are higher in mining and quarrying , electricity and as, transport and large-scale manufacturing sectors. Since Pakistan is deficient in infrastructure and energy demand is expected to rise rapidly, the ICOR would tend to rise.
Services Sector:
The services sector is projected to attain growth rates from 6.6 percent in 2005-06 to 7.4 percent in 2009-10, with an average growth rate of 6.9 percent during the period 2005-10. Within the services sector, its various sub-sectors, like transport, storage and communications would grow from 6.4 percent in 2005-06 to 6.8 percent in 2009-10 with an average growth of 6.4 percent during 2005-10. Similarly, the other sub-sectors including wholesale and retail trade, finance and insurance, ownership of dwellings, public administration defence, and community and social services on the average during 2005-10 are expected to grow by 8.6 percent, 5.4 percent, 4.6 percent, 6.3 percent and 5.1 percent respectively.
The services sector plays a vital role in sustaining the growth rate of Pakistan‘s economy. With a share of over 50 percent in GDP, it makes substantial contribution towards poverty alleviation and improvement of the living conditions of the common man. The MTDF broadly aims at achieving the following objectives for the development of services sector:
(a) To sustain an average growth rate of 7.3 percent per annum in the combined output of services.
(b) To reduce the gap between receipts and payments of services in the balance of payments.
(c) To diversify the existing structure of output of services by inducing domestic and private investment in business, finance, information technology (IT) and foreign trade related services.

(d) To encourage private sector participation (exclusively or through public-private partnership) in areas still dominated by the public sector e.g. ports, roads, highways, mass transit, civil aviation, telecommunication, broadcasting, telecasting , health and education services.
(e) To encourage and assist private sector in setting up specialized research establishments and training institutions to cater to the state of the art services both for domestic as well as foreign markets.
(f) To improve regulatory framework by encouraging individuals to form professional bodies/associations in areas of their interest.
(g) Standardization, recognition and accreditation of services institutions and facilities with international standards and bodies.
Balance of Payments:
For MTDF, exports (gross) are projected to increase from US$ 14,050 million in 2004-05 to US$ 28,125 million in 2009-10 at an annual compound growth rate of 14.9 percent. Imports (c&f) are projected to increase from $ 19,291 million in 2004-05 to $ 36,491 million in 2009-10 at an annual compound growth rate of 13.6%. The deficit trade balance is projected to increase from $ 3,555 million in 2004-05 to $ 5,211 million in 2009-10.
Investment Requirements in Pakistan:
To sustain a average GDP growth of 7.4 percent per annum during 2005-10, the investment level will have to be raised from 19.7 percent in 2004-05 to 25.6 percent of GDP in 2009-10. To support higher levels of investment, the ratio of fixed investment to GDP would have to rise from 18.1 percent in 2004-05 to 24.2 percent in 2009-10. For this purpose the level of investment in private sector would be raised from 13.5 percent of GDP in 2004-05 to 16.5 percent during 2009-10. The public sector investment would increase from 4.6 percent of GDP in 2004-05 to 7.7 percent in 2009-10. The investment requirements for the plan period are summarized in Table I:
Investment Requirements
(As percent of GDP)
2005-06
Targets
2009-10
Projections
Total investment 21.5 26.0
Fixed investment 19.4 24.3
Public 5.9 6.8
Private 13.5 17.5

Public Sector Development Programme:
Public spending on major infrastructure and goals will be as follows:
Public Sector Development Programme
(All figures in Rs. billion)
Sector 2005-06
2009-10
Water resources 48.9 47.7
Transport & communications 47.9 79.5
Power 20.5 183.2
Fuel 0.6 1.0
Education & vocational training 16.3 33.8
Higher education 12.2 29.5
Information technology 4.6 6.3
Science & technology 3.9 17.6
Health & nutrition 14.4 21.6
Environment 4.3 7.1
Culture, sports, tourism and youth 1.3 2.1
Khushal Pakistan Programme I 4.4 4.4
Khushal Pakistan Programme II 7.5 3.6
Local / District Government 7.4 17.4
Federal and provincial spending on agriculture & livestock 4.4 15.0

Agriculture Development:
Following are the targets for production of different crops:
Agriculture Production (2005-10)
(All figures in 000’ tonnes)
Items Targets
2005-06 2009-10
Grains: Wheat 22139 25436
Rice 5000 6371
Maize 2905 3457
Other Cereals 621 713
Cash Crops: Cotton (Lint) 2560 2892
Sugarcane 50095 56716
Tobacco 90 90
Pulses: Gram 833 1067
Others 314 494
Oilseeds: Cottonseed 5120 5783
Rape & Mustard & Canola 240 503
Sunflower 575 1006
Others 159 201
Vegetables: Potato 2001 2527
Onion 1943 2361
Other Vegetables 3559 5116
Fruits 6570 9445
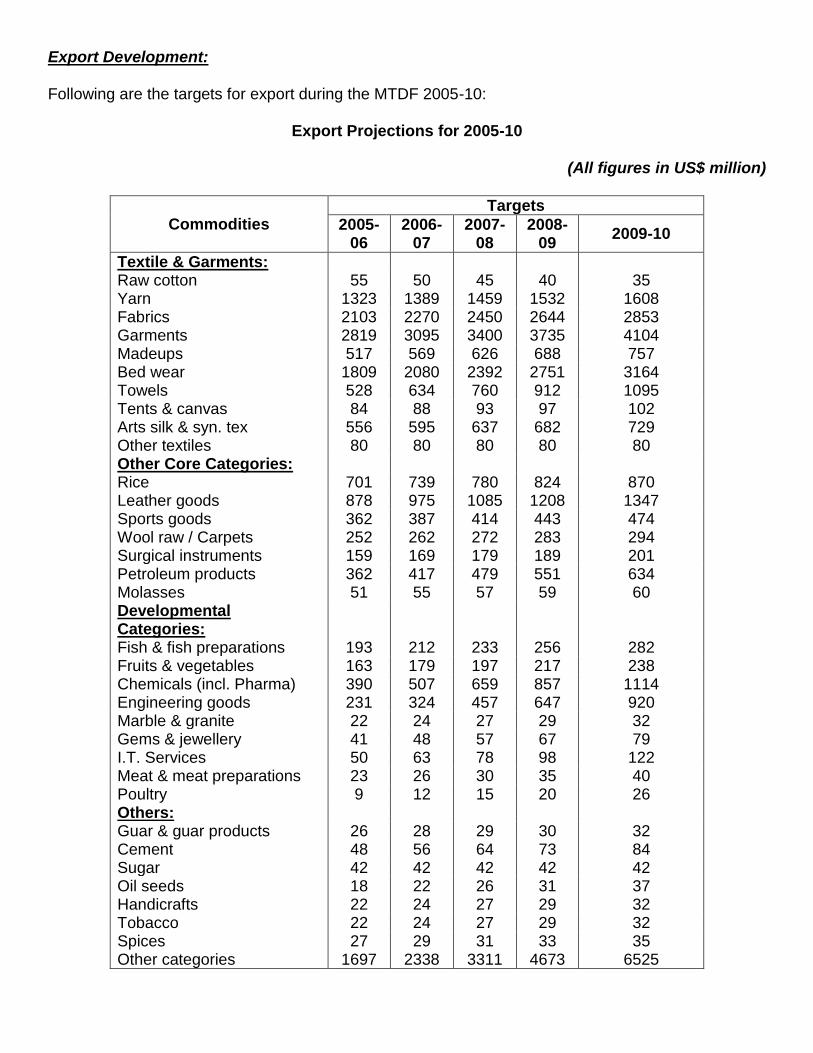
Export Development:
Following are the targets for export during the MTDF 2005-10:
Export Projections for 2005-10
(All figures in US$ million)
Commodities Targets
2005-06
2006-07
2007-08
2008-09
2009-10
Textile & Garments: Raw cotton 55 50 45 40 35
Yarn 1323 1389 1459 1532 1608
Fabrics 2103 2270 2450 2644 2853
Garments 2819 3095 3400 3735 4104
Madeups 517 569 626 688 757
Bed wear 1809 2080 2392 2751 3164
Towels 528 634 760 912 1095
Tents & canvas 84 88 93 97 102
Arts silk & syn. tex 556 595 637 682 729
Other textiles 80 80 80 80 80
Other Core Categories: Rice 701 739 780 824 870
Leather goods 878 975 1085 1208 1347
Sports goods 362 387 414 443 474
Wool raw / Carpets 252 262 272 283 294
Surgical instruments 159 169 179 189 201
Petroleum products 362 417 479 551 634
Molasses 51 55 57 59 60
Developmental Categories:
Fish & fish preparations 193 212 233 256 282
Fruits & vegetables 163 179 197 217 238
Chemicals (incl. Pharma) 390 507 659 857 1114
Engineering goods 231 324 457 647 920
Marble & granite 22 24 27 29 32
Gems & jewellery 41 48 57 67 79
I.T. Services 50 63 78 98 122
Meat & meat preparations 23 26 30 35 40
Poultry 9 12 15 20 26
Others: Guar & guar products 26 28 29 30 32
Cement 48 56 64 73 84
Sugar 42 42 42 42 42
Oil seeds 18 22 26 31 37
Handicrafts 22 24 27 29 32
Tobacco 22 24 27 29 32
Spices 27 29 31 33 35
Other categories 1697 2338 3311 4673 6525

Industrialisation
The modern era of human civilisation is known as the era of massive industrialisation, engineering and mining. The countries like US, UK, France, Germany, Japan, Netherlands, Canada, Italy, etc., have dethroned poverty and unemployment through industrialisation on massive scale. The newly emerging countries like China, South Korea, Malaysia, Taiwan, Mexico, etc. have also shown a remarkable progress in raising their nation‘s standard of living through industrialisation. But the countries like India, Pakistan, Bangladesh, Sri Lanka, Nepal, Bhutan, etc. have failed to eradicate poverty and unemployment through agriculture and so called industrial development. These less developed countries (LDCs) are caught up in a vicious poverty circle, in which the productivity is very low, leading to a low level of income and purchasing power. The size of market is limited by low purchasing power, and, hence, investment is discouraged. Since, there is less inducement to invest, the rate of capital formation is low and the capital equipment available to each worker is small. Since the capital availability per worker is small, productivity per worker is also very low. In this way, the vicious circle of poverty is completed on the demand side.
This vicious cycle of poverty can only be broken through production on massive basis. In other words, through industrialisation on massive basis the living standard can be climbed up to a desirable level. We have success stories of UK, France, West Germany and Japan, which were almost ruined after Second World War, they managed to re-industrialise their economies and climbed up to a benchmark position. Therefore, it is obvious that the industrial development is very essential for any developing country, either agricultural or non-agricultural, for the following reasons:
1. Increase in employment opportunities: Mostly LDCs are agrarian economies furnished with disguised unemployment, that is, there is a surplus of labour with zero marginal productivity. Therefore, it is the industrial sector that can cope with such heavy unemployment. Massive industrialisation provides employment opportunities on massive basis. Massive industrialisation means establishment of more infrastructure facilities, which will in turn lead to more employment. It will also lead to research facilities and innovation of new products.

Industrialists will employ more capital equipment and labour for the manufacture of new products.
2. Increase in living standard: Higher employment level, higher income level and greater variety of products mean higher living standard. With optimum utilisation of natural and human resources of the country, through industrialisation, the national income and the per capita income will rise. More industrialisation will provide greater stimulus to outputs and stability to the economy.
3. Increase in productivity: With increased industrialisation, the industries are furnished with more capital equipment, new production techniques, and skilled labour to enhance the productivity, improve quality, and reduce cost per unit. This will, in turn, reap internal and external economies.
4. Attainment of internal and external economies: Heavy industrialisation enjoys the economies of scale. The term 'Internal Economies' refers to the situation, in which the individual firm gains along with technological and non-technological factors, the larger the production, the lower the cost per unit. The external economies arise because the development of an industry can lead to the development of ancillary services of benefit to all firms; a labour force skilled in the crafts of the industry; a components industry equipment to supply precisely the right parts; or a trade magazine in which all firms can advertise cheaply.
5. Reduction of BOP deficit: Increased productivity will have a positive effect on balance of payment. Higher the output level, higher the export. All the leading industrialised countries of the world are the major players of globalisation, for example, US, UK, France, Germany, Japan, China, South Korea, Malaysia, EU, etc. Thus, the balance of payment deficit can be reduced through a substantial increase in export of industrially produced goods.
6. Increased savings and investments: With increased level of incomes, an industrialised economy enjoys increased savings and investments. Foreign investors are encouraged to directly invest in the production, service and trade. Local investors have confidence in the economy. Capital market becomes strong and stable. More employment opportunities are available, in fact, labour become acute.
7. Increased government revenues: With increased level of income, the government revenues are increased. Therefore, the government is able to provide more public facilities, like health care, research and education, infra structure, old age benefits, unemployment allowance, cost of living allowance, civil defence, etc.

Resource Mobilisation
There are two types of resource channels:
(a) Revenue Receipts: Revenue receipts can be bifurcated into:
(i) Tax Revenues, and
(ii) Non-Tax Revenues.
(b) Capital Receipts: Capital receipts can be classified into:
(i) External Borrowings, and
(ii) Internal Non-Bank Borrowings.
There are two ways through which resources can be mobilised. They are:
(a) Internal Resources: Resources can be mobilised internally by two methods. They are:
(i) Voluntary Savings: The task of voluntary savings is a crucial one. This can be done through moral suasion and active government participation. The government should provide necessary incentives to increase the savings through various policies programmes. The government should develop its financial sector so that it can act as an efficient instrument for mobilising resources.
(ii) Involuntary Savings: Involuntary savings refer to the system of mobilising resources through tax revenues and non-tax revenues:
Tax Revenues: Taxation system occupies the most important place in the socio-economic aspect of a country to mobilise the internal resources. The resources so obtained are then channelised for development purposes by the government. Pakistan has imposed various types of direct and indirect taxes for raising revenues. These include custom duties, excise duties, estate duty, income tax, corporate tax, taxes on sales and purchases, terminal taxes and surcharges, etc. Tax revenues are ‗revenue receipts‘.
Non-Tax Revenues: Non-tax sources of revenues for the Federal Government are state trading profits, earnings of commercial departments like post office, telegraph and telephone, interest charges on loans to provincial governments, local bodies, etc., whereas for the provincial governments, they include irrigation charges and forests, etc.
(b) External Resources: The external resources include grants, loans and foreign aid of various types. Since the internal resources are inadequate to meet the government expenditures, we have to rely heavily on foreign assistance. For this purpose, we have been taking loans from IMF, IBRD, ADB and various developed countries.

How to Increase the Rate of Capital Formation:
A country can increase its capital formation through its own domestic saving and by inflows of capital from abroad. Following are the ways to increase net capital formation as a percentage of national income:
(a) Capital Imports: We can increase the capital formation with the pain of reducing current consumption, by capital inflows from abroad or exploitation of idle resources.
(b) Moral Suasion: The government should convince the people to save more. Sound national economic management, coupled with a social security system, might make people less insecure about economic emergencies, so that they may invest more in productive activity.
(c) Improvement to the Tax System: Saving is unconsumed current production. Taxation is one form of saving. Improving the tax system increases saving. There should be emphasis on direct taxes, taxes on luxuries and sales taxes.
(d) Increasing Investment Opportunities: Government subsidies, tariffs, loans, training facilities, technical and managerial help and construction of infrastructure may increase saving because prospective entrepreneurs perceive higher investment returns.
(e) Redistribution of Income: The government can encourage particular sectors and economic groups by its tax, subsidy and industrial policies. It can redistribute income to persons with a high propensity to save or stimulate output in sectors with the most growth potential and in which saving and taxation are high.
(f) Local Financing of Social Investment: Local government can levy taxes, that Federal Government cannot if the funds are used to finance schools, roads or other social overhead projects that clearly benefit local residents.
(g) Inflationary Financing: The banking system can provide credit and the treasury can print money to loan to those with high rates of saving and productive investment. Creating new money, although inflationary, increases the proportion of resources available to high savers, so that real capital formation rises.
(h) Foreign Inflow of Capital: The foreign investors from developed countries are also invited to invest in the country. Moreover, the foreign aid and assistance are also obtained from developed countries and international financial institutions such as IMF, World Bank, ADB, Islamic Bank, Paris Club, EU, etc.

Foreign Aid and Its Role in Economic Development
Definition of Foreign Aid:
Foreign Aid occurs when the recipient country receives additional resources in foreign currency over and above the capacity to import generated by exports. In simple words, foreign aid means those additional resources which are used to raise the performance of the recipient country above the existing level. It can be defined as the debt which is given by a country to another country on the concessional rates. The concessional elements may be:
(a) Lower rates of interest than the prevailing rate of interest in the international commercial money market.
(b) Longer period for repayments.
(c) Grants which does not entail the payment of other principal or interest, i.e., a free gift.
A country which gives loan is called donor and the country which receives the loan is called recipient country.
Types of Foreign Aid:
There are two types of foreign aid, according to their source:
(a) Bilateral Aid: Bilateral aid is the aid which is given from the government of the donor country to the recipient country. It depends upon political and economic relationships of various countries and it also depends on the will of donor country.
(b) Multilateral Aid: Multilateral aid is the aid given by certain financial institutions, agencies or organisations to the government of developing country. It is distributed in a fair manner in order to raise the pace of economic development. So it is better than bilateral aid which is given on the basis of political considerations and the fear of the domination of a donor country is also removed in the case of multilateral aid which may be helpful in raising the pace of economic development.
Forms of Foreign Aid:
Following are the forms of foreign aid:
(a) Financial Aid: The simplest form of capital inflow is the provision of convertible foreign exchange, but very little foreign capital indeed comes to the underdeveloped world so conveniently. Financial aid is further divided into various sub-forms, i.e.:
(i) Tied Aid: Tied aid is of two types:
Nation Tied Aid: is given to the recipient country on the condition that she will spend it in the donor country to solve the BOP problems of that country and to stimulate exports, i.e., if Pakistan is given aid by US and is asked to import raw materials or machinery from US only then it is ‗nation tied aid‘ or ‗resource tied aid‘.

Project Tied Aid: is given only for specific projects and the recipient country cannot shift it to other projects.
(ii) Untied Aid: Untied aid is the aid which is not tied to any project or nation. It is, in all respects, better than the tied aid because it offers more efficient use of foreign resources. It is much desired because in the case of untied aid the recipient country is not bound to spend the foreign resources on specific projects or in the donor country which may charge higher prices than international market.
(iii) Grants: A grant is that form of foreign aid which does not entail either the payment of principal or interest. It is a free gift from one government to another or from an institution to a government. It is much desired because it increases the internal expenditures and generates income. It is given on the basis of humanitarianism, especially in days of emergencies, earth quakes, floods, wars, etc.
(iv) Loans: It is the borrowing of foreign exchange by the poor country from the rich country to finance short-term or long-term projects. They are further sub-divided into two types:
Hard Loans: Hard loans are also called short-term loans. In order to finance industrial imports they are given usually for a period less than five years, and they are paid in the currency borrowed. It contains no concessional element but interest rate is usually lower than the prevailing rate of interest in the international market.
Soft Loans: Soft loans are also known as long-term loans. Soft loans are made for 10-20 years and it is repaid in the currency of recipient country. Interest on these loans is lesser than hard loans and often these loans invoice grace period. Concessional elements are comparatively greater.
(b) Commodity Aid: Commodity aid, in fact, is another type of tied aid, which relates to agriculture products, raw materials and consumer goods. Under commodity aid, the donor country has much political influence on the recipient country, for example, in 1960s, US gave wheat to Pakistan under PL-480 and had much influence on the development policy of Pakistan. Commodity aid may be received in cash form or in the form of food grains:
(i) In Cash Form: If it is received in cash form it may be more helpful because then a country may buy more commodities from cheaper sources.
(ii) In Food Grain Form: It is a special type of commodity aid, which is given in the form of food grains only, for example, US gives food grains to the poor country under Public Law (PL-480) and funds obtained from it are used on American companies and agencies operating in the recipient countries. The rest of the aid is granted.
(c) Food Aid: There is more than enough food produced each year to feed adequately everyone on earth. However, food is so unevenly distributed that malnutrition and hunger exist in the same country or region where food is abundant.
During 1960s, the United States sold a sizable fraction of its agricultural exports under a concessionary Public Law 480, where LDC recipients could pay for the exports in inconvertible currency over a long period. During late 1970s, about three-quarters of the food aid went to low-income countries. It was about one-third of their cereal imports. Projections indicate that food deficits are likely to increase in the 1980s and 1990s. In the early 1980s, the United States, which provides the bulk of total food aid, reduced its food assistance.

Critics of food aid argue that it increases dependence, promotes waste, does not reach the most needy and dampens local food production. Nevertheless, the food aid has frequently been highly effective. It plays a vital role in saving human lives during famine or crisis, and if distributed selectively, reduces malnutrition. Unfortunately, poor transport, storage, administrative services, distribution networks and overall economic complex hinder the success of food aid programmes, but the concept itself is not at fault.
(d) Technical Aid: Technical aid is another form of tied aid and is much useful for the recipient country to increase the pace of economic development by using the modern technology or skill in some specific sectors of the economy. Under this aid programme, training facilities are provided by the donor country‘s government and it bears all the expenditures involved in the training of advisory technocrats. Technical assistance from the donor‘s point of view takes two main forms:
(i) Through Recruitment: Technical assistance may be given through recruitment. Selected people of recipient country are recruited in the donor country for service overseas, partly, often largely, at the expense of the donor government.
(ii) Through Scholarships & Training Facilities: The second form of technical assistance is scholarship and training facilities in donor country for foreign students (from recipient country).
(e) Foreign Direct Investment (FDI): It is also included in the category of foreign aid. In Pakistan, the examples of FDI are Lever Brothers, Reckitt and Colman, Bata, Philips, etc. It is often argued that FDI should be run under strict control, like licensing, annual auditing, compulsory treatment of foreign capital as domestic capital, etc.
(f) Double Tied Aid: It is also known as ‗procurement tied aid‘. It is the aid which is tied both for projects as well as for resources.
Types of Foreign Aid to Pakistan:
The foreign aid received by Pakistan can be categorised as follows:
(a) Project Assistance: The large bulk of foreign aid received by Pakistan has been in the form of project assistance which is tied in most cases, to both source and utilisation. Project aid is a type of aid allocated for particular development ventures like irrigation projects or large industrial and communication networks which require a substantial imported component.
Besides the imported component, there is also a local finance component of a particular project which has to be covered by raising the necessary resources domestically. Once the domestic component of the project has been raised, the government has to open a special account for the project and withdrawals from the account are possible only after the approval of Aid Mission of the donor countries or agencies.
(b) Commodity Assistance: Commodity assistance, the second largest component amongst the different types of aid received by Pakistan, has allowed some degree of flexibility to the country by not being tied to utilisation although in most cases it is tied to sources. It is for this reason that Pakistan has preferred commodity over project assistance. However, commodity assistance as a ratio of total aid decreased from 34% in 1960-65 to 23% in 1979-80.
(c) Food Aid under PL 480: The third largest component of aid received by Pakistan is commodity assistance under PL 480 provided by USA through the sale of surplus agricultural commodities. These commodities, ranging from wheat to edible oil, have been purchased by Pakistan Government from US Government and were paid for Pakistani rupee till 1967 and in rupee and dollars after 1967. The funds generated by the sale of these surplus agricultural commodities are then deposited in a special counterpart fund controlled by US Government through its Aid Mission to Pakistan. The allocation of these funds, termed as aid, between different activities has been prerogative of the US Government.
(d) Technical Assistance: This type of foreign aid is of great significance to Pakistan, because in Pakistan, there is a shortage of technical knowledge, entrepreneurial skill and skilled labour. This type of foreign aid helps in increasing the intangible value of our skill and semi-skill labour in particular projects, for example, construction of sea ports, dams and other water projects, fly-overs, highways, motorways, underground railway system, high rise buildings, etc.
However, as these foreign experts are paid much higher salaries than what a local person of the same qualification can expect to receive, the real value of technical assistance can be reduced with obvious resentment amongst local experts.
Need of Foreign Aid:
The principal economic arguments advanced in support of foreign aid are as follows:
(a) Foreign Exchange Constraints: External finance (both loans and grants) can play a critical role in supplementing domestic resources in order to relieve savings or foreign-exchange bottlenecks. This is the familiar ‗two-gap‘ analysis of foreign assistance, which will be briefly discussed later in this chapter.
(b) Growth and Savings: External assistance also is assumed to facilitate and accelerate the process of development by generating additional domestic savings as a result of the higher growth rates that it is presumed to induce. Eventually, it is hoped, the need for concessional aid will disappear as local resources become sufficient to give the development process a self-sustaining character.
(c) Technical Assistance: Financial assistance needs to be supplemented by ‗technical assistance‘ in the form of high-level manpower transfers to assure that aid funds are most efficiently utilised to generate economic growth. This manpower gap filling process is thus analogous to the financial gap filling process.
(d) Absorptive Capacity: Finally, the amount of aid is determined by the recipient country‘s absorptive capacity. Typically, the donor countries decide which LDCs are to receive aid, how much, in what form (i.e. loans or grants, financial or technical assistance), for what purpose and what conditions on the basis of their assessment of LDCs absorptive capacity.
Criticism on Foreign Aid:
The following criticism has been forwarded on foreign aid:
(a) According to critics, foreign aid does not promote faster growth but may in fact retard it by substituting for, rather than supplementing, domestic savings and investment and by exacerbating LDCs balance of payments deficits as a result of rising debt repayment obligations and the linking of aid to donor country exports.

(b) The foreign aid is generally focused on and stimulates the growth of modern sector, thereby increasing the gap in living standards between the rich and the poor in Third World countries. Rather then relieving economic bottlenecks and filling gaps, aid, and for that matter private foreign investment, not only widens existing savings and foreign exchange resource gaps but may even create new ones (e.g. urban rural or modern traditional sectors gaps).
(c) If the aid given is concerned with unproductive fields or obsolete technology, it will have the effect of increasing the inflation in the country.
(d) The biggest objection which is imposed on foreign aid is that donor countries make interference in the economic and political activities of the recipient country. The recipient country has to devise its economic policies in accordance with the wishes of donor countries or international financial institutions.
Two-Gap Model:
The two-gap model was presented by Hollis Chenery and A. Strout as an approach to economic development. According to them, most of the developing countries faced either:
a shortage of domestic savings to match investment opportunities (i.e. the saving gap or constraint), or
a shortage of foreign exchange to finance needed imports of capital and intermediate goods (i.e. foreign exchange gap or constraint).
They also further assume that the savings and foreign exchange gaps are „unequal‟ in magnitude and that they are mutually „independent‟. In other words, there is no substitutability between savings and foreign exchange, which is an unreal assumption.
In an economy where the demand of investment cannot be met entirely by domestically generated savings nor through imports financed by the country‘s own export earnings, resources are transferred from abroad in the form of either loans, credits, grants, remittances, or direct private foreign investment. This is the traditional ‗two-gap‘ or dual approach to the analysis of the role of foreign aid in economic development where foreign resources are assumed to fill both a saving-investment gap as well as a foreign exchange gap in the recipient country. According to the assumptions of the two gap model, foreign aid, given an MPS, raises the level of domestic savings by raising the level of income and exports with the result that at some terminal date, foreign inflows are reduced to zero.
According to this model, a country passes through three stages on its way to self-sustained growth:
(a) In the first stage, the dominant constraint is that of absorptive capacity, i.e. the economy is so primitive and backward that it cannot invest beneficially the minimum amount, i.e. 15% or so, necessary to achieve the required rate of growth let say 5 to 6%. The purpose of foreign aid at this stage is to increase the absorptive capacity of the country by providing technical assistance, training, education, managerial ability, entrepreneurial talent and so on. Once the absorptive capacity of the economy has increase sufficiently, the constraint on growth is that of domestic savings.
(b) The second stage is the stage where there is a saving constraint on the economy. A country, like Pakistan, with a low level of income and a large proportion of its population at subsistence level can hardly be expected to save 15-20% of its national income. The suggested way out is that foreign aid may be used to supplement domestic savings and fill the gap between domestic savings and the investment required for a reasonable level of growth.

During this stage, the saving gap will be greater than trade gap, and there may be some deficit BOP and high inflation as well.
(c) The third stage is the stage of trade constraint. As the economy grows, more and more inputs are required in the form of capital goods, industrial raw materials, etc. Exports cannot keep pace with increasing imports and the resultant difference between the two becomes larger and larger until it exceeds the difference between domestic savings and the required savings. Therefore, at this stage, the trade gap is said to be dominant and the foreign aid is now required to bridge this gap. However, at this stage, there is less need of foreign aid and assistance, because as the economy develops further rising levels of income result in an increase in savings as a proportion of national income until the required level is attained and the saving gap is closed. Also as development proceeds, first import substitution of consumer goods, then their export and import substitution of capital goods takes place with the result that exports grow faster than the imports and ultimately catch up with them and hence the trade gap is also filled. With the filling of this gap, the need for foreign aid and assistance is now closed.
Foreign Aid to Pakistan:
Before discussing the foreign capital inflow in Pakistan, it is important to distinguish between pledges, commitments, disbursement and utilisation of aid. These terms are frequently used to describe the various stages through which foreign aid passes before being utilised in the recipient country. A pledge is a promise by the donor country to advance a specified amount of foreign aid, commitment implies the allocation of foreign aid by the donor for specific projects or programmes, disbursement of aid means the transfer of resources from donor to the recipient, and utilisation implies the actual implementation of foreign aid financed projects.
Pakistan, like many other developing countries, has been relying on foreign assistance to supplement national saving to finance investment. In order to bridge the resource gap, it started foreign borrowing as early as 1950s.
Over the years, there has been a continuous decline in the aid inflows to Pakistan. Net transfer which constituted about 90% of the gross disbursements in 1964-65 dropped to 56% in 1977-78 and 50% in 1979-80.
In the early periods greater proportion of aid was received as grant or grant like aid or assistance. This type of assistance was gradually reduced and its place was taken by hard terms foreign loans and credits repayable in foreign exchange with strict terms and conditions such as tied aid and other conditionalities.
The share of grants and grants like assistance in total commitments was 80% during the first plan which was reduced to 46% during the second plan, 31% during third plan and came to as low as 12% during non-plan period. Moreover, its share increased slightly to above 20% during the fifth and sixth five year plan periods mainly due to relief assistance for Afghan refugees.
Pakistan’s Debt Servicing:
By subtracting the annual debt servicing (repayment of principal and interest) from gross aid, we deduce the net foreign aid which is available to the recipient country for financing its imports and gross investment.

The annual debt servicing charges shown in official statistics are net of relief provided in the form of a moratorium. A moratorium on debt means the postponement of the annual debt servicing obligations till some later time which no doubt provides temporary relief to a foreign exchange crisis-ridden country. But since the debt has to eventually be repaid, a moratorium only delays, by increasing its foreign exchange earnings, would at some later stage be in a position to fulfil its debt servicing obligations.
Pakistan's debt situation reached unsustainable level by 1999 because of persistence of large fiscal and current account deficits during the last two decades. The ‗twin deficits‘ resulted in an explosive accumulation of both domestic and external debt. Domestic debt grew at an average annual rate of almost 28 % during the first half of the 80's; 22 % during the second half and 16 % during the first nine years of the 90's. In other words; Pakistan's total external debt and foreign exchange liabilities which stood at $ 9 billion in 1980-81, reached almost $ 22 billion by the end of the 80's and by 97-98 touched a high figure of $ 42.7 billion.
The stock of public debt stood at Rs 155 billion by end of the 1970's and by end of the 80's another Rs 646 billion was added which caused public debt to rise at Rs 801 billion. But by end of the 90's, another Rs 2430 billion was added to the public debt, which stood at Rs 3231 billion. The absolute number of public debt is not much of interest. What is more damaging is the burden of the public debt, which means as percentage of GDP or total revenue. At the end of 70's, the public debt was 56 % of GDP or 317 % of total revenue. It rose to 92 % of GDP or 505 % of the revenue by the end of the 80's. It was over 100 % of GDP and 630 % of the revenues by the end of the 90's. By any standard, this was horrifying number for any country. It was horrifying because almost two-third of the revenues were consumed for debt servicing alone which forced the government to cut Public Sector Development Programme (PSDP).
The various composition of expenditure also continued to change over the years. The share of defence in total expenditure was 24 % in 1980-81 while interest payment accounted for only 9 % and development budget was 41 % of total expenditure. By the end of 1980's, defence spending increased marginally to 26 % from 24 % in beginning of 80's. The share of interest payments more than doubled during this period from 9 % to 21 %. Development spending continued to shrink from 41 % to 25 %. In other words, interest payment was taking over development expenditure in the country. As Pakistan entered the decade of the 90's the composition of expenditure continued to deteriorate. Interest payments increased further to 33 % of total expenditure by the end of the 90's, while development spending decline to 13 % and defence spending also shrank to 20 % .The onslaught of rising interest payments continued to crowd out not only development spending but defence spending as well.
With President‘s Musharraf‘s policies, Pakistan has rescued the worst economic situation, but still there are lot of improvements needed in the economy, especially in manufacturing sector and energy sector. The economy is now more stable. Interest payment has started declining, it was as high as Rs 240 billion in 1999-2000 and declined to Rs 210 billion in 2003-04. Interest payments were drastically reduced to 22.4 % from 33 % in the past. Most importantly public debt as percentage of GDP, which was over 100 % a few years back, has declined to 91 %. Similarly public debt has percentage of total revenue which was as high as 633 % has come down to 516 %. Most importantly, the external debt and foreign exchange liabilities have declined from $38 billion to $35 billion. Pakistan's external debt and liabilities to foreign exchange reserves ratio was 22 times in 1998-99 but with the decline in debts and increase in foreign exchange reserves, the ratio declined sharply to 2.8 times in six years.

External Debt
(All figures in billion rupees)
Particulars 2000-01 2001-02
2002-03
External Debt 2059.5 2005.6 1927.7
Total Debt Servicing 340.3 431.2 304.7
Total Debt as % of GDP 113.5 104.3 95.1
External Debt as % of GDP 60.2 55.3 48.0
Ratio of External Debt Servicing to: Export Earnings 38.0 44.8 28.8
Foreign Exchange Earnings 23.7 26.5 16.0
Ratio of Total Debt Servicing to: Tax Revenues 77.1 90.2 55.1
Total Revenues 61.5 69.1 43.2
Total Expenditure 47.4 52.2 34.1
Current Expenditure 52.7 61.6 41.8
Pakistan’s Earthquake Disaster and the Role of Foreign Aid
An earthquake of 7.6 magnitude struck Pakistan, India, and Afghanistan, on October 8, 2005. The epicentre of the earthquake was located near Muzaffarabad in Pakistani-administered Kashmir, and approximately 60 miles north-northeast of Islamabad. The most affected areas are the NWFP and Azad Kashmir. More than 80,000 were killed, thousands of people injured and more than 3 million people were homeless in Pakistan. According to United Nations, the loss and damages in October 8‘s South Asia Earthquake are more than that of Tsunami struck Sri Lanka, Indonesia and India in December 2004.
On call for aid on humanitarian basis from Pakistan, several countries come forward and generously announced aid and assistance for earthquake victims. Initially US and Turkey announced $256 million and $250 million respectively. On 19th November the World Donor Conference 2005 was held in Islamabad, in order to collect donations for the reconstruction and rehabilitation of earthquake affected victims and areas. Among bilateral aid pledges United States was again on top. USA promises to provide $510 million in the Conference. About $5.9 billion were pledged on the same day and about $7 billion have been pledged so far. Most of these pledges include interest-free soft-loans repayable within 40 years.
The USAID initially pledged $156 million to Pakistan for earthquake disaster relief, which includes $100 million for humanitarian relief and reconstruction, and $56 million to support the Defence Department‘s relief operations. The aid was further increased to $510 million pledged in the Donor Conference 2005. Around 1000 American emergency management personnel are working in Pakistan to assist with relief efforts and 140 US military and civilian cargo airlifts have delivered thousands of tons of medical supplies, food, shelter material, blankets and rescue equipment to the people of affected areas. Six US military ships have delivered 115 pieces of heavy equipment and

158 tons of humanitarian assistance supplies through the port of Karachi.
In addition, American charitable organizations have raised $21.6 million for the relief effort and US companies have committed $47.9 million in cash and in-kind contributions.
Turkey pledged aid worth $150 million to Pakistan out of which $100 million would be extended as financial assistance and $50 million in the shape of relief goods and technical assistance. Apart from the contributions of US$150 million the Turkish Government has also committed another US $ 3 million at the Geneva Donors Conference. Moreover, the Turkish Prime Minister Tayyip Erdogan became the first foreign leader to visit Pakistan after the earthquake, and assured his country‘s aid and assistance for relief efforts to Pakistan on long-term basis. Turkey has also sent her medical and rescue teams to Pakistan. Turkey is also providing 1 million blankets and tents, 50000 tonnes of flour and 25000 tonnes of sugar and cooking oil.
Star TV of Turkey organized a live telethon for donations. Turkish Prime Minister, Cabinet members and members of business community participated with a target of is US$ 15 million. Turk Samanyolu TV, another channel collected US$ 3.7 million.
Several other countries and international organisations announced aid packages and assistance for Pakistan (before Donor Conference 2005):
Saudi Arabia is on third rank with its financial support of US $133 for the quake victims. Saudi 1 TV Channel has also organised a live telethon for donations and collected millions of dollars for earthquake victims in Pakistan.
UAE announced $100 million aid package for Pakistan. Kuwait pledged $100 million to help the victims of the earthquake, half in immediate relief and
half to finance infrastructure repairs under the supervision of the Kuwait Fund for Arab Economic Development (a government organisation).
Italy converts debts of US $70 million into relief, while another of 15 million US dollars will also be converted to be used for the reconstruction and rehabilitation of the earthquake affected people. The Italian government has also offered training for Pakistani officials in Disaster Management and preparedness.
United Kingdom (UK) sent three Chinook Helicopters to Pakistan to take part in relief operations in Azad Kashmir and NWFP. UK has also announced additional ₤20 million in aid.
India announced Rs. 1 billion aid. China announced US $6.2 million aid for quake victims and also sent an emergency-response
team. The Chinese government sent a 49-member international rescue team. Australia announced Australian $5.5 million (US $4.18 million) in aid, which include Australian
$500,000 for immediate medical and relief assistance. The funds will be channelled through Red Cross and Red Crescent.
Ireland will provide one million euros to the relief effort in Pakistan. Afghanistan has announced US $500,000 financial help, four helicopters, 30 tonnes of dry
fruit and 35-member rescue and relief team. Afghanistan also observed a three-day mourning on the loss of lives due to the earthquake.
Japan had sent a 50-strong emergency relief team. The team, formed by disaster rescue experts from fire fighting, police and coast guard organizations, included police, disaster management and coast guard specialists. They are engaged in search and rescue operations as well as information gathering.
A military plane has been sent from Spain with emergency doctors, fire-fighters and medical supplies to help deal with the aftermath of the South-Asian earthquake.
The Swedish Rescue Services Agency was sending tents and blankets and the Czech

government said it was ready to send rescue teams with dogs. France sent sniffer dogs and cutting gear. Malaysian Red Crescent Society sent a 12-member team including four doctors and eight
relief workers to Pakistan. Red Cross and Crescent workers from other Southeast Asian nations, including Indonesia,
the Philippines and Singapore will also join the relief efforts in Pakistan.
European Union (EU) has proposed giving at least €80 million (US $96 million) in aid for reconstruction and relief activities for the survivors of earthquake in Pakistan. This is in addition to the 13.6 million euros emergency humanitarian aid already released, bringing the total proposed aid for 2005-06 to 93.6 million euros (US $111.7 million).
World Bank offered US $20 million to Pakistan to help deal with the tragedy unleashed by the South Asia earthquake.
Asian Development Bank (ADB) announced reallocation of $10 million for immediate emergency assistance in the worst-affected areas of Pakistan.
World Health Organization (WHO) has provided Pakistan with two emergency health kits, which will provide essential medical supplies to care for a total of 20,000 people for three months. It has also announced five more kits as well as packages to cover 1000 surgical operations in coming days.
United Nations (UN) has sent its emergency coordination team to join relief efforts after the earthquake.
NATO is planning to send engineers teams to open blocked roads and setting up hospitals in the quake ravaged areas.
According to the Government of Pakistan, Rs. 5.15 billion donations have been received in President‘s Earthquake Relief Fund, while Rs. 5.35 billion donations have been pledged. And some US $ 2.05 billion foreign aid has been announced including US $1.93 billion aid pledges from 15-20 countries. It has been estimated that the time for reconstruction of earthquake devastated areas will take atleast three to five years. The Government will need billions of dollars in the reconstruction and rehabilitation process, which could only be provided through foreign aid.
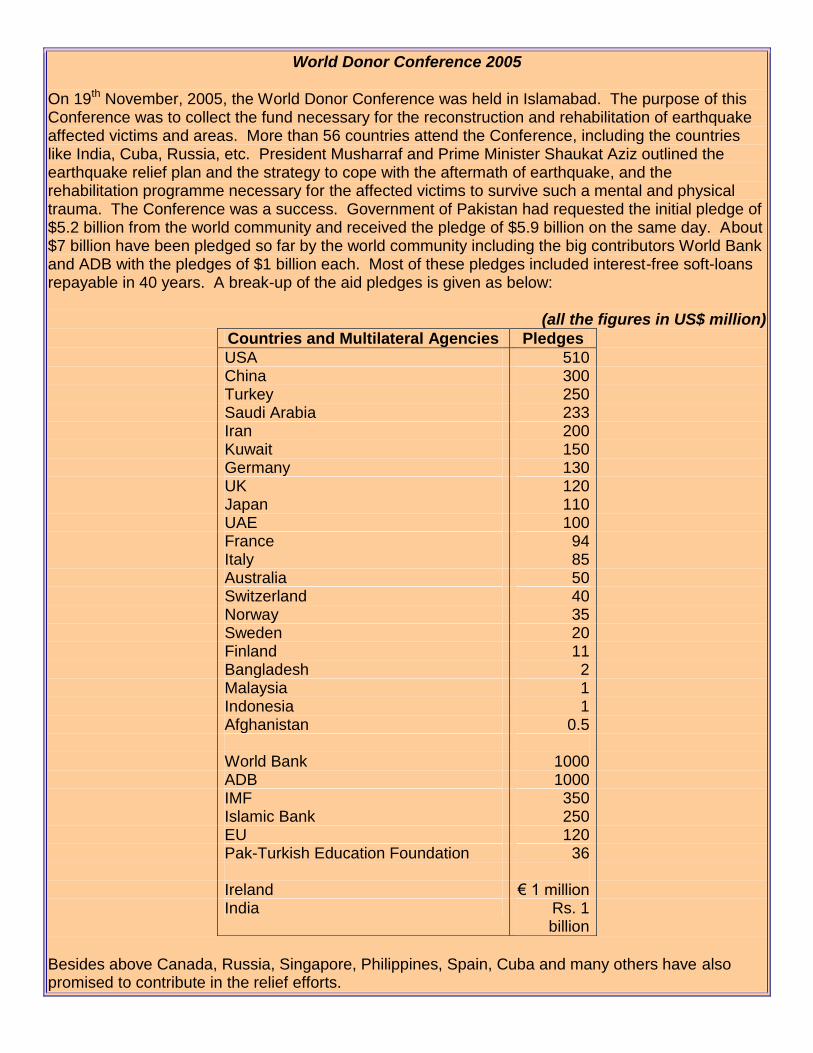
World Donor Conference 2005
On 19th November, 2005, the World Donor Conference was held in Islamabad. The purpose of this Conference was to collect the fund necessary for the reconstruction and rehabilitation of earthquake affected victims and areas. More than 56 countries attend the Conference, including the countries like India, Cuba, Russia, etc. President Musharraf and Prime Minister Shaukat Aziz outlined the earthquake relief plan and the strategy to cope with the aftermath of earthquake, and the rehabilitation programme necessary for the affected victims to survive such a mental and physical trauma. The Conference was a success. Government of Pakistan had requested the initial pledge of $5.2 billion from the world community and received the pledge of $5.9 billion on the same day. About $7 billion have been pledged so far by the world community including the big contributors World Bank and ADB with the pledges of $1 billion each. Most of these pledges included interest-free soft-loans repayable in 40 years. A break-up of the aid pledges is given as below:
(all the figures in US$ million)
Countries and Multilateral Agencies Pledges
USA 510
China 300
Turkey 250
Saudi Arabia 233
Iran 200
Kuwait 150
Germany 130
UK 120
Japan 110
UAE 100
France 94
Italy 85
Australia 50
Switzerland 40
Norway 35
Sweden 20
Finland 11
Bangladesh 2
Malaysia 1
Indonesia 1
Afghanistan 0.5
World Bank 1000
ADB 1000
IMF 350
Islamic Bank 250
EU 120
Pak-Turkish Education Foundation 36
Ireland € 1 million
India Rs. 1 billion
Besides above Canada, Russia, Singapore, Philippines, Spain, Cuba and many others have also promised to contribute in the relief efforts.
Private Investment
Importance of Foreign Private Investment:
There is no doubt that the inflow of foreign capital accelerates the economic growth of under-developed countries in number of ways:
(a) Foreign investment supplement domestic savings and harnesses them to secure a rapid rate of growth. It serves as a stimulant to additional domestic investment in the recipient country. By increasing the rate of capital formation in the country, it goes a long way in removing the capital deficiency which is the main hurdle in the economic growth.
(b) Foreign investment generally brings along with it technical know how. By providing technical expertise it helps in building modern industrial structure in the receiving countries. In this way, it adds to their aggregate national product and per capita income which not only works towards removing their poverty but increases the rate of savings which in turn accelerates the process of their growth. In course of time, the vicious circle of poverty is broken and the beneficial circle of prosperity is set in motion.
(c) Foreign investment provides valuable foreign exchange which is the desperate need of the developing economies. It is generally observed that, in the early years of development, the import bill of such countries goes on mounting because they have to import food grains, machinery and capital and essential industrial raw materials but their exports lag woefully behind. This creates balance of payment difficulties in the solution of which foreign capital proves a god send.
(d) Benefits also accrue from foreign investment to domestic labour in the form of higher real wages, to consumers in the form of greater supply of consumer goods, larger in quantity, better in quality and greater in variety and to the government in the form of higher tax revenues. The economy benefits through the realisation of external economies. Since foreign capital helps in building up economic infra-structure in the form of means of transport and communications, railways, roads, hydro-electric projects supplying irrigation and power, it undoubtedly results in acceleration of the rate of growth.
Determinants of Private Investment:
The private investment rates in developing countries have varied significantly over time. In Pakistan, the private investment rate fall sharply during 1990s. Instead of rapid economic growth, Pakistan witnessed slowing down of economic growth during 1990s. Investment rate decelerate from an average of over 19% of GDP to 15.6% by 1999. There are number of factors that help explain these variations:
(a) Real Per Capita Growth Rate: There is general agreement among economists that a country‘s growth rate would have a positive impact on private investment. A higher growth rate would increase private investment activity if the relationship between the level of real output and the desired capital stock is relatively fixed.
(b) Real Interest Rate: There are competing views about the effect of real interest rates on private investment. A high level of real interest rates raises the real cost of capital, and therefore dampens the level of private investment. But there is another side. Poorly developed financial markets in these countries and inadequate access to foreign financing for

most private projects implies that private investment is constrained largely by domestic savings.
(c) Level of Per Capita Income: Economists have argued that per capita income levels should be positively related to private investment activity, because higher income countries are better able to devote resources to saving.
(d) Public Investment Rate: As with the real interest rate, the impact of the public investment rate (i.e., the ratio of public investment expenditure to GDP) on private investment activity is uncertain.
(e) Domestic Inflation Rate: High rates of inflation adversely affect private investment activity by increasing the riskiness of longer-term investment projects, reducing the average maturity of commercial loans, and distorting the information conveyed by prices in the economy. In addition, high inflation rates are often considered a sign of macroeconomic instability and the inability of government to control macro-economic policy, both of which contribute to an adverse investment climate.
(f) External Debt Burden: Measured by its debt-service payments ratio and the ratio of external debt to GDP, the external debt burden can have a powerful negative effect on a country‘s private investment rate. A higher debt-service payments ratio means that fewer resources are available for domestic use, including private investment, and hence should have a direct adverse impact on private investment rates. A high ratio of external debt to GDP, which indicates that the country has a large debt ‗overhang‘, may also discourage private investment.
(g) Non Economic Factors: Besides the above economic variables, there are also other non-economic factors, such as political stability and investor confidence, that play an important role in investment behaviour. Another factor is a country‘s tax and regulatory environment which also plays a vital role in establishing investor‘s confidence in the administrative structure of the country.
Investment Policy and the Current Situation in Pakistan:
According to Pakistan‘s Board of Investment, our country‘s investment policy is based on liberalisation policy. The main features of Pakistan‘s investment policy are outlined as below:
(a) All economic sectors open to Foreign Direct Investment.
(b) Equal treatment to local and foreign investors.
(c) 100 % foreign equity allowed.
(d) No Government sanction required.
(e) Attractive tax / tariff incentives package.
(f) Remittance of Royalty, Technical & Franchise Fee, Capital, Profits, Dividends allowed.
By October 2004, total foreign direct investment (FDI) stood at $950 million as against $472 million in October 1999. During the year 2004-05, total investment provisionally estimated at 16.9%, slightly lower than last year 17.3%. Fixed investment as percentage of GDP is estimated at 15.3% for the

year 2004-05 as against 15.6% last year. Public Sector investment declined from 4.8% in 2003-04 to 4.4% in 2004-05. During the year 2004-05 private sector investment rose marginally to 10.9%.
Net Inflow of Foreign Private Investment (Direct + Portfolio)
(All figures in US$ million)
Country 2001-02 2002-03 2003-04 2004-05
USA 324.7 226.6 259.8 373.0
UK -2.1 184.8 41.9 199.1
UAE 17.3 120.4 146.5 417.3
Germany 11.2 3.8 4.0 15.2
France -6.6 2.6 -5.6 -3.5
Hong Kong 23.4 5.2 5.0 61.2
Italy 0.1 0.4 - 0.4
Japan 6.6 14.1 11.6 41.7
Saudi Arabia 1.4 43.6 5.3 18.2
Canada 6.2 0.5 0.5 2.0
Others 92.4 218.1 452.7 552.0
Total 474.6 820.1 921.7 1676.6 Source: State Bank of Pakistan

Importance of Foreign Trade
Theory of Gains from Foreign Trade:
The gains from foreign trade can be broadly classified into:
(a) Static Gains: Static gains arise from optimum use of the country‘s factor endowments or resources in men, money and material, so that the national output is maximised resulting in increase in social welfare. Static gains result from the operation of the theory of comparative cost in the field of foreign trade. Acting on this principle, the participating countries are able to make optimum use of their resources or factor endowments so that the national output is greater than it otherwise would be. This raises the level of social welfare in the country. Utility or welfare can be measured by indifference curves. Utility or welfare can be measured by indifference curve. As a result of introduction or extension of foreign trade, the people can move to a higher indifference curve. This has been shown in the following figure. Take two countries A and B both producing wheat and cotton. Production possibility curve and indifference curves are shown as below:
In the above figure, it can be seen that, before the commencement of foreign trade, country A would be in equilibrium at the point E where the price line PP‘ is tangent to both production possibility curve AB and indifference curve IC1. The slope of the price line shows the price ratio or cost ratio of the two commodities in the country A; TT‘ is the terms of trade line showing the price ratio at which goods can be exchanged between these two countries, TT‘ line is tangent to A‘s production possibility curve AB. At point F, country A will produce more of cotton in which it has comparative advantage and less of wheat at F than at E. Taking the pattern of demand in the country A, we have the indifference curves IC1 and IC2 representing the demand for the two commodities. Now TT‘ is tangent to IC2 at G which shows the quantities of wheat and cotton consumed by the country A. It can be seen that as a result of introduction of foreign trade, the country A has moved from E on the indifference curve IC1 to G on the difference IC2, which represents a higher level of social welfare in terms of larger consumption of the two trade goods. This is called „static gain‟ resulting from specialisation brought about by the introduction of foreign trade. It can also be seen that the quantities of the two goods consumed and different from the quantities produced. The quantities produced are shown at F and quantities consumed at G. The difference is accounted for by exports and imports. The country A will be exporting KF quantity of cotton importing KG quantity of wheat.
The gain to country B can be similarly explained. Production possibility curve of B between wheat and cotton is shown by the curve CD in the following diagram. It is clear that given the factor endowments, it is more profitable for B to produce wheat. The country B fixes her production and

consumption at point E before the introduction of foreign trade. At this point, price ratio line PP‘ and indifference curve IC1 are tangent to production possibility curve CD. The country B would gain from trade if it can sell at a price ratio different from PP‘. Given the terms of trade line TT‘, the country B will produce at F on the production possibility curve CD:
From the above diagram, it would be evident that the country B will produce more of wheat in which it has comparative advantage and less of cotton in which it has comparative disadvantage. But given the price ratio as represented by terms of trade line TT‘, B will consume the quantities of two goods as shown by the point G where the terms of trade line TT‘ is tangent to the indifference curve IC2. It is clear that specialisation resulting from the introduction of foreign trade has enabled the country B to move to the higher indifference curve IC2 and thus consume more of the two goods. This is her gain from international trade. The country will now export KF amount of wheat and import KG amount of cotton. It may be borne in mind that in the case of constant opportunity cost, each country resorts to complete specialisation i.e. producing only one of the two goods. On the other hand, in case of increasing opportunity cost, specialisation is not complete so that a country produces relatively larger quantity of the commodity in which it has comparative advantage.
(b) Dynamic Gains: Dynamic gains, on the other hand, refer to those benefits which promote economic growth of the participating countries. International trade also brings to the participating countries that are known as dynamic gains. They relate to economic growth and development which results from the introduction of international trade. According to the theory of comparative cost, specialisation by different countries in producing commodities for which they are best fitted, results in a larger volume of production and improves productivity. This obviously promotes economic development. There is no doubt that extension of international trade has accelerated economic growth in the participating countries, like China, Malaysia, Indonesia, Turkey, India, Pakistan, Sri Lanka, etc.
Role of Foreign Trade in Economic Development:
International trade increases national income and facilitates saving and opens out new channels of investment. Increase in saving and investment is bound to promote economic growth. Exports earn foreign exchange which can be utilised in buying capital and equipment and know-how from abroad which can serve as instruments of economic growth. The larger the national income and output, the higher will be rate of growth. The higher level of output enables a country to avoid the vicious circle of poverty and put the country in the ‗take-off‘ or self-sustaining growth. Production possibilities and cost of production in different countries differ so widely that foreign trade brings to the participating countries tremendous gains in terms of national output and income.

Foreign trade promotes economic development in the following different ways:
(a) Acquisition of Capital Goods from Developed Countries: The under-developed countries (UDCs) are enabled by foreign trade to obtain in exchange for their goods capital equipment and heavy engineering machines to foster their countries‘ economic development. For example, Pakistan exports rice, cotton and cotton textiles, leather and leather goods, and sports goods and in exchange she imports heavy engineering machines and tools, trucks, and other capital equipment from the developed countries.
(b) Import of Technical Know-how or Skills: An under-developed country (UDC) is short of all kinds of professionals like engineers, architects, doctors, managers, accountants, economists, and other technical personnel. To cover this shortage and to learn more, a UDC can allow the inflow of technical brains from developed countries.
(c) International Market: The foreign trade can extend the scope of the business to the international market. The domestic market is limited, the foreign trade sector opens new vistas, new marketing channels and new markets. When the markets are extended, the economies of scale are reaped, the efficiency and productivity will increase. Accordingly, the forces of development will set themselves in motion.
(d) Foreign Investment: The foreign trade is also helpful in attracting foreign investment. The foreign investors are attracted towards active trading countries and invest in the form of capital goods and technical expertise. In this way, the assembling plants, the manufacturing plants and the latest technology will come into the country. As our recent investment agreements with China, USA, UK, South Korea, Sweden, Hong Kong, Saudi Arabia and UAE will be helpful in promoting trade and industries in the country.
(e) Source of Public Revenue: When there is imports and exports of goods and services, the government can earn the revenue in form of tariffs, custom duty, import licence fees, etc.
(f) Foreign Exchange Earnings: Moreover, the external sector also opens the employment opportunities for the country-men in the foreign countries. Hundreds of thousands of Pakistanis are working abroad. Pakistan is earning billions of dollars through foreign exchange remittances. Pakistan has earned $ 2.4 billion on account of workers‘ remittances working abroad during the year 2001-02, which increased to $ 4.2 billion during 2002-03. Therefore, such remittances are proved to be a major source of foreign exchange earnings.
Import Substitution vs. Export Promotion:
There are two types of economic strategies – import substitution and export promotion, which are helpful in removing the deficit in BOP and accelerating the process of industrialisation and economic development:
(a) Import Substitution: The import substitution strategy or „import-led‟ or „inward-looking strategy‟ aims at producing the import substitutes in the country. The import substitution (IS) strategy will reduce the dependence of a country on foreign goods. It will enable a country to produce the plants, machinery, electronic goods, consumer durables and a variety of goods. In this way, not only the domestic production will increase, but the domestic employment will also be boosted up. This strategy provides self-sufficiency in the economy. But at the same time the country has to rely on heavy foreign loans and assistance in order to complete expensive projects.

The import substitution strategy fosters the process of industrialisation and economic development. It helps in protecting and developing small and medium sized industries. It protects the local manufacturers and labour by protecting them from foreign competitors.
During 1950s and 1960s, the major stress was laid upon initiating the IS strategy in Pakistan. As a result of such strategy the manufacturing sector has had its foundations. The growth rate of manufacturing sector, during this period is estimated at 16% p.a. Some economists accorded that Pakistan, on the basis of such IS strategy, has entered in the stage of „take-off‟. The import substitution strategy pursued in Pakistan was given the name of „Easy-Import Substitution Strategy‟, which was mostly confined to the establishment of consumer goods like textile and sugar industry. But inspite of import-substitution in the country, we remained depending upon imports of capital goods, machinery, automobiles, chemicals, petro-chemicals and medicines, thus increasing BOP deficits. Moreover, the industrial sector, which was came into being as a result of IS strategy, was extremely inefficient. There was a misallocation of resources. The goods were produced at the prices higher than the international prices. The investors engaged in import-substitution not only reaped abnormal profits, but they were also exempted from direct taxes. They did not have to face competitors, trade-unions and even the anti-monopoly authority. Moreover, during this period, „multiple exchange rate system‟ was prevailed in the country. Due to this system, the price of rupee had fallen to a greater degree, which led to income disparity and unemployment. Moreover, during this era, Government‘s major focus was on industrial policies and she ignored altogether the development of agriculture sector.
(b) Export Promotion: Export promotion strategy is also known as „export-led‟ or „forward-looking strategy‟. Export promotion strategy is aimed at boosting the exports of semi-manufactured and manufactured goods in place of traditional commodities and improving the standard of exports. Export growth is equivalent to the economic growth. Because of comparative advantage when a country specialises in a product, the export-led strategy enables her to make the product available to the world community at cheaper prices. Thus, the international markets are extended for an exporting country. The income and employment levels are expanded. Consequently, the process of economic development is facilitated.
The export promotion strategy will also attract the foreign capital. The countries which are well endowed with natural resources like oil, gas, iron, rubber, tin and other mineral deposits and which are having potential and prospective comparative advantage in these products would be able to attract the foreign investors. The foreign capital, foreign technology and foreign skill will open new vistas. The output and employment will increase, and finally the export will go up.
In export promotion strategy, the subsidies and incentives are given to all the sectors of the economy, rather to a particular sector of the economy (as in the case of import substitution strategy). When exports are boosted enough foreign exchange could be earned which would be utilised in respect of importation. With the help of industrial imports, purchased with the foreign exchange earned through exports, a country may also launch the process of industrial development.
The emphasis of Pakistan‘s industrial policy has been more on import substitution than on export promotion. The position of domestic industries results in higher prices for the consumer. Industries are become inefficient because of absence of foreign competition, there is no incentive to reduce their production costs. The export industries of Pakistan have to be very efficient in order to compete in the global market.
Pakistan’s Foreign Trade Sector:
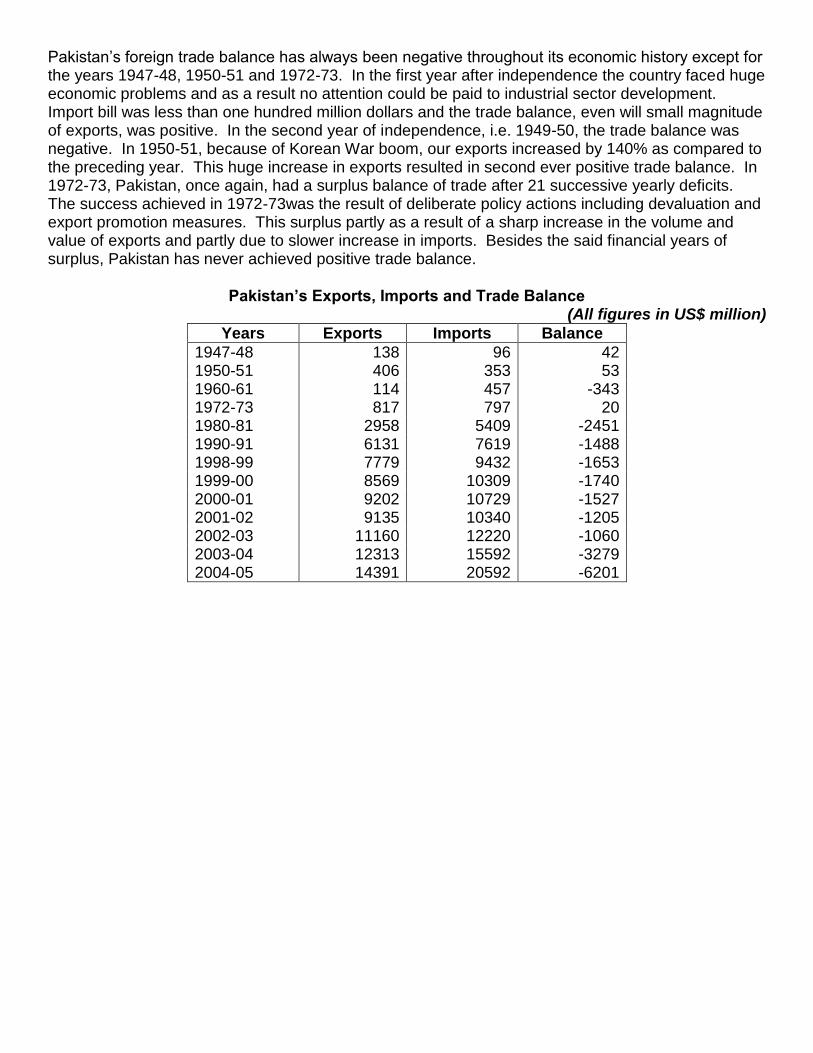
Pakistan‘s foreign trade balance has always been negative throughout its economic history except for the years 1947-48, 1950-51 and 1972-73. In the first year after independence the country faced huge economic problems and as a result no attention could be paid to industrial sector development. Import bill was less than one hundred million dollars and the trade balance, even will small magnitude of exports, was positive. In the second year of independence, i.e. 1949-50, the trade balance was negative. In 1950-51, because of Korean War boom, our exports increased by 140% as compared to the preceding year. This huge increase in exports resulted in second ever positive trade balance. In 1972-73, Pakistan, once again, had a surplus balance of trade after 21 successive yearly deficits. The success achieved in 1972-73was the result of deliberate policy actions including devaluation and export promotion measures. This surplus partly as a result of a sharp increase in the volume and value of exports and partly due to slower increase in imports. Besides the said financial years of surplus, Pakistan has never achieved positive trade balance.
Pakistan’s Exports, Imports and Trade Balance (All figures in US$ million)
Years Exports Imports Balance
1947-48 138 96 42
1950-51 406 353 53
1960-61 114 457 -343
1972-73 817 797 20
1980-81 2958 5409 -2451
1990-91 6131 7619 -1488
1998-99 7779 9432 -1653
1999-00 8569 10309 -1740
2000-01 9202 10729 -1527
2001-02 9135 10340 -1205
2002-03 11160 12220 -1060
2003-04 12313 15592 -3279
2004-05 14391 20592 -6201

(a) Composition of Exports and Imports: Structure and composition of Pakistan exports and imports have changed over time:
Composition of Pakistan’s Exports and Imports (In Percentage)
Year
Exports Imports
Primary Goods
Semi- Manufacture
s
Manufactured Goods
Capital Goods
Industrial Raw Material Consumer
Goods Capital Goods
Consumer Goods
1969-70 33 23 44 50 11 29 10 1979-80 42 15 43 36 6 42 16 1989-90 20 24 56 33 7 41 19 1993-94 10 24 66 38 6 43 13 2000-01 13 15 72 25 6 55 14 2001-02 11 14 75 28 6 55 11 2002-03 11 11 78 31 6 53 10 2003-04 10 12 78 35 7 49 9 2004-05 11 10 79 36 8 46 10

In 1969-70 the primary commodities comprised a huge share of 33% of total exports, while of the shares of semi-manufactured and manufactured goods were limited to 23% and 44% respectively. During the fiscal year 2004-05, the shares of primary, semi-manufactured and manufactured commodities are 11%, 10% and 79%. The significant rise in manufactured commodities, i.e. from 33% in 1969-70 to 79% in 2004-05, is a positive sign, but still Pakistan is lack of semi-manufactured goods. Pakistan has to reduce the export of her primary commodities and increase that of semi-manufactured goods. This is due to the fact that our primary commodities are short of international standards. Moreover, the prices of primary commodities are prone to severe price shocks. Whereas, the market for manufactured goods is huge and stable.
The change in composition of imports has not been very conducive to long-term growth requirements. In the above table and graph, it is indicated that the percentage share of ‗industrial raw materials for consumer goods industries‘ has a significant rise from 29% in 1969-70 to 46% in 2004-05. Whereas the percentage share of industrial raw material imports for capital good industries has declined from 11% to 8%. The percentage share of imports of manufactured capital goods has decreased from 50% to 36%. This situation indicates that our consumer good imports (including industrial raw materials) have increased at a rapid pace as compared with capital good imports which are

prerequisite for long-term self-sustained economic growth. It is very import to note that we are talking in terms of percentage share and not in terms of absolute values.
(b) Terms of Trade: The TOT of the country has been deteriorating since long, which states that the prices of our exports are decreasing while those of our imports are increasing. This is also one of the major shocks to our exports. Pakistan‘s annual terms of trade, and unit value indices of exports and imports are tabulated below:
Pakistan’s Annual Terms of Trade and
Unit Value Indices of Exports & Imports (Base Year: 1990-91)
Year Terms of
Trade
Unit Value Indices
of Exports
Unit Value Indices
of Imports
2000-01 90.96 271.47 298.44
2001-02 90.83 271.18 298.56
2002-03 82.07 254.02 309.52
2003-04 78.68 279.65 355.43
2004-05* 73.60 288.84 392.45
* The figures of FY 2004-05 include the provisional figures of 4th Quarter (Apr-Jun).
(c) Workers’ Remittances: Workers‘ Remittances are a major source of foreign exchange earnings and occupy a significant place in financing the import bill of the country. Pakistan has shown a remarkable progress in workers‘ remittances from abroad. In 1972-73 the workers‘ remittances stood at $136 million. In the year 1999-00, the workers remittances stood at $983.73 million. It increases four-fold to $4236.85 million in 2002-03 within the period of two years. Such amount of workers‘ remittances from abroad has never been achieved before in the economic history of Pakistan. This sharp increase shows the confidence of expatriate Pakistanis in the transparency of economic and foreign policies:
Workers Remittances from Abroad (All figures in $US Million)
Year Remittances
1998-99 1060.19
1999-00 983.73
2000-01 1086.57
2001-02 2389.05
2002-03 4236.85
2003-04 3871.58

(d) Foreign Exchange Reserves: On November 12, 1998, the foreign exchange reserves of Pakistan were at a ridiculous level of $415 million, hardly sufficient to finance two weeks of imports. The main reasons for such a low foreign exchange reserves were huge budgetary deficit, uncontrollable debt servicing, low foreign investment, heavy government expenditures, poor governance, and worst political conditions. Musharraf‘s Government‘s recent economic policies have survived the shortage of foreign exchange reserves. With vigorous and transparent policies of the Government, Pakistan‘s FOREX reserves stood at $12.6 billion on June 30, 2005:
Pakistan’s FOREX Reserves (All figures in US$ Billion)
Year End (June 30)
Total Liquid Reserves
1992-93 0.46
1998-99 2.28
1999-00 1.97
2000-01 3.22
2001-02 6.43
2002-03 10.72
2003-04 12.33
2004-05 12.62
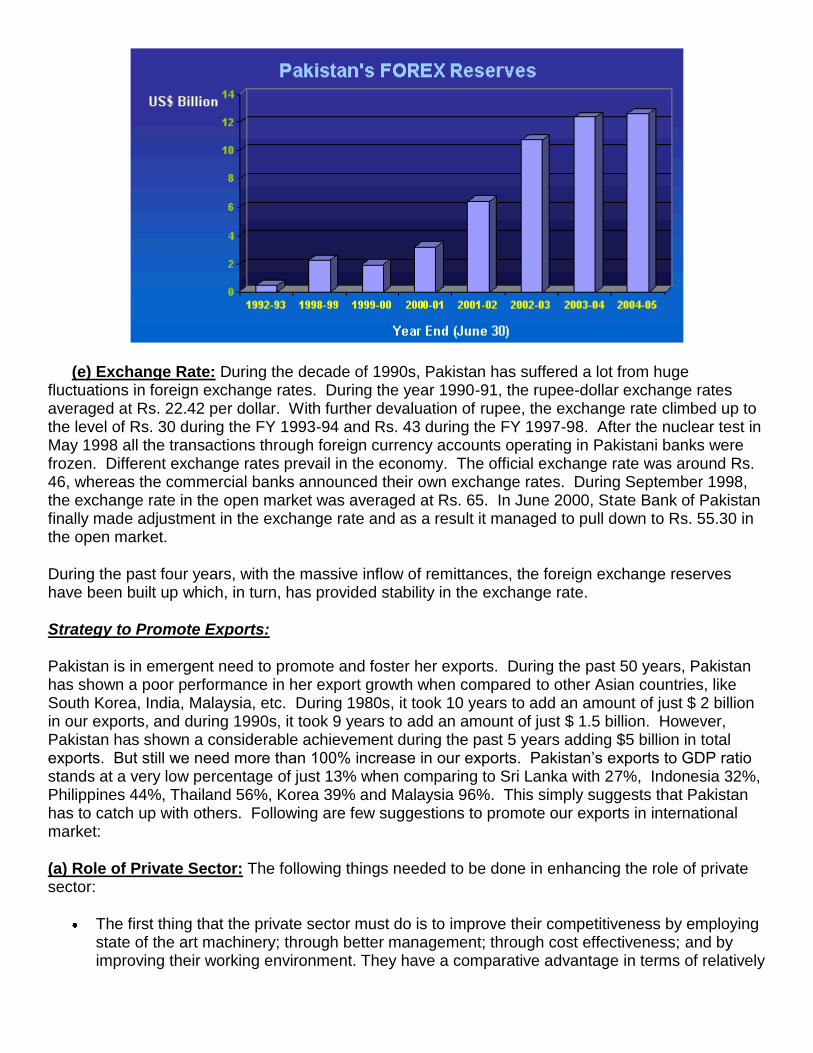
(e) Exchange Rate: During the decade of 1990s, Pakistan has suffered a lot from huge fluctuations in foreign exchange rates. During the year 1990-91, the rupee-dollar exchange rates averaged at Rs. 22.42 per dollar. With further devaluation of rupee, the exchange rate climbed up to the level of Rs. 30 during the FY 1993-94 and Rs. 43 during the FY 1997-98. After the nuclear test in May 1998 all the transactions through foreign currency accounts operating in Pakistani banks were frozen. Different exchange rates prevail in the economy. The official exchange rate was around Rs. 46, whereas the commercial banks announced their own exchange rates. During September 1998, the exchange rate in the open market was averaged at Rs. 65. In June 2000, State Bank of Pakistan finally made adjustment in the exchange rate and as a result it managed to pull down to Rs. 55.30 in the open market.
During the past four years, with the massive inflow of remittances, the foreign exchange reserves have been built up which, in turn, has provided stability in the exchange rate.
Strategy to Promote Exports:
Pakistan is in emergent need to promote and foster her exports. During the past 50 years, Pakistan has shown a poor performance in her export growth when compared to other Asian countries, like South Korea, India, Malaysia, etc. During 1980s, it took 10 years to add an amount of just $ 2 billion in our exports, and during 1990s, it took 9 years to add an amount of just $ 1.5 billion. However, Pakistan has shown a considerable achievement during the past 5 years adding $5 billion in total exports. But still we need more than 100% increase in our exports. Pakistan‘s exports to GDP ratio stands at a very low percentage of just 13% when comparing to Sri Lanka with 27%, Indonesia 32%, Philippines 44%, Thailand 56%, Korea 39% and Malaysia 96%. This simply suggests that Pakistan has to catch up with others. Following are few suggestions to promote our exports in international market:
(a) Role of Private Sector: The following things needed to be done in enhancing the role of private sector:
The first thing that the private sector must do is to improve their competitiveness by employing state of the art machinery; through better management; through cost effectiveness; and by improving their working environment. They have a comparative advantage in terms of relatively

cheap labour, relatively low cost of capital, a strong macroeconomic environment represented by a stable exchange rate, relatively low inflation and strong growth.
The second most important task that private sector must undertake is to look for new markets and new products. Today our exports are highly concentrated in few items and into few markets. More than 75% of our exports originate from four items, namely cotton, rice, leather and sports goods. Similarly more than one-half of our exports go to 7 countries. This state of affairs will not take us at higher export path. Diversification of exports, both in terms of commodity and regions will be needed. For new markets we need to look at China, Japan, Latin America and ASEAN Region.
(b) Role of the Government:
The first and foremost duty of the government is to provide a strong macroeconomic environment – an environment where exchange rate is stable; a comfortable foreign exchange reserves; low cost of capital; low inflation, low budget deficit and no debt crisis and consistent and transparent macroeconomic policies.
The second most important duty of the government is to provide strong infrastructure – transport and communication, roads and highways, power, well-functioning ports etc.
The third most important duty of the government is to enter into active Trade Diplomacy. We have to explore the possibilities in joining various Preferential Trading Arrangements (PTAs), and have to enter into bilateral negotiation at all levels for Free Trade Arrangements (FTA).
(c) Value Addition: Pursue enhancement of manufacturing and marketing capabilities and efficiencies with a view to achieve value addition and increased competitive strength for our core product categories.
(d) Women Entrepreneurship: To energize the women entrepreneurship in support of developing and realizing Pakistan's export capabilities and potential, and enhance overall economic value addition.
(e) Marketing Support: Majority of our exporters are presently weak in the marketing management abilities and the financial /human resources required for aggressive market share enhancement and product and geographical diversification. Due need of upfront investment of funds, SME exporters are shy to invest. It is essential that professional and financial help be provided by the government in partnership with the exporters, for aggressive international promotions, distributors and gaining access to new customers and markets.
(f) Pakistan's Business Image: It is recognized that all countries have their strengths and weaknesses. Success depends upon efficient capitalization of Strengths and management of Weaknesses to provide an honest and positive business image. It is also recognized that image management has to be professionally achieved for best results.
(g) Human Resources and Skill/Technology Support: In alignment with the strategic product, geographic needs and international trading regulations, the skills, training /technical facilities be enhanced amongst all stakeholders especially the exporters, Pakistan's Missions and the Export Promotion Bureau, financial institutions and SMEDA.
(h) Quality, Social and Environment Management: Culture of 'TQM' (Total Quality Management) and 'CI' (Continuous Improvement) needs to be inculcated and embedded in support of Quality,

Social progressively and meet international standards and specifications as a minimum. Appropriate regulatory framework, quality and social management processes such as ISO/SA certifications and a transparent efficient judicial process needs to be in support.
(i) Foreign Direct Investment and Finance: Foreign Direct Investment needs to be strongly encouraged to strengthen our exporters management expertise, technological and infrastructural support, competitive edge and market access.
Transparent access to finance will be vital for the desired significant increase in exports. Sufficient access at internationally competitive mark ups would need to be ensured, especially for the value adding and Developmental Product Categories.
(j) Small & Medium Enterprise Development: On a medium term basis, the success of Pakistan's exports must heavily rely on the strength of our Small and Medium size exporters. EPB in alignment with the supply chain management efforts of SMEDA, must help enhance the exporting and marketing capacity of the SME's inclusive of adequate finance through the relevant financial institution i.e. State Bank, SBFC, RDFC and other DFI's.

Balance of Payment
When a payment is received from a foreign country, it is a credit transaction while a payment to a foreign country is a debit transaction. The principal items shown on the credit side are exports of goods and services, unrequited or transfer receipts in the form of gift etc. from foreigners, borrowings from abroad, foreign direct investment and official sale of reserve assets including gold to foreign countries and international agencies.
The principal items on the debit side include imports of goods and services, transfer payments to foreigners, tending to foreign countries, investments by residents in foreign countries and official purchase of reserve assets or gold from foreign countries and internal agencies.
The credit and debit items are shown vertically in the BOP account of a country. Horizontally, they are divided into three categories, i.e.
(a) The current account,
(b) The capital account, and
(c) The official settlements account or official reserve assets account.
(a) The Current Account: It includes all international trade transactions of goods and services, international service transactions (i.e. tourism, transportation and royalty fees), and international unilateral transfers (i.e. gifts and foreign aid).
(b) The Capital Account: Financial transactions consisting of direct investment and purchases of interest-bearing financial instruments, non-interest bearing demand deposits and gold comprise the capital account.
(c) The Official Reserve Assets Account: Official reserve transactions consist of movements of international reserves by governments and official agencies to accommodate imbalances arising from the current and capital accounts.
In other words, it measures the change in nation's liquid and non-liquid liabilities to foreign official holders and the change in a nation's official reserve assets during the year. The official reserve assets of a country include its gold stock, holdings of its convertible foreign currencies and SDRs and its net position in the IMF.
BOP Account Chart:

1. CURRENT ACCOUNT:
(a) Merchandise:
Exports (+) (i.e. added)
Imports (–) (i.e. deducted)
(b) Services:
Services rendered (+)
Services received (–)
(c) Transfer Payments:
Transfer payments received (+)
Transfer payments rendered (–)
(d) Current Account Balance
2. CAPITAL ACCOUNT:
(a) Financial Transactions:
Borrowing from foreign countries (+)
Lending to foreign countries (–)
Direct investment by foreign countries (+)
Direct investment to foreign countries (–)
(b) Capital Account Balance
3. OFFICIAL ACCOUNT:
(a) Reserves:
Increase in foreign official assets in the country (+)
Decrease in official reserves of gold and foreign currency (i.e. official reserve assets) (–)
(b) Official Account Balance

Pakistan‘s balance of payment for the last three years is as follows:
Balance of Payment
(All figures in US$ Million)
Details 2001-02 2002-03 2003-04 1. Trade Balance:
Exports (fob) Imports (fob)
-294
9140
9434
-444
10889
11333
-1212
12395
13607 2. Services (Net):
Shipment
Other transportation
Travel
Investment income
Interest payment
Profits and dividends and purchase of crude oil
Other goods, services and income
-2617
-740
103
-147
-2319
-1469
-852
486
-2128
-868
237
-402
-2211
-1107
-1104
1116
-3585
-1159
161
-1035
-2206
-870
-1337
654 3. Current Transfers (Net):
Private transfers – net
Workers‘ remittances
FCA (residents)
Outright purchases
Export of currencies
Official transfers
of which: Saudi Oil Facility
5744
4249
2390
285
1376
0
1495
579
6775
5737
4237
-12
0
429
1038
637
6684
6110
3871
367
0
0
574
302 4. Current Account Balance (1+2+3) 2833 4203 1887 5. Capital Account (Net) -1107 -136 -1247 6. Errors and Omissions 928 522 247 7. Overall Balance 2654 4589 887 8. Financing
Changes in reserves
-2654
-2792
-4589
-5209
-887
-832
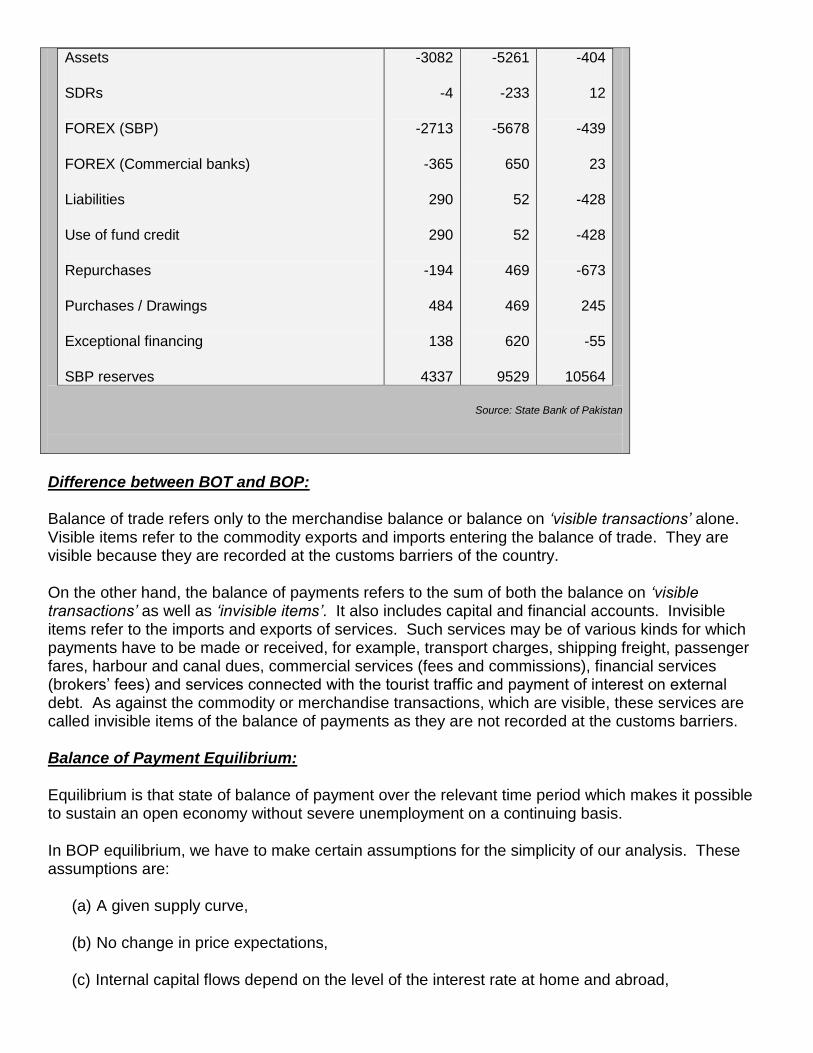
Assets
SDRs
FOREX (SBP)
FOREX (Commercial banks)
Liabilities
Use of fund credit
Repurchases
Purchases / Drawings
Exceptional financing
SBP reserves
-3082
-4
-2713
-365
290
290
-194
484
138
4337
-5261
-233
-5678
650
52
52
469
469
620
9529
-404
12
-439
23
-428
-428
-673
245
-55
10564
Source: State Bank of Pakistan
Difference between BOT and BOP:
Balance of trade refers only to the merchandise balance or balance on „visible transactions‟ alone. Visible items refer to the commodity exports and imports entering the balance of trade. They are visible because they are recorded at the customs barriers of the country.
On the other hand, the balance of payments refers to the sum of both the balance on „visible transactions‟ as well as „invisible items‟. It also includes capital and financial accounts. Invisible items refer to the imports and exports of services. Such services may be of various kinds for which payments have to be made or received, for example, transport charges, shipping freight, passenger fares, harbour and canal dues, commercial services (fees and commissions), financial services (brokers‘ fees) and services connected with the tourist traffic and payment of interest on external debt. As against the commodity or merchandise transactions, which are visible, these services are called invisible items of the balance of payments as they are not recorded at the customs barriers.
Balance of Payment Equilibrium:
Equilibrium is that state of balance of payment over the relevant time period which makes it possible to sustain an open economy without severe unemployment on a continuing basis.
In BOP equilibrium, we have to make certain assumptions for the simplicity of our analysis. These assumptions are:
(a) A given supply curve,
(b) No change in price expectations,
(c) Internal capital flows depend on the level of the interest rate at home and abroad,

(d) No accumulation of real capital.
It is evident that the balance of payments depends on both the level of domestic economic activity and the level of domestic interest rate.
FE curve is the set of all transactions of income and interest rate levels for which the overall payments balance is in equilibrium, i.e. neither in surplus nor in deficit (as shown in the following figure).
In the above figure, FE curve showing equilibrium in BOP. All the points above FE curve show surpluses in BOP and all the points below FE show deficits. B is the target point of policy at which the nation has achieved both internal balance (full employment without excessive inflation) and external balance.
Types of BOP Equilibrium:
There are two types of BOP equilibrium, i.e., static equilibrium and dynamic equilibrium:
(a) Static Equilibrium: The distinction between static and dynamic equilibrium depends upon the time period. In static equilibrium, exports equal imports including exports and imports of services as well as goods and the other items on the BOPs – short term capital, long term capital and monetary gold are on balance, zero. Not only should the BOPs be in equilibrium, but also national money incomes should be in equilibrium vis-à-vis money incomes abroad. The foreign exchange rate must also be in equilibrium.
(b) Dynamic Equilibrium: The condition of dynamic equilibrium for short periods of time is that exports and imports differ by the amount of short-term capital movements and gold (net) and there are no large destabilising short-term capital movements.
The condition for dynamic equilibrium in the long run is that exports and imports differ by the amount of long term autonomous capital movements made in a normal direction, i.e. from the low-interest rate country to those with high rates. When the BOP of a country is in equilibrium, the demand for domestic currency is equal to its supply. The demand and supply situation is thus neither favourable nor unfavourable. If the BOP moves against a country, adjustments

must be made by encouraging exports of goods, services or other forms of exports or by discouraging imports of all kinds. No country can have a permanently unfavourable BOP, though it is possible – and is quite common for some countries – to have a permanently unfavourable balance of trade. Total liabilities and total assets of nations, as of individuals, must balance in the long-run.
Types and Causes of BOP Disequilibrium:
There are three main types of BOP Disequilibrium which are discussed below:
(a) Cyclical disequilibrium,
(b) Secular disequilibrium, and
(c) Structural Disequilibrium.
(a) Cyclical Disequilibrium: Cyclical disequilibrium occurs because of two reasons. First, two countries may be passing through different paths of business cycle. Second, the countries may be following the same path but the income elasticities of demand or price elasticities of demand are different. If prices rise in prosperity and decline in depression, a country with a price elasticity for imports greater than unity will experience a tendency for decline in the value of imports in prosperity; while those for which import price elasticity is less than one will experience a tendency for increase. These tendencies may be overshadowed by the effects of income changes, of course. Conversely, as prices decline in depression, the elastic demand will bring about an increase in imports, the inelastic demand a decrease.
(b) Secular Disequilibrium: The secular or long-run disequilibrium in BOP occur because of long-run and deep seated changes in an economy as it advances from one stage of growth to another. The current account follows a varying pattern from one state to another. In the initial stages of development, domestic investment exceeds domestic savings and imports exceed exports.
Disequilibrium arises owing to lack of sufficient funds available to finance the import surplus, or the import surplus is not covered by available capital from abroad. Then comes a stage when domestic savings tend to exceed domestic investment and exports outrun imports. Disequilibrium may result, because the long-term capital outflow falls short of the surplus savings or because surplus savings exceed the amount of investment opportunities abroad. At a still later stage, domestic savings tend to equal domestic investment and long term capital movements are on balance, zero.
(c) Structural Disequilibrium: Structural disequilibrium can be further bifurcated into:
(i) Structural Disequilibrium at Goods Level: Structural disequilibrium at goods level occurs when a change in demand or supply of exports or imports alters a previously existing equilibrium, or when a change occurs in the basic circumstances under which income is earned or spent abroad, in both cases without the requisite parallel changes elsewhere in the economy. Suppose the demand for Pakistani handicrafts falls off. The resources engaged in the production of these handicrafts must shift to some other line or the country must restrict imports, otherwise the country will experience a structural disequilibrium.

A deficit arising from a structural change can be filled by increased production or decreased expenditure, which in turn affect international transactions in increased exports or decreased imports. Actually it is not so easy, because the resources are relatively immobile and expenditure not readily compressible. Disinflation or depreciation may be called for to correct a serious disequilibrium.
(ii) Structural Disequilibrium at Factors Level: Structural disequilibrium at the factor level results from factor prices which fall to reflect accurately factor endowments, i.e., when factor prices are out of line with factor endowments, distort the structure of production from the allocation of resources which appropriate factor prices would have indicated. If, for instance, the price of labour is too high, it will be used more sparingly and the country will import goods with a higher labour content. This will lead to unemployment, upsetting the balance in the economy.
General Measures to Correct BOP Disequilibrium:
To correct the different types of disequilibrium in BOP the following general measures are used:
(a) Exchange depreciation (price effect) or devaluation (by government),
(b) Deflate the currency,
(c) Tariffs,
(d) Import quotas, and
(e) Export duties.
(a) Exchange Depreciation (Price Effect) or Devaluation (by Government): Exchange depreciation means a reduction in the value of a currency in terms of gold or other currencies under „free market‟ conditions and coming about through a decline in the demand for that currency in relation to the supply. This is usually applied to „floating exchange rates‟. The purpose of this method is to depreciate the external exchange value of the home currency, thus cheapening the domestic goods for the foreigner. Whereas, under „fixed-parity system‟ or „fixed exchange rate‟, the reduction of currency value in against the gold or other currencies is official and not market based. This official reduction of exchange rate is called „devaluation‟. The purpose of both „depreciation‟ and „devaluation‟ is to cheapen the domestic goods and boost up the exports. But the governments regarded devaluation as a means of correcting a balance of payments deficit only as a measure of last resort. They predominantly relied on deflation of the home market and international borrowing. Devaluation or depreciation of the exchange rate can correct a balance of payment deficit because it lowers the price of exports in terms of foreign currencies and raises the price of imports on the home market. This does not necessarily succeed in its purpose. The immediate effect is similar to an unfavourable change in the TOT. For the resources devoted to the production of exports, less foreign exchange is earned with which to pay for imports. If the level of imports remained the same, more output would have to be diverted to exports and away from home consumption and investment simply to maintain the status quo. Devaluation or depreciation could lead to a loss of real income without any benefit to the balance of payments.
Pakistan has always faced negative BOT except for three years, i.e. 1947-48, 1950-51 and 1972-73. The newly born Pakistan had a quite high exports and a handsome balance of trade (US $ 42 million). With the Korean War boom in 1950-51, once again Pakistan gained a

surplus in BOT (US $ 53 million). However, the reason for 1972-73‘s positive BOT ($ 20 million) was the massive currency devaluation in 1972 when the rupee was devalued from Rs. 4.76 to 2.3 times higher level of Rs. 11 per US dollar. The exports increased significantly and the share of exports in GDP rose to 14.9%.
(b) Deflate the Currency: According to this method, the currency is deflated. As the currency contracts, prices will fall, which will stimulate exports and check imports. But the method of deflation is also full of dangers. If prices are forced down while costs, which are proverbially rigid (especially as regards wages in countries where trade unions are well organised), do not follow suit, the country may face a serious depression and unemployment. Correcting the balance of payments, therefore, once a disequilibrium has arisen is not an easy matter.
(c) Tariffs: Tariff is a tax levied on imports. It is synonymous with import duties or custom duties. Tariffs are used for two different purposes; for revenue and for protection. „Revenue Tariffs‟ are a source of government revenue and „Protective Tariffs‟ are meant to maintain and encourage those branches of home industry protected by the duties.
Tariff duties are of four types:
(i) Ad Valorem Tariff: It is levied as a percentage of the total value of the imported commodity.
(ii) Specific Duties: These are levied per unit of the imported commodity.
(iii) Compound Duties: These are a mixture of above two.
(iv) Sliding Scale Duties: These vary with the prices of commodities imported.
(d) Import Quotas: As a protective device, import quotas are alternative to tariffs. Under an import quota, fixed amount of a commodity in volume or value is allowed to be imported into the country during a specified period of time. The major objectives of import quotas are:
(i) to avoid foreign competition,
(ii) to provide greater administrative flexibility,
(iii) to solve the problem of BOP and BOT.
Import quotas are of the following five types:
(i) Tariff quota,
(ii) Unilateral quota,
(iii) Mixing quota,
(iv) Bilateral quota, and
(v) Import licensing.
(e) Export Duties: When world prices are higher than domestic prices, there is an incentive to export. In such a situation, a government may levy export duties. Export duties are used to prevent exports. The reason may be that exported commodities are required domestically.
Causes of Disequilibrium in BOP with Reference to Pakistan:
Following are the main causes of disequilibrium in BOP with reference to Pakistan:
(a) Revenue oriented tariffs: The import and export tariffs of Pakistan are by and large revenue oriented. The balance of payment reasons are no doubt taken into account in the determination of import and export duties. However, there are numerous anomalies in these tariffs. There are cases where the raw materials for a finished article are taxed at such a high rate that it is cheaper to import the finished articles rather than import the raw materials and produce the finished articles locally. In cases like this, there can be no possibility for producing such articles for export.
The import and export tariffs need a thorough revision from the point of view of minimising the tax element in the cost of production. The approach should be to tax consumption but not production.
(b) Adverse terms of trade: The TOT has a tendency to move against us. This is because of this fact that prices of our exports decreasing the world market while the prices of our imports are constantly rising. The prices of our exports fall because we export raw materials and semi-manufactured goods which cannot be stored for a long time. Our cotton and leather are facing the competition of artificial and synthetic fibre from China, Malaysia, Korea, etc. On the other hand, the prices of our import commodities are rising because they are finished and final products and can be disposed in the market very quickly. In such state of affairs, our international receipts go on falling while our payments go on increasing. Accordingly, the deficit is sure to occur.
(c) Import substitution policy of Pakistan: The emphasis of Pakistan‘s industrial policy has been more on import substitution than on export promotion. The position of domestic industries results in higher prices for the consumer. But what is worse is that industries having a sheltered domestic market tend to become inefficient, because, in the absence of foreign competition, there is no incentive to reduce their production costs. The export industries, on the other hand, have to be very efficient in order to be able to compete in the world market, for they don‘t have the luxury of a sheltered market at home, in which they can thrive at the cost of the consumer. Besides, some of the export industries are much more labour intensive than the import substitution industries.
(d) Export of primary commodities: The main factor for the disturbing export performances is the adverse trend in the terms of trade. But the vulnerability to the TOT shock is the result of heavy dependence of the country‘s export earnings on primary commodities like cotton, rice, and semi-manufactured goods, which are subject to frequent price fluctuations in the world market. To import stability to the country‘s export trade, it has been suggested times and again that the export of manufactured goods, for example, textiles, automobiles, heavy engineering goods, etc., should be increased.
(e) Capital account problem: The deficit in Current Account of BOP may be washed out by a surplus in capital account. But this is not the case with Pakistan. We have to face the following problems relating to capital account:

(i) The foreign official loans are specific and tied in nature and are attached with political interference and heavy rates of interest.
(ii) A lot of amount is spent on repayment of loans and debt servicing.
(iii) The private investors are still hesitant in making investment in our country because of several reasons, like political instability, lack of proper infra-structure, lack of energy generation plants, involvement of official procedures, and the element of stubbornness in the country.
(f) Trade restrictions of developed countries: The trade barriers raised by developed countries against the import of manufactures especially on agricultural products by the developing countries is one of the important factors preventing greater production and export by some industries in Pakistan, particularly the cotton textile industry. The dismantling of these barriers through negotiations can go a long way in increasing Pakistan‘s exports of manufactured goods.
(g) Inflation: Inflationary conditions are a serious obstacle to the promotion of exports. Inflation results in a rise in the domestic cost of production so that the goods produced cannot compete in the world market, if the rate of exchange is not suitably adjusted. So the control of inflation is essential for keeping Pakistani goods competitive and for promoting exports. It has not been possible to control inflation in Pakistan even in recent years.
(h) Ever-increasing demand for imports: Our socio-economic set-up is import and ultra import biased. People have craze to purchase imported goods. Accordingly, the demand for imported vehicles, consumer durables, electronics, etc. is increasing day by day. Moreover, the increased population, urbanisation and demonstration effect has necessitated the increase in demand for imported goods.
(i) Political instability: The development of the economy depends on the political circumstances of that country. Pakistan has been chronically suffered from different political shocks since her independence. Our exports and BOP are the clear reflection of these political instabilities. For example, during 1988-89, exports were affected by the political uncertainty and disturbances during the greater part of the year. The events starting from the dissolution of National Assembly on 29th May 1988 made a deep imprint on the psychology of business communities.
Measures to Correct Disequilibrium in BOP:
The following steps should be taken in order to remove the deficit or disequilibrium in balance of payment of Pakistan:
(a) Exports: The enhancing of exports will result in increasing the supply of foreign exchange in the country. In order to promote exports following steps should be taken:
(i) The proportion of manufactured goods be increased and that of primary and semi-manufactured goods be decreased.
(ii) In addition to manufactured exports, the non-traditional exports like food processing, dairy farming, vegetables and fruit canning, and dry fruits be promoted.
(iii) More and more delegates be sent abroad so that new markets could be explored. The export exhibitions and fairs be arranged in the big trading centres of the world. The

establishment of Expo Centres in Karachi and Lahore is a good step. Such expo centres should also be established in Rawalpindi-Islamabad, Faisalabad, Peshawar and the future city of Gwadar.
(iv) The quality and cost of the export goods be improved. Management philosophies like Continuous Improvement, TQM, Kaizen, and 3Es be adopted.
(v) The exporters be provided with compensatory and concessionary finance along with rebates, tax holidays and bonuses, etc. Export processing zones be increased and expanded in all the major cities.
(b) Imports: Our imports need proper check. Imports of only those goods should be allowed duty-free that are used in the production of export goods. Following steps should be taken:
(i) The imports of luxurious items should be restricted. The Government can impose heavy tariffs on foreign goods or even ban the imports of certain foreign goods that are deteriorating the BOP situation.
(ii) The imports of capital goods and engineering goods should be allowed, which are necessary for the economic development. Moreover, the Government should also allow the imports of those goods duty-free that are used in the production of export goods.
(c) Increase in Invisible Receipts and Decrease in Invisible Payments: The efforts be made to reduce the invisible expenditures. In this respect, the expenditures faced in respect of foreign embassies and foreign tours be decreased. The facilities of higher education regarding science and technology, medicine and surgery, business and economics, performing arts, etc. be provided for foreign students, especially from India, Afghanistan, Iran, Sri Lanka, Saudi Arabia, Bangladesh, independent Muslim states of Russia and UAE. In this way we can earn a lot of foreign exchange and remove the deficit in balance of payment. Moreover, the domestic airlines, shipping services, locomotives, recreational places including resorts, historical places, shopping places, etc should be made attractive for foreign tourists. Most of the countries are earning through their tourism and cultural sector, for example, Sri Lanka, Maldives, Malaysia, Indonesia, Singapore, Thailand, UAE, Egypt, Turkey, etc.
(d) Industrialisation and engineering: Reduction of BOP depends on our rapid industrial production and the quality of our products. We need to fully utilise the existing capacity of our industries, and to promote the process of industrialisation and development of engineering sector. The Government can establish more technical and engineering institutes and allow foreign faculties. The Government can also reduce sales tax or even allow tax exemptions on production and sale of machineries and heavy engineering goods including electric generators.
(e) Explore new vistas: The disequilibrium in BOP can also be corrected by exploring new vistas and diverting the resources to the production and sale of such new exportable goods and services. For example, the Government can find handsome export earnings in the new fields of genetic engineering, IT, anti-terrorism technology, computer gaming (like in South Korea), computer-based surgery, or even in the field of fashion designing, art and culture including sports.