economic obsolescence analysis as of january 1, 2015 · economic obsolescence different to that...
TRANSCRIPT

ONTARIO ENGINEERED WOOD INDUSTRY Economic Obsolescence Analysis As of January 1, 2015 Prepared for
Municipal Property Assessment Corporation

American Appraisal Canada, Inc. 3300 Bloor Street West, Centre Tower, Suite 2250, Toronto, ON M8X 2X3 tel 416-593-4050/fax 416-593-5168
Leading / Thinking / Performing
June 1, 2015 Mr. Paul Campbell Director Valuation and Customer Relations, Business Properties Municipal Property Assessment Corporation 1340 Pickering Parkway, Suite 101 Pickering, ON L1V OC4 Dear Mr. Campbell: At your request, American Appraisal Canada, Inc. prepared the attached report concerning the estimation of economic obsolescence in the Ontario engineered wood industry as of January 1, 2015. While we understand that our report may be used by MPAC as an input to establish the current value of land as at January 1, 2016, the information required to calculate economic obsolescence at that future date has not yet been revealed. Our report and conclusions can be updated when such information becomes available. Economic events and/or changes in the relative competitiveness of the subject industry between January 1, 2015 and January 1, 2016, may lead to a concluded rate of economic obsolescence different to that cited in this report. If you have any questions or if there is anything else we can do for you, please contact either of us at 416-593-3409 or 416-593-3408. Sincerely, James A. Skinner MBA, CA, CBV Michael A. Smith, MBA, CFA, CBV Vice President and Senior Managing Director Director

ONTARIO ENGINEERED WOOD INDUSTRY Economic Obsolescence Analysis As of January 1, 2015 Prepared for
Municipal Property Assessment Corporation

Table of Contents
Leading / Thinking / Performing i
Table of Contents EXECUTIVE SUMMARY ............................................................................................................................... 1
INTRODUCTION ......................................................................................................................................... 2
Purpose and Scope of Work ............................................................................................................ 2 Economic Obsolescence.................................................................................................................. 3
ECONOMIC CONDITIONS ............................................................................................................................ 4
Canada ............................................................................................................................................. 4 United States .................................................................................................................................... 8
THE ONTARIO ENGINEERED WOOD INDUSTRY .......................................................................................... 13
Forest Products in Ontario ............................................................................................................. 13 Engineered Wood Industry Overview ............................................................................................ 13 Existence of Economic Obsolescence ........................................................................................... 17
QUANTIFICATION OF ECONOMIC OBSOLESCENCE ..................................................................................... 19
Utilization Analysis ......................................................................................................................... 19 Gross Margin Analysis ................................................................................................................... 20 Return-on-Capital Analysis ............................................................................................................ 22 Price-to-Book Ratio Analysis ......................................................................................................... 22 Variable Cost Analysis ................................................................................................................... 24 Correlation and Conclusion for the Ontario Engineered Wood Industry ........................................ 27
CONCLUSIONS ........................................................................................................................................ 29
Exhibits A Economic Obsolescence Summary
B Utilization Analysis
C Gross Margin Analysis
D Return-on-Capital Analysis
E Price-to-Book Ratio Analysis
F Assumptions and Limiting Conditions

Executive Summary
Leading / Thinking / Performing 1
June 1, 2015 Municipal Property Assessment Corporation 1340 Pickering Parkway, Suite 101 Pickering, ON L1V OC4
EXECUTIVE SUMMARY American Appraisal Canada, Inc. (“American Appraisal”) was retained by the Municipal Property Assessment Corporation (“MPAC”) to complete an economic obsolescence analysis pertaining to the Ontario engineered wood industry (the “Industry”) as of January 1, 2015 (the “Effective Date”). We submit our findings in this narrative report. The purpose of this study was to determine if economic obsolescence was applicable to the real property of firms operating in the Industry and to express our estimates of the quantum of any such obsolescence. It is entirely inappropriate to use this report for any purpose other than the one stated. Only the signed client of record, MPAC, is the intended user of, and may rely on, American Appraisal’s report. No third party shall have the right of reliance on this report, and neither receipt nor possession of the report by any third party shall create any express or implied third-party beneficiary rights. Based on the information and analysis summarized in this report, it is our view that economic obsolescence in the Ontario engineered wood industry at January 1, 2015 was reasonably estimated as follows.
Industry Segment
Economic Obsolescence at Jan. 1, 2015
Ontario OSB 6.0%
Ontario Plywood 8.0%
Ontario MDF 7.0%
Ontario Particleboard 5.0%

Introduction
Leading / Thinking / Performing 2
INTRODUCTION
Purpose and Scope of Work MPAC is responsible for classifying and valuing all real property within the Province of Ontario in compliance with the Assessment Act and regulations established by the Government of Ontario. As required by the Province’s legislation, assessed value is based on Current Value. The Assessment Act defines Current Value in the following manner:
“in relation to land, the amount of money the fee simple, if unencumbered, would realize if sold at arm’s length by a willing seller to a willing buyer; (“valeur actuelle”)”
This means the price a property might reasonably be expected to sell for, in its current condition, on the open market. In order to achieve MPAC’s desired goal of equitability, the process of Current Value assessment parallels the intent of market value; its objective is to quantify the way in which location, physical characteristics and demand impact the value of a given real property. This is readily achievable when transaction data is available to compare a subject property to similar properties in the same market area. The more unique a property is, however, the more difficult it becomes to achieve and to be seen to achieve the objective of equitability amongst the Province’s taxpayers. Current Value assessment of special purpose manufacturing plants, including those operating in the Industry, is particularly challenging because of their inevitable uniqueness. We understand that MPAC relies upon the cost approach to assess special purpose manufacturing facilities, applied in the following manner:
i. land value is based on highest and best use as though vacant; ii. cost new of improvements is derived using MPAC’s Automated Cost System; iii. physical depreciation is based upon specific MPAC guidelines; and iv. functional obsolescence is estimated using MPAC guidelines.
MPAC has advised American Appraisal that it is contemplating refinement of this determination of value through the inclusion of a deduction for economic obsolescence (“EO”). Accordingly, our analysis resulted in estimates of the EO that may be broadly present within the Ontario engineered wood industry. Our estimates of EO may not be applicable to specific facilities, and may or may not apply to individual tax payers. The primary sources of information used in our investigation included the following:
Statistics Canada;
Industry Canada;

Introduction
Leading / Thinking / Performing 3
RISI, Inc.;
North American Wood Fibre Review;
Ontario Ministry of Natural Resources and Forestry;
Board of Governors of the Federal Reserve System;
Standard & Poor’s Industry Surveys;
Standard & Poor’s Capital IQ database;
RBC Capital Markets;
Canada Mortgage and Housing Corporation;
National Association of Home Builders;
United States Census Bureau;
regulatory filings of publicly traded industry participants ; and
other information as described in the relevant sections of this report.
We understand that MPAC expected, and accordingly we confirm that this analysis was performed, using data and information that was publicly available and that our analysis has been performed without the benefit of inspecting any real property locations in the subject industry.
Economic Obsolescence Economic obsolescence, also referred to as external obsolescence, is defined as:
“a form of depreciation or loss in value of usefulness of a property caused by factors external to the property. These may include such things as the economics of the industry; availability of financing; loss of material and/or labor sources; passage of new legislation; changes in ordinances; increased cost of raw materials, labor or utilities (without an offsetting increase in product price); reduced demand for the product; increased competition; inflation or high interest rates; or similar factors.”1
The economic principles of supply, demand, and competition drive the loss in value associated with EO. Typically, EO cannot be reduced by capital investments, but it can change and even decline to zero through changing economic conditions.
1 Valuing Machinery and Equipment: The Fundamentals of Appraising Machinery and Technical Assets, Second Edition, American Society of Appraisers, 2005.

Economic Conditions
Leading / Thinking / Performing 4
ECONOMIC CONDITIONS A sound analysis of economic obsolescence must consider current and prospective economic conditions, in both the national economies in which the subject industry operates, and in the Industry itself. The major variables reviewed in order to evaluate the overall state of a national economy include, among others, the current level of and changes in the real gross domestic product (“GDP”), interest rates, unemployment rates and inflation. Given the impact of both the Canadian and U.S. economies on the Industry analyzed, an overview of those economies for the last several years, as well as a consideration of forecast data follows.
Canada
Gross Domestic Product
GDP measures the value of all final goods and services produced in a given economy. Two measures of GDP are currently quoted, nominal and real GDP. Due to inflationary pressures, nominal GDP will tend to increase over time, thus preventing analysts from obtaining an accurate picture of the overall economy. As a result, a more accurate measure of economic growth is obtained using real GDP. Real GDP removes the effects of inflation from nominal GDP, thereby increasing comparability and consistency. The following excerpts are from the Bank of Canada’s January 2015 Monetary Policy Report.
Oil prices have plummeted over the past six months. Lower oil prices are expected to boost global economic growth while widening the divergences among economies. These developments are taking place against the backdrop of a modest pickup in global growth. Within this mixed global picture, the main area of strength is the United States, Canada’s largest trading partner. Economic growth in the United States is expected to become increasingly self-sustaining, further propelled by the large positive impact from oil-price declines, despite the drag from the appreciation of the U.S. dollar. In other advanced economies, particularly the euro area and Japan, growth is expected to remain weak despite additional policy stimulus, as the headwinds from deleveraging and uncertainty dissipate gradually. Those headwinds are also expected to temper the positive effects of lower oil prices on advanced economies. In the rest of the world, GDP growth is expected to be held back by the negative effects of lower oil prices on oil-exporting countries; however, growth should strengthen gradually through 2016 as foreign demand in advanced economies picks up and growth-enhancing structural reforms are implemented. Taking these various countervailing factors into account, the Bank of Canada (the “Bank”) anticipates a pickup in global economic growth to about 3.5% over the next two years. The oil price shock is occurring against a backdrop of solid and more broadly-based growth in Canada in recent quarters. Outside the energy sector, we are beginning to see the anticipated sequence of increased foreign demand, stronger exports, improved business confidence and

Economic Conditions
Leading / Thinking / Performing 5
investment, and employment growth. However, there is considerable uncertainty about the speed with which this sequence will evolve and how it will be affected by the drop in oil prices. Although there is considerable uncertainty around the outlook, the Bank is projecting real GDP growth will slow to about 1.5% and the output gap to widen in the first half of 2015. The negative impact of lower oil prices will gradually be mitigated by a stronger U.S. economy, a weaker Canadian dollar, and the Bank’s monetary policy response. The Bank expects Canada’s economy to gradually strengthen in the second half of this year, with real GDP growth averaging 2.1% in 2015 and 2.4% in 2016. The economy is expected to return to full capacity around the end of 2016, a little later than was expected in October.
Historical and forecast Canadian real GDP growth for 2006 to 2016 (projected) is shown below.
Year Annual Change
(%)
2006 2.8
2007 2.2
2008 0.7
2009 -2.8
2010 3.2
2011 2.5
2012 1.7
2013 2.0
2014* 2.4
2015* 2.1
2016* 2.4
*Estimated Sources: Bank of Canada & Statistics
Canada
Consumer Prices and Inflation Rates Compiled monthly by Statistics Canada, the Consumer Price Index (“CPI”) tracks retail price inflation (or deflation) for products sold to consumers. The rate of price inflation in the general economy directly influences pricing trends in the consumer goods market.
Both total CPI and core inflation have hovered near 2% in recent quarters, about 1 percentage point higher than a year earlier. The increase in core inflation over the past year is largely due to some sector-specific factors and the temporary effects of a lower Canadian dollar. Even without these factors, there has been a small upward drift in underlying inflation, consistent with the recent trend shown by alternative measures of core inflation.

Economic Conditions
Leading / Thinking / Performing 6
Core inflation is expected to ease through the middle of 2015 as the temporary boost to inflation from sector-specific factors falls out of the inflation data. Thereafter, core inflation is expected to remain fairly steady, at close to 2 per cent, as the downward pressure arising from excess supply and retail competition gradually dissipates and the upward pressure from the pass through of the depreciation of the dollar fades. Based on the assumption of oil prices at USD 60, total CPI inflation is projected to fall sharply and to be below the inflation-control range during 2015. Given the magnitude of the shock to oil prices, there is an exceptional amount of uncertainty about the profile for total CPI. For example, if the base-case scenario were to assume that oil prices were 10% higher (lower), total CPI inflation would be higher (lower) by 0.3 percentage points over the coming year. As the economy reaches and remains at full capacity by around the end of 2016, both core and total CPI are projected to be about 2% on a sustained basis.
Historical and forecast Canadian CPI growth rates for 2006 to 2016 (projected) are shown below.
Year CPI (%)
2006 2.0
2007 2.2
2008 2.3
2009 0.3
2010 1.8
2011 2.9
2012 1.5
2013 1.2
2014* 2.0
2015* 1.1
2016* 2.1
*Estimated Sources: Statistics Canada and
Consensus Economic Forecasts
Credit Conditions and Interest Rates According to the Bank’s Financial System Review – December 2014:
The unexpectedly slow global recovery has meant that monetary conditions in advanced economies, including Canada, have been very stimulative for much longer than envisioned in the aftermath of the financial crisis. Interest rate expectations and yields on long-term government bonds in advanced economies have continued to fall since June, reaching near-

Economic Conditions
Leading / Thinking / Performing 7
historical lows in Japan and the euro area, as the Bank of Japan and the European Central Bank continue to inject exceptional liquidity. Market rates suggest that the first rise in U.S. policy rates has been pushed back to the second half of 2015, in part reflecting concerns about spillovers to the United States from weakened growth prospects elsewhere in the world. Yields on Canadian long-term government bonds have followed their foreign counterparts: 10-year yields have declined by about 35 basis points since the June FSR and are now only about 35 basis points off their all-time lows. In addition, yields on provincial government bonds have also declined to near-historical lows. Corporate bond yields remain historically low, as fairly heavy issuance has been met by very strong investor demand. Overall business lending conditions have also continued to ease, owing to strong competition among financial institutions and capital markets. Borrowing costs for Canadian households remain at very low levels. Interest rates on 5-year mortgages have declined further over the past year, owing to both lower funding costs—proxied by the Canadian-dollar 5-year swap rate—and a 30-basis-point reduction in implied spreads. The Bank of Canada announced on December 3, 2014 that it was maintaining its target for the overnight rate at 1%. The target for the overnight rate is the average interest rate that the Bank wants to see in the marketplace for one-day (or "overnight") loans between financial institutions. Changes in this rate influence other interest rates, such as those for consumer loans and mortgages. The Bank Rate was correspondingly 1.25% and the deposit rate 0.75%.
Unemployment According to Statistics Canada, the nation’s unemployment rate remained at 6.6% in December, as gains in full-time work were offset by losses in part-time. Employment gains in 2014 amounted to 186,000 jobs, with increases in the second half of the year accounting for most of the growth. Provincially, unemployment declined in Prince Edward Island and was little changed in the other provinces. There were fewer people working in accommodation and food services as well as ‘other services’ in December. At the same time, employment increased in agriculture, public administration and natural resources. The number of self-employed people, as well as private and public sector employees was virtually unchanged in December. Historical and forecast Canadian unemployment rates were:

Economic Conditions
Leading / Thinking / Performing 8
Year Unemployment
Rate (%)
2006 6.3
2007 6.1
2008 6.2
2009 8.3
2010 8.0
2011 7.4
2012 7.3
2013 7.1
2014 6.9
2015* 6.4
2016* 6.3
*Estimated Source: Statistics Canada and RBC
Economics Research forecasts
United States
In this analysis, we examine the general economic climate that existed in the U.S. at the end of the fourth quarter of 2014. This summary provides an overview of some selected economic factors that prevailed at that time as well as a discussion of the factors that are crucial over an extended time period.
Gross Domestic Product
The Bureau of Economic Analysis reported that the nation's economy—as indicated by GDP—grew at an annual rate of 2.6% in the fourth quarter of 2014. This was below forecasts, as a survey conducted by Bloomberg found that the median forecast of economists was a 3.0% rate. This was also a deceleration from the third quarter, when GDP grew at a 5.0% rate—the fastest quarterly pace in 11 years. GDP is the total market value of goods and services produced in the U.S. economy and is generally considered the most comprehensive measure of economic growth. For all of 2014, the economy grew 2.4% from the year before, the biggest advance since 2010, following a 2.2% expansion in 2013. Consumer spending, private inventory investment, exports, business investment, state and local government spending, and residential fixed investment all made positive contributions to the fourth-quarter GDP rate. Federal government spending made a negative contribution to GDP, while imports, which are a subtraction in the calculation of GDP, increased.
Consumer Prices and Inflation Rates According to the Bureau of Economic Analysis, the price index for gross domestic purchases decreased 0.3% in the fourth quarter of 2014, compared with an increase of 1.4% in the previous quarter. The price index for gross domestic purchases measures prices paid by U.S.

Economic Conditions
Leading / Thinking / Performing 9
residents. Excluding food and energy prices, the price index for gross domestic purchases rose 0.7% in the fourth quarter, compared with an increase of 1.6% in the previous quarter. The U.S. Department of Labor reported that the Consumer Price Index fell 0.4% in December, on a seasonally adjusted basis, its largest decline since December 2008. Over the last 12 months, CPI has risen 0.8%. CPI is a measure of a basket of products and services—including housing, electricity, food, and transportation—and is used as a measure of inflation. CPI is comprised of three main indexes: the food index, the energy index, and the all items less food and energy index (also known as “Core CPI”). Core CPI, a measure of inflation that excludes volatile food and energy costs, was unchanged in December but up 1.6% over the past 12 months. The indexes for shelter, medical care, tobacco, and personal care all rose. Offsetting these increases were declines in the indexes for apparel, airline fares, used cars and trucks, alcoholic beverages, and household furnishings and operations. The U.S. Department of Labor reported that the Producer Price Index (“PPI”) fell 0.3% in December, on a seasonally adjusted basis. December was PPI’s steepest decline since October 2011. Over the last 12 months, PPI has risen 1.1%. PPI is a gauge of inflation in the manufacturing process that can be a precursor to inflation in consumer prices. PPI for final demand is comprised of two main indexes: final demand services and final demand goods. In December, the 0.3% decline in PPI was the result of a decrease in the index for final demand goods, which fell 1.2%. In contrast, prices for final demand services moved up 0.2%.
Interest Rates The Federal Open Market Committee (“FOMC”) met twice during the fourth quarter of 2014, issuing a statement from each meeting. At both meetings, the FOMC reaffirmed its desire to keep its target for the federal funds rate near zero. The FOMC’s goal with these decisions is to support its continued progress toward maximum employment and price stability. The FOMC noted that it will remain patient in deciding on whether to raise interest rates but will assess all available information in making that determination going forward. The federal funds rate is the interest rate at which a commercial bank lends immediately available funds in balances at the Federal Reserve to another commercial bank. The FOMC establishes a target rate and expands or contracts the money supply with the aim that the federal funds rate, a market rate, will approximate the target rate. The FOMC found that economic activity was expanding at a moderate pace. It found that labor market conditions had improved, as job gains remained solid and the unemployment rate declined. Additionally, a range of labor market indicators suggested that underutilization of labor resources continued to diminish. The FOMC stated that the housing market recovery remained slow, but household spending and business spending rose. Inflation remained below the FOMC’s longer-run objective, due in part to declining energy prices. The FOMC also determined that the time had come to end its asset purchase program since there had been a substantial improvement in the outlook for the labor market since the inception of the

Economic Conditions
Leading / Thinking / Performing 10
program. Further, the FOMC continued to see sufficient underlying strength in the broader economy. During the fourth quarter of 2014, the Board of Governors of the Federal Reserve left the discount rate unchanged, at 0.75%. The discount rate is the interest rate a commercial bank is charged to borrow funds, typically for a short period, directly from a Federal Reserve Bank. The board of directors of each Reserve Bank establishes the discount rate every 14 days, subject to the approval of the Board of Governors.
Construction According to the U.S. Census Bureau, privately owned housing starts in December were at a seasonally adjusted annual rate of 1,089,000, a 4.4% increase from the previous month and 5.3% above their level from one year ago. The construction of single-family homes rose 7.2% in December and was up 7.9% from one year ago. The construction of multifamily homes fell 4.2% in December but remained up 0.3% from one year ago. The multifamily home sector, which consists of buildings with five units or more, tends to be more volatile than the single-family home sector. Building permit authorizations for privately owned housing units, considered a good leading indicator of demand for new homes, were at a seasonally adjusted rate of 1,032,000 in December. This was 1.9% below the rate in the prior month but 1.0% above the rate from one year ago. Building permits for single-family housing units increased 4.5% in December and were up 8.1% from one year ago. Building permits for multifamily housing units dropped 12.4% in December and were down 9.9% from one year ago. The U.S. Census Bureau reported that overall spending on construction was at a seasonally adjusted annual rate of $982.1 billion in December. This figure was 0.4% above the November rate of $978.6 billion and 2.2% above the $961.2 billion rate from one year ago. Overall construction spending amounted to $961.4 billion in 2014, 5.6% above the $910.8 billion spent during 2013. The National Association of Realtors (“NAR”) reported that existing-home sales regained momentum in December, despite low inventory conditions. Existing-home sales in December climbed above an annual pace of 5.0 million sales for the sixth time in seven months. Median home prices for 2014 rose to their highest level since 2007, but total sales in 2014 were down 3.1% from 2013. Existing-home sales are completed transactions that include single-family houses, townhomes, condominiums, and co-ops. Existing-home sales rose 2.4% in December to a seasonally adjusted annual rate of 5.04 million, below the prior month’s rate of 5.25 million. Home sales remain 3.5% above their levels from one year ago and are now above year-over-year levels for the third straight month. NAR’s Realtors Confidence Index (“RCI”) December report found a broad uptick in confidence and market activity for current conditions when compared with November. The RCI for single-family homes advanced 2.0 points to 51.0, while the RCI for townhouses moved up 2.0 points to 37.0, and the index for condos held steady at 33.0 (strong = 100; moderate = 50; weak =

Economic Conditions
Leading / Thinking / Performing 11
0). The RCI is a key indicator of housing market strength based on a monthly survey of over 50,000 real estate practitioners.
National Association of Realtors Market Forecast
Unemployment The U.S. Department of Labor reported that job creation continued in December, with 252,000 new jobs being created. This came after 261,000 and 353,000 new jobs were created in October and November, respectively. Employment gains have now exceeded 200,000 jobs a month for 11 straight months, the longest stretch since the 19 months that ended in March 1995. Job growth averaged 246,000 per month in 2014, compared with an average monthly gain of 194,000 in 2013. Total employment rose by 2.95 million in 2014, the most in any calendar year since 1999. The unemployment rate (also known as the U3 unemployment rate) fell 0.2 percentage point to a six-and-a-half-year low of 5.6% in December. The annual average unemployment rate fell 1.2 percentage points between 2013 and 2014, the largest decline since 1984. The number of unemployed persons declined by 383,000 in December to 8.7 million. In 2014, the number of unemployed persons declined by approximately 1.7 million. The U3 unemployment rate is
Q1 2015 Q2 2015 2015 2016
Housing measures (thousands)
Housing starts 1,110 1,200 1,225 1,400
Single-family 730 790 820 970
Multifamily 380 410 405 430
Home sales
Total existing homes 5,180 5,250 5,300 5,430
New homes 500 560 596 720
Home prices (median)
Existing homes $199.8 $220.7 $217.0 $225.3
New homes $283.3 $292.0 $289.5 $293.7
Mortgage Rates
30-year fixed rate 4.2% 4.5% 4.8% 5.8%
1-year adjustable 2.4% 2.7% 2.9% 4.1%
Source of data: National Association of Realtors®.
Notes:Figures are in thousands, except for rates. Quarterly housing starts and home sales are seasonally adjusted at annual rate.Total existing home sales include single-family homes, condos, and co-ops.
National Association of Realtors® Forecast

Economic Conditions
Leading / Thinking / Performing 12
the official unemployment rate per the International Labour Organization definition and occurs when people who have actively looked for work within the past four weeks are still without jobs. The labor-force participation rate edged down 0.2 percentage point in December to 62.7%. The labor-force participation rate has remained within a narrow range of 62.7% to 62.9% since April. The employment-population ratio—the share of the working-age population with a job—was unchanged in December for the third consecutive month at 59.2%. However, the employment-population ratio rose by 0.6 percentage point in 2014. The number of unemployed persons who have been out of work for 27 weeks or more was essentially unchanged in December at 2.8 million, or 31.7% of the total unemployed. Over the past 12 months, the number of long-term unemployed has declined by 1.1 million. The average unemployment duration decreased slightly in December to 32.8 weeks from 33.0 weeks in November.
Economic Outlook Consensus Economics Inc., publisher of Consensus Forecasts—USA, reports that the consensus of U.S. forecasters is that real GDP will increase at a seasonally adjusted annual rate of 2.8% in both the first and second quarters of 2015. Every month, Consensus Economics surveys a panel of 30 prominent U.S. economic and financial forecasters for their predictions on a range of variables, including future growth, inflation, current account and budget balances, and interest rates. The forecasters expect GDP to grow 3.0% in 2015, 3.0% in 2016, and 2.8% in 2017. They forecast personal consumption will increase at a rate of 3.0% in both the first and second quarters of 2015. They expect personal consumption to increase 2.8% in both 2015 and 2016. These forecasters believe unemployment will average 5.7% in the first quarter of 2015 and 5.6% in the second quarter. They believe unemployment will average 5.5% in 2015. They also believe consumer prices will rise at a rate of 0.9% in the first quarter of 2015 and 1.6% in the second quarter. They expect consumer prices to increase 1.3% in 2015 and 2.1% in 2016. They expect producer prices to increase at a rate of 0.7% in the first quarter of 2015 and 1.1% in the second quarter. The forecasters anticipate producer prices will rise 0.9% in 2015. The most recent release of The Livingston Survey (the Survey) predicts fairly steady output growth through the end of 2015. The Survey, conducted by the Federal Reserve Bank of Philadelphia, is the oldest continuous survey of economists' expectations. It summarizes the forecasts of economists from industry, government, banking, and academia. The participants project real GDP to grow at an annual rate of 2.9% in the first half of 2015 and 2.7% in the second half of 2015. They believe GDP will grow 2.5% annually over the next 10 years.

The Ontario Engineered Wood Industry
Leading / Thinking / Performing 13
The Survey forecasted the unemployment rate to be 5.6% in June 2015, before declining to 5.4% in December 2015. The forecasters in the Survey expect CPI inflation to be 1.4% in 2015 and 2.1% in 2016. The Survey expects CPI to average 2.3% over the next 10 years. The Survey expects PPI inflation to be 1.1% in 2015 and 1.5% in 2016.
THE ONTARIO ENGINEERED WOOD INDUSTRY
Forest Products in Ontario According to data provided by the Ontario Forest Industries Association, Ontario’s forests cover approximately 800,000 km2; comprising 17% of Canada’s forests. The province has four distinct forest regions; the boreal forest in the north and, at its uppermost reaches, the boreal-barrens, and further south the deciduous and Great Lakes/St. Lawrence forest regions. Of these, the boreal forest is by far the largest, covering 550,000 km2 (close to 50% of the province) and accounting for 76% of Ontario woodlands. Characterized by needle bearing coniferous trees such as spruce and jack pine, and leaf bearing deciduous trees such as poplar and birch, the boreal forest is the primary source of raw material for the forest products industry.
89% of Ontario’s forests are publicly owned (88% by the Province, 1% federally), with the 11% balance being privately held. Ontario’s forestry industry has long been a key component of the province’s economy, and according to most recently available data from Natural Resources Canada, generates annual revenues of approximately $10.58 billion, divided between forestry and logging (8.9% of total revenues), pulp and paper manufacturing (62.1%), and wood products manufacturing (28.9%). Industry participants range from local sawmills and small scale logging operators with a few employees, to integrated multi-national companies with thousands of employees.
Engineered Wood Industry Overview Engineered wood, also known as composite wood, includes a range of derivative products which are manufactured by binding or fixing the strands, particles, fibres or veneers of wood, together with

The Ontario Engineered Wood Industry
Leading / Thinking / Performing 14
adhesives to form composite materials. These products are engineered to precise design specifications and tested to meet national and/or international standards. Sawmill scraps and other wood waste can be used to make engineered wood composed of wood particles or fibres, but whole logs are used for veneers. According to the Ontario Ministry of Natural Resources and Forestry, the following composite mills are licensed, or require a license, in the current fiscal year from April 1, 2014 to March 31, 2015. Facility licenses are required in Ontario for all mills that consume forest resources and utilize 1,000 cubic metres of material, or more, in one year.
Owner Location Product(s) Status
Ainsworth GP Ltd. Barwick OSB Operating
Weyerhaeuser Company Ltd. Kenora LSL Operating
GP North Woods LP Englehart OSB Operating
Flakeboard Company Limited Sault Ste. Marie MDF, thermally-fused laminates
Operating
Levesque Plywood Limited Hearst, ON Veneer core plywood, ultraviolet finishing
Operating
Ontario-manufactured composite wood types are described below. Please note that the word “panel” is used in this section to generally describe a sheet of OSB, plywood, particle board or similar product, usually 4’ x 8’ in size. Oriented Strand Board (“OSB”) is a manufactured panel product made from cross-oriented
layers of thin, rectangular wooden strips bonded together with waterproof wax and synthetic resin adhesives under intense heat and pressure. OSB is produced in huge, continuous mats to form a solid panel product of consistent quality with no laps, gaps, or voids. Finished panels are available in large dimensions, minimizing the number of joints that can "leak" heat and admit airborne noise. OSB’s strength makes it well suited to load-bearing applications in construction. Common uses include subflooring, single-layer flooring, wall and roof sheathing, sheathing ceiling/deck, structural insulated panels, webs for wood I-joists, industrial containers, mezzanine decks and furniture. OSB effectively serves many of the same end uses as plywood, but is produced at a lower cost.
Plywood is a sheet material manufactured from thin layers or plies of wood veneer that are
glued together with adjacent layers having their wood grain rotated up to 90 degrees to one another. This alteration of the grain is called cross-graining and has several important benefits: it reduces the tendency of wood to split when nailed at the edges; reduces expansion and shrinkage, provides improved dimensional stability; and makes the strength of the panel consistent across all directions. There are usually an odd number of plies so that the sheet is balanced to reduce warping. Plywood panels have superior dimensional stability and an excellent strength-to-weight ratio and are highly resistant to impact, chemicals, and changes in environmental temperature and humidity. Both

The Ontario Engineered Wood Industry
Leading / Thinking / Performing 15
plywood are OSB are generally classified as “wood structural panels” in building codes. Plywood’s share of the new residential construction market has been declining relative to OSB, and its largest market is now industrial.
Medium Density Fibre Board (“MDF”) is a dry-formed panel manufactured from wood fibres
combined with a synthetic resin or other suitable binder and compressed in a hot press to a density of 31 to 50 pounds per cubic foot. It is denser and stronger than particle board and primarily used in the manufacture of furniture, kitchen cabinets, moldings, and in other interior design applications. MDF panels have smooth surfaces suitable for direct painting, printing or laminating. When cut, MDF produces a tight edge and smooth surface and can therefore be machined and worked like solid wood. The edges can be routed to various shapes and still be smooth enough for a clean paint finish. The small size of its fibres not only makes MDF easy to finish, but also allows it to be produced in moulded form as well as in straight-edged flat panels. However, MDF does not hold a screw or nail as well as solid wood, plywood or even particleboard.
Particleboard is a panel product made from small particles of wood mixed with a resin and
formed into a solid board under heat and pressure. Residues such a sawdust and planer shavings from sawmills are generally used. Particleboard is usually bonded with a non–water-resistant resin, making the product unsuitable for exterior and high-humidity environments. The most important characteristic of particleboard is a smooth surface that will permit the efficient attachment of a coating. A smooth surface can be achieved through either a “multi-layer” composition (usually three or five layers) in which finer particles are deposited in the surface layers and coarser particles make up the core, or a “graduated” composition in which there is a continuous transition from the finest surface particles to the coarsest core particles. Particleboard has a variety of industrial uses, including components for furniture, cabinets, toys and games, and as floor underlay in construction, mobile home decking, shelving, and door cores. Particleboard and MDF compete for the same markets, with particleboard generally being of lower cost and quality than MDF. Surface quality on both flat surfaces and edges is not as high as with MDF, and particleboard tends to swell to a greater extent when exposed to water.
In the structural panel market, OSB has been steadily gaining market share from plywood and now represents about 64% of North American structural panel consumption. The relative abundance of fast growing deciduous and under-utilized coniferous trees, combined with automated state-of-the-art manufacturing processes, has resulted in a significant cost advantage for OSB over plywood. Industry analysts expect that OSB’s lower cost and comparable performance characteristics relative to plywood will continue to drive the market shift from plywood to OSB. Demand for engineered woods in North America is driven primarily by domestic new residential construction, home renovation activity and furniture manufacturing. Overseas export markets provide an additional source of demand. Demand for Ontario-manufactured engineered wood is additionally

The Ontario Engineered Wood Industry
Leading / Thinking / Performing 16
impacted by the Canadian dollar (“CAD”) to U.S. dollar (“USD”) foreign exchange rate. In recent years, Ontario, and Canadian composite mills generally, have been negatively impacted by lower demand from the United States due to the collapse of the American housing market and its subsequent tepid recovery.
Chart 1
Source: Industry Canada & U.S. Bureau of the Census
According to Statistics Canada, nearly 98.6% of Ontario’s 2014 engineered wood exports were destined for the United States. With export revenues denominated in U.S. dollars, and labour and certain other input costs paid in Canadian dollars, the profitability of exporting Ontario mills has been eroded over the years by an appreciating domestic currency. From the following chart, we can see that the Canadian dollar has appreciated in value from approximately USD 0.64 in 2002 to a 2014 year-to-date average of USD 0.9103. The exchange rate has eased somewhat in recent years, down from its 2011 high (average annual rate) of USD 1.0114. At the Effective Date, the Canadian dollar exchange rate stood at USD 0.8620.

The Ontario Engineered Wood Industry
Leading / Thinking / Performing 17
Chart 2
Source: Board of Governors of the Federal Reserve System
The Ontario engineered wood industry is cyclical in nature and extremely competitive. As in most commodity based industries competition is based primarily on price, with product quality, customer support and the ability to meet customers’ required delivery dates being additional success factors. Barriers to entry vary by market segment. For example, the Competition Bureau estimates that building a new OSB mill costs approximately $300 million or more and takes over 3 years. A new entrant must obtain the required environmental approvals and negotiate long-term fibre supply agreements. Ontario producers compete in both their domestic and the U.S. market against numerous American mills. The engineered wood market is also subject to competition from substitute products, including solid wood, fiber/cement composites, plastics and steel. Both the plywood and OSB segments of the North American industry have fairly concentrated structures. Plywood is the most highly concentrated segment with Georgia-Pacific representing 58% of North American capacity and the top 5 producers accounting for more than 80% of capacity. OSB is also quite concentrated with the top 5 producers representing 77% of North American capacity. Government regulation is a significant factor in the Ontario forest products industry generally, since annual fibre allotments and forest sustainability laws are the purview of the Province.
Existence of Economic Obsolescence The existence of EO in an industry may be indicated by one or more of the following factors:
reduced demand for the industry’s products;
overcapacity in the industry;

The Ontario Engineered Wood Industry
Leading / Thinking / Performing 18
dislocation of raw material supplies;
increasing cost of raw materials, labour, utilities, or transportation, while the selling price of the product remains fixed or increases at a much lower rate;
government regulations that require capital expenditures to be made with little or no return on the new investment; and
environmental considerations that require capital expenditures to be made with little or no return on the new investment.
A reduced demand for Ontario’s engineered woods was previously noted (see Chart 1). Prices, however, have recovered steadily from their 2008-2009 trough, as shown in Charts 3 and 4.
Chart 3
Source: RBC Capital Markets & RISI
We note that OSB prices weakened significantly in 2014 (Charts 3 and 4) as improved market conditions prompted the restart of previously idled capacity, including Wood Resources adding back 190 mmsf per year at Omak, WA and Boise Cascade adding 220 mmsf per year at its Chapman, AL mill. Production from this extra capacity and a slower than hoped for recovery of the U.S. housing market made 2014 a sub-standard year for OSB manufacturers. However, RISI Inc. is forecasting a much better performance in 2015 and 2016 driven primarily by strong growth in U.S. residential construction, and RBC Capital markets expects OSB prices to appreciate over the next two years.

The Ontario Engineered Wood Industry
Leading / Thinking / Performing 19
Plywood pricing in 2014 held up much better than OSB given its relatively greater exposure to industrial end markets. Greater stability, however, may come at the price of a lesser impact from the expected strong growth in U.S. home building over the next two years. Particleboard prices, as represented by Eastern Canadian Industrial prices, have been generally flat in USD terms, while MDF has shown a steady annual price appreciation since 2009.
Chart 4
Source: Norbord Inc.
Evidence for the existence of EO in the Ontario engineered wood industry is mixed. On the one hand, the province’s exports to U.S. markets are still well below historical levels, and excess capacity is still an issue in the larger North American market, especially with OSB. But engineered panel prices have increased significantly from their recession lows, and several mills have either reopened or announced plans to reopen. On balance, the evidence supports the continued existence of some EO in the Industry.
QUANTIFICATION OF ECONOMIC OBSOLESCENCE
Utilization Analysis One method used to quantify EO is to review the subject asset’s utilization. If the asset is being utilized at less than 100% or whatever is the industry norm, then EO may exist because demand in the industry is substantially less than available supply. Mathematically, this is based on the relationship whereby EO equals actual utilized capacity (demand) divided by maximum capacity (supply) with the result
$‐
$50
$100
$150
$200
$250
$300
$350
$400
$450
$500
Q1 1999
Q3 1999
Q1 2000
Q3 2000
Q1 2001
Q3 2001
Q1 2002
Q3 2002
Q1 2003
Q3 2003
Q1 2004
Q3 2004
Q1 2005
Q3 2005
Q1 2006
Q3 2006
Q1 2007
Q3 2007
Q1 2008
Q3 2008
Q1 2009
Q3 2009
Q1 2010
Q3 2010
Q1 2011
Q3 2011
Q1 2012
Q3 2012
Q1 2013
Q3 2013
Q1 2014
Q3 2014
USD
per Msf 7/16"
Period
Historical North Central 7/16" Benchmark OSB Price
Price Average

Quantification of Economic Obsolescence
Leading / Thinking / Performing 20
taken to an exponent (scale factor), subtracted from 1. The scale factor is a relationship of cost to capacity, which reflects the concept that as capacity increases, the cost of construction increases at a different, typically slower, rate. Typically, when a specific scale factor is not known, a value of 0.68 is used for manufacturing facilities based on data published in engineering and construction texts.
EO = 1 – (Demand/Capacity) 0.68 We researched industry sources and were able to obtain Canadian and North American aggregate capacity utilization data for each of the market’s major segments i.e. OSB, plywood, MDF and particleboard to the end of 2014. We also investigated other data sources including capacity utilization data for North American composite wood mills contained in the current annual reports of publicly traded companies, and North American OSB operating rates quoted by RBC Capital Markets. We selected a range of Demand/Capacity ratios for use in our valuation, based on the reported 2014 ratios for Canada and North America for each industry segment. Canadian ratios were incorporated given the currency risk exposure of Canadian mills, with the North American ratio also incorporated to reflect the integrated nature of the Canadian and U.S. markets. Based on Utilization Analysis, as of the Effective Date, the EO present in the various segments of the Industry was estimated to be:
Segment Economic Obsolescence
OSB 11.1% to 13.1% Plywood 0.4% to 6.8% MDF 11.7% to 16.2% Particleboard 7.8% to 12.4%
Details of the calculations are given in Exhibits B-1 to B-4. Please note that the two following profit-based methodologies, gross margin and return-on-capital analysis, produce Industry level, rather than segment level EO estimates.
Gross Margin Analysis The study of company or industry returns by comparing gross profit margins over time can also provide a useful measure of EO. Simply put, gross margin is a company’s revenues less its cost of goods sold, where cost of goods sold is defined to include the direct costs attributable to the production of the goods sold by a company. This amount includes the cost of the materials used in creating a product, along with the direct labour costs used in its production, but excludes indirect expenses such as distribution and sales force costs. If gross margins have been declining or are currently lower than in the past, EO may be present even if capacity utilization is high. EO can be measured using the formula:

Quantification of Economic Obsolescence
Leading / Thinking / Performing 21
EO = Benchmark GM % – Current GM %
Benchmark GM % Our gross margin analysis is presented in Exhibit C. In the gross margin analysis, a review was made of the relationship of the gross margin percentages realized by a universe of selected guideline companies in the 12 months to December 31, 2014, versus their returns during a period of time when profitability in the engineered wood industry was considered to be normal. 2010 to 2013 represents the most recent period over which industry gross profit margins were considered to be normal. In selecting the guideline companies, we used the following sources: OneSource database
Standard and Poor’s Capital IQ database We searched the Onesource database for companies operating in Standard Industrial Classification (“SIC”) code 2493 – lumber, plywood, millwork and wood panels, and also searched using the keywords “OSB”, “MDF”, “plywood”, “particleboard” and “wood-based panels”. We then reviewed the identified companies for a significant exposure to the engineered wood industry since some were integrated forest products companies. Of the companies reviewed, 4 were selected as being most suitable for use in our analysis including: Ainsworth Lumber Co. Ltd. (ANS - TSX)
Boise Cascade Co. (BCC - NYSE)
Louisiana Pacific Corporation (LPX - NYSE)
Norbord Inc. (NBD - TSX)
EO for each of the guideline companies was calculated using the following formula:
EO = 2010 to 2013 Avg. GM % – Current GM % 2010 to 2013 Avg GM %
Industry EO, calculated using the median EO of the selected guideline companies, was estimated to be 41.7%. In this case, however, we do not believe that a gross margin analysis produces a reliable estimate of Industry EO for the following reasons. As mentioned previously, 2014 was a sub-standard year for OSB mills sandwiched between a banner year in 2013 and 2 forecast years of significant growth. 3 of our guideline companies are OSB focused. Since the EO calculation incorporates current

Quantification of Economic Obsolescence
Leading / Thinking / Performing 22
(i.e. abnormally low 2014) gross margins, this will tend to inflate the numerator and the resulting EO estimate.
Return-on-Capital Analysis An additional approach to quantifying EO is a return-on-capital analysis (“ROCA”). In such an analysis, the relationship of earnings is compared to the magnitude of investment used to generate those earnings. In the ROCA, a review was made of the relationship of the percent earned on total capital by each of our 4 selected guideline companies in the 12 months to December 31, 2014, versus their returns during a period of time when profitability in the engineered wood industry was considered to be normal. Again, we selected 2010 to 2013 for use in our analysis. Percent earned on total capital is defined as “a company’s return on its stockholders’ equity and long-term debt obligations.” The summation of long-term debt and stockholders’ equity represents the total invested capital of a business enterprise. When the economics of the industry are good, the return on capital will be high; when poor, low. Hence, a return on capital analysis can be a meaningful indicator of economic obsolescence. Recall that EO can be determined for each of the guideline companies using the following formula:
EO = 2010 to 2013 Avg. ROC % – Current ROC % 2010 to 2013 Avg. ROC %
Using the median of the guideline companies, EO based on a ROCA was estimated to be 36.2%. Please see Exhibit D for calculations. Unfortunately, as an earnings-based methodology, the ROCA suffers from the same problem of 2014 OSB underperformance as does the gross margin analysis. Consequently, the ROCA was not believed to produce an estimate of Industry EO that was reliably indicative.
Price-to-Book Ratio Analysis Another method for estimating the EO present in a given asset or industry, is to analyze investors’ perception of the investment in that industry using common stock prices. The ratio of price paid for common stock relative to its book value may be indicative of the investors’ perception of the obsolescence present in the investment. Book value of the stock relates to original capital contributed to the firm in exchange for the stock, plus retained earnings that have accumulated since the initial investment. From a legal perspective, stockholders own the firm in which they have invested. From an investor’s viewpoint, stock ownership is considered to represent a net ownership position in the firm’s assets.

Quantification of Economic Obsolescence
Leading / Thinking / Performing 23
At any point in time, if the total value of all assets is considered and a deduction is made for all liabilities, the net amount is representative of the value of the aggregate value of the common stock (as per the balance sheet identity Assets - Liabilities = Shareholder’s Equity). Thus, an investor purchasing shares of common stock is making a decision on the value of the total assets. Book value of common stocks of publically held companies is calculated with reasonable consistency for most publicly traded companies due to accounting regulations. The regulations involve not only the general methodology used in the calculations, but also regulate the type of data available to investors. Due to the consistency of reporting, the book values can be useful as a benchmark for certain types of measurements. The selection of our guideline companies has been previously described. For each of the guideline companies we obtained Effective Date; i) stock price data, ii) number of shares issued and outstanding, and iii) book value of equity from the Capital IQ database. From this information we were able to calculate Effective Date price-to-book (“PTB”) ratios for each of the guideline companies. For baseline comparison purposes, a PTB ratio was available from Bloomberg for the S&P/TSX Equal Weight Industrials Index. The results of our PTB analysis are shown in Exhibit E, with EO estimated using the formula:
EO = S&P TSX Equal Weight Industrials – Engineered Wood Industry S&P TSX Equal Weight Industrials
EO = (2.68 – 2.43) / 2.68 = 9.2% Economic obsolescence was calculated using the median PTB ratio of the guideline companies, in light of the significant variation in individual guideline company ratios. This relationship is indicative of investors’ relative valuation of engineered wood industry assets when compared with general industrial stocks. Owners of general industrial stocks appear willing to pay about 9% more for such stocks than they would pay for stock in the engineered wood industry, based on the PTB value ratio. PTB ratio analysis is useful primarily as a broad indication of the existence of EO in a given industry, rather than as a specific estimate of its quantum. We note that PTB ratios can be impacted by much more than investors’ perceptions of EO, including a company’s capital structure, the extent of analyst coverage, stock trading liquidity, dividend policy, the existence of stock repurchasing programs etc. Additionally, unavoidable differences exist in the size, growth, profitability and risk of the guideline companies versus Ontario engineered wood mills.

Quantification of Economic Obsolescence
Leading / Thinking / Performing 24
Variable Cost Analysis An analysis of the average variable production costs of Ontario engineered wood mills (or the best available proxy), versus the average variable costs of competing North American regions can also be used to estimate EO. Variable costs are generally defined for the purpose of this report as:
Total Variable Costs = Wood Cost + Labour (Direct Operations & Maintenance) + Energy + Adhesives + Wax
+ Supplies (Operations & Maintenance) + Miscellaneous
According to the U.S. Department of Agriculture (“USDA”), wood cost alone accounts for 50% to 70% of the total variable costs of plywood manufacture, versus 30% to 35% for OSB. Based on data provided by RISI, Inc., wood cost accounts for about 30% to 40% of the total variable cost of particleboard. American Appraisal obtained annual variable production costs from 1996 through 2014 for each of OSB, MDF and particleboard from RISI, Inc. Variable cost data was available for each of the following North American regions:
Mill Type Region OSB Ontario/Quebec combined, US North/Central,
US South, Western Canada MDF Canada overall, US West, US East Particleboard Eastern Canada, US West, US South
Please note that in the case of particleboard Eastern Canada is defined to include Ontario, Quebec and the Maritimes, though we understand that little raw particleboard comes from the single mill in New Brunswick. Since variable cost data for plywood was not available by region, and wood cost accounts for 50% to 70% of its total variable production costs, we used a comparison of average regional sawlog costs to estimate EO for this segment. Plywood production would typically use a slightly better quality and larger diameter roundwood than the average sawlog, but the comparison was believed to be valid. We note in Charts 5 through 7 (see below) that for OSB, MDF and particleboard, over the observation period, the average variable cost of Ontario and Quebec mills (combined), or the nearest available proxy, was below the average of the competing regions for which data was available. This would indicate 0.0% EO for each of these segments based on a variable cost analysis.

Quantification of Economic Obsolescence
Leading / Thinking / Performing 25
Chart 5
Source: RISI, Inc.
Chart 6
Source: RISI, Inc.

Quantification of Economic Obsolescence
Leading / Thinking / Performing 26
Chart 7
Source: RISI, Inc.
Additionally, we observed that over the 2010 to 2014 period, the cost of Eastern Canadian sawlogs has become more competitive relative to other North American jurisdictions. Whereas in Q1 2010 Eastern Canada was the highest cost region of the four sampled, Eastern Canadian sawlog costs had achieved parity with those in the U.S. South at the Effective Date, due in part to a significant weakening of the CAD versus the USD. Prices in the following chart are quoted in USD per cubic meter.
Chart 8
Source: North American Wood Fiber Review

Quantification of Economic Obsolescence
Leading / Thinking / Performing 27
For plywood, segment EO was estimated based on the average excess cost of Ontario and Quebec (combined) over North American sawlogs from 2010 to 2014: EO = (Ontario Average Sawlog Cost / North American Average Sawlog Cost) - 1 EO = 12.0% In other words, Ontario sawlog costs (used as a proxy for plywood fibre costs) have been, on average, 12.0% more expensive than the North American average over the observation period.
Correlation and Conclusion for the Ontario Engineered Wood Industry Application of the multiple analyses of EO as described above resulted in the following indicators for the Ontario engineered wood industry: Given the availability of segment-specific data, we estimated EO at the segment, rather than at the engineered wood industry level. EO estimates for each segment were based on consideration of the range indicated by utilization analysis, and the EO indicated by variable cost analysis.
Method OSB Plywood MDF Particleboard
Segment Level EO
Utilization Analysis 11.1% to 13.1% 0.4% to 6.8% 11.7% to 16.2% 7.8% to 12.4%
Variable Cost Analysis 0.0% 12.0% 0.0% 0.0%
Industry Level EO
Gross Margin Analysis 41.7%
Return-on-Capital 36.2%
Price-to-Book 9.2%
The income-based methodologies, namely gross margin analysis and ROCA, were not believed to produce reliable estimates of EO because 3 of our guideline companies had a significant exposure to OSB which underperformed in the 2014 measurement year. This underperformance was believed to be due to temporary factors. PTB ratio analysis was used more as a broad indicator of the existence of Industry EO, and to further widen our analysis

Conclusions
Leading / Thinking / Performing 28
CONCLUSIONS Based on the information and analysis summarized in this report, it is our view that economic obsolescence in the Ontario engineered wood industry at January 1, 2015 was reasonably estimated as follows:
Industry Segment
Economic Obsolescence at Jan. 1, 2015
Ontario OSB 6.0%
Ontario Plywood 8.0%
Ontario MDF 7.0%
Ontario Particleboard 5.0%
We reserve the right, but will be under no obligation, to review all calculations referred to in this report and, if considered necessary by us, to revise our estimates in the light of any new facts, trends or changing conditions existing at any date prior to or at the Effective Date, which become apparent to us subsequent to the date of this report. The engagement of, and compensation for, American Appraisal and its employees was not contingent on the development or reporting of predetermined values or a direction in value that favors the cause of the client; the amount of the value estimates; the attainment of stipulated results; nor the occurrence of a subsequent event directly related to the intended use of this appraisal. This report represents American Appraisal’s impartial and unbiased analysis, estimates, and conclusions limited only by the Terms and Conditions which were part of our Letter of Engagement, and the Assumptions and Limiting Conditions which are part of this report. Neither American Appraisal nor its employees who were assigned to this engagement (including their immediate family members) have any substantial interest, direct or indirect, in MPAC or in any party directly or indirectly controlling or, controlled by or, under direct or indirect common control with MPAC. We also confirm we are not connected with MPAC or any party directly or indirectly controlling or, controlled by or, under direct or indirect common control of MPAC as an officer, employee, promoter, underwriter, trustee, partner, director or persons performing similar functions.

Conclusions
Leading / Thinking / Performing 29
Respectfully submitted,
No third party shall have the right of reliance on this report, and neither receipt nor possession of this report by any third party shall create any express or implied third-party beneficiary rights. 718-104

Leading / Thinking / Performing (1 Page)
Exhibit A Economic Obsolescence Summary

Exhibit AEconomic Obsolescence Analysis of the Ontario Engineered Woods Industry
As of January 1, 2015
Method OSB Plywood MDF ParticleboardSegment Level EO Estimates
(1) Utilization Analysis 11.1% to 13.1% 0.4% to 6.8% 11.7% to 16.2% 7.8% to 12.4%(2) Variable Cost Analysis 0.0% 12.0% 0.0% 0.0%
EconomicMethod ObsolescenceIndustry Level EO Estimates
(3) Gross Margin Analysis 41.7%(4) Return-on-Capital Analysis 36.2%(5) Price-to-Book Ratio Analysis 9.2%
OSB Plywood MDF Particleboard
(6) Selected Economic Obsolescence Rates 6.0% 8.0% 7.0% 5.0%
Notes:(1) See Exhibits B-1 through B-4. Analysis incorporates actual capacity utilization data for Canada and North America.(2)
- MDF estimate is based on a variable cost comparison of Canada versus the average of US East and US West.
(3) See Exhibit C.(4) See Exhibit D.(5) See Exhibit E.(6)
Municipal Property Assessment Corporation
EO Summary
The income based methodologies, namely gross margin analysis and ROCA, were not believed to produce reliable estimates of EO because 3 of our guideline companies had a significant exposure to OSB which underperformed in the 2014 measurement year. PTB ratio analysis was used more as a broad indicator of the existence of Industry EO, and to further widen our analysis.
Economic Obsolescence
- OSB estimate is based on a variable cost comparison of Ontario/Quebec combined, versus the average of US North/Central, US South and Western Canada.- Plywood production would typically use a slightly better quality and larger diameter roundwood than the average sawlog. Therefore, in the absence of plywood variable cost data by region, sawlog prices have been used as a reasonable approximation for the cost of plywood logs.
- Particleboard estimate is based on a variable cost comparison of Eastern Canadian mills versus the average of US West and US South.
Given the availability of segment-specific data, we have estimated EO at the segment, rather than at the engineered wood industry level. EO estimates for each segment are based on consideration of the range indicated by utilization analysis, and the EO indicated by variable cost analysis.
American Appraisal Page 1

Leading / Thinking / Performing (4 Pages)
Exhibit B Utilization Analysis

Municipal Property Assessment Corporation Exhibit B-1Economic Obsolescence Analysis of the Ontario Engineered Woods IndustryUtilization Analysis - OSBAs of January 1, 2015
Total Capacity Total Production Total ProductionSource Mill Location/Name Products (MMsf-3/8") (MMsf) Total Capacity
(1) Ainsworth Lumber Co. Ltd. 100 Mile House, BC OSB 440 Barwick, ON OSB 510 Grand Prairie, AB OSB 730 High Level, AB OSB 860
2,540 1,746 68.7%
(1) Louisiana-Pacific Corporation Carthage, TX OSB 500 (North American OSB) Chambord, QC OSB 470
Dawson Creek, BC OSB 380 Fort St. John, BC OSB 820 Hanceville, AL OSB 410 Jasper, TX OSB 475 Maniwaki, QC OSB 650 Roxboro, NC OSB 500 Sagola, MI OSB 410 Swan Valley, MB OSB 520 Thomasville, AL OSB 750
5,885 4,294 73.0%
(1) Norbord Inc. Bemidji, Minnesota OSB 470(North American OSB) Codele, Georgia OSB 990
Guntown, Mississippi OSB 450Huguley, Alabama OSB 500Jefferson, Texas OSB 415Joanna, South Carolina OSB 650La Sarre, Quebec OSB 375Nacogdoches, Texas OSB 380Val-d'Or, Quebec OSB 340
4,570 3,511 76.8%
(1) Weyerhaeuser Company Arcadia, LA OSBEdison, AB OSBElkin, NC OSBGrayling, MI OSBHudson Bay, SK OSBSutton, WV OSB
3,035 2,749 90.6%
(2) 2014 North American Average Demand/Capacity Ratio 81.3%(2) 2014 United States Average Demand/Capacity Ratio 81.1%(2) 2014 Canadian Average Demand/Capacity Ratio 84.1%
Canada North America(3) Selected Demand/Capacity 84.1% 81.3%
EO = 1 - (Demand/Capacity) 0.68 11.1% to 13.1%
Notes:(1) Data as per most recently available public filings of the identified companies(2) Source is RISI, Inc.(3) Selected demand/capacity is presented in a range using 2014 average Canadian and North American ratios
American Appraisal Page 1

Municipal Property Assessment Corporation Exhibit B-2Economic Obsolescence Analysis of the Ontario Engineered Woods IndustryUtilization Analysis - PlywoodAs of January 1, 2015
Total Capacity Total Production Total ProductionSource Mill Location/Name Products (MMsf) (MMsf) Total Capacity
(1) Boise Cascade Elgin, OR PlywoodFlorien, LA PlywoodKettle Falls, WA PlywoodMedford, OR PlywoodOakdale, LA PlywoodChester, SC PlywoodMoncure, NC Plywood
2,380 1,973 82.9%
(1) Potlatch Corporation St. Maries, ID Plywood 150 159 106.0%
(1) West Fraser Timber Co. Ltd. (Alberta Plywood ) Edmonton, AB PlywoodWilliams Lake, BC PlywoodQuesnel, BC Plywood
830 771 92.9%
(1) Weyerhaeuser Company Emerson, AR Plywood 210Zwolle, LA Plywood 250
460 252 54.8%
(1) Plum Creek Timber Company, Inc. Columbia Falls, MT Plywood 110 85 Evergreen, MT Plywood 110 82
220 167 75.9%
(2) 2014 North American Average Demand/Capacity Ratio 90.2%(2) 2014 United States Average Demand/Capacity Ratio 88.3%(2) 2014 Canadian Average Demand/Capacity Ratio 99.5%
Canada North America(3) Selected Demand/Capacity 99.5% 90.2%
EO = 1 - (Demand/Capacity) 0.68 0.4% 6.8%
Notes:(1) Data as per most recently available public filings of the identified companies(2) Source is RISI, Inc.(3) Selected demand/capacity is presented in a range using 2014 average Canadian and North American ratios
American Appraisal Page 2

Municipal Property Assessment Corporation Exhibit B-3Economic Obsolescence Analysis of the Ontario Engineered Woods IndustryUtilization Analysis - MDF
Total Capacity Total Production Total ProductionSource Mill Location/Name Products (MMsf) (MMsf) Total Capacity
(1) West Fraser Timber Co. Ltd. Blue Ridge, AB (Ranger Board) MDFQuesnel, BC (Westpine MDF) MDF
300 206 68.7%
(1) Plum Creek Timber Company, Inc. Columbia falls, MT (Thick Line) MDF 145 98 Columbia falls, MT (Thin Line) MDF 120 113
265 211 79.6%
(2) 2014 North American Average Demand/Capacity Ratio 83.3%
(2) 2014 United States Average Demand/Capacity Ratio 85.4%
(2) 2014 Canadian Average Demand/Capacity Ratio 77.1%
North America Canada(3) Selected Demand/Capacity 83.3% 77.1%
EO = 1 - (Demand/Capacity) 0.68 11.7% 16.2%
Notes:(1) Data as per most recently available public filings of the identified companies.(2) Source is RISI, Inc.(3) Selected demand/capacity is presented in a range using 2014 average Canadian and North American ratios.
American Appraisal Page 3

Municipal Property Assessment Corporation Exhibit B-4Economic Obsolescence Analysis of the Ontario Engineered Woods IndustryUtilization Analysis - ParticleboardAs of January 1, 2015
Total DemandSource Total Capacity
(1) 2014 North American Average Demand/Capacity Ratio 88.8%
(1) 2014 United States Average Demand/Capacity Ratio 91.7%
(1) 2014 Canadian Average Demand/Capacity Ratio 82.4%
North America Canada(2) Selected Demand/Capacity 88.8% 82.4%
EO = 1 - (Demand/Capacity) 0.68 7.8% 12.4%
Notes:(1) Source is RISI, Inc.(2) Selected demand/capacity is presented in a range using 2014 average Canadian and North American ratios
American Appraisal Page 4

Leading / Thinking / Performing (1 Page)
Exhibit C Gross Margin Analysis

Municipal Property Assessment Corporation Exhibit CEconomic Obsolescence Analysis of the Ontario Engineered Woods IndustryGross Margin Analysis (1)As of January 1, 2015
Benchmark Avg.Current High 2010 - 2013 High % - Current % Benchmark % - Current %
Guideline Company GM % GM % GM % (2) High % Benchmark %
Ainsworth Lumber Co. Ltd. 9.5% 45.2% 24.0% 78.9% 60.3%Boise Cascade Co. 14.2% 14.2% 12.4% 0.0% 0.0%Louisiana-Pacific Corporation 9.1% 40.2% 15.5% 77.2% 40.8%Norbord Inc. 8.4% 23.1% 14.7% 63.6% 42.5%
Mean 10.3% 30.7% 16.6% 54.9% 35.9%Median 9.3% 31.6% 15.1% 70.4% 41.7%
(3) Economic Obsolescence 41.7%
Notes:(1)
(2) 2010 to 2013 represents the most recent period over which industry returns were considered to be normal.(3)
Source: Standard & Poor's Capital IQ database. Historical data for Boise Cascade is available to 2009, for all other guideline companies data is available to at least 2000.
Economic obsolescence was based on the observed median of the {(Benchmark% - Current%) ÷ Benchmark%} calculations for the guidelinecompanies. The {(High% - Current %) ÷ High%} calculation is shown only for illustration purposes as a maximum EO level using this methodology, since this quantum of EO was not supported by industry conditions at the Effective Date. Current period represents latest 12 months results to December 31, 2014.
American Appraisal Page 1

Leading / Thinking / Performing (1 Page)
Exhibit D Return-on-Capital Analysis

Municipal Property Assessment Corporation Exhibit DEconomic Obsolescence Analysis of the Ontario Engineered Woods IndustryReturn on Capital Analysis (1)As of January 1, 2015
Benchmark Avg.Current High 2010 - 2013 High % - Current % Benchmark % - Current %
Guideline Company ROC % ROC % ROC % (2) High % Benchmark %
Ainsworth Lumber Co. Ltd. -0.7% 23.5% 4.4% n.m. n.m.Boise Cascade Co. 11.6% 11.6% 5.8% 0.0% 0.0%Louisiana-Pacific Corporation -2.6% 20.3% 1.6% n.m. n.m.Norbord Inc. 2.1% 26.9% 7.7% 92.1% 72.3%
Mean 2.6% 20.6% 4.9% 46.0% 36.2%Median 0.7% 21.9% 5.1% 46.0% 36.2%
(3) Economic Obsolescence 36.2%
Notes:(1)
(2) 2010 to 2013 represents the most recent period over which industry returns were considered to be normal.(3)
Source: Standard & Poor's Capital IQ database. Historical data for Boise Cascade is available to 2009, for all other guideline companies data is available to at least 2000.
Economic obsolescence was based on the observed median of the {(Benchmark% - Current%) ÷ Benchmark%} calculations for the guidelinecompanies. The {(High% - Current %) ÷ High%} calculation is shown only for illustration purposes as a maximum EO level using this methodology, since this quantum of EO was not supported by industry conditions at the Effective Date. Current period represents latest 12 months results to December 31, 2014.
American Appraisal Page 1

Leading / Thinking / Performing (1 Page)
Exhibit E Price-to-Book Ratio Analysis
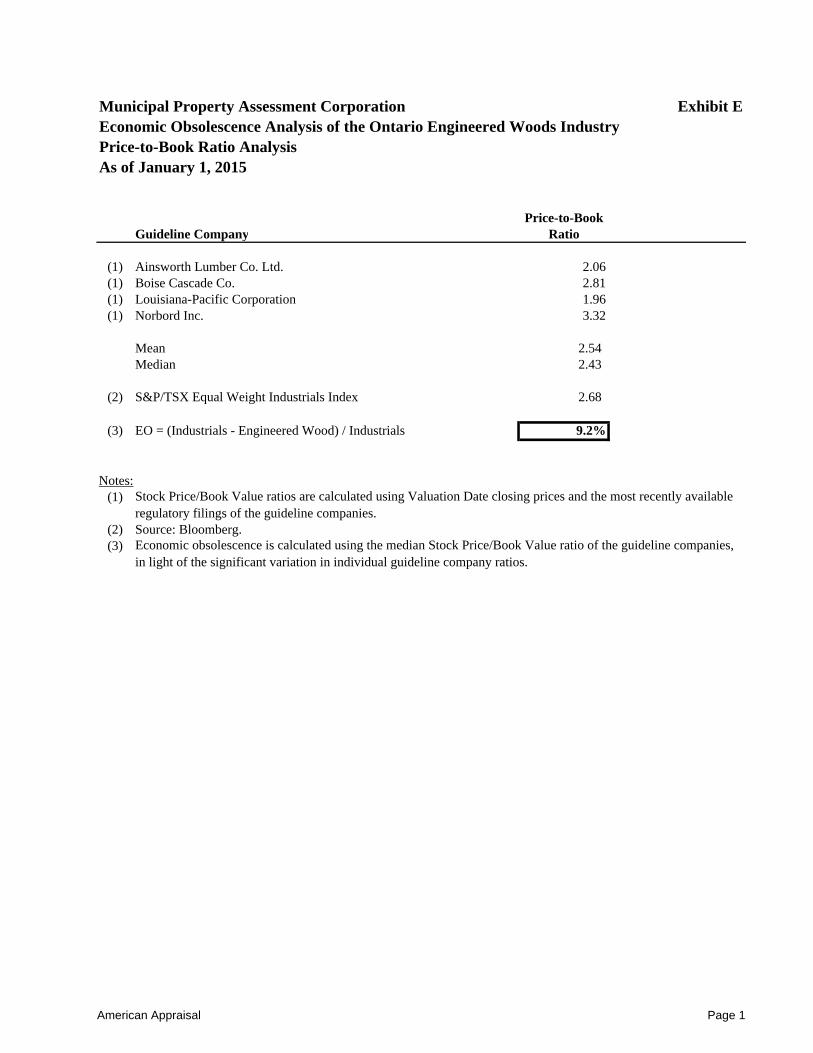
Municipal Property Assessment Corporation Exhibit EEconomic Obsolescence Analysis of the Ontario Engineered Woods IndustryPrice-to-Book Ratio AnalysisAs of January 1, 2015
Price-to-BookGuideline Company Ratio
(1) Ainsworth Lumber Co. Ltd. 2.06(1) Boise Cascade Co. 2.81(1) Louisiana-Pacific Corporation 1.96(1) Norbord Inc. 3.32
Mean 2.54 Median 2.43
(2) S&P/TSX Equal Weight Industrials Index 2.68
(3) EO = (Industrials - Engineered Wood) / Industrials 9.2%
Notes:(1)
(2) Source: Bloomberg.(3)
Stock Price/Book Value ratios are calculated using Valuation Date closing prices and the most recently available regulatory filings of the guideline companies.
Economic obsolescence is calculated using the median Stock Price/Book Value ratio of the guideline companies, in light of the significant variation in individual guideline company ratios.
American Appraisal Page 1

Leading / Thinking / Performing (2 Pages)
Exhibit F Assumptions and Limiting Conditions

Leading / Thinking / Performing 1
ASSUMPTIONS AND LIMITING CONDITIONS
This service was performed with the following general assumptions and limiting conditions. To the best of our knowledge, all data, including historical financial data, if any, relied upon in reaching opinions and conclusions or set forth in this report are true and accurate. Although gathered from sources that we believe are reliable, no guarantee is made nor liability assumed for the truth or accuracy of any data, opinions, or estimates furnished by others that have been used in this analysis. No responsibility is assumed for matters legal in nature. No investigation has been made of the title to or any liabilities against the property appraised. We have assumed that the owner’s claim is valid, the property rights are good and marketable, and there are no encumbrances that cannot be cleared through normal processes, unless otherwise stated in the report. The value or values presented in this report are based upon the premises outlined herein. The date of value to which the conclusions and opinions expressed apply is set forth in the report. The value opinion presented therein is based on the status of the economy and on the purchasing power of the currency stated in the report as of the date of value. This report has been made only for the use or uses stated, and it is neither intended nor valid for any other use. Possession of this report or any copy thereof does not carry with it the right of publication. No portion of this report (especially any conclusion, the identity of any individuals signing or associated with this report or the firms with which they are connected, or any reference to the professional associations or organizations with which they are affiliated or the designations awarded by those organizations) shall be disseminated to third parties through prospectus, advertising, public relations, news, or any other means of communication without the written consent and approval of American Appraisal. Areas, dimensions, and descriptions of property, if any, used in this analysis have not been verified, unless stated to the contrary in the report. Any areas, dimensions, and descriptions of property included in the report are provided for identification purposes only, and no one should use this information in a conveyance or other legal document. Plans, if any, presented in the report are intended only as aids in visualizing the property and its environment. Although the material was prepared using the best available data, it should not be considered as a survey or scaled for size. Unless stated to the contrary in the report, no environmental impact study has been ordered or made. Full compliance with all applicable laws and governmental regulations is assumed unless otherwise stated, defined, and considered in the report. We have also assumed responsible ownership and that all required licenses, consents, or other legislative or administrative authority from any applicable

Leading / Thinking / Performing 2
government or private entity organization either have been or can be obtained or renewed for any use that is relevant to this analysis. The value estimate contained within the report specifically excludes the impact of substances such as asbestos, urea-formaldehyde foam insulation, other chemicals, toxic wastes, or other potentially hazardous materials or of structural damage or environmental contamination resulting from earthquakes or other causes, unless stated to the contrary in the report. It is recommended that the reader of the report consult a qualified structural engineer and/or industrial hygienist for the evaluation of possible structural/environmental defects, the existence of which could have a material impact on value.