economic loss accounting in japan, tomoyuki okada mlit
TRANSCRIPT

Ministry of Land, Infrastructure, Transport and Tourism
Economic Loss Accounting in Japan
October 28, 2016
Tomoyuki OKADA
Director, River Planning Division,
Water and Disaster Management Bureau

1. Continuous improvement of disaster management system
2. Statistics and databases on disaster damages
3. Utilization of flood damage statistics
4. Criteria of cost-benefit analysis
• Direct and indirect damages
• Non-monetary evaluation
5. Conclusion
1
Outline
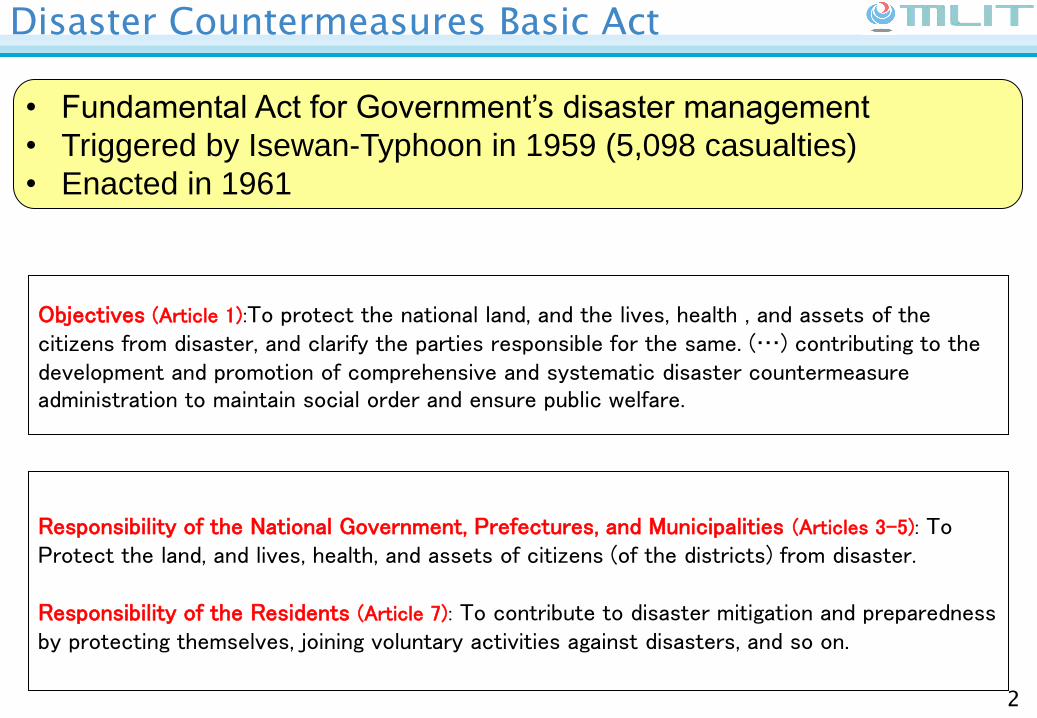
Responsibility of the National Government, Prefectures, and Municipalities (Articles 3-5): To Protect the land, and lives, health, and assets of citizens (of the districts) from disaster. Responsibility of the Residents (Article 7): To contribute to disaster mitigation and preparedness by protecting themselves, joining voluntary activities against disasters, and so on.
Objectives (Article 1):To protect the national land, and the lives, health , and assets of the citizens from disaster, and clarify the parties responsible for the same. (…) contributing to the development and promotion of comprehensive and systematic disaster countermeasure administration to maintain social order and ensure public welfare.
• Fundamental Act for Government’s disaster management
• Triggered by Isewan-Typhoon in 1959 (5,098 casualties)
• Enacted in 1961
2
Disaster Countermeasures Basic Act

Progress on Japanese Disaster Management
3

Progress on Japanese Disaster Management
4
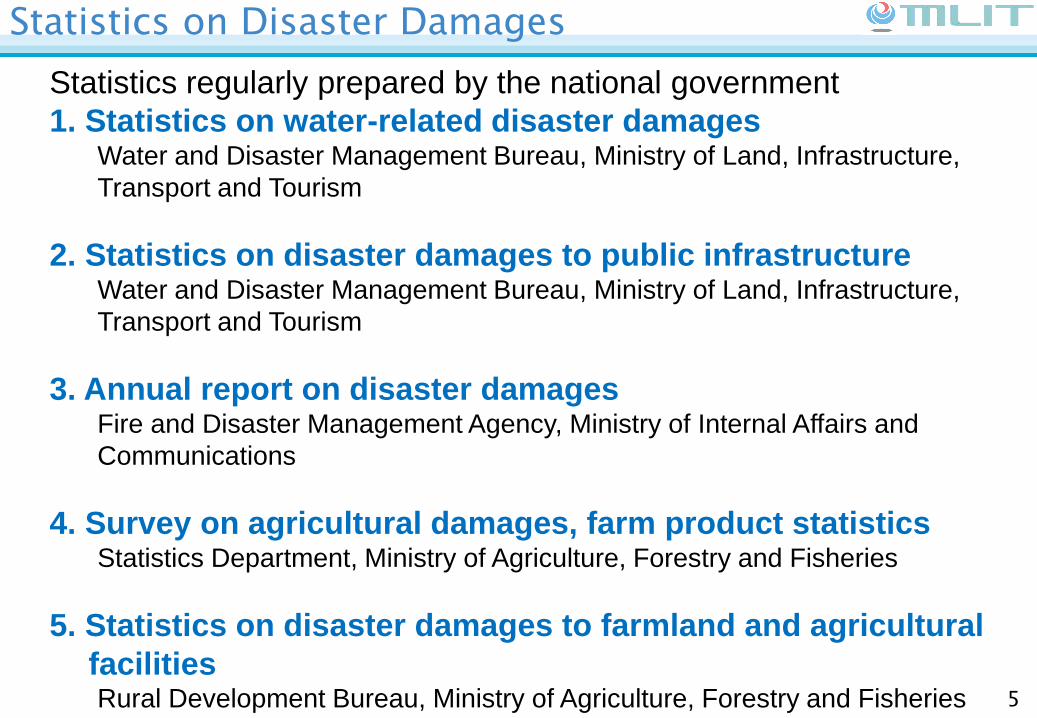
Statistics regularly prepared by the national government
1. Statistics on water-related disaster damages Water and Disaster Management Bureau, Ministry of Land, Infrastructure,
Transport and Tourism
2. Statistics on disaster damages to public infrastructure Water and Disaster Management Bureau, Ministry of Land, Infrastructure,
Transport and Tourism
3. Annual report on disaster damages Fire and Disaster Management Agency, Ministry of Internal Affairs and
Communications
4. Survey on agricultural damages, farm product statistics Statistics Department, Ministry of Agriculture, Forestry and Fisheries
5. Statistics on disaster damages to farmland and agricultural
facilities Rural Development Bureau, Ministry of Agriculture, Forestry and Fisheries
Statistics on Disaster Damages
5

Actual damage caused by water-related hazards such as floods, landslides, storm surges, tsunamis, etc. (since 1961)
Damage to General Properties Buildings, household commodities, machineries
for businesses, agricultural products
Damage to Assets for Public
Services Transportation, electric power, gas, water supply
Damage to public Infrastructures Costs for recovery works, etc
Statistics on Water-related Disaster Damages
6

Query and view the survey data
Aggregate, organize, and
screen the survey data
•A general statistics survey based on the article 19 of the Statistics Act (approved by
Minister for Internal Affairs and Communications)
•Carried out by MLIT’s Water and Disaster Management Bureau in collaboration with
prefectures and municipalities.
National Government
(MLIT) Prefectures
Occurrence of
water-related
disaster
General assets Public infrastructures Public Services
Municipalities Municipalities
Prefectures
Prefectures
Public Services
Offices
Submit -Aggregate the survey data
-Calculate the damage
-Compile and publish Flood
Damage Statistics
-Upload the data to the
DB server of Flood
Damage Statistics
Develop the guideline of flood
damage statistics survey
(coverage and procedure of the
survey, survey format, fill-in
guideline, etc.) Submit within 45 days of disaster
occurrence
Access to Flood Damage
Statistics DB National Government
(Regional Offices, etc.)
Submit
Submit
7
Data Collection Process

Nishi-Biwajima, Aichi in Shinkawa river 8
2000 Tokai Storm (September 11-13, 2000)
Total economic loss
771,492 million JPY
87%
1%
11% 1%
General assets
Agriculture
Public infrastructures
Public Services
Obu City and Kariya City, Aichi (September 12, 2000)
Estimation of Total Economic Loss

Inundation in Nishibiwajima Town
Effect of Preventive Measures
Simulated
Damage for
same heavy
rain after the
completion of
Preventive
Measures
Cost of
Preventive
Measures
after disaster
Actual
Damage
670
Billion
yen
71.6 billion yen
Effectiveness
of preventive
project:
550 billion
yen
120 Billion
yen
Effectiveness
7.7 (=550/71.6)
The case of Tokai Storm on September 11-13, 2000
9

0
5,000
10,000
15,000
20,000
25,000
30,000
1
10
100
1,000
10,000
19
46
19
51
19
56
19
61
19
66
19
71
19
76
19
81
19
86
19
91
19
96
20
01
20
06
Flood Management Cost (Nominal)
GDP (Nominal)
Number of Fatalities
Number of fatalities (people)
Flood manegement cost (Nominal) (hundred of million yen)
GDP(nominal) <billion yen>
<600,000>
<500,000>
<400,000>
<300,000>
<200,000>
<100,000>
<0>
*Number of fatalities exclude those who dead by tsunami *GDP : 1980-2009(2000 price), 1946-1979(1990 price)
←
Typ
ho
on
Kat
hle
en
←
Typ
ho
on
Ion
←Ty
ph
oo
n K
itty
←
Typ
ho
on
Jan
e
←Ty
ph
oo
n R
uth
←W
est-
Jap
an F
loo
d
←
Typ
ho
on
To
yam
aru
←Is
ahay
a Fl
oo
d
←Ty
ph
oo
n K
arin
oga
wa
←Ty
ph
oo
n Is
e-B
ay
←Se
con
d T
yph
oo
n M
uro
to
←To
kai F
loo
d
←
Typ
ho
on
No
.24
, No
.26
←W
est-
Jap
an W
ater
Dis
aste
r
←
Typ
ho
on
No
.6, N
o.7
, No
.9
←Ty
ph
oo
n N
o.1
7
←
Nag
asak
i Wat
er D
isas
ter
←W
este
rn-S
anin
Wat
er D
isas
ter
←Ty
ph
oo
n N
o.6
, Lan
dsl
ide
in N
agan
o
←
Wes
t-Ja
pan
Wat
er D
isas
ter
←
Typ
ho
on
No
.17
, No
.18
, No
.19
Pyr
ocl
asti
c fl
ow
of
Un
zen
-Fu
gen
-Dak
e ←
Au
gust
Flo
od
in K
yusy
u
←
Deb
ris
Flo
w in
Kag
osh
ima
Har
ihar
a ←
Fuku
shim
a To
chig
i Flo
od
, Ko
chi F
loo
d
←D
ebri
s Fl
ow
in H
iro
shim
a
Ku
mam
oto
Flo
od
Number of Fatalities by Floods , GDP and Budget for Flood Management (2000 price)
10
Effect of Flood Management Investment

0
20
40
60
80
100
120
140
0
10000
20000
30000
40000
50000
60000
70000
19
62
19
67
19
72
19
77
19
82
19
87
19
92
19
97
20
02
20
07
Damage to
General Assets
(10 billion yen)
Density of Damage
Cost
(thousand yen / ha)
Total Inundated Area (10,000ha)
Area of Inundated (Residential & Other Property) (10,000ha)
Density of Flood Damage to General Assets
Damage to General Assets (2000 Price)
20 10 0
Inundated area (10,000 ha)
Flood Damage Density (Economic Loss per Area)
Water-related Disasters Statistics in Japan 11
GDP and Budget for Flood Management (2000 price)

12
It is specified in Disaster Countermeasure Basic Act of Japan that
the government shall submit White Paper on Disaster
Management to the National Diet every year. It was first published
in 1963 and has been annually issued since then.
<Disaster Countermeasures Basic Act of Japan>
Article 9, section 2: In compliance with related
government ordinances, every fiscal year the
government must submit to the National Diet the report
on Disaster Management Plan as well as the overview
of countermeasures implemented for Disaster
Management.
White Paper on Disaster Management

Project Evaluation Criteria
[Evaluation Criteria] (River/Dam project)
(1) Necessity of the project
1. Changes in socio-economic situation
1)Impact of potential disasters
2)Historical disasters
3)Risk of disaster occurrence
4)Conditions of regional development
5)Regional cooperation schemes
2. Investment effectiveness
1) Cost-Benefit Analysis
2) Flood Damage Indices
3. Condition of project progress
1)Project adoption year, 2)Land acquisition and construction start year, 3)Condition of project progress
(2)Expected progress of the project 1) Future project schedule, etc
(3)Possibility of cost reduction and alternative options 1) Consideration of possibility of alternative options
2) Plans for cost reduction
6) Urgency of the project
7) Importance within the water system
(river project only)
8) Disaster information dissemination system
9) Consistency with relevant project
10) Possibility of alternative options
Re-
evaluation
New project
evaluation
←economic evaluation by Benefit Cost ratio (B/C)
←quantitative evaluation of flood impact difficult to
translate into monetary values.
The information considered for project evaluation includes not only cost-benefit
analysis but also necessity of the project, project schedule and expected progress,
and possibility of cost reduction or alternative options.
13

10. Increase in land prices as a result of improvement in flood protection
Direct damage
Indirect damage
Intensification benefit
3. Business interruption ・ Business interruption damage (household , businesses, public and public interest services )
・ Emergency response costs (household, businesses, public and public interest service)
4. Impairment of social welfare facilities (hospitals, social welfare facilities, disaster management facilities)
5. Economic impact (disruption of traffic , lifeline, cascading economic impact of damages)
6. Other damage (underground space, cultural facilities, waste generated by flood)
7. Psychological damage
8. Risk premium (insecurities due to possibility of damage)
9. Damages that cause permanent changes to the local economic system (Because the region as a whole is
severely damaged by a large-scale flood the economic system cannot recover to its pre-disaster state.)
( : Damages not considered in Cost-Benefit Analysis (difficult to monetize) but are quantitatively assessed
( : Considered in Cost-Benefit Analysis)
1. Damage to asset ・General property damage (houses, residential properties depreciable assets and inventory assets of
businesses, depreciable assets of fishing and farming properties, etc.)
・ Agricultural product damage
・ Infrastructure damage
2. Human damage (human loss, people isolated etc.)
( : Damages not considered in Cost-Benefit Analysis (difficult to monetize) but are quantitatively assessed
( : Considered in Cost-Benefit Analysis)
14
Consideration of damages with difficulty in quantitative monetary
estimation in the Cost-Benefit Analysis
Cost-Benefit Analysis
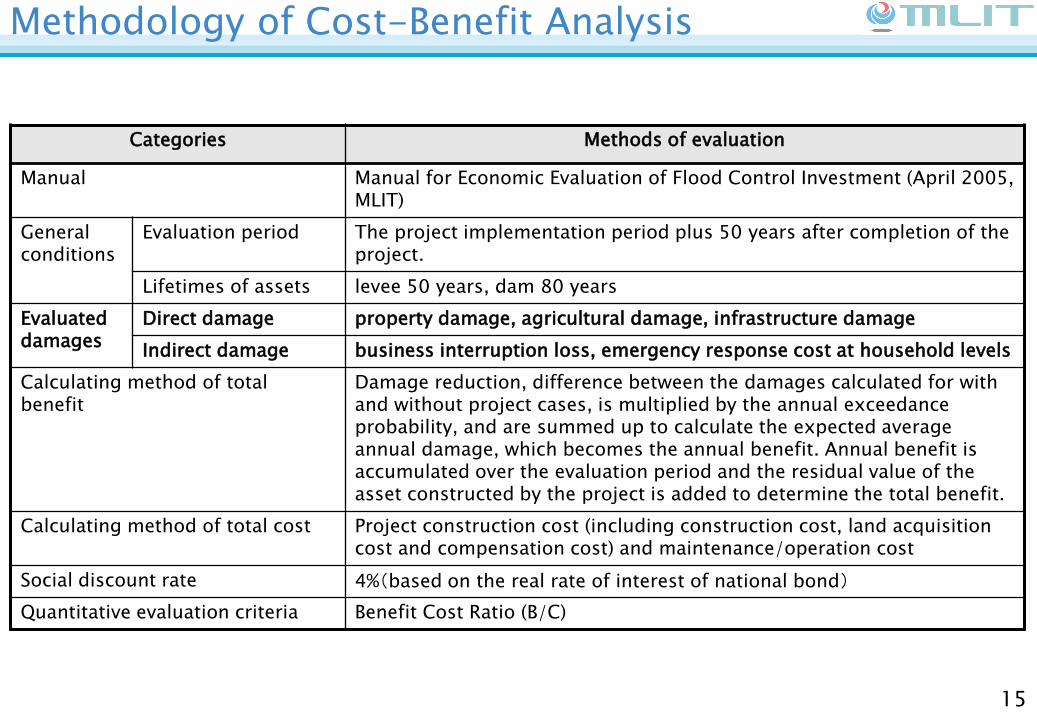
Categories Methods of evaluation
Manual Manual for Economic Evaluation of Flood Control Investment (April 2005, MLIT)
General conditions
Evaluation period The project implementation period plus 50 years after completion of the project.
Lifetimes of assets levee 50 years, dam 80 years
Evaluated damages
Direct damage property damage, agricultural damage, infrastructure damage
Indirect damage business interruption loss, emergency response cost at household levels
Calculating method of total benefit
Damage reduction, difference between the damages calculated for with and without project cases, is multiplied by the annual exceedance probability, and are summed up to calculate the expected average annual damage, which becomes the annual benefit. Annual benefit is accumulated over the evaluation period and the residual value of the asset constructed by the project is added to determine the total benefit.
Calculating method of total cost Project construction cost (including construction cost, land acquisition cost and compensation cost) and maintenance/operation cost
Social discount rate 4%(based on the real rate of interest of national bond)
Quantitative evaluation criteria Benefit Cost Ratio (B/C)
15
Methodology of Cost-Benefit Analysis

Inundation simulation is conducted for multiple flood sizes Inundation areas under pre- and post-project status are assessed
A) Inundation Simulation
River Improvement Plan
Compute expected damage for each flood size based on simulation results
[Amount of damage reduction for a given flood size] =[Expected damage under without-project state] -[Expected damage under with-project state]
[Reduction in expected annual damage]
=Σ([Amount of damage reduction for a given flood size]
x [probability of occurrence])
B) Computing reduction in annual average flood damages
Total benefit=Sum of [reduction in expected annual damage] of each year
Evaluation period: improvement period + 50 years Base year for discounting: the year the evaluation is conducted Discount rate: 4% Add residual value of the constructed asset at the end of the evaluation period
C) Computing total benefit
E) Computing B/C
[cost]=[annual project cost] + [maintenance and management cost]
[total cost]= sum of [annual project cost] of each year
Evaluation period: improvement period + 50 years Base year for discounting: evaluation year Discount rate:4%
D) Computing total cost
Flowchart of Cost-Benefit Analysis
Source: “Manual for Economic Evaluation of Flood Control Investments” (MLIT, 2005.6)
16

17
Benefit Categories for Flood Project Analysis

Items Methods of evaluation
Manual “Manual for Flood Damage Indices Analysis” (2013.6, MLIT)
General conditions
Flood magnitudes
In principle damage reduction is not converted into expected annual damage reduction, but instead the magnitude of damage reduction is assessed under a specific size of flood, such as a design flood (single or multiple floods).
Evaluated damages
Direct damage Human damage (inundated population, expected loss of life, maximum number of persons isolated, etc.)
Indirect damage Damage caused by impaired social functions (medical/welfare facilities, disaster management facilities) Cascading impact (traffic disruption, lifeline, economic damage) Others (underground space, cultural facilities, debris waste generated by flood)
Computation of overall non-monetized impact
For each of the damage categories damages are evaluated quantitatively whenever possible, e.g., affected population, etc
Evaluation of Damages with difficulty in quantitative monetary
estimation in the Cost-Benefit Analysis in Japan
18
Quantitative Damage Estimation

Non-monetary Evaluation
items Consideration contents Items Consideration contents
1: Human damage
1-1 population in inundation area
5: Lifeline
5-1 population affected by disruption of electric power supply
1-2 number of vulnerable people in inundation area requiring assistance under disaster conditions
5-2 population affected by disruption of gas supply
1-3 expected loss of life 5-3 population affected by disruption of water supply
1-4 maximum number of people isolated 5-4 population affected by disruption of sewerage system
1-5 number of people isolated for more than 3 days 5-5 population affected by communication service (fixed)
1-6 total number of people subject to evacuation per 10 years
5-6 population affected by communication service (cellular phone)
2: Medical/soci
al welfare facility
2-4 number of impaired social welfare facilities 6: Economic impact within and
outside the
region
6-1 economic losses using economic models such as input-output inter-industrial relations, etc
2-5 number of users of impaired social welfare facilities
6-2 impact on supply chain caused by damage to high market share companies
3: Base facility for disaster
management
3-1 number of impaired major disaster management facilities (police station, firehouse, public office etc.)
6-3 number of listed companies suffered by flood
3-2 population of jurisdictional area with impaired major disaster management facilities
6-4 number of employees suffered by flood
7: Under-ground space
7-1 routes and stations, etc. of subway suffered by flood
4: Losses caused by disruption of traffic
4-1 disruption of major road 7-2 number of users affected by flooding of subway services
4-2 amount of traffic affected by disruption of road 7-3 flooded underground shopping complex/facility
4-3 increase in travel time due to disruption of road 7-4 number of users affected by inundation of underground shopping complex/facility 4-4 disruption of main railway
8: Cultural facility
8-1 flooded cultural facilities, etc. 4-5 number of users affected by disruption of railway
9: Waste
9-1 amount of flood disaster waste generated 9-2 management cost of flood disaster waste
Reference: “Manual for Flood Damage Indices Analysis” (2013.6, MLIT)
Categories of damages considered for non-monetary evaluation (quantitative impacts are analyzed)
19

Indire
ct d
am
age
Categories Indices Damage per unit
(depends on inundation depth ranks) Remarks
Business interruption Number of employees
20,734~102,880 (yen/person)
Emergency response cost at
households
Clean-up works Number of
houses 10,749 (yen/day)
Cost increase due to alternative
activities
Number of houses
82.5~343.3 (thousand yen/household)
Emergency response costs of businesses
Number of offices
470~6,619 (thousand yen/office)
Dire
ct d
am
age
genera
l asset d
am
age
Categories Indices Unit price of asset Damage rate
(depend on depth) Remarks
Residential Houses Total floor
area 135.8~226.3
(thousand yen/m2) 0.032~0.888
Damage rate depends on land gradient and sedimentation
Residential properties (content) Number of households
14,683 (thousand yen/house)
0.21~0.991 Damage rate changes by occurrence of sedimentation
Offices depreciable assets
Number of employees
1,115~49,950 (thousand yen/person)
0.099~0.995 Asset values for industrial categories. Damage rate changes with sedimentation
inventory assets 57~63,414
(thousand yen/person) 0.056~0.982
Asset values for industrial categories. Damage rate changes with sedimentation
Damage to fishing and
farming properties
depreciable assets Number of properties
1,900 (thousand yen/house)
0.0~0.725 Damage rate changes by occurrence of sedimentation
inventory assets 536 (thousand
yen/house) 0.0~0.845
Damage rate changes by occurrence of sedimentation
Agricultural product damage (rice paddy/field)
Amount of yield
11~2,145 (thousand yen/ton)
0.11~1.00 Set for each crop. Damage rate depends on depth and days of inundation
Infrastructure 1.694 multiplied by general asset (total value)
[expected damage] = [direct damage]+[indirect damage]
[direct damage] = Σ([asset values in grid cell] x [damage rate])
[indirect damage] = Σ([number of asset units in grid cell]×[damage per unit])
References:
“Manual for Economic Evaluation of Flood Control
Investments” (MLIT, 2005.6)
“Property Assessment Unit Values and Deflators”
(2013.2 )
Direct and Indirect Damages
20

Damage rates are mainly derived from the interviews and surveys conducted in disaster areas.
Damage rates for residential houses
0.0
0.2
0.4
0.6
0.8
1.0
0 1 2 3 4 5
Dam
age
rate
[-]
Inundation depth [m]
A-Group
B-Group
C-Group
Floor height
Reference: “Manual for Economic Evaluation of Flood Control Investments” (MLIT, 2005.6)
*Damage rate computed from ”Flood damage survey” 1993-1996 (Damage situations in flood affected areas were surveyed by conducting questionnaires and interviews)
(Damage rates in case of sedimentation are the conventionally used rates and are not based on the above surveys)
* The values reflect complete or partial destruction of the house
Inundation
depth
Gradient
Below
floor level
Above floor level Sedimentation
(Above floor level)
less than
50cm
50 – 99
cm
100 - 199
cm
200- 299
cm
over
300cm
less than
50cm
less than
50cm
A-Group
(I<1/1000) 0.032 0.092 0.119 0.266 0.580 0.834
0.43 0.785 B-Group
(1/1000≦I<1/500) 0.044 0.126 0.176 0.343 0.647 0.870
C-Group
(I<1/500) 0.050 0.144 0.205 0.382 0.681 0.888
Damage Rates
21

Unit value of properties are revised every year based on the fluctuation in prices.
Property value of businesses Values of agricultural products (1000 yen/ton)
Unit price Unit price
Rice 200 Podded peas 1051
Wheat 53 Green beans 754
Soybeans 103 White raddich 65
Azuki beans 350 Carrots 108
Peanuts 460 Burdocks 194
Sweat potatoes 188 Taros 248
White potatoes 109 Apples 223
Cucumbers 237 Oranges 190
Eggplants 295 Chinese citrons 136
Tomatoes 278 Pears 282
Pumpkins 158 Persimmons 215
Watermelons 156 Grapes 774
Strawberries 815 Peaches 349
Green peppers 335 Tea leaves 654
Melons 619 Sugar beet 11
Chinese cabbages 53 Konjac 227
Cabbages 56 Tobacco leaves 2,145
Lettuces 131 Rushes 908
Spinach 372 Chrysanthemum 53
Long green onions 246 roses 63
Onions 97 Carnations 38
Cocoons
Fruites
Industrialcrops
Petals
Leaf andstem
vegetables
Name Name
Fruitesand
Vegitables
Potatoes
Beans
Vegetablelegumes
Rootvegetables
Reference: “Property Assessment Unit Values and Deflators” (2013.2 )
(thousand yen/person)
Depreciable assets Inventory assets
Amount of addedvalue
(Suspension ofbusiness)
D Mining 12,839 3,784 103
E Construction 1,472 3,649 20
F Manufacturing 5,107 4,527 28
G Electric/Gas/Heat supply/Water supply 109,953 5,455 54
H Information and communication 5,641 1,426 37
I Transport 5,178 1,254 22
J Wholesale/Retail 1,815 2,162 27
K Finance/Insurance 4,622 290 21
L Real estate 24,251 9,296 49
M Food/Hotel 1,943 154 22
N Medical/Welfare 1,712 57 14
O Education/Learning support 864 271 23
P Multiservice 4,622 290 22
Q Service 4,622 290 22
R Public service 4,622 290 22
(Note)For industrial classification, refer to Japan Standard Industrial Classification(revised in March 2002)
Industrial classification
Unit Values for Damage Calculation
22

23
1. Data collection is supported by government regulations and systems.
2. Disaster data regarding large-scale natural disasters and accidents is reported to the national government.
3. Damage statistics is used for policy and project evaluation. Compiled long-term data shows national trend.
4. Estimated costs of infrastructure recovery is needed for declaring the state of disaster emergency, which leads to 10 to 20% subsidy increase.
5. Direct damage loss is supplemented by non-monetary quantitative data.
6. Ex-post flood damage loss survey and ex-ante economic analysis use the same calculation method.
Conclusion

Thank you.

Result of the Feasibility Exercise on indicators A-D
Setsuko Saya
Director, Cabinet Office, Japan
10 October 2016 Geneva
Open-ended intergovernmental expert working group on indicators and terminology relating to disaster risk reduction
Informal consultations of the Chair
Australia, Cambodia, Colombia, Czech Republic, Ecuador, Fiji, Guatemala, Indonesia, Jamaica, Japan, Mexico, Mongolia, Myanmar, the Philippines, Sri Lanka, Switzerland and the United States of America
25

1. Seventeen Member State assessed 35 indicators whether each indicator was feasible or not, and sent the result to the facilitator (Japan).
2. The facilitator counted the number of Member States which assessed each indicator as “feasible”, “not sure” and “not feasible”.
3. According to the result of 2., each indicator was categolised into: ① Strongly supported (more than 9 MSs :“feasible”) ⇒ 14 Global indicators
② Support is mixed (“feasible” = “not feasible”) ⇒ 6 Country specific indicators
③ Support is weak (more than 6 MSs: “not feasible”) ⇒14 Country specific indicators
Procedures
26
“Feasible indicators” are: • Data is collected by the public sector
regularly. • Data covers a wide range of hazardous
events. • Methodologies to collect /calculate
data are clear.
“Not feasible indicators” are: • Data only covers extreme events. • Definition is not clear/too much in
detail. • Some required items are not covered. • The private sector collects data.

Target A
Cod
e Indicators in the Concept Note
Number of countries Evaluation
Feasible Not
sure
Not
feasible
Strong/Mixed
/Weak
Recommended
global indicators
A-1 [Number of [deaths / deceased] and [missing [persons] /
presumed dead] due to hazardous events per 100,000.] 16 0 1
Strong
Country specific
indicator
A-2 Number of [deaths / deceased] due to hazardous events. 17 0 0 Strong Global indicator 1
A-3 Number of [missing [persons] / presumed dead] due to
hazardous events. 13 2 2
Strong Global indicator 2
Not recommended in the revised non-paper
A-1
alt.
[Number of deaths, missing, injured, displaced or
[evacuated] due to hazardous events per 100,000.] 7 0 6
Mixed
Country specific
indicator
27

Target B
Cod
e Indicators in the Concept Note Feasible
Not
sure
Not
feasible
Strong/Mixed
/Weak
Recommended
global indicators
B-1 [Number of affected people [by hazardous event / due to
hazardous events] per 100,000.] 11 0 5
Strong Global indicator 3
B-2 [Number of injured or ill people due to hazardous events.] 12 2 3 Strong Global indicator 4
B-3
[Number of people who left their [places of residence /
home][and places where they are] due to hazardous
events. ]
9 2 6
Mixed Country specific
indicator
B-4
[Number of people whose [houses / dwellings or homes]
were [damaged / partially destroyed] due to hazardous
events.]
15 1 0
Strong Global indicator 5
B-5 [Number of people whose [houses / dwellings or homes]
were [totally] destroyed due to hazardous events.] 15 0 0
Strong Global indicator 6
B-6
[Number of people who [received / required] [food relief
aid / aid including food [and non-food] and medical aid]
[among other things] due to hazardous events.]
6 1 6
Mixed Country specific
indicator
B-7 [Number of people whose livelihoods were disrupted,
destroyed or lost due to hazardous events.] 4 1 11
Weak
Country specific
indicator
28

Target C Cod
e Indicators in the Concept Note Feasible Not sure
Not
feasible
Strong/Mixed
/Weak
Recommended
global indicators
C-1* [Direct economic loss due to hazardous events [in relation to global
gross domestic product.]] 6 0 10
Weak Country specific indicator
C-2* Direct agricultural loss due to hazardous events. 13 3 0 Strong Global indicator 7
C-3* Direct economic loss due to industrial facilities damaged or destroyed
by hazardous events. 6 3 7
Weak Country specific indicator
C-4* Direct economic loss due to commercial facilities [and services]
damaged or destroyed by hazardous events 6 4 5
Mixed Country specific indicator
C-5* [Direct economic loss due to houses damaged by hazardous events] 13 1 2 Strong Global indicator 8
C-6* [Direct economic loss due to houses destroyed by hazardous events] 12 2 3
Strong Global indicator 9
C-7* [Direct economic loss due to damage to [critical infrastructure / public
infrastructure] caused by hazardous events.] 13 1 3
Strong Global indicator 10
C-8* [Direct economic loss due to cultural heritage damaged or destroyed
by hazardous events.] 5 2 8
Weak Country specific indicator
C-9* [Direct economic loss due to environment degraded by hazardous
events.] 3 2 10
Weak Country specific indicator
C-
10* [Financial transfer and access to insurance.] 1 2 10
Weak Country specific indicator
Not recommended in the revised non-paper
C-
11* [Direct economic loss due to disruptions to basic services.] 1 2 10
Weak Country specific indicator
C-
12*
[Direct economic loss due to services sectors (such as transportation,
tourism, finance) caused by hazardous events.] 3 3 11
Weak Country specific indicator
29

Target D Code Indicators in the Concept Note Feasible
Not
sure Not feasible
Strong/Mixed/W
eak
Recommended global
indicator
D-1* Damage to critical infrastructure due to hazardous events. 6 1 8
Weak Country specific indicator
D-2* [Number / percentage] of health facilities [including mental health
services] destroyed or damaged by hazardous events. 9 4 3
Strong Global indicator 11
D-3* [Number / percentage] of educational facilities destroyed or damaged
by hazardous events. 9 3 2
Strong Global indicator 12
D-4* [Number / percentage] of [major] transportation [units and]
infrastructures destroyed or damaged by hazardous events. 9 2 3
Strong Global indicator 13
D-5* [Number / Length / Percentage] of [time / days / person days] basic
services have been disrupted due to hazardous events. 8 1 6
Mixed Country specific indicator
D-7* [Number / percentage] of security service structures destroyed or
damaged by hazardous events. 2 0 12
Weak Country specific indicator
Not recommended in the revised non-paper
D-1 bis* [Number of electricity plants and transmission towers destroyed or damaged
by hazardous events.] 5 3 6
Mixed Country specific indicator
D-8* [Number / percentage] of tourist infrastructure facilities destroyed or
damaged by hazardous events. 4 0 11
Weak Country specific indicator
D-10* Number of communication infrastructure destroyed or damaged by
hazardous events. 5 0 10
Weak Country specific indicator
D-13* Number of agricultural facilities destroyed or damaged by hazardous events. 8 0 8 Weak Country specific indicator
D-14* Number of water and sanitation infrastructures destroyed or damaged
by hazardous events. 13 0 3
Strong Global indicator 14
D-15* Number of days financial services have been disrupted due to hazardous
events. 3 1 10
Weak Country specific indicator
30

Questions for discussion
• Proposed “global indicators” are not always “feasible” for all the Member States.
⇒ How to facilitate the data collection.
• Definition of each indicator could make difference on the feasibility assessment.
⇒ Clear and common definition is needed, while leaving flexibility for each MS to determine the proxies or components of indicators.
• How can compounded indicators become useful?
• Data collection for “relevant but not feasible today” indicators needs to be explored in the long term.
31