economic inequality: challenges for policy...presentation at un-wider workshop, un new york, may 6...
TRANSCRIPT

Economic Inequality:
Challenges for Policy
Martin Ravallion
Georgetown University and NBER
1
Presentation at UN-WIDER workshop, UN New York, May 6 2019

Two challenges ahead
• Motivational challenge: Should we care about inequality and relative poverty as well as absolute poverty?
• Policy challenge: How might we have greater success against inequality?
2

This talk
Why do we care?
Measurement: also a policy motivator
Policies to help assure pro-poor growth
Redistributive policies to complement pro-poor growth
Six recommendations
3

Why do we care?
4

Why do we care? Ethical arguments
• Consensus on absolute poverty but not inequality.
• Maybe “inequality” is too big a word! Needs to be un-packed to inform public action.
• Ethical concerns about:
– fairness of processes, such as unfair trades, restricted mobility
– unequal opportunities in life, esp. from conditions of birth
– unequal outcomes in life; utilitarian objections and/or implications for the next generation
– objectionable specific inequities (ethnic/race, gender, geographic) especially if due to discrimination.
5

Why do we care? Costs of inequality
• High inequality threatens prospects for future economic growth, and dampens the impact of growth on poverty.
– Credit constraints facing the poor and middle class.
– Political impediments to reform and public good provision.
– Social costs of conflict, weaker social cohesion, discrimination, higher crime.
• Countries starting out with high inequality have a harder time growing their economy, and a harder time assuring that their growth is pro-poor.
6

Measurement as a policy motivator
7

Better measurement and monitoring matters to addressing both challenges
• Long history of how poverty and inequality measurement has influenced policy. Shaming into action.
• Social relevance of the measures is key.
• Current measurement practice are incomplete; out-of-step with popular thinking
• Largely missing from the way economists think about “inequality” and “poverty:”
– Absolute inequality
– The poorest
– Relative incomes
8

Debates on inequality are often debates between absolutists and relativists
• Possibly half think about inequality in absolute terms not relative.
• Perceptions on the ground often differ to the numbers quoted by economists and statisticians!
• At local level: absolutist (e.g., NGO) sees rising inequality but relativist economist sees constant or even falling inequality.
• Neither is wrong: Just different axioms of inequality measurement (scale-invariance vs translation invariance).
9
Conflicting views
• “The poorest of the world are being left behind. We need to reach out and lift them into our lifeboat.” U.N. Secretary-General Ban Ki-moon, 2011
• “Poverty is not yet defeated. Far too many are being left behind.” Guy Ryder, ILO
• Yet economists appear to tell a very different story. Adages such as “a rising tide lifts all boats” or claims that “growth isgood for the poor” or that there has been a “breakthrough from the bottom”
10
How can we understand such different claims?

Counting poor people may miss what is happening to the poorest
11
Poorest left behind Same reduction in the incidence of poverty but without leaving the poorest behind
Measure of
welfare
Cumulative % of
population
Measure of
welfare
Cumulative % of
population
Poverty
line
Poverty
line Floor
stays put
Rising floor
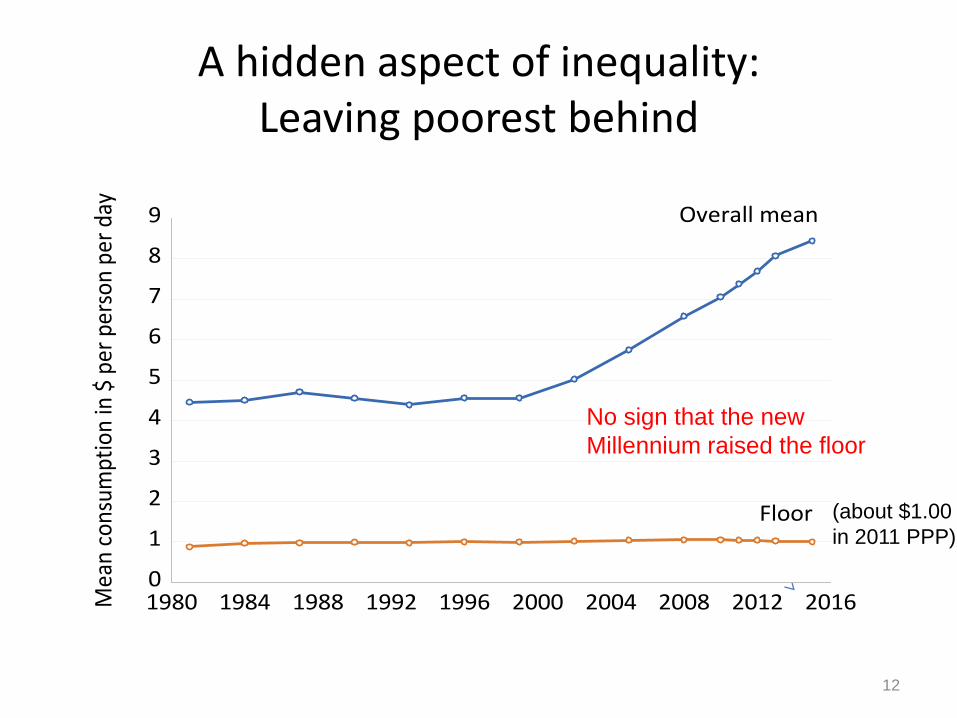
A hidden aspect of inequality: Leaving poorest behind
12
(about $1.00
in 2011 PPP)
0
1
2
3
4
5
6
7
8
9
1980 1984 1988 1992 1996 2000 2004 2008 2012 2016
Overall mean
Floor
Mea
n co
nsum
ptio
n in
$ p
er p
erso
n pe
r da
y
No sign that the new
Millennium raised the floor

Yes, the poorest have been left behind!Fewer people living near the floor, but little change in the floor
13
0
2
4
6
8
10
12
0 10 20 30 40 50 60 70 80 90 100
Percentile
Ab
so
lute
ga
in 1
98
1-2
01
1 ($
pe
r p
ers
on
pe
r d
ay)
-40
-20
0
20
40
60
80
100
0 2 4 6 8 10 12 14 16 18 20
Pe
rce
nt o
f th
e p
op
ula
tio
n
Consumption or income per person ($ per day, 2005 prices)
1981
2011
Difference (2011-1981)
Near zero gain at bottom

Rising numbers of relatively poor but not absolutely poor
14
0
10
20
30
40
50
60
1988 1990 1992 1994 1996 1998 2000 2002 2004 2006 2008 2010 2012 2014
Glo
ba
l h
ea
dco
un
t in
de
x o
f p
ove
rty (
%)
Absolute only
($1.90/day)
Absolute +
(weakly) relative

Measures of “global inequality” ignore gains from living in rich country!
• It is assumed that the gains are fully reflected in “own income”.
• This is wrong on two counts:
– Measurement concerns (time period; errors)
– Gains from public non-market goods (Wagner’s Law)
• Subjective welfare data: national income effect could well be 50% or more of the own-income effect
=> Global inequality is far higher than current measures suggest.
• This swamps concerns about under-measured “top end.”
15

Policies to help assure pro-poor growth
16

Economic growth and inequality
• Growth has been roughly distribution neutral on average
– Falling inequality in some growing economies and in some periods (Malaysia; Indonesia 1970-90)
– But rising in other countries/periods (Indonesia since late-1990s).
• Growth has been the main proximate source of progress against absolute poverty.
• But very mixed evidence that it helps much against relative poverty or relative inequality.
• And growth tends to come with higher absolute inequality.
17

Rising inequality in growing economies?
18
-.15
-.10
-.05
.00
.05
.10
-.10 -.08 -.06 -.04 -.02 .00 .02 .04 .06 .08 .10 .12
Growth rate in the mean (annualized difference in logs)
Gro
wth
in
ab
solu
te in
eq
ua
lity
(an
nu
aliz
ed
dif
fere
nce
in
log
ab
solu
te G
ini i
nd
ex)
r=0.90
-.06
-.04
-.02
.00
.02
.04
.06
-.10 -.08 -.06 -.04 -.02 .00 .02 .04 .06 .08 .10 .12
Growth rate in the mean (annualized difference in logs)
Gro
wth
in
re
lati
ve
in
eq
ua
lity
(an
nu
ali
ze
d d
iffe
ren
ce
in
lo
g r
ela
tiv
e G
ini
ind
ex
)
r=0.18
Relative inequality Absolute inequality

Growth is a less important proximate cause of uneven progress against relative poverty
19
• Elasticity of absolute poverty to growth in mean = -2.2.
• Elasticity of (weakly) relative poverty to mean = -0.4.
-.4
-.3
-.2
-.1
.0
.1
.2
.3
.4
.5
-.10 -.08 -.06 -.04 -.02 .00 .02 .04 .06 .08 .10 .12
Growth rate in mean
Gro
wth
ra
te in
po
ve
rty
(an
nu
alize
d d
iffe
ren
ce in
lo
g H
)
Absolute poverty
(slope=-2.25; se=0.27)
Relative poverty
(slope=-0.43; se=0.05)

20
How to achieve more pro-poor growth?
Literature and policy discussions point to the need to:
• Develop human and physical assets of poor people => quality services
• Make markets work better for poor people (credit, labor, land)
• Remove all negative discrimination (race, gender)
• Remove biases against the poor in public spending, taxation, trade and regulation
• Invest in local public goods/infrastructure (not neglecting poor areas) + agriculture and rural development
• Remove restrictions on migration (between and within)
• Foster labor absorption from urban economies, esp., small and medium sized towns

Human development and inequality
• Socio-economic gradients in schooling and health care everywhere help perpetuate poverty and inequality across generations.
• Generalized gains in schooling can be inequality increasing initially; need for focusing on poor families.
21
• Log earnings are linear in years of schooling. So earnings inequality rises with extra schooling in poor countries.
-.1
.0
.1
.2
.3
.4
.5
.6
.7
.8
0.0 0.1 0.2 0.3 0.4 0.5 0.6 0.7 0.8 0.9 1.0
Mean school completion (Grade 6; 15-19 years)
Ab
solu
te g
ap
: R
ich
est
qu
inti
le -
po
ore
st
Schooling gap: rich - poor

Redistributive policies to complement
pro-poor growth
22

Lessons from the advanced economies
• Fiscal incidence studies suggest that redistributive policies—mainly taxes and transfers—have reduced inequality substantially (OECD, IMF).
– Average Gini for market incomes = 0.49
– Average Gini for disposable income = 0.31
• (Though redistributive effort has not typically increased with the higher inequality of market incomes since mid-1990s.)
23

Rising use of direct interventions in the developing world
• Two main forms:
1. Direct non-contributory income transfers to poor or vulnerable families; with or without conditions.
2. Workfare schemes use work requirements for targeting.
• Today almost every developing country has at least one such program, though often with limited coverage.
• Roughly one billion people currently receive assistance.
24
But are these interventions reaching the poor?
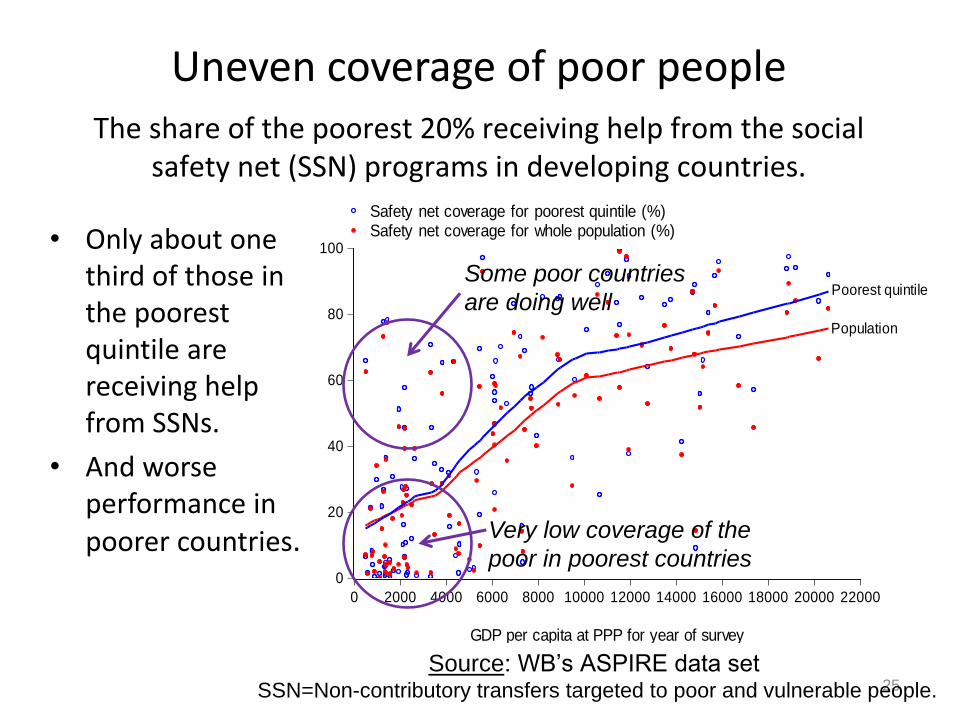
Uneven coverage of poor people
• Only about one third of those in the poorest quintile are receiving help from SSNs.
• And worse performance in poorer countries.
25
0
20
40
60
80
100
0 2000 4000 6000 8000 10000 12000 14000 16000 18000 20000 22000
GDP per capita at PPP for year of survey
Safety net coverage for poorest quintile (%)Safety net coverage for whole population (%)
Poorest quintile
Population
The share of the poorest 20% receiving help from the social safety net (SSN) programs in developing countries.
Source: WB’s ASPIRE data set SSN=Non-contributory transfers targeted to poor and vulnerable people.
Very low coverage of the
poor in poorest countries
Some poor countries
are doing well

One billion poor; one billion SSN recipients
Living in poverty Receiving help
from SSN
26
But mostly not the same people in poor countries!

Less poor countries tend to be better at reaching their poor by these policies
27

Success stories too!
• Malaysia: one of the fastest rates of poverty reduction in world; 50% in 1970 to 0.4% in 2016
• Growth combined with falling inequality (Gini from over 0.5 to under 0.4 in same period).
• Active redistributive policies, esp., ethnicity.
• Sobering lesson for SDG1: it even took Malaysia 30 years to eliminate the last 3% of extreme poverty.
28

Reaching the poorest? Social assistance lifts mean floor by only 1.5 cents a day
• Social spending lifted the floor by $0.48 per person per day on average, well below the mean spending per capita of $0.88 a day.
• This is worse than a UBI.
• The bulk of this impact is due to social insurance; social assistance on its own only lifts the floor by 1.5 cents per dayon average!
• This is less than 10% of mean spending on social assistance.
29

Is it spending more or spending better that lifts the floor?
30
-3
-2
-1
0
1
2
3
-10 -9 -8 -7 -6 -5 -4 -3 -2 -1 0 1 2
Log social spending
Log f
loor
post-
transfe
rs
r=0.751
• The bulk (77%) of the variance is due to variance in levels of
social spending rather than the efficiency of that spending.
• Countries that
spend more on
social protection
tend to have a
higher floor
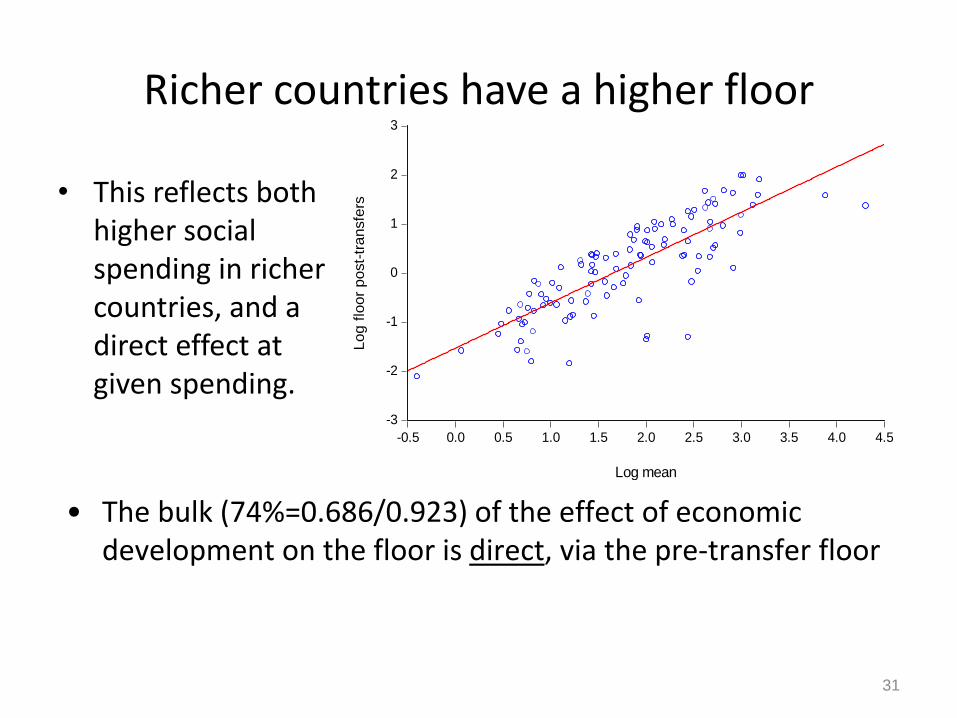
Richer countries have a higher floor
• This reflects both higher social spending in richer countries, and a direct effect at given spending.
31
-3
-2
-1
0
1
2
3
-0.5 0.0 0.5 1.0 1.5 2.0 2.5 3.0 3.5 4.0 4.5
Log mean
Log f
loor
post-
transfe
rs
• The bulk (74%=0.686/0.923) of the effect of economic development on the floor is direct, via the pre-transfer floor

A new role for redistributive interventions, but many challenges ahead
• Success against relative poverty and in raising the floor will almost certainly require more effective redistributive policies.
• Constraints include information, incentives, financing and political economy. Administrative capacity is key.
• High marginal tax rates on the poor must be avoided; poverty traps due to fine targeting.
• Method of financing is key to overall impact.
• Information constraints can be severe. Reliable fine targeting is rarely feasible in practice in developing economies.
32

Imperfect information is a severe constraint
• The popular “poverty gap” calculation assumes that we can accurately identify poor people and tell how poor they are.
• This is a strong assumption.
– Limitations of even the best h’hold surveys
– Policies in practice use a smaller set of poverty proxies
– Reaching poor h’holds does not mean we reach poor individuals
• Evidence for Sub-Saharan Africa:
– Even with a budget sufficient to eliminate poverty with full information, existing targeting methods do not bring poverty rate below about three-quarters of its initial value.
– Prevailing methods are particularly bad in reaching poorest.
– And many poor individuals are found in non-poor h’holds.
33

Direct redistributive policies not requiring “welfare” or workfare
• Pro-poor public services (health, education, security)
– Targeted or universal
• Microfinance for poor people
– Mixed record
• Minimum wage rate (if enforceable)
• Progressive income tax (if broad coverage) + tax credits
• Stronger tax enforcement
34

A policy to consider more seriously, for both pro-poor growth and redistribution
• Basic full income
– Universal; all citizens (“poor” or not)
– Cash plus imputed values of key in-kind services (health, education)
– Cash accumulates in an account for children until age 18 (say)
• Financed by cutting other subsidies and programs that bring little benefit to the poor
• + progressive income tax when administratively feasible
• Supportive ID system (e.g., Aadhaar in India, but privacy concerns need to be addressed).
35

Six recommendations for better
policy making
36
Beyond slogans
• “Tax the rich more”
• “Spend less on rich people”
• “Spend more on poor people”
• “Target spending to the poor”
• “Rely on local participation”
37

Recommendation 1: Policies must be tailored to the realities of the setting
• Successful policies respect local constraints on the information available, administrative capabilities and incentive constraints.
• A key role for analysts is to learn about these constraints and make them explicit.
• Too often policy making is done in the absence of a proper understanding of these constraints, which makes for bad policies.
38

Recommendation 2: Tap local information but with effective state support
• Tapping local information can help identify those in need, and help in responding, but it must be combined with strong governments.
• We have seen greater use of participatory, community-based (governmental and non-governmental), institutions for income support and/or service provision.
• However, these should not be seen as substitutes for strong public administration, which will still be needed in guiding and monitoring local institutions, including addressing grievances.
39

Recommendation 3: Focus on poverty reduction not finer “targeting” per se
• Excessive emphasis on reducing inclusion errors, but leaving high exclusion errors.
• The most finely targeted policy (lowest inclusion errors) need not have the most impact on poverty
o Information problems; measurement errors
o Proxy means tests are often poor means tests, esp., poorest
o Hidden costs of participation
o Adverse incentives: high marginal tax rates => poverty traps
o Political economy; concerns about undermining social support/political consensus
40
Recommendation 4: Improve the protection-promotion trade-off
• Yes, there can be a trade off, though it is often exaggerated.
• Transfers have a role in allowing markets to work better from the perspective of poor people.
• “Smart,” “Social investment,” approaches (CCT and productive workfare) show promise. But assessments must consider all the costs and benefits and avoid paternalism.
• Greater flexibility is needed in responding to shocks. Participant capture is a common problem. Also local moral hazard.
• Don’t be too ambitious: administrative capacity is a key constraint in practice.

Recommendation 5: Monitoring and evaluation are crucial
• There are persistent knowledge gaps about the effectiveness of this class of policies.
• In addressing those gaps, generalized preferences among the methodological options are rarely defensibly in the absence of knowledge about the setting, and (especially) the data that are available.
• There is a menu of defensible options.
• It is no less important that policy makers are active in identifying key knowledge gaps, and/or supporting the creation of relevant knowledge.
42

Recommendation 6: Learn from mistakes
• Policy makers must also adapt to evidence of failure, admitting and learning from mistakes as well as scaling up successes.
• Too often, it seems, deficient programs survive well beyond their useful life.
• Bureaucratic inertia and participant capture appear to be common problems.
• The NGO GiveWell has a page on its website devoted to acknowledging its own mistakes (the first listed of which was not hiring a PhD economist, which the NGO is in the process of correcting at the time of writing).
• Citizens should demand that governments do the same.
43

Thank you for your attention!