economic indicators: march 1972
TRANSCRIPT

92d Congress, 2d Session
Economic Indicators
March 1972
Prepared for the Joint Economic Committee by the
Council of Economic Advisers
UNITED STATES
GOVERNMENT PRINTING OFFICE
WASHINGTON : 1972
Digitized for FRASER http://fraser.stlouisfed.org/ Federal Reserve Bank of St. Louis

JOINT ECONOMIC COMMITTEE
(Created pursuant to Sec. 5(a) of Public Law 304, 79th Cong.)
WILLIAM PROXMIRE, Wisconsin, ChairmanWRIGHT PATMAN, Texas, Vice Chairman
SENATE
JOHN SPARKMAN (Alabama)J. W. FULBRIGHT (Arkansas)ABRAHAM RIBICOFF (Connecticut)HUBERT H. HUMPHREY (Minnesota)LLOYD M. BENTSEN, Jr. (Texas)JACOB K. JAVITS (New York)JACK MILLER (Iowa)CHARLES H. PERCY (Illinois)JAMES B. PEARSON (Kansas)
JOHN RJAMES W.LOUGHLIN
HOUSE OF REPRESENTATIVESRICHARD BOLLING (Missouri)HALE BOGGS (Louisiana)HENRY S. REUSS (Wisconsin)MARTHA W. GRIFFITHS (Michigan)WILLIAM S. MOORHEAD (Pennsylvania)WILLIAM B. WIDNALL (New Jersey)BARBER B. CONABLE, Jr. (New York)CLARENCE J. BROWN (Ohio)BEN B. BLACKBURN (Georgia)
. STARK, Executive DirectorKNOWLES, Director of ResearchF. McHuGH, Senior Economist
COUNCIL OF ECONOMIC ADVISERSHERBERT STEIN, Chairman
EZRA SOLOMONMARINA v. N. WHITMAN
Economic Indicators prepared under supervision of FRANCES M. JAMES
[PUBLIC LAW 120—81sx CONGRESS; CHAPTER 237—IST SESSION]
JOINT RESOLUTION [S J. Res. 55]
To print the monthly publication entitled "Economic Indicators"
Resolved by the Senate and House of Representatives of the United States oj America in Congress assembled, Th.i i t h e Jo in tEconomic Committee be authorized to issue a monthly publication en t i t l ed "Economic Ind ica to r s , " and t h a i asufficient quantity be printed to furnish one copy to each Member of Congress; the Secretary and t h e Sergeant atArms of the Senate; the Clerk, Sergeant at Arms, and Doorkeeper of the 1 louse of Representat ives , two copies tothe libraries of the Senate and House, and the Congressional Library; seven hundred copies to the Joint EconomicCommittee; and the required number of copies to the Superintendent of Documents for distribution to depositorylibraries; and that the Superintendent of Documents be authorized to have copies printed for sale to the public.
Approved June 23, 1949.
Charts drawn by Art Production Branch, Office of the Secretary, Department of Commerce.
Economic Indicators, published monthly, is available at 25 cents a single copyor by subscription at $3.00 per year (foreign, $4.00) from:
SUPERINTENDENT OF DOCUMENTSGOVERNMENT PRINTING OFFICE
WASHINGTON, D.C. 20402
Subscribers who wish to receive it at an earlier date after release may take advan-tage of provisions for airmail subscriptions. The domestic airmail subscriptionprice is $3.60 additional per year.
The 1967 edition of the Historical and Descriptive Supplement to EconomicIndicators, which describes each series and gives annual data for years notshown in the monthly issues, is available at 70 cents a copy from the Superintend-ent of Documents, Government Printing Office.
11
Digitized for FRASER http://fraser.stlouisfed.org/ Federal Reserve Bank of St. Louis

TOTAL OUTPUT, INCOME, AND SPENDINGTHE NATION'S INCOME, EXPENDITURE, AND SAVINGGross national product rose $191/2 billion in the fourth quarter to a seasonally adjusted annual rate of $1,073 billion.For the year 1971, gross national product totaled $1,047 billion, an increase of $72% billion from 1970.
[Billions of dollars; quarterly data at seasonally adjusted annual rates]
Period
19641965196619671968 _ _ _1969 _ _19701971 "
3970: 1I II I I —IV. ,_
197J: 1I tI I I _ _ _IV"__
Disposat
Total 1
438. 1473. 2511. 9546. 3591. 0634. 2687. 8741. 3
667. (')685. 7696. 2701. 5
722, 0739. 6748. 5755. 0
le persons
Less :Interest
paid andtransfer
pay-mentsto for-eigners
10. 712. 013. 013. 915. 116. 717. 918. ( >
17. 517. 818. 018. o
18. 418. 618. 818. 8
Persons
il income
Equals:Total
exclud-ing
interestand
trans-fers
427.4461. 3498. 9532. 4575. 9617. 5069. 9722. 7
650. 1667. 9678. 2683. 2
703. 6721. 0729. 7736.2
Personalconsump-
tionexpend-itures
401. 2432. 8466. 3492. 1536. 2579. 0615. 8662. 1
604. 0613. 8620. 9624. 7
644. 9657. 4668. 8677. 2
Per-sonalsaving
ordis-
saving( •)\ /
26. 228. 432. 540. 439. 837. 954. 160. 5
46. 254. 257. 458. 5
58. 663. 661. 059. 0
N
Taxand
nontaxreceipts
oraccruals
174. 1189. 1213.3228. 9263. 5295. 6300. 5320.9
296. 6301. 8301. 7301. 9
312. 3317.8322. 0331.0
et receip
Less:Trans-
fers,interest,
andsub—
sidies 2
46. 749. 955. 562. 870. 778.494. 2
108. 2
82. 797. 596. 899. 8
101. 4109. 1110. 3110.9
C
ts
Equals:Net
receipts
127. 3139. 2157.9166. 2192. 7217. 2206. 3212. 7
213. 9204. 3204. 9202. 1
210. 9208. 7211. 7220. 1
jovernme
E
Totalexpend-
itures
175.4186. 9212.3242.9270. 3288.2313.6341.2
300. 0314. 0316. 9323. 7
329. 3338.7344. 1351.8
Dt
xpenditur
Less:Trans-
fers,interest,
andSUu—
sidies 2
46.749. 955. 562. 870.778. 494. 2
108.2
82.797. 596. 899. 8
101. 4109. 1110. 3110.9
es
Equals:Pur-
chasesof goods
andservices
128. 7137. 0156. 8180. 1199. 6209. 7219. 4233.0
217.3216. 5220. 1223. 7
227. 9229. 6233. 8240. 8
Surplusor
deficit(— ),
incomeand
productaccounts
-1.42. 21. 1
— 13. 9-6.8
7. 4-13. 1-20.2
-3.4— 12. 2— 15. 2-21.7
-17. 1-20. 9— 22. 2-20.8
Period
19641965.196619671968196919701971 »
1970: IIIIIIIV.
1971: IIIIIIIV"
Grossretained
earn-ings 3
76. 284. 791. 393. 095. 495. 699. 3
112. 9
96. 299. 1
100. 4101. 5
107. 6111. 9113.0119. 1
B usiness
Grossprivate
domesticinvest-ment 4
94. 0108. 1121. 4116. 6126. 0137. 8135. 3151. 6
131. 2134. 1138. 6137. 3
143. 3152.9150. 8159.4
Excessof
invest-ment(-)
-17.8-23. 4-30. 1-23. 5-30. 6-42. 1-36.0-38. 7
-35. 0-35. 0-38. 2-35. 8
-35. 7— 41. 0— 37. 8-40.3
Nettransfers
to for-eignersby per-
sons andGovern-
ment
2. 82. 82. 83.02.92. 93. 13. 4
3. 03. 03. 23. 3
3. 13. 43. 73. 5
Ii
Net ea
Exports
37. 139. 243. 446. 250.655. 662. 965. 3
61. 563. 263. 763. 2
66.266.568.260. 4
iternation
xports ofnd service
Less:Imports
28. 632. 338. 141. 048. 153. 659. 365. 3
58. 059. 059. 760. 5
61. 566. 468. 265.0
al
goods,s
Equals:Net
exports
8. 56. 95. 35. 22. 52. 03. 6.0
3. 54. 24. 02. 7
4. 7. 1. 0
-4. 6
Excess oftransfers
orof net
exports(~) 5
-5.7— 4. 1— 2. 4— 2. 2
. 4
. 9-. 43.4
__ 5— 1. 1
n
. 7
— 1. 63. 33. 78. I
Totalincome
orreceipts
633. 7688. 0750.9794. 6866. 9933. 2978. 6
1, 051. 7
963. 2974. 3986. 7990. 1
1, 025. 21, 044. 91, 058. 11, 078. 9
Statis-tical
discrep-ancy
-1. 3-3. 1-1. 0
— . 7-2.7-4. 1— 4. 5-5. 0
-7. 3— 5. 8-3. 2-1.6
-4. 3-4. 9— 4. 7-6. 0
Grossnationalproduct
orexpend-
iture
632.4684. 9749. 9793. &864. 2929. 1974. 1
1, 046. 8
956.0968.5983.5988.4
1, 020. 81, 040. 01, 053. 41, 072. 9
1 Personal income (p. 5) less personal tax and nontax payments (fines, penal-ties, etc.).
net transfers by Govern-
, ,pital consumption allowances, and private wage accruals less disbursements.oes not include retained earnings of unincorporated business, which are in-
cluded in disposable personal income.
- Private business investment, purchases of capital goods by private nonprofitinstitutions, and residential housing.
6 Net foreign investment less capital grants received by U.S., with signchanged.
Source: Department of Commerce.
Digitized for FRASER http://fraser.stlouisfed.org/ Federal Reserve Bank of St. Louis

GROSS NATIONAL PRODUCT OR EXPENDITUREGross national product (seasonally adjusted) rose at an annual rate of 7.6 percent in the fourth quarter, accordingto current estimates. When adjusted for price changes, the rate was 5.8 percent. For 1971 as a whole, grossnational product increased by 71A percent, real gross national product by 2% percent, and prices by 4% percent.
BILLIC1,100
1 AAA
900
OAA
700
600
CAA
400£
300
100
>NS OF DOLLARS
^*****\
—
s
.—-~~~^
i l l ;1965
^~*~
nmt*****1* ********
„„................,.....•.»»'..
NE1
1 1 1
1966
SEASO
GROSS N4
. *"
r~~^^
PE
GCOF
f EXPORTS OF GOOAND SERVICES
\
1 i I ^1967
^ALLY ADJUSTED ANNUAL
TIONAL PRODUCT
\ ^
^^RSONAL CONSUMP"
EXPENDITURES
3VERNMENT PURCH>GOODS AND SER\
\
DS
1 1 1
1968
RATES
^** ~
^—
ION
^SES'ICES
-\
GROSS PRIVATEINVESTME
J J 11969
-— '
„,»—-**
DOMESTIC^T
! f 1
1970
BILLIONS OF DO
^^
v
,..„,„„,..» .....-•"'"
1 ! 11971
LLARS1,100
1 AAA
Ann
7AA
600
400
200
inn
0
SOURC& DEPARTMENT OF COMMERCE COUNCIL OF ECONOMIC ADVISERS
Period
1961..1962. ....1963196419651966196719681969197019711970:1
II _IIIIV..
1971: I.IIIIIIV
Totalgross
nationalproductin 1958dollars
497.2529.8551.0581. 1617. S658. 1675. 2706.6724. 7720.0739.4719. 8721. 1723.3715.9729.7735.8740. 7751.3
Totalgross
nationalproduct
Billions <
520. 1560.3590. 5632.4684. 9749. 9793.9864. 2929. 1974, 1
1, 046. 8956. 0968. 5983. 5988. 4
1, 020. 81, 040. 01, 053. 41, 072. 9
Personalcon-
sump-tion
expend-itures
sf dollars;
335.2355. 1375.0401.2432. 8466. 3492. 1536.2579. 6615. 8662. 1604. 0613. 8620. 9624.7644. 9657. 4668.8677.2
Grossprivate
domesticinvest-ment
quarterly
71.783. 087. 194.0
108. 1121.4116. 6126. 0137.8135. 3151.6131. 2134. 1138. 6137.3143. 3152. 9150. 8159.4
Netexportsof goods
andservices
data at &
5. 65. 15.98.56.95.35.22. 52. 03. 6.0
3. 54. 24. 02.74, 7. 1. 0
-4.6
Gove
Total
easonall^
107. 6117. 1122. 5128. 7137.0156. 8180. 1199. 6209. 7219. 4233.0217. 3216. 5220. 1223.7227. 9229. 6233. 8240.8
niment ]
Total
y ad juste
57. 463. 464. 265. 266.977.890. 798. 899. 297. 297.6
100. 296. 896. 195.996. 496. 097. 6
100.3
mrchasesservicesFederal
Nationaldefense l
d annual
47.851. 650.850.050. 160. 772. 478. 378. 475.471.478. 975. 174. 273. 272. 671. 470. 271.4
of good
Other
rates
9. 611.813. 515.216. 817. 118. 420. 520.721.926.221. 321. 621. 922. 723. 724. 627.428.9
s and
Stateandlocal
50.253. 758. 263. 570. 179. 089. 4
100. 8110. 6122. 2135.5117. 1119. 7124. 0127. 9131. 6133. 6136. 2140.5
Implicitprice
deflatorfor total
GNP,I958=100a
104. 62105. 78107. 17108. 85110. 86113. 94117. 59122. 30128. 21135. 29141. 57132. 82134. 32135. 97138. 07139. 88141. 34142. 21142. 80
* This category corresponds closely with budget outlays for national defense,shown on p. 36.
3 Gross national product in current dollars divided by gross national productIn 1958 dollars.
Source: Department of Commerce.
Digitized for FRASER http://fraser.stlouisfed.org/ Federal Reserve Bank of St. Louis

NATIONAL INCOME
National income rose $15 billion (seasonally adjusted annual rate) in the fourth quarter following an $8 billionrise in the third.
BILLIONS OF DOLLARS
900
BILLIONS OF DOLLARS
900
800
CORPORATi: PROFITS ANDINVfNlORY VALUATION ADJUSTMENT
500
400 —
100
SOURCEj DEPARTMENT OF COMMtRCE COUNCIL OF ECONOMIC ADVISERS
[Billions of dollars; quarterly data at seasonally adjusted annual ratesj
Period
1961196219631964196519B6 __ __1967. _ _ _1968196919701971 »
1970: IIIIIIIV
1971: IIIIIIIV* _ .
Totalnationalincome
427. 3457. 7481. 9518.1564. 3620. 6653. 6711. 1763. 7795. 9851. 1
785.8793. 4802. 2802. 1
831. 7847. 3855. 2S70. 3
Compen-sationof em-
ployees *
302. 6323. 6341. 0365.7393. 8435. 5467. 2514. 6565. 5601. 9641.9
593. 2598. 5606. 5609. 3
627. 3638. 0645. 6656. 6
Proprieto
Farm 2
12. 813. 013. 112.114.816. 114. 814.716. 815. 816. 3
17.816. 614. 514. 4
14. 815.217.018. 1
rs' income
Businessand pro-fessional
35. 637. 137. 940.242.445. 247. 349.550. 351. 052. 1
50. 251. 051. 451. 5
51. 651. 952. 352.5
Rentalincome
ofper-
16. 016.717. 118.019.020. 021. 121. 222. 623. 324. 3
23. 023. 223. 423. 7
23. 824. 224. 524. 6
Netinter-est
10. 011. 613.815.818.221. 424. 426. 929.933. 035. 6
31. 832. 633. 434. 2
34. 835. 435. 936.4
Corporaltory va
Total
50. 355. 758. 966.376. 182.478. 784. 378.670. 881. 0
69. 871. 573. 069.0
79. 582.580.082.2
be profitsluation ac
Profitsbeforetaxes
50.355. 459. 466.877.884. 279.887.684. 275. 485.5
75. 675. 878.571. 6
83. 086. 985.886.2
and inven-Ijustment
Inventoryvaluation
adjustment
-0. 1. 3
-. 5-.5
— 1.7— 1. 8— 1. 1-3. 3— 5. 5-4. 5— 4. 4
— 5. 8-4. 2— 5. 5-2.6
-3.5-4.4-5.8-4.0
1 Includes employer contributions for social insurance. (Sec also p. 4.)3 Excludes farm profits of corporations engaged in farming and therefore differs
from net farm income (including net inventory change) on p. 6 which includesmen profits.
Source: Department of Commerce.
Digitized for FRASER http://fraser.stlouisfed.org/ Federal Reserve Bank of St. Louis

SOURCES OF PERSONAL INCOMEPersonal income rose $5 billion in February to a seasonally adjusted annual rate of $897 billion. Wage and salarydisbursements accounted for $3% billion of the rise. Since November personal income has risen at an annual rate of10% percent, considerably more than the 6% percent rise from 1970 to 1971.
BILLIONS OF DOLLARS1,000
TOTAL PERSONAL INCOME
800
600
400
200
SEASONALLY ADJUSTED ANNUAL RATES
BILLIONS OF DOLLARS1 1 000
I I I I I I I I1966 1967
HIMIIIMH"*""*"
OTHER INCOME
TRANSFER PAYMENTS
1968 1970 1971
800
600
400
200
1972
SOURCE: DEPARTMENT OF COMMERCE COUNCIL OF ECONOMIC ADVISERS
(Billions of dollars; monthly data at seasonally adjusted annual rates)
Period
196319641965196619671968196919701971
1971: JanFeb____MarAprMay___JuneJu ly___AugSeptOctNovDec_..__
1972: JanFeb»_..
Totalpersonalincome
465. 5497. 5538.9587. 2629. 3688. 9750. 3803. 6857. 0
829. 9832. 4838. 3843. 0848. 6868. 6857. 7866. 1869. 9871.2874. 9883. 9
892. 0896.9
Wageand
salarydisburse-ments l
311. 1333. 7358.9394. 5423. 1464. 9509. 6541. 4574. 2
558. 7560. 6564. 8567. 7572. 0573. 2572. 9579. 2579. 8581. 3584. <S594. 8
602. 1605. 8
Otherlabor
income 2
14.916. 618.720.722. 325. 428. 230. 833. 732. 432. 632. 833. 133. 433. 733. 934. 134. 334. 434. 634. 8
35. 035.2
Proprietc
Farm
13. 112. 114.816. 114. 814. 716. 815. 816. 314. 714. 814. 915. 115. 215. 316. 117.017.818. 018. 118. 118. 318.5
>rs' incomeBusinessand pro-fessional
37. 940. 242.445. 247. 349. 550. 351. 052. 1
51. 651. 551. 751. 851. 952. 152.252. 352. 352.452.552. 652. 552.6
Rentalincome
ofpersons
17. 118. 019.020. 021. 121. 222. 623. 324. 323. 923. 524. 024. 124. 224. 324. 424. 524. 524. 524. 624. 624. 724. 8
Divi-dends
16.517. 819.820. 821. 423. 624. 425. 025.525. 625. 725. 525. 525. 625. 225.625. 725. 725. 725. 724. 325. 825. 9
Personalinterestincome
31.434.938.743. 648. 052. 958. 864. 767. 566. 766. 666. 466. 666. 766. 967. 468. 168. 868. 768. 668.468. 768.9
Transferpay-
ments
35. 336. 739.944. 151. 859. 665. 979. 694. 786. 887. 889. 189.890. 5
109. 096. 296. 597. 997. 497. 698.298. 799.2
Less: Per-sonal con-tributionsfor socialinsurance
11.812. 513.417. 720. 522. 826. 328. 031. 230. 530. 730. 930.931.031. 131. 131.431. 431. 431. 632.033. 934.0
Nonagri-culturalpersonalincome 3
448. 1480. 9519. 5566. 3609. 4668. 8727. 7781.4834. 0808. 6810. 8816. 6821. 1826.5846. 5834. 8842.4845. 3846. 4850. 1859. 2867. 1871.7
1 Compensation of employees (see p. 3) excluding employer contributions forsocial insurance and wage accruals less disbursements.
penssitems.
Employer contributions to private pension, health, and welfare funds: com-isation for injuries; directors' fees; military reserve pay ;and a few other minor
3 Personal income exclusive of net income of unincorporated farm enterprises,farm wages, agricultural net interest, and net dividends paid by agricultural,,corporations.
Source: Department of Commerce.
Digitized for FRASER http://fraser.stlouisfed.org/ Federal Reserve Bank of St. Louis

DISPOSITION OF PERSONAL INCOMEIhe saving rate declined in the fourth quarter, in large part because acceleration of estate and gift tax paymentsremporarily held down disposable personal income.
BILLIONS OF DOLLARS
700
<500
BILLIONS OF DOLLARS
DOLLARS4,000
3,500
3,000
2,500
2,000
COUNCIL OF ECONOMIC ADVISERS
Period
196319641965196619671968196919701971
1970: I— _I I__III_IV__
1971: ! ___II—III.IV..
Per-sonal
income
465. 5497. 5538.9587. 2629. 3688. 9750. 3803. 6857. 0
784. 3803.8809. 8816. 7
833. 5853. 4864. 6876. 7
LPer-
sonaltax andnontax
pay-ments
60. 959. 465.775.483. 097. 9
116. 2115. 9115. 8
116. 7118. 0113. 5115. 2
111. 6113. 8116. 0121. 7
Equals:Dis-
posablepersonalincome
404. 6438. 1473.2511. 9546. 3591. 0634. 2687. 8741. 3
667. 6685. 7696. 2701. 5
722. 0739. 6748. 5755. 0
L
Totalpersonaloutlays l
Billions
384. 7411. 9444.8479. 3506. 0551. 2596. 3633. 7680. 7
SeasG
621. 5631. 5638. 9643. 0
663. 3676. 0687. 6696.0
ess : PersePersoi
ex
Durablegoods
of dollars
53. 959. 266. 370. 873. 184. 089. 988. 6
100.5
nally adji
88. 690. 790. 484. 9
96. 699. 1
102. 8103. 6
mal outlalal consurpenditure
Non-durablegoods
168. 6178.7191. 1206. 9215. 0230. 8247. 6264. 7278. 6
isted annu
259. 4262. 9265. 5270. 9
273. 2277. 8280. 2283. 3
ysnptions 2
Services
152. 4163. 3175.5188. 6204. 0221. 3242. 1262. 5282. 9
al rates
256. 1260. 2265. 0268. 9
275.0280. 5285. 8290. 3
Equals:Personal
saving
19. 926. 228.432. 540. 439. 837. 954. 160. 5
46. 254 257. 458. 5
58. 663. 661. 059.0
Per capposable
incc
Currentdollars
Dol
2,1392,2842,4362, 6052,7512, 9463, 1303,3583, 581
3, 2723, 3533,3953,410
3, 5003,5773, 6113, 633
>ita dis-personal)me
1958dollars
lars
2,0162, 1262, 2392,3362, 4042,4872,5352,5952,660
2,5702, 6062,6132,588
2, 6312,6632, 6692,676
Savingas per-cent of
dis-posablepersonalincome
(percent)
4. 96.06.06. 47. 46.76.07.98.2
6. 97. 98. 28. 3
8. 18. 68. 17.8
Popula-tion
(thou-sands) 3
189, 197191, 833194, 237196, 485198, 629200, 619202, 599204, 800207, 006
204, 012204, 526205, 107205, 729
206, 259206, 760207, 276207, 824
1 Includes personal consumption expenditures, interest paid by consumers,land personal transfer payments to foreigners.
2 See p. 2 for total personal consumption expenditures.
3 Includes Armed Forces abroad. Annual data are for July 1; quarterly data arefor middle of period, interpolated from monthly data.
Source: Department of Commerce.
Digitized for FRASER http://fraser.stlouisfed.org/ Federal Reserve Bank of St. Louis

FARM INCOMENet farm income excluding and including inventory change (seasonally adjusted) increased about 6 percent infourth quarter.
BILUONS OF DOLLARS70
60
50
40
30
20
10
BILLIONS OF DOLLARS70
60
50
SEASONALLY ADJUSTED ANNUAL RATES
30
20
NET FARM INCOMEINCLUDING NET INVENTORY
CHANGE
\
10
J L1965 1966 1967 1969 1971
SOURCEi DEPARTMENT OF AGRICULTURE
Period
196319641965196619671968196919701971__ _ _
1970: IIIIIIIV
1971: IIIIIIIV.
Personaltotal f
Fromall
sources
20.620.623.624. 924.025. 127. 727.528.0
income rearm popu
Fromfarm
sources
12. 111.313.514. 413. 113. 214.914.214. 5
ceived bylation
Fromnonfarmsources
8.59.3
10.010. 510. 911. 912, 813. 313. 5
Realize
Total i
Billions c42.342.644.949. 749. 050. 955. 556. 658. 6Seaso
57. 957. 155. 755. 6
56. 857. 659. 360. 9
•••~ • •• "•J
d gross
Cashreceipts
frommarket-
ings)f dollars
37.437.239.343. 342. 744. 148. 149. 251. 6
naiiy adji50. 549. 748. 448. 3
49. 750. 652. 353. 8
ncome re
Produc-tion ex-penses
29.729. 530.933. 434. 836. 238. 740. 942. 9
tsted annu40. 240. 741. 241. 4
42. 242. 843. 043. 6
C ' ( ' i v < ' ( i ! r < >
Net t(oper
Exclud-ing net in-ventorychange
12.613.114.016. 314. 214. 716. 815. 715. 7
at rates17. 716. 414. 514. 2
14. 614. 816. 317. 3
in l . ' i n i m i 1
j f a rmators
Includ-ing net in-ventorychange 2
13.212.315.016. 314. 914. 816. 915. 916. 3
17. 916. 614. 614. 5
14. 915. 317. 118. 2
i\c(. inr.farm inclinventory
Currentdollars
Dol3, 7083, 5644, 4875, 0194,7304, 8545,6855, 4515, 676
6, 1205, 6804, 9904, 960
5, 1805, 3205, 9506, 330
omr perin l ine nutr change 8
1967dollars 4
iars4,0303, 8324, 7235, 1214, 7304, 6675, 2164, 7824,770
5, 4605, 0304, 3804, 310
4, 4304, 5104,9605,280
3 Cash receipts from marketings, Government payments, and nonmoriey in-come furnished by farms.
2 Inventory of crops and livestock valued at the average price for the year.Also, see footnote 2, p. 3.
3 Based on Census of Agriculture definition of a farm. The number of farms isheld constant within a year.
6
4 Income in current dollars divided by the index of prices paid by fanners forfamily living items on a 1967 base.
Source: Department of Agriculture.
Digitized for FRASER http://fraser.stlouisfed.org/ Federal Reserve Bank of St. Louis

CORPORATE PROFITS(Corporate profits including inventory valuation adjustment rose $2.2 billion (seasonally adjusted annual rate) inthe fourth quarter and regained most of the third quarter drop.
BILLIONS OF DOLLARS BILLIONS OF DOLLARS
SEASONALLY ADJUSTED ANNUAL RATES
100
PROFITS BEFORE TAXES
20
100
80
40
20
1966
SOURCE: DEPARTMENT OF COMMERCE
1972
COUNCIL OF ECONOMIC ADVISERS
[Billions of dollars; quarterly data at seasonally adjusted annual rates]
Period
19631964.1965__ ..196619671968196919701971*
1970: III...III,.IV...
1971: I....li-ra..IV ».
Con
Allindus-tries
58.966.376. 182.478.784,378.670.881. 0
69.871.573.069. 0
79. 582. 580. 082. 2
3orate pr
M
Total
28. 832.739,342. 638. 741. 736. 029. 534.4
31. 131. 530, 625. 0
34.435. 033.0
ofits (befcvaluation
anufactui
Durablegoodsindus-tries
15. 817.822. 824 020. 722. 418. 413, 016.4
14 314913. 88.8
17. 217.014 8
>re taxes)adjustme
ing
Non-durablegoods
tries
13.014.916. 618.618. 019. 317. 516. 618. 0
16. 716. 516. 816. 2
17. 218, 118. 1
and invertit
Trans-portation,
com-muni-
cations,and
publicutilities
9. 510. 111. 111. 910. 810. 610. 08.08. 5
8.27.87. 98. 1
8. 48.58.5
itory
Allother l
20.623.525. 627. 929. 132. 032. 733. 338. 1
30. 532. 234 535, 9
36. 739. 038. 6
Corpo-rate
profitsbeforetaxes
59.466.877. 884. 279. 887. 684 275. 485. 5
75. 675. 878. 571. 6
83, 086. 985. 886.2
Corpo-ratetax
liabil-ity
26. 328.331. 334 333. 239.939.734 137.8
34 134 535. 632. 3
38. 339. 137. 536. 4
Corja
Total
33. 138.446. 549. 946, 647. 844 541. 247. 6
41. 541. 342. 939. 2
44847.848. 249. 8
Dorate pifter taxe
Divi-dendpay-
ments
16. 517,819. 820. 821.423.624 425. 025.5
25. 024 925. 225. 0
25. 625. 425. 725. 3
ofits8
Un-distrib-
utedprofits
16.620.626.729. 125. 324 220.016.222. 1
16. 616. 417.714 3
19. 222.422.5245
Corpo-rate
capitalcon-
sump-tion
allow-ances 2
31.833. 936. 439. 543. 046. 851. 356. 261. 9
54 455. 756. 758. 0
59. 461.062. 7644
Profitsplus
capitalcon-
sump-tion
allow-ances 3
64872.382.989.589.694 695. 897. 4
109,5
95.996.999. 697. 2
104 2108. 7110. 91142
1 Includes all other industries and financial institutions.8 Includes depreciation and accidental damages.* Corporate profits after taxes pins corporate capital consumption allowances.
Source: Department of Commerce.
Digitized for FRASER http://fraser.stlouisfed.org/ Federal Reserve Bank of St. Louis

GROSS PRIVATE DOMESTIC INVESTMENTGross private domestic investment (seasonally adjusted) rose sharply in the fourth quarter as fixed investment rose1
and inventory investment turned positive after a decrease in the third quarter.
BILLIONS OF DOLLARS160
140
BILLIONS OF DOLLARS160
20 20
1965
SOURCE. DEPARTMENT OF CO/AMERCE COUNCIL OF ECONOMIC ADVISERS
[Billions of dollars; quarterly data at seasonally adjusted annual rates]
P*>rinH
196119621963196419651966196719681969197019711970: I
IIIIIIV _
1971: IIIIIIIV.
Totalgross
privatedomesticinvest-ment
71. 783. 087. 1940
108.1121. 4116. 6126. 0137. 8135. 3151.6131. 2134. 1138. 6137. 3143. 3152. 9150. 8159.4
Total
69. 777.081. 388. 298. 5
106. 6108. 4118. 9130. 4132. 5149. 3130.8132. 1133. 5133. 6140. 2148. 3152. 0157.0
Total
47.051. 754.361. 171. 381.683. 388.898. 6
102. 1108.7100. 8102. 1104. 8100. 8104. 7108. 3109. 3112. 6
N <
Struc
Total
18. 419. 219. 521.225.528. 528. 030. 334. 536. 838.236. 136. 637. 337. 136. 738. 538. 739.0
Fixed kn
Dnresident
tures
Non-farm
17. 718. 518. 820.524. 927.827. 329.633. 735. 937.335. 335. 736. 536. 335.837. 637. 738. 1
vestment
ial
Produceble equ
Total
28.632. 534.839.945. 853. 155. 358. 564. 165. 470.564. 765. 667. 563.768. 169. 870. 673. 6
rs' dura-ipment
Non-farm
25.829.431. 236.341.648. 450. 053.659. 260. 063. 159. 760. 661. 658. 161. 062. 462. 766.3
Residstruc
Total
22. 625. 327.027. 127. 225. 025. 130. 131. 830. 440. 630. 029. 928. 732. 835. 440. 042. 744.4
entialtures
Non-farm
22.024.826. 426.626. 724. 524.529. 531. 229. 740. 129. 429. 328. 132. 235.039. 542. 143. 8
Changeness mv
Total
2.06. 05. 95.89. 6
14.88. 27. 17.42.82.2.4
2. 15. 13.73. 14. 6
-1. 22.4
in busi-entories
Non-farm
1.75.35. 16.48. 6
15.07. 56.97. 32. 51.7. 1
1. 84. 73. 32.94. 1
-2.02.0
Source: Department of Commerce.
8
Digitized for FRASER http://fraser.stlouisfed.org/ Federal Reserve Bank of St. Louis

EXPENDITURES FOR NEW PLANT AND EQUIPMENTBusinessmen have projected a 10% percent rise in plant and equipment expenditures from 1971 to 1972. Two monthsago they projected a 9-percent increase over the same period.
BILLIONS OF DOLLARS
100
80
<50
20
BILLIONS OF DOLLARS1 100
SEASONALLY ADJUSTED ANNUAL RATES
TOTAL NEW PLANT AND EQUIPMENT
1966
..»»»**„.«••""""
J L1967
NONMANUFACTURING
"'""".„ ....
1968
MANUFACTURING
1969 1970 1971
J7 ; J/ t J/
80
60
40
20
J/SEE FOOTNOTE 3 BELOW.SOURCES: SECURITIES AND EXCHANGE COMMISSION AND DEPARTMENT OF COMMERCE
1972
COUNCIL OF ECONOMIC ADVISERS
[Billions of dollars; quarterly data at seasonally adjusted annual rates]
Period
196219631964_ _. _ ._19651966196719681969197019711972s
1971: IIIIIIIV
1972: I3 _ _II3
2d half 3
Total i
38.3940.7746. 9754. 4263. 5165. 4767. 7675. 5679. 7181.2189.77
79. 3281. 6180. 7583. 18
87. 5489. 0991. 08
M
Total
15. 0616. 2219. 3423. 4428. 2028. 5128. 3731. 6831. 9529. 9932. 61
30. 4630. 1229. 1930. 35
31. 9232. 5232. 96
anufactui
Dur-able
goods
6. 797. 539. 28
11. 5014. 0614. 0614. 1215. 9615. 8014. 1516. 11
14. 2114. 0613. 7614. 61
15. 6215. 9816. 38
"ing
Non-durablegoods
8. 268. 70
10. 0711. 9414. 1414. 4514. 2515. 7216. 1515. 8416. 50
16. 2516. 0615.4315. 74
16. 3016. 5416. 58
Mining
1. 401. 271. 341. 461. 621. 651. 631. 861. 892.162.20
2. 042. 082. 232. 30
2. 222. 122. 23
Tra
Rail-road
1. 021. 261. 661. 992. 371. 861. 451.861. 781.671.75
1. 461.881. 721. 64
1. 901. 671. 71
nsportat
Air
0. 52. 40
1. 021. 221. 742. 292.562.513. 031. 882. 42
1. 292. 281.682. 26
2. 022. 962. 33
ion
Other
1. 651. 581. 501. 681. 641.481. 591. 681. 231. 381. 55
1. 331. 401.481. 33
1.671. 351. 60
Publicutilities
4. 904. 985. 496. 137. 438. 74
10. 2011. 6113. 1415. 3017. 44
14. 6414. 9115. 8715. 74
16. 9016. 7817. 96
Com-muni-cation
3. 854. 064. 615. 306. 026. 346.838. 30
10. 1010. 7712. 30
10. 7011. 2110.7310. 44
303132
Com-mercial
andother 2
9. 9910. 9912. 0213. 1914.4814. 5915. 1416.0516.5918.0519. 51
17.3917.7217.8519. 10
. 90
.70
. 301 Excludes agricultural business; real estate operators; medical, legal, educa-
tional, and cultural service; and nonprofit organizations.-Includes trade, service, construction, finance, and insurance.3 Estimates based on expected capital expenditures as reported by business
in late January and February 1972. Includes adjustments when necessary forsystematic tendencies in expectations data.
NOTE.—Annual total is the sum of unadjusted expenditures; it does not
necessarily coincide with the average of seasonally adjusted figures.These figures do not agree with the totals included in the gross national product
estimates of the Department of Commerce, principally because the latter coveragricultural investment and also certain equipment and construction outlayscharged to current expense.
Sources: Securities and Exchange Commission and Department of Commerce:
Digitized for FRASER http://fraser.stlouisfed.org/ Federal Reserve Bank of St. Louis

EMPLOYMENT, UNEMPLOYMENT, AND WAGESSTATUS OF THE LABOR FORCEThe civilian labor force declined by 172,000 (seasonally adjusted) in February with the bulk of the net reductionoccurring among the unemployed. Total employment was about the same in February as in January but up sharplyfrom 1971.
MILLIONS OF PERSONS*
90
85
80
75
70
65
SEASONALLY ADJUSTED
CIVILIAN LABOR FORCE
UNEMPLOYMENT
\
I » I I I I I I ! » I I I I I I i i i i i I i » i i i
MILLIONS OF PERSONS*1 90
85
80
75
70
65
i i i i i i t t t i i
PERCENT OF CIVILIAN LABOR FORCE PERCENT OF CIVILIAN LABOR FORCE
u
ir
NE/
j\
sAf
1
>L
?<
O
>6
Y/v\ EhJT */VT E
\;
1967r
• - ]"
196?J
(
sE/^S Oh<IA
1
IL
9<
/
W
AC JL SI ED
!-i
9
r—
7()
^-:-1
-
1
197
-1
1972
*16 YEARS OF AGE AND OVER.SOURCE,- DEPARTMENT OF IABOR COUNCIL OF ECONOMIC ADVISERS
Period
196719681969.._1970_._1971___
1971:Jan..Feb_Mar.Apr._May-June.July.Aug_Sept.Oct..Nov_Dec_
1972:Jan*>Feb__
Totallaborforce
(includ-ing
ArmedForces)
80, 79382, 27284, 23985, 90386, 929
85, 62885, 65385, 59885, 78085, 95487, 78488, 80888, 45386, 88487, 35287, 71587, 541
87, 14787, 318
Civiliaployi
Total
74, 37275, 92077, 90278, 62779, 120
Unadji
77, 23877, 26277, 49378, 20478, 70979, 47880, 68180, 61879, 29580, 06580, 20480, 188
79, 10679, 366
\,n em-nent
XTJNon-agn-cul-
tural
Thous70, 52772, 10374, 29675, 16575, 732
tsted
74, 36174, 41574, 45274, 69975, 11175, 55976, 71076, 85375, 85176, 59576, 94277, 240
76, 23776, 458
Unem-ploy-ment
ands of f2,9752,8172,8314,0884,993
5,4145,4425,1754, 6944, 3945, 4905, 3305,0614, 8404,5704,8154,695
5,4475,412
Totallaborforce
(includ-ing
ArmedForces)
>ersons 1680, 79382, 27284, 23985, 90386, 929
86, 70686, 81186, 38586, 67086, 83686, 21786, 72787, 08887, 24087, 46787, 81287, 888
88, 80188, 075
Civilianlaborforce
years of77, 34778, 73780, 73382, 71584, 113
*
88, 78088, 86188, 45588, 78883, 98683, 40183, 98084, 31384, 49184, 75085, 11685, 225
85, 70785, 585
Civilia
Total
age and o74, 37275, 92077, 90278, 62779, 120
Seasonally
78, 71878, 47578, 44678, 73278, 83078, 60079, 01479, 19979, 45179, 83280, 02080, 098
80, 63680, 628
in emplo
Agri-cul-tural
ver3,8443,8173,6063,4623,387adjusteo
3,4068, 2853, 8873,5403,4123,3013,3748,4078,8633,4163,4193,400
8,8938,357
yment
XTJNon-agri-cul-tural
70, 52772, 10374, 29675, 16575, 732
I
75, 31275, 19075, 05975, 19275, 41875, 29975, 64075, 79276, 08876, 41676, 60176, 698
77, 24377, 266
Unem-ploy-ment
2,9752,8172,8314,0884,993
5,0124, 8865, 0095,0565, 1564,8014,9165, 1145,0404,9185,0965,127
5,0714,912
Unemplrate (pe
civiliafor
Unad-justed
3.83.63. 54. 95.9
6.66. 66.35. 75. 36. 56.25.95.85.45. 75.5
6. 46. 4
oymentrcent ofn laborce)Season-ally ad-justed
Percent
6.05.96.06. 06. 15. 8o. 96.16. 05. 86.06.0
5. 95. 7
Laborforce
partici-pationrate,unad-
justed l
60. 660.761. 161. 361. 0
60.560. 560. 360.460.461. 662.261. 960.760. 961. 160. 9
60. 260.3
i Total labor force as percent of noninstitutional population,Source: Department of Labor.
10
*Data beginning January 1972 not strictly comparable with prior data becauseof adjustment to the 1970 Census data, which added 333,000 to the civilian laborforce and 301,000 to civilian employment.
Digitized for FRASER http://fraser.stlouisfed.org/ Federal Reserve Bank of St. Louis

SELECTED MEASURES OF UNEMPLOYMENT AND PART-TIME EMPLOYMENT'At 5.7 percent (seasonally adjusted) the overall unemployment rate in February was down by 0.2 percentage pointfrom January. The jobless rate for married men, at 2.8 percent, was at its lowest point since August 1970.
PERCENT10 [
UNEMPLOYMENT RATE,ALL CIVILIAN WORKERS UNEMPLOYMENT RATE, EXPERIENCED
WAGE AND SALARY WORKERS
1966 1972
SOURCE: DEPARTMENT OF LABOR COUNCIL OF ECONOMIC ADVISERS
Period
. _
19671968196919701971
1971: JanFebMarAprMavJuneJulvAugSeptGetNovDec
1972: Jan. _ ._.Fob
Unen(percen
for
Allworkers
3.83.63.54.95. 9
6.05. 96.06.06. 15.85. 96. 16.05. 86. 06. 0/>. 9fy. 7
iployment of civili*ce in grou
Experi-enced
wage andsalary
workers
Per3. 63.43.34. 85. 7
Seasonall5. 85. 65. 85. 75. 95.55. 65. 75. 75.55. 75.85.65. 6
t ratein laborP)
Marriedmen(wife
present)
cent1.81.61. 52.63. 2
?/ adjusted& G>O. O& &O. &
S. 2S. 23.2S. 13. 1at q>o. <&s.s3. 03.83. 23.02. 8
Laborforce
time lost J
4. 24.03. 95.36. 4
6.66.46. 56. 56. 65. 66. 36. 56. 36. 56.46.46.46. 1
Over 40hours
20, 92020, 60020, 60818, 92519, 095
19, 07018, 46319, 44818, 20719, 50519, 06917, 80517, 94919, 96419, 16920, 24920, 23919, 17619, 362
Persons
35-40hours
Thousan32, 61632, 65834, 20133, 53735, 752
I
35, 68733, 88135, 83035, 76736, 54036, 72334, 52835, 30736, 88832, 95737, 49537, 42836, 82036, 460
at work iby hours
Total
cle of pers13, 29014, 78515, 21018, 22216, 298
Jnadjustec16, 57618, 96616, 26716, 65016, 04114, 64613, 89813, 32915, 08121, 03916, 29416, 79917, 00817, 360
n nonagnworked p
Ur
Part-tieconomic
Usuallyfull-
time 3
ons 16 yej1,060
895955
1,2011,184
i
1, 4421,2671,2841,2421, 1021, 1421,0941, 2621,1261,0801, 1201, 0451,220
5 1, 147
cultural in>er week 2
ider 35 ho
me fors reasons
Usuallypart-time 4
ire of age853820855995
1,256
9731, 1231,093
9881,0811,5151,9391,7521,0941, 1661, 1911, 1531, 101
8 1, 087
idustries
urs
Part-tieconomi<
Usuallyfull-
time 3
and over
Seasonall
1,3541, 2451,2661,2991,219
9911,1481,147It0761,1481,2631,0841,1461,127
me for3 reasons
Usuallypart-time4
y adjusted
l,l$41,$161,2091,2051,2761,2091,S901,2781,2361,3541,8411,3041,2831,176
» Man-hours lost, by tlio unemployed and persons oil part-time for economicreasons as a percent of potentially available labor force man-hours,t "Differs from total noiumricuitural employment (p. 10), which includes per-sons with jobs but not at work for such reasons as vacation, illness, bad weather,arid industrial disputes.
3 Includes persons who worked part-time because of slack work, materialshortages or repairs, new job started, or job terminated.
4 Primarily includes persons who could find only part-time work.5 Average hours worked: usually full-time, 24.4; usually part-time, 18.S.Source: Department of Labor. 11
Digitized for FRASER http://fraser.stlouisfed.org/ Federal Reserve Bank of St. Louis

UNEMPLOYMENT INSURANCE PROGRAMSIn February, insured unemployment under Stare programs averaged 256,000 lower than a year earlier. The seasonal!adjusted insured unemployment rate at 3.5 percent was little changed from the January rate.
MILLIONS OF PERSONS MILLIONS OF PERSONS
WEEKLY INSURED UNEMPLOYMENT(STATE PROGRAMS)
1971
\
1970
! f fJAN. FEB. MAR. APRIL MAY JUNE JULY AUG. SEPT. OCT. NOV. DEC
SOURCE; DEPARTMENT OF LABOR COUNCIL OF ECONOMIC ADVISERS
Period
1968196919701971 "1971: Jan
FebMarApr___MayJuneJulyAug _ - _ _ >SeptOct»- _ _ _ - _ _Nov* _ _Dec" _ _
1972: Jan*__Feb*_
Week ended1972: Feb 5 __ _
12___ _1926
Mar 4 P
11*
A
Coveredemploy-
ment
Thou57, 97759, 99959, 526
11 progran
Insuredunem-ploy-ment
(weeklyaver-age)
sands1, 1871, 1772,0702, 3133, 1943, 2163,0912,7562,4432,3322,4312, 3492, 1742, 1292,3112,6663,0973, 186
3, 1163, 1813, 1613, 1183,057
is
Totalbenefits
paid(mil-lions
of dol-lars)
2, 191. 02, 298. 64, 170. 14, 963. 3
568. 1599. 3683.7586. 0470. 8494.8467.7483. 1418.5388. 5430.7514.6481. 8492. 1
Insuredunem-ploy-ment
Weekly t1, 1111, 1011, 8052, 1502,7992,7512,5772,2832,0011,8931, 9931, 9121,7391, 7161, 8792, 2212,5242, 495
2, 5062, 5512,4682,474
*2, 411
Initialclaims
iverage, t201200296295427321275257238250342282236252298358385293
342319279252264257
St«
Exhaus-tions
housands161625373939414442433735333131323738
ite progra
Insurecploymencent of
emplo
Unad-justed
Pen2. 22. 13. 44. 15. 25. 24.84. 33. 83. 63. 83. 63.33. 23. 54. 24. 84. 7
4.74. 84. 74.74.6
ms
unem-t as per-coveredyment
Season-ally ad-justed
sent
3. 83. 83. 94.04.24.24.14.24.34.44.23. 83.43.6
Benefit
Total(mil-
lions ofdollars)
2, 031. 62, 127. 93, 848. 54, 694. 5
527. 2557.9635. 4541.9433. 0452. 7425.4433.6377.8348. 3387.0467. 9449. 6461. 3
s paid
Averageweeklycheck
(dollars)
43. 4346. 1750. 3455. 4952. 8353. 1253. 0052. 7152. 3252. 0955.2356. 0856. 2553.0753.3157.8557.4057. 16
i Not charted.
12Source: Department of Labor. NOTE.—For definitions and coverage, see the 1967 Supplement to Economic
Indicator Si
Digitized for FRASER http://fraser.stlouisfed.org/ Federal Reserve Bank of St. Louis

NONAGRICULTURAL EMPLOYMENTRotal nonfarm payroll employment rose by 83,000 (seasonally adjusted) in February. Job increases were concentratedin the service-producing industries. Manufacturing employment was little changed in February.
MILLANC76
72
68
64
-^
40
36
24"
20
16
12
8
IONS OF WAGE> SALARY WORKE
~
ALL
/
-
/
C~*
, , , , , , ! , , , , ,1969
SOURCE: DEPARTMENT C
RS (SEASONALLY ADJ
NONAGR1CULTUESTABLISHMENTS
1NONMANUFACT
(PRIVATE)
MANUFACTURING
"""•" -x..-
3OVERNMENT
....A...-
I 1 1 I 1 t I ! 1 f !
1970
)F LABOR
JSTED)
RAL
URING
I 5
I .
t 1 ! 1 1 I ! ! 1 ! I
1971
*~
*••^
V.
•*
^
•II
r,.
t 1 1 ! I ! 1 I t t IK
1972
MILAN
16
14
12
^ ;
12
^ 10
8
;
4
2
LIONS OF WAGED SALARY WORKE
(ENLARGED SCX
r~~~" — -
WH(
W***"1"""1
_
HM'""11""""""*
_
_
;
-
/|l 1 ! 1 1 ! 1 t ! t !
K 1969
RS (SEASONALLY ADJ
VLE)
• .. i •*-
, ^)LESALE AND RE
****i*"*"rSERVICES
DUMANUF
•««»
wNONDL
MANUFAC
^
CONTRCONSTRL
/
i i , i i 1 . i , . i1970
LISTED)
,— • 1
"AIL TRADE
-=CT«— - «*
RABLEACTURING-\
\"•'•ntHuiu naun,
JRABLE:TURING
,..,«*iB.im,.,
ACTCTION
I 1 1 I t 1 1 ! 1 1 !
1971
COUNCIL
00
-
>-
_
•It
-
„. '•
"~
-
1 ! t I 1 ( 1 t t 1 | K
1972 "
OF ECONOMIC ADVISER!
-
x
J
[Thousands of wage and salary workers;* seasonally adjusted]
Period
1966196719681969197019711971: Jan..
Feb__Mar..Apr..May.June.July..Aug..Sept..Oct...Nov..Dec..
1972: Jan*_Feb".
Total
63, 95565, 85767, 91570, 28470, 61670, 69970, 45470, 39170, 48070, 59970, 76970, 65770, 53170, 52970, 85370, 84871, 04271, 18571, 60371, 686
Manufa(
Total
19, 21419, 44719, 78120, 16719, 36918, 61018, 74718, 68418, 60918, 63918, 70218, 60818, 53318, 45718, 61618, 56018, 60318, 56618, 61118, 627
jturing (]
Durablegoods
11, 28411, 43911, 62611, 89511, 19810, 59010, 69710, 64210, 57110, 59810, 65110, 59810, 55210, 48510, 59710, 56110, 57210, 54810, 57310, 588
private)
Non-durablegoods
7, 9308,0088, 1558,2728, 1718, 0208,0508, 0428, 0388, 0418,0518,0107, 9817, 9728,0197,9998,0318,0188, 0388,039
Total
33, 95035, 01236, 28837, 91538, 71239, 23138, 98838, 96339, 07939, 12939, 20939, 21139, 18639, 22939, 38239, 35339, 45239, 58139, 90639, 929
N
Mining
627613606619622601625622622623622619597609616521525607615613
onmanu
Con-tractcon-
struc-tion
3, 2753, 2083, 2853,4353, 3453,2593,2713, 1983,2643, 2823, 2753, 2553, 2283,2193, 2503,2903, 3203,2453,3183,236
faeturing
Trans-porta-tionand
publicutilities
4, 1514,2614,3104,4294,5044,4814, 5074, 5264, 5204, 5054,5184, 5004, 4764,4284,4604,4424, 4344,4654, 5114,499
5 (private
Whole-saleand
retailtrade
13, 24513, 60614, 08414, 63914, 92215, 17415, 03915, 05915, 07415, 10715, 14815, 13515, 15815, 22315, 27315, 27015, 27815, 31515, 45115, 514
)
Finance,insur-ance,andreal
estate
3, 1003, 2253,3823,5643, 6903,8003,7463, 7493, 7583, 7693, 7883, 8073, 8063, 8043, 8213, 8343,8513,8603,8763,882
Services
9,55110, 09910, 62311, 22911, 63011, 91711, 80011, 80911, 84111, 84311, 85811, 89511, 92111, 94611, 96211, 99612, 04412, 08912, 13512, 185
Gover
Federal
2, 5642,7192,7372,7582,7052, 6642,6612, 6622, 6622,6672, 6672, 6402,6432, 6502. 6742,6752,6692,6692,6672,667
ament
Stateandlocal
8,2278, 6799, 1099,4449, 830
10, 19410, 05810, 08210, 13010, 16410, 19110, 19810, 16910, 19310, 18110, 26010, 31810, 36910, 41910, 463
»Includes all full- and part-time wage and salary workers in nonagricultural•establishments who worked during or received pay for any part of the pay periodwhich includes the 12th of the month. Excludes proprietors, self-employed per-sons, domestic servants, and personnel of the Armed Forces. Total derived from,this table not comparable with estimates of nonagricultural employment of theCivilian labor force, shown on p. 10, which include proprietors, self-employed
persons, and domestic servants; which count persons as employed when theyare not at work because of industrial disputes; and which are based on an enu-meration of population, whereas the estimates In this table are based on reportsfrom employing establishments.
Source: Department of Labor. 13
Digitized for FRASER http://fraser.stlouisfed.org/ Federal Reserve Bank of St. Louis

WEEKLY HOURS OF WORK - SELECTED INDUSTRIESThe average workweek of production workers in private nonfarm industries rose 0.2 hour (seasonally adjusted) irFebruary. The workweek of factory workers rose 0.4 hour over the month.
HOI46
44
42
40
38
36
34
JRS PER WEEK (SEA
TOTAL NO
1 .
<jj, 1 1 1 1 1 1 M,I i1969-
SONALLY ADJUSTED)
lAGRICULTUR^
. . l . . . l . f . .T . t
1970
vL PRIVATE
•—— *-*^^ -*-l
I 1 1 1 1 I! I 1 ! I
1971
^^
1 1 I 1 1 I 1 1 1 1 IK
1972
HO46
44
42
40
38
36
34
JRS PER WEEK <SE>
MANUFACTl
V *
A\ 1 t I 1 1 I I 1 1 1
1969
TONALLY ADJUSTED)
JRING
r^^1 1 1 1 1 1 1 1 1 1 1
1970
p--xX1
I 1 I 1 1 1 I 1 M 1
1971
*l
1 ! 1 1 1 I 1 I I 1 IK
1972 "
42
40
38
36
34
32
30
CONTRACT CONSTRUCTION
t i n t i1969 1970 1971 1972
SOURCE, DEPARTMENT OP tABOR
42
40
38
36
34
32
30
RETAIL TRADE
1969 1970 1971 1972
COUNCIL OF ECONOMIC ADVISERS
[Average hours per week1]
Period
196219631964 . .19651966.,.1967 ...1968196919701971.1971: Jan
FebMarAprMayJuneJulyAugSeptOctNovDec
1972: Jan *Feb 9
Totalnonagri-culturalprivate 2
3a738. 838.738.838. 638. 037. 837.737. 137.036.636.636.836. 736.837.337.337.437.037.037.037.336. 736.8
Manufac-turing
Unad
40. 440.540. 741. 241. 340. 640.740. 639.839. 939.639.439. 739. 540. 040. 239.839.839.840.040.240.739.840.0
Contractconstruc-
tion
Justed
37. 037. 337. 237.437. 637.737. 437.937. 437.336. 035. 537. 137.037.038.038.138. 336. 938.237.936. 535. 836.0
Retailtrade 3
37. 437. 337. 036. 635. 935. 334. 734. 233.833. 733. 133. 133.133. 333. 334.034. 834. 733. 733. 533.434. 133. 233.2
Totalnonagri-culturalprivate 2
36. 987.087. 087. 086. 987.186. 986. 986. 787. 087. 187. 237. 087. 2
Manufac-i turingi
Seasonail}
39. 889. 889.889. 840. 040. 040. 039.889.589.840.140.8
40.040.4
Contractconstruc-
tion
7 adjusted
87. 686. 887. S87. 186. 837.287. 137.135. 737.689. 086.887.437. 3
Retailtrade 3
83.6S3. 683. 533. 7Q<2? *yOO. 4
S3. 788.8S3. 6S3. 600 0OO. O
83. 783.9e>& iyOO. i<z?e? fyoo. i
*Data relate to production workers or nonsupervisory employees.•Ala) Includes other private Industry groups shown on p. 13.8 Includes eating and drinking places.
14
Source: Department of Labor.
Digitized for FRASER http://fraser.stlouisfed.org/ Federal Reserve Bank of St. Louis

AVERAGE HOURLY AND WEEKLY EARNINGS - SELECTED INDUSTRIESAverage hourly earnings of private nonfarm production workers were unchanged between January and Februaryat $3.54. Weekly earnings rose slightly, reflecting a longer workweek.
DOLLARS DOLLARS
6.00
5.00
4.00
3.00
2.00
AVERAGE HOURLY EARNINGS
/"I
MANUFACTURING
i i i i I t t i i j1969
1 \CONTRACT
CONSTRUCTION
TOTAL NONAGRICULTURALPRIVATE
RETAIL TRADE
1970 1971
240
200
160
120
80
AVERAGE WEEKLY EARNINGS
'V V
1972 1969
MANUFACTURING
CONTRACTCONSTRUCTION
TOTAL NONAGRICULTURALPRIVATE
1970
--\-RETAIL TRADE
, ! , , , , ,1971
1 1 I 1 I 1 I 1 I
1972
SOURCE* DEPARTMENT OF UBOR COUNCIL OF ECONOMIC ADVISERS
[For production workers or nonsupervisory employees]
Period
19621963196419651966196719681969197019711971: Jan
FebMarAprMay_ _JuneJulyAugSeptOctNov—_ _Dec
1972: Jan "Feb"
Average \
Totalnonagri-culturalprivate 1
$2. 222. 282.362. 452. 562. 682, 853. 043. 223. 433. 333. 353. 363. 383. 413. 423.433. 453. 493. 493. 483. 513. 543. 54
lourly earn
Manu-factur-
ing
$2. 392.462.532. 612. 722. 833. 013. 193. 363. 573. 503. 513. 523. 543. 553. 573. 573. 563. 603.603. 603. 693. 703.71
ings — curr<
Contractcon-
struc-tion
$3. 313.413.553.703. 894. 114.414. 795. 255. 725. 535. 565.545. 555.655. 635. 685. 755. 865. 90r>. 905. 935. 985. 98
3nt dollars
Retailtrade 2
$1. 631. 681.751.821.912.012. 162. 302. 442.572.522. 542. 552. 562. 572. 582.582. 572. 602. 602. 602. 612. 652. 66
Average v
Totalnonagri-culturalprivate 1
$85. 9188. 4691.3395. 0698. 82
101. 84107. 73114. 61119. 46126. 91121. 88122. 61123. 65124. 05125. 49127. 57127. 94129. 03129. 13129. 13128. 76130. 92129. 92130. 27
weekly earn
Manu-factur-
ing
$96. 5699. 63
102. 97107. 53112. 34114. 90122. 51129. 51133. 73142. 44138. 60138. 29139. 74139. 83142. 00143. 51142. 09141. 69143. 28144. 00144. 72150. 18147. 26148. 40
ings — curr
Contractcon-
struc-tion
$122. 47127. 19132. 06138. 38146. 26154. 95164. 93181. 54196. 35213. 36199. 08197. 38205. 53205. 35209. 05213. 94216. 41220. 23216. 23225. 38223. 61216. 45214. 08215. 28
3nt dollars
Retailtrade 2
$60. 9662. 66647566.6168.5770.9574.9578. 6682.4786. 6183.4184.0784.4185.2585.5887.7289.7889. 1887.6287. 1086.8489.0087. 9888.31
Manufsindu,
Adjustedhourly
earnings.1 QA7i on s
85.787. 890. 392. 695. 7
100. 0106. 2112.6119. 7127. 7124. 8125. 3125. 8126. 5126. 9127. 3127. 8128. 3129. 1128.9129.0131.7132.8132.7
icturingBtries
Averageweeklyearn-ings,1967
dollars 4
$106. 58108. 65110. 84113. 79115. 58114. 90117. 57117. 95114. 99117. 43116. 28115. 82116. 64116. 33117.55118. 12116.66116. 04117. 25117. 65118. 04122. 00119. 53
1 Also includes other private Industry groups shown on p. 13.2 Includes eating and drinking places.a Earnings in current dollars adjusted to exclude the effects of overtime and
Interindustry shifts.
1 Earnings in current dollars divided by the consumer price index.Source: Department of Labor.
15
74-920°—72-Digitized for FRASER http://fraser.stlouisfed.org/ Federal Reserve Bank of St. Louis

PRODUCTION AND BUSINESS ACTIVITYINDUSTRIAL PRODUCTIONIn February, industrial production (seasonally adjusted) rose 0.7 percent, following a revised 0.6 percent rise inJanuary. The annual rate of increase since the 1971 low of August was 7.2 percent.
Index, 1967=100 (SEASONALLY ADJUSTED)130
120
Index, 1967=100 (SEASONALLY ADJUSTED)150
100
901969
SOURCEr BOARD OF GOVERNORS OF THE FEDERAL RESERVE SYSTEM COUNCIL OF ECONOMIC ADVISERS
[1967=100, seasonally adjusted]
Period
196219631964196519661967196819691970_1971" _ - _1971: Jan
FebMar __AprMayJuneJuly.AugSeptOct.-- ._-NovDec.-
1972: Jan*.Feb"
Totalindus-trial
produc-tion
72.276. 581.789.297.9
100. 0105. 7110. 7106. 7106.4105.3105.7105. 5106. 2107. 0107.2106. 1105. 3106.2106.4107. 0107.6108. 2109.0
M,
Total
71.475.881. 289. 198. 3
100. 0105. 7110. 5105. 2104.8103. 3103.9103. 2104. 4105. 7105. 6104. 9103. 6104.9105.4105.3105.7106. 4107. 2
anufaetur
Durable
69. 073. 579. 088.599.0
100.0105. 5110. 0101. 598. 998. 198. 698.399. 1
100. 5100. 199. 496.698. 599. 198.098.499. 4
100.4
Industry
ng
Non-durable
75. 179. 284. 490. 097. 3
100.0106. 0111. 1110. 6113. 3110. 9111. 7110. 4112. 1113. 3113. 7113. 0113.8114. 2114. 6115.9116. 2116. 5117. 1
Mining
85.689.091. 193.998. 4
100. 0103. 9107. 2109.7107. 0111. 1110. I111. 4110. 4108. 6108.9105. 7106. 5106.097.7
102.3107.7107. 8108. 1
Utilities
70. 275. 181.986. 993. 6
100. 0109. 4119. 5128. 5135. 4129. 6132. 2131. 5133. 2132. 1135.6138. 7137.0138.4139.3139.6136.5138.3139.5
Fi
Total
70. 874. 979. 686. 896. 1
100. 0105. 8109. 0104. 41044102. 9103. 0102. 5103. 6103. 9104.5104. 9105.0104.6105.3105.9105. 6106. 0106. 7
aal produ
Con-sumergoods
77.782. 086. 893. 098. 6
100. 0106. 6111. 1110. 3115.6112. 8112.9112.7114. 6115. 7116. 1116. 0116. 0115.0116. 9118.2117.7118.3119. 0
Market
cts
Equip-ment
61. 965. 670. 178.793.0
100. 0104. 7106. 196. 188.988. 989. 388. 488. 187.888.289. 389.690.289.088.888.688.889. 5
T .Inter-mediateproducts
76.981. 187. 393. 099. 2
100.0105.7112.0111. 9112. 8110. 9112. 5112. 0112.4113.5112.4113. 8110. 7112. 5113.0114.0114.9115.5116. 1
TV, 'I ofo
rials
72.477. 082. 691.099.8
100.0105. 7112. 4107.8106. 8106. 5106. 8107. 1107. 5108.9109.0105. 3104.0106.2105.6106.0107.5108.4109.7
Source: Board of Governors of the Federal Reserve System.
16
Digitized for FRASER http://fraser.stlouisfed.org/ Federal Reserve Bank of St. Louis

PRODUCTION OF SELECTED MANUFACTURESProduction of most durable and nondurable manufactures (seasonally adjusted) rose in February. The largest gainswere in transportation equipment and primary metals—about 2 percent each.
Index, 1967=100 (SEASONALLY ADJUSTED) Index, 1967=100 (SEASONALLY ADJUSTED),130
CHEMICALS, PETROLEUM,AND RUBBER
1001969 1972
SOURCE: BOARD OF GOVERNORS OF THE FEDERAL RESERVE SYSTEM COUNCIL OF ECONOMIC ADVISERS
[1967 = 100, seasonally adjusted]
Period
1962196319641965196619671968196919701971 v
1971: JanFebMar_ _ _ _Apr_ _ _MayJune _ _ _ -. -JulyA u g _ _ _ - _ _ __ _ .SeptOctNov _ .. ^Dec__
1972: Jan *Fcb"__ _. _
Primarymetals
78.284. 395. 7
104. 0108. 8100. 0103. 2114. 1106. 9100. 9
108. 1105. 5106. 6108. 71 14. 310S. 198. 281. 093. 995. 791.494. 4
101. 3102. 8
Durab
Fabri-catedmetal
products
75. 978.483. 392. 6
100. 5100. 0106. 3113. 6109. 4107. 3
105. 4106. 6104. 9108. 5108. 5108. 5110. 8108. 0105. 7106. 9106. 9107. 7
106. 4107.7
le manufc
Machin-ery
64.867.974. 384. 198. 6
100. 0101. 9106. 8100.495.5
93.494. 294. 094. 295. 395.297.495. 696. 397.096.396. 7
97. 197. 0
ictures
Transpor-tationequip-ment
69.375. 979. 691. 3
101. 2100. 0109. 7107. 690. 391. 3
91. 192. 691. 389. 590. 991.788. 591. 191.792.491. 689. 8
89. 391. 1
Lumberand
prod-ucts
82.085. 891. 094. 798. 4
100. 0104. 8108. 6106. 3113.4
109. 7110. 8110. 3112. 5110. 0111. 0115. 4113. 1113. 9117. 3117. 9119.4
123.2
Nc
Textiles,apparel,
andleather
84. 386. 991. 997. 8
101. 7100. 0104. 9105. 9100. 2100. 7
98. 698.097. 399.8
101. 5102.4100. 2100. 1102. 5102. 2101.6103. 9
102. 2102.4
mdurable
Paperand
print-ing
74.378.484. 590. 598. 9
100. 0104. 2109. 1107. 8107. 8
107. 1108. 1104. 6106. 9106. 9106.0106. 8108. 2108.3109.0110.6110.8
112. 3112.7
manufactu
Chemicals,petro-
leum, andrubber
64.570.075.983. 894. 1
100. 0109. 6118. 4118. 2124.3
118. 2120. 9120. 5122. 4124. 2125. 3124. 0126. 2127.3126. 5127.8127.8
128.4129. 2
res
Foods
tobacco
84. 087. 090. 692. 697.0
100. 0103. 6107. 5110. 8113. 4
113. 9113. 1112. 2112.9113. 6113. 7113. 8112. 8111. 1113.2115. 6115. 0
115. 6115. 9
Source: Board of Governors of the Federal Reserve System.
17Digitized for FRASER http://fraser.stlouisfed.org/ Federal Reserve Bank of St. Louis

WEEKLY INDICATORS OF PRODUCTIONProduction of steel, autos, and trucks increased during February and early March.
MILLIONS OF TONS MILLIONS OF SHORT TONS
STEEL
1 \l I l I I i I l I i I I I I I | I I I I I I I i | I i i I I I I I I I I i I I I I i I I I I 1 I I I.y-. . -_ _ __ " * ~
BILLIONS OF KILOWATT HOURS40
25
200
100
SOURCES: AMERICAN IRON AND STEEl INSTITUTE, DEPARTMENT OF THE INTERIOR,EDISON ElECTRIC INSTITUTE. AND WARD'S AUTOMOTIVE REPORTS COUNCIL OF ECONOMIC ADVISERS
Period
Weekly average:1965 _.196619671968196919701971 »1971: Jan
FebMar _ _ _Apr _ _MayJuneJulyAug___SeptOct —NovDec.__
1972: JanFeb*___ .
Week ended:1972: Feb 12
1926
Mar 411"
Steel piThousands
of nettons
2,5212,5722,4402,5152,7092,5222,3062, 5452, 7192,8542,9292, 9172, 6782, 2491, 3031,7941,8531,8771,9872,2582,412
2, 3622,4162,4392,4872, 553
'oducedIndex
(1967=100)
103. 3105. 4100.0103. 1111. 0103. 4945
104.3111.4117. 0120. 0119. 5109. 892.253.473.576.076.981.592. 598.9
96. 899.0
100.0101. 9104.6
Electricpower
distributed(millions of
kilowatt-hours)
20, 16921, 97123, 16925, 24427, 58829, 31730, 92331, 20030, 86429, 99328, 57028, 92132, 55132, 78132, 78631, 88729, 59030, 22731, 21832, 65533, 323
33, 80632, 70532, 62731, 86832, 421
Bituminouscoal mined(thousands
of shorttons) 1
1,7351,7981,8681, 8271,8842,0121,9842,0581,9542,1022, 1972,0261, 9631,8292, 1182, 129
9061, 7632, 1181,9011, 808
1,8071,8621,7751,7652 1, 898
Freightloaded
(thousandsof cars)
562570540543543522486490486506523526525424493502445441449456465
457474462488487
Paperboardproduced
(thousandsof tons)
410446439479507489501482502516508513510467522510531521478499535
545545534550
Carassemb
Total
213.7199. 3172.9207.6195. 8158. 9204.8220. 3231. 0230. 2211. 6232. 4212. 3131.8145.7215.6233.6218. 6171. 7216. 3226. 1
223.8228.6226. 1236. 1229. 4
s and triled (thoi
Cars
179.4165. 4142.4170.1158. 1125. 9165.0181. 7188. 8188. 1170. 6190. 6169. 7106.5110. 2172. 5186. 8175. 1136. 9169. 8176. 5
174.5178.3175.8184. 6178.0
icksisands)
Trucks
34.333. 930. 537.537. 833.039.938. 542. 242. 140. 941.742.625.335.543.246. 743.534.946. 549. 6
49. 350. 350.451.551.4
1 Daily average. Includes data for Alaska.2 Not charted.
18
Sources: American Iron and Steel Institute, Edison Electric Institute, Depart-ment of the Interior, Association of American Railroads, American Paper Insti-tute, and Ward's Automotive Reports.
Digitized for FRASER http://fraser.stlouisfed.org/ Federal Reserve Bank of St. Louis

NEW CONSTRUCTIONP\ccording to preliminary estimates, expenditures for new construction (seasonally adjusted) rose about 2 percent inJanuary. Both private and public construction increased. . • • . ' - . . • •
BILLIONS OF DOLLARS140
BILLIONS OF DOLLARS140
201966
SOURCE: DEPARTMENT OF COMMERCE
1972
COUNCIL OF ECONOMIC ADVISERS
Period
196619671968196919701971
1970: NovDec
1971: JanFebMar .Apr -May__June .JulyAugSeptOctNovDec
1972: Jan*1 i Includes nonhousek<tions, not shown separa
3 F. W. Dodge series.beginning 1971 for floor 5
Total newconstruc-
tionexpendi-
tures
76. 077. 586.693.394, 3
108.7
98.3102. 6100. 6102. 3103. 0105. 9107.6109. 2110. 0111. 9110. 0113.7113.6115. 6118.3
ieping resident!tely.Kelates to 50 Sspace.
Total
52.052.059.065. 466. 178. 8
69.270.770. 670. 773. 076. 377.979. 980. 582. 181.481.883. 284. 686.8
il construction
tates beginning
Resid
Total A
Bi25, 7 125. 630.633.231.742. 1
Seasonall
34. 135. 135.636. 537. 739. 641. 542. 342. 743. 944. 745. 145. 346. 348. 5
and additions a
1970 for value
Private
entialNew
housingunits
llions of dol19.419.024. 025.924. 234. 2
y adjusted at
25. 626. 727. 628. 529. 631. 032. 934. 035. 036.637.437. 537. 638.540. 6
nd altera-C
index and
Commer-cial and
industrial
lars2626
13. 816. 216. 317.0
inual rales
15. 616. 116.416. 416. 817. 416.817. 318. 117.916. 316.517. 117.318. 1
Sources: Depaiompany, F. W.
Other
3.4
14.716. 018. 119.7
19. 519. 518.617.918. 519. 319. 620. 319.720. 220.420. 320. 920.920. 2
"tnient of Com.Dodge Divisior
Federal,State,andlocal
24. 025. 527. 628. 028. 129.9
29. 031. 930.031. 630. 129. 629. 729.329.529.828.631.830.431.031. 5
merce and McGi.
Construct! c
Total valueindex,
(1967 =100)
94.8100. 0113. 2123. 7123. 1144. 3
Seasonallyadjusted
130132117126142161141147151153154137155160165
raw-Hill Infora
>n contracts2
Commer-cial and
industrialfloor space(millions ofsquare feet)
769694779883743730
Seasonallyadjustedannual
rates648656652600785658761754728658849741824807728
aation Systems
i f\
Digitized for FRASER http://fraser.stlouisfed.org/ Federal Reserve Bank of St. Louis

NEW HOUSING STARTS AND APPLICATIONS FOR FINANCINGIn February, private housing starts rose about 8% percent to a seasonally adjusted annual rate of 2,678,000 units-another all-time high. Permits for future starts were about the same as in January.
MILLIONS OF UNITS3.0
MILLIONS OF UNITS3.0
1.0 1.0
1966 1972
SOURCES: DEPARTMENT OF COMMERCE. DEPARTMENT OF HOUSING AND URBAN DEVELOPMENT, AND VETERANS ADMINISTRATION COUNCIL OF ECONOMIC ADVISERS
[Thousands of units]
Period
19661967.1968. _ _ .196919701971"
1971: JanFeb _ _ _ _Mar _ _Apr __ _ _MavJuneJulvAug _ _ _ __SeptOct _NovDec _
1972: Jan*Feb*>__
Totalprivate
andpublic
(includ-ing
farm)
1, 195. 91, 321. 91, 545. 51, 499. 61, 469. 02, 084. 5
114. 8104. 6169. 3203. 6203. 5196. 8197.0205. 9175. 6181.7176. 4155.3150. 2152. 9
Totalprivate(includ-
ingfarm)
1, 165. 01, 291. 61, 507. 71, 466. 81, 433. 62, 052. 2
110. 6102. 2167. 9201. 1198.5193. 8194. 3204. 5173. 8179. 7173. 7152. 1148.4151. 5
Hou
Total (
Total
1, 165. 01, 291. 61, 507. 71, 466. 81, 433. 62, 052. 2
1,8101, 7931, 9381,9512, 0462,0082,0912, 2192,0292,0382,2282,4572,4712,678
sing star
including
Oneunit
778. 5843. 9899. 5810. 6812. 9
1, 151. 0
1,0071, 0051,0801, 1221, 1521, 1501, 1621, 1981, 1721, 1551, 2421,3471,4101, 315
ts
Private
I farm)
Two ormoreunits386. 4447.7608.2656. 2620. 7901. 2Seasona
803788858829894858929
1,021857882985
1, 1101, 0621,363
Coverhome p
(noni
FHA
129. 1141. 9147. 7153. 6233. 5301. 2
lly ad jus
384286266280271290288325294299293399
378
nmentrograms'arm)
VA
36. 852. 556. 151. 261. 094.0
ted annu
75738293969199
1039898
105104116118
Newprivatehousing
unitsauthor-ized 1
971. y1, 141. 01, 353. 41, 323. 71, 351. 51, 907. 4
al rates
1, 6351, 5631, 6271, 6381, 9271, 8492, 0522,0061,9002, 1731, 9522, 2922, 1052, 112
Proposeconstr
._
Applica-tions tor
FHAcommit-ments -
153. 0167. 2168. 9187. 6315. 0366. 8
366349344348375378392359343351291472
333
d homeuction
Requestsfor VA
apprais-als2
99. 2124. 3131. 7138. 2143. 7217. 9
189175186206221250234218253231207228232224
1 Authorized by issuance of local building permit; in 13,000 permit-issuing Sources: Department of Commerce, Department of Housing and Urbaiiplaces beginning 1967:12,000 for 1963-66, and 10,000 prior to 1963. Development, and Veterans Administration. 1
2 Units represented by mortgage applications or appraisal requests for newhome construction.
20Digitized for FRASER http://fraser.stlouisfed.org/ Federal Reserve Bank of St. Louis
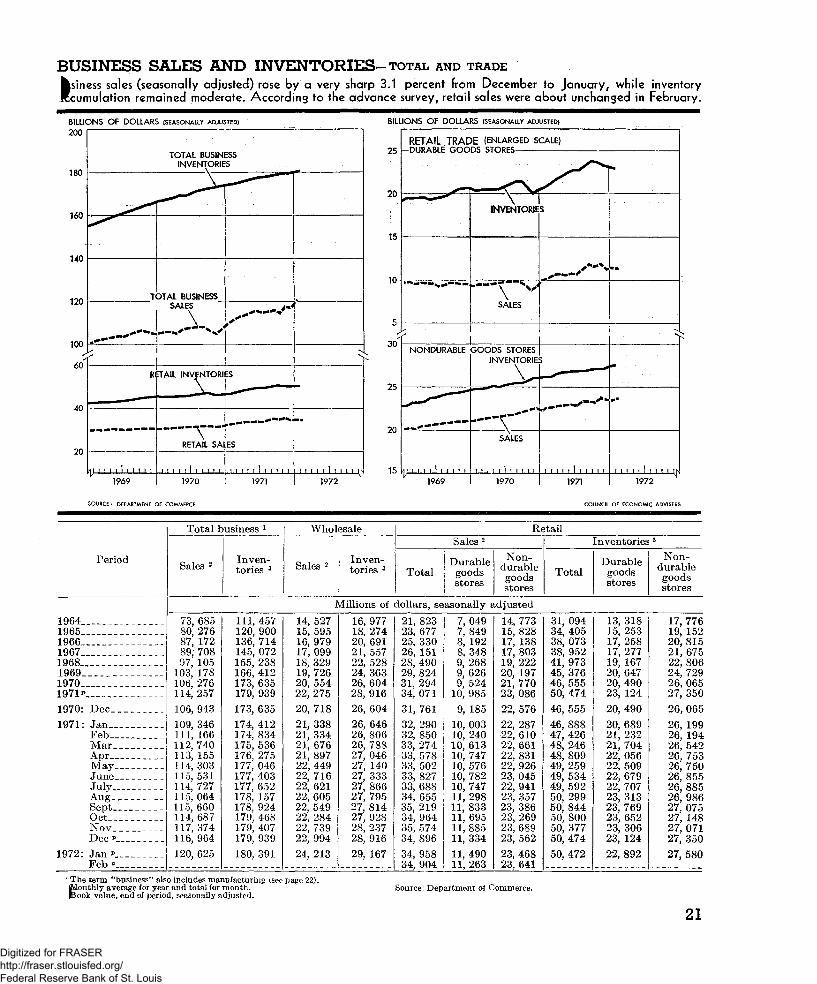
BUSINESS SALES AND INVENTORIES-TOTAL AND TRADE
tsincss sales (seasonally adjusted) rose by a very sharp 3.1 percent from December to January/ while inventorycumulation remained moderate. According to the advance survey, retail sales were about unchanged in February.
BILLIONS OF DOLLARS (SEASONALLY ADJUSTED)200
BILLIONS OF DOLLARS {SEASONALLY ADJUSTED)
180
160
140
120
100
60
40
20
TOTAL BUSINESSINVENTORIES
JTOTAL BUSINESSSALES
^-^-^-x^/
^w
RETAIL INVENTORIES
1969
RETAIL SALES
1970 1971
25
20
-DURABLE GOODS STORES-
10
RETAIL .TRADE (ENLARGED SCALE)
INVENTORIES
\SALES
NONDURABLE GOODS STORESINVENTORIES
1972 1969 1970 1971 1972
SOURCE' DEPARTMENT OF COMMERCE COUNCIL OF ECONOMIC ADVISERS
Period
19641965196619671968196919701971"1970: Dec1971: Jan
FebMar __AprMayJuneJulyAug ___ _ _SeptOctNov_._Dec *
1972: Jan"_Feb v
Total t
Sales 2
73, 68580, 27687, 17289, 70897, 105
103, 178106, 276114,257
106, 943109, 346111, 166112, 740113, 155114, 303115, 531114, 727115, 064115, 660114, 687117, 374116, 964120, 625
msiness 1
Inven-tories 3
111, 457120, 900136, 714145, 072155, 238166, 412173, 635179, 939173, 635174, 412174, 834175, 536176, 275177, 046177, 403177, 652178, 157178, 924179, 468179, 407179, 939
180, 391
Whol
Sales 2
I
14, 52715, 59516, 97917, 09918, 32919, 72620, 55422, 27520, 71821, 33821, 33421, 67621, 89722, 44922, 71622, 62122, 60522, 54922, 28422, 73922, 994
24, 213
esale
Inven-tories 3
vlillions of
16, 97718, 27420, 69121, 55722, 52824, 36326, 60428, 91626, 60426, 64626, 80626, 78827, 04627, 14027, 33327, 86627, 79527, 81427, 92828, 23728, 91629, 167
Total
dollars, se
21, 82323, 67725, 33026, 15128, 49029, 82431, 29434,071
31, 76132, 29032, 85033, 27433, 57833, 50233, 82733, 68834, 65535, 21934, 96435, 57434, 896
34, 95834, 904
Sales 2
Durablegoodsstores
asonally £
7, 0497,8498, 1928,3489, 2689, 6269, 52410, 9859, 18510, 00310, 24010, 61310, 74710, 57610, 78210, 74711, 29811, 83311, 69511,88511, 334
11, 49011, 263
Re
Non-durablegoodsstores
id justed
14, 77315, 82817, 13817, 80319, 22220, 19721, 77023, 08622, 57622, 28722, 61022, 66122, 83122, 92623, 04522, 94123, 35723, 38623, 26923, 68923, 562
23, 46823, 641
jtail
Total
31, 09434, 40538, 07338, 95241, 97345, 37646, 55550, 474
46, 55546, 88847, 42648, 24648, 80949, 25949, 53449, 59250, 29950, 84450, 80050, 37750, 47450, 472
[nventories
Durablegoodsstores
13, 31815, 25317, 25817, 27719, 16720, 64720, 49023, 124
20, 49020, 68921, 23221, 70422, 05622, 50922, 67922, 70723, 31323, 76923, 65223, 30623, 12422, 892
3
Non-durablegoodsstores
17, 77619, 15220, 81521, 67522, 80624, 72926, 06527, 350
26, 065
26, 19926, 19426, 54226, 75326, 75026, 85526, 88526, 98627, 07527, 14827, 07127, 350
27, 580
' The term "business" also includes manufacturing (see page 22).[Monthly average for year and total for month.|3ook value, end of period, seasonally adjusted.
Source: Department oi Commerce.
21
Digitized for FRASER http://fraser.stlouisfed.org/ Federal Reserve Bank of St. Louis

MANUFACTURERS' SHIPMENTS, INVENTORIES, AND ORDERSMamtories
BILL70
60
50
40
30
20
40
30
20
ifacturers' shir which decl
ONS OF DOLLARS
MANUFACTl
TOT
— ^
DL
^ nr-.
Willl""***""""*""**"*
ymi lnm
MANUFACTlDURABLE
Jff^*~*^/**s**+^im
„.,...„,...,.......««•
NOA\ | 1 1 1 1 ! 1 1 1 1
1969
pments andned during
> ISEASONAILY ADJUS
JRERS' SHIPME
AL
| — ' V
RABLE GOODS
V
,,1»»*»<M,»»'""IMIH««1»»*
NON
I i I I I 1 i i i i i
JRERS' NEW C
GOODS
r*—^"~*\/•*~~*y— «•
NDURABLE GOO£i i i i i 1 i i i i i
1970
new orders (1 971, rose b
TED}
NTS
^^^^
^ — *^~^„„..,...-..,........,*»•*
DURABLE GOOD
r i i i i I i i i i i
DRDERS
j~^/-J^""^"—'-^,..,.. »*•»
>s1 1 1 . 1 1 1 . 1 1 1
1971
seasonally ay $350 mill
^
*
5
Ml I l l l l l l ^
1 1 1 1 1 ! 1 1 | | iKl
1972 M
djustecion in
BILLI110
100
90
80
70
60
50
40
30
20
) rose substaJanuary but
ONS OF DOLLARS
MANUFACTl
^
^-
/ j l 1 I 1 1 1 I ! 1 1 1
V 1969
ntially in lainondurable
(SEASONALLY ADJUS1
JRERS' INVEN1
^f^
^-r^\
TOTAL
-DURABLE GOOD
\ :. «** " """
NONDURA
....WHMMWM""**"*"*""
1 ! I 1 1 1 1 1 1 1 1
1970
luary. Durabstocks fell b
FEDJ
•QRIES
s
5LE GOODS
\ .«-.
i i i i i I t i i i i1971
le goods invy $150 milli
t 1 1 1 1 I ! I 1 1 IK
1972 "
C..
SOURC& DEPARTMENT OF COMMERCE COUNCIL OF ECONOMIC ADVISERS
Period
196419651966196719681969197019711970: Dec__ ..1971: Jan
FebMarAprMayJuneJulyAugSeptOctNovDec
1972: Jan"
Manufac
Total
37, 33541, 00344, 86346, 45850, 28753, 62954, 42957, 91154, 46455, 71856, 98257, 79057, 68058, 35258, 98858, 41857, 80457, 89257, 43959, 06159, 074
61, 454
turers' shi
Durablegoods
19, 63422, 21624, 62925, 22027, 69529, 53929, 34931, 55029, 18530, 16630, 85631, 61631, 30831, 85032, 65032, 12331, 46431, 54331, 16632, 10631, 858
33, 725
pments l
Non-durablegoods
17, 70118, 78820, 23321, 23722, 59224, 09025, 08026, 36125, 27925, 55226, 12626, 17426, 37226, 50226, 33826, 29526, 34026, 34926, 27326, 95527, 216
27, 729
Manufac
Total
Millions
63, 38668, 22177, 95084, 56390, 73796, 673
100, 476100, 549
100, 476100, 878100, 602100, 502100, 420100, 647100, 536100, 194100, 063100, 266100, 740100, 793100, 549
100, 752
^urers' inv
Durablegoods
of dollars
38, 43642, 22749, 79354, 88858, 96963, 16065, 15264, 24265, 15265, 30865, 09065, 08265, 03365, 07964, 82564, 69264, 52364, 56364, 49464, 39964, 242
64, 591
en tories 2
Non-durablegoods
seasonal
24, 95025, 99428, 15729, 67531, 76833, 51335, 32436, 30735, 32435, 57035, 51235, 42035, 38735, 56835, 71135, 50235, 54035, 70336, 24636, 39436, 307
36, 161
Ma
Total
y adjuste
37, 95241, 80345, 91246, 70750, 50553, 76853, 86657, 72455, 46857, 25557, 16557, 69956, 59757, 02857, 00958, 25558, 08557, 32257, 49059, 57659, 408
63, 099
nufacture
Durat
Total
d
20, 25822, 98625, 69025, 46827, 91929, 68128, 77831, 35330, 14031, 66631, 07131, 47230, 22830, 60130, 66631, 95531, 75831, 02631, 12632, 56432, 138
35, 256
rs' new ord€
>le goodsProducers'
capitalgoods
industries
3, 9354,4355,2654, 9585,3076, 0745,7946,3905,9256, 4426, 6176,2195,6776, 1936,2376, 1466,5516,4256,8066,5656,835
8,055
srs 1
Non-durablegoods
17, 69418, 81720, 22221, 23922, 58524, 08725, 08826,37125, 32825, 58926, 09426, 22726, 36926, 42726, 34326, 30026, 32726, 29626, 36427, 01227, 270
27, 843
Manu-fac-
turers'mven-tory-ship-
mentsratio 3
1. 641.601. 621.761.741.751.821.741.841.811.771.741.741.721.701. 721.731.731.751.711.70
1.641 Monthly average for year and total for month.2 Book value, end of period, seasonally adjusted.8 For annual periods, ratio of weighted average inventories to average monthly
shipments; for monthly data, ratio of inventories at end of month to shipmentsfor month.
22
Source: Department of Commerce.
Digitized for FRASER http://fraser.stlouisfed.org/ Federal Reserve Bank of St. Louis

MERCHANDISE EXPORTS AND IMPORTSExports and imports in January continued to be disturbed by actual and potential dockstrikes. The deficit, seasonallyadjusted, was $319 million.
BILLIONS OF DOLLARS BILLIONS OF DOLLARS
3.0
2.5
ZO
25
2.0
1966
y SEE NOTE BfLOW.
SOUUCf. DfPAHTMENT OF COMMERCE
1972
COUNCIL OF ECONOMIC ADVISERS
[Millions of dollars]
Period
Monthly average:1963196419651966196719681969 . _1970197J
1970: Dec__1971: Jan..
Feb..Mar.Apr. _Mav_JuneJulv-Aug._Sept_Oct..Nov.Dec..
1972: Jan..
Totalmg ree
Season-ally ad-justed
3, 5693, 7388, 6913,8153,5213, 7833,6618,4933,6784, 5112, 7103,1603, 859i <P<J) i4, <o<&J.
I\(melud-xports) l
Unad-justed
1, 8692, 1532, 2292,4582, 5862, 8393, 1113, 5553,630
3,6843, 4803, 5284, 1083, 8063, 9143,6863, 3383, 3674, 2252, 8283, 2214,0573, 815
lerchandi
Total 1 2
1,8452, 1232,2012,4212,5542, 8023,0663, 5023, 576
U
3,6333, 4323, 4724,0593, 7423, 8543, 6253, 2933, 3194, 1702,7763, 1764,0003, 766
se exportDomesti
Food,bever-ages,
and to-bacco
349386377432392383370422423
nadjuste
485438402455401423395385383568294394537506
:sc exports
Crudemate-rialsandfuels
315361356367394405417558537
d
667555537596578550544468515586394471644567
Manu-fac-
turedgoods
1, 1911,3771,4531, 6021, 7371, 9852,2322,4452,537
2, 3782, 3512, 4492,9382, 6512, 7922,6052, 3632,3532,9352, 0282,2482,7372, 601
To
Season-ally ad-justed
3,4028,6838,5508,5653, 7543, 9884,0198, 7908,9844,2458,5318,3874,1324,540
MerchGen
tal 2
Unad-justed
1,4281,5621,7862, 1352,2412,7693, 0043,3293,800
3,5533,4193, 1913,9073,8933, 8414,2783, 6903,8444, 2543,4723,5314,2834, 280
andise ireral impc
Food,bever-ages,
and to-bacco
322335334382392447442519534
Unad
575523442528593521593565616715352353606631
n ports>rts 3
Crudemate-rialsandfuels
396419453476447503533545606
justed
597511477638564607665630640659571598712702
Manu-fac-
turedgoods
672759937
1,2041, 3131,7191,9182,1592,537
2,2652, 2682, 1632,6192,6112, 5862,8952, 3632,4672, 7672,4232,4622,8252,820
Gross-merchan-dise tradesurplus,season-ally ad-justed
44159044432334570
107226
— 171
16850
141250
— 232-201— 858— 297— 256
265-821—227— 274—819
1 Total excludes Department of Defense shipments of grant-aid military sup-plies and equipment under the Military Assistance Program.
2Total includes commodities and transactions not classified according to kind.*Total arrivals of imported goods other than intransit shipments.
NOTE.—Data adjusted to include silver ore and bullion reported separatelyprior to 1969.
Source: Department of Commerce. 23
Digitized for FRASER http://fraser.stlouisfed.org/ Federal Reserve Bank of St. Louis

U.S. BALANCES ON GOODS, SERVICES, AND TRANSFERSThe current account of the balance of payments was in deficit by $5.8 billion (seasonally adjusted annual rate)the fourth quarter.
BILLIONS OF DOLLARS BILLIONS OF DOLLARS
1966
SOURCE: DEPARTMENT OF COMMERCE COUNCIL OF ECONOMIC ADVISERS
[Millions of dollars]
Period
196619671968196919701971*___ __
1970: IIIIII___IV....
1971:1IIIII...IV"
M
Ex-ports
29, 39030, 68033, 58836, 49041, 98042, 769
40, 96442, 32842, 78441, 84444, 06442, 82445, 90038, 288
erchandis<
Im-ports
— 25, 463-26, 821-32, 964-35, 830-39, 870-45, 648
-38, 912-39, 324-39,968-41, 276-43, 072-47, 068-48, 060-44, 392
3 1 2
Netbal-
ance
3, 9273,859
624660
2, 110-2, 879
2,0523, 0042, 816
568992
-4, 244-2, 160-6, 104
Milite
Directex-
pendi-tures
-3, 764-4, 378-4, 535-4, 856-4, 851-4, 796
-4,728-5, 020-4, 844-4, 812-4, 696-4, 856-4, 760-4, 872
try trans
Sales
8291, 2401, 3951, 5151,4801,942
Se
1,0961, 7881, 3081, 7322, 0402, 1881,8721,668
actions
Netbal-ance
-2,935— 3, 138— 3, 140-3, 341-3, 370-2, 854
asonally a
-3, 632-3, 232-3, 536-3, 080-2, 656-2, 668-2, 888-3,204
Netiiment i
Pri-vate 3
5, 3315,8486, 1575, 8206, 3608,925
djusted
6, 1845, 8886, 5406, 8287,6089,3408, 164
10, 580
west-ncome
U.S.Gov-ern-ment
444063
155-118-975
annual r«
124— 12
— 256-324— 452— 636
-1,356— 1,456
Net.traveland
trans-porta-tion
expend-itures
— 1, 382— 1,752— 1, 558-1,780-1,979-2, 246
a,tes
-1,792— 2, 000-2, 212— 1, 912
— 1,736-2, 468-2, 236-2,544
Otherserv-ices,net
315365344497587728
588532628600844700700672
Bal-anceon
goodsand
serv-ices 1
5,3005,2202,4892, Oil3, 592
699
3, 5244, 1803, 9802, 6804,600
24224
-2,056
Re-mit-
tances,pen-
sions,and
otheruni-
lateraltrans-fers1
-2,890-3, 081-2, 875-2,910-3, 148-3,473
— 3, 024-3, 012-3, 212-3, 344-3, 080-3, 352-3,708-3, 756
Cur-rentac-
countbal-ance
2,4102, 139-386— 899
443-2, 774
5001, 168
768-6641,520
-3, 328-3,484-5, 812
1 Excludes military grants.2 Adjusted from Census data for differences in timing and coverage.3 Includes fees and royalties from U.S. direct investments abroad or from
foreign direct investments in the United States.
Source: Department of Commerce.
24
Digitized for FRASER http://fraser.stlouisfed.org/ Federal Reserve Bank of St. Louis

U.S. OVERALL BALANCES ON INTERNATIONAL TRANSACTIONSRevised estimates indicate that the U.S. balance of payments in the fourth quarter was in deficit at a seasonally adjustedannual rate of $17.4 billion on the net liquidity basis and $25.1 billion on the official reserve transactions basis.
BILLIONS OF DOLLARS20 I
10
-10
-20
-30
-40
-50
-60
SEASONALLY ADJUSTED ANNUAL RATES
BILLIONS OF DOLLARS1 20
BALANCE ON OFFICIALRESERVE TRANSACTIONS
BALANCE ONCURRENT ACCOUNT
AND LONG-TERMCAPITAL
10
-10
-20
-30
-40
-50
-601966 1967 1972
SOURCEi DEPARTMENT OF COMMERCE COUNCIL OF ECONOMIC ADVISERS
[Millions of dollars]
Period
196619671968196919701971 *
1970: IIII I I___IV---
1971:1II _ _ .III.-.IV v
Long-terflows
U.S.Govern-ment 1
— 1, 469-2,423-2, 161-1, 930— 2, 029-2, 382
-1, 812-2,360-1, 248-2, 692-2, 732-2, 528-2, 092— 2, 168
m capital>, net
Private 2
— 2, 555-2,912
1, 198-50
- 1, 454-4, 128
-3,876-1,088
-88028
-4,036-7, 172-7, 188
1, 888
Balance
accountand long-
capital
-1,614— 3, 196— 1, 349-2,879-3, 039-9,284
-5, 188-2, 280— 1, 360— 3, 328-5, 248- 1 3, 028- 12, 764-6, 092
Non-liquidshort-term
privatecapitalflowsnet2
— 102— 505
231-602— 545
-2,529
Sc
-460-560— 460— 700
- 1, 524— 1, 636— 4, 032— 2, 924
Allo-
nf
specialdraw-
ingrights
867717
iasonally
868868868864720716716716
Errorsandomis-
sions,net
-431-985-493
— 2, 603— 1, 104- 10, 878
adjusted
-236- 1, 500— 1, 748
-932-4, 048-9, 252
— 21, 132— 9, 080
Balance,net
liquid-ity
basis
-2, 148-4, 685— 1, 610-6, 084-3, 821
-21, 973
annual ra
-5, 016-3, 472-2, 700-4, 096- 10, 100-23, 200-37,212-17, 380
Liquidprivatecapitalflows,net2
2, 3671, 2673,2518,786
-6, 000— 7, 794
tes
— 6,440-2, 144-5,600-9, 816
-12, 100212
-11,528-7, 760
Balance,officialreservetrans-actionsbasis
219-3,418
1, 6412, 702
-9, 821-29, 767
— 11,456— 5, 616-8, 300
-13,912
-22, 200—22, 988-48, 740-25, 140
Changesin lia-bilities
toforeignofficial
agencies,net3
-7873, 366-761
— 1, 5157, 344
27, 419
10, 4002,3965,964
10, 61619, 47220, 35243, 96425, 888
Changesin U.S.officialreserveassets,net 4
56852
-880-1, 187
2,4772, 348
1,0563, 2202, 3363, 2962,7282,6364,776-748
U.S.officialreserveassets,
net(end ofperiod)
14, 88214, 83015, 710
5 16, 96414, 487
6 12, 167
Unad-justed
17, 35016, 32815, 52714, 48714, 34213, 50412, 131
6 12, 1671 Excludes liabilities to foreign official reserve agencies.2 Private foreigners exclude the IMF, but include other international and
regional organizations.a Includes liabilities to foreign official agencies reported by U.S. Government
and U.S. banks and U.S. liabilities to the IMF arising from reversible gold salesto, and gold deposits with, the United States.
1 Official reserve assets include gold, special drawing rights, convertible cur-rencies, and the U.S. gold tranche position in the IMF.
6 Includes gain of $67 million resulting from revaluation of the German markin October 1969.
6 On Dec. 31, U.S. reserve assets consisted of gold stock, $10,206 million, specialdrawing rights, $1,100 million; convertible currencies, $276 million; gold trancheposition, $585 million.
Sources: Department of Commerce and Treasury Department.
25
Digitized for FRASER http://fraser.stlouisfed.org/ Federal Reserve Bank of St. Louis

PRICESCONSUMER PRICESIn January the consumer price index rose 0.1 percent; seasonally adjusted the increase was 0.3 percent. Food priceswere unchanged unadjusted and down 0.2 percent seasonally adjusted. Nonfood commodities declined 0.3 percent;seasonally adjusted they rose 0.2 percent. Service prices increased 0.5 percent reflecting mostly higher taxes andpublic utility and transportation rates.
Index, 1967=100140
Index, 1967=100140
100
90
100
901972
SOURCE: DEPARTMENT OF LABOR COUNCIL OF ECONOMIC ADVISERS
(1967 = 1001
Commodities Services
Period
19621963196419651966196719681969197019711970: Dec1971: Jan
FebMarAprMayJuneJulyAugSeptOctNovDec
1972: Jan
Allitems
90.691.792.994. 597.2
100. 0104.2109. 8116. 3121. 3119. 1119. 2119. 4119. 8120. 2120.8121. 5121. 8122. 1122. 2122.4122. 6123, 1123.2
All com-modities
92. 893.694.695. 798. 2
100. 0103.7108. 4113. 5117. 4115. 6115.4115.5116. 1116.6117. 2117.9118. 1118.2118. 1118.4118. 5118. 9118. 7
Food
89. 991.292. 494. 499. 1
100. 0103. 6108. 9114. 9118.4115.3115.5115.9117. 0117.8118. 2119.2119.8120. 0119. 1118. 9119. 0120. 3120. 3
Comm
All
94 194. 895. 696.297. 5
100.0103. 7108. 1112. 5116.8115.5115.2115. 2115. 5115.8116. 6117. 1117.0117. 1117. 4118.0118. 1118. 1117.7
odities lee
Durable
97.697.998. 898.498.5
100. 0103. 1107. 0111. 8116.5115. 2115. 2115. 0115. 2115. 7116. 6117. 4117. 5116. 9116. 4117. 1117. 4117.2117.3
s food
Non-durable
91. 892.793. 594. 897.0
100.0104. 1108. 8113. 1117. 0115.7115. 3115. 4115. 7116.0116. 6116. 9116.7117.2118.2118. 7118.7118. 8118. 1
Allservices
86.888. 590.292. 295. 8
100. 0105. 2112. 5121. 6128. 4125. 6126. 3126. 6126. 6126. 8127. 5128. 2128.8129. 4129. 8ISO. 0130.4130. 8131. 5
Rent
94.095.095. 996. 998.2
100. 0102. 4105. 7110. 1115. 2112.6112. 9113. 6113. 9114. 4114. 7115. 2115. 4115. 8116. 1116.4116. G116. 9117. 1
Serviceslessrent
85. 587.389. 291. 595. 3
100. 0105. 7113. 8123. 7130. 9128. 0128. 7129. 0128. 9129. 1129. 8130, 6131. 2131. 9182. ;;Io2. 5132. <J] ;j;j. 3134. 1
Source: Department of Labor.
26Digitized for FRASER http://fraser.stlouisfed.org/ Federal Reserve Bank of St. Louis

WHOLESALE PRICESlie wholesale price index rose 0.9 percent in February/ seasonally adjusted it was up 0.7 percent. Industrial com-nodities increased 0.5 percent unadjusted and 0.4 percent adjusted, the same as in January. Farm products andDrocessed foods and feeds together were up 1.9 percent unadjusted and 1.8 percent seasonally adjusted.
Index, 1967=100120
Index, 1967=100
100
95
100
951966 1971 1972
SOURCE: DEPARTMENT OF LABOR COUNCIL OF ECONOMIC ADVISERS
[1967=100]
Industrial commodities
Period
19621963196419651966196719681969197019711971: Jan
FebMarApr _Mav _JuneJulyAugSept . .O c t _ _ _ _ _ _ _Nov _ _ _Dec
1972: JanFeb
Allcom-modi-ties
94. 894. 594.796.699. 8
100. 0102. 5106.5110. 4113. 9111. 8112. 8113. 0113. 3113. 8114. 3114. 6114. 9114. 5114. 4114. 5115. 4116. 3117.3
Farmprod-ucts
98.096. 094.698. 7
105. 9100. 0102. 5109. 1111. 0112. 9108. 9113. 9113. 0113. 0114. 0116. 0113. 4113. 2110. 5111. 3112. 2115. 8117. 8120. 7
±TOC-essedfoodsand
feeds
91. 992.592. 395. 5
101. 2100. 0102. 2107. 3112. 0114. 3111. 8113. 3113. 7113. 5114. 5114. 9116. 0115. 4114. 6114. 1114. 4115. 9117.2118. 8
All in-dustri-als1
94, 894, 795. 296. 498. 5
100. 0102. 5106. 0110. 0114. 0112. 2112.5112.8113. 3113. 7113. 9114. 5115. 1115. 0115. 0114. 9115. 3115. 9116. 5
Crudemate-rials 2
95. 694, 397. 1
100. 9104.5100. 0102. 0110. 6118.8122. 7121. 4121. 8121. 4124. 1123.5122. 8122. 7122. 3123. 0122. 9122. 6123. 4125. 6127.0
Inter-mediatemate-rials 3
95.395. 095. 696. 998.9
100. 0102. 6106. 2110.0114. 3111. 5112. 0112. 7113.3113.8114. 1114, 9115. 9115.9115. 7115. 6115. 8116. 4117.2
Produc-er fin-ishedgoods
92. 292. 493. 394. 496. 8
100. 0103. 5106. 9111. 9116. 6115. 6115. 9116. 0116. 1118. 3116. 5116. 8117. 1116. 9117. 1117.0117. 8118. 4118. 8
ConsuEished g<cludin
Dur-able
98.397.898. 297. 998.5
100. 0102. 2104. 0107. 1110. 9110. 5110. 8110. 4110. 5110. 7110. 7111. 0111. 1110.4111. 3111.3112.6112. 9113.2
tier fin-x>ds ex-g food
Non-durable
94. 895. 194.895. 997. 8
100, 0102. 2105. 0108.2111. 3110. 9110. 8110. 7110.5111.0111. 2111. 6111. 8111.9111. 7111. 7111. 8112. 0112. 1
1 Coverage of the subgroups does not correspond exactly to coverage of thisIndex.
s Excludes crude foodstuffs and feedstuffs, plant and animal fibers, oilseeds, andleaf tobacco.
3 Excludes intermediate materials for food manufacturing and manufacturedanimal feeds; includes, in part, grain products, for further processing.
Source: Department of Labor. p"7
Digitized for FRASER http://fraser.stlouisfed.org/ Federal Reserve Bank of St. Louis

PRICES RECEIVED AND PAID BY FARMERSIn the month ended February 15, prices received by farmers rose 2 percent while prices paid were up 1 percent. Th<actual and adjusted parity ratios were up 1 point each.
index, 1967=100130
Index, 1967=100130
90 -
RA1yo
on
70
*0
10 y
/S'*'.»...»*
! t ! 1 1
19C
\X,
! ! t I !
36
• ~1 L t 1 1 I 1 ! 1 1 !
1967
,,--,...,
i i l M
19r i t i i
68
,-,/"
( I I 1 !
19
"-"( I I I !
69
PARITY RATIO (AC
...M* \
V "
[ ! ! ! ! ! ! ! 1 ! l i l t !
1970 19
TUAL)
.„..,, X\x
i i i i j71
RATI
,»
1 1 | ! ! I 1 i I i i
1972
DO/yo
cm
70
<^0
J/RATIO OF INDEX OF PRICES RECEIVED TO INDEX OF PRICES PAID, INTEREST, TAXES, AMD WAGE RATES, ON 1910-14-100 BASE.SOURCE: DEPARTMENT OF AGRICULTURE COUNCIL OF ECONOMIC ADVISERS
Period
19621963 _1964 _1965__1966 _1967 .19681969-197CL _ _1971.
1971: Jan 15Feb 15Mar 15__Apr 15 __ _ ___Mav 15June 15 _ _July 15Aug 15Sept 15Oct 15Nov 15Dec 15 > _ „__
1972: Jan 15Feb 15
Prices i
All farmproducts
96969398105100103108110112
106112111111113113113113111113114116120122
Deceived by t
Crops
10310610610310510010197100108102105107108111114111108104106108109111111
armers
Livestockand
products
Index, 1
92898594105100104116118116110117114114114113114117117118119121126131
Prices
All items,interest,taxes, andwage rates
967=100
9091929498100104109114120117118118119120120120120121121121122
123124
paid by far
Familylivingitems
9192939598100104109114119
116117117117118119119120120120120121121123
mers
Produc-tionitems
9495949699100102106110115112113114115115116116116116116117117118118
Parity~
Actual
807876778074737472706870706970707070686970717273
ratio l
Adjusted 2
83818082867979797774
7275747374747474727474757879
1 Percentage ratio of index of prices received by fanners to index of prices paid,interest, taxes, and wage rates on 1910-14=100 base.2 The adjusted parity ratio reflects Government payments made directly tofarmers.
Source: Department of Agriculture.
28
Digitized for FRASER http://fraser.stlouisfed.org/ Federal Reserve Bank of St. Louis

MONEY, CREDIT, AND SECURITY MARKETSMONEY STOCKThe seasonally adjusted money stock grew at a 6.7 percent annual rate in the 3-month period ended in February.In the preceding 3-month period there was a small decline. Time and savings deposits continued to increase sharply.
BILLIONS OF DOLLARS BILLIONS OF DOLLARS
300
250
200
150
AVERAGES OF DAILY FIGURES, SEASONALLY ADJUSTED
TIME AND SAVINGS /DEPOSITS /
1966
SOURCE: BOARD OF GOVERNORS OF THE FEDERAL RESERVE SYSTEM
300
250
200
150
1972
COUNCIL OF ECONOMIC ADVISERS
[Averages of daily figures, billions of dollars]
Period
1966: Dec1967: Dec1968: Dec1969: Dec _ _ _ _ _ _ _1970: Dec_1971: Dec1971: Jan
FebMar _ _Apr _ _ _MayJune _ _ _ _JulyAua: _ _Sept__ _ _ _ _ _ _ _ _OctNov.Dec _ __ _
1972: JanFeb *_
JV
Total
171. 7183. 1197. 4203. 7214. 8228. 2215. 3217. 7219. 7221. 2223. 8225. 5227.4228.0227. 6227. 7227. 7228. 2228. 8231.4
[onev sto(
Cur-rencyout-side
banks
Seasonally38. 340. 443. 446. 049. 052. 549. 349. 750. 050. 550. 851. 151.651. 751. 952. 252. 252. 552. 853. 2
;k
De-mand
de-posits l
T adjusted133. 4142. 7154. 0157. 7165. 8175. 7166.0168. 0169. 7170. 7173. 0174. 5175. 8176. 3175. 7175. 5175. 5175. 7176. 0178.2
Timeand
savingsde-
posits 1
158. 1183. 4204. 2194. 1228. 9269. 9234.4240. 2245. 4248. 1251. 3254. 4256.4257. 3259. 6263. 3265. 3269. 9274. 4278. 1
JV
Total
176. 9188.6203.4209. 8221. 2235. 1221. 4215. 6217. 5222. 3219. 9223. 7226. 0224.9226. 2227. 5229. 6235. 1235. 3229. 3
lonev sto<
Cur-rencyout-side
banks
1
39. 141. 244. 346. 950. 053. 549. 149. 149. 550. 150. 551. 051. 951. 951. 952. 252. 853. 552. 652. 6
3k
De-mand
de-posits1
[Jnadjuste137. 8147. 4159. 1162. 9171. 3181. 5172. 3166. 5168. 0172. 3169. 4172. 7174. 1173.0174. 3175. 3176. 9181. 5182. 7176. 6
Timeand
savingsde-
posits *
d156. 9182. 1203. 2193. 2228. 1269. 0233. 8239. 6246. 2248. 5251.4253. 8255. 5258. 1260. 3264. 1265. 5269. 0273. 7277.3
U.S.Gov-ern-ment
demandde-
posits 1
3. 45. 05. 05. 67. 36.76.88. 45.55. 57.85.36.86.87. 55. 33. 96. 77. 27.2
1 Deposits at commercial banks.NOTE.—Effective June 9,1966, balances accumulated for payment of personal
loans (about $1.1 billion) are excluded from time deposits and from loans at allcommercial banks.
Source: Board of Governors of the Federal Reserve System.
29
Digitized for FRASER http://fraser.stlouisfed.org/ Federal Reserve Bank of St. Louis

PRIVATE LIQUID ASSET HOLDINGS - NONFINANCIAL INVESTORSLiquid asset holdings of private nonfinancial investors rose $8.5 billion (seasonally adjusted) in February, accordito a new Federal Reserve series. Currency and deposits increased $9.3 billion while other types of liquid assets feuslightly on balance.
BILLIONS OF DOLLARS BILLIONS OF DOLLARS
900
800
700
600
500
400
300
200
100
AVERAGES OF DAILY FIGURES, SEASONALLY ADJUSTED
CURRENCY
AND DEPOSITS
900
800
700
600
500
400
300
200
100i. t i t i 1 i t i 1 1 1 I
1966 1967 1968 1969 1970 1971 1972
SOURCE BOARD OF GOVERNORS OF THE FEDERAL RESERVE SYSTEM COUNCIL OF ECONOMIC ADVISERS
[Averages of daily figures; billions of dollars, seasonally adjusted]
Period
1965: Dec _1966: Dec _.1967: Dec1968: Dec1969: Dec1970: Dec1971: Dec1971: Jan
FebMar_AprMayJuneJulyAug__SeptOctNovDec
1972: Jan »Feb "
Totalliquidassets
557.7588.2637. 5694.6719.7770.6850. 5
776. 2784 2792. 8800.0808.6816. 8823. 3827.6831. 6838. 3842. 8850. 5858. 7867.2
Total
447.4469.6516. 0559.6576. 2623.6709.8631. 8643. 0653.6662. 5671. 5678.6684. 8688. 7692.6698. 1703.0709. 8719. 3728.6
Curr<
Cur-rency
36.338. 340.443.446.049.052. 5
49. 349. 750.050.550.851. 151.651.751. 952.252. 252. 552. 853.2
3ncy and
Demanddeposits
115.5117.3125. 2135.2138.11447153.4144.5146. 2147. 8148. 8151.2152. 8153. 9154 1153. 5153. 3153.0153.4153.6155.8
deposits
Time d
Com-mercialbanks
125.2136.8156. 2174.2177.0198. 8232. 2203.3208.3213. 0216.0218. 5220. 7221.7222. 4224. 0226. 5228. 9232.2237.1240.1
eposits
Nonbankthrift
institu-tions
170.4177. 3194.2206. 8215.2231.1271. 72347238. 8242. 9247.3251. 02541257.5260. 5263.1266. 1268.9271.7275.8279.6
U.S. Gment se
Savingsbonds
49. 550. 151.051.451.151. 353.751.451.651. 852.052. 252.552.752. 953.153. 353.553.7540542
overn-curities
Other
38.243. 339. 546. 862.553.039.249.746. 143.942. 842. 042. 742. 743.041.741. 040.639. 237.436.3
Nego-tiablecertifi-
cates ofdeposit
15. 515.019.522. 79. 1
23.230.224525.626.225.826.126.727.327.528. 129. 228. 930.230. 130.7
Com-mercialpaper
7. 110. 911. R
14^20. o19.!
18. 818.017.216. 916. 816. 415. 815. 616.116. 716. 817.717.917. 4
NOTE.—New series.Source: Board of Governors of the Federal Beserve System.
30Digitized for FRASER http://fraser.stlouisfed.org/ Federal Reserve Bank of St. Louis

BANK LOANS, INVESTMENTS, DEBITS, AND RESERVES• February, seasonally adjusted bank loans and investments rose $5.2 billion or at an annual rate of 14 percent.Dank loans increased at an annual rate of 11 percent. Free reserves were positive in February for the third monthin a row.
BILLIONS OF DOLLARS BILLIONS OF DOLLARS
50C
400
300
200
100
ALL COMMERCIAL BANKS SEASONALLY ADJUSTED, END OF MONTH
TOTALLOANS AND INVESTMENTS
INVESTMENTS IN OTHER SECURITIESnuiiitx"
INVESTMENTS INU.S. GOVERNMENT SECURITIES
I I 1 1 I ! I I I 1 I 1 1 1 ! I I ! I I ! 1 I 1 I I I 1 I I 1 I I 1
1966 1968 1969 1970 1971
500
400
300
200
100
1972
COUNCIL OF ECONOMIC ADVISERS
End of period
196619671968196919701971 »1971: Feb
MarAprMavJuneJulyAug__ _ _ _Sept p.Oct *Nov r
Dec p
1972: Jan»_Feb "___
(s
Totalloansand
invest-ments
3 316. 1352. 0390.6
4 402. 1435. 9482.9446. 1449. 5452, 5456. 1461. 1463.7468. 4472. 4476. 5478. 4482. 9489. 8495. 0
All con 11ciisonally
Loans,excluding
inter-bank
3 213. 9231. 3258. 2
4 279. 4292. 0
5 318. 6295. 7296. 5298. 2300. 7
' 301. 7304. 1309. 7313. 0316. 4317. 5318. 6324. 3327. 1
icrcial bankadjusted da
Investr
U.S. Gov-ernmentsecurities
Billions53. 559.361. 0
4 51. 558. 060. 360.861. 160. 760.462. 861. 660. 959. 959. 158. 960. 359. 861. 1
stta)
nents
Othersecuri-
ties
of dollars3 48. 7
61.471.4
4 71. 285. 9
5 103. 989.691.993. 595. 1
5 96. 698. 097. 899. 5
101. 0102. 0103. 9105. 7106. 8
Weeklyreporting
large com-mercialbanks
Commercialand indus-trial loans
60.765. 873.181. 581.783.880. 881. 281. 181.482. 381. 682.483. 583. 182. 683. 881. 882. 5
Bankdebitsoutside
New YorkCity (232centers) ,
seasonallyadjustedannualrates 1
3,4213, 7404,3545, 163o, 7446,4366, 0326, 1166,3026,2156,6136. 6236, 6656,6976,4946,8396,776
A
Totalreserves
23, 83025, 26027, 22128, 03129, 26531, 32929, 88029, 68629, 88530, 41930, 02330, 54730, 45530, 80230, 86030, 95331, 32932, 86531, 953
ill membe
Excessreserves
Millions o392345455257272165201199140312131162198206207263165173163
r banks 2
Borrow-ings atFederalReserveBanks
: dollars557238765
1,0863211073283191483304538218045013604071072034
Freereserves
-165107
-310-829
— 4958
— 127— 120
-8-18
-322-658-606-295— 153-144
58153129
1 Debits during period to demand deposit accounts except interbank andU.S. Government. New series beginning January 1964.
2 Averages of daily figures. Annual data are for December.P Effective June 1966, balances accumulated for payment of personal loans[bout $1.1 billion) are excluded from loans at all commercial banks, and certain
- vertificates of CCC and Export-Import Bank totaling about $1 billion are includedin other securities rather than in loans.
* Beginning June 1969, data include all bank-premises subsidiaries and othersignificant majority-owned domestic subsidiaries: earlier data include com-mercial banks only.5 As of June 1971, Farmers Home Administration notes totaling about SO.7billion are classified as "other securities" rather than as "loans."
Source: Board of Governors of the Federal Reserve System.
31
Digitized for FRASER http://fraser.stlouisfed.org/ Federal Reserve Bank of St. Louis

CONSUMER AND REAL ESTATE CREDITToial consumer credit fell $1.4 billion in January/ a year earlier fhe drop was $1.7 billion. Consumer insralmecredit (seasonally adjusted) rose about $650 million in January.
BILLIONS OF DOLLARS160
BILLIONS OF DOLLARS160
20
SEASONALLY ADJUSTED (ENLARGED SCALEJ
INSTALMENT CREDIT EXTENDED
4 v\ i i i t i I i i1966 1967
SOURCE* BOARD OF GOVERNORS OF THE FEDERAL RESERVE SYSTEM
|Mil l ions of dollar.-
Period
1963196419651966196719681969197019711970: Dec
1971: JanFebMarAprMay_ __JuneJulyAugSeptOctNovDec
1972: Jan
Consu
Total
71, 73980, 26890, 31497, 543
102, 132113, 191122, 469126, 802137, 237126, 802
125, 077123, 815123, 604125, 047126, 025127, 388128, 354129, 704130, 644131, 606133, 263137, 237
135, 830
mer crediti
Total l
55, 48662, 69271, 32477, 53980, 92689, 89098, 169
101, 161109, 545101, 161
100, 10199, 24499, 168
100, 028100, 692101, 862102, 848104, 060104, 973105, 763107, 097109, 545
108, 826
outstandinmad justed^InstalmentAutomo-
bilepaper
22, 25424, 93428, 61930, 55630, 72434. 13036, 60235, 49038, 31035, 490
35, 00434, 86935, 02835, 49635, 81936, 34936, 76337, 15437, 38337, 75938, 16438, 310
38, 111
g (end of i
Personalloans
15, 61817, 84820, 41222, 18724, 01826, 93629, 91831, 61234, 43231,612
31, 45531, 39631, 50431, 77332, 04132, 35132, 68033, 13433, 42033, 57533, 97734, 432
34, 300
eriod;
N on—instal-ment 2
16, 25317, 57618, 99020, 00421, 20623, 30124, 30025, 64127, 69225, 641
24, 97624, 57124, 43625, 01925, 33325, 52625, 50625, 64425, 67125, 84326, 16627, 692
27, 004
(. 'Onsuinand n
To— — — —
Extended
63, 59170, 67078, 58682, 33584, 69397, 053
102, 888104, 130117, 638
8,536
8,9169,0819,5339, 7519, 6909, 7159, 675
10, 04910, 15610, 03110, 57210, 130
10, 184
er ins t i i lmt'paid (seastill
Repaid
56, 82563, 47069, 95776, 12081, 30688, 08994, 609
101, 138109, 254
8, 515
8, 8298,9799,0389, 0889, 1979, 1908, 9149, 2229, 1579, 1079, 3069,230
9,547
n t credi t eu m l l v adj i
A n to mob
Extended
22, 12624, 04627, 22727, 34126, 66731, 42432, 35429, 83134, 638
2, 170
2,4612, 6872, 8972, 8722,7562, 8382,7733,0043, 1472, 9923, 1622, 973
2,978
x t e n d e i ls l ed )
ilr paper
Repaid
19, 25421, 36923, 54325, 40426, 49928, 01829, 88230, 94331, 8182,618
2, 6232, 6362, 6962, 5662,6402, 6782, 5652,6972, 7322,6342,6622,696
2, 761
M or t ^,a j.'.edebt , o i i t -sL'mdinu;i ion iu rm,1- to -1-
houses :;
182, 200197, 600212, 900223, 600236, 100251, 200266, 800280, 200307, 500
280, 200
283, 600
290, 900
299, 500
307, 500
^Iso includes other consumer goods paper, and repair and modernizationloans, not shown separately.2 Consists of single-payment loans, charge accounts, and service credit.3 End of period, unadjusted.
32
Sources: Board oi Governors of the Federal Keserve System and Federal HonvLoan Bank Board.
Digitized for FRASER http://fraser.stlouisfed.org/ Federal Reserve Bank of St. Louis

BOND YIELDS AND INTEREST RATESa 3-month Treasury bill rate rose from mid-February to mid-March while long-term Government bonds were about
unchanged. Yields on high-grade corporate bonds declined.
PERCENT PER ANNUM10
PERCENT PER ANNUM10
CORPORATE Aaa BONDS(MOODY'S)
1966
SOUUCf. SK TABU HlOW COUNCIL OF ECONOMIC ADVISERS
[Percent per annum]
Period
19641965196619671968-.1969__197019711971: Jan
Feb.MarAprMayJune _JulyAugSeptOctNovDec
1972: JanFeb »
Week ended :1972: Feb 4__
11—18—25__
Mar 3—10..I7p.
U.S. Gove3-monthTreasury
bills »
3. 5493. 9544.8814, 3215.3396. 6776. 4584. 3484. 4943. 7733. 3233. 7804. 1394. 6995. 4055. 0784.6684.4894. 1914. 0233. 4033. 180
3. 3673. 1413. 0663. 1453. 4463. 5533. 845
irnment secui
3-5 yearissues 2
4. 064.225. 165.075.596. 857.375.775. 725. 314. 745. 426. 026. 366.776. 395. 965. 685. 505.425. 335. 51
5. 555. 515.475. 505. 505. 575.84
"ity yields
Taxablebonds 3
4. 154.214. 654.855.266. 126. 585.745.925. 845. 715. 755. 965. 945.915. 785. 565. 465. 485. 625. 625. 67
5. 705. 715.655. 635. 625. 62
6 5. 67
High-grademunicipal
bonds(Standard &
Poor's) 4
3.223.273. 823.984.515. 816. 515.705.705. 555.445. 656. 146. 226. 315. 955. 525. 245. 305. 365. 255. 33
5. 465. 295.275. 305. 315. 195. 28
Corpora(Moo
Aaa
4.404.495. 135. 516.187. 038. 047.397.367. 087. 217. 257. 537. 647. 647. 597.447. 397. 267.257. 197.27
7.257. 297.287. 267.257.24
6 7. 22
ie bondsdy's)
Baa
4. 834.875. 676.236.947. 819. 118. 568.748. 398.468. 458. 628. 758. 768. 768. 598.488. 388. 388.238. 23
8. 268. 258.238. 218. 218. 228. 24
Primecommercial
paper,4r-6
months
3.974.385. 555. 105.907. 837. 725. 115. 114. 474. 194. 575. 105. 455. 755. 735. 755. 544. 924. 744. 083. 93
3.984. 003.933. 883. 904. 00
6 4. 23
FHAnew homemortgageyields 5
5. 455.466.296.557.138. 199.057.788.40
7. 327.377.757. 897.977.927. 847. 757.627.597. 49
1 Rate on new issues within period. 2 Selected note and bond issues.8 April 1953 to date, bonds due or callable 10 years and after.* Weekly data are Wednesday figures.fi Data for first of the month, based on the maximum permissible interest rate
(7 percent beginning February 18, 1971) and 30-year mortgages paid in 15 years.
e Not charted.Sources: Department of Housing and Urban Development, Treasury Depart-
ment, Board of Governors of the Federal Reserve System, Standard & Poor'sCorporation, and Moody's Investors Service.
33Digitized for FRASER http://fraser.stlouisfed.org/ Federal Reserve Bank of St. Louis

COMMON STOCK PRICES, YIELD, AND EARNINGSThe stock market continued to move generally upward in February and early March.
Index, 1941-43=10 Index, 1941-43=10
120
100
90
WEEKLY120
110
100
90
80
COMPOSITE PRICE INDEX FOR500 COMMON STOCKS
60 I t i l l 1 I I I ! I I I I I I I I I ! I I I 1 I t I I LJ l i l t 1 t I I 1 I 1 1 I I I I I I I I I I t 1 I I I I t I II I I 1 I I I 1 1 I I 1
PERCENT PERCENTMONTHLY
DIVIDEND YIELD ON COMMON STOCKS
PRICE/EARNINGS RATIO ON COMMON STOCKS
101966
SOURCE: STANDARD & POOR'S CORPORATION
Period
1966196719681969_197019711971: Feb
Mar __AprMavJuneJulvAugSept _ _ _Oct _ _ _ .NovDec
1972: Jan _ _ _Feb
Week ended :1972: Feb 4
111825
Mar 310___ _17...
Total
85. 2691.9398.7097. 8483.2298. 2997. 1199. 60
103. 04101. 6499. 7299. 0097. 2499.4097. 2992. 7899. 17
103. 30105. 24
104. 43105. 10105. 22105. 58107. 07108. 78
4 107. 62
Total
91.0899. 18
107. 49107. 1391. 29
108. 35106. 62109. 59113. 68112. 41110. 26109. 09107. 26109. 85107. 28102. 21109. 67114. 12116. 86
115. 69116. 67116. 93117. 30119. 08120. 99119. 57
Price iIndustrials
Capitalgoods
1941-84. 8696. 96
105. 77103. 7587. 87
102. 83101. 58104. 69109. 38108. 61105. 46102. 48100. 90104. 55100. 6695. 51
103. 78109. 69113. 90
113. 49114. 17114. 20113. 75115. 73118. 68117. 10
ndex 1
Consumers'goods
13=1074. 1079. 1886.3387. 0680. 2299.7695. 3898. 54
102. 41101. 96100. 96100. 5599. 82
103. 34101. 3197. 47
103. 92106. 45109. 42
107. 90109. 67110. 25109. 84112. 96114. 35112. 95
Publicutilities
68. 2168. 1066.4262. 6454.4859. 3362. 4962. 4262. 0659. 2057. 9060. 0857. 5156.4857.4155. 8657. 0760. 1957. 41
58. 5257. 4856.7557. 2157. 3758. 1158. 11
Railroads
46. 3446.7248.8445. 9532. 1341.9438. 7839. 7042. 2942. 0542. 1242. 0543. 5547. 1844. 5841. 1943. 1745. 1645. 66
45. 9445. 7645. 6645. 3445. 6146.6147. 15
Dividendyield 2
(percent)
3. 403. 203.073. 243. 833. 143. 183. 102. 993.043. 103. 133. 183. 093. 163. 313. 102. 962. 92
2. 932. 912. 912. 922. 862. 82
4 2. 85
Price/earningsratio 3
14. 9217.5217.2016.5715. 91
18. 11
17.43
17. 69
5 Includes 500 common stocks: 425 industrials, 55 public utilities, and 20 rail-roads. Weekly Indexes for capital and consumer goods are Wednesday figures;all other weekly indexes are averages of dally figures.
'Aggregate cash dividends (based on latest known annual rate) divided bythe aggregate monthly market value of the stocks in the group. Annual yields
34
are averages of monthly data. Weekly data are Wednesday figures.s Ratio of price index for last day in quarter to quarterly earnings (seasonally
adjusted annual rate). Annual ratios are averages of quarterly data.4 Not charted*Source: Standard & Poor's Corporation.
Digitized for FRASER http://fraser.stlouisfed.org/ Federal Reserve Bank of St. Louis

FEDERAL FINANCEBUDGET RECEIPTS, EXPENDITURES, AND NET LENDING
In the first 7 months of the current fiscal year there was a deficit of $20.2 billion/ a year earlier there was a deficit of$18.0 billion.
BILLIONS OF DOLLARS260
BILLIONS OF DOLLARS260
220
-20
-40
-20
-401962 1963 1964 1965 1966
J/ESTIMATE
SOURCES: TREASURY DEPARTMENT AND OFFICE OF MANAGEMENT AND BUDGET
1967 1968FISCAL YEARS
1969 1970 1971 \972^ 1973^
COUNCIL OF ECONOMIC ADVISERS
[Billions of dollars]
Period
Fiscal year:19611902196319641965196619671968196919701971197231973»._
Cumulative totals forfirst 7 months:
Fiscal year 1971Fiscal year 1972
B
Keceip
Receipts
94.499. 7
106. 6112.7116.8130. 9149. 6153. 7187. 8193.7188.4197.8220. 8
103.4110.8
udget receipts,
Uexpenditure
Expendi-tures
96.6104.5111. 5118. 0117. 2130. 8153. 2172. 8183. 1194.5210. 3235.6246. 5
121.0129.8
expenditures,
iccount
Surplus ordeficit (— )
— 2.2—4.8— 4. 9-5.4
— . 3(2)
—3.6-19.1
4,7-.7
-21.9-37.8— 25.7
-17.6— 19. 1
and net lendii
Loanaccount
Netlending
1.22. 4
— . 1. 5
1. 23. 85. 16.01.52. 11. 11. 0
— . 2
. 41.2
ag
Totalsurplus ordeficit (— )
-3.4— 7. 1-4.8—5. 9— 1.6-3.8-8.7
-25.23. 2
— 2. 8-23.0— 38. 8-25. 5
-18. 0-20. 2
Feder(end of
Total1
292.9303. 3310. 8316.8323. 2329.5341.3369. 8367. 1382.6409. 5455. 8493. 2
401. 0432. 6
il debtperiod)
Held bythe public
238.6248.4254. 5257. 6261. G264. 7267. 5290. 6279. 5284.9304. 3343. 8371.3
301. 8326. 0
Excludes non-interest-bearing public debt securities held by IMF.Surplus of $36 million.
»Estimates.
Sources: Treasury Department and Office of Management and Budget.
35
Digitized for FRASER http://fraser.stlouisfed.org/ Federal Reserve Bank of St. Louis

FEDERAL BUDGET RECEIPTS BY SOURCE ANDOUTLAYS BY FUNCTIONin the first 7 months of the current fiscal year receipts were $7.4 billion above a year earlier while outlays were $9.7billion higher.
BILLIONS OF DOLLARS BILLIONS OF DOLLARS
20 - - 20
180
140
120
100.
80
60
40
OUTLAYS(EXPENDITURES AND NET LENDING) «••"***
/X"
^++*
NONDEFENSE *****- Y *.*•"""""""""*
^^^**
_,.....•-' *"~ ^ \- .. -«.-—"-"**"*"" _^^^^^ NATIONAL DEFENSE
^ I I I I I I I t I I I j^1962 1963 1964 1965 1966 1967 1968 1969 1970 1971 1972 J/ 1973 J/
VEST.MATE ' FISCAL YEARS
SOURCES. TREASURY DEPARTMENT AND OFFICE OF MANAGEMENT AND BUDGET COUNCIL OF ECONOMIC ADVISERS
180
140
ion
100
80
60
40
[Billions of dollars]
Period
Fiscal year:196119621963196419651966196719681969197019711972219732
Cumulative totals forfirst 7 months:
Fiscal year 1971Fiscal year 1972___
Total
94. 499. 7
106. 6112. 7116.8130. 9149. 6153. 7187. 8193. 7188.4197.8220. 8
103. 4110. 8
Recei]
Individualincometaxes
41. 345. 647. 648.748.855. 461. 568. 787. 290. 486. 286. 593. 9
53.054.4
pts
Corpo-rationincometaxes
21. 020. 521. 623. 525. 530. 134. 028. 736. 732. 826. 830. 135. 7
11.812. 9
Other
32. 133. 637.440. 542. 645. 354. 156. 363. 970. 575.481. 291. 2
38.543. 5
Total
97. 8106. 8111. 3118. 6118.4134.7158. 3178. 8184. 5196. 6211.4236. 6246. 3
121. 3131. 0
Natio
Total
47. 451. 152. 353. 649. 656.870. 180. 581. 280. 377.778.078.3
44. 741. 9
(
nal defense
Depart-ment ofDefense,military 1
43.346. 948. 149. 646. 054. 267. 577. 477.977. 274.575. 075. 9
43. 140. 5
)utlays
Interna-tionalaffairsand
3.44. 54. 14. 14.34. 54. 54. 63. 83. 63. 14. 03. 8
1. 62. 1
Healthand
incomesecurity
22. 123. 725. 526.827.431. 537. 843. 749. 356. 770.282. 287.8
38. 644. 9
In-terest
8. 18. 39. 29. 8
10. 411. 312. 613. 715. 818. 319.620. 121. 2
11. 211. 8
Other
16. 819. 220. 324. 226. 730.633. 236. 234.437.740.952. 355. 2
25. 230.3
1 Expenditure account.* Estimates.
Sources: Treasury Department and Office of Management and Budget.
36Digitized for FRASER http://fraser.stlouisfed.org/ Federal Reserve Bank of St. Louis

;DERAL SECTOR, NATIONAL INCOME ACCOUNTS BASIS-recording to current estimates for the fourth quarter, Federal receipts rose $51/3 billion (seasonally adjusted annualrate) and expenditures increased $4 billion, yielding a deficit of $251/2 billion.
BILLIONS OF DOLLARS260
240
220
BILLIONS OF DOLLARS
140
120
180
160
140
120
+20
Q
_nri
-40
SURPLUS
-
~ DEFICITi I I
SOURCE: DEPARTMENT OF CC
^^^
\ \ \
1967
DMMERCE
Hi "*
! . 1 . I1968
•
Finn,,
! 1 11969
CALENDAR YEARS
88 I 1 |
! \ \
1970
l|l^ ^
I I1971
IW
cot
-
-
1 I 11972
NCIL OF ECONOMIC ADVISERS
+20
*5A
-40
I Billions of dollars, quarterly data at seasonally adjusted annual rates]
i V n . n i
Fiscal year:I 1 H 1 7I ' .M- .X1 ! ) ( > < >]«)701971 *>_„1972 i _ _ _1973 * _ _ _
Dalendaryear:19671968196919701971 *>___
1970:I___IT__III_IV..
1971:I___II__III_
' IV"
Tola !
M7. '2100. 0190. 3194. 6194. 0202. 8227. 9
151. 2175. 0196. 9191. 5198. 8191. 6193. 8191. 3189. 3196. 5197. 7197. 8203. 1
Federal (
1 ' i • r s i > 1 1 ; il a x M i n i
err, a p i s
<M. f>71. 490. 093. 887. 791. 398. 3
67. 579. 794. 992. 289. 093. 894. 589. 791. 086. 687. 688. 893. 0
Jovcrmn
( 'orpor a l e
pro! , l sl a x
a c c r u a l s
5 1 . 1>>>. 737. 332. 832. 533. 040. 7
30. 736. 736. 330. 633. 6
30. 630. 931. 929. 0
34. 134. 833. 232.1
( M i l , reeeip
1 n d i r e c i1 > us i n essl a x a n dn o n t a x
acc rua l s
J f> . 817. 118. 619. 220. 319.820. 7
16. 318. 019. 019. 320.319. 019. 119.719. 420. 719.919.720. 7
ts
( ' m i l r i -1 ) i j l ions
r,, r.social in-surance
35. 738. 344. 348. 853. 558. 768. 2
36. 740. 746. 849. 356. 048. 249. 250. 049. 855. 155.556. 157.2
Tota l
154. 5172.5185. 9197. 2212. 4237. 8255. 9
163. 6181. 5189. 5205. 3221. 9196. 1207. 9206. 7209. 8212. 7221. 4224. 6228. 7
Fee
Pur-chases
ol ^oodsand
services
85. 394. 999. 399. 295. 3
103. 0107. 0
90. 798. 899. 297. 297. 6
100. 296. 896. 195. 996. 496. 097.6
100. 3
leral Go^
Trans-fer pay-
ments
39. 444. 850. 756. 969. 979. 887. 4
42. 248. 252. 463. 475. 956. 165. 364. 667. 569. 677. 878. 078. 1
/eminent
( iranis-in-aid
to Stateandlocal
govern-ments
14. 817.819. 422. 627. 036. 240. 6
15. 818. 720. 324. 429. 623. 023. 924. 925. 927. 029. 530. 231.6
, expend]
Netinterest
paid
9. 910. 912. 314. 014. 213.414.8
10. 211. 713. 114. 613.714.314. 315. 014.814. 013.313. 913. 8
tures
Subsidiesless
currentsurplus ofGovern-
ment en-terprises
5. 14. 14. 14. 65. 95. 46.0
4. 64. 14. 65. 55. 15. 05. 55.85.7
5. 84. 84.84. 9
Less:Wage
accrualslessdis-
burse-ments
0.0. 0.0. 1. 1. 0.0
. 0
. 0
.0
. 0
.0
2. 5-2. 1
4.' 0. 0. 0.0. 0
Surplusor
denciij. (~~)'income
anolproduct
accounts
-7.3-11.9
4. 4-2. 7
-18.4— 35. 0-28.0
-12.4— 6. 5
7.3— 13. 6-23. 1-4. 5
-14. 1-15. 4-20. 5-16. 2-23. 7-26.7-25.6
1 Estimates.Source: Department of Commerce. 37
Digitized for FRASER http://fraser.stlouisfed.org/ Federal Reserve Bank of St. Louis

UNITED STATESGOVERNMENT PRINTING OFFICE
DIVISION OF PUBLIC DOCUMENTS
WASHINGTON, D.C. 2O4O2
OFFICIAL BUSINESS
First-Class Mail
POSTAGE AND FEES PAIDU.S. GOVERNMENT PRINTING OFFICE
ContentsTOTAL OUTPUT, INCOME, AND SPENDING Page
The Nation's Income, Expenditure, and Saving 1Gross National Product or Expenditure 2National Income 3Sources of Personal Income 4Disposition of Personal Income 5Farm Income 6Corporate Profits 7Gross Private Domestic Investment 8Expenditures for New Plant and Equipment 9
EMPLOYMENT, UNEMPLOYMENT, AND WAGESStatus of the Labor Force 10Selected Measures of Unemployment and Part-Time Employment 11Unemployment Insurance Programs 12Nonagricultural Employment 13Weekly Hours of Work—Selected Industries 14Average Hourly and Weekly Earnings—Selected Industries 15
PRODUCTION AND BUSINESS ACTIVITYIndustrial Production 16Production of Selected Manufactures 17Weekly Indicators of Production 18New Construction . 19New Housing Starts and Applications for Financing 20Business Sales and Inventories—Total and Trade 21Manufacturers' Shipments, Inventories, and New Orders 22Merchandise Exports and Imports 23U.S. Balances on Goods, Services, and Transfers 24U.S. Overall Balances on International Transactions 25
PRICESConsumer Prices 26Wholesale Prices 27Prices Received and Paid by Farmers 28
MONEY, CREDIT, AND SECURITY MARKETSMoney Supply $ . 29Private Liquid Asset Holdings—Nofinancial Investors 30Bank Loans, Investments, Debits, and Reserves 31Consumer and Real Estate Credit 32Bond Yields and Interest Rates 33Common Stock Prices, Yield, and Earnings 34
FEDERAL FINANCEFederal Budget Receipts, Expenditures, and Net Lending 35Federal Budget Receipts by Source and Outlays by Function 36Federal Sector, National Income Accounts Basis 37
NOTE.—Detail in these tables will not necessarily add to totals because of rounding.Unless otherwise stated, all dollar figures are current dollars.P Indicates preliminary and not available.
i
For sale by the Superintendent of Documents. U.S. Government Printing Office. Washington, D.C. 20402Price 25 cents per copy, $3 per year ; S4 foreign. Domestic air mail, $3.60 additional per year.
38 U.S. G O V E R N M E N T P R I N T I N G O F F I C E : 1972
Digitized for FRASER http://fraser.stlouisfed.org/ Federal Reserve Bank of St. Louis