economic indicators june 2014
DESCRIPTION
Economic Indicators and Monthly Overview June 2014TRANSCRIPT

| [Presentation title] | [Client Name] | [Date] 1
Economic Indicators
Last update 13.6.2014

| Economic Indicators | 2
Economic Outlook Monthly Overview – June 2014
Europe:
• Consensus June GDP forecast for WE remained stable on 1,5% for 2014 and on 1,8% for 2015.
• The EU industrial confidence remained stable while the consumer confidence indicator
continued its positive development from the last months in May.
• The IFO Business Climate index for Germany slightly fell in May. A lull was seen in the German
economy in May.
• ECB cut its benchmark rate from 0,25% to 0,15% and its deposit rate from 0% to -0,1% on
June 5 in order to encourage banks to lend to businesses. ECB president Mario Draghi indicated
that the bank would do more if necessary in order to contribute to a return of inflation rates to
levels closer to 2%.
US:
• Consensus June GDP forecast for the US decreased again from 2,5% to 2,2% for 2014.
Forecast for 2015 remained on 3,1%.
• GDP prospects have dimmed this month after Q1 growth was downgraded to -1,0% q-o-q from
+0,1%. The poor outturn was largely due to frigid weather. Many economists do not appear overly
concerned about the Q1 impact. The hope is that the next three quarters can make up somewhat
for this year’s poor start.
Japan:
• The June GDP growth forecast for Japan improved from 1,3% to 1,5% for 2014 and from 1,2%
to 1,3% for 2015.
• Japanese GDP beat expectations as consumers ramped up spending ahead of the April 1 sales
tax hike. Still, expectations are for a substantial slowdown in private consumption over the
coming months.

3 | Economic Indicators |
Eurostat Data

| Economic Indicators | 4
Economic Indicators – GDP EU 28
Source: Eurostat June 14
-5
-4
-3
-2
-1
0
1
2
3
4
08
Q1
09
Q1
10
Q1
11
Q1
12
Q1
13
Q1
14
Q1
%
GDP for the EU 28 countries at constant prices quarter vs. same quarter of last year

| Economic Indicators | 5
Economic Indicators – GDP EU 28
Source: Eurostat June
14
-2,5
-2
-1,5
-1
-0,5
0
0,5
1
08
Q1
09
Q1
10
Q1
11
Q1
12
Q1
13
Q1
14
Q1
%
GDP for the EU 28 countries at constant prices quarter on quarter

| Economic Indicators | 6
Economic Indicators –EU 28 Consumer Price Index
Source: Eurostat May 14
0
0,5
1
1,5
2
2,5
3
3,5
4
4,5
08
/1
09
/1
10
/1
11
/1
12
/1
13
/1
14
/1
15
/1
14.Apr; 0,8
%
The harmonized index of consumer prices is the result of the collaboration
between Eurostat and National Statistical Institutes of the Member States.

| Economic Indicators | 7
Economic Indicators – ECB interest rate
Source: ECB, FED, Eurostat Jun 14
May 14; 0,5
Jun.14; 0,15
Jun.14; 0,25
-0,5
0,0
0,5
1,0
1,5
2,0
2,5
3,0
3,5
4,0
4,5
Jan
08
Ju
ly 0
8
Jan
09
Ju
l.09
Jan
10
Ju
l.10
Jan
11
Ju
ly 1
1
Jan
12
Ju
l.12
Jan
13
Ju
l.13
Jan
14
Ju
l.14
Jan
15
%
ECB short-term rate
Eurozone inflation
FED rate

| Economic Indicators | 8
Economic Indicators –EU 28 Unemployment Rate
Source: Eurostat Jun 14
10,4
6
7
8
9
10
11
12
Ja
n 0
8
Ja
n 0
9
Ja
n 1
0
Ja
n 1
1
Ja
n 1
2
Ja
n 1
3
Ja
n 1
4
Ja
n 1
5
%
Unemployment rate for EU 28 countries
| Economic Indicators | 9
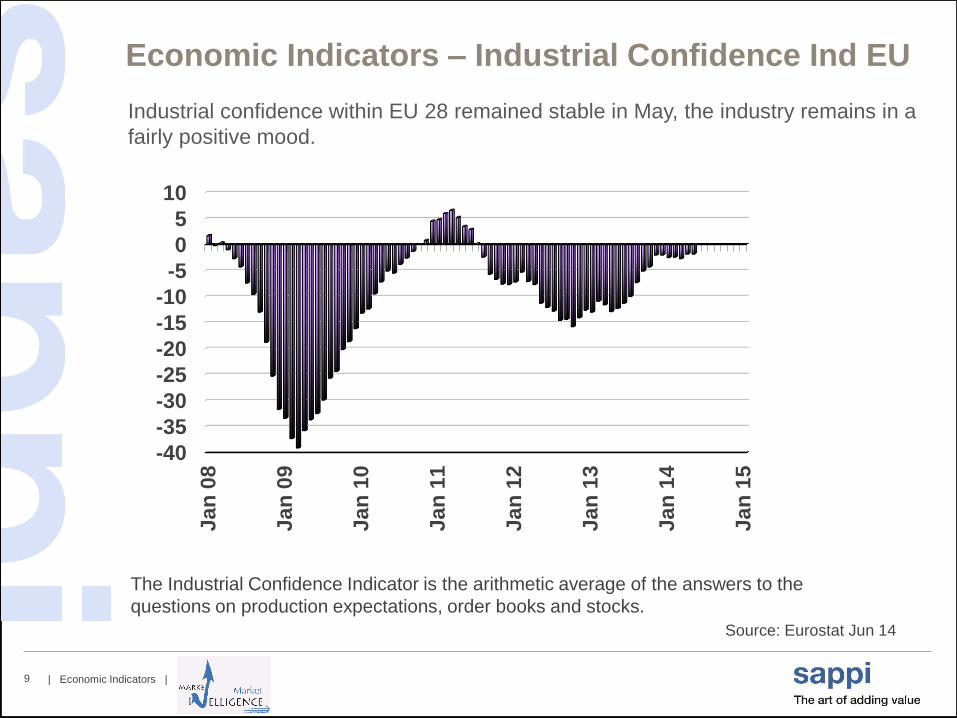
Economic Indicators – Industrial Confidence Ind EU
Source: Eurostat Jun 14
-40
-35
-30
-25
-20
-15
-10
-5
0
5
10Jan
08
Jan
09
Jan
10
Jan
11
Jan
12
Jan
13
Jan
14
Jan
15
Industrial confidence within EU 28 remained stable in May, the industry remains in a
fairly positive mood.
The Industrial Confidence Indicator is the arithmetic average of the answers to the
questions on production expectations, order books and stocks.

| Economic Indicators | 10
Economic Indicators – Consumer Confidence Ind EU
Source: Eurostat Jun 14
Consumer Confidence within EU 28 continued its positive path in May and reached
its highest level since October 2007.
-35
-30
-25
-20
-15
-10
-5
0
Jan
08
Jan
09
Jan
10
Jan
11
Jan
12
Jan
13
Jan
14
Jan
15
The Consumer Confidence Indicator is the arithmetic average of the answers to the questions
on the financial situation of households and general economic situation (past and future)
together with that on the advisability of making major purchases.

| Economic Indicators | 11
Economic Indicators – Capacity Utilization
in Manufacturing Industry in % - EU 27
Source: Eurostat May 14
60
65
70
75
80
85
04
Q1
05
Q1
06
Q1
07
Q1
08
Q1
09
Q1
10
Q1
11
Q1
12
Q1
13
Q1
14
Q1
79,5
%
The capacity utilization in manufacturing industry gives the level of capacity utilization
in percent, as assessed by managers in manufacturing industry.

| Economic Indicators | 12
Ifo Data

| Economic Indicators | 13
Economic Indicators – IFO World Economic Climate
Source: IFO May 14
The Ifo World Economic climate clouded slightly regarding expectations in Q2 2014
but remains friendly overall.
This indicator is being updated on a quarterly basis.

| Economic Indicators | 14
Economic Indicators – IFO European Economic Climate
Source: IFO May 14
The economic climate in Europe continued its positive path in Q2 2014.
This indicator is being updated on a quarterly basis.

| Economic Indicators | 15
Economic Indicators – IFO NA Economic Climate
Source: IFO May 14
This indicator is being updated on a quarterly basis.

| Economic Indicators | 16
Economic Indicators – IFO Asia Economic Climate
Source: IFO May 14
This indicator is being updated on a quarterly basis.
The economic climate in Asia slowed down quite significantly in Q2 2014.

| Economic Indicators | 17
Economic Indicators – GDP Forecast Euro Area
Source: IFO May 14

| Economic Indicators | 18
Economic Indicators – GDP Forecast Germany
Source: IFO May 14

| Economic Indicators | 19
Economic Indicators – Exchange rate $ vs €
Source: IFO May 14

| Economic Indicators | 20
Economic Indicators –
Ifo business situation and 6 month expectations
Source: IFO Jun 14
75
80
85
90
95
100
105
110
115
Jan
08
Jan
09
Jan
10
Jan
11
Jan
12
Jan
13
Jan
14
Jan
15
80
85
90
95
100
105
110
115
120
125
Jan
08
Jan
09
Jan
10
Jan
11
Jan
12
Jan
13
Jan
14
Jan
15
Business situation 6 months expectations
The IFO-Institut für Wirtschaftsforschung business situation index shows the current evaluation of the
economic situation, while the 6 month expectations index shows the expectations of the companies for the next
6 months. Over 7000 companies are being interviewed.
The Ifo Business Climate Index for Germany slightly fell in May. Assessments of the current
business situation were no longer as favorable as in April and companies were also less
optimistic about future business developments. A lull was seen in the German economy in
May.

| Economic Indicators | 21
Economic Indicators – IFO Assessment of Current
Business Situation
Source: IFO Jun 14
The Ifo Business Climate Index for Germany slightly fell in May. Assessments of the current
business situation were no longer as favorable as in April and companies were also less
optimistic about future business developments. A lull was seen in the German economy in
May.

| Economic Indicators | 22
Economic Indicators – IFO business climate index
printing industry
Source: IFO Jun 14, bundesverband druck und medien
-60
-50
-40
-30
-20
-10
0
10
20
Jan
08
Jan
09
Ja
n 1
0
Jan
11
Jan
12
Jan
13
Jan
14
Jan
15
The IFO-Institut für Wirtschaftsforschung business climate index for the printing industry is
based on a monthly representative questionnaire to 300 German printers.
The business climate within the printing industry came down from +10 to -3 in May.

| Economic Indicators | 23
Economic Indicators – IFO business climate index
printing industry
The IFO-Institut für Wirtschaftsforschung business climate index for the printing industry is
based on a monthly representative questionnaire to 300 German printers.
Business Development at German Printers – May 2014:
The assessment of the current business situation in the printing
industry deteriorated in May but still reached a better level than in May
of the previous year.
The business climate – an indicator for the development in
the next quarter – cooled down from a positive 10% to -3% in May.
The business expectations for the coming 6 months also deteriorated.
They fell to the level of the beginning of the year, only 10% of the printers
expect an improvement of the business activity during the coming 6
months.
Source: IFO Jun 14, bundesverband druck und medien

| Economic Indicators | 24
Zenith Data

| Economic Indicators | 25
Global Advertising Growth – Zenith 4/14 Press Release
Source: ZenithOptimedia 4/14

| Economic Indicators | 26
Regional Advertising Development –
Zenith 4/14 Press Release
Source: ZenithOptimedia 4/14

| Economic Indicators | 27
Global Advertising Market – Zenith 4/14 Press Release
Source: ZenithOptimedia 4/14

| Economic Indicators | 28
Advertising by medium – Zenith 4/14 Press Release
Source: ZenithOptimedia 4/14