economic indicators for greater cheyenne - wyoming center for
TRANSCRIPT
Economic Indicators for Greater Cheyenne Volume XXIX - Number 1March 2013
Wyoming Center for Business & Economic Analysis307-632-1347wyomingeconomicdata.com

Economic Indicatorsfor Greater Cheyenne
Annual Trends Edition
Wyoming Center for Business and Economic Analysis
Volume XXIX, Number 1March, 2013

Table of ContentsEconomic Indicators Summary ......................................... 1Business Trends
Cheyenne/Laramie County Profile .......................................4Laramie County Retail Sales by Sub Sectors ......................6Laramie County Sales and Use Tax Receipts ......................7Figure 1 - Sales and Use Taxes
Total Tax Distributions .................................................. 8Selected Laramie County Sales and
Use Tax Distributions ......................................................9Growth Rates .......................................................................10Figure 2 - Growth Rates – Population vs Employment ....11Figure 3 - Growth Rates – Wages,
Personal Income and Real GDP .....................................11Laramie County Gross Domestic Product..........................12Cheyenne Electrical Power Sales .......................................13Figure 4 - Commercial Electric Power Sales .....................14Cheyenne Gas Consumption...............................................15Cheyenne Utility Hookups..................................................16Laramie County Auto Registrations (Titles) ......................17Laramie County Enplanements .........................................18Tourism Activity ..................................................................19
Employment TrendsLabor Force Averages ..........................................................22Figure 5 - Unemployment Rate ..........................................23Laramie County Employment (BEA) .................................24Current Employment Statistics .........................................25Laramie County Employers ................................................26Laramie County Proprietors ...............................................27Figure 6 - Proprietor Income vs Annual Earnings ............28Laramie County Employment Projections .........................29Major Employers in the Cheyenne Area ............................30Firms by Size and Industry in 2010 ...................................31
Wages, Earnings & Income Trends2011 Household Income ......................................................34Median Household Income .................................................342011 Earnings by Gender ...................................................34Average Wage and Compensation Per Job ........................34Figure 7 - Average Wage and Average
Compensation Per Job....................................................35Laramie County Average Annual Earned Income .............36Per Capita Personal Income ...............................................37
Figure 8 - Per Capita Personal Income ..............................38Laramie County Personal Income and
Earnings by Industry (BEA) ..........................................39Figure 9 - Personal Income .................................................41Laramie County Total Payroll ............................................42
Demographic TrendsCensus Detail ......................................................................45Population Estimates and Projections ...............................46Figure 10 - Population Forecasts .......................................47Laramie County Population Profiles ..................................48Population by Race and Ethnic Groups .............................49Population by Age and Gender ...........................................49Migration & Commuters .....................................................50Figure 11 - Commuting Flows ............................................51Figure 12 - Net Residential Adjustment ............................51Commuter Income Flows ....................................................52Laramie County Education Profiles ...................................53Public and Private School Enrollment ...............................54Figure 13 - Public School and College Enrollment ............55
Housing TrendsAnnual Core Logic Residential Market Data ....................58Residentials for Sale, Sold & Price .....................................59Cheyenne Housing Rental Rates ........................................60Housing Profile – Laramie County .....................................61Figure 14 - Residential Housing Profile .............................62Housing Profile – Cheyenne Area .......................................63Building Permits .................................................................64Residential Construction Activity ......................................65Historic Housing Occupancy...............................................66Vacancy Rates ......................................................................67
Development TrendsAnnexation Trends ..............................................................70Commercial Construction Activity .....................................71Figure 15 - Residential and Commercial
Construction Valuation ..................................................72New Commercial/Industrial Construction .........................73Commercial Property ..........................................................74Assessed Real and Personal Property Value .....................75Figure 16 - Assessed Real and Personal Property Values ...76Major Property Tax Districts ..............................................77Figure 17 - Major Property Tax Districts ...........................78
Editor ..................................................................................................................................R.T. O’GaraResearch Assistance ....................................................................................................... Cindy BranchTypography ................................................................................................................... Stacy Shultz-Bisset Cover Design ...................................................................................................................Cheyenne LEADS
The articles appearing in this publication represent the opinions of the authors and do not necessarily reflect the views of the various funding organizations. Duplication or quotation of material in this publication is welcomed, but it is requested that the Center be credited.
COMMUNICATIONS Data Center Phone: (307) 632-1347 Mailing Address: Wyoming Center for Business & Data Center FAX: (307) 632-1368 Economic Analysis, Inc. Editor e-mail: [email protected] 1720 Carey Ave., Suite 520 Cheyenne, WY 82001

Page 1 Economic Indicators
Economic IndicatorsSummaryThe purpose of the Annual Trends is to summarize and illustrate the Cheyenne/Laramie County local economy over the past 10 years or more. It presents the latest available, federal, state and local agency statistics dealing with Laramie County’s economic and demographic growth patterns. Business and government planning requires a realistic assessment of past trends of the existing economy and realistic assumptions about the future. The indicators and statistics contained in this report can be used as a relative measure of future economic activity in Cheyenne and Laramie County.
2012 in ReviewIt has been five years since the onset of the Great Recession (December 2007) and its official ending in June 2009. At this point in time, the majority of the data sources now allow for a full assessment of the impacts of the downturn and how well the Greater Cheyenne economy has recovered.
The earlier assessment that the local economy took a relatively mild hit from the recession is permanently affirmed. Year 2009saw the heaviest losses while 2010 also saw some downside carryover effects, especially within the labor market. By yearend 2011, the local economy was well into recovery and by the end of 2012, almost every sector had fully recovered and most had returned or exceeded historical growth rates. Below are summary details.• New job growth was solid for both 2011 and 2012.
One series posted growth rates of 2.3 percent for 2011 and 2.9 percent for 2012. Another increased at 5.3 percent in 2011 and 1.7 percent in 2012. The U.S. Department of Commerce, Bureau of Economic Analysis (BEA), reported job growth at -0.9 percent in both 2009 and 2010 and a positive rate of growth of 1.8 percent in 2011. BEA counts both part-time and full-time jobs in their statistics, and it reported a total of 63,105 jobs in Laramie County in 2011. It reported 63,155 jobs in 2008. See Table 1.4 for more details.
• Job growth should spawn personal income growth and without income growth households cannot meet ever increasing fixed expenditures and they cannot increase discretionary spending. BEA data showed personal income grew at an unsustainable rate of 11.1 percent in 2008 and then promptly fell 6.0 percent in 2009. However, it immediately recovered by rising 4.1 percent in 2010 and 6.5 percent in 2011. Data for 2012 is not available. Even with these wide swings in growth, local households still experienced substantial real personal income growth between 2008 and 2011. Total personal income stood at 4.345 billion dollars in 2011.
• Average county wages as presented in Table 1.4 increased at an average rate of 2.51 percent between 2007 and 2011 which would be expected given the rise in personal income mentioned above.
• The growth in personal income and wages provided ample opportunities for local households to increase their spending following the Great Recession and they did not disappoint as Table 1.1 presents. Retail sales grew 2.0 percent in 2010, 1.1 percent in 2011 and 5.0 percent in 2012. At minimum, estimated retail sales ended 2012 at 1.1 billion dollars.
• Laramie County’s real Gross Domestic Product (GDP) numbers are presented in Tables 1.4 and 1.5. There was a sharp and deep revision in 2009 numbers by the BEA this year. Last year BEA reported that real GDP increased 7.96 percent in 2009 and this year’s revised number reported a 3.33 percent decrease instead. Such a large revision was due to BEA’s top-down modeling which takes the overall state number and then reduces it to fit county level proportions plus the probable recognition that 2009’s original 7.96 percent increase was in serious contradiction to most other economic and financial data that reported declines in 2009 due to the Great Recession. Even with this revision, local real GDP rebounded by 3 percent in 2010 and 2.4 percent in 2011. By 2011 the county’s real GDP stood at 4.354 billion dollars. Nominal (unadjusted for inflation) GDP registered even larger rebound numbers for 2010 and 2011, 6.4 percent and

Page 2 Economic Indicators
7.4 percent respectively. These revised GDP numbers were released on February 22, 2013. Year 2012 statistics are not available.
• As a consequence of the increases in job growth, personal income and retail sales, sales tax receipts to local county governments increased sharply following 2009. Total distributions as reported in Column 1 of Table 1.2 grew at an average rate of 7.0 percent between 2009 and 2012. Revenues from the 6th Penny sales tax also rose at a similar pace, 7.3 percent for that period.
• The Laramie County construction sector (industrial, commercial and residential)was the first to feel the impacts of the Great Recession and was the last sector to begin to recover from the down turn. Within the borders of Cheyenne, the number of issued building permits actually presaged the recession. Between 2001 and 2005, City permits averaged 2,464 per year. In 2006, they dropped to 1,795 (-27.2%) and eventually reached a recession low of 1,402 in 2009. The series rebounded each year since 2009 and finished 2012 at 1,952 which still left it 21 percent below the pre-recession average of 2,464. Even though the number of permits in 2012 still lagged pre-recession levels, the total dollar value of permits rose to 185 million dollars in 2012 which was the second highest total we have on record (1985). The highest valuation was set in 2007 at 189 million dollars.
• New residential construction within Cheyenne moved in tandem with the national recession. The dollar value of residential construction began to contract in 2006, down 24.5 percent from 2005 and eventually bottomed out at $20.5 million dollars in 2008, a drop of 69.0 percent from 2005’s peak
of 66 million dollars. Since 2008, valuations have inched back up and closed 2012 at 39 million dollars which still left this indicator well behind its peak years, 2004 and 2005.
• Table 5.2 presents the actual number of housing units by type constructed in Laramie County from 1984 through 2012. The bubble years were 2004 and 2005. New residential construction plunged 45 percent in 2006 and then fell another 32 percent in 2007. In 2005, 674 single-family homes were built and by 2009 that figure had fallen to 229. Since 2009, single-family construction has crawled upwards and at the end of 2012, it had reached 350 units. This was highest total since 2006. An analysis of new construction of owner occupied housing (single-family detached, townhomes and condominiums) between 2000 and 2012 revealed that the stock of such housing increased at an annual average rate of 1.69 percent over that period for the greater Cheyenne economy. Approximately, 4,880 new units were built over the twelve year period. In addition, county-wide population growth was 1.13 percent between 2000 and 2011.
• Countywide, new industrial and commercial construction activity had a banner year in 2012. Total dollar valuation of such activity essentially tied a historical high last year. There was 167 million dollars’ worth of new industrial and commercial in 2012. Fifty-one million of this total was within city limits and balance outside of its borders. The last time the city saw such a volume of new commercial construction was in 2001. Records for the county for this series only go back to 2005 and thus 2012 established a new high in the unincorporated areas of the county.

Business TrendsThis section contains core business data sets designed to measure overall economic growth for the greater Cheyenne economy.
For example Table 1.4 provides 10 core growth measures such as population, jobs, personal income and GDP. The reader will quickly see to what degree the Great Recession impacted the local economy and when those impacts occurred.
Interestingly, Laramie County’s population grew at strong rates right through the recession years and according to the most recent Census Bureau estimates (March 15, 2013), population growth accelerated over the past three years. The Bureau reported the 2012 population total at 94,483 persons which was an increase of 2,745 persons since the 2010 Census. Over the past 5 years, the growth rate averaged 2.2 percent which was well above the long-term growth rate of 1.0 percent. Of the 2,745 person increase reported above, 1,487 of this total were due to in-migration and 487 were due to natural growth (births – deaths). In-migration then overwhelmed natural growth by a 3 to 1 ratio. Given the relatively strong growth in jobs over the last few years, the sharp rise in Census Bureau population estimates was not unexpected. Table 1.4 provides additional details.
It is generally assumed that growth in the county’s population is tied to job growth and thus if job growth is negative, there should be a decline or loss in population. Given the fact there were job losses in 2009 and 2010, the expectation would be to see population losses, but apparently that was and will not be the case (See Figure 2 and Table 1.4). Total school enrollments countywide (Table 4.7) increased 2.3 percent in 2009, remained unchanged in 2010, and increased fractionally in both 2011 and 2012. This unexpected result was due, in large part, to the fact that local job losses were marginal within the full-time employed workforce. Second, given the severity of the national recession, job losers had very few options to relocate to better performing local economies.
Figure 3 presents the relationship between personal income growth, wage growth and county Gross Domestic Product (GDP). As can be seen, personal income growth normally exceeded the growth in wages until 2009 when it fell below that series, but by 2010, the long-term trend had returned and by 2011 its growth rate was well ahead of the other two series. Non-labor income (dividends, interest, and rents) after falling in 2009 increased for the next two years and finished 2011 at 933 million dollars, up 6.9 percent from 2010. However, it still lagged the historical high (1.151 billion dollars) reached in 2008.
Table 1.11 provides yearend statistics for the local tourism industry. The various measures for tourism activity offered a conflicted view of how this sector has fared over the past few years. The visitation declines reported for the Old West Museum and the Pine Bluffs Information Center were troubling. The sharp drops reported by the Visit Cheyenne Walk-In Count and the I-25 Visitor Center were due to a change in administrative counting procedures at Visit Cheyenne and by the fact the I-25 Visitor Center was closed for a few weeks as it moved to its new location this past summer. The 27.1 percent increase in visitors at the State Museum in 2012 obviously contradicted the declines reported above. The decreases reported at local hotels and motels in Nights Occupied and Occupancy Rates for 2012 were apparently tied to a slackening in exploration and drilling activities associated with the Niobrara shale play.
SECTION 1 BUSINESS TRENDS
Table1.0 Cheyenne/Laramie County Profile1.1 Laramie County Retail Sales
By Sub Sectors (2008 - 2012)1.2 Laramie County Sales and
Use Tax Receipts (1991 - 2012)Figure 1 - Laramie County Sales & Use Taxes
1.3 Selected Laramie County Sales and Use Tax Distribution (1986 - 2012)
1.4 Growth Rates (1995 - 2012)Figure 2 - Growth Rate Population vs. EmploymentFigure 3 - Growth Rates - Wages, Personal Income & Real GDP
1.5 Laramie County GDP (2001 - 2011)1.6 Electrical Power Sales (1988 - 2012)
Figure 4 - Commercial Electric Power Sales
1.7 Gas Consumption (1991 - 2012)1.8 Utility Hookups (1990 - 2012)1.9 Auto Registrations (1996 - 2012)1.10 Enplanements (1995 - 2012)1.11 Tourism Activity (2004 - 2012)

Page 4 Economic Indicators
Table 1.0
Cheyenne/Laramie County ProfileITEMS MOST RECENT PERIOD PREVIOUS PERIOD % CHANGE
IN VALUEYEAR VALUE YEAR VALUEDemographyTotal Population - Cheyenne¹ 2011 58,640 2010 59,466 -1.39%
Total Population - Laramie County 2012 94,483 2011 92,487 2.16%
Total Male Population 2011 45,020 2010 45,875 -1.86%
Total Female Population 2011 45,374 2010 45,863 -1.07%
% of Population - Under 20 Years Old 2011 27.2% 2010 27.4% -0.73%
% of Population - 65 Years & Older 2011 12.3% 2010 12.5% -1.60%
Median Age 2011 37.1 2010 37.0 0.27%
% of Population - White Alone (Non-Hispanic) 2011 87.2% 2010 88.5% -1.47%
% of Population - Native American Alone 2011 1.1% 2010 1.0% 10.00%
% of Population - Hispanic or Latino 2011 12.9% 2010 13.1% -1.53%
Households - County 2011 36,566 2010 37,576 -2.69%
Average Household Size - County 2011 2.4 2010 2.4 0.00%
Households - City 2011 24,693 2010 25,557 -3.38%
% of Households (HH) Headed by Married Couples 2011 50.9% 2010 43.1% 18.10%
% of HH Headed by Single Female (w/own children <18 yrs.) 2011 10.4% 2010 7.7% 35.06%
Weather & GeographyTotal Area (sq. miles)¹ 2000 2,688 - -
Total Area (sq. miles)¹¹ - Cheyenne 2012 25.52 2011 25.48 0.16%
Water Area (sq. miles) 2000 1.6 - -
Mean Elevation (ft.) 2000 6,100 - -
Normal Mean Temperature (F) - Cheyenne2 1949 - 06 45.9 1971-00 44.9 2.23%
Average Annual Precipitation (inches) - Cheyenne2 1949 - 06 14.6 1971-00 15.5 -5.50%
Average Wind Speed (mph) 1996 - 06 12.4 1992-02 12.6 -1.59%
Crime & Law EnforcementCrimes3 2011 2,784 2010 2,972 -6.33%
Crimes per 10,000 Persons 2011 308.0 2010 324.0 -4.93%
Homicides per 10,000 Persons 2011 0.2 2010 0.0
Rapes per 10,000 Persons 2011 4.3 2010 4.9 -11.44%
Robberies per 10,000 Persons 2011 3.3 2010 2.7 21.44%
Aggravated Assaults per 10,000 Persons 2011 16.9 2010 14.1 19.70%
Burglaries per 10,000 Persons 2011 43.6 2010 40.0 8.85%
Larcenies & Thefts per 10,000 Persons 2011 228.8 2010 277.2 -17.47%
Motor Vehicle Thefts per 10,000 Persons 2011 10.8 2010 14.1 -23.33%
Education% of Pop. (25 yrs. & older) with High School Diploma¹ 2011 92.2% 2010 93.8% -1.71%
% of Pop. (25 yrs. & older) with Bachelor’s Degree 2011 24.4% 2010 22.6% 7.96%
Pupil -Teacher Ratio in LCSD #14 2006-07 10.38 2005-06 10.36 0.19%
Pupil -Teacher Ratio in LCSD #2 2006-07 7.47 2005-06 6.53 14.40%
Expenditures Per Pupil in LCSD #1 2010-11 $15,170 2009-10 $14,585 4.01%
Expenditures Per Pupil in LCSD #2 2010-11 $20,462 2009-10 $18,930 8.09%
LCSD #1 Enrollment 2011 - 12 13,388 2010-11 13,370 0.13%
LCSD #2 Enrollment 2011 - 12 940 2010-11 916 2.62%
Total School Enrollments Laramie County 2011 - 12 14,883 2010-11 14,966 -0.55%
% of Students in Private Schools 2011 - 12 2.96% 2010-11 2.79% 6.09%
% of Students Home-Schooled 2011 - 12 1.71% 2010-11 1.72% -0.61%
ACT Average Composite Score (range 1-36) LCSD #1 2010-11 20.2 2009-10 19.1 5.76%
ACT Average Composite Score (range 1-36) LCSD #2 2010-11 20.5 2009-10 19.6 4.59%

Page 5 Economic Indicators
ITEMS MOST RECENT PERIOD PREVIOUS PERIOD % CHANGEIN VALUEYEAR VALUE YEAR VALUE
LCSD #1 Graduation Rate5 2010-11 75.72% 2009-10 76.61% -1.16%
LCSD #2 Graduation Rate 2010-11 89.29% 2009-10 83.05% 7.51%
Average Student Age at LCCC (Fall Semester)7 2011 26 2010 27 -3.70%
Median Student Age at LCCC (Fall Semester) 2011 22.36 - -
Full-time Equivalent (FTE) Enrollment at LCCC (Fall Semester) 2012 2,975.95 2011 3,136.68 -5.12%
3 - Year Graduation Rate at LCCC 2010 17.6% 2009 25.3% -30.55%
3 - Year Rate of Transfer from LCCC 2010 28.4% 2009 24.9% 14.18%
HousingAverage Rent for 2-3 Bedroom House ($)8 2Q12 $965 2Q11 $991 -2.62%
Average Rent for 2 Bedroom Apartment ($) 2Q12 $649 2Q11 $654 -0.76%
Average Rent for 2-3 Bedroom Mobile Home ($) 2Q12 $667 2Q11 $656 1.68%
Average Sales Price - Cheyenne 2012 $191,846 2011 $180,676 6.18%
Average Sales Price - Close-in Rural 2012 $285,984 2011 $265,153 7.86%
Laramie County's EconomyMedian Household Income¹ 2011 $54,156 2010 $48,784 11.01%
Mean Household Income 2011 $69,320 2010 $66,689 3.95%
Per Capita Personal Income ($)9 2011 $46,882 2010 $44,285 5.86%
Average Wage per Job 2011 $42,320 2010 $40,988 3.25%
Average Annual Pay ($)10 2011 $40,209 2010 $39,052 2.96%
Employment & LaborEmployment¹² 2012 45,583 2011 44,308 2.88%
Unemployment Rate¹³ 2012 6.0% 2011 6.7% -10.45%
Total Non-farm Jobs9 2011 62,169 2010 61,071 1.80%
% of Jobs in Farming 2011 1.48% 2010 1.47% 0.70%
% of Jobs in Mining 2011 N/A 2010 N/A -
% of Jobs in Government 2011 27.79% 2010 28.22% -1.52%
% of Jobs in Construction 2011 5.91% 2010 5.84% 1.26%
% of Jobs in Manufacturing 2011 2.65% 2010 2.61% 1.56%
% of Jobs in Trans. & Ware. 2011 5.72% 2010 5.55% 3.16%
% of Jobs in FIRE 2011 10.93% 2010 10.79% 1.37%
% of Jobs in Retail Trade 2011 10.92% 2010 10.99% -0.70%
% of Jobs in Wholesale 2011 1.61% 2010 1.63% -1.09%
Workforce Demographics% of Workforce Age 16-19¹ 2011 6.7% 2010 6.6% 2.25%
% of Workforce Age 20-24 2011 9.3% 2010 9.6% -3.25%
% of Workforce Age 25-44 2011 33.1% 2010 33.4% -0.93%
% of Workforce Age 45-54 2011 18.9% 2010 19.2% -1.33%
% of Workforce Age 55-64 2011 16.1% 2010 15.6% 2.89%
% of Workforce Age 65-74 2011 8.8% 2010 8.6% 2.30%
% of Workforce Age 75 and over 2011 7.0% 2010 6.9% 1.16%
% of Workforce Male 2011 50.6% 2010 50.6%
% of Workforce Female 2011 49.4% 2010 49.4%
CPIU.S. CPI 2012 229.6 2011 224.9 2.07%
Annual Inflation Rate - Cheyenne 2Q12 2.0% 2Q11 5.0% -Sources: 1 U.S. Census Bureau 2 Western Regional Climate Center 3 Wyoming Division of Criminal Investigation 4 Laramie County School Districts #1 & #2 5 Wyoming Department of Education
6 Office of Institutional Analysis, University of Wyoming 7 Laramie County Community College 8 State of Wyoming, Dept. of Admin. & Info., Economic
Analysis Division 9 U.S. Commerce Department, Bureau of Economic Analysis
10 U.S. Department of Labor, Bureau of Labor Statistics 11 City of Cheyenne 12 Wyoming Department of Employment, CES Data 13 Wyoming Department of Employment, LAUS Data 13 Wyoming Department of Employment, LAUS Data

Page 6 Economic Indicators
Table 1.1
Laramie County Retail Sales by Sub Sectors2008 - 2012
INDUSTRY (NAICS) 2008 2009 2010 2011 2012Auto Dealers and Parts 51,570,200 50,152,900 52,837,200 63,544,400 77,406,800Gasoline Stations 38,197,300 39,567,600 43,260,400 50,658,200 50,247,600Home Furniture and Furnishings 31,371,400 27,572,600 31,543,800 31,103,700 36,187,200Electronic and Appliance Stores 66,252,400 54,716,600 39,320,500 39,918,600 37,574,700Building Material & Garden 106,827,600 101,813,600 107,094,100 118,540,700 139,907,300Grocery and Food Stores 21,897,300 20,178,100 20,325,000 19,407,000 22,695,300Liquor Stores 16,322,500 15,086,000 15,026,600 16,064,700 17,202,900Clothing and Shoe Stores 40,194,500 41,084,800 41,381,500 45,472,700 50,211,200Department Stores 58,895,300 55,514,100 53,570,900 56,461,700 56,150,400General Merchandise Stores 112,139,900 121,387,400 117,054,300 129,856,700 123,601,700Miscellaneous Retail 63,200,700 58,896,900 71,878,600 66,802,300 65,525,000Lodging Services 37,066,900 34,652,800 38,775,900 44,456,700 44,558,900Eating and Drinking Places 144,445,500 142,509,500 146,935,100 157,674,300 171,439,100Automobile Sales 188,725,700 168,978,700 171,949,500 214,239,800 217,913,500TOTAL 977,107,200 932,111,600 950,953,400 1,054,201,500 1,110,621,600Source: Wyoming Department of Revenue

Page 7 Economic Indicators
Table 1.2
Laramie County Sales and Use Tax ReceiptsAnnual Total
1991 - 2012 (Dollars)
YEAR
TOTAL SALES TAX DISTRIBUTIONS
4% STATE & 1% OPTIONAL
(a)
4% STATE SALES AND USE TAX
DISTRIBUTIONS (b)
LOCAL OPTIONAL 1% SALES AND USE
TAX DISTRIBUTIONS
1991 14,214,108 7,743,249 6,470,8591992 15,030,132 8,260,537 6,769,5951993 15,783,892 8,675,088 7,108,8041994 16,945,691 9,260,700 7,684,9911995 17,634,051 9,673,791 7,960,2601996 19,999,036 11,223,626 8,775,4101997 21,048,071 11,177,653 9,870,4181998 21,494,660 11,541,365 9,953,2951999 23,492,966 12,426,483 11,066,4832000 24,833,339 13,115,173 11,718,1672001 26,406,542 13,800,674 12,605,5682002 29,011,725 15,428,989 13,582,7362003 29,528,829 15,855,502 13,673,3272004 30,559,319 16,501,718 14,057,6012005 31,733,902 17,213,493 14,520,4092006 33,118,921 * 17,894,618 15,224,3032007 32,702,985 * 17,636,107 15,066,6062008 33,114,106 * 17,827,988 15,286,1192009 31,517,315 * 16,979,116 14,529,1992010 31,846,764 * 17,051,836 14,794,9272011 36,323,256 * 18,977,386 17,345,8702012 38,495,663 20,616,860 17,878,803
Notes: (a) This total includes the 4% Sales and Use Tax, the 1 % Sales and Use Tax, and the Out of State Sales and Use Tax.
Prior to 1989, the percentage of sales and use tax collections distributed to counties was 33 %, From July 1, 1989 to June 30, 1992, it was 36.67%. From July 1, 1992 to June 30, 1993, the allocation was 35%. From July 1, 1993, it was changed to 28%. As of July 1, 2002, the percentage distribution was changed to 29.5%. As of June 30, 2004, the percentage distribution was changed to 31%. (b) State Sales and Use Taxes were increased from 3% to 4% on July 1, 1993 * Totals do not include state reimbursements for lost sales taxes previously levied on food salesSource: Wyoming Department of Revenue & Taxation

Page 8 Economic Indicators
FIGURE 1
Laramie County Sales and Use Taxes Total Tax Distributions
1991 - 2012
91 92 93 94 95 96 97 98 99 00 01 02 03 04 05 06 07 08 09 10 11 12
0
10
20
30
40Millions
Figure 1

Page 9 Economic Indicators
Selected Laramie County Sales and Use Tax DistributionsAnnual Totals
1986 - 2012 (Dollars)
YEARLODGING TAX
RECEIPTS (A)
% CHANGE
ESTIMATED TOTAL TAXABLE
SALES (B)
% CHANGE
1986 N/A 573,654,700 2.5%1987 N/A 560,841,236 -2.2%1988 202,981 570,305,413 1.7%1989 222,653 9.7% 585,918,593 2.7%1990 228,378 2.6% 635,181,509 8.4%1991 246,751 8.0% 647,085,861 1.9%1992 262,981 6.6% 676,959,513 4.6%1993 283,746 7.9% 710,880,409 5.0%1994 302,640 6.7% 768,499,065 8.1%1995 316,596 4.6% 796,025,960 3.6%1996 326,421 3.1% 877,541,038 10.2%1997 321,721 -1.4% 987,041,761 12.5%1998 344,509 7.1% 995,329,539 0.8%1999 362,725 5.3% 1,106,648,302 11.2%2000 399,193 10.1% 1,171,816,600 5.9%2001 400,237 0.3% 1,260,556,700 7.6%2002 453,917 13.4% 1,358,273,578 7.8%2003 582,681 28.4% 1,367,333,000 0.7%2004 646,724 11.0% 1,405,760,086 2.8%2005 691,081 6.9% 1,452,040,902 3.3%2006 845,936 22.4% 1,557,499,671 * 7.3%2007 1,128,773 33.4% 1,577,713,775 * 1.3%2008 1,156,118 2.4% 1,636,290,275 * 3.7%2009 1,058,485 -8.4% 1,632,019,917 * -0.3%2010 1,244,406 17.6% 1,569,042,742 * -3.9%2011 1,381,347 11.0% 1,734,587,019 10.6%2012 1,291,774 -6.5% 1,787,880,300 3.1%
Notes: (A) Lodging Tax Receipts: 7/1/87 - 3/31/03 - 2%; 4/1/03 - 3/31/07 - 3% effective 4/1/07 - 4% (B) Estimated Total Taxable Sales: amounts were added to reflect loss in sales taxes levied
on food *2006 - $350,694 *2007 - $710,532 *2008 - $1,076,784 *2009 - $1,791,000 *2010 - $895,500Source: Wyoming Department of Revenue & Taxation
Table 1.3

Page 10 Economic Indicators
Tables 1.4
Growth RatesLaramie County
1995 - 2012
YEARLARAMIE COUNTY
CITY OF CHEYENNE
EMPLOYMENT (CES)
BEA EMPLOYMENT
ANNUAL AVERAGE WAGES/JOB
POPULA-TION
% CHANGE
POPULA-TION
% CHANGE # JOBS %
CHANGE # JOBS % CHANGE $ %
CHANGE1995 79,513 0.80% 53,472 0.27% 35,092 1.86% 49,692 0.85% 22,700 2.52%1996 80,186 0.85% 53,692 0.41% 35,467 1.07% 50,127 0.88% 23,359 2.90%1997 80,238 0.06% 53,626 -0.12% 35,825 1.01% 50,635 1.01% 24,504 4.90%1998 80,522 0.35% 53,780 0.29% 36,417 1.65% 51,659 2.02% 25,819 5.37%1999 81,009 0.60% 53,925 0.27% 37,192 2.13% 52,383 1.40% 26,890 4.15%2000 81,607 0.74% 53,011 -1.69% 37,933 1.99% 53,997 3.08% 27,466 2.14%2001 82,554 1.16% 53,717 1.33% 38,183 0.66% 53,220 -1.44% 29,199 6.31%2002 83,226 0.81% 54,103 0.72% 39,208 2.68% 54,802 2.97% 30,799 5.48%2003 84,084 1.03% 54,709 1.12% 40,242 2.64% 55,998 2.18% 31,705 2.94%2004 85,427 1.60% 55,461 1.37% 40,833 1.47% 57,213 2.17% 33,077 4.33%2005 85,732 0.36% 55,533 0.13% 41,575 1.82% 58,438 2.14% 34,361 3.88%2006 86,819 1.27% 55,885 0.63% 42,908 3.21% 59,637 2.05% 37,391 8.82%2007 87,654 0.96% 56,313 0.77% 44,150 2.89% 61,659 3.39% 38,232 2.25%2008 89,077 1.62% 57,048 1.31% 45,158 2.28% 63,155 2.43% 39,478 3.26%2009 90,430 1.52% 57,618 1.00% 44,133 -2.27% 62,560 -0.94% 40,258 1.98%2010 91,738 1.45% 59,739 3.68% 43,342 -1.79% 61,984 -0.92% 40,988 1.81%2011 92,487 0.82% 60,096 0.60% 44,308 2.23% 63,105 1.81% 42320 3.25%2012 94,483 2.16% N/A — 45,583 2.88% N/A — N/A —
10 Year Avg. 1.28% 1.13% 1.54% 1.73% 3.80%5 Year Avg. 1.51% 1.47% 0.67% 1.15% 2.51%
Source: Census Bureau Source: Census Bureau Source: WY Dept of Workforce Services
Source: U.S. Dept. of Commerce
Source: U.S. Dept. of Commerce
YEARPERSONAL INCOME PER CAPITA
INCOMEREAL PER CAPITA
INCOME REAL COUNTY GDP RESIDENTIAL ELECTRIC
$ % CHANGE $ %
CHANGE $ % CHANGE ($000,000) %
CHANGE # HOOKUPS % CHANGE
1995 1,710,435 4.47% 21,828 3.61% 14,323 0.79% N.A. — 28,851 1.32%1996 1,782,412 4.21% 22,559 3.35% 14,378 0.38% N.A. — 29,295 1.54%1997 1,882,460 5.61% 23,736 5.22% 14,789 2.86% N.A. — 29,794 1.70%1998 2,031,156 7.90% 25,686 8.22% 15,758 6.55% N.A. — 30,319 1.76%1999 2,150,636 5.88% 26,957 4.95% 16,181 2.68% N.A. — 30,421 0.34%2000 2,292,534 6.60% 28,573 5.99% 16,593 2.55% N.A. — 30,806 1.27%2001 2,489,246 8.58% 30,161 5.56% 17,030 2.63% 3,238 — 30,946 0.45%2002 2,669,447 7.24% 32,080 6.36% 17,832 4.71% 3,360 3.77% 31,330 1.24%2003 2,837,070 6.28% 33,742 5.18% 18,338 2.84% 3,505 4.32% 31,776 1.42%2004 3,028,303 6.74% 35,449 5.06% 18,766 2.33% 3,636 3.74% 32,340 1.77%2005 3,208,013 5.93% 37,420 5.56% 19,160 2.10% 3,695 1.62% 35,065 8.43%2006 3,549,671 10.65% 40,885 9.26% 20,280 5.85% 3,947 6.82% 35,121 0.16%2007 3,751,313 5.68% 42,797 4.68% 20,645 1.80% 4,177 5.83% 35,057 -0.18%2008 4,168,039 11.11% 46,791 9.33% 21,733 5.27% 4,268 2.18% 35,136 0.23%2009 3,918,152 -6.00% 43,328 -7.40% 20,200 -7.05% 4,126 -3.33% 35,318 0.52%2010 4,080,008 4.13% 44,285 2.21% 20,305 0.52% 4,251 3.03% 35,478 0.45%2011 4,345,022 6.50% 46,882 5.86% 20,846 2.66% 4,354 2.42% 35,062 -1.17%2012 N/A. - N/A — N/A — N/A — 35,334 0.78%
10 Year Avg. 5.83% 4.61% 2.10% 3.04% 1.24%5 Year Avg. 4.28% 2.94% 0.64% 2.03% 0.16%
Source: U.S. Dept. of Commerce Source: U.S. Dept. of Commerce
Source: WCBEA Source: U.S. Dept. of Commerce
Source: CLF&P

Page 11 Economic Indicators
FIGURE 2
Growth Rates Population vs Employment
1995 - 2012
95 96 97 98 99 00 01 02 03 04 05 06 07 08 09 10 11 12
0
1
2
3
4
-1
-2
-3
Population Employment
Figure 2
Growth Rates Wages,Personal Income and Real GDP
1995 - 2011
95 96 97 98 99 00 01 02 03 04 05 06 07 08 09 10 11
0123456789
101112
-1-2-3-4-5-6-7
Percent Change From Previous Year
Wages Income Real GDP
FIGURE 3 Figure 3

Page 12 Economic Indicators
Laramie County Gross Domestic Product2001 - 2011
YEAR REAL GDP
% CHG.
NOMINAL GDP
NOMINAL GROWTH
REAL PER
CAPITA GDP
% CHG.
2001 3,238 2,737 39,2242002 3,360 3.77% 2,908 6.25% 40,376 2.94%2003 3,505 4.32% 3,159 8.63% 41,686 3.24%2004 3,636 3.74% 3,404 7.76% 42,566 2.11%2005 3,695 1.62% 3,695 8.55% 43,097 1.25%2006 3,947 6.82% 4,158 12.53% 45,468 5.50%2007 4,177 5.83% 4,626 11.26% 47,650 4.80%2008 4,268 2.18% 4,841 4.65% 47,914 0.55%2009 4,126 -3.33% 4,619 -4.59% 45,626 -4.78%2010 4,251 3.03% 4,916 6.43% 46,141 1.13%2011 4,354 2.42% 5,280 7.40% 46,898 1.64%
AVERAGE 3.04% 6.89% 1.84%Source: BEA & WCBEA
Tables 1.5

Page 13 Economic Indicators
Tables 1.6
Cheyenne Electrical Power SalesMonthly Average
1988 - 2012
YEAR INDUSTRIAL COMMERCIAL RESIDENTIAL1988 18,101,455 16,122,944 N/A1989 19,279,580 16,630,256 N/A1990 19,708,183 17,242,640 N/A1991 20,206,789 17,804,254 10,853,9971992 22,678,954 18,213,299 15,461,2571993 25,888,948 19,363,148 16,100,7521994 26,660,488 20,470,098 16,153,5441995 29,646,805 20,722,672 16,378,0511996 29,274,837 21,981,947 16,909,7341997 30,333,102 22,289,679 17,007,3441998 29,496,366 23,627,902 17,198,6081999 30,008,744 24,583,751 17,489,4792000 29,558,994 26,688,059 18,315,3322001 29,422,453 26,817,975 17,687,1862002 30,183,684 27,929,167 18,096,7702003 31,074,855 28,776,711 18,475,063
*2004 26,128,505 27,358,136 30,991,326*2005 13,580,000 41,602,707 42,421,787*2006 10,787,692 44,657,625 20,757,3412007 11,868,049 45,400,412 21,165,8732008 12,014,921 48,779,417 21,278,7352009 14,566,015 48,560,547 21,260,9372010 13,379,674 49,638,083 21,561,2232011 17,433,096 50,079,146 19,032,8062012 18,964,595 48,144,494 21,953,797
Note: Power Consumption is measured in KWH.* The variance in the average use per month for industrial and commercial
customers between 2004-2006 and prior years is the result of customer classifications differences between the two accounting systems utilized by CLFP’s corporate owners. The total of industrial and commercial customers remains consistent for the two years and prior years.
Source: Cheyenne Light Fuel & Power

Page 14 Economic Indicators
FIGURE 4
Commercial Electric Power SalesMonthly Average
Cheyenne 1988 - 2012
Power Consumption is Measured in KWH
88 89 90 91 92 93 94 95 96 97 98 99 00 01 02 03 04 05 06 07 08 09 10 11 120
10
20
30
40
50
60Millions
Industrial Commercial
Figure 4

Page 15 Economic Indicators
Tables 1.7
Cheyenne Gas ConsumptionMonthly Average
(Measured in MCF) 1991 - 2012
YEAR INDUSTRIAL COMMERCIAL RESIDENTIAL1991 62,300 140,943 224,2651992 64,192 131,956 215,9811993 63,294 152,432 243,8811994 54,535 140,474 227,1681995 62,276 142,419 232,9011996 59,469 143,344 247,0281997 55,996 140,290 247,7591998 58,969 124,638 211,1191999 60,765 120,926 206,8422000 61,456 123,062 204,3752001 58,687 131,003 201,3292002 56,454 124,940 210,7762003 56,620 120,830 201,0572004 N/A 179,150 211,2752005 N/A 120,787 198,3672006 N/A 112,464 193,8282007 N/A 105,777 198,4132008 N/A 124,734 215,1872009 N/A 124,949 209,7172010 N/A 122,462 207,4262011 N/A 125,695 214,3362012 N/A 113,454 186,456
Source: Cheyenne Light Fuel & Power

Page 16 Economic Indicators
Cheyenne Utility Hookups1990 - 2012
YEARAVERAGE METERED
WATER TAPS
AVERAGE RESIDENTIAL
ELECTRIC HOOKUPS
AVERAGE RESIDENTIAL GAS HOOKUPS
1990 17,349 N/A N/A1991 17,417 27,467 22,8611992 17,537 27,743 23,1831993 17,721 27,966 23,4521994 17,926 28,476 23,9001995 18,154 28,851 24,2991996 18,444 29,295 24,6961997 18,691 29,794 25,4901998 18,890 30,319 25,8641999 19,100 30,421 25,9942000 19,193 30,806 26,4152001 19,355 30,946 26,6432002 19,532 31,330 27,1222003 19,832 31,776 27,6682004 20,246 32,340 28,3572005 20,721 35,065 29,1752006 21,225 35,121 29,8592007 21,600 35,057 30,1852008 21,678 35,136 30,4002009 21,929 35,318 30,6722010 22,048 35,478 31,2052011 22,338 35,062 31,6792012 22,581 35,334 31,929
Source: Cheyenne Board of Public Utilities Cheyenne Light, Fuel & Power
Tables 1.8

Page 17 Economic Indicators
Tables 1.9
Laramie County Auto Registrations (Titles)Annual Total
1996 - 20121996 31,5401997 31,1811998 31,0221999 32,6252000 33,3812001 35,0922002 36,8082003 36,3532004 35,7242005 36,7372006 36,0212007 36,2422008 35,2292009 32,4452010 33,1462011 38,1772012 36,757
Source: Laramie County Clerk

Page 18 Economic Indicators
Tables 1.10
Laramie County EnplanementsAnnual Total
1995 - 20121995 23,5811996 21,0021997 21,8391998 19,0351999 19,5002000 22,6462001 24,4262002 21,3912003 17,1822004 16,1672005 14,3722006 14,6812007 16,8882008 15,3142009 11,1552010 17,4262011 22,7762012 13,952
Note: The declines in 1994,1995, and 2012 reflect the loss of a regional airline serving the Cheyenne market.
Source: Cheyenne Airport

Page 19 Economic Indicators
Tables 1.11
Tourism ActivityMonthly Averages
2004 - 2012
2004 2005 2006 2007 2008 2009 2010 2011 2012*Available Rooms 28,637 66,126 66,156 68,411 66,142 69,263 69,788 69,794 70,457*Nights Occupied 17,851 42,643 43,509 46,272 39,232 38,274 44,530 45,590 43,801*Occupancy Rate (%) 62.3 64.5 65.7 67.6 59.3 55.2 63.7 65.3 62.2*Average Room Rate ($) 57.88 64.45 62.75 67.58 72.40 70.08 70.45 74.34 76.03Visit Cheyenne Walk-in Count 2,317 2,653 4,132 4,015 3,934 4,495 4,189 4,918 3,463
Trolley Ridership 947 1,027 1,284 1,023 1,041 1,231 1,019 1,426 1,074Pine Bluffs Info. Center 13,935 13,085 12,589 12,924 9,172 8,740 7,629 9,590 9,345I-25 State Visitor Center 5,102 5,379 7,391 6,837 6,401 6,174 6,650 7,177 5,726Old West Museum Paid Visitor 3,019 3,017 3,277 2,921 2,591 2,644 2,082 1,942 1,514
State Museum 1,862 1,745 2,003 1,734 1,824 1,865 2,262 2,135 2,713
* Note: Visit Cheyenne changed reporting agencies for hotels, beginning with 2005 dataNote: Numbers reported are a monthly average for each year.Source: Visit Cheyenne

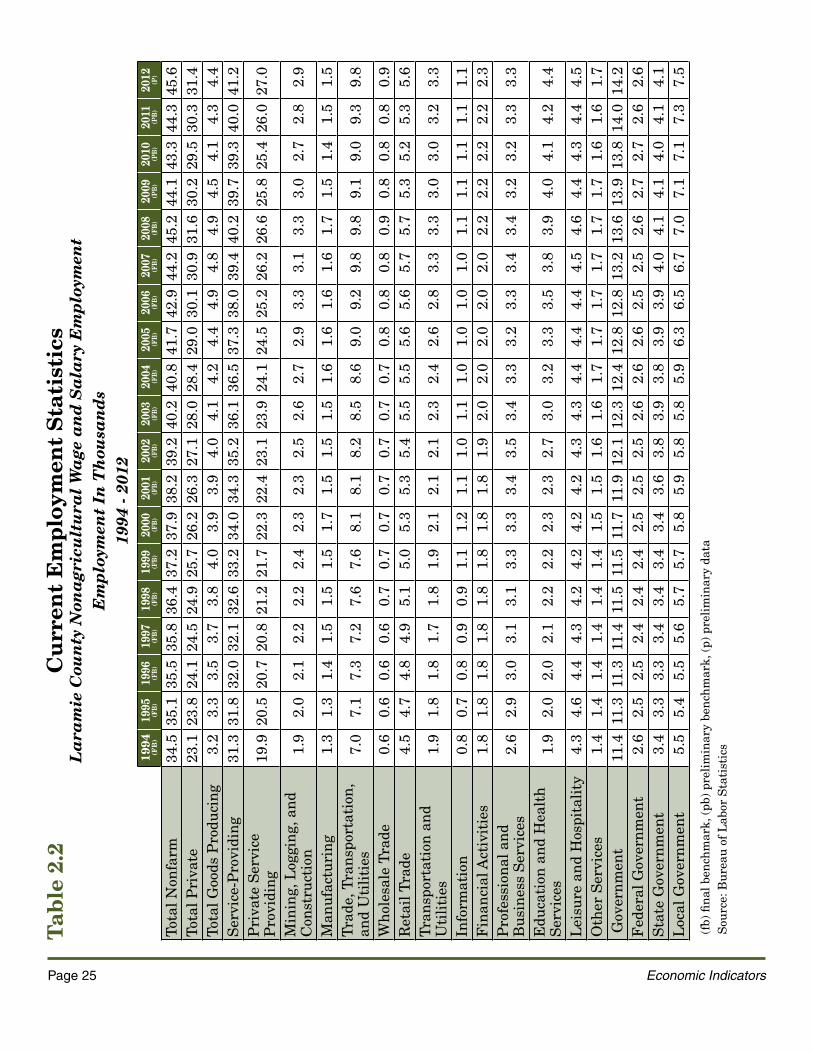
Employment TrendsThis section presents a comprehensive overview of past and current employment statistics and trends.
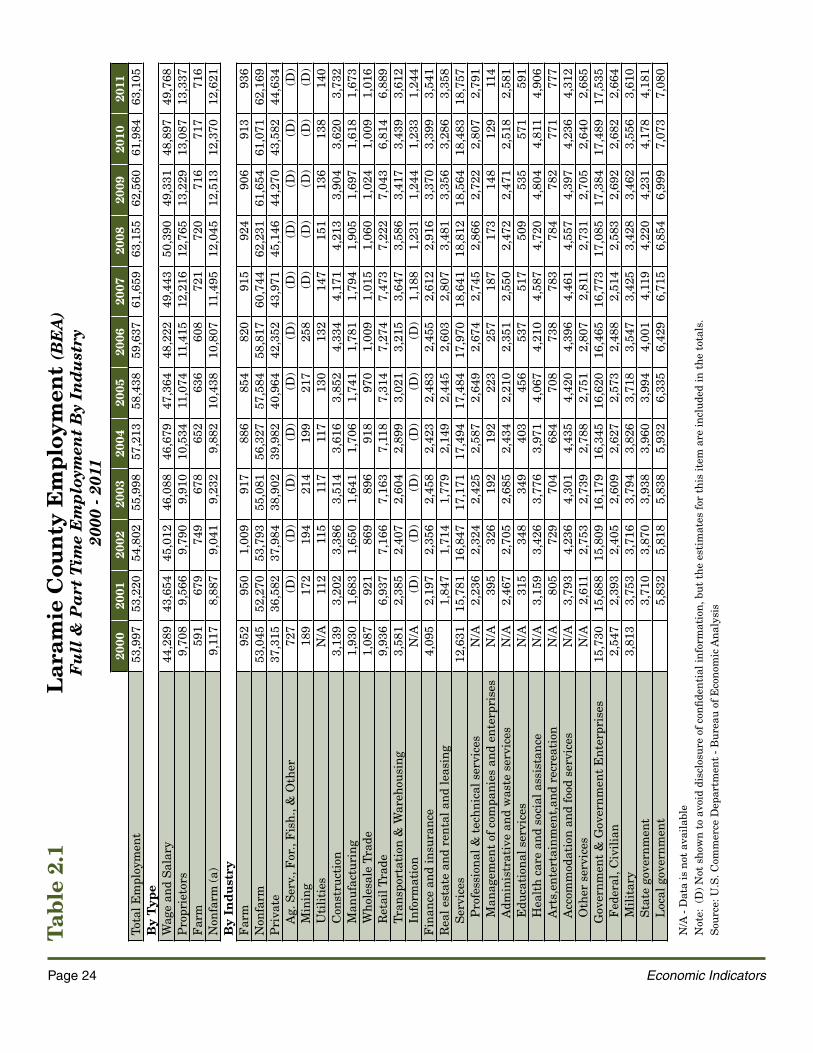
Table 2.1 presents job totals (full & part-time) by industrial sector which permits the user to see which sectors have been growing or shrinking over time. The source of these numbers is the Bureau of Economic Analysis (BEA) which is an arm of the U.S. Department of Commerce and is considered the best source of jobs data, but BEA data generally lags by two years but for the first time, its data has only a one year lag.
As Table 2.1 presents total jobs in 2011 stood at 63,105 which was only 50 jobs short of the record high reached in 2008. Therefore, using BEA data, the greater Cheyenne economy essentially fully recovered from the Great Recession by yearend 2011 in terms of its labor market.
The transportation and warehousing sector added the most jobs in 2011, 173, while finance and insurance was second with a gain of 142. Construction added 112 jobs in that year. All other sectors had gains of less than 100. Most surprising was the marginal job increases posted by the government sector. It added only 46 new jobs in 2011 as compared to 105 in 2010 and 299 in 2009 which, of course, was the heart of the recession. However, government still retained its first position as the largest job sector in the county with 17,535 jobs which accounted for 27.8 percent of all jobs. This sector also generated 42.0 percent of all wage and salary earnings in Laramie County.
By government sub-sector, local government accounted for 13.0 percent of all wage and salary earnings. The military sub-sector was next at 10.9 percent followed by state government at 9.7 percent. The federal civilian sector was last at 8.4 percent. See Table 3.3 for additional details.
Table 2.3 contains statistics on the number of employers in Laramie County and is fairly self-explanatory. The number of employers increases steadily year-after-year in the county.
In 2011 there was a 2.2 percent increase over 2010. The professional and technical sector gained 25 new firms and beat the construction sector by 1. Seven sectors saw a loss of firms in 2011.
Table 2.4 presents BEA data on the number of non-farm and farm proprietors plus average incomes for both groups through 2011. The number of non-farm proprietors within the greater Cheyenne economic system increased for eight consecutive years (2002 – 2009) but then fell 1.9 percent in 2010 with a loss of 143 proprietors which was tied to the recession. This number then re-bounded in 2011 with an increase of 2 percent or by 251 firms.
Non-farm proprietor income, on the other hand, has not shown the same consistent rise as the non-farm proprietor total count. The former had posted steep decreases in 2007 and 2008 and finally saw increases over the last three years (2009 - 2011) as presented in Table 2.4. Non-farm proprietor income between 2000 and 2007 contributed an average of 7.8 percent to total personal income in Laramie County. However, since 2008 that percentage fell to 6.0 percent which meant non-farm proprietors had not made any headway in adding to the economic diversity of the county’s economy. It appears that the growth in the number of proprietors over recent years has served to only dilute their annual earnings. This trend may also suggest that workers who have lost jobs are finding it difficult to re-enter the workforce and are turning to self-employment as a means to make a living. From a
SECTION 2 EMPLOYMENT TRENDS
Table2.0 Labor Force Averages (1999 - 2012)
Figure 5 - Unemployment Rates2.1 BEA Employment (2000 - 2011)2.2 Current Employment Statistics
(1994 - 2012)2.3 Employers By NAICS (2001 - 2011)2.4 BEA Proprietors (1985 - 2011)
Figure 6 - Proprietor Income vs. Annual Wages
2.5 Employment Projections (2010 - 2016)
2.6 Major Employers (2009 - 2013) 2.7 Firms By Size and Industry (2010)

big picture standpoint, total non-farm proprietor income in 2011 was 267.7 million dollars while total personal income in Laramie County was equal to 4.345 billion dollars. The former, therefore, contributed 6.1 percent to total personal income.
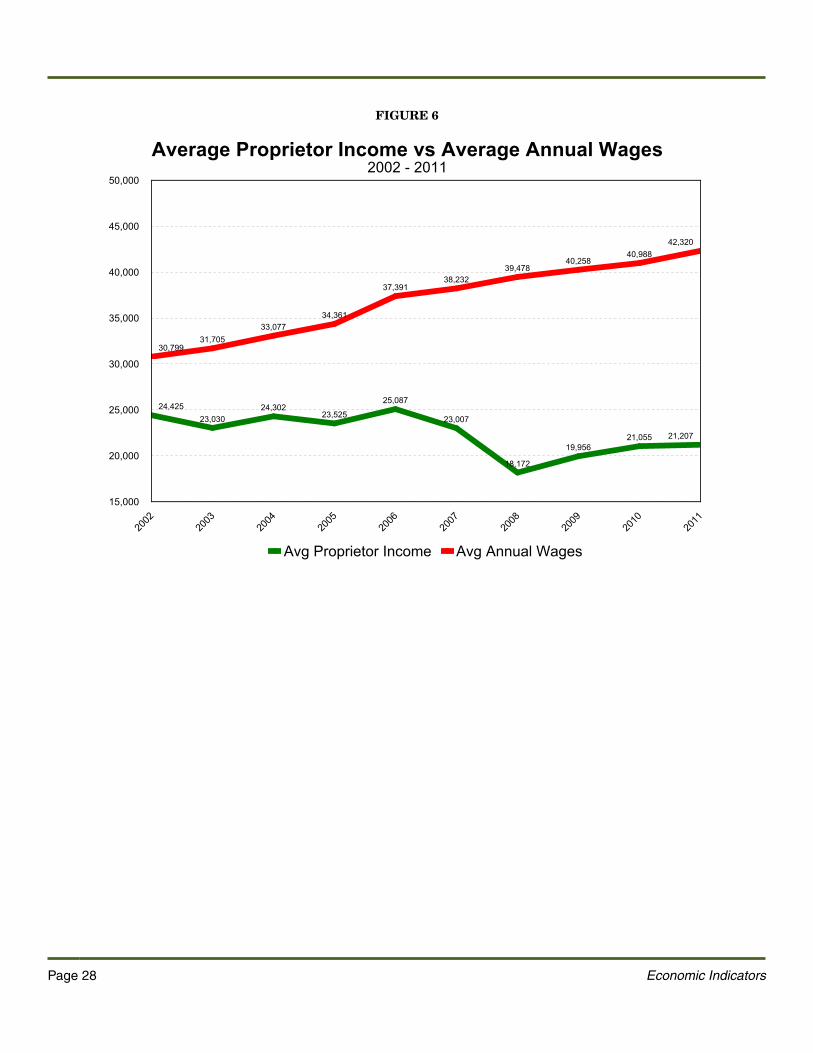
Figure 6 presents the relationship between average annual earnings in Laramie County to average non-farm proprietor income. The gap between the two averages remained fairly consistent between 2001 and 2004, but then began to widen thereafter. That is, employed worker earnings increased much faster than proprietor incomes and by 2008, the differential had widened to $21,306 as compared to $10,836 in 2005. Since 2008, the gap has closed fractionally.
BEA revised farm proprietor statistics in recent years with the revisions injecting inconsistency into the long-term trend. This problem is especially pronounced for years 2002 and 2007 as presented in Table 2.4. As a result, it is difficult to know with any degree of certainty as to whether the number of farms in Laramie County are increasing or decreasing on a long-term basis.
Total farm income in 2011 mushroomed over 2010. It rose an astonishing 92 percent to 51.5 million dollars. However, farm income is always highly volatile and so it did not disappoint in this regard. By comparison, it was 24.8 million in 2008, 13.3 million in 2009 and 26.9 million in 2010. Table 2.4 presents these figures.
Table 2.5 contains job projections (full and part-time) through year 2016 using BEA data as the baseline data set. The recession, of course, disturbed the long-term growth trends in job creation and thus future projections assumed a greater degree uncertainty but generally approach past growth rates of approximately 2.0 percent annually.
Table 2.7 presents the number of firms in Laramie County by employment size with the data from County Business Patterns. As of 2010, there were 2,701 firms, up 1.9 percent, compared to 2,641 in 2009 and 2,651 firms in 2008. The Health Care and Social Assistance sector continued to employ the most workers (6,695) in 2010 with Retail Trade in second place at 5,216.

Page 22 Economic Indicators
Tabl
e 2.
0La
bor
Forc
e Av
erag
esFo
r W
yom
ing,
Lar
amie
Cou
nty
& C
heye
nne
1999
- 20
1219
9920
0020
0120
0220
0320
0420
0520
0620
0720
0820
0920
1020
1120
12 (A
)
LAB
OR
FO
RC
EW
yom
ing
264,
676
266,
883
269,
985
269,
654
271,
607
273,
091
278,
183
284,
987
290,
490
293,
854
293,
926
293,
769
304,
242
306,
045
Lara
mie
Cou
nty
40,3
2740
,237
40,1
2040
,839
41,5
5041
,324
41,6
1141
,984
42,4
1842
,622
42,8
7143
,188
45,0
6445
,504
Chey
enne
28,3
2026
,802
26,7
3027
,212
27,6
9227
,540
27,7
2627
,970
28,2
5328
,397
28,3
3428
,399
29,6
99N
/A
EM
PLO
YE
D(b
)
Wyo
min
g25
1,82
825
6,68
525
9,50
825
8,46
225
9,48
926
2,35
826
7,92
727
5,75
828
2,10
228
4,53
527
5,21
727
3,31
326
2,25
828
9,79
3La
ram
ie C
ount
y (L
AUS)
38,9
1338
,732
38,4
6439
,101
39,6
3339
,441
39,8
4940
,329
40,8
7440
,897
40,0
6639
,927
42,0
4942
,773
Lara
mie
Cou
nty
(CES
)37
,192
37,9
3338
,183
39,2
0840
,242
40,7
7541
,725
42,9
0844
,175
45,1
5044
,133
43,3
4244
,308
45,5
83
Chey
enne
*27
,341
25,7
3725
,559
25,9
8226
,336
26,2
0826
,480
26,7
9827
,161
27,1
7626
,633
26,4
2227
,872
N/A
UN
EM
PLO
YED
Wyo
min
g12
,848
10,1
9710
,477
11,1
9212
,118
10,7
3310
,256
9,22
98,
388
9,09
918
,710
20,4
5616
,763
14,8
22La
ram
ie C
ount
y1,
414
1,50
51,
656
1,74
41,
923
1,90
31,
747
1,63
61,
544
1,72
5 2,
806
3,26
1 3,
015
2,73
6 Ch
eyen
ne *
979
1,06
51,
171
1,23
01,
356
1,33
21,
246
1,17
11,
093
1,22
01,
701
1,97
61,
827
N/A
UN
EM
PLO
YME
NT
RAT
EW
yom
ing
4.9%
3.8%
3.9%
4.2%
4.5%
3.9%
3.7%
3.3%
2.9%
3.2%
6.4%
7.0%
6.0%
5.3%
Lara
mie
Cou
nty
3.5%
3.7%
4.1%
4.3%
4.6%
4.6%
4.2%
3.9%
3.6%
4.0%
6.5%
7.5%
6.7%
6.0%
Chey
enne
*3.
5%4.
0%4.
4%4.
5%4.
9%4.
8%4.
5%4.
2%3.
9%4.
3%6.
0%7.
0%6.
2%N
A
N/A
- D
ata
is n
ot a
vaila
ble.
Not
es: (
a) F
igur
es a
re n
ot b
ench
mar
ked.
(b
) La
bor s
tatis
tics a
re co
mpi
led
from
two m
ajor
sour
ces:
Cur
rent
Pop
ulat
ion
Surv
ey (C
PS) a
nd C
urre
nt E
mpl
oym
ent S
tatis
tics (
CES)
. Loc
al A
rea
Une
mpl
oym
ent S
tatis
tics
(LAU
S) a
re es
timat
ed b
ased
on C
PS d
ata
whi
ch is
colle
cted
thro
ugh
hous
ehol
d su
rvey
s whe
re in
divi
dual
s are
repo
rted
as e
mpl
oyed
, une
mpl
oyed
or n
ot in
the l
abor
forc
e.
This
dat
a in
clud
es e
mpl
oym
ent f
or b
oth
agri
cultu
re a
nd n
onag
ricu
ltura
l ind
ustr
ies.
CES
dat
a is
bas
ed o
n es
tabl
ishm
ent r
ecor
ds co
mpi
led
thro
ugh
mon
thly
sur
veys
of
nonf
arm
em
ploy
ers.
Indi
vidu
als
who
wor
ked
in m
ore
than
one
est
ablis
hmen
t, fu
ll or
par
t-tim
e, a
re co
unte
d ea
ch ti
me
thei
r nam
es a
ppea
r on
payr
olls
.Fi
gure
s fo
r 199
5 - 2
007
are
benc
hmar
ked
data
.*
Chey
enne
Em
ploy
men
t is
base
d on
Cen
sus
Bure
au p
opul
atio
n es
timat
es.
Sour
ce: W
yom
ing
Dep
artm
ent o
f Wor
kfor
ce S
ervi
ces

Page 23 Economic Indicators
FIGURE 5Figure 5
Unemployment Rate1999 - 2012
99 00 01 02 03 04 05 06 07 08 09 10 11 122
3
4
5
6
7
8
Cheyenne Laramie County Wyoming
Page 24 Economic Indicators
Lara
mie
Cou
nty
Em
ploy
men
t (B
EA
)Fu
ll &
Par
t Tim
e E
mpl
oym
ent B
y In
dust
ry
2000
- 20
1120
0020
0120
0220
0320
0420
0520
0620
0720
0820
0920
1020
11To
tal E
mpl
oym
ent
53,9
9753
,220
54,8
0255
,998
57,2
1358
,438
59,6
3761
,659
63,1
5562
,560
61,9
8463
,105
By
Type
Wag
e an
d Sa
lary
44,2
8943
,654
45,0
1246
,088
46,6
7947
,364
48,2
2249
,443
50,3
9049
,331
48,8
9749
,768
Prop
riet
ors
9,70
89,
566
9,79
09,
910
10,5
3411
,074
11,4
1512
,216
12,7
6513
,229
13,0
8713
,337
Farm
591
679
749
678
652
636
608
721
720
716
717
716
Non
farm
(a)
9,11
78,
887
9,04
19,
232
9,88
210
,438
10,8
0711
,495
12,0
4512
,513
12,3
7012
,621
By
Indu
stry
Farm
952
950
1,00
991
788
685
482
091
592
490
691
393
6N
onfa
rm53
,045
52,2
7053
,793
55,0
8156
,327
57,5
8458
,817
60,7
4462
,231
61,6
5461
,071
62,1
69Pr
ivat
e37
,315
36,5
8237
,984
38,9
0239
,982
40,9
6442
,352
43,9
7145
,146
44,2
7043
,582
44,6
34
Ag. S
erv.,
For
., Fi
sh.,
& O
ther
72
7(D
)(D
)(D
)(D
)(D
)(D
)(D
)(D
)(D
)(D
)(D
)
Min
ing
189
172
194
214
199
217
258
(D)
(D)
(D)
(D)
(D)
U
tiliti
esN
/A11
211
511
711
713
013
214
715
113
613
814
0
Cons
truc
tion
3,13
93,
202
3,38
63,
514
3,61
63,
852
4,33
44,
171
4,21
33,
904
3,62
03,
732
M
anuf
actu
ring
1,93
01,
683
1,65
01,
641
1,70
61,
741
1,78
11,
794
1,90
51,
697
1,61
81,
673
W
hole
sale
Tra
de1,
087
921
869
896
918
970
1,00
91,
015
1,06
01,
024
1,00
91,
016
Re
tail
Trad
e9,
936
6,93
77,
166
7,16
37,
118
7,31
47,
274
7,47
37,
222
7,04
36,
814
6,88
9
Tran
spor
tatio
n &
War
ehou
sing
3,58
12,
385
2,40
72,
604
2,89
93,
021
3,21
53,
647
3,58
63,
417
3,43
93,
612
In
form
atio
nN
/A(D
)(D
)(D
)(D
)(D
)(D
)1,
188
1,23
11,
244
1,23
31,
244
Fina
nce
and
insu
ranc
e4,
095
2,19
72,
356
2,45
82,
423
2,48
32,
455
2,61
22,
916
3,37
03,
399
3,54
1Re
al e
stat
e an
d re
ntal
and
leas
ing
1,84
71,
714
1,77
92,
149
2,44
52,
603
2,80
73,
481
3,35
63,
286
3,35
8
Serv
ices
12,6
3115
,781
16,8
4717
,171
17,4
9417
,484
17,9
7018
,641
18,8
1218
,564
18,4
8318
,757
P
rofe
ssio
nal &
tech
nica
l ser
vice
sN
/A2,
236
2,32
42,
425
2,58
72,
649
2,67
42,
745
2,86
62,
722
2,80
72,
791
M
anag
emen
t of c
ompa
nies
and
ent
erpr
ises
N/A
395
326
192
192
223
257
187
173
148
129
114
A
dmin
istr
ativ
e an
d w
aste
ser
vice
sN
/A2,
467
2,70
52,
685
2,43
42,
210
2,35
12,
550
2,47
22,
471
2,51
82,
581
E
duca
tiona
l ser
vice
sN
/A31
534
834
940
345
653
751
750
953
557
159
1
Hea
lth ca
re a
nd s
ocia
l ass
ista
nce
N/A
3,15
93,
426
3,77
63,
971
4,06
74,
210
4,58
74,
720
4,80
44,
811
4,90
6
Art
s,en
tert
ainm
ent,a
nd re
crea
tion
N/A
805
729
704
684
708
738
783
784
782
771
777
A
ccom
mod
atio
n an
d fo
od s
ervi
ces
N/A
3,79
34,
236
4,30
14,
435
4,42
04,
396
4,46
14,
557
4,39
74,
236
4,31
2
Oth
er s
ervi
ces
N/A
2,61
12,
753
2,73
92,
788
2,75
12,
807
2,81
12,
731
2,70
52,
640
2,68
5
Gov
ernm
ent &
Gov
ernm
ent E
nter
pris
es15
,730
15,6
8815
,809
16,1
7916
,345
16,6
2016
,465
16,7
7317
,085
17,3
8417
,489
17,5
35
Fed
eral
, Civ
ilian
2,54
72,
393
2,40
52,
609
2,62
72,
573
2,48
82,
514
2,58
32,
692
2,68
22,
664
M
ilita
ry3,
813
3,75
33,
716
3,79
43,
826
3,71
83,
547
3,42
53,
428
3,46
23,
556
3,61
0
Sta
te g
over
nmen
t3,
710
3,87
03,
938
3,96
03,
994
4,00
14,
119
4,22
04,
231
4,17
84,
181
L
ocal
gov
ernm
ent
5,83
25,
818
5,83
85,
932
6,33
56,
429
6,71
56,
854
6,99
97,
073
7,08
0
N/A
- D
ata
is n
ot a
vaila
ble
Not
e: (
D) N
ot s
how
n to
avo
id d
iscl
osur
e of
confi
dent
ial i
nfor
mat
ion,
but
the
estim
ates
for t
his
item
are
incl
uded
in th
e to
tals
.So
urce
: U.S
. Com
mer
ce D
epar
tmen
t - B
urea
u of
Eco
nom
ic A
naly
sis
Tabl
e 2.
1
Page 25 Economic Indicators
Cur
rent
Em
ploy
men
t Sta
tist
ics
Lara
mie
Cou
nty
Non
agri
cult
ural
Wag
e an
d Sa
lary
Em
ploy
men
tE
mpl
oym
ent I
n Th
ousa
nds
1994
- 20
1219
94
(FB
)19
95(F
B)19
96(F
B)19
97(F
B)19
98(F
B)19
99(F
B)20
00(F
B)20
01(F
B)20
02(F
B)20
03(F
B)20
04(F
B)20
05(F
B)20
06(F
B)20
07(F
B)20
08(F
B)20
09(P
B)20
10(P
B)20
11(P
B)20
12 (P)
Tota
l Non
farm
34.5
35.1
35.5
35.8
36.4
37.2
37.9
38.2
39.2
40.2
40.8
41.7
42.9
44.2
45.2
44.1
43.3
44.3
45.6
Tota
l Pri
vate
23.1
23.8
24.1
24.5
24.9
25.7
26.2
26.3
27.1
28.0
28.4
29.0
30.1
30.9
31.6
30.2
29.5
30.3
31.4
Tota
l Goo
ds P
rodu
cing
3.2
3.3
3.5
3.7
3.8
4.0
3.9
3.9
4.0
4.1
4.2
4.4
4.9
4.8
4.9
4.5
4.1
4.3
4.4
Serv
ice-
Prov
idin
g31
.331
.832
.032
.132
.633
.234
.034
.335
.236
.136
.537
.338
.039
.440
.239
.739
.340
.041
.2Pr
ivat
e Se
rvic
e Pr
ovid
ing
19.9
20.5
20.7
20.8
21.2
21.7
22.3
22.4
23.1
23.9
24.1
24.5
25.2
26.2
26.6
25.8
25.4
26.0
27.0
Min
ing,
Log
ging
, and
Co
nstr
uctio
n1.
92.
02.
12.
22.
22.
42.
32.
32.
52.
62.
72.
93.
33.
13.
33.
02.
72.
82.
9
Man
ufac
turi
ng1.
31.
31.
41.
51.
51.
51.
71.
51.
51.
51.
61.
61.
61.
61.
71.
51.
41.
51.
5Tr
ade,
Tra
nspo
rtat
ion,
an
d U
tiliti
es7.
07.
17.
37.
27.
67.
68.
18.
18.
28.
58.
69.
09.
29.
89.
89.
19.
09.
39.
8
Who
lesa
le T
rade
0.6
0.6
0.6
0.6
0.7
0.7
0.7
0.7
0.7
0.7
0.7
0.8
0.8
0.8
0.9
0.8
0.8
0.8
0.9
Reta
il Tr
ade
4.5
4.7
4.8
4.9
5.1
5.0
5.3
5.3
5.4
5.5
5.5
5.6
5.6
5.7
5.7
5.3
5.2
5.3
5.6
Tran
spor
tatio
n an
d U
tiliti
es1.
91.
81.
81.
71.
81.
92.
12.
12.
12.
32.
42.
62.
83.
33.
33.
03.
03.
23.
3
Info
rmat
ion
0.8
0.7
0.8
0.9
0.9
1.1
1.2
1.1
1.0
1.1
1.0
1.0
1.0
1.0
1.1
1.1
1.1
1.1
1.1
Fina
ncia
l Act
iviti
es1.
81.
81.
81.
81.
81.
81.
81.
81.
92.
02.
02.
02.
02.
02.
22.
22.
22.
22.
3Pr
ofes
sion
al a
nd
Busi
ness
Ser
vice
s2.
62.
93.
03.
13.
13.
33.
33.
43.
53.
43.
33.
23.
33.
43.
43.
23.
23.
33.
3
Educ
atio
n an
d H
ealth
Se
rvic
es1.
92.
02.
02.
12.
22.
22.
32.
32.
73.
03.
23.
33.
53.
83.
94.
04.
14.
24.
4
Leis
ure
and
Hos
pita
lity
4.3
4.6
4.4
4.3
4.2
4.2
4.2
4.2
4.3
4.3
4.4
4.4
4.4
4.5
4.6
4.4
4.3
4.4
4.5
Oth
er S
ervi
ces
1.4
1.4
1.4
1.4
1.4
1.4
1.5
1.5
1.6
1.6
1.7
1.7
1.7
1.7
1.7
1.7
1.6
1.6
1.7
Gov
ernm
ent
11.4
11.3
11.3
11.4
11.5
11.5
11.7
11.9
12.1
12.3
12.4
12.8
12.8
13.2
13.6
13.9
13.8
14.0
14.2
Fede
ral G
over
nmen
t2.
62.
52.
52.
42.
42.
42.
52.
52.
52.
62.
62.
62.
52.
52.
62.
72.
72.
62.
6St
ate
Gov
ernm
ent
3.4
3.3
3.3
3.4
3.4
3.4
3.4
3.6
3.8
3.9
3.8
3.9
3.9
4.0
4.1
4.1
4.0
4.1
4.1
Loca
l Gov
ernm
ent
5.5
5.4
5.5
5.6
5.7
5.7
5.8
5.9
5.8
5.8
5.9
6.3
6.5
6.7
7.0
7.1
7.1
7.3
7.5
(fb) fi
nal b
ench
mar
k, (p
b) p
relim
inar
y be
nchm
ark,
(p) p
relim
inar
y da
taSo
urce
: Bur
eau
of L
abor
Sta
tistic
s
Tabl
e 2.
2

Page 26 Economic Indicators
Laramie County EmployersCovered Employment
2001 - 2011
2001 2002 2003 2004 2005 2006 2007 2008 2009 2010 2011
PRIVATE EMPLOYMENTAgriculture 23 22 22 19 20 22 21 23 27 30 35Mining 10 13 14 16 19 18 20 18 17 23 27Utilities 5 8 7 6 6 10 9 10 8 8 9Construction 365 382 391 411 449 457 454 445 437 414 438Manufacturing 63 65 67 70 76 74 81 83 75 75 69Wholesale Trade 129 132 149 147 158 163 183 181 166 174 167Retail Trade 342 346 350 344 346 334 343 338 321 317 323Transportation & Warehousing 109 102 99 112 110 119 130 136 127 127 135
Information 52 51 51 52 52 55 59 55 59 54 58FIRE 266 271 283 289 300 301 311 314 315 350 349Services 1,165 1,222 1,236 1,314 1,369 1,389 1,412 1,489 1,526 1,548 1,582Professional & Business Services 287 298 324 347 368 384 402 436 448 459 484
Management of Companies & Enterprises 14 14 16 16 25 26 26 22 19 17 15
Administrative & Waste Services 199 201 212 233 238 234 238 261 259 261 265
Educational Services 23 24 26 28 30 34 39 40 40 44 50Health Care & Social Assistance 195 204 218 243 245 253 260 277 297 299 303
Arts, Entertainment, & Recreation 34 71 30 30 32 32 32 31 28 27 27
Accommodation & Food Services 167 174 180 190 203 198 192 194 204 199 199
Other Services 246 236 230 227 228 228 223 228 231 242 239Government * 128 130 135 134 135 142 145 146 144 159 158Federal Government 47 49 52 50 53 55 58 58 57 68 67State Government 55 55 58 58 56 60 60 61 61 64 64Local Government 26 26 25 26 26 27 27 27 26 27 27TOTAL 2,657 2,706 2,804 2,914 3,040 3,084 3,168 3,238 3,222 3,279 3,350
N/A - Data is not available.Source: Wyoming Department of Workforce Services - Q4 data
Table 2.3

Page 27 Economic Indicators
Table 2.4
Laramie County Proprietors(BEA)
1985 - 2011
YEAR NON-FARM
AVG NON-FARM
PROPRIETOR INCOME
FARM AVG FARM INCOME
TOTAL PROPRIETORS
1985 5,822 $9,790 584 -$3,830 6,4061986 5,416 $11,883 574 $3,392 5,9901987 6,383 $9,168 547 $10,512 6,9301988 6,817 $7,722 550 $8,525 7,3671989 6,578 $9,233 558 $10,079 7,1361990 6,747 $9,165 557 $18,794 7,3041991 7,150 $8,480 563 $19,922 7,7131992 6,999 $9,826 582 $21,002 7,5811993 7,285 $10,849 582 $26,223 7,8671994 7,976 $11,859 579 $6,829 8,5551995 7,958 $13,891 584 $16,611 8,5421996 8,237 $14,631 580 $10,374 8,8171997 8,607 $12,503 586 $30,572 9,1931998 8,971 $15,494 610 $15,657 9,5811999 8,725 $16,699 628 $9,586 9,3532000 9,117 $19,396 660 $9,614 9,7772001 8,887 24,454 679 $15,424 9,5662002 9,041 24,425 749 -$4,210 9,7902003 9,232 23,030 678 $7,752 9,9102004 9,882 24,302 652 $6,021 10,5342005 10,438 23,525 636 $13,950 11,0742006 10,807 25,087 608 $6,467 11,4152007 11,495 23,007 721 $14,924 12,2162008 12,045 18,172 720 $34,463 12,7652009 12,513 19,956 716 $18,608 13,2292010 12,370 21,055 717 $37,457 13,0872011 12,621 21,207 716 $71,932 13,337
Source: US Commerce Department - Bureau of Economic Analysis
Page 28 Economic Indicators
FIGURE 6
Average Proprietor Income vs Average Annual Wages2002 - 2011
30,79931,705
33,07734,361
37,39138,232
39,47840,258
40,98842,320
24,42523,030
24,30223,525
25,087
23,007
18,172
19,95621,055 21,207
2002
2003
2004
2005
2006
2007
2008
2009
2010
2011
15,000
20,000
25,000
30,000
35,000
40,000
45,000
50,000
Avg Proprietor Income Avg Annual Wages
Figure 6

Page 29 Economic Indicators
Laramie County Employment ProjectionsJobs by Place of Work
2010 - 2016
ACTUAL2010
ACTUAL2011
PROJECTED2012
PROJECTED2013
PROJECTED2014
PROJECTED2015
PROJECTED2016
Total Employment(1) 61,984 63,105 64,430 65,637 67,758 68,904 69,872
PRIVATEAgriculture 913 936 941 895 914 933 944Mining (D) (D) (D) (D) (D) (D) (D)Utilities 136 140 147 134 135 136 139Construction 3,620 3,742 3,864 4,820 5,046 5,172 5,285Manufacturing 1,618 1,673 1,724 1,720 1,932 2,044 2,107Transportation & Warehousing 3,439 3,612 3,822 3,713 3,955 4,212 4,317Wholesale Trade 1,009 1,016 1,041 1,089 1,114 1,140 1,151Retail Trade 6,814 6,889 6,923 6,958 7,491 7,559 7,616Finance, Insurance & Real Estate 6,685 6,899 6,968 7,051 7,122 7,157 7,193
Professional & Tech. Services 2,807 2,791 2,868 3,014 3,128 3,188 3,204Administrative & Management 2,647 2,695 2,754 2,815 2,843 2,877 2,905Information 1,233 1,244 1,266 1,301 1,328 1,357 1,365Educational Services 571 591 621 568 619 675 685Health Care & Social Assistance 4,811 4,906 5,033 4,902 5,172 5,440 5,560Arts, entertainment, & recreation 771 777 798 857 876 857 878
Accommodation & Food Services 4,236 4,312 4,391 4,445 4,565 4,688 4,791Other Services 2,640 2,685 2,757 3,061 3,077 3,108 3,123
GOVERNMENTFederal Civilian 2,682 2,664 2,693 2,722 2,742 2,755 2,761Military 3,556 3,610 3,646 3,658 3,616 3,652 3,670State & Local Government 11,251 11,261 11,418 11,569 11,742 11,859 11,718
(1) Sector totals will not equal Total Employment due to non-disclosures.(D) Not shown to avoid disclosure of confidential information, but estimates are included in totals.Source: Wyoming Center for Business & Economic Analysis
Table 2.5

Page 30 Economic Indicators
Major Employers in the Cheyenne Area(100 or more employees)
2009 - 2013
COMPANY PRODUCT 2009 2010 2011 2012 2013F.E. Warren A.F.B. Military 4,325 3,694 3,820 4,325 3,660State of Wyoming Government Services 3,553 3,372 3,379 3,397 3,409Laramie Co. School Dist. #1 Education K-12 1,955 2,102 2,157 2,157 2,178Federal Government Government Services 1,739 1,874 1,804 1,785 1,814 Cheyenne Regional Medical Center Health Care 1,415 1,700 1,618 1,667 1,763Wyoming National Guard Military 756 744 744 1,048 1,230Laramie County Community College
Academic, Vocational & Community Service Education 490 506 531 570 800
Sierra Trading Post Outlet Catalogue/Retail 572 622 595 587 684Veterans’ Affairs Medical Ctr. Health Care 496 586 586 603 650 Union Pacific Railroad Transportation, Rail 602 572 594 594 600City of Cheyenne Government Services 606 601 550 550 570Lowe’s Companies Distribution Center 518 407 450 450 450a
EchoStar Communications Satellite Uplink Center 301 343 324 360 396 Laramie County Government Government Services 360 363 375 366 383Holly Frontier Oil Refinery 340 313 292 292 292a
Great Lakes Aviation Airlines 236 259 259 259 259a
Magic City Enterprises Rehabilitation Facility 199 221 228 249 224 Laramie Co. School Dist #2 Education K-12 214 213 214 226 224Allstate Call Center Insurance 247 224 250 218 218 United States Postal Service Government Services 245 240 210 212 216BlueCross/Blue Shield Health Plans 204 199 177 205 205Dyno Nobel Fertilizer & Industrial
Ammonium Nitrate Mfg. 125 136 151 157 204Little America Hotel & Resort 180 111 133 136 202 Life Care Cheyenne Long-Term Care 185 190 196 196 196a
Crete Carrier Corp Trucking 163 171 173 195 195VAE Nortrak Mfg. Rail Supply Manufacturer 108 104 125 160 153Simon Contractors Heavy Construction 120 120 120 120 153Warren Federal Credit Union Credit Union 103 125 132 135 144APW Wyott Corporation Manufacturing 150 125 120 130 141Mountain Regional Services, Inc. Disability Services 130 110 124 110 130 Optimum Communications Communications 103 125 129 129 129a
Taco Johns Inc. Food Service Headquarters 117 108 113 115 110Mountain Towers Long-Term Care 124 126 110 115 109Wyoming Tribune-Eagle News and Printing Services 114 106 111 110 106Companies requesting anonymity 1,281 1,177 1,268 1,380 1,487
TOTALS 22,376 21,989 22,162 23,308 23,684a Current Count not provided by Company-used previous yearData includes locally based employees onlyNote: Previous years counts may adjust as companies are added or removed from the listingSource: Cheyenne LEADS employer interviews January 2013
Table 2.6

Page 31 Economic Indicators
Table 2.7
Firms by Size and Industry in 2010Laramie County
Number of Establishments by Employment-size class(1)
2010
2010 TOTAL FIRMS
EMPLOY-EES 1-4 5-9 10-19 20-49 50-99 100-
249250-499
500-999
1000 OR MORE
Forestry, fishing, hunting, agriculture 5 12 4 1 0 0 0 0 0 0 0
Mining 16 N/A 11 1 1 2 0 1 0 0 0Utilities 8 N/A 4 0 1 2 1 0 0 0 0Construction 291 2,303 181 52 32 18 4 4 0 0 0Manufacturing 64 1,379 31 8 9 9 4 2 1 0 0Wholesale trade 118 811 71 22 14 10 1 0 0 0 0Retail trade 356 5,216 153 105 50 25 15 6 0 2 0Transportation & warehousing 101 N/A 55 17 15 8 2 0 3 1 0Information 52 N/A 30 7 7 3 3 1 1 0 0Finance & insurance 200 1,727 135 26 23 13 1 1 1 0 0Real estate & rental & leasing 121 400 94 17 10 0 0 0 0 0 0
Professional, scientific & tech. services 384 1,474 307 46 19 10 1 1 0 0 0
Management of companies & enterprises 17 135 12 2 1 1 1 0 0 0 0
Admin, support, waste mgt, remed. Serv. 141 1,076 84 32 16 5 3 1 0 0 0
Educational services 29 323 13 5 7 3 1 0 0 0 0Health care and social assistance 307 6,695 142 57 54 32 12 5 4 0 1
Arts, entertainment & recreation 29 267 18 2 3 6 0 0 0 0 0
Accommodation & food services 195 3,686 55 25 49 51 10 5 0 0 0
Other services (expect public admin.) 260 1,345 154 69 31 6 0 0 0 0 0
Unclassified establishments. 7 N/A 7 0 0 0 0 0 0 0 0TOTAL 2,701 30,763 1,561 494 342 204 59 27 10 3 1
(1) Does not include proprietors, government, household services, or railroad workers.Source: US Census Bureau - County Business Patterns

Wages, Earnings & Income TrendsThis section presents multiple series on average wages, earnings and personal income for residents of Laramie County. The most recent income data is for year 2011. The U.S. Census Bureau now provides various income measures using the American Community Surveys (ACS) and over recent years has attempted to refine their estimates. The ACS provides 1-year estimates which sample a geographic area with 65,000 plus persons, the 3-year estimate sample includes the 65,000 area, plus areas with 20,000 plus persons. The 5-year estimates (includes both the 1-year and 3 year areas and those areas with less than 20,000 persons. The 5-year estimates are based on 5 times as many sample cases as 1-year estimates. The reader should only compare 1-year estimates to 1-year estimates and 5-year estimates to 5-year estimates. Do not compare 1-year estimates to 5-year estimates, etc.
The reader needs to be aware that income figures will vary depending upon which estimate is provided. In addition, the ACS income estimates are at the 90% confidence level which adds a larger margin of error to reported numbers. The end result is that reported income measures vary sharply from year-to-year in both absolute size and in the rates of change. Therefore, extreme caution is encouraged when drawing firm conclusions about income measures. The footnotes provided in Table 3.0 explain which estimates are being used.
Table 3.0a which presents ACS 5-yr. estimates of household income had median income at $54,156 in 2011 which was an increase of $1,332 (+2.5%) over 2010’s estimate of $52,824. Mean or average household income was estimated at $69,320 in 2011 versus $66,689 in 2010, an increase of 3.9 percent. Both the median and mean then out gained the percentage increases reported in Table 3.0b. Both were 5-year ACS estimates and carry a greater degree of confidence than the ACS 1-year and 3-year estimates presented in Table 3.0b which is immediately right of Table 3.0a. As the reader will quickly see, the median figures reported in the latter table carry greater variation in size and in direction of movement which is due to the differences in geographic sizes being sampled.
What is of greater interest is the fact that the number of households with incomes above $100,000 rose to 19.2 percent in 2011 as compared to 2010’s 17.2 percent. This was an 11.6 percent increase in relative terms. In absolute numbers, there were 6,170 such households in 2010 and 7,009 households in 2011 by comparison. What has occurred is an income bracket creep especially by households in the upper income brackets. For instance there were 4,207 households in 2010 in the 100-149.9k bracket but by 2011 this number has risen to 4,647, an increase of 10.5 percent. In the $200k bracket, the 2011 gain was somewhat startling at 35.1 percent (724 household in 2010 and 978 in 2011). Among all the other lower income brackets, the magnitudes of bracket creep were considerably less pronounced. In addition, the number of households in the bottom two brackets fell slightly which was positive.
Both the average county-wide wage and average compensation per job which included benefits rose throughout the Great Recession years and continued upward in the post-recession years. In 2011 the increases were even stronger at 3.3 percent and 3.6 percent respectively. These consistent gains in wages and salaries re-confirmed that the Great Recession impacted the local economy on a limited basis.
SECTION 3 WAGES, EARNINGS & INCOME TRENDS
Table3.0 Income & Average Wages
Figure 7 - Average Wage andCompensation Per Job
3.1 Average Annual Earned Income (2004 - 2011)
3.2 Per Capita Income (1988 - 2011)Figure 8 - Per Capita Personal Income
3.3 Personal Income and Earnings By Industry (2000 - 2011)Figure 9 - Personal Income
3.4 Total Payroll (2003 - 2011)

The table presenting 2011 Earnings by Gender clearly depicted the often discussed gender gap, but the statistics do not explain why the gap exists. Median earnings for males in Laramie County were 32.7 percent higher than females and mean earnings were fractionally higher at 33.6 percent.
Figure 7 presents the relationship between the cost of employer paid benefits and total average compensation. The gap (benefits) between total compensation and average wages has risen consistently since 1998. In 1999, benefits accounted for 24.2 percent of total average compensation. By 2010 and 2011 this ratio had risen to 27.3 percent.
Table 3.1 presents Wyoming Department of Workforce Services average annual earnings by industrial sectors and provided an alternative measure to BEA data, but similar to BEA numbers, average earnings also rose during the Great Recession and in the post-recession years, but the rates of increase were generally smaller. Workforce Services did report a 3.0 percent increase in average annual earned income for 2011.
Figure 9 presents U.S., Wyoming and Laramie County annual personal income totals from 1979 through 2011. Recession years are highlighted in gray. The reader will quickly see how closely changes in Laramie County’s personal income mirror national income changes under most circumstances. During the 1991 recession, local personal income growth changed by almost identical rates with U.S. personal income. However, during the 2001 recession, both state and local personal income grew faster than national income. During the Great Recession, initial income statistics had growth in local income positive but with BEA data revisions, local growth went into negative territory and matched national and state personal income growth which was negative. By the end of 2010 all three had returned to positive growth as presented in the graph.
A final note on one sub-component of personal income, non-labor income, is required in this section. Non-labor income is composed of dividends, interest, rents and government transfer payments. The contribution of non-labor income to county total personal income has changed rather dramatically and for the positive over the years. In 1970, this component accounted for 23.3 percent of total personal income. By 1990, it had risen to 34.5 percent and in 2000 its contribution stood at 35.8 percent. In 2011, it had increased to 36.7 percent. Also by 2011, dividends, interest and rents contributed 21.5 percent to total personal income with government transfer payments adding another 15.2 percent. Combined these two were equal to 1.593 billion dollars in 2011. Transfer payments consist of Medicare, Medicaid, unemployment insurance, government retirement and disability payments to households. The long-term increase in the proportionate share of non-labor income to total Laramie County personal income suggests that the area has become attractive to retirees who are dependent upon non-labor income to meet their needs. It also implies that there has been in-migration of higher income workers who receive a greater share of their income from non-labor (investments) efforts. As presented in other parts of this report, Laramie County has an aging population (more retirees) and has seen significant in-migration over the past decade. The 65 year and older age cohort accounted for 13 percent of the county’s total population in 2011 as compared to 8.7 percent in 1980. The county saw net positive in-migration of 8,466 persons between year 2000 and the first half of 2012.

Page 34 Economic Indicators
Table 3.0
2011 Household IncomeLaramie County (a)
Median Household IncomeLaramie County (b)
HOUSEHOLDS YEAR MEDIAN HOUSEHOLD INCOME PERCENT CHANGE
TOTAL: * 36,566 1995 $34,560 N/ALess than $10,000 1,668 1996 N/A N/A$10,000 to $14,999 1,659 1997 $37,168 N/A$15,000 to $24,999 3,674 1998 $39,671 6.73%$25,000 to $34,999 3,727 1999 $39,728 0.14%$35,000 to $49,999 5,969 2000 $41,075 3.39%$50,000 to $74,999 7,531 2001 $41,446 0.90%$75,000 to $99,999 5,329 2002 $42,485 2.51%$100,000 to $149,999 4,647 2003 $44,283 4.23%$150,000 to $199,999 1,384 2004 $45,684 3.16%$200,000 or more 978 2005* $44,790 -1.96%Median household income 54,156 2006* $50,907 13.66%Mean household income 69,320 2007*** $49,784 -2.21%* 90 percent confidence level margin of errorSource: US Census Bureau, American Community Survey, 5 year estimates
2008*** $54,740 9.96%2009*** $52,375 -4.32%2010*** $51,660 -1.37%2011*** $51,864 0.39%
Source: US Census Bureau * American Community Survey, 1 year estimates *** American Community Survey, 3 year estimates
2011 Earnings by GenderPopulation 16 Years and Over
(Full-time, year-round) Laramie County
Average Wage and Compensation Per Job
Laramie County
MALES FEMALES YEAR COMPEN-SATION
PERCENT CHANGE WAGES(1) PERCENT
CHANGETotal: 19,726 15,166 1993 N/A 22,700$1 to $9,999 or loss 493 470 1994 N/A 23,359 2.90%$10,000 to $14,999 552 758 1995 N/A 23,426 0.29%$15,000 to $24,999 2,466 2,988 1996 N/A 23,595 0.72%$25,000 to $34,999 2,860 3,564 1997 N/A 24,504 3.85%$35,000 to $49,999 4,655 3,564 1998 N/A 25,819 5.37%$50,000 to $64,999 3,413 1,926 1999 $32,360 26,890 4.15%$65,000 to $74,999 1,913 849 2000 $33,743 4.27% 27,466 2.14%$75,000 to $99,999 1,933 622 2001 $36,889 9.32% 29,199 6.31%$100,000 or more 1,440 394 2002 $39,185 6.22% 30,799 5.48%Median earnings $45,553 $34,326 2003 $40,621 3.66% 31,705 2.94%Mean earnings $54,942 $41,139 2004 $42,517 4.67% 33,077 4.33%Source: US Census Bureau, American Community Survey, 5 year estimates
2005 $44,209 3.98% 34,361 3.88%2006 $48,530 9.77% 37,391 8.82%2007 $49,446 1.89% 38,232 2.25%2008 $51,540 4.23% 39,478 3.26%2009 $52,868 2.58% 40,258 1.98%2010 $54,317 2.74% 40,988 1.81%2011 $56,284 3.62% 42,320 3.25%
(1) Does not include benefitsSource: US Department of Commerce - Bureau of Economic Analysis
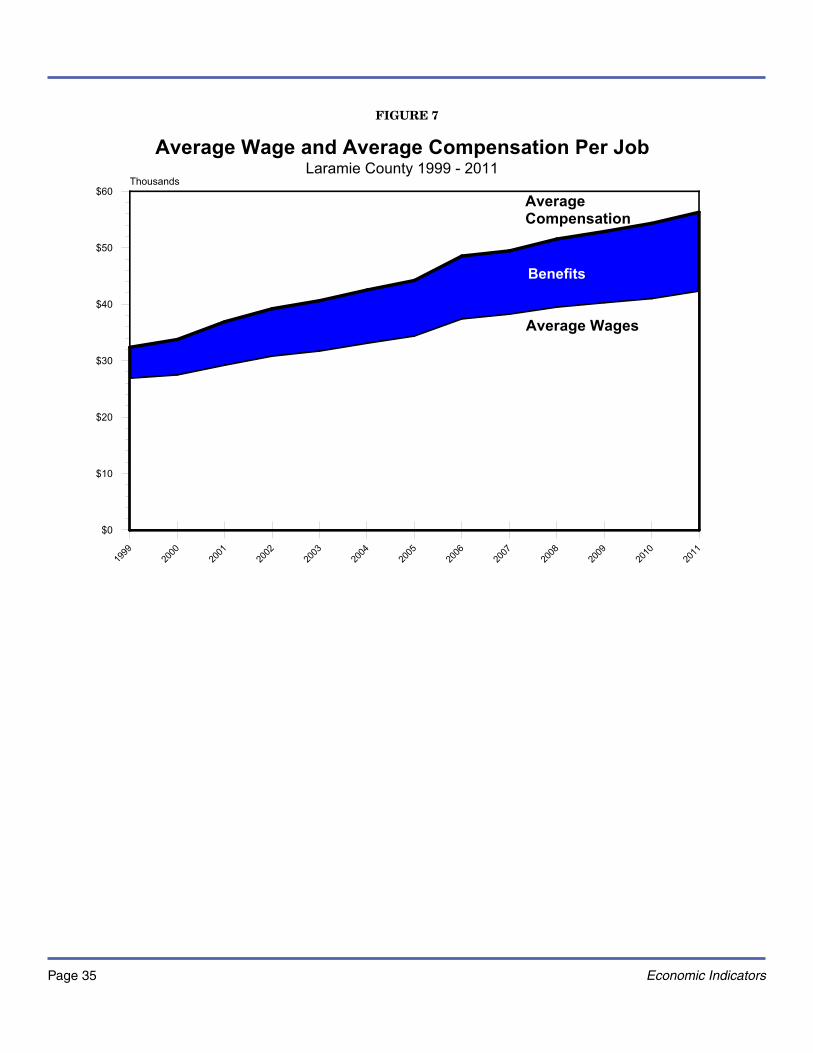
Page 35 Economic Indicators
FIGURE 7
1999
2000
2001
2002
2003
2004
2005
2006
2007
2008
2009
2010
2011
$0
$10
$20
$30
$40
$50
$60Thousands
Average Wage and Average Compensation Per JobLaramie County 1999 - 2011
Benefits
AverageCompensation
Average Wages
Benefits
Figure 7

Page 36 Economic Indicators
Table 3.1
Laramie County Average Annual Earned Income(1)
(Dollars)2004 - 2011
2004 2005 2006 2007 2008 2009 2010 2011Average Annual Earned Income 30,992 32,188 35,308 35,074 37,453 38,376 39,052 40,209
PRIVATEAgriculture 24,882 24,505 24,284 26,611 29,016 28,093 28,613 29,640Mining 42,705 56,680 66,183 50,856 47,333 53,586 57,499 60,970Utilities 59,605 58,734 59,748 62,855 71,890 73,294 73,346 78,000Construction 31,447 31,162 35,802 40,430 41,782 40,313 39,611 41,158Manufacturing 40,196 41,691 42,523 46,904 49,231 49,517 53,846 60,398Wholesale Trade 39,793 40,027 42,887 45,604 46,722 47,619 48,191 50,232Retail Trade 21,840 22,659 23,452 23,673 24,284 24,674 24,934 26,026Trans & Warehousing 28,522 30,225 33,046 34,320 36,621 37,440 38,597 39,871Information 38,701 36,231 40,326 41,444 41,574 42,913 42,744 44,109Finance & Insurance 38,012 39,884 41,444 43,966 43,745 44,590 45,890 46,527Real Estate & Rental & Leasing 27,222 28,951 29,991 33,904 31,837 32,656 35,035 35,243Professional & Business Services 42,861 44,330 46,189 48,802 49,920 54,587 51,220 54,366Management of Companies & Enterprises N/A 45,825 52,494 61,334 56,550 51,012 54,847 62,426
Administrative & Waste Services 21,619 19,474 19,539 20,865 22,971 24,596 23,946 24,453Educational Services 18,642 19,981 22,763 23,010 24,622 26,273 26,000 25,558Health Care & Social Assistance 34,515 35,075 36,153 36,985 38,285 38,363 40,092 41,444Arts, Entertainment & Recreation 12,051 12,272 12,012 12,181 12,532 12,181 12,389 13,039Accommodation & Food Services 12,831 13,975 26,429 16,055 14,599 14,404 14,911 15,327Other Services 22,048 22,321 24,726 29,653 27,742 27,859 28,639 31,070
GOVERNMENT 38,558 40,378 42,783 45,591 47,723 49,179 49,868 50,453Federal Government 49,920 52,429 54,990 57,655 59,553 59,696 61,360 62,478State Government 41,028 43,095 46,215 49,361 52,455 54,691 56,420 56,836Local Government 31,941 33,722 35,880 38,714 40,456 41,886 41,795 42,315
(1) Compiled using quarterly data of average weekly wagesN/A - Data is not available.Source: Wyoming Department of Workforce Services

Page 37 Economic Indicators
Per Capita Personal IncomeLaramie County
1988 - 2011
YEARLARAMIE COUNTY
(a)WYOMING
(b) UNITED STATES
(c)
PERCENT DIFFERENCE
((a-c)/c)1988 $15,796 $14,821 $17,244 -8.40%1989 $17,068 $16,382 $18,402 -7.25%1990 $18,651 $17,910 $19,354 -3.63%1991 $19,159 $18,589 $19,818 -3.33%1992 $19,742 $19,344 $20,799 -5.08%1993 $20,249 $20,065 $21,385 -5.31%1994 $21,068 $20,741 $22,297 -5.51%1995 $21,828 $21,358 $23,262 -6.16%1996 $22,559 $22,233 $24,442 -7.70%1997 $23,736 $23,774 $25,654 -7.48%1998 $25,686 $25,496 $27,258 -5.77%1999 $26,957 $27,192 $28,333 -4.86%2000 $28,601 $29,261 $30,319 -5.67%2001 $30,161 $31,216 $31,157 -3.20%2002 $32,080 $31,890 $31,481 1.90%2003 $33,742 $33,634 $32,295 4.48%2004 $35,449 $35,825 $33,909 4.54%2005 $37,420 $38,839 $35,452 5.55%2006 $40,885 $43,836 $37,725 8.38%2007 $42,797 $45,281 $39,506 8.33%2008 $46,791 $49,104 $40,947 14.27%2009 $43,328 $42,828 $38,637 12.14%2010 $44,285 $45,353 $39,791 11.29%2011 $46,882 $47,898 $41,560 12.81%
Source: US Department of Commerce - Bureau of Economic Analysis
Table 3.2

Page 38 Economic Indicators
FIGURE 8
Per Capita Personal Income1988 - 2011
88 89 90 91 92 93 94 95 96 97 98 99 00 01 02 03 04 05 06 07 08 09 10 11
0
5
10
15
20
25
30
35
40
45
50
Thousands
Laramie County Wyoming United States
Figure 8
Source: US Department of Commerce - Bureau of Economic Analysis

Page 39 Economic Indicators
Lara
mie
Cou
nty
Per
sona
l Inc
ome
and
E
arni
ngs
by I
ndus
try
(BE
A)
(Tho
usan
ds o
f Dol
lars
) 20
00 -
2011
2000
2001
2002
2003
2004
2005
2006
2007
2008
2009
2010
2011
Tota
l Per
sona
l Inc
ome
2,33
8,01
72,
489,
949
2,66
9,93
12,
837,
159
3,02
8,29
53,
208,
059
3,54
9,63
33,
751,
313
4,16
8,03
93,
918,
152
4,08
0,00
84,
345,
022
Der
ivat
ion
of T
PI
Earn
ings
by
Pl
ace
of W
ork
1,69
7,74
81,
838,
149
1,98
1,47
82,
090,
031
2,22
8,71
32,
348,
324
2,61
5,25
52,
719,
973
2,84
0,78
52,
871,
049
2,94
3,27
13,
120,
283
Less
: Per
sona
l Con
t.
for S
ocia
l Ins
ur. (
a)19
1,25
620
3,02
721
9,82
723
2,49
824
5,84
125
5,89
131
8,56
832
6,30
433
6,80
834
5,81
635
0,06
433
5,38
3
Plus
: Adj
ustm
ent
for R
esid
ence
-4,6
40-4
,412
-9,0
02-1
3,36
6-1
5,01
2-1
6,39
1-2
2,13
1-2
3,81
1-2
7,49
0-2
9,03
7-3
0,16
9-3
2,71
3
Equa
ls: N
et E
arn.
by
Plac
e of
Res
iden
ce1,
501,
852
1,63
0,71
01,
752,
649
1,84
4,16
71,
967,
860
2,07
6,04
22,
274,
556
2,36
9,85
82,
476,
487
2,49
6,19
62,
563,
038
2,75
2,18
7
Plus
: Div
iden
ds,
Inte
rest
, and
Ren
t (b)
550,
075
546,
825
575,
121
626,
450
667,
297
715,
211
828,
116
900,
076
1,15
0,87
781
7,05
487
2,46
093
2,74
4
Plus
: Tra
nsfe
r Pay
men
ts28
6,09
031
2,41
434
2,16
136
6,54
239
3,13
841
6,80
644
6,96
148
1,37
954
0,67
560
4,90
264
4,51
066
0,09
1
Indu
stry
Ear
ning
sFa
rm18
,145
18,1
175,
496
12,8
1711
,963
17,9
1312
,763
20,4
7334
,462
23,8
8836
,270
61,1
82N
onfa
rm1,
633,
270
1,82
0,03
21,
975,
982
2,07
7,21
42,
216,
750
2,33
0,41
12,
602,
492
2,69
9,50
02,
806,
323
2,84
7,16
12,
907,
001
3,05
9,10
1Pr
ivat
e98
6,61
21,
110,
590
1,18
9,88
31,
239,
082
1,32
0,67
41,
376,
270
1,59
2,97
71,
617,
878
1,65
5,87
01,
634,
999
1,65
5,46
81,
773,
063
Ag. S
erv.,
For
., Fi
sh,
and
Oth
er (c
)7,
573
(D)
(D)
(D)
(D)
(D)
(D)
(D)
(D)
(D)
(D)
(D)
Min
ing
7,11
813
,516
13,5
5512
,181
13,1
1616
,894
21,5
84(D
)(D
)(D
)(D
)(D
)Co
nstr
uctio
n10
3,67
011
9,04
113
5,77
713
9,69
615
1,24
316
0,64
219
8,95
420
0,79
921
8,79
920
1,44
119
1,90
220
9,33
3M
anuf
actu
ring
80,6
7885
,287
89,9
8891
,255
95,2
8998
,384
113,
051
130,
091
132,
405
109,
595
118,
750
137,
492
Tran
spor
tatio
n an
d W
areh
ousi
ng18
4,70
913
1,44
213
1,34
714
1,56
815
7,98
216
8,01
218
3,09
620
6,50
520
7,23
919
7,79
620
6,72
222
5,52
6
Who
lesa
le T
rade
41,1
3040
,742
37,2
4339
,915
40,9
5744
,016
48,6
8652
,284
54,5
7552
,851
53,4
1556
,309
Reta
il Tr
ade
158,
116
143,
997
154,
460
159,
017
160,
363
171,
463
181,
620
188,
005
197,
038
193,
233
198,
023
211,
819
Fina
nce
and
insu
ranc
e99
,759
80,3
4493
,445
98,9
0510
2,73
510
3,54
911
8,42
210
6,78
694
,187
138,
695
129,
376
132,
102
Real
est
ate
and
re
ntal
and
leas
ing
35,6
2840
,572
40,3
4946
,805
49,8
5147
,663
35,2
5139
,075
39,4
6343
,052
43,6
90
Info
rmat
ion
N/A
(D)
(D)
(D)
(D)
(D)
(D)
57,7
6959
,541
62,7
8962
,300
65,4
66U
tiliti
esN
/A7,
801
8,76
59,
125
9,66
510
,488
11,2
4612
,757
15,5
6314
,467
14,6
7515
,779
Tabl
e 3.
3

Page 40 Economic Indicators
2000
2001
2002
2003
2004
2005
2006
2007
2008
2009
2010
2011
Serv
ices
290,
480
403,
701
436,
068
452,
382
486,
079
502,
588
611,
926
607,
725
620,
878
612,
963
626,
114
656,
660
Prof
essi
onal
&
busi
ness
serv
ices
75,4
3988
,270
93,3
8090
,009
99,9
3910
8,41
111
5,18
012
3,02
713
5,28
013
0,56
013
1,77
213
8,06
4
Man
agem
ent o
f Co
mpa
nies
&
Ente
rpri
ses
27,5
9913
,605
12,6
468,
808
9,26
411
,252
15,4
8212
,799
10,6
126,
634
5,53
24,
845
Adm
inis
trat
ive
&
Was
te S
ervi
ces
23,8
8055
,880
58,1
7758
,475
54,3
2043
,795
47,3
9453
,114
56,1
9257
,588
58,2
6659
,700
Educ
atio
nal S
ervi
ces
2,69
23,
918
4,64
95,
403
6,92
67,
868
10,1
8010
,829
11,1
8611
,462
12,2
6312
,551
Hea
lthca
re &
So
cial
Ass
ista
nce
96,7
3211
7,48
512
7,88
414
6,27
816
1,05
716
8,75
218
1,61
620
7,34
122
8,94
323
3,52
624
6,22
625
7,89
3
Arts
, Ent
erta
inm
ent,
& R
ecre
atio
n5,
473
13,8
8114
,342
14,2
9912
,760
13,1
4513
,381
14,3
0913
,973
13,3
3311
,008
11,3
53
Acco
mm
odat
ion
&
Food
Ser
vice
17,4
0955
,552
61,4
4465
,590
75,8
5581
,862
154,
455
98,7
7487
,901
83,1
0683
,300
88,0
37
Oth
er se
rvic
es41
,256
55,1
1063
,546
63,5
2065
,958
67,5
0374
,238
87,5
3276
,791
76,7
5477
,747
84,2
17G
over
nmen
t &
Gov
ernm
ent E
nter
pris
es64
6,65
870
9,44
278
6,09
983
8,13
289
6,07
695
4,14
11,
009,
515
1,08
1,62
21,
150,
453
1,21
2,16
21,
251,
533
1,28
6,03
8
Fede
ral,
Civi
lian
149,
962
153,
739
167,
533
182,
669
199,
325
205,
174
211,
121
222,
392
236,
498
247,
321
248,
870
258,
326
Mili
tary
189,
260
199,
553
228,
092
241,
702
257,
922
265,
563
267,
339
271,
344
278,
346
297,
444
319,
935
333,
859
Stat
e go
vern
men
t30
7,43
616
0,56
717
8,13
318
8,87
619
6,63
020
9,56
022
9,87
125
1,14
127
3,20
628
5,54
029
2,33
429
5,96
9Lo
cal g
over
nmen
t19
5,58
321
2,34
122
4,88
524
2,19
927
3,84
430
1,18
433
6,74
536
2,40
338
1,85
739
0,39
439
7,88
4
N/A
- D
ata
is n
ot a
vaila
ble
Not
es:
(a)
Pers
onal
cont
ribu
tions
for s
ocia
l ins
uran
ce a
re in
clud
ed in
ear
ning
s by
type
and
indu
stry
but
exc
lude
d fr
om p
erso
nal i
ncom
e.
(b)
Incl
udes
the
capi
tal c
onsu
mpt
ion
adju
stm
ent f
or re
ntal
inco
me
of p
erso
ns.
(c
) “O
ther
” con
sist
s of
wag
es a
nd s
alar
ies
of U
S re
side
nts
empl
oyed
by
inte
rnat
iona
l org
aniz
atio
ns a
nd fo
reig
n em
bass
ies
and
cons
ulat
es in
the
Uni
ted
Stat
es.
(D
) Not
sho
wn
to a
void
dis
clos
ure
of co
nfide
ntia
l inf
orm
atio
n, b
ut th
e es
timat
es fo
r thi
s ite
m a
re in
clud
ed in
the
tota
ls.
Sour
ce: U
S Co
mm
erce
Dep
artm
ent -
Bur
eau
of E
cono
mic
Ana
lysi
s

Page 41 Economic Indicators
FIGURE 9
Personal IncomeLaramie County, Wyoming, and United States
1980 - 2011
1979
1980
1981
1982
1983
1984
1985
1986
1987
1988
1989
1990
1991
1992
1993
1994
1995
1996
1997
1998
1999
2000
2001
2002
2003
2004
2005
2006
2007
2008
2009
2010
2011
2012
0%
5%
10%
15%
20%
-5%
-10%
-15%
% Change from the Previous Year
US Wyoming Laramie County Recession Period
Figure 9

Page 42 Economic Indicators
Lara
mie
Cou
nty
Tota
l Pay
roll
Cov
ered
Em
ploy
men
t by
Stan
dard
Ind
ustr
ial C
lass
ifica
tion
(D
olla
rs)
2003
- 20
11
2003
2004
2005
2006
2007
2008
2009
2010
2011
PR
IVAT
E E
MP
LO
YME
NT
Agri
cultu
re3,8
05,18
73,9
93,18
64,1
80,86
54,9
75,21
25,8
58,14
66,9
17,06
37,8
45,10
17,9
74,74
38,2
14,69
1M
inin
g2,4
55,90
83,1
28,12
89,7
36,14
65,7
72,46
64,3
86,12
94,9
69,91
65,1
80,18
83,2
27,81
88,9
50,20
4U
tiliti
es6,4
64,38
26,7
86,96
67,5
23,27
37,6
88,85
18,7
51,92
210
,171,2
829,8
20,99
19,9
15,79
610
,685,6
01Co
nstr
uctio
n77
,438,0
8982
,032,4
7289
,461,9
2911
4,832
,074
122,6
55,25
013
0,697
,518
116,4
26,31
910
3,906
,955
111,4
81,62
2M
anuf
actu
ring
58,28
7,694
63,13
2,746
66,16
4,291
69,26
7,208
76,51
9,006
82,49
9,186
73,51
8,033
76,41
0,802
88,63
6,643
Who
lesa
le T
rade
26,89
9,770
28,14
6,228
30,71
5,026
34,79
3,021
37,44
6,002
40,43
6,474
39,80
6,629
39,00
4,251
41,04
1,985
Reta
il Tr
ade
116,8
87,39
511
8,437
,493
126,6
54,85
513
1,240
,773
136,4
85,73
113
7,208
,929
130,4
58,37
212
9,864
,713
138,0
66,40
1Tr
ansp
orta
tion
& W
areh
ousi
ng38
,656,9
8145
,557,6
4750
,309,1
0261
,206,0
0078
,702,1
9884
,023,2
7281
,026,6
5984
,789,9
1292
,851,6
63In
form
atio
n38
,902,6
7539
,906,9
1236
,000,2
4940
,775,3
7443
,096,4
0144
,546,3
9946
,529,9
1946
,284,3
4648
,391,1
53Fi
nanc
e &
Insu
ranc
e57
,482,5
3157
,508,2
5759
,808,8
6462
,790,8
2364
,978,5
5271
,044,3
8475
,856,5
1675
,535,0
0476
,608,0
00Re
al E
stat
e &
Ren
tal &
Lea
sing
12,18
7,528
12,99
6,364
14,32
9,007
15,37
8,661
17,78
0,746
17,07
3,501
15,93
1,975
17,56
0,796
18,03
9,263
Serv
ices
276,0
86,49
829
0,496
,260
309,7
27,91
738
3,562
,104
367,1
13,12
937
6,716
,170
376,6
36,75
438
0,408
,110
400,9
60,41
1Pr
ofes
sion
al &
Bus
ines
s Se
rvic
es54
,225,0
0860
,989,3
5067
,228,5
9970
,776,5
8674
,676,1
1381
,258,6
0382
,278,3
7978
,346,0
1681
,625,7
82M
anag
emen
t of
Com
pani
es &
Ent
erpr
ises
6,378
,375
N/A
8,873
,314
11,74
3,629
9,773
,961
8,233
,161
5,001
,495
4,149
,174
3,910
,860
Adm
inis
trat
ive
& W
aste
Ser
vice
s39
,313,2
4436
,682,7
4229
,297,1
0630
,901,9
8735
,107,9
8538
,095,1
4139
,122,9
0540
,152,1
2740
,446,8
82Ed
ucat
iona
l Ser
vice
s1,5
01,45
42,0
69,27
02,8
06,87
64,4
85,43
65,0
45,61
05,2
04,09
05,5
02,54
45,8
37,78
35,9
77,16
7H
ealth
Car
e &
Soc
ial A
ssis
tanc
e97
,299,9
5310
5,511
,083
111,6
20,05
511
7,796
,016
131,2
71,55
414
2,131
,911
146,5
51,10
215
4,012
,466
163,6
78,22
3Ar
ts, E
nter
tain
men
t, &
Re
crea
tion
2,941
,453
3,094
,922
2,993
,259
3,147
,717
3,657
,106
3,683
,910
3,531
,027
3,383
,917
3,560
,767
Acco
mm
odat
ion
& F
ood
Serv
ices
46,09
6,540
53,18
9,263
58,00
6,438
111,8
07,94
468
,027,3
7362
,624,1
4359
,681,9
0559
,438,6
2362
,617,2
21O
ther
Ser
vice
s28
,330,4
7128
,959,6
3028
,902,2
7032
,902,7
8939
,553,4
2735
,485,2
1134
,967,3
9735
,088,0
0439
,143,5
09
GO
VER
NM
EN
TFe
dera
l Gov
ernm
ent
122,5
52,00
013
0,284
,805
134,1
21,74
013
6,304
,292
144,3
82,91
515
3,343
,770
160,1
20,80
516
3,960
,722
165,4
29,57
4St
ate
Gov
ernm
ent
151,5
91,00
015
4,283
,173
163,9
91,04
617
6,929
,458
194,1
56,56
221
1,961
,307
222,4
47,13
822
6,172
,146
228,0
67,80
6Lo
cal G
over
nmen
t17
2,337
,000
184,8
63,45
820
7,631
,299
225,5
27,23
325
3,907
,930
274,8
45,59
629
0,286
,996
292,9
32,73
329
6,631
,364
TOTA
L PA
YRO
LL ($
)1,1
62,07
1,702
1,228
,471,9
561,3
04,99
5,609
1,471
,097,5
501,5
56,22
0,619
1,646
,454,7
671,6
51,89
2,395
1,657
,948,8
471,7
34,05
6,381
N/A
- D
ata
was
not
ava
ilabl
eSo
urce
: Wyo
min
g D
epar
tmen
t of E
mpl
oym
ent
Tabl
e 3.
4

Demographic TrendsThe user will find population data for Cheyenne and Laramie County in this section along with population forecasts. The population figures include the Decennial Census statistics for Cheyenne, Albin, Burns, Pine Bluffs, Laramie County plus Census Designated Places and are presented in Table 4.0. At minimum no less than 76,200 individuals reside within a 5-mile radius of Cheyenne’s incorporated boundaries according to the 2010 Census which would equal 83 percent of the total county population. Between 2000 and 2010, the ranchettes surrounding the city were the fastest growing sub-area at 19.1 percent. They added 929 persons. The city, of course, added the most persons, 6,455, but its rate of increase was at 12.2 percent by comparison.
The greatest rate of population change occurred at F.E. Warren Air Force base which lost 31 percent of its population (1,368 persons). This loss was due to a designed reduction in dormitory populations, not a reduction in base jobs or military personnel.
According to the 2010 Census the median age for residents continued its long-term rise in 2010. It declined to 35.8 years in 2008 but in 2010 it stood at 37.0 years. According to the most recent ACS data, the 2010 median age was 38.2. The continued rise in the median age creates a disturbing trend with negative implications for the county’s future economy. An aging population has the potential to create a shortage of young workers as older workers retire and as these old workers retire they also place increased demands on social services and programs. However as explained in section 3, increased retires can also add stability to personal income and the overall economy. A lack of a relatively young workforce means diminished abilities to meet the demands of an ever increasing retirement population. Table 4.2 provides additional county level demographic details.
FORECASTSTables 2.5 and 4.1 present the Center’s employment and population forecasts for Laramie County to 2016 where new job creation is expected to grow at 2.1 percent per year and population growth is forecasted at 1.25 percent annually. There are other organizations that are offering projections for Laramie County which are provided below.
The State of Wyoming is projecting that the county’s population will grow at an annual rate of 0.9 percent to 2015 and then at a 0.76 percent rate well into the future. These rates are close to or below historical growth rates for the county and essentially represent “no growth” or stagnation scenarios.
Another organization is projecting both population and job growth at 1.1 percent rates through year 2035.
The Wyoming Housing Database Partnership has also projected housing demands through year 2040. Between 2010 and 2025, they forecast the demand for single-family homes in Cheyenne will increase on average at a rate 338 units per year or 0.75 percent. The average increase in the actual number of new single-family homes between 2000 and 2012 was 390 (Table 5.2) by comparison. Their forecast for rental demand is at a rate of 0.39 percent annually or 47 units per year through year 2025. The actual number of apartment units built between 2000 and 2012 averaged 79 units per year (Table 5.2).
Table 4.4 presents migration statistics for Laramie County from 2000 forward. The County has experienced for the past 12 consecutive years greater in-migration than out-migration. The new Census numbers suggest that net in-migration was greater than natural population growth (births minus deaths) over the past decade. Total net
SECTION 4 DEMOGRAPHIC TRENDS
Table4.0 Census Detail (1990 - 2010).4.1 Population & Household Estimates
(1990 - 2016)Figure 10 - Population Forecasts
4.2 Population Profile (1980 - 2011)4.3 Population By Race & Ethnic
Groups (1980 - 2010)Population By Age & Gender (2000 - 2010)
4.4 Migration & Commuters (2000 - 2011)Figure 11 - Commuting FlowsFigure 12 - Net Commuting Residential Adjustment
4.5 Commuter Income Flows (1990 - 2011)
4.6 Education Profiles & ACT Scores4.7 School Enrollments (1985 - 2012)
Figure 13 - School Enrollments

in-migration using Driver License Exchange statistics over this period stood at 8,466 persons through the first half of 2012. Year 2011 saw a marked slowdown in net migration from the previous four years and preliminary 2012 data suggested that trend continued through 2012.
However, even with an apparent slowdown in net in-migration over the past two years, the trend remained positive during the Great Recession period and post-recession years which violated the long established local rule of thumb that when unemployment increases and personal income falls, Laramie County experiences net out-migration. In other words, the unemployed leave the community to find work elsewhere.
Table 4.5, in conjunction with Figures 10 and 11, provide insights as to the role commuters play in Laramie County’s economy. The table presents inflow and outflow earnings and the net residence adjustment between the two. The inflow of earnings represents the amount of money brought back into the county’s economy by Laramie County residents who commute to work outside of the county. The outflow of earnings represents workers who commute into the county for work but live outside of the county.
Net outflows have been consistently larger overtime which means more dollars flow out of the local economy than are returned by county residents working outside of Laramie County. Figure 11 presents this trend. Figure 12 presents the ratio between the net residential adjustments and total county personal income. This ratio steadily decreased from 1.64 percent in 1990 to 0.50 percent in 2004, but since then it has crept steadily upward and stood at 0.75 percent by the end of 2011. However, the 2011 net outflows accounted for only 0.75 percent of total personal county income which is an insignificant percentage. Commutation has been and remains a non-factor in the Laramie County economy. If the assumption is made that commuters, local and non-local, earn average compensation rates as found in Table 3.0, this would suggest that approximately 1,552 Laramie County workers commute to jobs outside of the county and 2,134 non-resident workers commute into the county for work.
Table 4.6 provides education profiles for Laramie County. ACT scores for 2012 were not available for Laramie County.
Table 4.6 also presents 1-year ACS estimates on educational attainment in Laramie County. As can been seen, there is moderate to wide variation in the estimates from year-to-year as thus valid comparisons on a year-to-year basis were not possible.
Statistics presented in Table 4.7 are for educational enrollment data throughout the county. The statistics presented for the two local school districts for elementary, junior high and senior high years have been revised from last year’s data. The above data are the official enrollments published by the Wyoming Department of Education as of October 1st of each year going back to 1991. The revised statistics removed, to a large degree, the volatility found in the data published in the earlier editions of the Economic Trends. This is especially true for years 2009 and 2010. The large jump in elementary school enrollments reported between 2009 and 2010 (+556 kids) last year vanished under the new official statistics. The official statistics reported an increase of only 44 students in 2010. The average rate of increase in elementary school enrollments between 2008 and 2012 was 1.83 percent under the revised data as compared to 2.23 percent under the previous data. Elementary enrollments, however, surpassed 8,000 in 2011 and maintained that level in 2012. The last time elementary school enrollments exceeded 8,000 was 1996. At minimum, 752 elementary students have been added to local school system since 2007 which helps explain the District’s scramble to find additional facilities. It is also noteworthy that elementary enrollments rose throughout the Great Recession years but total school enrollments declined fractionally in 2010 (-0.2%). Note also that LCCC enrollments fell in 2012 as the Greater Cheyenne economy approached full recovery from the recession.
Home schooled enrollments decreased over the past five years with an annual average decline of 31 students per year which was equal to a 9.6 percent negative growth rate. An explanation for this sharp change in direction was not available.

Page 45 Economic Indicators
Table 4.0
Census Detail1990 - 2010
1990 2000 2010Cheyenne City 50,008 53,011 59,466Burns N/A 285 301Fox Farm/College 2,965 3,272 3,647Pine Bluffs 1,054 1,153 1,129Ranchettes 4,038 4,869 5,798South Greeley 3,723 4,201 4,217Warren AFB 3,832 4,440 3,072Albin Town 120 120 181Carpenter CDP 94
65,740 71,351 77,905
Bal. of County 7,402 10,256 13,833
TOTAL 73,142 81,607 91,738
Source: U.S. Census Bureau Decennial Census 1990, 2000, 2010

Page 46 Economic Indicators
Table 4.1
Population Estimates and ProjectionsLaramie County
1990 - 2016
YEAR LARAMIE COUNTY POPULATION
CITY OF CHEYENNE POPULATION ESTIMATES
ESTIMATED LARAMIE COUNTY HOUSEHOLDS
1990 73,142 (a) 50,197 (a) 28,092 (a)1991 73,979 (c) 50,607 (c) 28,584 (c)1992 75,826 (c) 51,758 (c) 29,084 (c)1993 77,495 (c) 52,628 (c) 29,593 (c)1994 78,885 (c) 53,329 (c) 30,111 (c)1995 79,513 (c) 53,472 (c) 30,638 (c)1996 80,186 (c) 53,692 (c) 31,174 (c)1997 80,328 (c) 53,626 (c) 31,719 (c)1998 80,526 (c) 53,780 (c) 32,274 (c)1999 81,009 (c) 53,925 (c) 32,837 (c)2000 81,617 (a) 53,011 (a) 31,927 (a)2001 82,554 (c) 53,717 (c) 32,364 (b)2002 83,226 (c) 54,103 (c) 32,808 (b)2003 84,084 (c) 54,709 (c) 33,257 (b)2004 85,427 (c) 55,461 (c) 33,713 (b)2005 85,732 (c) 55,533 (c) 34,394 (d)2006 86,819 (c) 55,885 (c) 33,463 (d)2007 87,654 (c) 56,313 (c) 33,261 (d)2008 89,077 (c) 57,048 (c) 33,871 (b)2009 90,430 (c) 57,618 (c) 34,176 (b)2010 91,738 (c) 59,739 (a) 37,576 (a)2011 92,487 (c) 60,096 (c) 37,895 (b)2012 94,483 (c) 60,459 * 38,240 (b)2013 95,664 (b) 61,055 * 38,661 (b)2014 96,860 (b) 61,717 * 39,044 (b)2015 98,071 (b) 62,378 * 39,481 (b)2016 98,789 (b) 62,942 * 39,915 (b)
Notes: (a) U.S. Census Bureau Count (b) Projections by the Center for Business & Economic Analysis (c) U.S. Census Bureau Estimate (d) American Community Survey (ACS)* Projections by the Wyoming Division of Economic Analysis

Page 47 Economic Indicators
FIGURE 10
Population ForecastsLaramie County
1990 - 2016
1990
1991
1992
1993
1994
1995
1996
1997
1998
1999
2000
2001
2002
2003
2004
2005
2006
2007
2008
2009
2010
2011
2012
2013
2014
2015
2016
0
20
40
60
80
100
120Thousands
Figure 10

Page 48 Economic Indicators
Laramie County Population Profiles1980 - 2011
1980 1990 2000 *2006 *2007 *2008 *2009 *2010 *2011Census Population 68,649 73,142 81,607 85,384 86,353 87,542 88,854 91,738 92,680
Age DistributionLess than 5 5,797 5,907 5,384 6,528 6,390 6,534 6,967 6,727 6,2645 - 19 years 17,197 16,360 17,910 16,210 17,787 18,667 16,677 18,078 17,50120 - 44 years 2,760 20,141 30,427 30,328 29,423 29,590 19,108 30,258 31,35145 - 64 years 12,035 13,295 18,535 22,568 22,325 22,208 23,425 24,584 25,51165 and over 5,990 7,439 9,351 9,750 10,425 10,545 11,277 11,505 12,053
Less than 5 (a) 5,797 5,907 5,384 6,528 6,390 6,534 6,967 6,727 6,2645 - 16 years 12,354 13,088 14,475 N/A N/A N/A N/A 14,453 11,90916 years and older 50,986 55,067 62,981 N/A N/A N/A N/A 71,171 N/A18 years and older 48,884 53,063 60,584 64,546 69,283 65,321 67,396 68,751 70,9225 - 20 years 18,639 17,465 19,024 N/A 17,787 18,667 16,677 19,385 24,70118 - 20 years 4,670 3,293 3,385 3,647 N/A 3,535 2,186 3,711 N/A21 - 24 years 5,766 4,016 4,419 N/A N/A 4,987 5,623 5,205 N/A25 - 44 years 20,422 25,020 24,894 24,231 24,141 25,046 23,752 23,746 24,15145 - 54 years 6,566 7,323 11,489 12,432 12,817 12,637 12,360 13,554 13,44855 - 59 years 2,859 2,998 3,929 6,171 5,351 5,246 6,431 6,292 7,09360 - 64 years 2,610 2,974 3,117 3,965 4,157 4,325 4,634 5,324 4,97065 and over 5,990 7,439 9,351 9,750 10,425 10,545 11,277 11,505 12,053
Median Age 28.1 31.9 35.3 36.0 36.4 35.8 36.6 38.2 37.0Persons Per Household 2.81 2.55 2.45 N/A 2.51 2.58 2.50 2.44 2.42
Per Capita IncomeCity 7,626 1,351 19,469 N/A 28,240 N/A 26,634 26,607 28,024County 11,446 18,656 28,004 40,752 43,351 N/A 24,903 26,608 28,024
Median Household Income City 16,935 28,117 38,307 N/A 52,521 56,820 49,176 49,065 54,053County 17,630 27,571 39,307 50,907 52,521 56,820 49,744 48,784 54,053
Median Family IncomeCity N/A N/A 45,995 N/A 65,716 70,306 61,521 61,074 71,589County N/A N/A 46,536 60,737 65,716 70,306 69,209 62,337 71,589
Note: (a) 1980 numbers were interpolated to match 1990 census age cohorts.Sources: US Census of Population and Housing 1980, 1990, 2000 * American Community Survey, 1-Year Estimates
Table 4.2

Page 49 Economic Indicators
Population by Race and Ethnic Groups1980 - 2010
YEAR WHITE BLACK NATIVE AMERICAN ASIAN OTHER TOTALS HISPANIC
(ETHNICITY)LARAMIE COUNTY
1980 58,838 1,952 661 555 68,649 6,6431990 62,265 2,218 528 821 73,142 7,3102000 72,563 2,124 693 777 5,450 81,607 8,8972010 81,205 2,248 878 976 6,431 91,738 11,978
WYOMING1980 431,503 3,270 8,266 2,044 445,083 24,4741990 411,946 3,606 9,479 2,806 427,837 25,7512000 454,670 3,722 11,133 2,771 21,486 493,782 31,6692010 511,279 4,748 13,336 4,426 29,837 563,626 50,231
Source: US Census Bureau
Population by Age and GenderLaramie County
2000 - 2010
AGE2000 CENSUS 2010 CENSUS
% CHANGEMALE FEMALE TOTAL MALE FEMALE TOTAL
Under 5 2,758 2,626 5,384 3,425 3,302 6,727 24.9%5 to 19 9,177 8,733 17,910 9,221 8,857 18,078 0.9%20 to 24 3,001 2,532 5,533 3,439 3,073 6,512 17.7%25 to 34 6,165 5,452 11,617 6,284 6,071 12,355 6.4%35 to 54 12,478 12,288 24,766 12,562 12,383 24,945 0.7%55 to 64 3,474 3,572 7,046 5,773 5,843 11,616 64.9%65 and Over 3,933 5,418 9,351 5,171 6,334 11,505 23.0%Total 40,986 40,621 81,607 45,875 45,863 91,738 12.4%
Source: US Census Bureau
Table 4.3

Page 50 Economic Indicators
Table 4.4
Migration & CommutersLaramie County Migration Data(1)
2000 - 2012YEAR IN-MIGRANTS OUT-MIGRANTS NET MIGRANTS
2000 3,052 2,439 6132001 3,007 2,294 7132002 2,822 1,978 8442003 2,577 1,793 7842004 2,565 2,254 3112005 2,545 2,116 4292006 2,519 2,009 5102007 2,678 2,072 6062008 2,735 2,085 6502009 2,714 1,672 1,0422010 2,805 1,478 1,3272011 2,516 1,987 5292012 First Half 1,092 984 108Total 33,627 25,161 8,466
1. Driver Licenses Exchanged & SurrenderedSource: Wyoming Housing Database Partnership Reports
Commuters from Laramie County 1990 - 2000
FROM LARAMIE COUNTY TO: 1990 2000 FROM LARAMIE COUNTY TO: 1990 2000Larimer, CO 109 525 Lincoln, NE 0 25Weld, CO 80 244 Cheyenne, NE 44 25Albany, WY 145 199 Carbon, WY 14 25Denver, CO 35 95 Scottsbluff, NE 0 24Kimball, NE 55 88 Wyandotte, KS 0 20Adams, CO 0 78 Seward, NE 0 20Other Countries 0 64 Clay, IA 0 20Jefferson, CO 6 39 Bernalillo, NM 0 18Boulder, CO 0 39 Not Reported 0 0Adams, NE 0 39 Natrona, WY 57 0Sweetwater, WY 25 32 Johnson, WY 0 0Converse, WY 0 29 Jackson, CO 0 0Arapahoe, CO 0 29 Goshen, WY 64 0Platte, WY 33 28 Elsewhere 430 0El Paso, CO 0 28 Total Commuters 488 1,556
Sectors with Largest Number of CommutersConstruction 20.3%Utilities, Transportation & Warehousing 19.7%Services 18.6%Source: Bureau of Economic Analysis

Page 51 Economic Indicators
FIGURE 11Figure 11
Commuting Flows Laramie County
1990 - 2011
1990
1991
1992
1993
1994
1995
1996
1997
1998
1999
2000
2001
2002
2003
2004
2005
2006
2007
2008
2009
2010
2011
$0$10$20$30$40$50$60$70$80$90
$100$110$120$130
Thou
san d
s
Inflow of Earnings Outflow of Earnings
Figure 12
Net Residential AdjustmentLaramie County
1990 - 2011
90 91 92 93 94 95 96 97 98 99 00 01 02 03 04 05 06 07 08 09 10 11
0.0%
-0.5%
-1.0%
-1.5%
-2.0%
FIGURE 12
19 19 19 19 19 19 19 19 19 19 20 20 20 20 20 20 20 20 20 20 20 20

Page 52 Economic Indicators
Commuter Income FlowsLaramie County
1990 - 2011
YEARINFLOWS OF EARNINGS
($000)
OUTFLOW OF EARNINGS
($000)
NET RESIDENT ADJUSTMENTS
($000)
% NET ADJUSTMENT/
TPY1990 14,944 37,380 -22,436 -1.64%1991 17,526 39,598 -22,072 -1.56%1992 20,195 42,575 -22,380 -1.50%1993 23,555 44,952 -21,397 -1.36%1994 27,633 46,175 -18,542 -1.12%1995 31,159 46,467 -15,308 -0.88%1996 34,958 47,662 -12,704 -0.70%1997 39,649 50,387 -10,738 -0.56%1998 45,318 55,110 -9,792 -0.47%1999 51,292 60,001 -8,709 -0.40%2000 59,567 64,207 -4,640 -0.20%2001 62,564 66,976 -4,412 -0.18%2002 63,509 72,511 -9,002 -0.34%2003 64,019 77,385 -13,366 -0.47%2004 67,931 82,943 -15,012 -0.50%2005 71,878 88,269 -16,391 -0.51%2006 76,332 98,463 -22,131 -0.62%2007 80,785 104,596 -23,811 -0.63%2008 83,603 111,093 -27,490 -0.66%2009 80,687 109,724 -29,037 -0.74%2010 81,252 111,421 -30,169 -0.74%2011 87,407 120,120 -32,713 -0.75%
Source: Bureau of Economic Analysis
Table 4.5

Page 53 Economic Indicators
Table 4.6
Laramie County Education Profiles1980 - 2011
1980 1990 2000 2006(B) 2007(B) 2008(B) 2009(B) 2010(B) 2011(B)
Education Attainment (Yrs.)(a)
Elementary (K-8) 3,693 2,373 1,268 1,709 1,406 854 1,163 1,371 790High School (9-12, no diploma) 3,940 4,868 4,107 3,671 4,068 3,746 4,041 2,407 3,831
Senior High Graduate (12) 15,711 13,283 14,053 16,614 16,098 16,350 15,124 19,091 16,224College Study (13-15) 8,288 15,763 15,916 14,920 14,281 16,067 17,882 17,238 14,913College Graduate (16+) 6,815 9,467 8,146 8,292 8,392 8,995 7,915 8,854 N/APercent High School Graduates 80.1% 84.2% 89.1% 90.5% 90.2% 91.0% 90.5% 93.8% N/A
Percent bachelor’s degree or higher N/A N/A N/A 22.3% 24.2% 24.1% 22.2% 22.6% N/A
Associate Degree N/A N/A 4,868 7,019 6,538 5,597 6,916 7,487 8,933Professional School Degree N/A N/A 2,853 3,277 3,555 3,036 3,834 3,505 5,439Master’s Degree N/A N/A 1,136 738 1,168 1,104 744 751 N/A
Notes: (a) 25 Years and olderNA - Data is not available.Source: US Census Bureau(b) American Community Survey 1-Year Estimates
Average ACT Scores2000 - 2012
2000 2001 2002 2003 2004 2005 2006 2007 2008 2009 2010 2011 2012Laramie County 21.7 21.5 22.2 22.5 22.1 22.3 22.3 21.9 21.4 20.6 19.1 20.5 N/A
Wyoming 21.6 21.5 21.4 21.4 21.4 21.4 21.6 21.5 21.1 20.0 20.0 20.3 20.3United States 21.0 21.0 20.8 20.8 20.9 20.9 21.1 21.2 21.1 21.1 21.0 21.1 21.1
Source: US Census of Population and General Social and Economic Characteristics 1980, 1990Wyoming State Data Center Bulletin Volume II, Number 3ACT, Inc., Iowa city, IA Laramie County School District Number 1

Page 54 Economic Indicators
Public and Private School EnrollmentCheyenne and Laramie County
1985 - 2012
YEAR ELEMEN-TARY
JUNIOR HIGH
SENIOR HIGH PRIVATE HOME
SCHOOLED TOTAL LCCC HEADCOUNT
LCCC FTE
1985 7,225 3,296 2,827 616 N/A 13,964 2,588 1,5951986 7,499 3,189 2,899 560 N/A 14,147 2,707 1,6171987 7,639 3,145 2,951 497 N/A 14,232 2,877 1,6831988 7,740 3,081 2,908 510 N/A 14,239 2,900 1,7451989 7,913 3,010 2,860 499 N/A 14,282 3,151 1,8331990 7,989 3,004 2,865 488 N/A 14,346 3,509 1,9791991 8,180 3,223 2,971 433 N/A 14,807 3,483 2,0581992 8,186 3,487 3,000 368 96 15,137 3,564 2,1271993 8,363 3,622 3,017 352 118 15,472 3,448 2,1301994 8,250 3,645 2,967 375 297 15,534 3,229 1,7621995 8,212 3,555 3,131 379 190 15,467 3,040 1,5401996 8,036 3,585 3,203 389 221 15,434 3,017 1,4641997 7,822 3,658 3,260 460 238 15,438 3,044 1,4201998 7,782 3,640 3,176 478 269 15,345 2,852 1,6221999 7,711 3,533 3,079 450 305 15,078 3,057 1,3992000 7,555 3,525 3,117 424 333 14,954 2,959 1,3492001 7,532 3,485 3,182 360 346 14,905 2,736 1,3402002 7,415 3,510 3,099 360 326 14,710 2,863 1,5552003 7,285 3,510 3,130 409 317 14,651 3,421 1,9182004 7,104 3,496 3,107 535 305 14,547 3,329 1,9162005 7,053 3,497 3,094 471 295 14,410 3,529 1,9502006 7,168 3,412 3,146 415 331 14,472 3,069 1,9482007 7,263 3,242 3,199 394 357 14,454 3,507 2,0772008 7,459 3,130 3,185 406 380 14,560 3,647 2,0432009 7,738 3,153 3,176 453 377 14,897 3,921 2,1452010 7,782 3,214 3,100 433 336 14,865 4,255 2,3862011 8,004 3,247 3,035 405 292 14,983 4,469 2,4232012 8,015 3,272 3,041 441 255 15,023 4,416 2,281
NA - Data is not available.Footnote for School Districts: LCCC Headcount and FTE numbers are for the Cheyenne Campus and F.E. Warren AFB only.These figures do not include the Albany County Campus.1991 forward figures for Elementary, Junior High and Senior High are the Official yearly Oct 1 Enrollment from WDE.Source: Laramie County School District #1 Laramie County School District #2 Laramie County Community College Private Schools Wyoming Department of Education
Table 4.7

Page 55 Economic Indicators
FIGURE 13
Public School and College EnrollmentCity of Cheyenne and Laramie County
1995 - 2012
95 96 97 98 99 00 01 02 03 04 05 06 07 08 09 10 11 120
2
4
6
8
10
Thousands
Home Schooled Private Schools LCCC Sr. High Jr. High Elementary
Figure 13

Housing TrendsThis section contains data compiled from various sources that should be useful in assessing the local housing market. The financial and economic health of a community’s housing sector is critical for future economic development efforts, and thus the statistics presented in this section were designed with this goal in mind.
Table 5.0 presents historical annual real estate statistics for Laramie County from Core Logic Solutions which is a national firm providing comprehensive real estate data on the nation’s commercial and residential markets. Table 5.1 also presents historical residential housing market data with the bulk of that data being provided by the Cheyenne Board of Realtors. Core Logic’s data is more comprehensive and in-depth than that the Board of Realtors’ data and thus, we focused our analysis on Core Logic numbers.
Home sales unexpectedly declined over 2012, down 1.3 percent from 2011. Total sales last year were 1,750 which remained well below 2008’s total of 2,175. Current sales, therefore, remained 19.5 percent below the pre-recession level. However, average sales prices in 2012 increased to $200,414 or 2.4 percent over 2011’s average of $195,743. The County Assessor reported 2011’s average home sales price at $197,700 which was slightly higher than 2011 Core Logic’s price of $195,743. The Board of Realtor’s 2012 average selling price within city limits was $191,846 with rural homes selling, on average, at $285,984.
The number of foreclosures fell sharply last year, down 25 percent, to a total of 899 as compared to 2011’s total of 1,202. Last year’s total foreclosures were almost identical to 2008’s figure of 895. The foreclosure rate for both those years was identical, 0.5 percent. Another shadow market statistic that moved positively in 2012 was the number of negative equity loans. Such loans decreased by 226 in 2012 or by 12.4 percent from 2011’s total of 1,817. The monthly average for the number of 90+ day delinquency loans also fell in 2012 (-9.5%) as compared to 2011. However, it was still 23 percent above the 2008 average of 247. All in all, the greater Cheyenne housing market has, for the most part, recovered from the Great Recession. The expectation is that by yearend 2013, the recovery will be complete.
A total of 350 single-family homes were permitted for construction in 2012 which was an increase of 73 homes (+26.4%) over 2011’s total of 277.
Last year’s total was the highest since 2006 when 460 homes were permitted. Even at 350, 2012’s construction level still lagged the peak year of 2004 when new home construction permits hit 726. In addition to construction of new single-family homes, 132 new multi-family housing units were permitted in 2012. However, of the 132 units, 78 were for the construction of an assisted living facility. Up until late 2012, there had been no new multi-family construction in Laramie County since 2009. For all of 2012 then, 482 additional housing units were added to the stock of housing which was the highest level of activity since 2005. See Table 5.2 for more details.
Table 5.2 presents historical Cheyenne housing rental rates through second quarter 2012. On a year-over-year basis, rates decreased for homes and a typical 2-bedroom apartment. Home rents fell 2.6 percent while apartment rates saw a marginal decline of 0.8 percent. Rates for a mobile home increased 1.7 percent by comparison.
SECTION 5 HOUSING TRENDS
Table5.0 Annual Core Logic Residential
Market Data (2008 - 2012)5.1 Residentials For Sale, Sold & Price
(1987 - 2012)5.2 Cheyenne Housing Rental Rates
(1993 - 2012)5.3 County Housing Profile (1984 - 2012)
Figure 14 - New Residential Housing Permits
5.4 Cheyenne City Housing Profile (2000 - 2012)
5.5 Building Permits (1998-2011)5.6 Residential Construction Activity
(1987 - 2012)5.7 Historic Housing Occupancy
(1960 - 2010)5.8 Vacancy Rates (1988 - 2012)

Table 5.8 presents apartment vacancy rates across Laramie County. Vacancy rates at large apartment complexes have crept steadily lower for the past 6 quarters and finished 2012 at a rate of 2.08 percent. In second quarter 2009, this rate stood at 5.3 percent by comparison. The 2012 year end rate was the lowest posted since 1995. Also, the Wyoming Housing Database Partnership’s apartment vacancy rate (last column in table 5.8) stood at 2.28 percent at the end of the second quarter of 2012 and obviously mirrored the large complex rate. Given that both rates are compiled independently of one another, they jointly suggested the local supply of multi-family housing is constrained and any new construction would be quickly absorbed.

Page 58 Economic Indicators
Table 5.0
Annual Core Logic Residential Market Data2008 - 20122008 2009 2010 2011 2012
Total Sales Count 2,175 2,052 2,040 1,773 1,750Total Sales Price - Mean 193,859 189,635 200,314 195,743 200,414New Construction Sales Count 254 193 273 89 68New Construction Sales % of Total Sales 11.6% 9.4% 13.3% 5.1% 4.1%New Construction Sales Price - Mean 236,797 238,269 237,644 214,553 276,279Resale Sales Count 1,675 1,593 1,475 1,360 1,386Resale Sales Price - Mean 194,412 191,118 198,312 204,067 202,488Foreclosures 895 1,007 1,215 1,202 899Foreclosure Rate 0.5% 0.6% 0.7% 0.7% 0.5%Negative Equity Loans 0 750 1,862 1,817 1,59190+ Day Delinquency 247 297 367 336 304
Source: Core Logic Solutions

Page 59 Economic Indicators
Table 5.1
Residentials for Sale, Sold & Price1987 - 2012
YEAR
AVERAGE RESIDENTIAL
UNITS FOR SALEAVERAGE DAYS ON
THE MARKET(1)AVERAGE SELLING
PRICELARAMIE COUNTY AVERAGE SALES
PRICE REPORTED BY ASSESSOR(3)
TOTAL UNITS SOLD
CITY & RURALCITY RURAL CITY RURAL CITY RURAL
1987 724 124 n/a $65,825 $82,942 N/A 1,5131988 675 136 n/a $65,125 $91,575 N/A 1,1891989 645 114 n/a $66,900 $88,133 N/A 1,3641990 575 113 n/a $67,667 $86,833 N/A 1,2311991 467 84 n/a $65,350 $96,317 N/A 1,4811992 320 54 34 $70,250 $104,633 N/A 1,6341993 222 44 53 $76,808 $104,867 N/A 1,7101994 240 59 47 $81,775 $123,725 N/A 1,8721995 133 42 16 $87,924 $139,313 N/A N/A1996 330 78 59 $88,868 $129,079 N/A 2,1351997 407 82 68 $99,140 $144,695 N/A 2,0931998 453 114 97 $100,053 $156,345 N/A 2,3931999 380 121 129 $107,081 $154,805 $110,429 2,8992000 345 117 126 $108,509 $168,607 $119,107 1,3212001 333 99 112 $114,819 $186,935 $123,583 1,5082002 247 110 102 $123,556 $195,434 $131,599 1,4972003 271 102 98 $136,139 $216,344 $145,087 1,6052004 371 111 116 $147,921 $231,846 $155,467 1,8582005 475 145 120 129(2) $161,219 $248,114 $165,743 1,8792006 680 189 89 93 $172,455 $253,026 $179,338 1,8402007 717 172 85 101 $175,088 $261,145 $191,863 1,5862008 670 205 89 110 $174,366 $251,418 $202,304 1,3602009 456 132 78 128 $172,355 $261,529 $193,759 1,3312010 487 166 75 97 $182,630 $262,112 $208,842 1,2912011 412 162 82 102 $180,676 $265,153 $197,700 1,3482012 345 140 72 86 $191,846 $285,984 N/A 1,510
(1) Note: As of January 2006, Cheyenne Board of Realtors (CBR) changed the calculation of the average days on the market from the day listed to the day under contract.
Prior to 2006, the avg days on the market was calculated from day listed to the day of closing.(2) CBR began reporting average days on the market separately for city and rural areas.(3) Source: Laramie County Assessor’s Office Source: Cheyenne Board of Realtors

Page 60 Economic Indicators
Cheyenne Housing Rental Rates1993 - 2012
Table 5.2
QUAR-TER/YEAR
HOUSE APART-MENT
MOBILE HOME
MOBILE HOME LOT
RENT2Q93 $556 $384 $395 $1604Q93 $554 $421 $424 $1492Q94 $586 $447 N/A $1494Q94 $592 $444 $423 $1542Q95 $501 $375 $385 $1594Q95 $501 $379 $382 $1622Q96 $584 $433 $422 $1664Q96 $550 $419 $396 $1582Q97 $622 $433 $433 $1824Q97 $588 $431 $480 $1772Q98 $559 $429 $417 $1774Q98 $606 $424 $450 $1762Q99 $666 $428 $508 $1754Q99 $628 $433 $485 $1842Q00 $651 $441 $497 $2034Q00 $637 $440 $498 $2052Q01 $681 $453 $485 $2094Q01 $757 $470 $566 $2082Q02 $730 $480 $555 $2144Q02 $762 $478 $487 $2152Q03 $820 $503 $521 $225
QUAR-TER/YEAR
HOUSE APART-MENT
MOBILE HOME
MOBILE HOME LOT
RENT4Q03 $843 $528 $524 $2242Q04 $854 $542 $553 $2194Q04 $839 $569 $579 $2272Q05 $829 $542 $594 $2434Q05 $816 $573 $546 $2212Q06 $860 $551 $631 $2454Q06 $835 $564 $588 $2522Q07 $864 $558 $575 $2304Q07 $864 $557 $594 $2392Q08 $899 $601 $559 $2904Q08 $856 $587 $616 $2662Q09 $892 $587 $576 $2934Q09 $902 $594 $633 $2652Q10 $936 $621 $630 $3094Q10 $983 $640 $597 $2762Q11 $991 $654 $656 $2874Q11 $1,057 $649 $586 $2842Q12 $965 $649 $667 $308
Note: House - 2 or 3 bedroom, single-family, excluding gas or electric. Apartment - 2 bedroom, unfurnished, excluding gas or electric Mobile Homes - Total monthly expenses, including water and lot rent Mobile Home Lot Rent - Single wide, including water
Source: State of Wyoming Economic Analysis Division

Page 61 Economic Indicators
Table 5.3
Housing ProfileLaramie County
1984 - 2012
YEAR
AUTHORIZED CONSTRUCTION IN PERMIT ISSUING AREAS PER UNIT VALUATION
SFU DUPLEX UNITS
TRI & FOUR PLEX
MULTI- FAMILY
TOTAL UNITS
SFU 2011 REAL $ VALUE
% CHANGE
1984 226 0 4 0 230 103.20 0.1071985 214 2 68 36 320 94.30 -0.0861986 377 4 16 11 408 84.80 -0.1011987 190 0 24 0 214 113.20 0.3351988 160 2 0 162 324 125.90 0.1121989 100 0 20 0 120 138.90 0.1031990 79 0 0 0 79 151.30 0.0891991 91 0 0 0 91 150.70 -0.0041992 229 2 4 8 243 145.90 -0.0321993 263 4 16 0 283 153.20 0.0501994 353 0 4 12 369 146.10 -0.0461995 258 22 4 14 298 142.30 -0.0261996 302 2 68 292 664 147.00 0.0331997 254 6 17 198 475 144.20 -0.0191998 320 24 4 121 469 144.30 0.0011999 289 0 4 30 323 159.30 0.1042000 245 0 0 0 245 176.50 0.1082001 257 2 4 56 319 180.80 0.0242002 446 12 0 20 478 166.40 -0.0802003* 565 0 200 8 773 164.60 -0.0112004* 726 4 48 88 866 166.70 0.0132005* 674 0 44 132 850 175.10 0.0512006* 460 2 0 8 470 193.50 0.1052007* 321 0 0 0 321 179.60 -0.0722008* 203 0 44 6 253 135.2 -0.2472009* 229 2 0 216 447 173.1 0.2802010* 312 0 0 0 312 169.3 -0.0222011* 277 0 0 0 277 183.7 0.0852012* 350 0 0 132 482 N/A N/A
N/A - Data is not available* 2003 - 2012 are calculated by the Wyoming Center for Business & Economic Analysis. Estimates before that time were calculated by the Census BureauSource: Census Bureau Wyoming Center for Business & Economic Analysis

Page 62 Economic Indicators
FIGURE 14
New Residential Housing Units(By Type)
Laramie County1999 - 2012
99 00 01 02 03 04 05 06 07 08 09 10 11 12
050
100150200250300350400450500550600650700750800850900
Duplexes Tri & Four plexes Multi-Family Single Family
Figure 14

Page 63 Economic Indicators
Hou
sing
Pro
file
Che
yenn
e A
rea
2000
- 20
12
2000
2001
2002
2003
2004
2005
2006
2007
2008
2009
2010
2011
2012
Tota
l Hou
sing
Uni
ts24
,214
24,4
3424
,716
25,3
7025
,976
26,5
6326
,859
27,0
6327
,240
27,6
3127
,869
28,0
6628
,448
Sing
le F
amily
Uni
ts17
,582
17,7
4218
,004
18,4
5818
,967
19,4
1019
,704
19,9
0820
,035
20,2
0820
,446
20,6
4320
,893
% o
f Tot
al72
.6%
72.6
%72
.8%
72.8
%73
.0%
73.1
%73
.4%
73.6
%73
.5%
73.1
%73
.4%
73.6
%73
.4%
Mul
ti-Fa
mily
Uni
ts6,
632
6,69
26,
712
6,91
27,
009
7,15
37,
155
7,15
57,
205
7,42
37,
423
7,42
37,
555
% o
f Tot
al27
.4%
27.4
%27
.2%
27.2
%27
.0%
26.9
%26
.6%
26.4
%26
.5%
26.9
%26
.6%
26.4
%26
.6%
Not
es:
(a) E
nd o
f yea
r figu
res
-- D
o no
t acc
ount
for d
emol
ishe
d co
ndem
ned
or u
nocc
upie
d un
its.
Sour
ce: C
ity o
f Che
yenn
e Bu
ildin
g an
d En
gine
erin
g D
epar
tmen
t
Hou
seho
lds
by U
nit T
ype
Lara
mie
Cou
nty
Cen
sus
Bur
eau
Dat
a, 2
010
UN
IT T
YPE
TEN
UR
E
OW
NR
EN
TTO
TAL
% O
F TO
TAL
Sing
le-F
amily
Uni
t21
,514
4,35
225
,866
72.3
%D
uple
x21
793
814
2.3%
Tri-
or F
our-
Plex
582,
244
2,30
26.
4%Ap
artm
ent
196
2,67
02,
866
8.0%
Mob
ile H
ome
2,84
31,
042
3,88
510
.9%
Boat
, RV,
Van
, Etc
.57
057
0.2%
Tota
l24
,689
11,1
0135
,790
100.
0%So
urce
: Am
eric
an C
omm
unity
Sur
vey,
5 ye
ar e
stim
ates
Tabl
e 5.
4

Page 64 Economic Indicators
Table 5.5
Building PermitsCity of Cheyenne
1999 - 2012
1999 2000 2001 2002 2003 2004 2005 2006 2007 2008 2009 2010 2011 2012 TOTALTotal Single Family 179 144 160 262 454 509 443 294 204 127 173 238 197 250 3,634 Detached 159 129 152 222 329 498 443 287 204 127 173 238 197 250 3,408 Attached 20 15 8 40 125 11 0 7 0 0 0 0 0 0 226 Townhouses 20 15 8 40 124 7 0 6 0 0 0 0 0 0 220 Condos 0 0 0 0 1 4 0 1 0 0 0 0 0 0 6New Apartments/Duplex 33 18 11 1 50 24 16 1 0 12 2 0 0 132 300
Mobile Homes/Constr. Trailers 26 12 14 15 22 36 10 10 7 8 12 1 0 1 174
Demolish 25 18 30 26 24 24 33 28 13 32 17 0 0 2 272
Note: Attached Single Family Permits are Townhouses and CondosSource: City of Cheyenne Building and Engineering Department
Building PermitsLaramie County (not including City of Cheyenne)
1999 - 2012
1999 2000 2001 2002 2003 2004 2005 2006 2007 2008 2009 2010 2011 2012 TOTALTotal Rural Single Family Permits* 126 108 105 172 173 219 231 166 117 76 56 74 80 100 1,803
Total Multi-Family Permits N/A N/A N/A 12 80 58 24 8 0 0 0 0 0 0 182
* Does not include Mobile or Modular Home permits.N/A - Data is not availableSource: City of Cheyenne Building and Engineering DepartmentSource: Laramie County Planning and Development Office

Page 65 Economic Indicators
Table 5.6
Residential Construction ActivityCity of Cheyenne
1987 - 2012
YEAR HOUSING PERMITS
FIVE YEAR AVERAGE
NEW NET HOUSING UNITS (a)
NEW PERMIT VALUATION
1987 190 192 132 $8,879,1701988 160 143 115 $8,091,0881989 100 129 76 $4,674,8331990 79 112 49 $4,345,7071991 91 85 55 $4,861,9161992 229 86 141 $11,470,1361993 263 103 206 $16,648,5381994 353 132 234 $15,110,8831995 258 158 194 $12,686,7011996 237 268 551 $16,005,8521997 189 260 386 $13,349,6731998 218 206 346 $13,419,2341999 175 215 204 $14,639,3842000 143 192 143 $15,069,8622001 158 177 210 $17,125,0152002 262 191 279 $29,060,9162003 404 228 604 $36,668,4792004 509 295 606 $67,770,8782005 443 355 587 $65,952,7622006 295 383 296 $49,764,0212007 204 371 204 $32,930,5022008 139 318 177 $23,947,2982009 175 251 391 $46,116,0222010 238 210 238 $37,359,0222011 197 191 197 $33,107,1792012 253 200 383 $51,318,559
NA - Data is not available.Notes: (a): Housing units are defined as New Residences, Townhouses, Condominiums,
Multi-plexes and Apartment units. 1983 - 1988: Reported Apartment permits were not extended into units. 1989 - 1991: No new apartments or multi-plexed units were built.Source: City of Cheyenne Engineer’s Office

Page 66 Economic Indicators
Table 5.7
Historic Housing OccupancyLaramie County
1960 - 2010
1960 1970 1980 1990 2000 2010Owner Occupied Units 10,377 11,220 16,930 18,406 22,054 25,533% of Total 53.9% 57.7% 62.1% 60.3% 64.4% 68.0%
Renter Occupied Units 7,871 6,646 8,362 9,686 9,873 12,043% of Total 40.9% 34.2% 30.7% 31.8% 28.9% 32.0%
Vacant 988 1,571 1,983 2,415 2,286 2,886% of Total 5.1% 8.1% 7.3% 7.9% 6.7% 7.1%
Total Units 19,236 19,437 27,275 30,507 34,213 40,462
Source: US Census of Population and Housing

Page 67 Economic Indicators
Table 5.8
Vacancy RatesLaramie County
1988 - 2012
LARGE APARTMENT COMPLEXES ONLY(1)
VACANCY RATE(1)YEAR AVG # UNITS
SAMPLEDAVG # UNITS
VACANT%
VACANT1988 641 50 7.74% -
1989 605 38 6.28% -1990 668 52 7.84% -1991 670 21 3.13% -1992 665 1 0.10% -1993 665 0 0.06% -1994 665 3 0.40% -1995 665 6 0.96% -1996 665 42 6.32% -1997 617 41 6.59% -1998 790 86 10.87% -1999 1003 88 8.78% -2000 961 71 7.41% -2001a 862 27 3.17% 3.942001b 858 19 2.18% 1.962002a 847 21 2.52% 0.812002b 803 20 2.53% 2.352003a 808 18 2.27% 1.832003b 817 26 3.18% 3.352004a 814 27 3.36% 3.012004b 805 44 5.42% 5.302005a 852 45 5.28% 3.952005b 879 52 5.95% 4.752006a 920 44 4.75% 2.382006b 903 45 5.02% 3.972007a 893 52 5.86% 2.272007b 838 31 3.66% 1.992008a 822 30 3.61% 2.822008b 855 29 3.36% 4.162009a 864 30 3.51% 3.642009b 870 46 5.27% 4.202010a 873 35 4.01% 3.482010b 896 36 4.02% 4.442011a 789 24 3.00% 1.862011b 796 30 3.73% 3.472012a 791 21 2.65% 2.282012b 769 16 2.08% -
Notes a = 2nd quarter data b = 4th quarter data(1) Source: Wyoming Housing Database Partnership Source: Wyoming Center for Business and Economic Analysis Inc.

Development TrendsThe City of Cheyenne added 123 acres or 1.8 percent to its boundaries in 2012 as compared to 214 acres in 2011. Since 2000, the average rate of geographic expansion by the city was 1.7 percent per year. By comparison; the city’s population grew at a rate of 1.28 percent over the past ten years.
Table 6.1 presents detailed statistics on the level of commercial construction undertaken between 1987 and 2012 within city borders. New com-mercial construction soared in 2012 to its highest level since 2001. New construction reached 51.3 million dollars last year as compared to 3.9 million in 2011.About 35 percent of the total was attributed the construction of a new cancer center at the local hospital.
The dollar value of city commercial additions and remodels also posted a large increase from 2011, up approximately 180 percent to 42 million dollars. Again a large remodeling project at the local hospital accounted for a solid portion of 2012’s total remodeling construction of 42 million dollars.
Table 6.2presents combined dollar valuations for only new commercial and industrial construction for both the city and the county. As easily seen, 2012 was a banner year with 167 million dollars of new commercial construction undertaken. The expectation was that 2011 would have seen this type of growth, but apparently it was delayed one year. Still this almost staggering jump in commercial and industrial construction last year clearly demonstrated the overall strength in the greater Cheyenne economy and its resiliency to the Great Recession.
Table 6.3 provides summary vacancy statistics for commercial properties through 4th quarter 2012. While the number of vacant warehousing properties generally declined over the past 6 quarters, the volume of leasable/saleable square footage rose due to the addition of one very large property (135,000 sf.) to the list. However, this facility was leased late in the first quarter of 2013 and hopefully available warehousing space will show a substantial drop by the end of the 1st quarter 2013 when the figures are finalized.
Available commercial office space remained under 400,000 sf for the last 3 quarters of 2012, but there were no indications of a potential large increase in the demand for commercial office to absorb the current large over supply. The high double-digit vacancy rates found in Table 6.3 were a clear reflection of this over supply.
The number of available retail properties averaged 72 per quarter for the final three quarters of 2012 with the average square foot vacancy rate hovering at 8.0 percent as compared to the office vacancy rate of 17.8 percent. Lease rates for retail properties averaged $13.79/sf in fourth quarter 2012. Office properties leased, on average, at $13.04/sf by year-end 2012 by comparison.
After declining in 2010 for the first time in a decade, assessed property values in both the city and county rose in 2011 and 2012. City values increased 2.4 percent in 2011 and then increased another 2.0 percent in 2012. Total city valuation stood at 531.2 million dollars in 2012. Growth in county valuations did substantially better than city valuations over the past two years with 2011 values rising 4.7 percent followed by a 5.9 percent increase in 2012. For the first time, total county property valuation exceeded 1 billion dollars ($1.007 billion) in 2012. See Table 6.5 for further details. Increases in residential valuation drove city assessed values higher while higher industrial values drove the county’s side of the equation. Table 6.3 provides all of the details.
SECTION 6 DEVELOPMENT TRENDS
Table6.0 Annexation Trends (1984 - 2012)6.1 Commercial Construction Activity
(1987 - 2012)Figure 15 - Residential & Commercial Construction Valuation
6.2 New Commercial/Industrial Construction (2005 - 2012)
6.3 Commercial Property (2010 - 2012)6.4 Assessed Real Property Values
(2002 - 2012)Figure 16 - Assessed Real & Personal Property Values
6.5 Major Property Tax Districts (2002 - 2012)Figure 17 - Major Property Tax Districts - Revenues

ECONOMIC DEVELOPMENT Laramie County’s economic development organization, Cheyenne LEADS, worked with 40 distinct new prospects in 2012 which is the lowest number of new prospects in over a decade. However, the overall quality of the prospects was higher than has often been the case. The new prospects were in the following broad sectors: 27 Manufacturing (up from 16 in 2011), 1 Energy / Energy Production (down from 10 in 2011), 4 Datacenters, 2 Other Technology, 2 Transportation and, 4 miscellaneous. At the same time that the number of new prospects has been declining, LEADS has had the best three years ever in terms of number of committed prospects.
The big news for 2012 was the announcement in April that Microsoft would be building a datacenter complex in the North Range Business Park. This was the culmination of just under a year of work, a relatively short time to put this kind of deal together and get a commitment to locate here. Twenty jobs will be created initially by this project. During 2012, LEADS also had commitments from five other companies totaling 175 jobs. One of these companies is Searing, a California manufacturing company, which began construction in October and plans to begin hiring in early 2013 representing 45 good manufacturing jobs. One company in this list is a hotel chain that LEADS worked with closely but which LEADS does not count in primary job creation numbers. With the hotel jobs removed from the count, 135 new jobs were announced in 2012. In addition, the Searing and Microsoft construction activities will count for nearly 400 temporary construction jobs during 2013.

Page 70 Economic Indicators
Annexation TrendsCity of Cheyenne
1984 - 2012
YEAR ACRES ANNEXED
CITY SIZE SQ. MI.
ANNUAL GROWTH %
1984 562.09 17.05 5.44%1985 18.79 17.08 0.18%1986 6.14 17.09 0.06%1987 156.89 17.33 1.40%1988 19.65 17.36 0.17%1989 1,152.63(a) 19.16 10.37%1990 306.10 19.64 2.51%1991 114.21 19.82 0.92%1992 54.08 19.91 0.45%1993 22.01 19.94 0.15%1994 12.96 19.96 0.10%1995 307.82 20.44 2.40%1996 18.11 20.47 0.15%1997 66.66 20.57 0.49%1998 0.99 20.57 0.00%1999 640.00 21.20 3.06%2000 6.25 21.30 0.47%2001 48.73 21.38 0.38%2002 942.53 21.70 1.50%2003 93.67 22.10 1.84%2004 74.00 22.22 0.54%2005 332.82 22.74 2.34%2006 945.53(b) 24.22 6.51%2007 39.33 24.31 0.37%2008 185.26 24.60 1.19%2009 205.45 24.92 1.30%2010 177.87 25.15 0.92%2011 214.11 25.48 1.31%2012 123.2 25.52 0.16%Total 6,847.88
Note: (a) Includes the Cheyenne Business Parkway: 1069.2 Acres (b) Does not include the North Range Business Park.Source: City of Cheyenne Engineer’s Office
1982 - 2007 Data: City of Cheyenne Building and Engineering Department Annual Report.
Table 6.0

Page 71 Economic Indicators
Com
mer
cial
Con
stru
ctio
n A
ctiv
ity
Cit
y of
Che
yenn
e 19
87-2
012
YE
AR
NE
W
CO
NST
RU
C-
TIO
N
PE
RM
ITS
VALU
ATIO
NA
DD
ITIO
NS
&
RE
MO
DE
LS
PE
RM
ITS
VALU
ATIO
NA
NN
UA
L
TOTA
L P
ER
MIT
SVA
LUAT
ION
PE
RC
EN
T C
HA
NG
E
PE
RM
ITS
(%)
VALU
ATIO
N
1987
14$3
,806
,496
102
$1,6
62,0
0111
6$5
,468
,497
-4.1
%-2
.1%
1988
3$6
29,4
1997
$2,7
12,4
5310
0$3
,341
,871
-13.
8%-3
8.9%
1989
7$3
,375
,503
106
$3,2
61,8
3011
3$6
,637
,333
13.0
%98
.6%
1990
12$4
,572
,715
106
$3,5
59,2
1111
8$8
,131
,926
4.4%
22.5
%19
9111
$7,2
75,5
9012
4$6
,484
,012
135
$13,
759,
602
14.4
%69
.2%
1992
15$9
,750
,000
92$5
,891
,709
107
$15,
641,
709
-20.
7%13
.7%
1993
11$2
,700
,325
113
$3,2
05,4
1612
4$5
,905
,741
15.9
%-6
2.2%
1994
29$1
0,87
1,04
311
8$1
0,35
9,67
714
7$2
1,23
0,72
018
.5%
259.
5%19
9520
$16,
434,
056
133
$7,2
95,6
6315
3$2
3,72
9,87
24.
1%11
.8%
1996
19$1
2,92
5,96
912
1$6
,029
,289
140
$18,
955,
258
-8.5
%-2
0.1%
1997
19$2
0,83
9,10
216
8$1
2,31
7,51
118
7$3
3,15
6,61
333
.6%
74.9
%19
9832
$12,
161,
139
134
$14,
437,
090
166
$26,
598,
229
-11.
2%-1
9.8%
1999
20$7
,846
,454
142
$11,
044,
908
162
$18,
891,
362
-2.4
%-2
9.0%
2000
31$2
4,32
0,75
519
1$1
5,83
1,82
522
2$4
0,15
2,58
037
.0%
112.
5%20
0150
$51,
451,
096
166
$19,
480,
513
216
$70,
931,
609
-2.7
%76
.7%
2002
51$3
0,84
4,54
719
0$2
6,12
5,66
524
1$5
6,97
0,21
211
.6%
-19.
7%20
0330
$7,4
62,6
2012
4$1
5,90
1,57
615
4$2
3,36
4,19
6-3
6.1%
-59.
0%20
0420
$18,
912,
595
142
$16,
961,
616
162
$35,
874,
211
5.2%
53.5
%20
0567
$35,
703,
309
116
$12,
515,
338
183
$48,
218,
647
13.0
%34
.4%
2006
62$3
0,68
0,57
187
$10,
286,
203
149
$40,
966,
774
-18.
6%-1
5.0%
2007
51$4
0,11
3,16
410
3$3
3,57
0,62
115
4$7
3,68
3,78
53.
4%79
.9%
2008
33$2
8,16
3,23
510
9$2
2,08
2,44
314
2$5
0,24
5,67
8-7
.8%
-31.
8%20
0920
$3,8
57,6
9861
$20,
823,
825
81$2
4,68
1,52
3-4
3.0%
-50.
9%20
1014
$27,
254,
322
84$1
2,75
4,13
398
$40,
008,
455
21.0
%62
.1%
2011
10$3
,909
,712
105
$14,
937,
762
115
$18,
847,
474
17.3
%-5
2.9%
2012
18$5
1,34
6,61
511
0$4
1,89
3,96
612
8$9
3,24
0,58
111
.3%
394.
7%N
A - D
ata
is n
ot a
vaila
ble.
Sour
ce: C
ity o
f Che
yenn
e Bu
ildin
g an
d En
gine
erin
g D
epar
tmen
t
Tabl
e 6.
1

Page 72 Economic Indicators
FIGURE 15
Residential and CommercialConstruction Valuation
1987 - 2012
87 88 89 90 91 92 93 94 95 96 97 98 99 00 01 02 03 04 05 06 07 08 09 10 11 120
20
40
60
80
100
120
Millions
Commercial Residential
Figure 15

Page 73 Economic Indicators
Table 6.2
New Commercial/Industrial Construction2005 - 2012
YEAR CITY COUNTY TOTAL % CHANGE
2005 $35,703,309 $103,964,335 $139,667,6442006 $30,680,571 $2,599,690 $33,280,261 -76.2%2007 $40,113,164 $26,894,834 $67,007,998 101.3%2008 $28,163,235 $9,150,632 $37,313,867 -44.3%2009 $3,857,698 $37,167,252 $41,024,950 9.9%2010 $27,254,322 $54,285,457 $81,539,779 98.8%2011 $3,909,712 $22,999,557 $26,909,269 -67.0%2012 $51,346,615 $115,559,215 $166,905,830 520.3%
Source: City of Cheyenne Building and Engineering Department Laramie County Planning & Development

Page 74 Economic Indicators
Table 6.3
Commercial PropertyFor Sale & Lease (1,500 Sq. Ft. and Above)
2010 - 2012
PROPERTY TYPE # PROPERTIES
SQUARE FOOTAGE
AVG. LEASE RATE
MIN./MAX. RATE VACANCY RATE
Second Quarter 2010Warehouse 54 755,892 $5.57 3.34-13.06 15.1%FR
Retail 66 376,641 $11.25 4.61 - 17.00 9.9%FR
Office Space 88 520,529 $12.18 4.80 - 18.00 26.5%FR
Third Quarter 2010Warehouse 51 605,041 $5.99 3.34-13.06 10.3%FR
Retail 74 321,469 $10.84 4.61 - 17.00 7.1%FR
Office Space 77 473,770 $11.53 4.00-17.64 20.5%FR
Fourth Quarter 2010Warehouse 36 476,507 $5.89 3.34-13.06 8.9%FR
Retail 68 358,737 $11.66 7.00-16.00 8.0%FR
Office Space 72 413,248 $11.99 5.14-17.00 18.7%FR
First Quarter 2011Warehouse 40 500,960 $5.43 3.34-15.60 9.2%FR
Retail 71 438,941 $14.91 7.00-27.00 7.9%FR
Office Space 78 453,668 $12.39 5.14-19.00 17.7%FR
Second Quarter 2011Warehouse 39 485,557 $7.33 3.34-19.00 10.3%FR
Retail 69 471,264 $14.83 6.00-27.00 7.9%FR
Office Space 78 444,962 $12.34 5.14-17.00 19.1%FR
Third Quarter 2011Warehouse 40 395,449 $7.51 3.95-19.00 6.4%FR
Retail 65 556,105 $14.38 7.00-23.50 6.7%FR
Office Space 73 454,493 $13.02 5.14-22.00 21.3%FR
Fourth Quarter 2011Warehouse 41 331,361 $7.51 4.50-19.00 5.7%FR
Retail 72 598,138 $13.88 7.00-23.50 7.5%FR
Office Space 66 391,942 $12.38 5.14-22.00 18.3%FR
First Quarter 2012Warehouse 44 378,210 $7.76 4.29-19.00 7.1%Retail 80 670,323 $14.25 6.00-23.50 9.4%Office Space 68 428,336 $13.31 5.14-22.00 20.5%Second Quarter 2012Warehouse 46 444,917 $7.27 4.25-19.00 8.4%Retail 72 641,817 $13.35 5.00 - 20.00 8.0%Office Space 63 384,705 $13.48 5.14-22.00 18.5%Third Quarter 2012Warehouse 35 468,066 $7.01 3.20-19.00 9.3%Retail 73 634,151 $13.80 5.00 - 23.50 8.4%Office Space 62 386,327 $13.26 5.00-22.00 17.6%Fourth Quarter 2012Warehouse 31 455,612 $6.61 3.20-19.00 9.3%Retail 72 637,585 $13.79 5.00 - 23.50 8.0%Office Space 70 375,463 $13.04 5.00-22.00 17.4%FR = Final Revision

Page 75 Economic Indicators
Ass
esse
d R
eal a
nd P
erso
nal P
rope
rty
Valu
eLa
ram
ie C
ount
y 20
02 -
2012
2002
2003
2004
2005
2006
2007
2008
2009
2010
2011
2012
TOTA
LCi
ty ($
)30
1,61
5,10
333
3,02
8,98
136
0,98
6,24
440
2,26
4,90
244
3,23
4,61
046
8,74
2,96
349
1,13
6,89
851
2,01
1,81
551
0,33
5,67
452
2,50
6,42
553
3,19
1,52
7Co
unty
($)
190,
599,
915
205,
659,
198
229,
652,
549
244,
439,
397
280,
900,
035
305,
750,
575
360,
546,
473
403,
268,
293
398,
392,
120
429,
369,
837
474,
450,
028
RE
SID
EN
TIA
LCi
ty ($
)19
8,71
6,88
421
6,45
8,09
624
0,89
8,69
927
3,11
6,51
929
9,46
4,95
330
1,26
7,63
531
1,44
0,64
531
5,91
9,04
232
5,78
3,65
833
6,01
2,45
934
0,92
8,90
7Co
unty
($)
86,7
20,8
2398
,458
,096
111,
253,
557
127,
393,
533
144,
933,
887
165,
856,
111
177,
212,
824
180,
771,
757
181,
815,
093
189,
475,
613
193,
035,
691
Asse
ssed
% of
Ac
tual
Val
ue9.
509.
509.
509.
509.
509.
509.
509.
509.
509.
509.
50
CO
MM
ER
CIA
LCi
ty ($
)73
,319
,387
87,4
03,9
3590
,420
,290
95,5
54,1
9410
8,95
1,15
813
0,95
2,22
213
4,38
4,56
813
9,30
7,75
413
7,90
5,10
113
8,51
3,67
514
4,76
3,75
8Co
unty
($)
13,0
51,2
5413
,615
,738
14,5
34,4
7715
,947
,858
17,6
70,7
5917
,911
,527
29,6
72,1
3730
,955
,419
30,1
96,6
6930
,822
,423
32,0
07,7
24As
sess
ed %
of
Actu
al V
alue
9.50
9.50
9.50
9.50
9.50
9.50
9.50
9.50
9.50
9.50
9.50
IND
UST
RIA
L *
City
($)
25,0
06,0
6824
,996
,324
24,0
52,7
8927
,057
,707
27,2
14,0
4827
,508
,729
35,0
91,0
2147
,042
,892
37,3
12,7
0239
,078
,802
38,9
57,2
72Co
unty
($)
67,5
40,6
2869
,123
,194
76,3
46,2
4270
,763
,291
81,8
85,0
5893
,770
,212
123,
697,
989
161,
134,
802
155,
640,
370
178,
172,
414
217,
416,
235
Asse
ssed
% of
Ac
tual
Val
ue11
.50
11.5
011
.50
11.5
011
.50
11.5
011
.50
11.5
011
.50
11.5
011
.50
AG
RIC
ULT
UR
AL
City
($)
00
00
1,09
65,
633
4,20
34,
213
5,62
24,
841
5,25
6Co
unty
($)
17,4
46,0
8118
,038
,932
20,5
35,7
3722
,337
,600
25,3
97,0
7112
,994
,233
13,3
69,2
7814
,719
,375
16,6
98,4
3117
,678
,952
18,8
33,6
94As
sess
ed %
of
Actu
al V
alue
9.50
9.50
9.50
9.50
9.50
9.50
9.50
9.50
9.50
9.50
9.50
VAC
AN
TCi
ty ($
)4,
572,
764
4,60
3,42
95,
574,
466
6,53
6,48
27,
603,
355
9,00
8,74
410
,216
,461
9,73
7,91
49,
328,
333
8,89
6,64
88,
536,
334
Coun
ty ($
)5,
841,
129
6,42
3,23
86,
982,
536
7,99
7,11
511
,013
,260
15,2
18,4
9216
,594
,245
15,6
86,9
4014
,041
,815
13,2
20,4
3513
,156
,684
Asse
ssed
% of
Ac
tual
Val
ue9.
509.
509.
509.
509.
509.
509.
509.
509.
509.
509.
50
N/A
- D
ata
is n
ot a
vaila
ble.
(a) 2
007
Agri
cultu
ral d
ata
now
refe
rs to
land
onl
y. Al
l oth
er d
ata
such
as
impr
ovem
ents
and
per
sona
l pro
pert
y ar
e no
w in
clud
ed in
resi
dent
ial o
r com
mer
cial
dat
a.*
Fluc
tuat
ions
in v
alua
tions
are
due
pri
mar
ily to
chan
ges
in m
iner
al v
alua
tions
.So
urce
: Lar
amie
Cou
nty
Asse
ssor
’s O
ffice
Tabl
e 6.
4
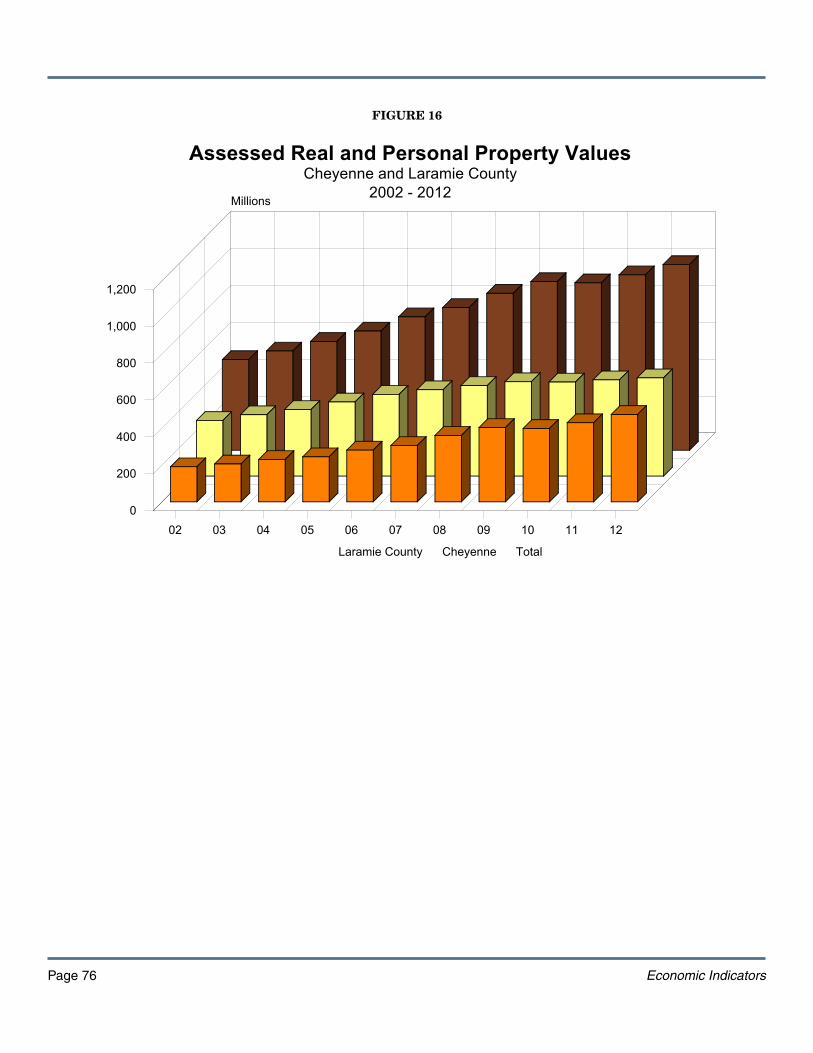
Page 76 Economic Indicators
FIGURE 16
Assessed Real and Personal Property ValuesCheyenne and Laramie County
2002 - 2012
02 03 04 05 06 07 08 09 10 11 120
200
400
600
800
1,000
1,200
Millions
Laramie County Cheyenne Total
Figure 16

Page 77 Economic Indicators
Maj
or P
rope
rty
Tax
Dis
tric
tsR
even
ues
2002
- 20
12
2002
2003
2004
2005
2006
2007
2008
2009
2010
2011
2012
CITY
OF
CHE
YEN
NE
Valu
e ($)
301,
615,
103
333,
028,
981
360,
986,
244
402,
264,
902
443,
234,
610
468,
742,
963
491,
167,
735
512,
011,
815
510,
335,
674
522,
506,
425
533,
191,
527
Mill
Lev
y8.
008.
008.
008.
008.
008.
008.
008.
008.
008.
008.
00Re
venu
e ($)
2,41
2,92
12,
664,
232
2,88
7,89
03,
218,
119
3,54
5,87
73,
749,
944
3,92
9,34
24,
096,
095
4,08
2,68
54,
180,
051
4,26
5,53
2LA
RAM
IE C
OU
NTY
Valu
e ($)
492,
215,
018
538,
688,
179
590,
638,
793
646,
704,
299
724,
134,
645
774,
493,
538
851,
683,
371
915,
280,
108
908,
727,
794
951,
876,
262
1,00
7,64
1,55
5M
ill L
evy
22.0
017
.00
17.0
017
.00
17.0
021
.66
20.9
117
.00
17.0
017
.00
17.0
0Re
venu
e ($)
10,8
28,7
309,
157,
699
10,0
40,8
5910
,993
,973
12,3
10,2
8916
,775
,530
17,8
08,6
9915
,559
,762
15,4
48,3
7216
,181
,896
17,1
29,9
06LC
SC
HO
OL
DIS
TRIC
T #1
Valu
e ($)
456,
486,
561
499,
696,
020
547,
178,
850
599,
968,
474
669,
240,
204
717,
792,
802
778,
434,
192
826,
511,
245
835,
786,
729
855,
006,
652
901,
103,
052
Mill
Lev
y44
.00
44.0
044
.00
44.0
044
.00
44.0
044
.00
44.0
044
.00
44.0
044
.00
Reve
nue (
$)20
,085
,409
21,9
86,6
2524
,075
,869
26,3
98,6
1329
,446
,569
31,5
82,8
8334
,251
,104
36,3
66,4
9536
,774
,616
37,6
20,2
9339
,648
,534
LC S
CH
OO
L D
ISTR
ICT
#2Va
lue (
$)35
,728
,457
36,9
92,1
5943
,459
,943
46,7
35,8
2554
,894
,441
56,7
00,7
3673
,249
,179
88,7
68,8
6372
,941
,065
96,8
69,6
1010
6,53
8,50
3M
ill L
evy
46.4
246
.18
46.1
946
.20
45.8
945
.91
45.9
145
.91
44.9
044
.00
44.0
0Re
venu
e ($)
1,65
8,51
51,
708,
298
2,00
7,41
52,
159,
195
2,51
9,10
62,
603,
131
3,36
2,87
04,
075,
379
3,27
5,05
44,
262,
263
4,68
7,69
4LC
CO
NSE
RVAT
ION
DIS
TRIC
T Va
lue (
$)49
2,21
5,01
853
8,68
8,17
959
0,63
8,79
364
6,70
4,29
972
4,13
4,64
577
4,49
3,53
885
1,68
3,37
191
5,28
0,10
890
8,72
7,79
495
1,87
6,26
21,
007,
641,
555
Mill
Lev
y0.
500.
500.
500.
500.
500.
500.
500.
500.
500.
500.
50Re
venu
e ($)
246,
108
269,
344
295,
319
323,
352
362,
067
387,
247
425,
842
457,
640
454,
364
475,
938
503,
821
SOU
TH C
HE
YEN
NE
WAT
ER &
SE
WER
Valu
e ($)
17,3
61,2
5818
,971
,122
21,2
69,4
3722
,416
,670
27,2
64,7
7627
,498
,980
29,0
21,2
8530
,630
,610
31,5
78,2
2634
,558
,849
35,4
51,5
92M
ill L
evy
4.02
3.69
3.57
2.52
2.49
3.54
3.60
5.16
5.28
5.13
5.76
Reve
nue (
$)69
,792
70,0
0375
,932
56,4
9067
,889
97,3
4610
4,47
715
8,05
416
6,73
317
7,28
720
4,20
1W
EED
AN
D P
EST
DIS
TRIC
TVa
lue (
$)49
2,21
5,01
853
8,68
8,17
959
0,63
8,79
364
6,70
4,29
972
4,13
4,64
577
4,49
3,53
885
1,68
3,37
191
5,28
0,10
890
8,72
7,79
495
1,87
6,26
21,
007,
641,
555
Mill
Lev
y1.
501.
501.
501.
501.
501.
501.
501.
501.
501.
501.
50Re
venu
e ($)
738,
323
808,
032
885,
958
970,
056
1,08
6,20
21,
161,
740
1,27
7,52
51,
372,
920
1,36
3,09
21,
427,
814
1,51
1,46
2N
A - D
ata
is n
ot a
vaila
ble.
Sour
ce: L
aram
ie C
ount
y As
sess
or’s
Offi
ce
Tabl
e 6.
5

Page 78 Economic Indicators
FIGURE 17
Major Property Tax DistrictsRevenues2002 - 2012
02 03 04 05 06 07 08 09 10 11 12
0
10
20
30
40
50
Millions
Figure 17
LC School Dist #2 Cheyenne Laramie County LC School Dist #1