economic indicators: august 1989 - fraser congress, 1st session economic indicators august 1989...
TRANSCRIPT

101st Congress, 1st Session
Economic Indicators
AUGUST 1989(Includes data available as of August 30, 1989)
Prepared for the Joint Economic Committee by the
Council of Economic Advisers
UNITED STATES
GOVERNMENT PRINTING OFFICE
WASHINGTON : 1989
Digitized for FRASER http://fraser.stlouisfed.org/ Federal Reserve Bank of St. Louis

JOINT ECONOMIC COMMITTEE(Created pursuant to Sec. 5(a) of Public Law 304, 79th Cong.)
LEE H. HAMILTON, Indiana, ChairmanPAUL S. SARBANES, Maryland, Vice Chairman
HOUSE OF REPRESENTATIVESAUGUSTUS F. HAWKINS (California)DAVID R. OBEY (Wisconsin)JAMES H. SCHEUER (New York)FORTNEY H. (PETE) STARK (California)STEPHEN J. SOLARZ (New York)CHALMERS P. WYLIE (Ohio)OLYMPIA J. SNOWE (Maine)HAMILTON FISH, JR. (New York)FREDERICK S. UPTON (Michigan)
SENATELLOYD BENTSEN (Texas)EDWARD M. KENNEDY (Massachusetts)JEFF BINGAMAN (New Mexico)ALBERT GORE, JR. (Tennessee)RICHARD H. BRYAN (Nevada)WILLIAM V. ROTH, JR. (Delaware)STEVE SYMMS (Idaho)PETE WILSON (California)CONNIE MACK (Florida)
JOSEPH J. MINARIK, Executive Director
COUNCIL OF ECONOMIC ADVISERS
MICHAEL J. BOSKIN, ChairmanJOHN B. TAYLOR, Member
RICHARD L. SCHMALENSEE, Member-Designate
[PUBLIC LAW 120—81sT CONGRESS; CHAPTER 237—IST SESSION]
JOINT RESOLUTION [S.J. Res. 55]
To print the monthly publication entitled "Economic Indicators"
Resolved by the Senate and House of Representatives of the United States of America in Congress assembled, That theJoint Economic Committee be authorized to issue a monthly publication entitled "Economic Indicators," and thata sufficient quantity be printed to furnish one copy to each Member of Congress; the Secretary and the Sergeantat Arms of the Senate; the Clerk, Sergeant at Arms, and Doorkeeper of the House of Representatives; twocopies to the libraries of the Senate and House, and the Congressional Library; seven hundred copies to theJoint Economic Committee; and the required numbers of copies to the Superintendent of Documents fordistribution to depository libraries; and that the Superintendent of Documents be authorized to have copiesprinted for sale to the public.
Approved June 23, 1949.
Charts drawn by Art Production Branch, Office of the Secretary, Department of Commerce.
Economic Indicators, published monthly, is available at $2.25 a single copy($2.81 foreign), or by subscription at $24.00 per year ($30.00 for foreignmailing) from:
SUPERINTENDENT OF DOCUMENTSGOVERNMENT PRINTING OFFICE
WASHINGTON, D.C. 20402
Digitized for FRASER http://fraser.stlouisfed.org/ Federal Reserve Bank of St. Louis

TOTAL OUTPUT, INCOME, AND SPENDINGGROSS NATIONAL PRODUCTIn the second quarter of 1989, according to revised estimates, current-dollar gross national product (GNP) rose 7.3percent (annual rate) or $90.7 billion. Real GNP (GNP adjusted for price changes) rose 2.7 percent and theimplicit price deflator rose 4.6 percent.
BILLIONS OF DOLLARS (RATIO SCALE) BILLIONS OF DOLLARS (RATIO SCALE)
5,600
5,200
4,800
4,400
4,000
3,600
3,200
2,800
2,400
SEASONALLY ADJUSTED ANNUAL RATES
^\
—
GNPIN CURRENT DC
"" "~~ **«. *i
-^~~
1 1 1
1981
*-— ̂ — tf^
1 1 1
1982
X>
! ! 11983
S^-
1 1 1
1984
^
1 I 1
1985
^LLARS ^__^
\\GNP
IN 1982 DO
1 1 1
1986
,_-'"'
LARS
1 1 !1987
1 I 1
1988
^ _
—
—
—
—
—
! ! 11989
5,600
5,200
4,800
4,400
4,000
3,600
3,200
2,800
2,400
SOURCE- DEPARTMENT OF COMMERCE COUNCIL OF ECONOMIC ADVISERS
[Billions of current dollars; quarterly data at seasonally adjusted annual rates]
Period
1980..19811982....198319841985198619871988
1982: IV1983: IV1984: IV1985: IV1986: IV
1987: IIIIV
1988: IIIUIIV
1989: III r
Grossnationalproduct
2,732.03,052.63,166.03,405.73,772.24,014.94,231.64,524.34,880.6
3,212.53,545.83,851.84,107.94,297.3
4,566.64,665.8
4,739.84,838.54,926.95,017.3
5,113.15,203.8
Personalcon-
sumptionexpendi-
tures
1,732.61,915.12,050.72,234.52,430.52,629.02,797.43,010.83,235.1
2,117.02,315.82,493.42,700.42,868.5
3,055.93,083.3
3,148.13,204.93,263.43,324.0
3,381.43,446.8
Grossprivate
domestic
ment
437.0515.5447.3502.3664.8643.1659.4699.9750.3
409.6579.8661.8654.1648.8
692.8749.7
728.8748.4771.1752.8
769.6774.7
Exports and imports of goodsand services
Netexports
32.133.926.3
-6.1-58.9-78.0-97.4
-112.6-73.7
14.1-25.8-67.9
-103.2-108.9
-115.3-114.6
-82.8-74.9-66.2-70.8
— 54.0-52.7
Exports
351.0382.8361.9352.5383.5370.9396.5448.6547.7
335.9364.7385.7369.2402.4
458.0482.6
521.6532.5556.8579.7
605.6623.2
Imports
318.9348.9335.6358.7442.4448.9493.8561.2621.3
321.9390.5453.6472.4511.3
573.4597.2
604.3607.5623.0650.5
659.6675.9
Government purchases ofgoods and services
Total
530.3588.1641.7675.0735.9820.8872.2926.1968.9
671.8676.1764.5856.7888.9
933.2947.5
945.7960.1958.6
1,011.4
1,016.01,034.9
Federal
Total
208.1242.2272.7283.5310.5355.2366.5381.6381.3
293.2276.1326.0376.6368.8
384.5388.1
374.1377.1367.5406.4
399.0407.8
Nationaldefense
142.7167.5193.8214.4234.3259.1277.8294.8298.0
205.4221.5244.1268.6280.7
300.2296.8
297.4298.0296.1300.5
298.7302.0
Non-defense
65.474.878.969.176.296.088.786.883.3
87.754.681.9
108.088.1
84.391.3
76.779.171.4
105.9
100.4105.8
Stateand
local
322.2345.9369.0391.5425.3465.6505.7544.5587.6
378.7400.0438.5480.1520.1
548.7559.4
571.6583.0591.0604.9
617.0627.1
Finalsales
2,740.33,028.63,190.53,412.83,704.54,003.64,224.84,495.04,850.0
3,272.43,514.83,806.84,100.74,309.4
4,557.14,602.5
4,709.84,809.24,882.34,998.7
5,085.45,176.5
Grossdomestic
pur-chases 1
2,699.83,018.73,139.73,411.83,831.14,092.84,829.04,636.84,954.3
3,198.53,571.63,919.74,211.24,406.2
4,681.94,780.4
4,822.54,913.44,993.15,088.1
5,167.15,256.5
1 GNP less exports of goods and services plus imports of goods and s Source: Department of Commerce, Bureau of Economic Analysis
Digitized for FRASER http://fraser.stlouisfed.org/ Federal Reserve Bank of St. Louis

GROSS NATIONAL PRODUCT IN 1982 DOLLARS[Billions of 1982 dollars; quarterly data at seasonally adjusted annual rates]
Period
198019811982198319841985198619871988
1982- IV ..1983: IV1984: IV ..1985- IV1986: IV ....
1987: mIV
1988: Inmrv
1989- ITLr
Grossnationalproduct
3,187.13,248.83,166.03,279.13,501.43,618.73,717.93,853.74,024.4
3,159.33,365.13,535.23,662.43,733.6
3,872.83,935.6
3,974.84,010.74,042.74,069.4
4,106.84,134.0
Personalcon-
sumptionexpendi-
tures
2,000.42,024.22,050,72,146.02,249.32,354.82,446.42,513.72,598.4
2,078.72,191.92,281.12,386.92,477.8
2,536.52,532.3
2,570.82,586.82,608.12,627.7
2,641.02,655.3
Gross privatedomestic investment
Nonre-sidential
fixed
379.2395.2366.7361.2425.2453.5438.4455.5493.8
352.3390.4444.4460.9435.7
472.8472.7
483.6497.8501.0492.7
501.0511.0
Resi-dentialfixed
137.0126.5105.1149.3170.9174.4195.7194.8194.1
115.8159.9169.6179.4200.3
192.1191.9
189.1194.2195.1198.1
195.6189.1
Changein
busi-ness
inven-tories
-6.923.9
-24.5-6.462.39.15.6
23.727.9
-59.327.041.7
7.7-20.8
6.856.6
34.321.537.518.3
24.519.0
Exports and imports ofgoods and services
Netexports
57.049.426.3
-19.9-84.0- 104.3-129.7-115.7-74.9
11.7-46.2-94.8
-135.4
-118.9-109.8
-78.2-72.6-74.9-73.8
-55.0-52.5
Ex-ports
388.9392.7361.9348.1371.8367.2397.1450.9530.1
336.0355.5376.6367.4406.5
461.3484.1
517.4519.7531.9551.4
569.7585.2
Imports
332.0343.4335.6368.1455.8471.4526.9566.6605.0
324.3401.6471.4492.6541.9
580.2593.9
595.6592.3606.9625.2
624.6637.7
Government purchases ofgoods and services
Total
620.5629.7641.7649.0677.7731.2761.6781.8785.1
660.1642.2693.2752.7776.0
783.5792.1
775.1783.0775.9806.4
799.7812.0
Federal
Total
246.9259.6272.7275.1290.8326.0334.1339.6328.9
289.5266.0300.5340.6342.4
340.7344.9
323.8327.9319.8343.9
335.5345.4
Nation-al
defense
171.2180.3193.8206.9218.5237.2252.1265.2261.5
201.4211.6225.3241.4255.8
270.6266.7
263.0262.5258.8261.6
254.4256.6
Non-defense
75.779.378.968.272.388.882.074.467 .4
88.254.475.299.286.6
70.178.2
60.865.461.082.3
81.188.9
Stateandlocal
373.6370.1369.0373.9387.0405.2427.5442.1456.2
370.6376.2392.7412.1433.6
442.8447.2
451.3455.1456.1462.5
464.2466.5
Finalsales
3,194.03,225.03,190.53,285.53,439.13,609.63,712.43,830.03,996.5
3,218.63,338.13,493.53,654.73,754.4
3,866.03,879.0
3,940.53,989.24,005.24,051.0
4,082.34,115.0
Grossdomes-
ticpur-
chases l
3,130.13,199.43,139.73,299.13,585.43,723.03,847.63,969.44,099.3
3,147.63,411.33,630.03,787.63,869.0
3,991.74,045.5
4,052.94,083.34,117.64,143.2
4,161.84,186.5
1 GNP less exports of goods and services plus imports of goods and services. Source: Department of Commerce, Bureau of Economic Analysis.
IMPLICIT PRICE DEFLATORS FOR GROSS NATIONAL PRODUCT[1982 = 100; quarterly data are seasonally adjusted]
Period
1980198119821983 ..19841985198619871988
1982: IV1983- IT1984: IV1985: IV .1986: IV
1987- IIIrv
1988- InIllrv
1989: III '
Grossnationalproduct
85.794.0
100.0103.9107.7110.9113.8117.4121.3
101.7105.4109.0112.2115.1
117.9118.6
119.2120.6121.9123.3
124.5125.9
Personal consumptionexpenditures
Total
86.694.6
100.0104.1108.1111.6114.3119.8124.5
101.8105.7109.3113.1115.8
120.5121.8
122.5123.9125.1126.5
128.0129.8
Durablegoods
89.295.7
100.0102.1103.8104.8105.6108.1110.1
100.7103.1104.1104.7106.2
108.8109.0
109.3109.6110.2111.2
111.2110.8
Nondura-ble goods
89.496.9
100.0102.1105.0107.5107.3112.1116.3
101.0103.1105.8108.7107.8
112.8113.7
114.0115.9117.1118.2
120.0123.3
Services
83.992.6
100.0106.2111.6116.8122.4129.0134.9
102.7108.3113.5119.0124.9
129.8131.5
132.7134.2135.6137.3
139.0140.4
Gross privatedomestic investment
Nonresi-dentialfixed
85.193.4
100.098.897.997.799.397.598.7
100.798.397.997.9
100.0
96.797.0
97.797.898.4
100.6
100.4100.3
Residen-tial fixed
89.496.6
100.0102.2106.0108.3111.1116.2119.7
99.1103.1107.2109.0112.4
117.8118.7
119.5119.5119.6120.4
122.1124.2
Exports and imports ofgoods and services
Exports
90.297.5
100.0101.3103.2101.099.899.5
103.3
100.0102.6102.4100.599.0
99.399.7
100.8102.5104.7105.1
106.3106.5
Imports
96.0101.6100.097.497.195.293.799.0
102.7
99.397.296.295.994.4
98.8100.6
101.5102.6102.7104.0
105.6106.0
Government purchases of goods andservices
Federal
Total
84.393.3
100.0103.1106.8109.0109.7112.4115.9
101.3103.8108.5110.6107.7
112.8112.5
115.5115.0114.9118.2
118.9118.1
Nationaldefense
83.492.9
100.0103.6107.2109.2110.2111.1114.0
102.0104.7108.3111.3109.7
110.9111.3
113.1113.5114.4114.9
117.4117.7
Non-defense
86.494.3
100.0101.4105.5108.2108.1116.7123.6
99.5100.3108.9108.8101.7
120.3116.8
126.2121.0117.1128.7
123.8119.1
Stateand local
86.293.4
100.0104.7109.9114.9118.3123.2328.8
102.2106.3111.7116.5120.0
123.9125.1
126.7128.1129.6130.8
132.9134.4
Source: Department of Commerce, Bureau of Economic Analysi
Digitized for FRASER http://fraser.stlouisfed.org/ Federal Reserve Bank of St. Louis

CHANGES IN GNP, PERSONAL CONSUMPTION EXPENDITURES, ANDRELATED PRICE MEASURES
[Percent change from previous period; quarterly data at seasonally adjusted annual rates]
Period
198019811982198319841985198619871988
1982- IV1983: IV1984- IV1985: IV1986- IV
1987: inIV
1988: I .nmrv
1989- In'.
Gross national product
Currentdollars
8.911.73.77.6
10.86.45.46.97.9
4.212.44.76.24.2
8.49.0
6.58.67.57.5
7.97.3
Constant(1982)dollars
-0.21.9
-2.53.66.83.42.73.74.4
.67.31.73.02.3
5.36.6
4.03.73.22.7
3.72.7
Implicitprice
deflator
9.09.76.43.93.73.02.63.23.3
3.64.73.03.31.8
2.82.4
2.04.84.44.7
4.04.6
Chain priceindex
9.09.46.34.13.93.32.53.43.7
4.13.93.13.22.7
3.73.3
3.34.34.44.1
4.64.9
Fixed-weighted
price index(1982
weights)
9.39.36.24.14.03.42.73.64.2
4.04.03.23.33.1
3.83.8
3.84.85.24.3
4.85.1
Personal consumption expenditures
Currentdollars
10.610.57.19.08.88.26.47.67.4
10.39.77.26.06.2
9.23.6
8.77.47.57.6
7.18.0
Constant(1982)dollars
0 21.21.34.64.84.73.92.83.4
5.35.54.31.92.2
4.7-.7
6.22.53.33.0
2.02.2
Implicitprice
deflator
10.79.25.74.13.83.22.44.83.9
4.44.33.04.03.94.44.4
2.34.73.94.6
4.85.7
Chain priceindex
10.99.25.74.23.93.52.74.74.1
4.84.13.14.23.9
4.44.3
2.65.04.34.8
4.75.9
Fixed-weighted
price index(1982
weights)
10.59.05.64.24.03.52.74.74.3
4.84.13.24.33.9
4.44.5
2.65.14.64.9
4.86.4
NOTE.—Annual changes are from previous year and quarterly changes are from previous quarter. Source: Department of Commerce, Bureau of Economic Analysi
NONFINANCIAL CORPORATE BUSINESS-OUTPUT, COSTS, AND PROFITS[Quarterly data at seasonally adjusted annual rates]
Period
1980198119821983198419851986198719881982: IV1983- IV1984: IV1985- IV1986: IV
1987- HIIV
1988- Inm ..rv
1989- In p
Gross domesticproduct of
nonfinancialcorporate business(billions of dollars)
Currentdollars
1,540.81,738.41,782.21,914.22,146.72,267.12,367.12,520.72,731.3
1,779.42,012.52,201.82,309.42,408.7
2,556.22,598.4
2,648.12,705.92,754.92,816.4
2,842.72,884.5
1982dollars
1,807.91,837.21,782.21,866.02,036.52,117.42,173.92,282.62,419.5
1,760.21,940.52,069.52,137.72,198.5
2,309.22,343.3
2,381.82,408.92,434.12,453.2
2,459.12,469.2
Current-dollar cost and profit per unit of output (dollars) '
Totalcostand
profit 2
0.852.946
1.0001.0261.0541.0711.0891.1041.129
1.0111.0371.0641.0801.096
1.1071.109
1.1121.1231.1321.148
1.1561.168
Capitalconsump-
tionallow-anceswith
capitalconsump-
tionadjust-ment
0.095.109.125.123.118.119.123.123.123
.131
.120
.118
.120
.124
.123
.122
.122
.122
.122
.124
.125
.126
Indirectbusinesstaxes 3
0.077.090.094.098.100.103.106.106.107
.096
.098
.102
.104
.106
.107
.106
.106
.107
.108
.108
.110
.111
Compen-sation ofemploy-
ees
0.581.632.676.679.687.704.721.730.744
.685
.680
.694
.713
.727
.726
.734
.732
.740
.746
.756
.768
.779
Netinterest
0.031.037.043.037.039.038.041.047.052
.042
.037
.042
.037
.042
.048
.050
.050
.051
.053
.055
.057
.060
Corporate profits withinventory valuation and capital
consumption adjustments
Total
0.068.078.063.089.109.106.098.098.103
.057
.103
.107
.106
.096
.103
.098
.102
.103
.102
.105
.096
.092
Profitstax
liability
0.037.035.026.032.036.033.035.041.044
.023
.036
.032
.033
.038
.044
.041
.041
.044
.044
.045
.045
.040
Profitsaftertax4
0.031.044.037.057.073.073.064.058.059.034.066.075.072.058
.060
.057
.060
.059
.058
.061
.051
.052
Outputper hour
of allemploy-
ees(1982dol-
lars) *
'18.524r 18.643' 18.704'19.217' 19.682•"19.996' 20.456' 20.908' 2 1.446T 18.770'19.423* 19.783r20.117'20.646
'21.090'21.192
'21.418'21.453'21.528'21.506r21.411
Compen-sation
per hourof all
employ-ees
(dol-lars) *
' 10.769'11.777'12.635' 13.039' 13.528'14.069'14.746'15.252'15.947
'12.865'13.209'13.735'14.342' 15.005
'15.319' 15.546
'15.672'15.871'16.068'16.259
' 16.449
1 Output is measured by gross domestic product of nonfinancial corporate business in 1982 dol-lars,
3 This is equal to the deflator for gross domestic product of nonfinancial corporate business withthe decimal point shifted two places to the left.
3 Indirect business tax and nontax liability plus business transfer payments less subsidies.4 With inventory valuation and capital consumption adjustments.
* Data reflect revisions beginning 1986 of GNP and related items published July 27, 1989, andrevisions due to changes in the labor input series. See Note, page 16 for details.
Sources: Department of Commerce (Bureau of Economic Analysis) and Department of Labor(Bureau of Labor Statistics).
Digitized for FRASER http://fraser.stlouisfed.org/ Federal Reserve Bank of St. Louis

NATIONAL INCOME[Billions of dollars; quarterly data at seasonally adjusted annual rates]
Period
19821983198419851986198719881982- IV1983- IV1984- IV1985: IV1986- IV1987- TTT
IV
1988- Inm . .IV
1989- III"
Nationalincome
2,518.42,719.53,028.63,234.03,412.63,665.43,972.62,548.22,851.53,096.13,312.83,473.13,694.83,799.9
3,853.63,933.64,005.74,097.4
4,185.24,249.9
Compen-sation ofemploy-
ees1
1,907.02,020.72,213.92,367.52,511.42,690.02,907.61,931.12,092.72,272.72,426.72,571.22,709.82,778.7
2.819.42,878.92,935.12,997.2
3,061.7r3,118.0
Proprietors' incomewith inventory
valuation and capitalconsumptionadjustments
Farm
24.612.430.530.234.741.639.828.519.328.129.237.233.648.4
44.045.437.732.0
59.0r50.7
Nonfarm
150.9178.4204.0225.6247.2270.0288.0159.8188.6209.7235.0252.0271.6280.3
279.9286.5289.3296.3
300.3T 304.2
Kentalincome ofpersons
withcapital
consump-tion
adjust-ment
13.613.28.59.2
11.613.415.715.812.45.67.8
13.511.514.3
15.614.616.316.1
11.8r9.7
Corporate profits with inventory valuation and capitalconsumption adjustments
Total
150.0213.7266.9282.3282.1298.7328.6146.1248.5266.9291.4275.2313.0308.2
318.1325.3330.9340.2
316.3309.1
Profits with inventory valuationadjustment and without capital
consumption adjustment
Total
159.2196.7234.2222.6228.3247.8281.8150.7223.4224.6228.4226.1261.5255.8
268.1276.4284.1298.7
279.7276.9
Profitsbefore tax
169.6207.6240.0224.3221.6266.7306.8164.1231.5226.1235.0234.1281.0276.2
288.8305.3314.4318.8
318.0297.6
Inventoryvaluation
adjust-ment
-10.4-10.9
-5.8-1.7
6.7-18.9-25.0-13.4
-8.1-1.6-6.6-8.0
-19.4-20.4
-20.728 8
-30.4-20.1
-38.3T — 20.7
Capitalconsump-
tionadjust-ment
-9.217.032.759.753.850.946.8
-4.525.142.363.049.151.552.4
49.948.946.941.5
36.6r32.3
Netinterest
272.3281.0304.8319.0325.5351.7392.9266.9290.2313.1322.7324.0355.3370.0
376.6383.0396.4415.7
436.1r458.1
1 Includes employer contributions for social insurance. (See also p. 5.) Source: Department of Commerce, Bureau of Economic Analysis.
PERSONAL CONSUMPTION EXPENDITURES[Billions of dollars, except as noted; quarterly data at seasonally adjusted annual rates]
Period
1982....1983198419851986198719881982- IV1983: IV1984- IV1985- IV1986- IV1987: m
IV
1988: IninIV
1989- In r
Totalpersonal
con-sumptionexpendi-
tures
2,050.72,234.52,430.52,629.02,797.43,010.83,235.12,117.02,315.82,493.42,700.42,868.53,055.93,083.3
3,148.13,204.93,263.43,324.0
3,381.43,446.8
Durable goods
Totaldurablegoods
252.7289.1335.5372.2406.0421.0455.2263.8310.0346.7373.2422.0439.3424.5
446.4454.6452.5467.4
466.4471.0
Motorvehi-clesand
parts
108.9130.4157.4179.1196.2195.5211.6115.7144.4162.3173.8201.1211.3196.3
210.3212.5208.4215.3
211.7212.9
Furni-tureand
house-hold
equip-ment
95.7107.1118.8129.9139.7149.1162.099.1
112.4122.7134.7143.8151.0151.4
156.9162.2162.7166.1
172.1173.7
Other
48.151.659.363.270.076.581.649.053.261.864.777.177.076.7
79.279.981.486.0
82.684.4
Nondurable goods
Totalnon-
durablegoods
771.0816.7867.3911.2942.0998.1
1,052.3786.6837.9879.6932.7952.1
1,006.01,015.4
1,022.21,042.41,066.21,078.4
1,098.31,122.0
Food
398.8421.9448.5471.6500.0529.2559.7407.0430.8456.1482.5511.9531.7536.8
542.5554.5567.8574.1
587.3592.8
Cloth-ing andshoes
124.4135.1146.7156.4166.8177.2186.8126.5141.1149.8160.6168.7178.9180.6
180.8183.6188.9193.9
195.0199.2
Gaso-line
and oil
89.190.290.090.673.575.276.889.891.989.091.066.076.876.7
74.376.978.377.6
77.988.8
Other
158.7169.5182.1192.6201.7216.6229.0163.4174.0184.7198.5205.5218.6221.3
224.5227.5231.2232.8
238.1241.2
Serv-ices
1,027.01,128.71,227.61,345.61,449.51,591.71,727.61,066.51,167.91,267.11,394.51,494.41,610.61,643.3
1,679.51,707.91,744.71,778.2
1,816.71,853.8
Retail sales ofnew passenger
cars (millions ofunits)
Do-mestics
5.86.88.08.28.27.17.56.07.47.77.07.77.86.6
7.77.57.47.5
7.07.3
Im-ports
2.22.42.42.83.23.23.12.52.62.63.13.43.53.3
3.23.23.03.0
2.83.0
Source: Department of Commerce, Bureau of Economic Analysis.
Digitized for FRASER http://fraser.stlouisfed.org/ Federal Reserve Bank of St. Louis

SOURCES OF PERSONAL INCOMEPersonal income rose $32.8 billion (annual rate) in July, following an increase of $20.5 billion in June. Wages andsalaries increased $25.4 billion in July, compared with an increase of $17.6 billion in June.
BILLIONS OF DOLLARS*(RATIO SCALE) BILLIONS OF DOLLARS*(RAT1O SCALE)
5,000
4,000
3,000
2,000
1,400
800
400
. 1
. '
-'
/— —
|Illl|lllll
1981
SEASONALLY ADJUSSOURCE: DEPARIME
__
. _ _ — • - • - — —
^""~~
tmilmii1982
TED ANNUAL RATESIT OF COMMERCE
__----"""
Illllllllll
1983
TOTA
WAGE AS
C
Illllllllll
1984
r-r""'L PERSONAL Ih
"~"\
D SALARY DISE
\"~'\" 1
3THER INCOME
~"~T~"TRANSFERPAYMENTS
miilum1985
4 COME
URSEMENTS
•
iimhim1986
--
--""
_..-- — — •
iiii||ini|1987
'
,. — -
miilmti1988
COUNCIL OF
^
---*"
miilmu1989
CONOMIC ADVISERS
4,000
3,000
2,000
1,400
800
400
[Billions of dollars; monthly data at seasonally adjusted annual rates]
Period
198019811982198319841985198619871988
1988: July ..AugSent ...Oct.NovDee
1989: JanFebMarApr *May r
July"
personalincome
2,258 42 52092,670 82 83863,10873 325 33,526 23 777 64,064 5
4079 84,094.2
4 118 64 18044 16894 206 3
4 273 14 319 5436074 386 843957
4 416 24449 0
Wage andsalary
disburse-ments 1
1 3720
1 51031 586 11 676 61 83861 9754209482 2494
24290
2 443 42447 7
2 465 62497 1
2 '501 62 516 7
2 54542 557 32 5794
2601 32 603 52 621 126465
Other laborincome l z
13841503163 6173 6182 9187 6199 3212 8228 9
229 3231 1232 9234 72365238 2
239 7241 3242 9244 42460247 5249 1
Proprietor
Farm
20530 724 612 430530 234741 639 8
41 038633 447 119 529 4
48 065 963 056 153 742 336 1
' income 3
Nonfarm
160 1156 1150 917842040225 6247 227002880
288 5288 529092958295 7297 4
299 63006300 8304 6303 5304 73074
income ofpersons 4
6 613 313 613 28 59 2
11 613415 7
15 616 516 716 416 116 0
13 811 89 99 79 79 696
dividendincome
52 961 363 968 775 578 785 8920
102 2
102 4103 9104 7105 8106 5106 9
1084109 4110 3111 0111 4111 8112 8
interestincome
271 93354369 7393 1444 74780
493 2523 2571 1
570 1576 0583 0590 8598 66064
616 5628 9641 56484655 2661 86682
pay-ments 5
324 7368 1410 6442 6456 6489 8521 55482584 7
585 7587 9588 7592 2593 5595 6
610 7614 2624 2623 9625 5631 1634 3
Less:
contributionsfor socialinsurance
88 6104 5112 3120 1132 7149 3161 9172 91949
196 1195 9197 2199 5199 1200 1
209 0209 8211 3212 6212 7213 82150
personalincome e
2 215 82465 62 618 72 799 03052 13 271 33 469.43 714 74 003.7
4017 94 034.64064 14 112 34 12844 155 9
4 20404 23244 27654 30734 32054 352 34 391.1
1 The total ol wage and salary disbursements and other labor income differs from compensation ofemployees (see p. 4) in that it excludes employer contributions for social insurance and the excess ofwage accruals over wage disbursements.
* Consists primarily of employer contributions to private pension and private welfare funds.3 With inventory valuation and capital consumption adjustments.4 With capital consumption adjustment.
5 Consists mainly of social insurance benefits, direct relief, and veterans payments.B Persona! income exclusive of farm proprietors' income, farm wages, farm other fa&or income,
and agricultural net interest.
Source: Department of Commerce, Bureau of Economic Analysis.
Digitized for FRASER http://fraser.stlouisfed.org/ Federal Reserve Bank of St. Louis

DISPOSITION OF PERSONAL INCOMEReal per capita disposable personal income was about unchanged in the second quarter of 1989.
BILLIONS OF DOLLARS * (RATIO SCALE)4,000
BILLIONS OF DOLLARS * (RATIO SCALE)4,000
1,400
DOLLARS * (RATIO SCALE)
1,400
DOLLARS * (RATIO SCALE)
16,000
14,000
12,000
10,000
8,000
6,000
PER CAPITA DISPOSABLE PERSONAL INCOME ^
CURRENT DOLLARS __V. _^— • ^
'
1 1 1
1981
1 1 1
1982
1 1 1
1983
r~--- '
! 1 11984
_— -
-r •
1 \982 DOLLAR'
< 1 11985
1 1 11986
r -— ' "
1 1 11987
1 1 11988
,-—
.....
1 1 11989
1 6,000
14,000
12,000
10,000
8,000
6,000
' SEASONALLY ADJUSTED ANNUAL RATESSOURCE: DEPARTMENT OF COMMERCE
COUNCIL OF ECONOMIC ADVISERS
Period
19801981...1982....1983..1984....1985...19861987...1988
1982: IV1983: IV1984: IV1985: IV1986: IV
1987: m....IV
1988: Inm....IV
1989: In r....
Persona!income
Less:Personaltax andnontax
payments
iEquals:Disposable
personalincome
Less:Personaloutlays I
Equals:Personal
saving
Billions of dollars
2,258.52,520.92,670.82,838.63,108.73,325.33,526.23,777.64,064.5
340.5393.3409.3410.5440.2486.6512.9571.7586.6
1,918.02,127.62,261.42,428.12,668.62,838.73,013.33,205.93,477.8
1,781.11,968.12407.52,297.42^504.52,713.32^888.53,104.13^333.1
136.9159.4153.9130.6164.1125.4124.9101.8144.7
Dispos-able
personalincome in
1982dollars
(billions)
2,214.32,248.62^261.52,331.92469.82,542.82^635.32,676.62^793.2
Per capitadisposable personal
income
Currentdollars
1982dollars
Per capita personalconsumptionexpenditures
Currentdollars
1982dollars
Dollars
8,4219,2439,724
10,34011,25711,86112,46913,14014,116
9,722
9,7699^7249,930
10^41910^62510^90510,970Ili337
7,6078,3208,8189,515
10^25310,985Ili57612,34013,131
8,7838,7948,8189,1399,4899,839
10,12310,30310,546
Percentchange inreal percapita
disposablepersonalincome
Saving aspercent ofdisposablepersonalincome
Percent
— 1.1.5
— .52.14.92.02.6
.63.3
Seasonally adjusted annual rates
2,729.22,941.83,188.33,399.13,597.8
3,795.53,908.7
3,948.54,026.64,097.64,185.2
4,317.84,399.6
411.1413.9459.7499.6534.4
572.0589.2
572.2590.7585.9597.8
628.3652.6
2,318.12,527.92,728.62,899.53,063.4
3,223.53,319.4
3,376.43,435.93,511.73,587.4
3,689.53,747.0
2,174.92,382.52,571.32,787.72,961.4
3,149.93,177.6
3,244.43,301.93,362.13,424.0
3,483.83,549.9
143.1145.4157.3111.7102.0
73.6141.8
131.9134.0149.6163.4
205.7197.2
2,276.12,392.72,496.32,562.82,646.2
2,675.62,726.2
2,151.22,773.32,806.42,835.9
2,881.72,886.6
9,92910,72511,46712,06812,629
13,19613,552
13,15413,96614,23514,504
14,88415,081
9,74910,15110,49110,66710,909
10,95311,130
11,23211,27311,37711,466
11,62511,618
9,0689,825
10,47911,24011,825
12,51012,588
12,82413,02813,22913,439
13,64113,873
8,9049,2999,5879,935
10,214
10,38410,339
10,41310,51510,57310,624
10,65410,687
1.29.11.73.3
.3
5.66.6
3.11.53.73.2
5.7-.2
7.17.56.85.46.14.44.13.24.2
6.25.85.83.93.3
2.34.3
3.93.94.34.6
5.65.3
Population,includingArmedForcesabroad(thou-
sands) "
227,754230,182232,549234,829237,051239,322241,660243,985246,378
233,466235,707237,946240,257242,579
244,274244,936
245,416246,008246,685247,343
247,890248,456
1 Includes personal consumption expenditures, interest paid by consumers to business, and person-al transfer payments to foreigners (net).
2 Annual data are averages of quarterly data, which are averages for the period.
Source: Department of Commerce (Bureau of Economic Analysis and Bureau of the Census).
Digitized for FRASER http://fraser.stlouisfed.org/ Federal Reserve Bank of St. Louis

FARM INCOMEIn the first quarter of 1989, according to current estimates, gross farm income rose $18.8 billion (annual rate) andnet farm income rose $21.5 billion.
BULK
240200
160
120
80
DNS OF DOLLARS* (RATIO SCALE) BILLIONS OF DOLLARS * (RATIO S
1, —
~ -̂ '
GRC/
3SS FARM INC(
" f
JMb
«__ -̂ *" "^
CALE)240200
160
120
80
An
40
20
10
40
20
10
* SEASONALLY ADJUSTED ANNUAL RATES
SOURCE: DEPARTMENT OF AGRICULTURECOUNCIL OF ECONOMIC ADVISERS
[Billions of dollars; quarterly data at seasonally adjusted annual rates]
Period
1980198119821983198419851986 ..19871988
1986: mIV ..
1987: InmIV
1988: Inm ..IV
1989- I
Income ot farm operators from {arming
Gross farm income
Total '
149.3166.4163.5153.0174.9166.2159.8169.8177.5
158.1162.6
173.6162.5168.9173.7
175.3182.5174.9177.1
195.9
Cash marketing receipts
Total
139.7141.7142.6136.6142.4144.0135.1138.1151.3
137.8137.7
134.9134.4146.5136.6144.2148.6160.2152.0
153.2
Livestock andproducts
68.069.270.369.473.069.871.576.278.8
77.373.0
73.377.079.675.1
81.775.278.280.2
83.0
Crops
71.772.572.367.169.574.263.661.972.5
60.564.7
61.657.466.961.5
62.573.482.071.8
70.2
Value ofinventorychanges 2
-6.36.5
— 1.410 96.32 4
-2.86
-4.3
2 3-1.9
Q
.1
4-1.9
-3.2-3.8
4 7-5.4
4.7
Productionexpenses
133.1139.4140.0140.4142.7134.0122.3123.5132.1
121.1120.7
120.3124.1125.0124.6126.7129.3135.4137.0
134.3
Net farm income
Currentdollars
16.126.923.512.732.232.337.546.345.4
37.041.9
53.438.443.949.048.753.239.540.1
61.6
1982 dollars *
18.828.623.512.229.929.132.939.437.4
32.336.4
46.032.831.341.340.844.132.432.6
49.2
1 Cash marketing receipts and inventory changes plus Government payments, other farm cashincome, and nonmoney income furnished by farms.
2 Physical changes in end-of-year inventory of crop and livestock commodities valued at averageprices during the year.
3 Income in current dollars divided by the GNP implicit price deflator.
NOTE.—Data include net Commodity Credit Corporation loans and operator households.
Sources: Department of Agriculture and Department of Commerce.
Digitized for FRASER http://fraser.stlouisfed.org/ Federal Reserve Bank of St. Louis

CORPORATE PROFITSIn the second quarter of 1989, according to preliminary estimates, corporate profits before tax fell $20.4 billion(annual rate) and after-tax profits fell $9.3 billion.
BILLIONS OF DOLLARS360
320
280
240
200
160
120
80
40
BILLIONS OF DOLLARS360SEASONALLY ADJUSTED ANNUAL RATES
v - f ~ \ PROFITS BEFORE TAX S
^ /"
~\\
\vV*"'S0
i
1981
\
\
S. ., , , r
\\
1 I 1
1982
/s
f
'' ^,../' s '
I I I1983
^
• -^ PR
' X
UNDISTI1 1 1
1984
r^]:>FITS AFTER T/
,._>-.
rA— '
TAX LIABILITY
IBUTED PROFI"
1 1 1
1985
S-^
tf
— -— -^
S
1 1 1
1986
'''' s — --
1 1 1
1987
/^
^-
S~~"
'-"
I 1 1
1988
\
-^
-X
-v
1 1 1
1989
320
280
240
200
160
120
80
40
SOURCE: DEPARTMENT OF COMMERCE COUNCIL OF ECONOMIC ADVISERS
[Billions of dollars; quarterly data at seasonally adjusted annual rates]
Period
19801981 .19821983...19841985...19861987...1988
1982- TV1983: TV1984- TV1985: TV1986- IV
1987: HIIV
1988: InmTV
1989- IH "
Profits (before tax) with inventory valuation adjustment 1
Total 2
194.0202.3159.2196.7234.2222.6228.3247.8281.8
150.7223.4224.6228.4226.1
261.5255.8
268.1276.4284.1298.7
279.7276.9
Domestic industries
Total
159.6173.8131.2166.6203.3191.4195.2208.7238.2
121.6190.7193.9193.6193.4
222.6211.8
225.7235.8239.0252.2
233.1228.5
Financial
21.016.511.818.113.022.832.030.529.8
18.715.513.626.028.6
30.229.9
27.729.731.630.1
29.327.9
Nonfinancial
Total 3
138.6157.3119.4148.5190.3168.6163.2178.2208.4
102.9175.2180.3167.6164.8
192.4181.9
198.0206.1207.3222.1
203.9200.6
Manufac-turing
77.188.558.070.188.879.759.576.698.4
46.888.679.883.864.8
87.384.5
94.698.295.1
105.5
96.5
Whole-sale and
retailtrade
21.632.534.638.951.244.144.141.140.1
33.643.151.838.541.0
43.241.2
42.237.339.241.8
34.1
Profitsbefore tax
237.1226.5169.6207.6240.0224.3221.6266.7306.8
164.1231.5226.1235.0234.1
281.0276.2
288.8305.3314.4318.8
318.0297.6
Taxliability
84.881.163.177.293.996.4
106.3124.7137.9
59.888.187.099.8
113.1
132.7127.3
129.0138.4141.2143.2
144.4133.3
Profits after tax
Total
152.3145.4106.5130.4146.1127.8115.3142.0168.9
104.3143.4139.2135.2121.0
148.3148.9
159.9166.9173.2175.6
173.6164.3
Dividends
54.763.666.971.579.083.391.398.7
110.4
68.573.980.884.093.6
100.0102.8
105.7108.6112.2115.2
118.5120.9
Undistrib-uted
profits
97.681.839.658.967.044.624.043.358.5
35.869.558.451.227.4
48.346.1
54.258.361.160.4
55.143.4
Inventoryvaluation
adjustment
-43.1-24.2-10.4-10.9-5.8-1.7
6.7-18.9-25.0
-13.4-8.1-1.6-6.6-8.0
-19.4-20.4
-20.7-28.8-30.4— 20.1
-38.3r-20.7
1 See p. 4 for profits with inventory valuation and capital consumption adjustments.2 Includes rest of the world, not shown separately.
3 Includes industries not shown separately.
Source: Department of Commerce, Bureau of Economic Analysis.
Digitized for FRASER http://fraser.stlouisfed.org/ Federal Reserve Bank of St. Louis

GROSS PRIVATE DOMESTIC INVESTMENTAccording to revised estimates for the second quarter of 1989, nonresidential fixed investment rose $9.5 billion(annual rate) and residential investment fell $4.0 billion. There was a $27.3 billion increase in inventories, followingan increase of $27.7 billion in the first quarter of 1989.
BILLIONS OF DOLLARS900
BILLIONS OF DOLLARS
800
700
600
500
400
300
200
100
-100
SEASONALLY ADJUSTED ANNUAL RATES
GROSS PRIVATE DOMESTIC /^\INVFSTMFNT /
/
/>l
--'"""
-
1 1 11981
"̂ 1""*----..
_.*-
\f
1 1 1
1982
/^ S*
,*~~
+>*
/f*
,/""
\ \ \
1983
r—^\^}
NFl>
CHA
^^%
1 1 I1984
ONRESIDENTI/ED INVESTMEh
— \~."
' Fl>
NGE IN BUSININVENTORIES
1 1 1
1985
^— 1
1•JT
RESIDENTIAL(ED INVESTMEh
V
ESS
'V
i i i1986
"^
..- '
41
~~
X%.
r— --/
1 1 11987
^~l
-"•'"
1 1 11988
'--"'
—
-
—
—
— - -
-
..
1 1 11989
900
800
700
600
500
400
300
200
100
0
-100
SOURCE: DEPARTMENT OF COMMERCE COUNCIL OF ECONOMIC ADVISERS
[Billions of dollars; quarterly data at seasonally adjusted annual rates]
Period
1980198119821983198419851986..19871988
1982: IV1983: IV1984: IV1985- IV1986- IV
1987: TTTIV
1988- ITJmIV
1989: IH r
Grossprivate
domesticinvestment
437.0515.5447.3502.3664.8643.1659.4699.9750.3
409.6579.8661.8654.1648.8
692.8749.7
728.8748.4771.1752.8
769.6174.1
Fixed investment
Total
445.3491.5471.8509.4597.1631.8652.5670.6719.6
469.5548.8616.8646.8660.9
683.2686.3
698.7719.1726.5734.1
742.0141.4
Nonresidential
Total
322.8369.2366.7356.9416.0442.9435.2444.3487.2
354.9383.9435.0451.3435.8
457.0458.6
472.7487.1493.2495.8
503.1512.6
Structures
113.9138.5143.3124.0141.1153.2139.0133.8140.3
137.6127.4146.6155.9133.7
137.3138.9
137.1139.9142.0142.5
144.7142.8
Producers'durable
equipment
208.9230.7223.4232.8274.9289.7296.2310.5346.8
217.3256.5288.4295.5302.2
319.8319.7
335.6347.2351.3353.3
358.5869.8
Residential
122.5122.3105.1152.5181.1188.8217.3226.4232.4
114.7164.9181.8195.5225.1
226.2227.7
226.1232.1233.2238.4
238.8234.8
Change in businessinventories
Total
8324.0245
-7.167.711.36.9
29.330.6
-59.931.045.0
7.2-12.2
9.563.3
30.029.344.618.7
27.721.3
Nonfarm
-2.418.3
-23.1.4
60.514.68.6
30.534.2
-51.121.341.323.7
-8.0
14.061.3
24.230.441.540.8
19.123.8
Source: Department of Commerce, Bureau of Economic Analysis.
Digitized for FRASER http://fraser.stlouisfed.org/ Federal Reserve Bank of St. Louis

EXPENDITURES FOR NEW PLANT AND EQUIPMENTAccording to the Commerce Department April-May survey, business spending for new plant and equipment isexpected to rise 9.9 percent in 1989, following a rise of 10.3 percent in 1988.
BILLIONS OF DOLLARS (RATIO SCALE)
500
BILLIONS OF DOLLARS (RATIO SCALE)
500
400
300
200
40 40
1981
J/ SURVEYED QUARTERLY_£/'SEE FOOTNOTE 4 BELOWSOURCE: DEPARTMENT OF COMMERCE COUNCIL OF ECONOMIC ADVISERS
[Billions of dollars; quarterly data at seasonally adjusted annual rates]
Period
1980....19811982....198319841985....19861987....19881989 4 .
1987: mIV
1988: Ininrv
1989- In 4
m4
IV4
Industries surveyed quarterly
Allindus-tries
282.80315.22310.58304.78354.44387.13379.47389.67429.67472.08
394.54406.82
412.02426.94436.01443.71
457.64467.50478.79484.38
Manufacturing
Total
112.33126.54120.68116.20138.82153.48142.69145.90165.70179.35
148.20152.21
158.60161.69168.91173.61"
175.83177.10182.70181.79
Dura-ble
goods
55.3659.8155.3553.0866.2473.2769.1471.0178.1282.13
71.9672.28
75.7076.8779.4880.42
81.7180.2184.0882.54
Non-durablegoods
56.9666.7365.3363.1272.5880.2173.5674.8887.5897.22
76.2479.92
82.9084.8289.4393.18
94.1296.8998.6199.25
Nonmanufacturing
Total 1
170.47188.68189.89188.58215.61233.65236.78243.78263.97292.72
246.34254.61
253.43265.25267.10270.11
281.81290.40296.09302.59
Mining
15.9921.3920.0515.1916.8615.8811.2211.3912.6712.00
11.8112.32
12.5913.2612.4712.35
12.1213.0812.2120.60
Trans-portation
16.6015.8414.7913.9716.5218.0218.8018.8521.3524.86
19.1919.34
20.4320.7222.1722.10
23.2423.1125.8527.24
Publicutilities
37.7441.2145.4344.9647.4848.8146.3844.8846.5150.77
45.2946.38
44.6145.4346.7049.27
50.2651.4250.1853.24
Com-mercial
andother
100.14110.24109.63114.45134.75150.94160.38168.65183.44205.09
170.05176.56
175.79185.83185.76186.38
196.20202.79207.86213.51
Addenda
Totalnon-farmbusi-ness2
314.47349.26347.47343.35398.99431.94427.23440.66482.40
Manu-facturing
112.33126.54120.68116.20138.82153.48142.69145.90165.70179 35
148.20152.21
158.60161.69168.91173.61
175.83177.10182.70181.79
Nonmanufacturing
Total
202.15222.72226.79227.15260.16278.46284.54294.77316.70
Sur-veyedquar-terly
170.47188.68189.89188.58215.61233.65236.78243.78263.97292.72
246.34254.61
253.43265.25267.10270.11
281.81290.40296.09302.59
Sur-veyed
annual-lyS
31.6834.0436.8938.5644.5544.8147.7550.9952.73
1 Excludes forestry, fisheries, and agricultural services; medical services; professional services;social services and membership organizations; and real estate, which, effective with the April-May1984 survey, are no longer surveyed quarterly. See last column ("nonmanufacturing surveyed annu-ally") for data for these industries.
2 "All industries" plus the part of nonmanufacturing that is surveyed annually.
3 Consists of forestry, fisheries, and agricultural services; medical services; professional services;social services and membership organizations; and real estate.
4 Planned capital expenditures as reported by business in April-May 1989, corrected for biases.
Source: Department of Commerce, Bureau of the Census.
10
Digitized for FRASER http://fraser.stlouisfed.org/ Federal Reserve Bank of St. Louis

EMPLOYMENT, UNEMPLOYMENT, AND WAGESIn July, civilian employment fell 82,000 and unemployment fell 64,000.
MILLIONS OF PERSONS*124
MILLIONS OF PERSONS*
124
120
116
112
108
104
100
96
X-
f*
12
SEASONALLY ADJUSTED
120
116
112
108
104
100
96
-^-•*,
12
8
4
0
CIVILIAN LABOR FORCE
CIVILIAN "EMPLOYMENT
UNEMPLOYMENT
1 1 1 1 1 ( 1 1 1 1 1 1 1 1 M 1 1 1 i 1 1
1981 1982 1983 1984 1985 1986 1987 1988 1989
' ! 6 YEARS OF AGE AND OVER
SOURCE: DEPARTMENT OF LABOR COUNCIL OF ECONOMIC ADVISERS
[Thousands of persons 16 years of age and over, except as noted; monthly data seasonally adjusted except as noted by NSA]
Period
1980198119821983198419851986'19871988
1988:JulyAugSeptOctNovDec
1989:JanFebMarAprMayJuneJuly
Noninstitu-tional
populationincludingresidentArmedForcesNSA
169,349171,775173,939175,891178,080179,912182,293184,490186,322
186,402186,522186,666186,801186,949187,098
187,340187,461187,581187,708187,854187,995188,149
Resi-dent
ArmedForcesNSA
1,6041,6451,6681,6761,6971,7061,7061,7371,709
1,6731,6921,7041,6871,7051,696
1,6961,6841,6841,6841,6731,6661,666
Labor forceincludingresidentArmedForces
108,544110,315111,872113,226115,241117,167119,540121,602123,378
123,331123,692123,688123,778124,215124,259
125,124124,865124,948125,343125,283125,768125,622
Employ-ment
includingresidentArmedForces
100,907102,042101,194102,510106,702108,856111,303114,177116,677
116,707116,895117,074117,260117,652117,705
118,407118,537118,820118,797118,888119,207119,125
Civilianlabor force
106,940108,670110,204111,550113,544115,461117,834119,865121,669
121,658122,000121,984122,091122,510122,563
123,428123,181123,264123,659123,610124,102123,956
Civilian employment
Total
99,303100,39799,526
100,834105,005107,150109,597112,440114,968
115,034115,203115,370115,573115,947116,009
116,711116,853117,136117,113117,215117,541117,459
Agricul-tural
3,3643,3683,4013,3833,3213,1793,1633,2083,169
3,0603,1423,1763,2383,2383,193
3,3003,2233,2063,1043,1123,0963,219
Nonagricultural
Total
95,93897,03096,12597,450
101,685103,971106,434109,232111,800
111,974112,061112,194112,335112,709112,816
113,411113,630113,930114,009114,102114,445114,240
Part timefor
economicreasons l
4,0644,4995,8525,9975,5125,3345,3455,1224,965
5,1024,9724,8624,7274,8195,033
4,8374,6974,7094,9304,6094,8014,505
Unemployment
Total
7,6378,273
10,67810,7178,5398,3128,2377,4256,701
6,6246,7976,6146,5186,5636,554
6,7166,3286,1286,5466,3956,5616,497
15weeks
andover
1,8712,2853,4854,2102,7372,3052,2321,9831,610
1,6191,6361,5681,5541,5021,495
1,5121,3041,3101,4261,3131,2581,472
Civilian
Laborforce
partici-pationrate(per-
cent) 2
63.863.964.064.064.464.865.365.665.9
65.966.066.066.066.166.1
66.566.366.366.566.466.666.5
Employ-ment/
populationratio(per-
cent) 2
59.259.057.857.959.560.160.761.562.3
62.362.362.462.462.662.6
62.962.963.063.063.063.163.0
1 Persons at work. Economic reasons include slack work, material shortages, inability to find full- 'Data beginning January 1986 not strictly comparable with earlier data because of change wtime work, etc. estimation procedures.
2 Civilian labor force (or employment) aa percent of civilian noninstitutional population. Source: Department of Labor, Bureau of Labor Statistics.
11
Digitized for FRASER http://fraser.stlouisfed.org/ Federal Reserve Bank of St. Louis

SELECTED UNEMPLOYMENT RATESIn July, the overall unemployment rate was unchanged, at 5.2 percent, and the civilian unemployment rate fellslightly, to 5.2 percent.
PERCENT* (SEASONALLY ADJUSTED) PERCENT* (SEASONALLY ADJUSTED)
10
'UNEMPLOYMENT AS PERCENT OF CIVILIAN LABOR FORCE IN GROUP SPECIFIED.
SOURCE; DEPARTMENT OF LABOR
1989
COUNCIL OF ECONOMIC ADVISERS
[Monthly data seasonally adjusted]
Period
198019811982 ..198319841985198619871988
1988: JulyAugSeptOctNovDec
1989: JanFebMarAprMayJune....July
Unem-ploy-mentrate,all
work-ers *
7.07.59.59.57.47.16.96.15.4
5.45.55.35.35.35.3
5.45.14.95.25.15.25.2
Unemployment rate (percent of civilian labor force in group)
Allcivilianwork-
ers
7.17.69.79.67.57.27.06.25.5
5.45.65.45.35.45.3
5.45.15.05.35.25.35.2
By sex and age
Men20 yearsand over
5.96.38.88.96.66.26.15.44.8
4.54.94.64.64.84.7
4.64.54.24.64.34.34.3
Women20 years
andover
6.46.88.38.16.86.66.25.44.9
5.04.84.84.74.74.7
4.74.54.64.74.84.95.0
Bothsexes16-19years
17.819.623.222.418.918.618.316.915.3
15.115.415.515.014.114.8
16.414.813.714.415.215.614.7
By race
White
6.36.78.68.46.56.26.05.34.7
4.74.94.74.64.64.6
4.64.34.24.64.44.54.6
Blackand
other
13.114.217.317.814.413.713.111.610.4
10.110.09.59.8
10.010.0
10.610.69.89.69.5
10.39.6
Black
14.315.618.919.515.915.114.513.011.7
11.511.410.911.211.211.6
12.011.910.910.811.011.910.9
By selected groups
Experi-enced
wage andsalary
workers
6.97.39.39.27.16.86.65.85.2
5.15.35.15.05.15.0
5.24.84.75.14.95.05.1
Marriedmen,
spousepresent
4.24.36.56.54.64.34.43.93.3
3.13.43.13.13.33.1
3.13.12.93.22.92.82.9
Womenwho
maintainfamilies
9.210.411.712.210.310.49.89.28.1
8.57.58.17.97.78.2
8.08.07.97.68.37.98.7
Full-time
workers
6.97.39.69.57.26.86.65.85.2
5.05.35.15.05.05.1
5.04.84.85.04.84.84.9
Part-time
workers
8.89.4
10.510.49.39.39.18.47.6
8.07.47.47.47.17.0
7.97.36.27.26.97.77.2
Laborforce
time lost(per-
cent) 2
7.98.5
11.010.98.68.17.97.16.3
6.46.46.36.16.26.3
6.25.95.86.05.96.16.0
1 Unemployed as percent of total labor force including resident Armed Forces.2 Aggregate hours lost by the unemployed and persons on part time for economic reasons fta per-
cent of potentially available labor force hours.
Source: Department of Labor, Bureau of Labor Statistics.
12
Digitized for FRASER http://fraser.stlouisfed.org/ Federal Reserve Bank of St. Louis

SELECTED MEASURES OF UNEMPLOYMENT AND UNEMPLOYMENTINSURANCE PROGRAMSIn July, the percentages of the unemployed who had been out of work for less than 5 weeks and for 5-14 weeksfell and the percentages for 15-26 weeks and for 27 weeks and over rose. Both the mean and the medianduration of unemployment rose.
PERCENT DISTRIBUTION
70
40
DURATION OF UNEMPLOYMENT
PERCENT DISTRIBUTION*
70
30 •=.
20
10 -
60
- 50
40
— 30
20
10
REASON FOR UNEMPLOYMENT
1989 1985
JOB LOSERS
REENTRANTS
JOB LEAVERS
NEW ENTRANTS
1986 1987 1988 1989
•SEASONALLY ADJUSTED
SOURCE: DEPARTMENT OF LABOR COUNCIL OF ECONOMIC ADVISERS
[Monthly data seasonally adjusted, except as noted]
Period
198019811982198319841985198619871988
1988- July
SeptOctNovDec
1989: JanFebMar
May
July
Unemploy-ment
(thousands)
7,6378,273
10,67810,7178,5398,3128,2377,4256,701
6,6246,7976,6146,5186,5636,554
6,7166,3286,1286,5466,3956,5616,497
Duration of unemployment
Percent distribution
Lessthan
5weeks
43.141.736.433.339.242.141.943.746.0
44.946.847.447.447.646.2
47.050.649.447.247.750.448.1
5-14weeks
32.330.731.027.428.730.231.029.630.0
30.729.028.828.529.531.1
30.729.129.431.131.730.429.4
15-26weeks
13.813.616.015.412,912.312.712.712.0
12.412.311.812.212.011.5
11.210.410.510.511.010.012.9
27weeks
andover
10.714.016.623.919.115.414.414.012.1
11.911.912.111.910.911.2
11.110.010.711.39.69.19.6
Number ofweeks
Aver-age
(mean)
11.913.715.620.018.215.615.014.513.5
13.513.513.513.412.612.8
12.712.112.412.711.811.112.0
Medi-an
6.56.98.7
10.17.96.86.96.55.9
6.25.95.75.75.65.8
5.75.35.45.45.35.55.6
Reason for unemployment:percent distribution
Joblosers
51.751.658.758.451.849.848.948.046.1
46.146.246.745.946.246.5
46.445.246.045.742.742.044.3
Jobleav-ers
11.711.27.97.79.6
10.612.313.014.7
13.814.614.915.314.715.1
14.715.514.415.017.515.515.3
Reen-trants
25.225.422.322.525.627.126.226.627.0
28.127.326.827.226.926.2
27.327.328.129.029.131.229.4
Newentrants
11.411.911.111.313.012.512.512.412.2
11.911.911.511.612.212.1
11.612.011.610.310.711.311.0
Stateprograms
Insuredunem-
ployment
Initialclaims
Insuredunem-
ployment,all
regularprograms(unadjust-
ed)1
Weekly average, thousands
3,3503,0474,0613,3962,4762,6112,6502,3322,056
2,0822,0692,0251,9721,9892,032
2,0612,1052,1432,1052,0632,1342,216
488460583438377396378328306
327305293296301309
293309323300317335339
3,8373,4104,5943,7752,5612,6932,7462,4012,125
2,0521,9141,7341,6771,8572,205
2,6852,6952,5672,2211,9601,941
1 Includes State (50 States, District of Columbia, Puerto Rico, and Virgin Islands), ex-service-men (OCX), Federal (UCFE), and railroad (RR) programs. Also includes Federal and State ex-tended benefit programs. Does not include Federal supplemental compensation program.
Source: Department of Labor (Bureau of Labor Statistics and Employment and Training Adminis-tration).
13
Digitized for FRASER http://fraser.stlouisfed.org/ Federal Reserve Bank of St. Louis

NONAGRICULTURAL EMPLOYMENTTotal nonagricultural employment as measured by the payroll survey rose 169,000 in July.
MILLIONS OF PERSONS*110
MILLIONS OF PERSONS* (ENLARGED SCALE)
100 -
90
80
70
60
50
40
30
20 fyiiiilimi1985
ALL NONAGRICULTURALESTABLISHMENTS
SERVICE-PRODUCINGINDUSTRIES
GOODS-PRODUCINGINDUSTRIES
1986 1987 1988Illlllllllll
26
24
22
20
18
^SERVICES
V1
.-'"1^.-^'
-
^-^•jwrifflfi
^
Rl
~
"
'iTfi MM 1 1 1
;TAIL TRADE
\ — r-
f+**
, — •OVERNMEN
n*,H
^s"
—
—
—
r
i| mill nit
1989 1985
•SEASONALLY ADJUSTEDSOURCE: DEPARTMENT Of LABOR
1989
COUNCIL OF ECONOMIC ADVISERS
[Thousands of wage and salary workers; l seasonally adjusted]_
Period
19801981 ....1982198319841985198619871988
1988: July....Aug....Sept....OctNov....Dec
1989: JanFebMarAprMay r..June r.July".
Totalnonagri-culturalemploy-
ment
90,40691,15689,56690,20094,49697^51999,525
102,200105,584
105,768105,954106,207106,475106,824107,097
107,442107,711107,888108,101108,310108,560108,729
Goods-producing industries
Total 2
25,65825,49723',81323,33424,72724^85924,55824,70825,249
25,32325,30325,31325,38425,46025,513
25,62625,62925,64625,67125,67225,65125,680
Con-struction
4,3464,188s',9053,9484,3834^6734*8164,967s',125
5,1505,1535,1635,1625,1915,213
5,2675,2705,2525,2795,2835,2815,318
Manufacturing
Total
20,28520,17018J8118,43419,37819^26018*96519,02419',403
19,44819,42519,43119,50519,55719,589
19,64819,64819,68019,67219,66719,65519,658
Durablegoo s
12,18712,10911*03910,73211,50511,49011*23011,19411*437
11,47511,46211,46411,50911,54511,565
11,60511,59411,60411,60011,59411,56711,549
Nondur-able
goods
8,0988,0617*.7417,7027,8737,7707*,7347,8307*967
7,9737,9637,9677,9968,0128,024
8,0438,0548,0768,0728,0738,0888,109
Service-producing industries
Total
64,74865,65965,75366,86669 76972,66074*,96777,4928o',335
80,44580,65180,89481,09181,36481,584
81,81682,08282,24282,43082,63882,90983,049
Trans-portation
andpublic
utilities
5,1465,165
4,9545 1595,2385J2555,3725',548
5,5575,5725,5815,5965,6165,634
5,6545,6675,6665,6825,7005,7165,739
Whole-sale
trade
5,2755,3585*.2785,2685 5555,7175,1535,8446J029
6,0386,0516,0716,0866,1046,125
6,1466,1716,1976,2066,2226,2296,234
Be tailtrade
15,03515,18915,17915,61316 54517,35617*93018,483
19,13919,18219,18819,22919,28219,328
19,40719,46019,48819,48919,52819,54819,600
Finance,insur-ance,
and realestate
5,1605,2985*3415,4685,6895,9556*2836,547
6,6786,6866,6956,7106,7266,744
6,7466,7636,7746,7766,7906,8016,812
Services
17,89018,61919*03619,69420,79722,00023*05324,23625*600
25,68325,78425,88825,98626,11126,280
26,31826,43426,52026,65126,71126,92326,997
Government
Total
16,24116,03115,'83715,86916,02416*39416*,69317,01011 ',31 2
17,35017,37617,47117,48417,52511,523
17,54517,58717,59717,62617,68717,69217,667
Federal
2,8662,7722*7392,7742,8072,8752*8992,943
2,9582,9672,9852,9862,9832,981
2,9782,9822,9822,9822,9992,9942,976
1 Includes all full- and part-time wage and salary workers in nonagricultural establishments whoreceived pay for any part of the pay period which includes the 12th of the month. Excludes propri-etors, self-employed persona, domestic servants, and personnel of t\ie Armed forces. Total derivedfrom this table not comparable with estimates of nonagricultural employment of the civilian laborforce, shown on p, 11, which include proprietors, self-employed persons, and domestic servants;which count persons as employed when they are not at work because of industrial disputes, bad
weather, etc., even if they are not paid for the time off; and which are based on a sample of theworking-age population, whereas the estimates in this table are based on reports from employingestablishments.
2 Includes mining, not shown separately.
Source: Department of Labor, Bureau of Labor Statistics.
14
Digitized for FRASER http://fraser.stlouisfed.org/ Federal Reserve Bank of St. Louis

AVERAGE WEEKLY HOURS, HOURLY EARNINGS, AND WEEKLYEARNINGS
PRIVATE NONAGRICULTURAL INDUSTRIES[For production or nonsupervisory workers; monthly data seasonally adjusted, except as noted]
Period
1980 . . ..19811982198319841985198619871988
1988: July
SeptOctNovDec
1989: JanFebMar
May '
July"
Average weekly hours
Totalprivate
nonagri-eultural }
35.335.234.835.035.234.934.834.834.7
34.834.634.734.834.734.7
34.834.634.734.934.634.634.9
Manufacturing
Total
39.739.838.940.140.740.540.741.041.1
41.141.041.141.241.241.0
41.141.141.041.341.041.041.0
Overtime
2.82.82.33.03.43.33.43.73.9
3.93.93.94.03.93.9
3.93.94.03.93.83.83.9
Average gross hourlyearnings
Totalprivate
nonagri-cultural l
$6.667.257.688.028.328.578.768.989.29
9.319.329.379.439.429.45
9.499.529.549.619.609.629.70
Manufac-turing
$7.277.998.498.839,199.549.739.91
10.18
10.1810.2110.2510.2910.3010.31
10.3310.3710.4010.4010.4210.4510.48
Average gross weekly earnings
Total privatenonagricultural 1
Currentdollars
$235.10255.20267.26280.70292.86299.09304.85312.50322.36323.99322.47325.14328.16326.87327.92
330.25329.39331.04335.39332.16332.85338.53
1977dollars "
$172.74170.13168.09171.26172.78170.42171.07169.28167.81168.39166.82167.68168.55167.28167.39
167.55166.44166.44167.53165.01165.10167.51
Current dollars
Manufac-turing
$288.62318.00330.26354.08374.03386.37396.01406.31418.40418.40418.61421.28423.95424.36422.71424.56426.21426.40429.52427.22428.45429.68
Construc-tion
$367.78399.26426.82442.97458.51464.46466.75480.44493.08
493.29492.53494.05499.66503.04497.07496.89498.39501.23505.21494.17497.79512.26
Retailtrade
$147.38158.03163.85171.05174.33174.64176.08178.70183.62
185.18183.57185.08186.30185.60187.11
187.40186.41186.98189.44187.56188.14190.68
Percent change from ayear earlier, total
privatenonagricultural 3
Currentdollars
6.98.54.75.04.32.11.92.53.2
4.12.84.24.13.33.9
4.23.54.14.53.33.54.2
1977dollars
-5.8-1.5-1.2
1.9.9
-1.4.4
-1.0-.9
.1j 2
-.0-.1-.9-.5
-.3-1.2-.8-.7
-2.0-1.6-.9
1 Also includes other private industry groups shown on p. 14.2 Current dollar earnings divided by the consumer price index for urban wage earners and clerical
workers (on a 1977 = 100 base).
3 Based on seasonally unadjusted data.
Source: Department of Labor, Bureau of Labor Statistics.
EMPLOYMENT COST INDEX—PRIVATE INDUSTRY[Not seasonally adjusted]
Period
1980: Dec1981: Dec....1982: Dec1983: Dec....1984: Dec1985: Dec....1986: Dec1987: Dec....1988: Dec....
1986: MarJune...SeptDec....
1987: Mar....June . . .Sept . . . .Dec....
1988: MarJuneSept...Dec
1989: Mar....June
Index (June 1981 = 100)
Totalcompensa-
tion
94.7104.0110.7117.0122.7127.5131.6136.0142.6
128.9129.0130.8131.6
132.9133.8135.1136.0
138.1139.8141.2142.6
144.4146.1
Wages andsalaries
95.4103.8110.3115.8120.6125.6129.5133.8139.3
126.8129.9128.8129.5
130.8131.7133.0133.8
135.1136.6137.9139.3
140.8142.2
Benefits 1
93.0104.3111.7120.0127.9132.4136.9141.7151.3
134.2134.8136.1136.9
138.1139.3140.3141.7
146.1148.2149.7151.3
154.0156.5
Percent change from
3 months earlier
Totalcompensa-
tion
2.12.01.31.21.3.6.6.7
1.0
1.1.8.7.6
1.0.7
1.0.7
1.51.21.01.0
1.31.2
Wages andsalaries
2.01.81.21.11.2.6.5.6
1.0
1.0.9.7.5
1.0.7
1.0.6
1.01.11.01.0
1.11.0
Benefits *
2.22.31.51.31.4.5.6
1.01.1
1.4.4
1.0.6
.9
.9
.71.0
3.11.41.01.1
1.81.6
12 months earlier
Totalcompensa-
tion
9.89.86.45.74.93.93.23.34.9
3.83.83.23.2
3.13.03.33.3
3.94.54.54.9
4.64.5
Wages andsalaries
9.08.86.35.04.14.13.13.34.1
3.93.73.13.1
3.23.03.33.3
3.33.73.74.1
4.24.1
Benefits *
11.812.27.17.46.63.53.43.56.8
3.23.53.33.4
2.93.33.13.5
5.86.46.76.8
5.45.6
1 Employer costs for employee benefits.NOTE.—The employment cost index is a measure of the change in the cost of labor, free from the
influence of employment shifts among occupations and industries.
Data exclude farm and household workers.
Source: Department of Labor, Bureau of Labor Statistics.
15
Digitized for FRASER http://fraser.stlouisfed.org/ Federal Reserve Bank of St. Louis

PRODUCTIVITY AND RELATED DATA, BUSINESS SECTOR
Period
198019811982 .. .19831984
1985198619871988
1982: IV r....1983: IV r....1984: IV r....1985: IVr....
1986: m T....IV '....
1987: I r
n r.mr....IV r....
1988: I 'n r.m r....IV r....
1989: I r
HP
19801981198219831984
1985198619871988 ...
1982: IV T ....1983: IV r ....1984: IV r ....1985: IV r....
1986: HIr....IV r ....
1987: I r
n r.mr....ivr
1988: Ir
nr.nir
IV
1989: Ir
n p
Output per hour ofall persons
Businesssector
Nonfarmbusinesssector
Output *
Businesssector
Nonfarmbusinesssector
Hours of allpersons 2
Businesssector
Nonfarmbusiness
sector
Compensation perhour 3
Businesssector
Nonfarmbusinesssector
Real compensationper hour 4
Businesssector
Nonfarmbusinesssector
Unit labor costs
Businesssector
Nonfarmbusinesssector
Implicit pricedeflator 5
Businesssector
Nonfarmbusinesssector
1977 = 100; quarterly data seasonally adjusted
99.4101.0100.2102.6105.2
107.3109.8111.1113.1
100.9103.5105.7108.4
109.6109.8
109.9110.7111.7112.5
113.3112.7113.6113.6
113.9114.2
99.0100.099.1
102.0104.2
105.6107.7108.9111.2
99.5103.0104.5106.2
107.5107.6
107.7108.6109.5110.3
111.1110.7111.6112.1
111.8111.8
106.7108.9105.5109.9119.2
124.2128.0133.4140.0
105.0113.6120.8125.9
127.7128.9
130.4132.2134.4136.7
138.2139.3140.7141.9
143.6144.0
106.7108.5104.9110.1119.2
123.9127.6133.1140.3
104.2114.1120.7125.5
127.2128.4
130.0132.0134.1136.4
138.0139.5141.1142.8
143.6144.2
107.3107.9105.3107.2113.3
115.7116.6120.1123.8
104.1109.7114.3116.2
116.5117.4
118.6119.5120.3121.5
122.0123.6123.9124.9
126.0126.2
107.8108.5105.9108.0114.4
117.4118.4122.2126.2
104.7110.8115.5118.1
118.3119.3
120.7121.6122.4123.7
124.3126.1126.4127.3
128.5129.0
131.8144.1154.9160.8167.4
174.8183.8191.0200.4
158.2163.2169.9178.6
185.1187.4
188.2189.5191.8195.2
196.5199.3202.2204.8
207.2210.5
131.6144.0154.7160.8167.2
174.0182.9189.8198.9
158.0162.9169.6177.5
184.1186.4
187.0188.3190.5193.9
195.1197.8200.5203.3
205.7208.5
97.096.197.397.897.6
98.4101.7101.9102.7
97.997.897.899.3
102.2102.8
101.9101.4101.7102.6
102.3102.7102.9103.1
103.0103.0
96.796.097.197.897.5
98.0101.1101.2101.9
97.897.697.698.7
101.7102.2
101.3100.7101.0101.9
101.6101.9102.1102.4
102.3102.0
132.6142.7154.5156.7159.1
162.8167.5171.9177.2
156.8157.7160.7164.9
168.9170.6
171.2171.3171.6173.5
173.5176.9178.1180.2
181.9184.4
132.9144.0156.1157.6160.4
164.9169.8174.2178.8
158.7158.2162.3167.1
171.2173.2
173.6173.4173.9175.8
175.7178.7179.6181.3
184.1186.4
127.6139.8148.1153.0158.2
162.2165.6170.0174.9
150.2155.2159.8163.7
166.7167.1
168.2169.6170.7171.3
171.9174.1175.8177.9
179.4181.5
127.8140.3149.2154.3159.0
163.8167.6172.0176.5
151.4156.2161.0165.5
168.8169.2
170.3171.4172.6173.4
173.8175.6177.0179.6
180.8182.9
Percent change; quarterly data at seasonally adjusted annual rates
-0.31.5
-.72.42.6
2.02.31.21.8
2.63.31.51.5
-1.6.8
.52.63.92.9
2.7-2.0
3.1.2
1.0.9
-0.41.1
-.93.02.1
1.32.01.12.1
2.01.6.9.8
-1.7.3
.43.33.62.7
3.0-1.5
3.41.9
-1.3.2
-1.12.13 14.28.4
4.23.14.24.9
-.510.43.53.6
.84.0
4.75.66.77.1
4.43.34.03.4
4.81.4
1 21.7
-3.35.08.3
3.93.04.45.4
-1.29.83.13.5
.73.7
5.26.16.67.0
4.84.44.64.8
2.41.7
-0.8.6
-2.41.85.7
2.2.8
3.03.1
-3.06.82.02.1
2.53.2
4.32.92.74.1
1.75.4
.93.2
3.8.4
0 7.6
-2.42.06.0
2.6.9
3.23.2
-3.18.12.22.7
2.53.4
4.82.82.94.2
1.85.91.22.8
3.81.5
10.59.37.53.84.1
4.45.23.94.9
4.15.73.56.3
4.65.0
1.92.74.87.4
2.85.95.85.2
4.86.6
10.59.57.44.03.9
4.15.13.74.8
4.64.43.55.8
4.65.0
1.42.74.87.3
2.75.55.55.9
4.85.5
2 6-.91.2
.6-.2
.83.3
.2
.8
2.81.6.0
2.1
2.22.1
-3.3-2.0
1.13.6
-.81.31.0.7
-.6.3
2 67
1.1.7
-.4
.53.2.1.7
3.3.3.0
1.6
2.22.1
-3.8-2.1
1.13.5
O
.9
.81.4
-.6- .9
10.97.78.31.41.5
2.32.82.63.1
1.52.32.04.8
6.44.2
1.4.1.9
4.3
.18.12.65.0
3.75.7
11.08.38.41.01.8
2.83.02.62.7
2.62.82.65.0
6.54.7
1.0-.61.24.5
-.37.12.03.9
6.25.2
9.09.65.93.33.3
2.52.12.62.9
2.44.82.72.6
4.91.0
2.53.42.61.4
1.55.14.14.8
3.34.9
9.79.76.33.53.0
3.02.32.62.7
3.03.13.32.1
5.11.0
2.82.53.01.7
1.04.33.25.9
2.84.8
1 Output refers to gross domestic product originating in the sector in 1982 dollars.2 Hours of all persons engaged in the sector, including hours of proprietors and unpaid family
workers. Estimates based primarily on establishment data.3 Wages and salaries of employees plus employers' contributions for social insurance and private
benefit plans. Also includes an estimate of wages, salaries, and supplemental payments for the self-employed.
4 Hourly compensation divided by the consumer price index for all urban consumers.5 Current dollar gross domestic product divided by constant dollar gross domestic product.
NOTE,—Data relate to all persons engaged in the sector.Percent changes are from preceding period and are based on original data; they therefore may
differ slightly from percent changes based on indexes shown here.Data reflect revisions beginning 1986 of GNP and related items published July 27, 1989. In
addition, hours of labor input have been redefined as hours at the work site (rather than hours paid),affecting all labor input series back to 1947 (1958 for nonfmaneial institutions); the labor inputseries also reflect the regular benchmarking of nonagricultural establishment data in June 1989.
Source: Department of Labor, Bureau of Labor Statistics.
16
Digitized for FRASER http://fraser.stlouisfed.org/ Federal Reserve Bank of St. Louis

PRODUCTION AND BUSINESS ACTIVITYINDUSTRIAL PRODUCTION AND CAPACITY UTILIZATIONIndustrial production rose in July and capacity utilization was unchanged; both had declined in June and May.
INDEX, 1977=100* (RATIO SCALE)
160
140
120
100
160
140
120
100
140
120
100
TOTAL INDUSTRIAL PRODUCTION
I l l l l l l l l l l I l l l l l l l l l l I l l l l l l l l l l
MANUFACTURING PRODUCTION
DURABLE'
UTILITIES AND MINING PRODUCTION
INDEX, 1977=100* (RATIO SCALE)240
FINAL PRODUCTS
SPACE
r -
^-"'
«— »_ I—',/"* -"-„ „ ._ .,
Illllllllll
BUSINESSEQUIPMENT
— C"CONSUMER
GOODS
Illllllllll
EQUIPMENT"-' ..\ .-
— ̂
r^.-'-"'
i iMiinii i
^-
IIIUllllll
220
200
180
160
140
120
100
PERCENT*100
90
80
70
1985•SEASONAUY ADJUSTEDSOURCE: BOARD OF GOVERNORS OF THE FEDERAL RESERVE SYSTEM
1989
CAPACITY UTILIZATION RATE(TOTAL INDUSTRY)
M H
Illllllllll1985
"̂ 1
llll|l|l||l
1986
^~~\
Illllllllll1987
_- — „ —
Illllllllll1988
-
Illllllllll1989
COUNCIL OF ECONOMIC ADVISERS
[Monthly data seasonally adjusted]
Period
1977 proportion
198019811982198319841985198619871988 . . .
1988: July
SeptOctNovDec
1989- JanFebMarApr r
May r ..June r.July p
Totalindustrial
production
Index,1977 = 100
100.0108.6111.0103.1109.2121.4123.7125.1129.8137.2
138.0138.5138.6139.4139.9140.4
140.8140.5140.7141.7141.6141.4141.7
Percentchange
from yearearlier
-1.92.2
-7.15.9
11.21.91.13.85.7
5.75.55.75.25.14.9
4.84.54.44.74.03.62.7
Industry production indexes, 1977 = 100
Manufacturing
Total
84.21108.2110.5102.2110.2123.4126.4129.1134.7142.7
143.6144.0144.4145.3145.8146.3
147.2146.8147.0148.0148.0148.1148.3
Durable
49.10109.1111.199.9
107.7124.2127.6128.4133.1141.9
142.9143.2143.8144.6145.2145.7
146.2145.9145.8146.9146.9146.8146.7
Nondurable
35.11107.0109.7105.5113.7122.3124.6130.1136.8143.9
144.6145.1145.3146.3146.7147.1
148.5148.1148.6149.6149.6149.9150.6
Mining
9.83112.4117.5109.3102.9111.1108.9100.4100.7103.4
104.3103.8103.7103.1104.7104.9
103.0100.9101.5102.4101.6100.4100.7
Utilities
5.96107.3107.1104.8105.2110.7111.1108.5110.3114.3
114.4117.8113.0113.9113.7115.4
114.0116.5117.5117.1116.3114.9115.8
Capacity utilizationrate, percent *
Totalindustry
80.979.972.174.681.080.479.480.783.3
83.783.883.784.084.184.3
84.383.983.884.283.983.683.6
Manufac-turing
79.378.270.373.980.580.179.781.183.5
84.084.084.084.384.484.4
84.784.384.184.584.284.083.9
1 Output as percent of capacity. Source: Board of Governors of the Federal Reserve System.
17
Digitized for FRASER http://fraser.stlouisfed.org/ Federal Reserve Bank of St. Louis
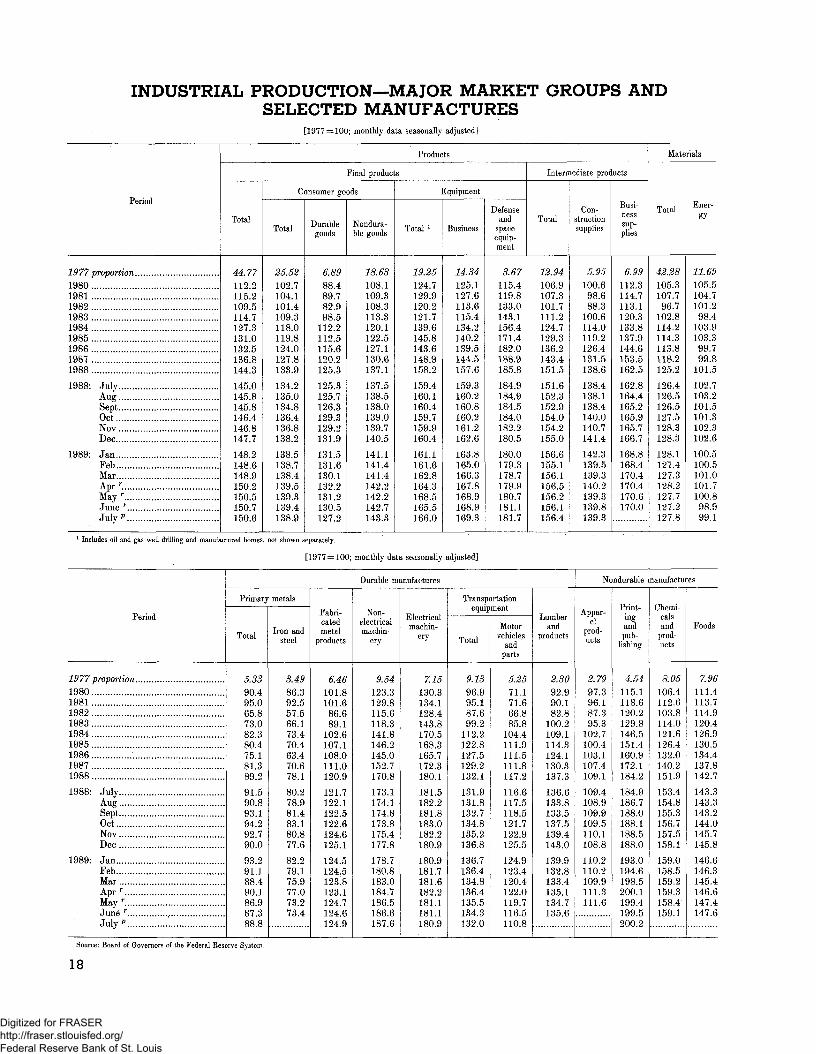
INDUSTRIAL PRODUCTION—MAJOR MARKET GROUPS ANDSELECTED MANUFACTURES
[1977 = 100; monthly data seasonally adjusted]
Period
1980198119821983198419851986 .19871988.
1988: July
SeptOctNovDec
1989- JanFebMarApr r
May r
July"
Products
Final products
Total
44.77112.2115.2109.5114.7127.3131.0132.5136.8144.3
145.0145.8145.8146.4146.8147.7
148.2148.6148.9150.2150.5150.7150.6
Consumer goods
Total
25.52102.7104.1101.4109.3118.0119.8124.0127.8133.9
134.2135.0134.8136.4136.8138.2
138.5138.7138.4139.5139.3139.4138.9
Durablegoods
6.8988.489.782.998.5
112.2112.5115.6120.2125.3
125.3125.7126.3129.3129.2131.9
131.5131.6130.1132.2131.2130.5127.2
Nondura-ble goods
18.63108.1109.3108.3113.3120.1122.5127.1130.6137.1
137.5138.5138.0139.0139.7140.5
141.1141.4141.4142.2142.2142.7143.3
Equipment
Total '
19.25124.7129.9120.2121.7139.6145.8143.6148.9158.2
159.4160.1160.4159.7159.9160.4
161.1161.6162.8164.3168.5165.5166.0
Business
14.34125.1127.6113.6115.4134.2140.2139.5144.5157.6
159.3160.2160.8160.2161.2162.6
163.8165.0166.3167.8168.9168.9169.3
Defenseand
spaceequip-ment
3.67115.4119.8133.0143.1156.4171.4182.0188.9185.8
184.9184.9184.5184.0182.2180.5
180.0179.3178.7179.9180.7181.1181.7
Intermediate products
Total
12. 94106.9107.3101.7111.2124.7129.3136.2143.4151.5
151.6152.3152.9154.0154.2155.0
156.6155.1156.1156.5156.2156.1156.4
Con-structionsupplies
5.95100.6
98.688.3
100.6114.0119.2126.4131.5138.6
138.4138.1138.4140.0140.7141.4
142.3139.5139.3140.2139.3139.8139.3
Busi-nesssup-plies
6.99112.3114.7113.1120.3133.8137.9144.6153.5162.5
162.8164.4165.2165.9165.7166.7
168.8168.4170.4170.4170.6170.0
Materials
Total
42.28105.3107.7
96.7102.8114.2114.3113.8118.2125.2
126.4126.5126.5127.5128.3128.3
128.1127.4127.3128.2127.7127.2127.8
Ener-gy
11.69105.5104.7101.2
98.4103.9103.3
99.799.8
101.5
102.7103.2101.5101.3102.3102.6
100.5100.5101.0101.7100.8
98.999.1
1 Includes oil and gas well drilling and manufactured homes, not shown separately.
[1977 = 100; monthly data seasonally adjusted]
Period
1977 proportion198019811982198319841985198619871988.
1988: July..AueSept.OctNovDec
1989: JanFebMar .Apr T
May r
June r
July11
Durable manufactures
Primary metals
Total
5.3390.495.065.873.082.380.475.181.389.2
91.590.893.194.292.790.0
93.291.188.490.186.987.388 8
Iron andsteel
3.4986.392.557.566.173.470.463.470.678.1
80.278.981.483.180.877.6
82.279.175.977.073.2ISA
Fabri-catedmetal
products
6.46101.8101.6
86.689.1
102.6107.1108.0111.0120.9
121.7122.1122.5122.6124.6125.1
124.5124.5123.8123.1124.7124.6124.9
Non-electricalmachin-
ery
9.54123.3129.8115.6118.3141.8146.2145.0152.7170.8
173.1174.1174.8173.8175.4177.8
178.7180.8183.0184.7186.5186.6187.6
Electricalmachin-
ery
7.15130.3134.1128.4143.8170.5168.3165.7172.3180.1
181.5182.2181.8183.0182.2180.9
180.9181.7181.6182.2181.1181.1180.9
Transportationequipment
Total
9.1396.995.187.699.2
112.2122.8127.5129.2132.1
131.9131.8132.7134.8135.2136.8
136.7136.4134.8136.4135.5134.3132.0
Motorvehicles
andparts
5.2571.171.666.885.8
104.4111.9111.5111.8117.2
116.6117.5118.5121.7122.9125.5
124.9123.4120.4122.0119.7116.5110.8
Lumberand
products
2.3092.990.182.8
100.2109.1114.3124.1130.3137.3
136.6133.8133.5137.5139.4143.0
139.9132.8133.4135.1134.7135.6
Nondurable manufactures
Appar-el
prod-ucts
2.7997.396.187.395.3
102.7100.4103.1107.4109.1
109.4108.9109.9109.5110.1108.8
110.2110.2109.9111.3111.6
ingandpub-
lishing
4.54115.1118.6120.2129.8146.5151.4160.9172.1184.2
184.9186.7188.0188.1188.5188.0
193.0194.6198.5200.1199.4199.5200 2
Chemi-calsand
prod-ucts
8.05106.4112.6103.8114.0121.6126.4132.0140.2151.9
153.4154.8155.3156.7157.5158.1
159.0158.5159.2159.3158.4159.1
Foods
7.96111.4113.7114.9120.4126.9130.5134.4137.8142.7
143.3143.3143.2144.0145.7145.8
146.6146.3145.4146.6147.4147.6
Source: Board of Governors of the Federal Reserve System.
18
Digitized for FRASER http://fraser.stlouisfed.org/ Federal Reserve Bank of St. Louis

NEW CONSTRUCTION[Monthly data seasonally adjusted]
Period
1979...19801981....19821983.19841985...19861987....1988
1988- JuneJuly
SeptOctNovDec
1989- JanFebMar
May 'June ".July"
Total newconstructionexpenditures
Private
Total
Residential
Total ' New housingunits
Commercialand
industrial 2Other
Federal,State, and
local
Billions of dollars
253.0252.8261.3248.0282.4329.6356.6387.0397.7409.7
408.7410.7408.1411.5411.1415.4425.0
424.8418.5419.2415.8418.2414.7
201.3194.3204.7194.3228.7271.9292.6315.3320.1328.7
328.0328.1329.2329.8331.4332.8336.3
339.5335.0340.4335.4333.5334.0
116.4100.4
99.284.7
125.5153.8158.5187.1194.7198.1
196.2196.8197.6198.3200.8202.0202.5
204.7202.3204.5204.0200.2197.9
89.369.669.457.094.6
113.8114.7133.2139.9138.9
42.046.755.058.753.868.682.778.076.579.8
Annual rates
137.5137.0137.0138.0139.8141.9143.3
145.6145.3143.2142.0138.3136.6
82.081.480.679.779.178.880.6
82.581.184.279.480.382.7
42.847.250.550.949.349.451.450.248.950.8
51.758.556.553.753.857.764.171.777.680.9
49.949.951.051.951.551.953.2
52.251.651.852.053.053.4
80.882.578.981.779.782.688.8
85.383.478.780.484.780.6
Construction contracts 3
Total valueindex
(1982=100)
10997
100100124136150158164161
169160162157164158163
155148150163159157163
Commercialand industrial
floor space(millions ofsquare feet)
1,059904919690756955
1,0971,0161,019
942
Annual rates
904954905880841839942
943850856836905938933
1 Includes residential improvements, not shown separately.2 Includes hotels and motels.3 F.W. Dodge series.
Sources: Department of Commerce (Bureau of the Census) and McGraw-Hill Information SystemCompany, F.W. Dodge Division.
NEW PRIVATE HOUSING AND VACANCY RATES[Thousands of units or homes, except as noted]
Period
1979198019811982198319841985198619871988
1988- July
SeptOctNovDec
1989- JanFebMar
July p
New private housing units
Units started, by type of structure
Total
1,745.11,292.21,084.21,062.21,703.01,749.51,741.81,805.41,620.51,488.1
1,4781,4591,4631,5321,5671,577
1,6781,4651,4091,3431,3081,4191,430
1 unit
1,194.1852.2705.4662.6
1,067.61,084.21,072.41,179.41,146.41,081.3
1,0671,0761,0391,1361,1381,141
1,1991,029
9811,029
977979
1,041
2-4 units
122.0109.591.180.0
113.5121.493.484.065.358.8
5 or more units
429.0330.5287.7319.6522.0544.0576.1542.0408.7348.0
Seasonally adjusted annu
505962636865
66625062425659
361324362333361371
413374378252289384330
Unitsauthorized
1,551.81,190.6
985.51,000.51,605.21,681.81,733.31,769.41,534.81,455.6
al rates
1,4251,4661,4321,5261,5081,518
1,4861,4031,2301,3341,3471,3081,281
Unitscompleted
1,870.81,501.61,265.71,005.51,390.31,652.21,703.31,756.41,668.81,529.8
1,5281,5391,5361,5161,4291,539
1,5371,6101,459
r 1,5521,4411,332
New private homes
Homes sold
709545436412623639688750671676
701712691718650669
700621
r555r607646646739
Homes forsale at end of
period i
3 397337275253301353346357365366
365363361353364366
369375377377381379371
Vacancy ratefor rental
housing units(percent) 2
5.45.45.05.35.75.96.57.37.77.7
7.8
7.3
7.3
7.3
1 Seasonally adjusted.2 Quarterly data entered in last month of quarter, i
with earlier data.3 New series beginning March 1979.
eries beginning 1979 not strictly comparableNOTE. — Beginning 1984, units authorized are for 17,000 permit-issuing places; for 1978-83 data
are for 16,000 places.Source: Department of Commerce, Bureau of the Census.
19
Digitized for FRASER http://fraser.stlouisfed.org/ Federal Reserve Bank of St. Louis

BUSINESS SALES AND INVENTORIES—Manufacturing and TradeIn June, manufacturing and trade sales fell 0.4 percent and inventories rose $3.1 billion. In July, according toadvance data, retail sales rose 0.9 percent, following a decline of 0.1 percent in June.
BILLIONS OF DOLLARS* (RATIO SCALE)
800
700
600
500
400
300
200
- ^_^— -
-
-
-
-
imiliim1985
,^~*~1^
MANTR/
* *
MAt
iimliim1986
UFACTURIN
kDE INVENTC
y-\"*NUFACTUR
-JD TRADE S/
miilum1987
3 AND>RIES
_ s~~~*
W-UES
Illllllllll
1988
-^ -
-
-
-
-
Illllllllll
1989
"RETAIL INVENTORIES
BILLIONS OF DOLLARS* (RATIO SCALE)
240
220
200
180
160
140
120
100
Illllllllll
• RETAIL SALES-
RATIO*1.80
1.60
1.40
1.20
1.00
_ INVENTORY-SALES RATIO RETA|L
* .. -!TV..--V.'
-
1 1 1 1 1 1 1 1 1 1 1
1985
r^vv
iiiniiiiii1986
'^z^^ »» ' -'"
^T-x~~ -
MANUFACTURINGAND TRADE
T 1 1 1 1 1 1 1 1 1 11987
1 1 1 1 1 1 1 1 1 j f1988
iiii|liiiu1989
•SEASONALLY ADJUSTEDSOURCE: DEPARTMENT OF COMMERCE COUNCIL OF ECONOMIC ADVISERS
Period
198219831984.1985198619871988.
1988: June r
JulyAUE . . ..SeptGetNovDec
1989' JanFebMarAprMay r
June "July ".
Manufacturing andtrade '
Sales a Inven-tories 3
Wholesale
Sales 2 Inven-tories 3
Eetail
Sales 2
TotalDurablegoodsstores
Nondura-ble goods
stores
Inventories 3
TotalDurablegoodsstores
Nondura-ble goods
stores
Millions of dollars, seasonally adjusted
348,747368,813407,869418,151423,700449,536485,756
486,226r486,102492,491492,478498,846501,400506,186
511,881507,328507,555517,745518,088515,769
574,491590,358644,306655,066653,853700,761753,718
724,515729,903737,562744,054743,544746,756753,718
759,803763,051765,504771,340778,093781,171
96,290100,244113,195114,315115,677123,581132,361
132,285133,833134,726135,332138,087137,239136,170
140,356139,547139,991142,290142,474142,046
128,196130,334142,380146,745152,447162,648178,313
172,079174,581176,368176,972177,408177,060178,313
179,761179,810179,681181,226182,615182,737
89,10797,328
106,805113,821119,663126,785135,763
135,060" 135,571
136,050135,751137,842139,529139,189
140,040139,428139,516141,413142,543
r 142,440143,731
28,01332,57437,81941,38744,86147,70752,379
52,372r52,22751,93151,42752,72553,93054,154
53,81553,07152,88653,90154,139' 53,65554,571
61,09364,75468,98572,43474,80279,07783,384
82,688r 83,34484,11984,32485,11785,59985,035
86,22586,35786,63087,51288,404
T 88,78589,160
134,468147,377167,159180,825185,224206,981221,242
210,473211,534215,396219,297216,724218,093221,242
222,584224,185224,693226,656230,423231,888
61,46968,98479,25788,60890,477
106,271114,994
106,869107,443110,146114,303111,689112,904114,994
115,704116,169115,993117,093118,835119,548
72,99978,39387,90292,21794,747
100,710106,248
103,604104,091105,250104,994105,035105,189106,248
106,880108,016108,700109,563111,588112,340
Inventory-sales ratio 4
Manufac-turing
andtrade '
1.671.561.531.551.551.511.50
1.491.501.501.511.491.491.49
1.481.501.511.491.501.51
Retail
1.491.441.491.531.561.561.57
1.561.561.581.621.571.561.59
1.591.611.611.601.621.63
1 See page 21 for manufacturing.2 Monthly average for year and total for month.3 End of period.
4 Annual data are averages of monthly ratios.
Source: Department of Commerce, Bureau of the Census.
20
Digitized for FRASER http://fraser.stlouisfed.org/ Federal Reserve Bank of St. Louis

MANUFACTURERS' SHIPMENTS, INVENTORIES, AND ORDERSIn June, manufacturers' shipments fell while inventories and orders rose. In July, according to advance data,durable goods shipments and new orders fell.
BILLIONS OF DOLLARS* (RATIO SCALE) BILLIONS OF DOLLARS* (RATIO SCALE)
280240
200
160
120
80
60
TOTAL
DURABLE GOODS
NONDURABLE GOODS
I l l l l l l l l l l
BILLIONS OF DOLLARS* (RATIO SCALE)
240
200
160
120
80
60
.
NEW ^PDEPS
^-^— i
Illllllllll1985
SEASONALLY ADJ
OURCE; DEPARTM
-r \| TOTAL
1DURABLE GOOD
^^
S A...̂ -''
__ J .-"'U--"t"1 -
iiintiiiii imiimii1986 1987
USTED
ENT OF COMMERCE
Illllllllll
1988
•».̂ ...
._--
Illllllllll
1989
440400360
280
200
160
120
80
60,
INVENTORIES
,_
MM, In,,,
DL
"kTOTAL
1 ^RABLE GOO
— v~NONDURABLE C
Illllllllll Illllllllll
. — —
OS
5OODS
Illllllllll
, — • —
Illllllllll
RATIO2.20
2.00
1.80
1.60
1.40
1.20
*
INVENTORY-SHIPMENTS RATIO
^
M 1 I 1 1 1 I t 1 1
1985
^
1 1 1 1 1 1 1 1 [ H
19861 1 M 1 1 I \ | | I
1987
-
mill
1988
r̂ "̂
1 1 1 1 1 1 1 1 1 1 1
1989
COUNCIL OF ECONOMIC ADVISERS
Period
1982 .19831984. .19851986.19871988
1988: JuneJulyAutrSeptOctNovDec
1989: JanFeb .. .MarAprMay 'June 'July p
Manufacturers' shipments l
Total Durablegoods
Nondura-ble goods
Manufacturers' inventories 2
Total Durablegoods
Nondura-ble goods
Manufacturers' new orders 1
Total
Durable goods
Total
Capitalgoods
industries,non-
defense
Nondura-ble goods
Manufac-turers'unfilledorders 2
Millions of dollars, seasonally adjusted
163,350171,242187,869190,016188,360199,170217,632
218,881216,698221,715221,395222,917224,632230,827
231,485228,353228,048234,042233,071231,283
79,35284,95696,62399,01999,989
105,291115,684
116,522113,122117,866118,030118,439119,874124,175
123,578120,924120,432123,331122,962
r!21,771118 161
83,99886,28691,24690,99688,37193,879
101,948
102,359103,576103,849103,365104,478104,758106,652
107,907107,429107,616110,711110,109109,512
311,827312,647334,767327,496316,182331,132354,163
341,963343,788345,798347,785349,412351,603354,163
357,458359,056361,130363,458365,055366,546
200,825200,406218,771214,066208,313216,598233,666
224,000225,467226,600228,214229,735231,766233,666
236,810238,165239,330240,486241,689242,312
111,002112,241115,996113,430107,869114,534120,497
117,963118,321119,198119,571119,677119,837120,497
120,648120,891121,800122,972123,366124,234
162,273174,122189,791190,918188,663201,966221,627
228,090219,877227,009222,669227,095228,153238,886
236,075231,306233,011239,907233,753235,254
78,33887,60098,58199,843
100,166107,770119,634
125,442116,112122,806119,321122,791123,035132,149
128,479124,107125,377129,372123,524
" 125,233122,896
21,66122,09826,24327,06726,55129,70735,028
35,45836,21338,80834,85834,62335,82539,432
40,35237,18938,13740,38937,290
r39,17941,142
83,93586,52291,20991,07588,49794,197
101,993
102,648103,765104,203103,348104,304105,118106,737
107,596107,199107,634110,535110,229110,021
314,270349,419372,586383,181387,065421,243468,860
443,357446,536451,830453,103457,281460,802468,860
473,450476,403481,366487,231487,913491,884
Manufac-turers'inven-tory —
shipmentsratio 3
1.951.801.741.741.701.621.58
1.561.591.561.571.571.571.53
1.541.571.581.551.571.58
1 Monthly average for year and total for month. Shipments are the same as sales.2 End of period.
3 Annual data are averages of monthly ratios.
Source: Department of Commerce, Bureau of the Census.
21
Digitized for FRASER http://fraser.stlouisfed.org/ Federal Reserve Bank of St. Louis

PRICESPRODUCER PRICESIn July, the producer price index for all finished goods fell 0.4 percent. Prices of finished consumer foods rose 0.1percent and prices of other finished consumer goods fell 0.9 percent. Capital equipment prices were unchanged.
INDEX, 1982 = 100 (RATIO SCALE)
120
110
100
90
80
INDEX, 1982=100 (RATIO SCALE)
120SEASONALLY ADJUSTED /-|~>M«I UACD
FINISHED GOODS PRICES CONSUMERFOODS ..
CAPITAL EQUIPMENT
_,--,
—
—/ fS
/
—
Illllllllll
1981
"' "*"
Illllllllll
1982
c*""l̂ S2«i
Illllllllll
1983
&z£^\^^
iiiiiiiiin1984
''^-^S-../'-v
niiiiiiiii1985
•""' / ^
^C^\
*v"\ *..'
Illllllllll1986
*./ *
^..
' \ 'CONSUMER CEXCLUDING F
||||ll|llll
1987
/
sf^
TOTAL ;
^ — r~~~
»OODSOODS
Illllllllll
1988
/'>•-
/**
/ \
—
—
—
Illllllllll
1989
SOURCE. DEPARTMENT OF LABOR COUNCIL OF ECONOMIC ADVISER:
110
100
90
80
[1982 = 100; monthly data seasonally adjusted]
Period
198019811982198319841985198619871988
1988- JulyAue:SeptOctNovDec
1989- JanFebMar r
May
July
Finished goods
Totalfinishedgoods
88.096.1
100.0101.6103.7104.7103.2105.4108.0
108.2108.5109.1109.2109.5109.9
111.1112.1112.6113.1114.1114.0113.5
Con-sumerfoods
92.497.8
100.0101.0105.4104.6107.3109.5112.6
112.9113.6114.6114.7115.1115.2
116.7117.8118.8118.2119.2118.2118.3
Finished goods excluding consumer foods
Total
86.795.6
100.0101.8103.2104.6101.9104.0106.5
106.6106.9107.3107.4107.7108.2
109.3110.1110.5111.4112.4112.6111.9
Consumer goods
Total
87.196.1
100.0101.2102.2103.398.5
100.7103.1
103.3103.5103.7103.8104.1104.7
106.0107.1107.5109.0110.2110.1109.1
Durable
91.096.4
100.0102.8104.5106.5108.9111.5113.8
113.9114.5115.1115.0115.0115.4
116.3116.9117.0116.3117.2117.4117.1
Nondurable
85.195.8
100.0100.5101.1101.793.394.997.3
97.697.697.697.898.398.9
100.4101.6102.2104.5105.8105.6104.3
Capitalequip-ment
85.894.6
100.0102.8105.2107.5109.7111.7114.3
114.3114.7115.7115.6115.8116.2
116.9117.4117.5117.4117.9118.7118.7
Totalfinished
con-sumergoods
88.696.6
100.0101.3103.3103.8101.4103.6106.2
106.5106.8107.3107.4107.8108.2
109.5110.6111.2112.0113.2112.8112.1
Intermediate materials
Total
90.398.6
100.0100.6103.1102.799.1
101.5107.1
107.9108.2108.6108.6109.0109.5
110.8111.3111.9112.5112.6112.4112.2
Foodsand
feeds '
105.5104.6100.0103.6105.797.396.299.2
109.5
115.9114.9115.3115.1113.2112.3
115.2114.8116.7115.2113.6111.8113.6
Other
89.498.2
100.0100.5103.0103.099.3
101.7106.9
107.4107.8108.2108.3108.8109.4
110.5111.1111.7112.3112.6112.4112.1
Crude materials
Total
95.3103.0100.0101.3103.595.887.793.796.0
96.697.297.196.694.897.8
101.8101.5103.7104.2105.1103.0103.2
Food-stuffsand
feed-stuffs
104.6103.9100.0101.8104.794.893.296.2
106.1
108.3110.9113.1113.4108.8110.8
113.3111.7115.2111.9112.3109.4108.2
Other
84.6101.8100.0100.7102.296.981.687.985.5
85.284.483.182.082.185.6
90.290.792.194.896.094.595.4
1 Intermediate materials for food manufacturing and feeds. Source: Department of Labor, Bureau of Labor Statistics.
22
Digitized for FRASER http://fraser.stlouisfed.org/ Federal Reserve Bank of St. Louis

CONSUMER PRICES—ALL URBAN CONSUMERSIn July, the consumer price index for all urban consumers rose 0.2 percent, seasonally adjusted and not seasonallyadjusted. The index was 5.0 percent above its year-earlier level.
INDEX, 1982-84=100 (RATIO SCALE)
130
120
110
100
90
80
70
60
SEASONALLY ADJUSTED
INDEX, 1982-84=100 (RATIO SCALE)
130
120
- CONSUMER PRICES—ALL ITEMS -
V
III1981 1982 1983 1984 1985 1986
1 1 1
1987
Hil l
1988
Illlll
110
100
90
80
70
601989
SEE NOTE ON TABLE BELOWSOURCE: DEPARTMENT OF LABOR COUNCIL OF ECONOMIC ADVISERS
[1982-84 = 100, except as noted; monthly data seasonally adjusted, except as noted]
Period
Rel. imp.3....1980198119821983198419851986198719881988:
JulyAueSeptOct.. .NovDec....
1989:JanFebMarAprMay..
July ... .
All items *
Notseason-
allyadjust-
ed(NSA)
100.0
82.490996.5996
103.91076109.6113.6118.3
118.5119.0119.8120.2120.3120.5
121.1121.6122.3123.1123.8124.1124.4
Sea-son-ally
adjust-ed
118.6119.0119.5120.0120.3120.7
121.4121.9122.5123.3124.0124.2124.5
Food
16.286.893.697.499.4
103.2105.6109.0113.5118.2
118.9119.5120.3120.6120.8121.2
122.1122.6123.6124.2125.0125.3125.7
Housing
Total '
42.381.190.496.999.5
103.6107.7110.9114.2118.5
118.5118.9119.3119.6120.1120.6
120.9121.3121.7121.8122.3122.6123.3
Shelter
Total
27.881.090.596.999.1
104.0109.8115.8121.3127.1
127.0127.6128.1128.3128.9129.4
129.7130.3131.1131.2131.8132.3133.2
Rent-ers'
costs(Dec.
1982 =100)
7.9
103.0108.6115.4121.9128.1133.6
133.4133.8133.8134.1134.2134.9
135.2136.4138.2137.3137.3138.1140.2
Home-own-ers'
costs(Dec.
1982 =100)
19.7
102.5107.3113.1119.4124.8131.1
131.2131.9132.5132.7133.5133.9
134.2134.7135.1135.6136.5136.9137.5
Mainte-nanceand
repairs(NSA)
0.282.490.796.499.9
103.7106.5107.9111.8114.7
114.5115.0115.3115.0115.4115.8
116.1117.1117.1117.3117.4118.3118.4
Fueland
otherutili-ties
7.675.486.494.9
100.2104.8106.5104.1103.0104.4
104.0104.0104.4105.1105.5106.3
106.9106.7106.9107.4107.6107.1107.6
Appar-el andupkeep
6.490.995.397.8
100.2102.1105.0105.9110.6115.4
115.7113.9116.0117.4117.4117.7
117.7117.5119.1119.4120.4119.1118.1
Transportation
Total *
17.283.193.297.099.3
103.7106.4102.3105.4108.7
108.7109.6109.7110.1110.4110.4
111.2111.9112.6115.0116.1115.9115.2
Newcars
4.388.493.797.499.9
102.8106.1110.6114.6116.9
116.7117.0117.7117.8117.9118.1
118.9119.3119.7119.8119.6119.3118.8
Motorfuel
3.197.4
108.5102.899.497.998.777.180.280.9
81.382.882.081.381.179.7
80.581.883.693.096.695.493.3
Medi-cal
care
6.074.982.992.5
100.6106.8113.5122.0130.1138.6
139.4140.0140.7141.6142.2142.9
144.0145.2145.9146.6147.6148.7149.8
Bner-gy2
7.386.097.799.299.9
100.9101.6
88.288.689.3
88.989.589.389.289.589.2
89.990.491.496.197.696.695.9
Allitemsless
food,shel-ter,and
energy
48.780.688.395.1
100.0105.0109.0112.7117.0121.9
122.2122.4123.0123.8124.2124.6
125.4125.8126.3126.6127.2127.4127.6
1 Includes items not shown separately.2 Household fuels—gas (piped), electricity, fuel oil, etc.—and motor fuel. Motor oil, coolant, etc.
also included through 1982.3 Relative importance, December 1988.
NOTE.—Data beginning 1983 incorporate a rental equivalence measure for homeownership costsand therefore are not strictly comparable with figures for earlier periods.
Data beginning 1987 and 1988 calculated on a revised basis.
Source: Department of Labor, Bureau of Labor Statistics. 23
Digitized for FRASER http://fraser.stlouisfed.org/ Federal Reserve Bank of St. Louis

CHANGES IN PRODUCER PRICES FOR FINISHED GOODS[Percent change from preceding period; monthly data seasonally adjusted, except as noted by NSA]
Period
198019811982198319841985198619871988
1988- JulyAugSeptOctNovDec
1989- JanPebMar '
May
July
Change from preceding period
Totalfinishedgoods
Consumer goods
Foods Exclud-ing foods
Capitalequip-ment
Change, Dec. to Dec., NSA
11.87.13.6
.61.71.82.32.24.0
7.51.52.02.33.5.6
2.82
5.7
14.18.64.2-.9
.82.1
-6.64.13.1
11.49.23.92.01.82.72.11.33.6
Change, month to month
0.6.3.6.1.3.4
1.1.9.4.4.9
-.1A
0.7.6.9.1.3.1
1.3.9.8
-.5.8
-.8.1
0.6.2.2.1.3.6
1.21.0.4
1.41.1
-.1-.9
0.3.3.9\
.2
.3
.6
.4
.1-.1
.4
.70
Change from 3 months earlier, annual rate
Totalfinishedgoods
4.24.25.73.73.73.0
7.19.8
10.27.47.35.11.4
Consumer goods
Poods
8.68.99.26.55.42.1
7.29.7
13.15.24.82.0
.3
Excludingfoods
2.42.44.02.02.33.9
8.812.011.111.812.110.0
.4
Capitalequipment
3.23.66.14.63.91.7
4.65.64.61.71.74.14.5
Change from 6 months earlier, annual rate
Totalfinishedgoods
3.44.04.44.03.94.3
5.46.76.57.38.67.64.4
Consumer goods
Foods
4.66.77.47.67.15.6
6.87.57.56.27.35.32.8
Excludingfoods
3.23.23.02.22.33.9
5.37.17.5
10.312.110.65.9
Capitalequipment
2.72.84.53.93.73.9
4.64.83.13.13.74.33.1
Changefromyear
earlier,total
finishedgoods
NSA
13.49.24.11.62.11.0
-1.42.12.5
2.52.62.73.03.34.0
4.55.35.55.66.25.95.0
Source: Department of Labor, Bureau of Labor Statistics.
CHANGES IN CONSUMER PRICES—ALL URBAN CONSUMERS[Percent change from preceding period; monthly data seasonally adjusted, except as noted by NSA]
Period
198019811982198319841985198619871988
1988: JulyAugSeptOctNovDec
1989: JanFebMar
MayJuneJuly
Allitems ' Food
Housing
Total '
Shelter
Total1Kent-erg'
costs
Home-owners'
costs
Fueland
otherutili-ties
Ap-parelandup-
keep
Transportation
Total ' Newcars
Motorfuel
Medi-cal
care
Ener-gy2
Allitemslessfood,
shelter,and
energy
Change, December to December, NSA
12.58.93.83.83.93.81.14.44.4
10.24.33.12.73.82.63.83.55.2
13.710.23.63.54.34.31.73.74.0
15.09.92.44.75.26.04.64.84.5
5.15.96.35.03.93.9
4.55.15.94.65.34.7
13.814.49.71.84.21.8
-5.61.62.9
6.83.51.62.92.02.8
.94.84.7
14.610.91.83.93.12.6596.13.0
7.46.81.53.42.53.45.91.82.1
18.89.4
-6.5-1.7-2.4
3.130 718.7
-2.1
9.912.511.06.46.16.87.75.86.9
18.011.91.3
-.5.2
1.819 78.2
.5
9.89.46.15.04.33.73.33.84.7
Change, month to month
0.4.3.4.4.3.3
.6
.4
.5
.7
.6
.2
.2
0.9.5.7.2.2.3
.7
.4
.8
.5
.6
.2
.3
0.3.3.3.3.4.4
.2
.3
.3
.1
.4
.2
.6
0.2.5.4.2.5.4
.2
.5
.6
.1
.5
.4
.7
0.3.3
0.2.1.5
.2.9
1.3-.70.6
1.5
0.3.5.5.2.6.3
.2
.4
.3
.4
.7
.3
.4
0.10
.4.7.4.8
.6-.2
.2
.5
.2-.5
.5
-0.2-1.6
1.81.20
.3
0— .21.4
.3
.8— 1.1-.8
0.3.8.1.4.3
0
.7.6.6
2.11.0
-.2-.6
0.1.3.6.1.1.2
.7
.3
.3
.1-.2-.3-.4
0.51.8
-1.0Q
2-1.7
1.01.62.2
11.23.9
-1.2-2.2
0.7.4.5.6.4.5
.8
.8
.5
.5
.7
.7.7
0.2.7
-.2— .1
.33
.8
.61.15.11.6
-1.07
0.3.2.5.7.3.3
.6.3.4.2.5.2.2
Addendum: All items, percent change(annual rate)
Fromprevi-
ousquar-ter s
4.5
4.4
5.4
6.4
From3
monthsearlier
4.94.54.84.84.44.1
4.75.46.16.47.15.74.0
From6
monthsearlier
4.44.74.94.84.54.5
4.84.95.15.66.25.95.2
Fromyear
earlier
NSA
13.510.36.23.24.33.61.93.64.1
4.14.04.24.24.24.4
4.74.85.05.15.45.25.0
1 Includes items not shown separately.2 Household fuels—gas (piped), electricity, fuel oil, etc.—-and motor fuel. Motor oil, coolant, etc.,
also included through 1982.
3 Quarterly changes are shown in the last month of the quarter.
Source: Department of Labor, Bureau of Labor Statistics.
24
Digitized for FRASER http://fraser.stlouisfed.org/ Federal Reserve Bank of St. Louis

PRICES RECEIVED AND PAID BY FARMERSPrices received by farmers in July were 0.7 percent below their June level. Prices paid by farmers in July were 0.6percent above their April level. (Data are not seasonally adjusted.)
INDEX, 1977= 100 (RATIO SCALE)
180
160
140
120
100
80
60RATION140
120
100
80
60
INDEX, 1977 =100 (RATIO SCALE)
180
I l l l l l I l l l l l
PRICES PAID
PRICES RECEIVED
l l l l l l l l I II I Illlll II Mil 60
160
140
120
100
80
--r~~ — ̂ ^-Illllllllll
1981
|—~~~ -^-
Illllllllll
1982
— —- — 1
Illllllllll
1983
1 — 1
Illllllllll
1984
KAIIU
~ ~
Illllllllll
1985
Illllllllll
1986
Illllllllll
1987
Illllllllll
1988
-
-
Illllllllll
1989
RATIO-^140
120
100
80
60
I/RATIO OF INDEX OF PRICES RECEIVED TO INDEX OF PRICES PAID.
SOURCE: DEPARTMENT OF AGRICULTURE COUNCIL OF ECONOMIC ADVISERS
[1977 = 100; not seasonally adjusted]
Period
198119821983198419851986 ...19871988....
1988: July
SeptOctNovDec
1989: JanFebM&rAprMayT JJuneJuly
Prices received by farmers
All farmproducts
139133135142128123126138142144144143144145
149148149147149147146
Crops
134121128138120107106126137136135133136136
140138136140141138134
Livestock andproducts
143145141146136138146150147152153152151154
158158161154156157156
Prices paid by farmers
All commodities,services,
interest, taxes,and wage rates 1
150159161164162159161170172
173
175
177
178
Productionitems, interest,
taxes, and wagerates
151158159161156150151160162
163
166
167
167
Productionitems
148153152155151144147157159
162
163
165
165
Ratio 2
9284848779777981838484838384
85858583848382
1 Includes items not shown separately. NOTE. — The official indexes are published on a 1910-14 base as required by law. The indexes2 Percentage ratio of index of prices received by fanners to index of prices paid, interest, taxes, have been converted to a 1977 — 100 base to facilitate comparison with other indexes,
and wage rates. See also footnote 3.3 Beginning March 1986. prices paid by farmers are available only for first month in quarter, and bource: Department of Agriculture.
for each month the received/paid ratio is based on latest data available.
25
Digitized for FRASER http://fraser.stlouisfed.org/ Federal Reserve Bank of St. Louis

MONEY, CREDIT, AND SECURITY MARKETSMONEY STOCK, LIQUID ASSETS, AND DEBT MEASURESMl rose in July after declining for four months; growth in the broader aggregates accelerated in July.
BILLIONS OF DOLLARS* (RATIO SCALE)
4,000
3,200
2,800
2,400
2,000
1,600
1,200
1985
• AVERAGES OF DAILY FIGURES; SEASONALLY ADJUSTED
SOURCE: BOARD OF GOVERNORS OF THE FEDERAL RESERVE SYSTEM
1984
M2
1986
BILLIONS OF DOLLARS*(RATIO SCALE)
4,0003,600
3,200
2,800
1987
2,400
2,000
1,600
1,200
600
400
1988 1989
COUNCIL OF ECONOMIC ADVISERS
[Averages of daily figures, except as noted; billions of dollars, seasonally adjusted]
Period
1980- Dec1981- Dec1982: Dec1983- Dec1984: Dec1985- Dec1986- Dec1987: Dec1988- Dec
1988- July
SeptOctNovDec
1989: JanFeb ' ..Mar '
May '
July p
Ml
Sum of currency,demand deposits,travelers' checks,
and othercheckable
deposits (OCDs)
412.2439.1476.4522.1551.9620.5725.9752.3790.3
782.5782.4783.7785.4786.6790.3
786.3787.4786.3783.1773.3770.3777.3
M2
Ml plus overnightKPs and
Eurodollars,MMMF balances(general purpose
and broker/dealer),MMDAs, and
savings and smalltime deposits
1,633.31,795.91,954.52,186.02,367.22,567.42,811.22,909.93,069.4
3,023.93,029.73,035.03,042.23,059.33,069.4
3,065.73,069.23,078.23,080.03,070.73,086.03,118.1
M3
M2 plus largetime deposits,
term EPs, termEurodollars, andinstitution-only
MMMF balances
1,991.11,236.92,443.82,694.32,982.33,201.73,494.93,677.6
r3,914.3
3,839.13,851.13,860.53,877.23,897.2
r3,914.3
3,918.73,927.83,948.93,956.23,951.23,969.04,000.6
L
MS plusother liquid
assets
2,327.82,599.42,853.53,155.53,523.43,830.64,137.14,340.2
r4,675.0
4,565.14,583.64,591.74,612.54,638.4
P4,675.0
4,678.34,690.44,724.44,742.14,737.64,739.2
Debt
Debt ofdomestic
nonfinaneialsectors
(monthlyaverage) 1
3,882.54,258.04,642.05,176.05,923.56,733.37,596.98,310.79,052.1
8,718.88,784.38,850.08,912.48,988.69,052.1
9,107.29,172.39,229.49,285.19,344.09,397.4
Percent change from year or 6months earlier 2
Ml
6.86.58.59.65.7
12.417.03.65.1
6.56.05.33.74.13.6
1.01.3.7
-.6-3.4-5.0
2 3
M2
8.910.08.8
11.88.38.59.53.55.5
6.55.44.53.54.03.8
2.82.62.92.5
.71.13.4
M3
10.212.39.2
10.310.77.49.25.26.4
7.56.45.65.25.45.2
4.24.04.64.12.82.84.2
Debt
9.69.79.0
11.514.413.712.89.48.9
8.99.09.08.99.39.3
9.19.08.88.58.17.8
1 Consists of outstanding credit market debt of the U.S. Government, State and local govern-ments, and private nonfinaneial sectors; data from flow of hinds accounts.
2 Annual changes are from December to December and monthly changes are from 6 months earli-
er at an annual rate.
NOTE.-—See p. 27 for components.
Source: Board of Governors of the Federal Reserve System.
26
Digitized for FRASER http://fraser.stlouisfed.org/ Federal Reserve Bank of St. Louis

COMPONENTS OF MONEY STOCK AND LIQUID ASSETS[Averages of daily figures; billions of dollars, seasonally adjusted, except as noted by NSA]
Period
1980: Dec1981- Dec1982: Dec1983- Dec1984: Dec1985- Dec1986: Dec1987- Dec1988: Dec
1988: July
SeptOc?NovDec
1989: JanFebMar
May '
July"
Cur-rency
115.2122.5132.6146.3156.1167.8180.5196.4211.8
206.4207.0208.6209.7210.5211.8
213.4214.3215.6215.9216.4217.4218.0
De-mand
de-posits
261.5231.5234.2238.7244.2267.3303.2288.3288.6
290.4289.9288.8288.9287.7288.6
284.0284.8284.3281.4278.2275.0279.0
Othercheck-
abledepos-
its(OCDs)
31.380.8
105.3132.2146.4179.5235.8260.4282.3
278.5278.3279.0279.4281.0282.3
281.3280.9279.1278.5271.3270.7273.2
Over-nightrepur-chaseagree-ments(EPs),
net,plusover-nightEuro-dollars
NSA
28.335.938.853.856.370.278.378.378.3
77.679.977.376.075.678.3
81.678.877.273.972.173.978.1
Money marketmutual fund
balances
Gener-al
pur-poseand
broker/dealer
NSA
61.6150.6185.2138.2167.5176.5208.0221.1239.4
229.6230.8231.0231.3237.4239.4
241.7247.2
r 255.5259.1258.9265.1274.6
Insti-tutiononly
NSA
15.238.051.143.262.764.584.489.687.6
84.884.083.784.687.487.6
89.389.687.687.791.695.198.2
Moneymarketdeposit
accounts(MMDAs)
NSA
0.0.0
43.2379.2416.9513.5572.5526.3502.7
522.0517.7511.4507.5506.7502.7
495.2485.3480.3471.3457.0456.9459.8
Sav-ingsde-
posits
400.2344.0356.9305.6285.4301.6371.0416.4431.3
429.7430.9430.5429.2431.8431.3
427.8424.6420.8412.8404.7402.0401.5
Smalldenom-inationtune
depos-its1
728.6823.2851.0784.0886.3882.6853.9914.1
1,025.2
981.0988.3998.7
1,009.71,017.81,025.2
1,035.71,048.31,061.01,083.11,105.81,118.51,126.3
Largedenom-ination
timedepos-its '
260.1302.5326.8327.4417.2436.6439.0487.4
r537.8
514.0519.4526.7532.0534.4
r537.8
' 544.5r551.7' 558.9567.8572.3573.3573.9
Termrepur-chaseagree-ments(EPs)
NSA
34.036.034.551.861.965.684.0
109.1123.1
125.6123.8122.3124.7127.5123.1
124.1127.1129.4127.0127.2126.9120.9
TermEuro-dollars
(net)
NSA
50.367.581.791.582.976.184.990.8
105.8
97.1102.8' 102.8
100.2101.6105.8
' 100.5r99.9' 105.3
101.1100.3
99.099.4
Sav-ings
bonds
72.367.868.071.174.279.491.7
100.4109.1
106.8107.4107.9108.4108.7109.1
109.7110.6111.5112.3112.9113.8
Short-term
Treas-ury
secu-rities
133.5149.4183.6211.9260.7300.1282.3257.5275.2
268.7272.6272.8273.3268.4275.2
' 274.4267.8
' 273.5278.0278.8264.7
Bankers'accept-ances
32.140.044.545.045.442.037.244.740.6
40.741.241.741.340.540.6
40.639.941.241.541.141.2
Com-mercialpaper
98.8105.3113.6133.2160.7207.4231.0260.3335.8
309.8311.3308.8312.3323.7335.8
334.9344.2349.2354.2353.5350.5
1 Small denomination and large denomination deposits are those issued in amounts of less than here.1100,000 and more than $100,000, respectively. Source: Board of Governl)ra o( the Federal Reserve System.
NOTE.-—Travelers checks of nonfaank issuers are a component of money stock but are not shown
AGGREGATE RESERVES AND MONETARY BASE[Averages of daily figures; millions of dollars; seasonally adjusted, except as noted]
Period
1980: Dec1981: Dec1982- Dec1983: Dec1984- Dec1985: Dec1986' Dec1987- Dec1988: Dec
1988: July
SeptOctNovDec
1989- JanFebMar
MayT 3
July".
Adjusted for changes in reserve requirements
Reserves of depository institutions
Total
33,40135,31537,38839,18442,32148,49358,14058,69360,706
61,05860,90360,82460,86260,85360,706
60,37060,26059,85459,46358,74058,35058,699
Nonbor-rowed
31,71134,67936,75438,41039,13447,17557,31357,91658,990
57,61857,66357,98558,56257,99158,990
58,70858,77358,04157,17457,01956,86058,005
Nonbor-rowed plusextended
credit
31,71434,82736,94038,41241,73947,67457,61658,39960,234
60,15760,31660,04360,34360,31460,234
59,75459,82259,37658,88058,217
r57,77658,111
Required
32,88734,99636,88838,62341,46847,43656,77157,66559,666
60,05159,95059,85259,80059,73359,666
59,22659,10658,89658,68657,70957,44557,733
Monetarybase
152,525161,043173,011188,303201,889219,510241,448257,991275,501
270,308270,979272,420273,659274,380275,501
276,784277,553278,615
r278,675278,329279,056279,984
Borrowings of depositoryinstitutions from the Federal
Reserve (NSA)
Total
1,690636634774
3,1861,318
827777
1,716
3,4403,2412,8392,2992,8611,716
1,6621,4871,8132,2891,7201,490
694
Seasonal
116543396
113563893
130
376423421332186130
7697
139213345431497
Extendedcredit
3148186
22,604
499303483
1,244
2,5382,6532,0591,7812,3221,244
1,0461,0501,3341,7071,197
917106
Source: Board of Governors of the Federal Reserve System.
27
Digitized for FRASER http://fraser.stlouisfed.org/ Federal Reserve Bank of St. Louis

BANK LOANS AND SECURITIESTotal commercial bank loans and leases rose 1.1 percent in July; commercial and industrial loans rose 1.2 percent.
ALL COMMERCIAL BANKS
BILLIONS OF DOLLARS* (RATIO SCALE)
2,800
2,400
2,000
1,600
1,200
800
400
200
160
120
1981 1982 1983
LOANS AND LEASES
U.S. GOVERNMENT SECURITIES
1984
l l l l l l l l l
1985
TOTHER SECURITIES •
l l l H l l l l l l
1986
BILLIONS OF DOLLARS* (RATIO SCALE)
2,800
2,400
2,000
1,600
1,200
800
400
200
160
120
1987
• SEASONALLY ADJUSTEDSOURCE: BOARD OF GOVERNORS OF THE FEDERAL RESERVE SYSTEM
M i l l
1988 1989
COUNCIL OF ECONOMIC ADVISERS
[Billions of dollars, seasonally adjusted *]
Period
1981: Dec1982: Dec1983: Dec1984: Dec1985: Dec1986: Dec1987: Dec1988: Dec
1988: AugSeptOctNovDec
1989: JanFebMarAprMayJuneJuly"...
All commercial banks
Totalloans and
securi-ties 2
1,307.71,401.51,553.61,723.71,911.42,094.52,239.62,417.2
2,377.62,381.52,401.42,410.22,417.2
2,422.82,451.92,464.92,470.92,486.32,496.82,518.1
U.S.Govern-
mentsecuri-
ties
179.3201.7259.2260.2270.7309.6335.5361.4
350.9353.1355.6358.8361.4
360.4361.8368.8370.7373.5373.8374.4
Othersecuri-
ties
160.9165.7170.6142.6181.4196.5195.3194.0
196.5195.2196.8195.9194.0
189.6190.4189.7187.2186.4
r 185.8184.6
Loans and leases
Total 2
967.51,034.11,123.91,321.01,459.31,588.41,708.81,861.9
1,830.11,833.21,848.91,855.61,861.9
1,872.91,899.71,906.51,913.11,926.51,937.31,959.1
Com-mercial
andindustri-
al
355.4392.6414.1472.9499.7536.2562.7601.9
597.4598.1601.6601.8601.9
606.6619.0617.8620.6626.3624.9632.2
Realestate
284.1299.8330.8376.3425.8494.0589.0672.0
643.0650.3659.8665.3672.0
678.9685.6691.8699.5705.5712.0719.8
Indi-vidual
182.5188.2212.9253.8294.8315.9329.5355.5
347.7350.2351.6353.0355.5
357.9358.9360.6362.9365.4366.0367.0
Securi-ty
21.525.428.134.342.740.134.438.5
39.636.538.538.238.5
37.744.743.640.038.041.140.3
Non-hankfinan-cial
institu-tions
29.931.330.531.432.535.031.930.0
31.130.730.430.230.0
30.330.629.729.229.0
r30.631.7
Agri-cultural
33.136.239.240.136.131.629.430.7
29.629.629.830.330.7
30.730.730.730.430.330.330.4
Stateand
politi-cal
subdi-visions
0.0.0
3.346.056.758.452.546.8
48.248.048.547.746.8
44.444.544.644.644.644.544.3
For-eign
banks
18.114.813.411.19.79.67.57.6
8.07.27.68.17.6
7.88.5
r8.28.3
r9.4r9.38.9
For-eign
officialinstitu-
tions
7.25.99.47.96.05.95.34.9
5.15.0
r4.94.94.9
4.84.84.8
r4.9r4.94.74.5
Leasefinanc-
ingreceiv-ables
12.713.313.716.019.022.324.529.2
28.128.528.929.129.2
29.429.629.629.830.029.930.4
Other
23.126.631.831.236.339.442.1
r44.8
52.249.147.5
r47.0r44.8
44.4r42.7r45.2r42.9r43.1r43.8
49.7
3 Data are prorated averages of Wednesday figures for domestically chartered banks and averagesof month-end data for foreign-related institutions. Data beginning January 1984 are not strictlycomparable with data for earlier periods, largely because beginning January 1984 certain obligationsof States and political subdivisions are included in loans rather than in other securities.
2 Excludes loans to commercial banks in the United States.
Source: Board of Governors of the Federal Reserve System.
28
Digitized for FRASER http://fraser.stlouisfed.org/ Federal Reserve Bank of St. Louis

SOURCES AND USES OF FUNDS, NONFARM NONFINANCIALCORPORATE BUSINESS
[Billions of dollars; quarterly data at seasonally adjusted annual ratesj
Period
1979198019811982198319841985198619871988
1988- InmIV
1989: 1"
Sources
Total
326.0324.8375.8298.5420.3492.6459.2519.8482.9467.5
464.4465.8475.8463.5
431.4
Internal 1
197.6200.1239.5242.3285.7336.3352.3357.5352.8366.8
359.9363.6365.3378.3
355.8
External
Total
128.4124.7136.4
56.2134.6156.3106.9162.3130.1100.7
104.5102.2110.5
85.2
75.6
Credit market funds
Total
60.170.790.749.877.995.850.9
121.368.563.8
100.554.067.532.8
-5.4
Securitiesand
mortgages
9.034.529.410.352.65 15.0
59.038.2
-18.2
20.5-20.0
12.486 1
81 0
Loans andshort-term
paper
51.136.261.239.525.3
100.946.062.330.382.0
80.074.055.1
118.9
75.6
Other 2
68.254.045.7
6.456.860.555.941.061.637.0
4.048.243.152.4
80.9
Uses
Total
368.1342.1383.6303.5385.8502.7435.3456.7437.3448.3
433.9447.3459.6452.2
425.3
Capitalexpendi-tures 3
238.3243.7286.5256.5270.7370.6342.3333.9361.7395.7
387.8386.7398.6409.3
406.6
Increase infinancial
assets
129.898.497.047.0
115.1132.193.0
122.875.652.6
46.160.661.042.9
18.7
Discrepancy(sources less
uses)
-42.1-17.3-7.7-4.934.5
-10.123.963.045.519.1
30.518.516.111.3
6.0
1 Undistributed profits (after inventory valuation and capital consumption adjustments), capitalconsumption allowances, and foreign branch profits, dividends, and subsidiaries' earnings retainedabroad.
2 Consists of tax liabilities, trade debt, and direct foreign investment in the U.S.
3 Plant and equipment, residential structures, inventory investment, and mineral rights from U.S.Government.
Source: Board of Governors of the Federal Reserve System.
CONSUMER INSTALLMENT CREDIT[Millions of dollars; seasonally adjusted]
Period
1980: Dec1981- Dec1982: Dec1983: Dec1984: Dec1985: Dec1986: Dec1987- Dec .1988: Dec1988: June
JulyAugSeptOctKovDec
NEW SERIES:1989: Jan
FebMarApr r
May r.June p
Installment credit outstanding (end of period)
Total
297,566310,682323,536367,868442,538517,755572,047607,721659,507637,836639,207644,666646,556649,132654,413659,507
682,020687,397691,162693,911698,132701,118
Automobile
111,936118,956124,218143,799173,704209,636247,313265,976281,174
278,058277,659279,585279,243278,902279,926281,174
286,382288,767288,850289,654290,741290,474
Revolving
54,89460,83866,24378,667
100,212122,013137,013153,884174,792164,408165,343167,125168,273170,131173,030174,792
176,716178,570182,831184,500186,502189,609
Mobilehome
18,62120,30222,83323,70425,79526,83427,35526,38725,74426,17426,21326,27726,18526,03326,00525,744
26,03625,99224,16823,99323,95223,695
Other
112,115110,586110,242121,698142,827159,272160,367161,475177,798169,196169,993171,679172,855174,066175,452177,798
192,886194,068195,314195,763196,936197,340
Net change in installment credit outstanding 1
Total
1,08313,11612,85444,33274,67075,21754,29235,67451,786
5,4051,3715,4591,8902,5765,2815,094
(2)5,3773,7652,7494,2212,986
Automo-bile
5397,0205,262
19,58129,90535,93237,67718,66315,1981,600
3991,926
342-3411,0241,248
(2)2,385
82804
1,087-267
Revolving
1,5375,9445,405
12,42421,54521,80115,00016,87120,908
2,303935
1,7821,1481,8582,8991,762
(2)1,8544,2611,6702,0023,107
Mobilehome
4141,6812,531
8712,0911,039
521-968-643-75
396492
-15228
-261
<2)44
-1,824174
-41257
Other
-3291 529
— 34411,45621,12916,4451,0951,108
16,323
1,577797
1,6861,1761,2111,3862,346
(2)1,1821,246
4491,173
404
1 For year-end data, change from preceding year-end; for monthly data, change from precedingmonth.
2 Because of break in series, net change not available.
Source: Board of Governors of the Federal Reserve System.
29
Digitized for FRASER http://fraser.stlouisfed.org/ Federal Reserve Bank of St. Louis

INTEREST RATES AND BOND YIELDSInterest rates rose in August.
PERCENT PER ANNUM PERCENT PfR ANNUM
\6
-DISCOUNT —RATE
FEDERALRESERVE
BANK OFNEW YORK
SOURCE SEE TABIE a COUNCIL OE ECONOMIC ADVISERS
[Percent per annum]
Period
19811982198319841985198619871988
19881 AugSept
OctNovDec
1989: JanFebMarApr.. ..MayJune
July
Aug p
Week ended:
1989: Aug 5121926
Sept 2
U.S. Treasury security yields
3-month bills(new issues) x
14.029
10.686
8.639.587.485.985.826.69
7.027.287.347.688.09
8.298.488.838.708.408.227.927.91
7.657.948.017.997.94
Constant maturities 2
3-year
14.4412.9210.4511.899.647.067.688.26
8.778.578.438.729.11
9.209.329.619.408.988.377.838.12
7.668.018.238.33
10-year
13.9113.0011.1012.4410.62
7.688.398.85
9.268.988.808.969.11
9.099.179.369.188.868.288.028.11
7.828.048.188.23
High-grademunicipal
bonds(Standard &
Poor's) 3
11.2311.579.47
10.159.187.387.737.76
7.867.717.547.587.66
7.417.477.617.497.256.976.97
6.877.067.077.20
CorporateAaa bonds(Moody' s) *
14.1713.7912.0412.7111.37
9.029.389.71
10.119.829.519.459.57
9.629.649.809.799.579.10
r8.93
8.95
8.818.928.999.02
Primecommercial
paper,6 months *
14.7611.898.89
10.168.016.396.857.68
8.368.238.248.558.97
9.029.359.979.789.298.808.358.31
7.998.208.408.46
Discount rate(N.Y. P.R.
Bank)5
13.4111.028.508.807.696.335.666.20
6.00-6.50
6.50-6.50
6.50-6.50
6.50-6.50
6.50-6.50
6.50-6.50
6.50-7.00
7.00-7.00
7.00-7.00
7 00 7 007.00-7.00
7.00-7.00
7.00-
7.00-7.00
7 00 7 007 00 7 007.00-7.00
7.00-
Prime ratecharged by
bants 5
18.8714.8610.7912.04
9.938.338.229.32
9.50-10.00
10.00-10.00
10.00-10.00
10.00-10.50
10.50-10.50
10.50-10.50
10.50-11.50
11.50-11.50
11.50-11.50
11.50-11.50
11.50-11.00
11.00-10.50
10.50-
11.00-10.50
10.50-10.50
10.50-10.50
10.50-10.50
10.50-
New-homemortgage
yields(FHLBB) 6
14.7015.1412.5712.3811.5510.179.319.19
9.069.269.109.439.39
9.529.829.99
10.1710.1810.4210.48
1 Bank-discount basis.2 Yields on the more actively traded issues adjusted to constant maturities by the Treasury De-
partment.3 Weekly data are Wednesday figures.4 Series excludes public utility issues for January 17, 1984 through October 11, 1984 due to lack
of appropriate issues.
5 Average effective rate for year; opening and closing rate for month and week.6 Effective rate (in the primary market) on conventional mortgages, reflecting fees and charges as
well as contract rate and assumed, on the average, repayment at end of 10 years.
Sources: Department of the Treasury, Board of Governors of the Federal Reserve System, Feder-al Home Loan Bank Board, Moodv's Investors Service, and Standard & Poor's Corporation.
30
Digitized for FRASER http://fraser.stlouisfed.org/ Federal Reserve Bank of St. Louis

COMMON STOCK PRICES AND YIELDSStock prices rose in August.
INDE>
240220200
180
160
140
120
100
80
60
40
PERC
20
15
10
5
0
(, DEC. 31, 1965 = 50 (RATIO SCALE) INDEX, DEC. 31, 1965 = 50 (RATIO!
COMPOS ITF STOCK PRICE(NYSE)
\ .
r ~r-^^
^Vn
] I I I I 1 11 I r l
1981
ENT
^J
1982
S 1
1983
^~^r~J
1984
^
1 1 1
1981
SOURCES: NEW YORK
^
i i i1982
STOCK EXCHANGE A
---_- -
1 1 1
1983
ND STANDARD & POC
f^ ~
1 1 1
1984
)R'S CORPORATION
1 1 n i 1 1 1 i 1 1
1985 1986
NGS-PRICE RATIO ON COMM(S&P)
\
^ >^
1 1 11985
fA .
1 1
1986
Kjnpy ~ S
( \ S~*~/~^~~'"̂̂
1987
ii i ill in ii
1988
jCALE)
240220200180
160
140
120
100
80
60
40
1989PERCENT
r /~\ i i1987
p- — —
1 1 1
1988
COUNCIL OF
1 1 1 0
1989
ECONOMIC ADVISERS
Period
1981198219831984198519861987.1988
1988- AugSeptOctNovDec
1989' JanFebMarAprMay
JulyAug p
Week ended:1989: July 29
Aug 5121926
Common stock prices l
New York Stock Exchange indexes (E
Composite
74.0268.9392.6392.46
108.09136.00161.70149.91
149.25151.47156.36152.67155.35
160.40165.08164.60169.38175.30180.76185.15192.83
188.17191.86193.55192.14192.40
Industrial
85.4478.18
107.45108.01123.79155.85195.31180.95
179.72182.18188.58183.79187.75
194.62200.00199.20204.81211.51216.75221.74231.17
225.74229.48231.94230.41230.84
Transporta-tion
72.6160.4189.3685.63
104.11119.87140.39134.12
132.53136.27141.93138.60144.07
153.09162.66160.14164.32168.88173.47179.32196.97
183.91187.06195.58196.97199.16
ec. 31, 1965 = 5
Utility
38.9139.7547.0046.4456.7571.3674.3071.77
70.6771.8374.1973.8374.81
75.8777.8477.6679.6984.0787.9590.4092.89
91.2693.5793.4892.3392.33
3)2
Finance
73.5271.9995.3489.28
114.21147.20146.48127.26
130.77133.15134.66129.61128.83
132.26137.19137.91143.26146.60154.08157.78164.84
1599.99164.77165.71164.34164.11
Dow-Jonesindustrialaverage 3
932.92884.36
1,190.341,178.481,328.231,792.762,275.992,060.82
2,051.292,080.062,144.312,099.042,148.58
2,234.682,304.302,283.112,348.912,439.552,494.902,554.032,689.01
2,610.362,654.862,695.372,685.322,688.62
Standard &Poor's
compositeindex (1941-
43=10)4
128.05119.71160.41160.46186.84236.34286.83265.79
263.73267.97277.40271.02276.51
285.41294.01292.71302.25313.93323.73
r331.93346.39
337.95344.57344.74344.78345.72
Common stock yields(percent) 5
Dividend-price ratio
5.205.814.404.644.253.493.083.64
3.753.693.613.703.68
3.643.593.683.593.523.443.38
3.313.283.273.283.30
Earnings-price ratio
11.9611.608.03
10.028.126.095.488.01
8.36
8.56
8.46
1 Average of daily closing prices.2 Includes all the stocks (more than 1,500) listed on the NYSE.3 Includes 30 stocks.4 Includes 500 stocks.5 Standard & Poor's series. Dividend-price ratios based on Wednesday closing prices. Earnings-
price ratios based on prices at end of quarter.NOTE.—All data relate to stocks listed on the New York Stock Exchange (NYSE).Sources: New York Stock Exchange, Dow-Jones & Company, Inc., and Standard & Poor's Cor-
poration.
31
Digitized for FRASER http://fraser.stlouisfed.org/ Federal Reserve Bank of St. Louis

FEDERAL FINANCEFEDERAL RECEIPTS, OUTLAYS, AND DEBTIn the first 10 months of fiscal 1989, there was a deficit of $123.8 billion, compared with a deficit of $142.2billion a year earlier.
BILLIOI-1,200
1,100
1,000
900
800
700
600
45 OF DOLLARS BILLIONS OF DC
RECEIPTS AND OUTLAYS!^
-""'
-""""-**" ^^^
^^
-~ff — RECEIPTS1'
A . i i i i - —i — — i 1 1 1 . N
3LLARS
1,200
1,100
1,000
900
800
700
600
0
100
200
SURPLUS OR DEFICIT (-V
^\ ^
A i I i I I I^1981 1982 1983 1984 1985 1986
^^^
I I I .._ IS1987 1988 1989 1990^
-100
-200
V INCLUDES ON-BUDGET AND OFF-BUDGET ITEMS.
SOURCES: DEPARTMENT Of THE TREASURY AND OFFICE OF MANAGEMENT AND BUDGET
FISCAL YEARS
COUNCIL OF ECONOMIC ADVISERS
[Billions of dollars]
Fiscal year or period
1976Transition quarter19771978 ,197919801981198219831984
19851986198719881989 (estimates) 1
1990 (estimates) l
Cumulative total, first 10months: 2
Fiscal year 1988Fiscal year 1989
Total
Receipts
298.181.2
355.6399.6463.3517.1599.3617.8600.6666.5
734.1769.1854.1909.0995.9
1,080.1
741.7816.1
Outlays
371.896.0
409.2458.7503.5590.9678.2745.7808.3851.8
946.3990.3
1,003.81,064.01,144.11,179.4
883.9939.9
Surplusor deficit
(-)
-73.7-14.7-53.6-59.2-40.2-73.8-78.9
-127.9-207.8-185.3
-212.3-221.2-149.7
155 1-148.3-99.2
-142.2123 8
On-budget
Receipts
231.763.2
278.7314.2365.3403.9469.1474.3453.2500.4
547.9568.9640.7667.5731.1793.3
540.9595.0
Outlays
302.276.6
328.5369.1403.5476.6543.0594.3661.2686.0
769.5806.8810.0861.4933.2957.1
716.5766.5
Surplusor deficit
(-)
70 5-13.3
49 7-54.9
38 2-72.7
73 9-120.0-208.0-185.6
-221.6-237.9-169.3-193.9-202.1-163.8
-175.7-171.5
Off-budget
Eeceipts
66.418.076.885.498.0
113.2130.2143.5147.3166.1
186.2200.2213.4241.5264.7286.8
200.8221.1
Outlays
69.619.480.789.7
100.0114.3135.2151.4147.1165.8
176.8183.5193.8202.7211.0222.3
167.4173.4
Surplusor deficit
(-)
-3.2-1.4-3.9-4.3-2.0-1.1
5 0-7.9
.2
.3
9.416.719.638.853.864.5
33.447.8
Gross Federal debt(end of period)
Total
629.0643.6706.4776.6828.9908.5994.3
1,136.81,371.21,564.1
1,817.02,120.12,345.62,600.82,853.53,084.8
2,548.52,810.2
Held bythe public
477.4495.5549.1607.1639.8709.3784.8919.2
1,131.01,300.0
1,499.41,736.21,888.12,050.22,177.82,279.2
2,013.62,147.4
1 Estimates from Mid-Session Review of the Budget, Office of Management and Budget, July 18,1989. Data for 1990 include asset sales.
2 Data from Monthly Treasury Statement for July 1989, issued August 1989.
NOTE.—Data are from Budget of the United States Government, Fiscal Year 1990, January1989, except as noted.
Sources: Department of the Treasury and Office of Management and Budget.
32
Digitized for FRASER http://fraser.stlouisfed.org/ Federal Reserve Bank of St. Louis

FEDERAL RECEIPTS BY SOURCE ANDOUTLAYS BY FUNCTIONIn the first 10 months of fiscal 1989, receipts were $74.4 billion higher than a year earlier and outlays were $56.0billion higher.
OUTLAYS-!/
BILLIONS OF DOLLARS500
RECEIPTS!'400
300
200
100
0
900
800
700
600
500
400
300
200
BILLIONS OF DOLLARS500
. INDIVIDUAL INCOME TAXES_
SOCIAL INSOCIAL INSURANCETAXES AND CONTRIBUTIONS
CORPORATION.INCOME TAXES
OTHER RECEIPTS
Tf.
-NONDEFENSE
A,-
. NATIONAL DEFENSE
400
300
200
100
0
900
800
700
600
500
400
300
200
1981 1982 1983 1984 1985 1986 1987
FISCAL YEARS
J/ INCLUDES ON-BUDGET AND OFF-BUDGET ITEMS.SOURCES: DEPARTMENT OF THE TREASURY AND OFFICE OF MANAGEMENT AND BUDGET
1988 1989 1990
COUNCIL OF ECONOMIC ADVISERS
Pillions of dollars]
Fiscal year
19761977.. ..1978197919801981198219831984
19851986198719881989 (estimates) *1990 (estimates)1.Cumulative total, first 10
months: 2
Fiscal year 1988Fiscal year 1989
On-budget and off-budget receipts
Total
298.1355.6399.6463.3517.1599.3617.8600.6666.5
734.1769.1854.1909.0995.9
1,080.1
741.7816.1
Indi-vidualincometaxes
131.6157.6181.0217.8244.1285.9297.7288.9298.4
334.5349.0392.6401.2445.3484.6
327.5363.7
Corpo-ration
incometaxes
41.454.960.065.764.661.149.237.056.9
61.363.183.994.5
105.8117.0
72.181.2
Socialinsur-ancetaxesand
contri-butions
90.8106.5121.0138.9157.8182.7201.5209.0239.4
265.2283.9303.3334.3361.5387.5
277.3301.7
Other
34.336.637.740.850.669.569.365.671.8
73.073.174.378.983.391.0
64.969.5
On-budget and off-budget outlays
Total
371.8409.2458.7503.5590.9678.2745.7808.3851.8
946.3990.3
1,003.81,064.01,144.11,179.4
883.9939.9
National defense
Total
89.697.2
104.5116.3134.0157.5185.3209.9227.4
252.7273.4282.0290.4301.2296.3
243.9248.9
Depart-ment ofDefense,military
87.995.1
102.3113.6130.9153.9180.7204.4220.9
245.2265.5274.0281.9292.7286.9
237.1241.8
Inter-nationalaffairs
6.46.47.57.5
12.713.112.311.815.9
16.214.211.610.510.716.4
10.37.9
Health
15.717.318.520.523.226.927.428.630.4
33.535.940.044.549.656.4
36.740.3
Medi-care
15.819.322.826.532.139.146.652.657.5
65.870.275.178.986.297.1
64.569.4
Incomesecuri-
ty
60.861.061.566.486.599.7
107.7122.6112.7
128.2119.8123.3129.3136.6145.4
108.4113.5
Socialsecuri-
ty
73.985.193.9
104.1118.5139.6156.0170.7178.2
188.6198.8207.4219.3232.4249.1
182.5193.6
Netinter-
est
26.729.935.442.652.568.785.089.8
111.1
129.4136.0138.6151.7169.1176.3
125.7139.6
Other
82.893.0
114.7119.6131.4133.5125.4122.3118.6
131.8142.1125.9139.4158.3142.4
112.1126.8
1 See footnote 1, page 32.2 Data from Monthly Treasury Statement for July 1989, issued August 1989.
NOTE.—Data are from Budget of the United States Government, Fiscal Year 1990, January1989, except as noted.
Sources: Department of the Treasury and Office of Management and Budget.
33
Digitized for FRASER http://fraser.stlouisfed.org/ Federal Reserve Bank of St. Louis

FEDERAL SECTOR, NATIONAL INCOME ACCOUNTS BASISIn the second quarter of 1989, according to preliminary estimates, Federal receipts rose $15.7 billion (annual rate)and Federal expenditures rose $16.6 billion.
BILLIONS OF DOLLARS
1,200
1,000
800
600
400
200
-200
SEASONALLY ADJUSTED ANNUAL RATES
BILLIONS OF DOLLARS
1,200
EXPENDITURES -
I I I 1 I I1981 1982
SOURCE: DEPARTMENT OF COMMERCE
1983
RECEIPTS
SURPLUS OR DEFICIT (-)
v \
1 I I1984
I I 11985 |
CALENDAR YFARS
1986
I 1 1
1987 1988
I I I
1,000
800
600
400
200
-200
1989
COUNCIL OF ECONOMIC ADVISERS
[Billions of dollars; quarterly data at seasonally adjusted annual rates]
Period
Fiscal year:1985198619871988
Calendar year:1985198619871988
1982: TV1983- IV1984: IV1985- IV1986- IV
1987- IIIIV
1988- IIIIllIV
1989- III r
Federal Government receipts
Total
776.8815.2897.3958.6
788.7827.9911.4972.4
633.1675.5742.7805.3853.8
921.5937.4
944.7973.2977.3994.6
1,036.21,051.9
Personaltax andnontaxreceipts
340.4357.0401.2408.0
346.4361.4405.8413.0
303.0291.9326.0355.3376.2
408.1420.0
402.7417.5411.4420.3
446.8465.0
Corpo-rate
profitstax
accruals
74.681.197.7
108.3
76.383.8
101.0111.4
46.470.269.778.888.9
107.4103.1
104.2111.6114.0115.8
117.0108.4
Indirectbusinesstax andnontax
accruals
55.950.953.455.8
55.150.553.856.7
47.653.656.253.550.8
53.854.5
55.955.957.457.8
58.058.2
Contribu-tions for
socialinsurance
305.8326.1345.0386.4
310.9332.1350.8391.3
236.1259.8290.7317.7337.9
352.2359.7
382.0388.2394.5400.6
414.3420.2
Federal Government expenditures
Total
962.31,028.01,060.41,104.0
985.61,034.81,072.81,118.3
835.7844.7930.2
1,017.51,042.8
1,065.51,101.7
1,096.51,114.71,099.81,162.1
1,183.71,200.3
Pur-chases
of goodsand
services
341.5368.6375.5378.6
355.2366.5381.6381.3
293.2276.1326.0376.6368.8
384.5388.1
374.1377.1367.5406.4
399.0407.8
TransferPa>'-
ments
374.0394.6411.2432.7
380.1399.9414.3438.2
347.4352.5362.1385.8405.8
414.3421.9
433.0434.4438.0447.6
460.4466.7
Grants-in-aid to
Stateandlocal
govern-ments
97.8107.4103.1108.6
99.7106.8102.6111.4
84.586.096.3
103.5103.0
101.7102.2
110.1112.2111.0112.2
118.7118.4
Netinterest
paid
128.3134.6138.8149.0
130.1135.6141.7151.4
87.2101.0125.3132.7136.0
142.5147.3
144.9249.9153.9157.0
167.0171.9
Subsidiesless
currentsurplus ofGovern-
mententer-prises
20.722.831.935.1
20.326.032.636.0
23.429.121.019.029.2
22.741.9
34.441.229.438.9
38.535.4
Less:Wage
accrualsless
disburse-ments
-0.1.0.1
— .1
o.0.0.0
.0
.0
.6
.0
.0
.22
.0.0.0.0
.0
.0
Surplusor deficit
(-),nationalincome
andproductaccounts
-185.5-212.8-163.1-145.4
-196.9-206.9-161.4-145.8
-202.6-169.2-187.5-212.2-189.0
-143.9-164.4
-151.8— 141.5-122.5-167.6
-147.5-148.4
Source: Department of Commerce, Bureau of Economic Analysis.
34
Digitized for FRASER http://fraser.stlouisfed.org/ Federal Reserve Bank of St. Louis

INTERNATIONAL STATISTICSINDUSTRIAL PRODUCTION AND CONSUMER PRICES—MAJOR
INDUSTRIAL COUNTRIES
Period
198019811982198319841985198619871988
1988' JuneJuly
SeptOct..NovDec .
1989- JanFebMar
MayJuneJuly p
Industrial production (1977 = 100; seasonally adjusted)
UnitedStates
108.6111.0103.1109.2121.4123.7125.1129.8137.2
136.5138.0138.5138.6139.4139.9140.4
140.8140.5140.7
r 141.7' 141.6r!41.4
141 7
Canada
104.8106.996.5
102.7115.2121.4123.2129.6137.2
137.9137.4138.7138.8137.8137.1137.9
137.5'138.3'138.0'139.3
139.5
Japan
119.0120.3120.7124.5136.1141.0140.8145.7159.1
158.4156.4160.8161.6160.2165.0166.1
167.3164.5172.5
r 166.3'167.3
170.0
France
107.2106.1105.0105.0106.1106.1107.2109.4114.3
114.9116.0116.0117.2113.2118.0117.3
118.2'117.4'116.6
120.7118.0
Germany
108.0105.9102.7103.3106.2111.0113.0113.7118.1
118.5116.1121.3120.0119.4119.1121.2
121.2120.5121.3124.3
'118.6121.3
Italy
114.8113.0109.5105.9109.5110.7
'114.7'119.3'126.4
'125.4'128.5'126.0'124.1'127.6'129.1'132.2
127.9130.3126.9127.0
UnitedKingdom
99.896.798.5
102.2102.4107.9110.2114.1
'118.2
118.7119.0119.0119.6119.0119.6118.8
'118.1'117.6'117.8'117.8
116.4116.5
Consumer prices (1982-84=100)
UnitedStates *
82.490.996.599.6
103.9107.6109.6113.6118.3
118.0118.5119.0119.8120.2129.3120.5
121.1121.6122.3123.1123.8124.1124.4
Canada
76.185.694.8
100.4104.7108.9113.4118.4123.2
123.0123.7124.1124.2124.8125.1125.1
125.7126.6127.2127.6128.9129.6130.4
Japan
90.995.498.099.9
102.1104.2104.9105.0105.7
105.5105.3105.6106.4106.9106.5106.2
106.0105.7106.2108.1108.7108.6
France
72.281.991.7
100.3108.0114.3117.2121.1124.3
124.2124.7125.0125.3125.6125.8126.0
126.5126.8127.2128.0128.5
Germany
86.792.297.1
100.3102.7104.9104.6105.0106.2
106.3106.3106.3106.3106.4106.7106.9
108.1108.4108.6109.2109.5109.6
Italy
63.275.487.7
100.8111.5121.0128.5134.4141.1
140.5140.9141.5142.2143.3144.5145.0
146.1147.3148.0149.0149.6150.31506
UnitedKingdom
78.587.995.499.8
104.8111.2114.9119.7125.6
125.2125.4126.8127.4128.7129.2129.6
130.4131.4131.9134.3135.1135.6
1 Data relate to all urban consumers Source: National sources as reported by Department of Commerce (Bureau of Economic Analysisand International Trade Administration).
U.S. MERCHANDISE EXPORTS AND IMPORTS[Billions of dollars; monthly data seasonally adjusted]
Period
1982198319841985198619871988
1988- JuneJuly
SeptOctNovDec
1989- JanFebMar
May'
Merchandise exports (f.a.s. value) l
Total 2
H6.4205.6224.0
4 218.84 227.2
254.1322.4
26.726.627.527.627.927.528.9
29.028.830,130.830.530.9
Principal end-use commodity category
Foods,feeds,and
bever-ages
31.330.931.524.022.324.332.3
2.72.82.92.92.72.62.8
2.92.93.23.13.23.2
Indus-trialsup-pliesand
materi-als
61.756.761.758.557.366.785.1
7.17.17.17.26.87.07.4
7.17.57.68.07.98.0
Cap-ital
goodsexceptauto-
motive
72.767.272.073.975.886.2
109.2
8.89.29.39.49.49.4
10.1
9.49.39.9
10.19.8
10.5
Auto-motivevehi-cles,
parts,anden-
gines
15.716.820.622.921.724.629.3
2.22.12.82.52.52.52.7
2.42.42.52.42.32.3
Con-sumergoods(non-food)
exceptauto-
motive
14.313.413.312.614.217.723.1
1.92.02.02.12.02.02.3
2.42.52.72.82.62.9
Other 2
20.720.524.027.335.934.643.4
4.03.53.43.64.44.03.6
4.74.24.24.44.64.0
General merchandise imports (customs value) 3
Total
244.0258.0325.7345.3365.4406.2441.0
37.335.137.636.837.138.139.7
37.938.239.539.040.539.1
Principal end-use commodity category
Foodsfeeds,and
bever-ages
17.118.221.021.924.424.824.8
1.91.92.22.02.12.12.2
2.22.02.12.02.22.0
Indus-trialsup-pliesand
materi-als
112.0107.0123.7113.9101.3111.0118.3
10.29.7
10.29.39.99.8
10.2
10.710.011.011.311.711.3
Cap-ital
goodsexceptauto-
motive
35.440.959.865.171.884.5
101.4
8.87.98.98.78.29.19.1
9.09.39.39.19.99.5
Auto-motivevehi-cles
parts,anden-
gines
33.340.853.566.878.285.287.7
7.36.67.27.67.77.58.0
7.47.67.77.37.26.7
Con-sumergoods(non-food)
exceptauto-
motive
39.744.960.068.379.488.795.9
8.07.98.18.08.18.39.0
7.78.38.38.38.58.4
Other
6.56.37.89.4
10,412.112.8
1.11.11.11.11.11.21.2
.91.01.11.11.11.1
Generalmer-
chandiseimports
(c.i.f.value)
254.9269.9346.4352.5382.3424.4459.5
38.836.539.238.238.639.641.3
39.539.741.240.742.240.7
Trade halance
Exports(f.a.s)less
imports(customs
value)
-27.5-52.4
-101.7-126.5-138.3-152.1-118.5
-10.6-8.5
-10.1-9.2-9.2
— 10.5-10.8
-8.9-9.4-9.5-8.3
-10.1-8.2
Exportsft.a.s)less
imports(c.i.f.)
-38.4-64.2
-122.4-133.6-155.1-170.3-137.1
-12.1-9.9
-11.7-10.6-10.7-12.1-12.5
-10.5-10.9-11.2-9.9
-11.7-9.8
1 Includes Department of Defense Military Assistance Program grant-aid shipments.2 Includes undocumented exports to Canada.3 Total arrivals of imported goods other than intransit shipments.4 Total exports are on a revised statistical month basis; end-use categories are on a statistical
NOTE.—Data shown include trade of the U.S. Virgin Islands.
Source: Department of Commerce, Bureau of the Census.
35
Digitized for FRASER http://fraser.stlouisfed.org/ Federal Reserve Bank of St. Louis

U.S. INTERNATIONAL TRANSACTIONSIn the second quarter, the merchandise trade deficit fell to $27.7 billion, from $28.4 billion (revised) in the firstquarter.
BILL
10
5
0
-5
-15
-20
-25
-30
-35
-40
-45
ONS OF DOLLARS* BILLIONS OF DOLL/
^—--\'"1
V— X
1 1 1
1981
SEASONALLY AOJUS
OURCE: DEPARTMEN
r-'/O
I V\
1 1 11982
TED
OF COMMERCE
A
' \
A\
A \\
\\\
\\
"X
1 1 1
1983
N BALANCE ON GOODS. t A Kin SFRUirpt;
V 1%N^V
I 1 11984
'O-N'V-^-v. x
-\\_\
ERCHANDISE
BALANCE
1 1 1
1985
/\
v
\ \/
1 1 I
1986
\\ ir_.^j .
1 1 11987
X J *"v^xS"/ BALANC
CURRENT A
1 1 1
1988
COUNCIL OF
)--
E ON:COUNT
1 1 1
1989
ECONOMIC ADVISERS
\RS*
10
5
0
-5
-10
15
-20
-25
-30
-35
-40
-45
[Millions of dollars; quarterly data seasonally adjusted. Credits (+), debits ( —)]
Period
1980198119821983198419851986198719881986: I
ninIV
1987- InmIV
1988: InmIV
1989: I"
Merchandise 1 2
Exports
224,269237,085211,198201,820219,900215,935223,367250,266319,25153,89956,79656,18256,49057,25560,01564,29768,69976,44778,47180,60483,729
r87,91990,866
Imports
-249,749-265,063-247,642-268,900-332,422
338 083-368,425
409 766-446,466-89,549-90,812-92,983-95,081
95 916-99^834- 104,903-109,113- 109,893- 109,882-110,943-115,748
r- 116,297— 118,584
Net balance
-25,48027 978
-36,44467 080
-112,522122 148
-145,058159 500
-127,215-35,650-34,016-36,801-38,591-38,661-39,819-40,606-40,414-33,446-31,411-30,339-32,019
r -28,378-27,718
Investment income 3
Eeceipts
72,50686,41283,54877,25185,90888,83288,615
104,703107,77523,97022,07821,74420,82225,11722,74423,57833,26526,75023,14824,72033,15926,862
Payments
-42,11952 329
-54,88452 376
-67,419-62,901-66,968
82 420- 105,548-17,357-17,533-15,729-16,350
19 755-2o',554-21,904-20,207-23,955-25,613-27,310-28,670-30,370
Net
30,38734,08328,66424,87518,48925,93121,64722,283
2,2276,6134,5456,0154,4725,3622,1901,674
13,0582,795
-2,465-2,590
4,489-3,508
Netmilitarytransac-
tions
2 577-1,523
474-3432 099
-3,5574 576
-2,8574 606
-1,411-1,298-1,089
-777-176-210
-1,031-1,440
-964-1,033-1,006-1,604-1,482
Nettravel andtranspor-
tationreceipts
997144992
-4,227-7,885-9,832-8,031-7,324-2,633-2,452-1,465-1,874-2,241
-2',088-1,279-1,993-1,854
-719-155
94-464
Otherservices,
net3
7,79411,08511,43612,26412,29912,35118,54717,90920,335
4,6204,5814,5394,8074,2504,3724,5554,7344,7875,0425,1265,3815,823
Balance ongoods andservices
9,12615,8102,191
-34,510-91,718-97,256
-117,470-129,488
111 892-28,280-27,653-29,210-32,330-31,190-35,555-36,687-26,055-28,682-30,586-28,964-23,659-27,265
Remit-tances,
pensions,and otherunilateral
trans-fers *
7 593-7,647
9 188-9/77612 468
-15,42615 778
-14,21214 656
-3,068-4,199-4,376-4,136-3,137-3,265-3,225-4,586-3,364-2,899-3,376-5,018-3,420
Balanceon current
account
1,5338,163
-6,997-44,286
-104,186112 682133 249
-143,700- 126,548-31,348-31,852-33,586-36,466-34,327-38,820-39,912-30,641-32,046-33,485-32,340-28,677-30,685
1 Excludes military.2 Adjusted from Census data for differences in timing and coverage.3 Fees and royalties from U.S. direct investments abroad or from foreign direct investments in the
United States are excluded from investment income and included in other services, net.
Source: Department of Commerce, Bureau of Economic Analysis.
36
Digitized for FRASER http://fraser.stlouisfed.org/ Federal Reserve Bank of St. Louis

U.S. INTERNATIONAL TRANSACTIONS—ContinuedIn the capital accounts, claims on foreigners reported by U.S. banks increased $22.6 billion in the first quarter of1989, compared with an increase of $30.9 billion in the fourth quarter of 1988. Liabilities to private foreignersreported by U.S. banks, excluding Treasury securities, increased $10.4 billion in the first quarter, compared with anincrease of $32.2 billion in the fourth quarter.
BILLIONS OF DOLLARS* BILLIONS OF DOLLARS*
20
-20
-40
20CHANGE INU.S. ASSETS
ABROAD, NET
-20
-40
1P81
'SEASONALLY ADJUSTED
SOURCE: DEPARTMENT OF COMMERCE
1989
COUNCIL Of ECONOMIC ADVISERS
[Millions of dollars; quarterly data seasonally adjusted, except as noted]
Period
198019811982198319841985198619871988
1986: InmIV
1987: InmIV
1988: InmIV
1989: I"
U.S. assets abroad, net[increase /capital outflow (— )]
Total
-86,118-110,951-121,153
49 777-22,304
32 628-99,665
76 218-82,110
-15,401-24,763-26,078-33,422
8,759-22,632-25,976-36,370
4,540-16,119-37,886-32,648
-31,816
U.S.officialreserve
assets 1 z
-8,1555 175
-4,965-1,196-3,131-3,858
3129,149
-3,566
-11516
280132
1,9563,419
323,742
1,50339
-7,3802,272
-4,000
Other U.S.Govern-
mentassets
-5,162-5,097-6,131
5006-5,489
2 821-2,024
9972,999
-232-238
-1,56511
40-195
308843
1 490-8851,9613,413
1,012
U.S.privateassets
-72,802-100,679-110,058
43 576-13,685-25,950-97,954
86 363-81,543
-15,054-24,541
24793-33,565
6,763-25,856-26,316-40,955
4,528-15,273
32 467-38,332
28 828
•Foreign assets in the U.S., net[increase/capital inflow ( + )] 2
Total
58,11283,03293,74684,869
102,621130,012221,605218,039219,299
39,04850,29169,92762,339
33,38151,13473,57559,949
27,02765,33446,17980,759
49,077
Foreignofficialassets
15,4974,9603,5935,8453,140
-1,08335,59445,19338,882
2,72015,83815,785
1,251
14,04010,329
75320,070
24,6315,8952 234
10,589
6,914
Otherforeignassets
42,61578,07290,15479,02399,481
131,096186,011172,847180,418
36,32834,45354,14261,088
19,34140,80572,82239,879
2,39659,43848,41370,170
42,163
Allocationsof specialdrawingrights
(SDRs)
1,1521,093
Statistical discrepancy
Total (sumof the itemswith signreversed)
25,32218,66334,4049,194
23,86915,29811,3081,878
-10,641
7,7016,324
- 10,2637,549
-7,81310,318
-7,6877,062
479-15,729
24,047-19,434
13,424
Of which:Seasonal
adjustmentdiscrepancy
3,5153 306
-4,6694,463
3,8952559
-4,5013,166
3,843-3,714-4,556
4,431
4,264
U.S. officialreserve
assets, net *(unadjusted,
end ofperiod)
26,75630,07433,95833,74734,93443,18648,51145,79847,802
44,91946,59548,08748,511
48,82445,14045,07045,798
43,18641,02847,78847,802
49,854
1 Consists of gold, special drawing rights (SDRs), convertible currencies, and the U.S. reserveposition in the IMF.
2 Quarterly data are not seasonally adjusted.
Sources: Department of Commerce (Bureau of Economic Analysis) and Department of theTreasury.
37
Digitized for FRASER http://fraser.stlouisfed.org/ Federal Reserve Bank of St. Louis

ContentsTOTAL OUTPUT, INCOME, AND SPENDING page
Gross National Product 1Gross National Product in 1982 Dollars 2Implicit Price Deflators for Gross National Product 2Changes in GNP, Personal Consumption Expenditures, and Related Price Measures 3Nonfmancial Corporate Business—Output, Costs, and Profits 3National Income 4Personal Consumption Expenditures 4Sources of Personal Income 5Disposition of Personal Income 6Farm Income 7Corporate Profits 8Gross Private Domestic Investment 9Expenditures for New Plant and Equipment 10
EMPLOYMENT, UNEMPLOYMENT, AND WAGESStatus of the Labor Force 11Selected Unemployment Rates 12Selected Measures of Unemployment and Unemployment Insurance Programs 13Nonagricultural Employment 14Average Weekly Hours, Hourly Earnings, and Weekly Earnings—Private Nonagricultural Industries 15Employment Cost Index—Private Industry 15Productivity and Related Data, Business Sector 16
PRODUCTION AND BUSINESS ACTIVITYIndustrial Production and Capacity Utilization 17Industrial Production—Major Market Groups and Selected Manufactures 18New Construction 19New Private Housing and Vacancy Rates 19Business Sales and Inventories—Manufacturing and Trade 20Manufacturers' Shipments, Inventories, and Orders 21
PRICESProducer Prices 22Consumer Prices—All Urban Consumers 23Changes in Producer Prices for Finished Goods 24Changes in Consumer Prices—All Urban Consumers 24Prices Received and Paid by Farmers 25
MONEY, CREDIT, AND SECURITY MARKETSMoney Stock, Liquid Assets, and Debt Measures 26Components of Money Stock and Liquid Assets 27Aggregate Reserves and Monetary Base 27Bank Loans and Securities 28Sources and Uses of Funds, Nonfarm Nonfinancial Corporate Business 29Consumer Installment Credit 29Interest Rates and Bond Yields 30Common Stock Prices and Yields 31
FEDERAL FINANCEFederal Receipts, Outlays, and Debt 32Federal Receipts by Source and Outlays by Function 33Federal Sector, National Income Accounts Basis 34
INTERNATIONAL STATISTICSIndustrial Production and Consumer Prices—Major Industrial Countries 35U.S. Merchandise Exports and Imports 35U.S. International Transactions 36
General Notes
Detail in these tables may not add to totals because of rounding.Unless otherwise noted, all dollar figures are in current dollars.Symbols used:
p Preliminary.' Revised.c Corrected.... Not available (also, not applicable).NSA not seasonally adjusted.
For sale by the Superintendent of Documents, U.S. Government Printing Office,Washington, B.C. 20402. Price $2.25 (single copy) ($2.81 foreign).
Subscription price: $24.00 per year; $30.00 for foreign mailing.
38 U.S. GOVERNMENT PRINTING OFFICE : 1989 0—21-141
Digitized for FRASER http://fraser.stlouisfed.org/ Federal Reserve Bank of St. Louis