economic implications of changing food consumption patterns
DESCRIPTION
Economic implications of changing food consumption patterns. Franco Sassi PhD OECD – Health Division Rome, 14 th November 2013. UN High-level Meeting on NCDs. Leading Risk Factors for Health Attributable Mortality, 2004. Source: WHO, 2009. Deaths from NCDs Worldwide, by Income Group. - PowerPoint PPT PresentationTRANSCRIPT

ECONOMIC IMPLICATIONS OF CHANGING FOOD CONSUMPTION PATTERNS
Franco Sassi PhDOECD – Health Division
Rome, 14th November 2013

UN High-level Meeting on NCDs
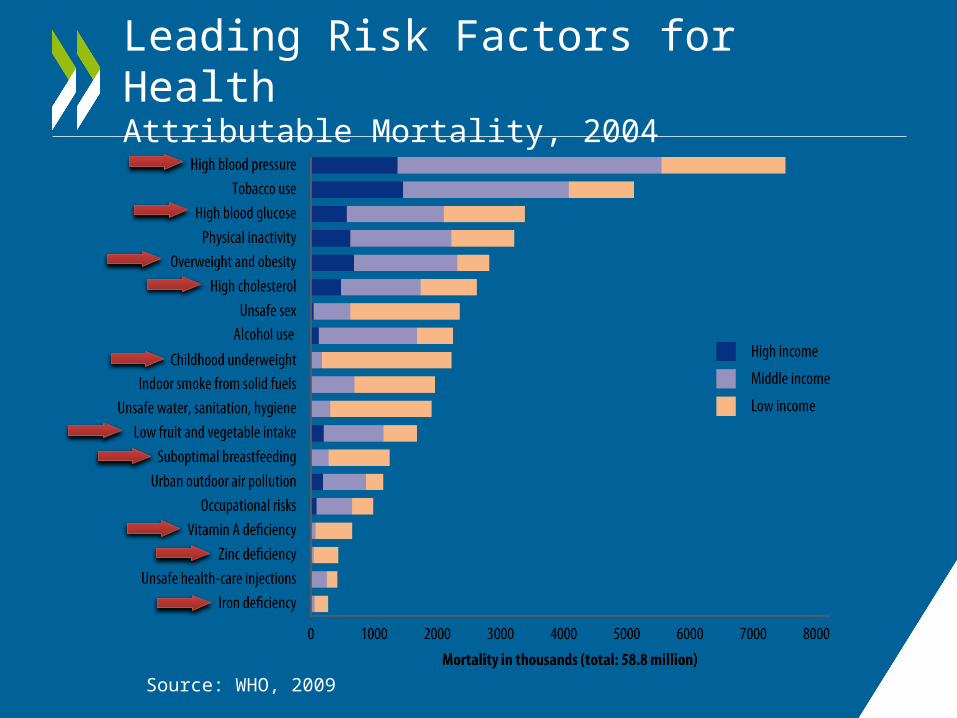
Leading Risk Factors for HealthAttributable Mortality, 2004
Source: WHO, 2009

2004 2015 20300
10,000,000
20,000,000
30,000,000
40,000,000
50,000,000
60,000,000
High income Higer-middle incomeLower-middle income Low income
Deaths from NCDsWorldwide, by Income Group
Source: WHO estimates and projections, 2008

Obesity: a Global Epidemic
India
China
Russia
OECD
Brazil
S Africa
UK
Mexico
% of adult population
0% 10%20%30%40%50%60%70%80%
• In Brazil, obesity tripled in men and doubled in women in 30 years; in India, up to 40% are overweight in urban areas
• Diabetes in China is now as common as in the US
• Obesity accounts for less than 1% of GDP in most OECD countries, over 1% in the US and up to 4% in China
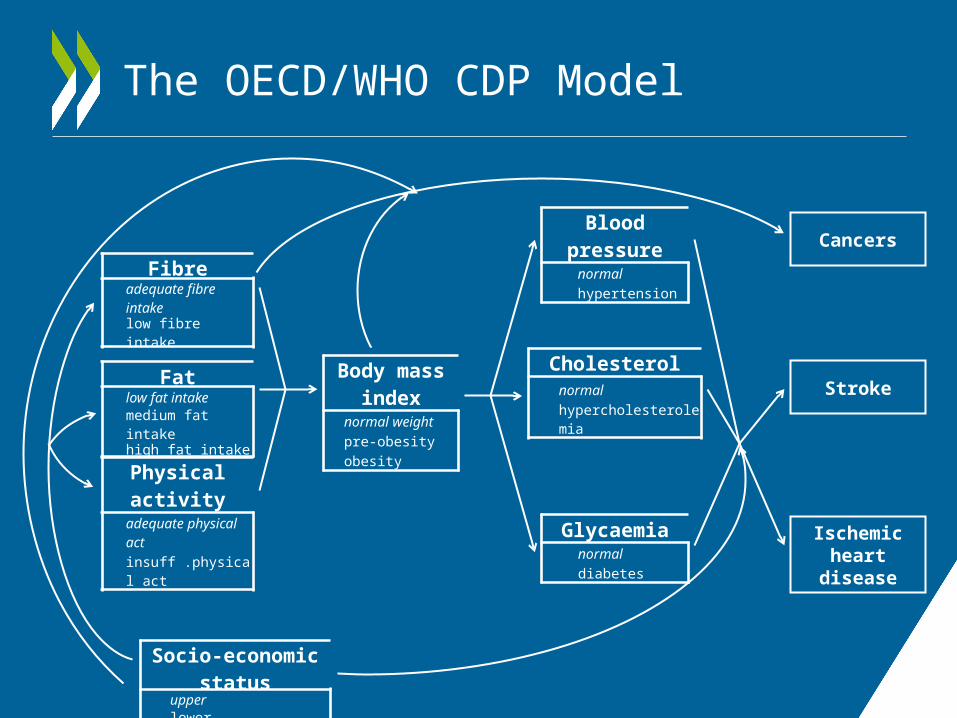
The OECD/WHO CDP Model
Physical activityadequate physical actinsuff .physical act
Body mass index
normal weightpre-obesityobesity
Blood pressurenormalhypertension
Cholesterolnormal
hypercholesterolemia
Glycaemianormaldiabetes
Cancers
Stroke
Ischemic heart
disease
Fatlow fat intakemedium fat intakehigh fat intake
Fibreadequate fibre intakelow fibre intake
Socio-economic statusupperlower

A Comprehensive & Affordable Prevention Package
OECD Countries Emerging Economies
Mass media campaigns Mass media campaigns
Compulsory food labelling Compulsory food labelling
Industry self-regulation of food advertising to children
Government regulation of food advertising to children
Physician-dietician counselling Fiscal measures
School-based interventions
Canada Europe Brazil China
24.03 $/cap 22.45 $/cap 0.40 $/cap 0.20 $/cap

What Can Prevention Achieve?

Prevention Keeps HealthyYears of Life Free of NCDs
0 7 14 21 28 35 42 490
100000002000000030000000400000005000000060000000700000008000000090000000
100000000
Time (years)
Mill
ion
life
year
s
0 7 14 21 28 35 42 490
100000002000000030000000400000005000000060000000700000008000000090000000
100000000
Time (years)
Mill
ion
life
year
s
Europe China Brazil Canada
Cancers (lung, colorectal, breast) Cardiovascular diseases

An Affordable Prevention Package
0
1
2
3
4
5
Tobacco useAlcohol use
US$
per
hea
d
4.5
1.2
0.4

Prevention is a Good InvestmentImpact on Health Expenditure
0 5 10 15 20 25 30 35 40 45 50
-140
-120
-100
-80
-60
-40
-20
0
EuropeCanadaBrazilChina
Time (years)
$ / c
apit
a
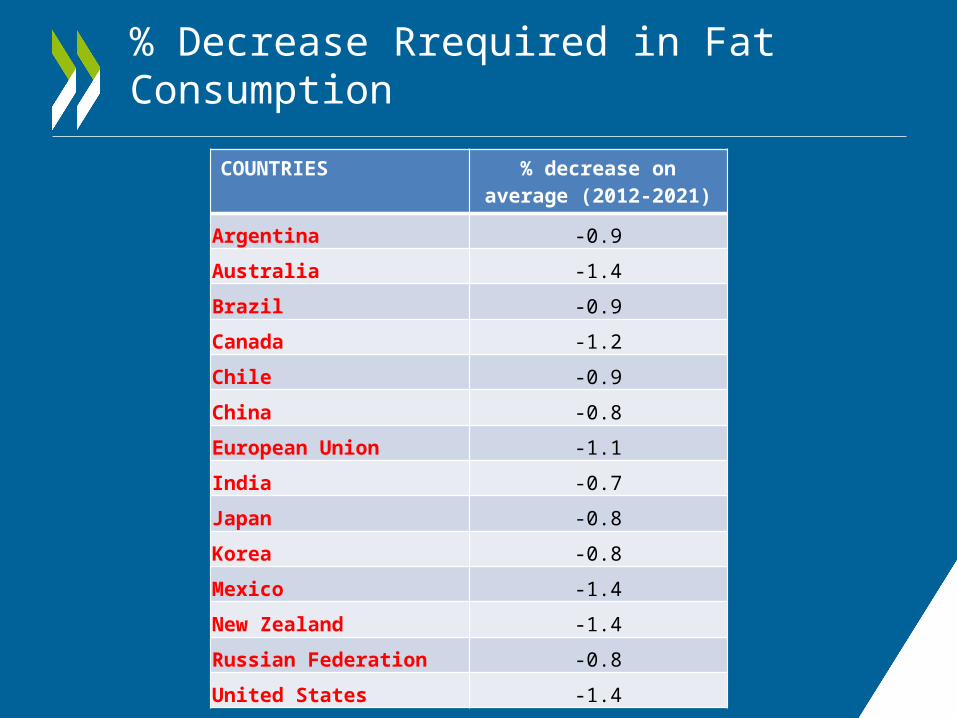
% Decrease Rrequired in Fat Consumption
COUNTRIES % decrease on average (2012-2021)
Argentina -0.9
Australia -1.4
Brazil -0.9
Canada -1.2
Chile -0.9
China -0.8
European Union -1.1
India -0.7
Japan -0.8
Korea -0.8
Mexico -1.4
New Zealand -1.4
Russian Federation -0.8
United States -1.4

Scenario 1 Results
2012 2013 2014 2015 2016 2017 2018 2019 2020 2021
-5-4-3-2-101
Atlantic beef world price
% differ-ence
2012 2013 2014 2015 2016 2017 2018 2019 2020 2021
-4
-3
-2
-1
0
Cheese world price% differ-ence
2012 2013 2014 2015 2016 2017 2018 2019 2020 2021
-3
-2
-1
0
Vegetable oil world price
% differ-ence
2012 2013 2014 2015 2016 2017 2018 2019 2020 2021
-3
-2
-1
0
Coarse grains world price
% difference

SATURATED FAT REDUCTION needed to meet WHO guidelines
EU NZL AUS USA BRA RUS ARG MEX CHN
-40
-35
-30
-25
-20
-15
-10
-5
0
Reductions to meet 10% calorie intake

Scenario2 Results
baseline scenario 10%
baseline scenario 10 %
Consumption Production
0
2000
4000
6000
8000
10000
12000
14000Bovine consumption and production (kt)
USABRAE27CHN

2012 2013 2014 2015 2016 2017 2018 2019 2020 20210
1000
2000
3000
4000
5000
6000
Pacific beef and veal price (USD/t)
baselinescenario
Scenario2 Results

2012 2013 2014 2015 2016 2017 2018 2019 2020 20210
200
400
600
800
1000
1200
1400
Vegetable oil world price
baseline scenario
Scenario2 Results

Key Policy Implications
• Obesity and NCDs are global economic issues
• Food and nutrition policies must be part of a comprehensive intersectoral prevention strategy
• Potential for major health, health expenditure and productivity gains
• Limited effects on world markets imply such changes should be economically sustainable over the medium and long term