economic impact study: port of virginia - william & mary€¦ · economic impact study: port of...
TRANSCRIPT
Economic Impact Study: Port of Virginia
THE OFPortVIRGINIA
Compiled by:The Mason School of Business Compete Center
College of William & Mary Williamsburg, VA 23187
Presented: January 2008
Please direct questions to the:Virginia Port Authority
Business Analysis and Strategy Department 600 World Trade Center
Norfolk, VA 23510 757.683.8000
THE FISCAL YEAR 2006 VIRGINIA ECONOMIC AND FISCAL IMPACTS OF VIRGINIA PORT AUTHORITY OPERATIONS
Prepared for:
The Virginia Port Authority
January 8, 2008
Prepared by:
Roy L. Pearson, Ph.D.
James R. Bradley, Ph.D.
K. Scott Swan, Ph.D.
Hector H. Guerrero, Ph.D. Director of the Compete Center
The Mason School of Business Compete Center College of William & Mary
Williamsburg, Virginia 23187

i
THE FISCAL YEAR 2006 VIRGINIA ECONOMIC AND FISCAL IMPACTS OF VIRGINIA PORT AUTHORITY OPERATIONS
The Virginia Port Authority (VPA) in Norfolk, Virginia, commissioned the Mason School of Business Compete Center to assess the Fiscal Year (FY) 2006 economic and fiscal impacts in Virginia of the VPA operations at four public terminals in Hampton Roads.
The Virginia Port Authority, together with its operating unit, Virginia International Terminals (VIT), owns and operates three cargo terminals in the Hampton Roads metropolitan area: Newport News Marine Terminal (NNMT), Norfolk International Terminal (NIT), and Portsmouth Marine Terminal (PMT). In addition, the Maersk Terminal (APM) on VPA-owned land in FY 2006 is included in the VPA cargo handling statistics, as a component of the VPA impact. These four terminals are referred to in this report as the VPA terminals. This report provides estimates of the revenue and employment impacts of the operations of these four terminals. These impacts occur on an ongoing basis from providing services enabling the flow of waterborne exports and imports out of and into Virginia. The estimates do not include the impacts of other Virginia terminals, such as the Hampton Roads private coal terminals, other bulk cargo terminals, and the Port of Richmond.
The Virginia economic impact of the VPA operations includes direct, indirect, and induced impacts stemming from the availability and use of the ports. The impacts summarized below are the sum of the direct, indirect, and induced impacts.
Port operations include the VPA and port operations providers such as pilots and longshoremen, and support services including truck and rail transportation, warehousing and storage, and ship servicing. The VPA terminals handled 16.3 million tons of cargo valued at $36.1 billion in FY 2006. The Virginia economic impact of the VPA port operations was $4.5 billion in revenues supporting 35,665 jobs earning compensation of $1.6 billion.
EXECUTIVE SUMMARY

ii
Exports were 6.6 million tons of goods worth $14.7 billion. The impact of moving exports through the four VPA terminals is included in the port operations impacts above. The port availability and VPA services also supported the Virginia production of goods for export, which is an additional impact on the Virginia economy. Virginia businesses produced an estimated $8.1 billion of goods exported through these terminals, 55 percent of the total value of VPA exports. Production of these goods generated revenues of $16.3 billion, and $4.3 billion in Virginia employee compensation to 93,520 employees.
Imports through the VPA terminals were 9.7 million tons valued at $21.5 billion (excluding freight, insurance, and customs duties). Handling these imports and getting them to their initial destination is included in the port operations impacts. That includes transporting the 60.5% of the imports destined to go beyond Virginia’s borders. However, an estimated 39.5%, or $8.5 billion, remained in Virginia, to be used as inputs by Virginia businesses and government and sold to Virginia consumers. Making these goods available in Virginia generated additional economic activity, in warehousing, in trucking goods to their final destinations, and in wholesale and retail operations. The economic impact of this activity was $20.3 billion in revenues supporting 213,816 Virginia jobs with earnings of $7.6 billion.
The total Virginia economic activity produced or facilitated by the FY 2006 VPA port operations was revenues of $41.1 billion, with Virginia employee compensation of $13.5 billion to 343,001 employees. This economic activity generated state and local income, sales, and real property taxes amounting to an estimated $1.2 billion, plus other government fees and taxes.
iii
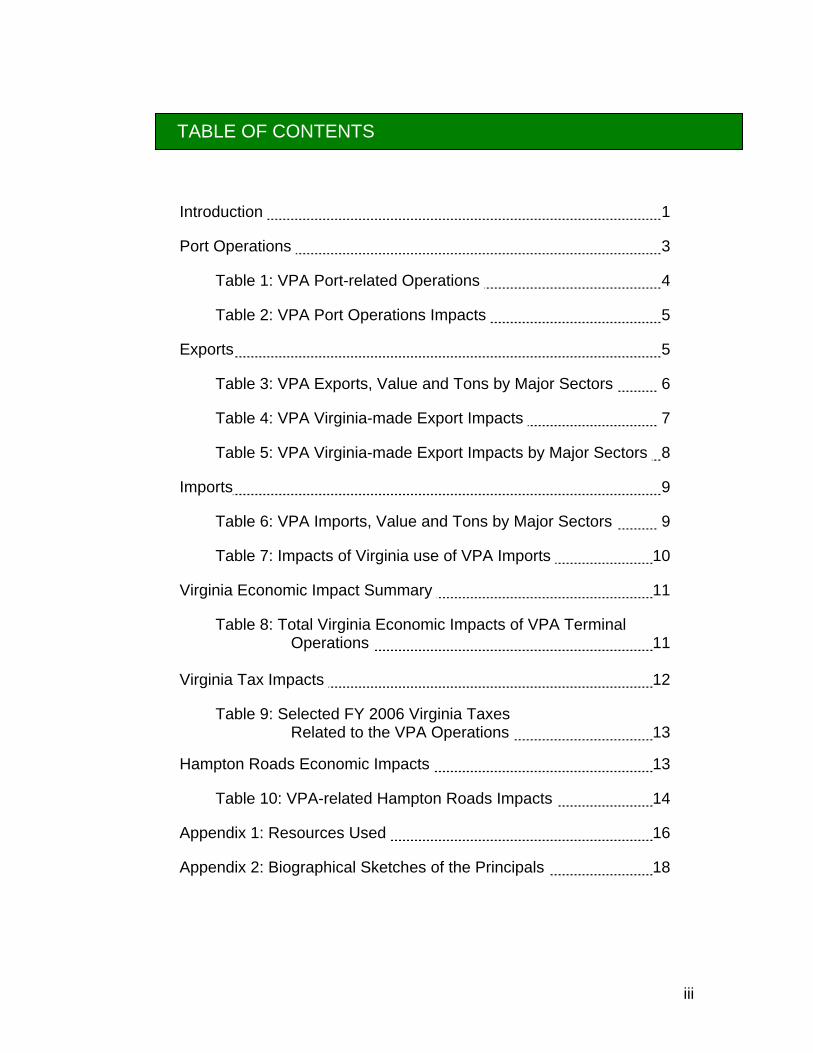
Introduction 1
Port Operations 3
Table 1: VPA Port-related Operations 4
Table 2: VPA Port Operations Impacts 5
Exports 5
Table 3: VPA Exports, Value and Tons by Major Sectors 6
Table 4: VPA Virginia-made Export Impacts 7
Table 5: VPA Virginia-made Export Impacts by Major Sectors 8
Imports 9
Table 6: VPA Imports, Value and Tons by Major Sectors 9
Table 7: Impacts of Virginia use of VPA Imports 10
Virginia Economic Impact Summary 11
Table 8: Total Virginia Economic Impacts of VPA Terminal Operations 11
Virginia Tax Impacts 12
Table 9: Selected FY 2006 Virginia Taxes Related to the VPA Operations 13
Hampton Roads Economic Impacts 13
Table 10: VPA-related Hampton Roads Impacts 14
Appendix 1: Resources Used 16
Appendix 2: Biographical Sketches of the Principals 18
TABLE OF CONTENTS
1
THE FISCAL YEAR 2006 VIRGINIA ECONOMIC AND FISCAL IMPACTS OF VIRGINIA PORT AUTHORITY OPERATIONS
The Virginia Port Authority (VPA) in Norfolk, Virginia, commissioned the Mason School of Business Compete Center to assess the Fiscal Year (FY) 2006 economic and fiscal impacts in Virginia of the VPA operations at four public terminals in Hampton Roads. These terminals are a Virginia gateway to the world for goods too heavy or bulky to transport economically by air.
The VPA Port operations have a direct economic impact on Virginia income and jobs created by the VPA and other port service companies handling the flow of goods through the terminals, transporting goods to the terminal for export, and transporting imported goods from the terminals to their initial purchaser. These FY 2006 impacts include handling the flow of exports from 38 states, D.C., Canada and Mexico; and imports destined for 35 states, D.C., Canada and Mexico.
Exports made in Virginia have a separate, additional Virginia economic impact. Producing export goods in Virginia creates income and jobs here, a direct economic benefit. Overseas demand for these goods is the ultimate force driving this production. However, the local availability of a geographically well-located deepwater port with the ability and capacity to handle a wide variety of export goods provides global market access for Virginia businesses, expanding the volume they can produce and sell profitably. We include the impact of Virginia-made exports to illustrate an important contribution of the VPA ports to the state economy.
Imports remaining in Virginia for use and sale also have an additional Virginia impact. While they do not directly bring new income into the Commonwealth, these imports are inputs into production and trade in Virginia, raw materials for Virginia businesses, and also goods creating Virginia income and jobs as Virginia truckers, wholesalers, and retailers make them available to local consumers. These imports are the Virginia base of the supply chain meeting local demand, a supply chain of services and goods with a large impact on Virginia income and jobs. The dollar cost of the imports is an expense, not an income. But the value added, the margins earned in the supply chain here, are income, creating Virginia payroll, taxes, and jobs. This economic impact is supported by the port operations, and needs to be recognized as a direct contribution to Virginia’s
INTRODUCTION

2
economy. We concur with the Virginia Economic Development Partnership’s view in Virginia and International Trade: Economic Impact of International Imports (May, 2005), “Large and positive impacts of economic activity are powerful arguments for the value of imports.”
In sum, this study provides estimates of the direct economic impact on Virginia in FY 2006 of three VPA port-related activities: the VPA port operations; Virginia production of goods exported through the VPA-terminals; and Virginia use and sale of goods imported through the VPA terminals.
Impacts are reported here by three measures: revenue (the dollar receipts or sales of goods and services), employee compensation (the wages and salaries earned and benefits received by payroll employees), and number of payroll employees. There are three streams of revenue, payroll, and jobs making up the total economic impact: the direct, indirect, and induced impacts.
The direct impacts are the force giving rise to the other two streams, the indirect and induced impacts. The revenue shown as a direct impact identifies the flow of payments generated initially by the demand for the goods or services being analyzed. This revenue is not a measure of the sellers’ contribution to Virginia’s Gross Domestic Product, since the products sold includes inputs purchased from other businesses. These purchases are an additional impact, labeled an indirect impact, identifying the business-to-business (B2B) payment flows created by the direct sales. The revenue shown as a Virginia indirect impact is the B2B spending for inputs and supplies from other Virginia businesses – from providers of goods and suppliers of services ranging from power and other utilities to cleaning, accounting, legal, and medical services. The payroll and jobs created by this B2B spending are an indirect impact, caused by and dependent upon the initial demand for goods and services, the direct impact.
There also is a third impact stream created, called an induced impact in economic impact parlance, as the income earned by households and businesses in the process of meeting the direct and indirect demands is spent, primarily for households’ consumption, and as the taxes paid to state and local governments also are spent, in providing public services and infrastructure. The induced impact is very real and predictable. Households do spend most of their income, and state and local governments do spend the taxes received. For example, if a plant shuts down (a direct impact), not only do its suppliers lose sales and cut payroll and jobs (an indirect impact), but other businesses that sell to the households of the plant and the suppliers’ workers lose customers and cut back – an induced impact. State and local governments also have less revenue and adjust their spending downward.

3
Each of these impact flows creates earned income. The part of earnings reported here is employee compensation, also referred to simply as payroll. We do not report estimates of other income components such as corporate profits or proprietors’ income. However, the income measures not reported here are included in estimating the state and local government tax flows generated. The employment measure here is payroll jobs, excluding sole proprietors. These jobs include part-time as well as full-time ones, as in the U.S. Bureau of Labor Statistics and Virginia Employment Commission employment statistics. There is reliable information on FY 2006 payroll and jobs by type of establishment, so our focus is on measures that can be estimated and verified with confidence.
The estimated impacts on Virginia in FY 2006 of the three VPA port-related activities — the VPA port operations, Virginia production of goods exported through the VPA-terminals, and Virginia use and sales of goods imported through the VPA terminals — are each described. Then, a summary of the total impacts follows. Next, we discuss some of the state and local government tax impacts. The final section of this report turns to a summary of the economic impacts in the Virginia portion of the Virginia Beach-Norfolk-Newport News, VA-NC Metropolitan Statistical Area (MSA), encompassing the Virginia cities of Chesapeake, Hampton, Newport News, Norfolk, Poquoson, Portsmouth, Suffolk, Virginia Beach, and Williamsburg; and the Virginia counties of Gloucester, Isle of Wight, James City, Mathews, Surry, and York. We call this metropolitan area Hampton Roads, the name generally used by Virginians.
The Virginia Port Authority, together with its operating unit, Virginia International Terminals (VIT), owns and operates three cargo terminals in the Hampton Roads metropolitan area: Newport News Marine Terminal (NNMT), Norfolk International Terminal (NIT), and Portsmouth Marine Terminal (PMT). In addition, the Maersk Terminal (APM), which was on VPA-owned land in FY 2006, is included in the VPA cargo handling statistics as a component of the VPA impact. These four terminals are referred to in this report as the VPA port or terminals. Not included are the impacts of other Virginia terminals, such as the Hampton Roads private coal terminals, other bulk cargo terminals, and the Port of Richmond.
In FY 2006, these VPA port operations handled 16,345,739 tons of cargo. To visualize the scale of that feat, the Ronald Reagan nuclear aircraft carrier weighs about 102,500 tons fully loaded. Moving 16.3 million tons is equivalent to moving
PORT OPERATIONS
4
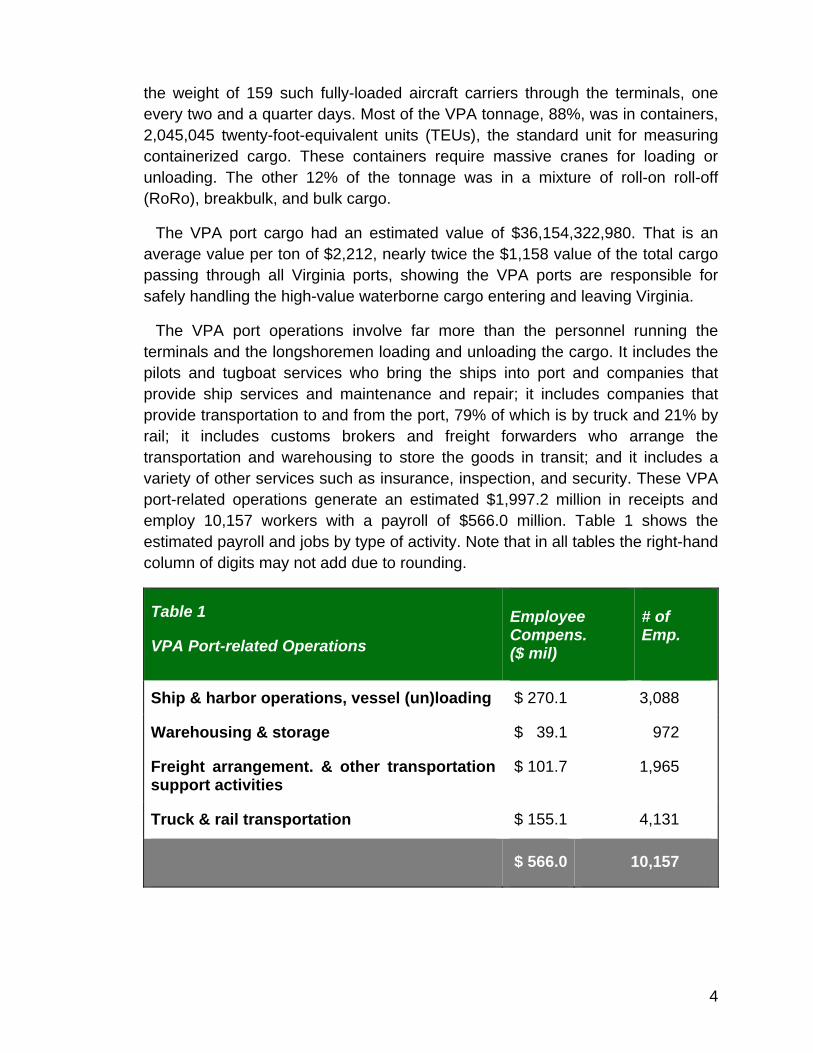
the weight of 159 such fully-loaded aircraft carriers through the terminals, one every two and a quarter days. Most of the VPA tonnage, 88%, was in containers, 2,045,045 twenty-foot-equivalent units (TEUs), the standard unit for measuring containerized cargo. These containers require massive cranes for loading or unloading. The other 12% of the tonnage was in a mixture of roll-on roll-off (RoRo), breakbulk, and bulk cargo.
The VPA port cargo had an estimated value of $36,154,322,980. That is an average value per ton of $2,212, nearly twice the $1,158 value of the total cargo passing through all Virginia ports, showing the VPA ports are responsible for safely handling the high-value waterborne cargo entering and leaving Virginia.
The VPA port operations involve far more than the personnel running the terminals and the longshoremen loading and unloading the cargo. It includes the pilots and tugboat services who bring the ships into port and companies that provide ship services and maintenance and repair; it includes companies that provide transportation to and from the port, 79% of which is by truck and 21% by rail; it includes customs brokers and freight forwarders who arrange the transportation and warehousing to store the goods in transit; and it includes a variety of other services such as insurance, inspection, and security. These VPA port-related operations generate an estimated $1,997.2 million in receipts and employ 10,157 workers with a payroll of $566.0 million. Table 1 shows the estimated payroll and jobs by type of activity. Note that in all tables the right-hand column of digits may not add due to rounding.
Table 1
VPA Port-related Operations
Employee Compens. ($ mil)
# of Emp.
Ship & harbor operations, vessel (un)loading $ 270.1 3,088
Warehousing & storage $ 39.1 972
Freight arrangement. & other transportation support activities
$ 101.7 1,965
Truck & rail transportation $ 155.1 4,131
$ 566.0 10,157

5
Table 2 shows the VPA port operations’ direct impact on revenue as well as payroll and jobs. Carrying out these operations requires an additional $725.6 million in purchases from other businesses, B2B transactions, for goods and services ranging from fuel, power, communications, and office supplies to business and professional services, supporting another 6,588 Virginia jobs, shown in Table 2 as the indirect impact.
In addition, an induced demand of $1.7 billion results from employees spending their wages and salaries, businesses spending out of their net cash flow, and state and local government tax receipts being spent for public goods and services. This induced impact, a ripple effect felt throughout the Virginia economy, accumulates to $1.7 billion in sales, engaging an estimated 18,920 Virginia workers, largely in the retail and service sectors. The combined effects are shown in Table 2, summing to $4.5 billion in revenue, $1.6 billion in payroll, and 35,665 Virginia jobs.
Table 2
VPA Port Operations Impacts ($ in mil)
Direct
Indirect
Induced
Total
Revenues/Sales $ 1,997.2 $ 725.6 $ 1,741.6 $ 4,464.5
Employee Compensation
$ 566.0 $ 287.7 $ 785.4 $ 1,639.1
Employment 10,157 6,588 18,920 35,665
We identified from PIERS — the Port Import Export Reporting Service — data for the specific FY 2006 shipments through the VPA terminals by 2,355 U.S. Harmonized Tariff Codes used in international trade. We then matched this information to 404 North American Industry Classification System (NAICS) 6-digit codes. Next we aggregated the data to 106 4-digit NAICS categories of goods
EXPORTS
6
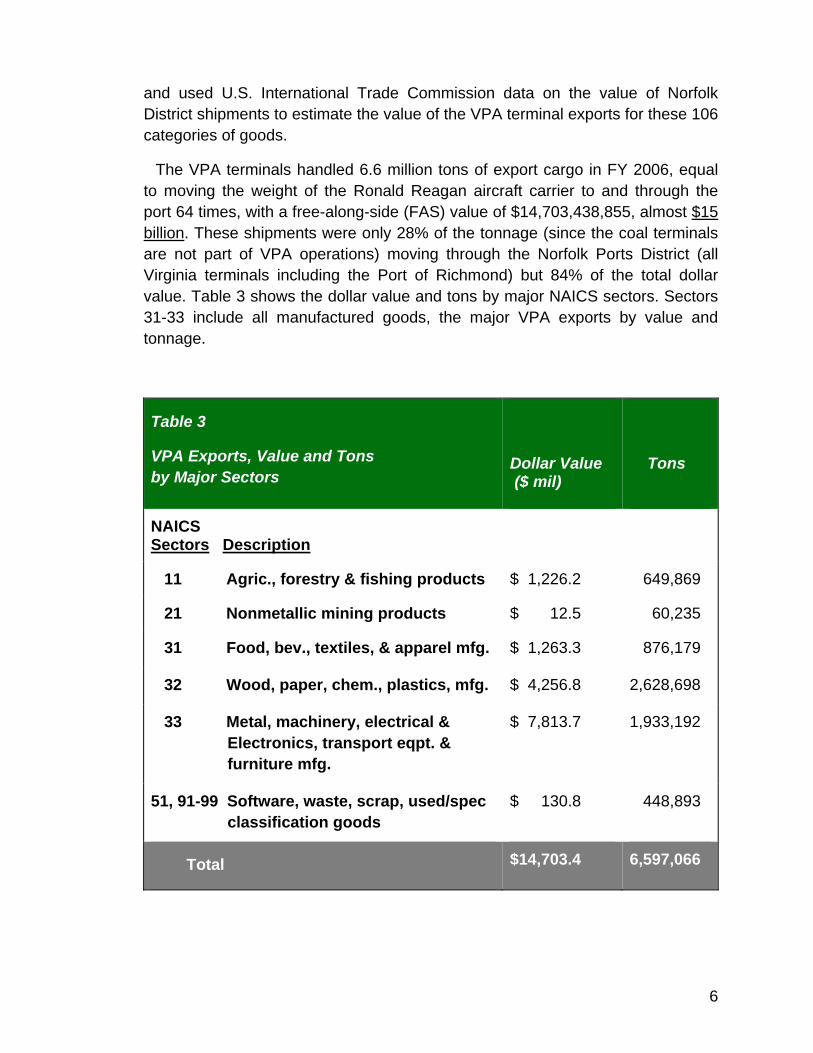
and used U.S. International Trade Commission data on the value of Norfolk District shipments to estimate the value of the VPA terminal exports for these 106 categories of goods.
The VPA terminals handled 6.6 million tons of export cargo in FY 2006, equal to moving the weight of the Ronald Reagan aircraft carrier to and through the port 64 times, with a free-along-side (FAS) value of $14,703,438,855, almost $15 billion. These shipments were only 28% of the tonnage (since the coal terminals are not part of VPA operations) moving through the Norfolk Ports District (all Virginia terminals including the Port of Richmond) but 84% of the total dollar value. Table 3 shows the dollar value and tons by major NAICS sectors. Sectors 31-33 include all manufactured goods, the major VPA exports by value and tonnage.
Table 3
VPA Exports, Value and Tons by Major Sectors
Dollar Value ($ mil)
Tons
NAICS Sectors Description
11 Agric., forestry & fishing products $ 1,226.2 649,869
21 Nonmetallic mining products $ 12.5 60,235
31 Food, bev., textiles, & apparel mfg. $ 1,263.3 876,179
32 Wood, paper, chem., plastics, mfg. $ 4,256.8 2,628,698
33 Metal, machinery, electrical & Electronics, transport eqpt. & furniture mfg.
$ 7,813.7 1,933,192
51, 91-99 Software, waste, scrap, used/spec classification goods
$ 130.8 448,893
Total $14,703.4 6,597,066

7
The Virginia economic impacts of getting these goods to port and on their way aboard ship are included as part of the port operations impacts already discussed. In this section we estimate the separate, additional impacts stemming from the portion of these exports made in Virginia.
Based on VPA shipment data, survey responses, and U.S. Department of Commerce export analysis by state, we estimate that 55% of the VPA exports were goods produced in Virginia. We believe 55% is a conservative estimate. The May 2005 Virginia Economic Development Partnership report, Virginia and International Trade: Economic Impact of International Imports, indicated that 74% of Virginia exports originated in Virginia. However, that percent may include some transshipment of goods actually produced elsewhere.
These Virginia-made exports were valued at $8.1 billion, and engaged 27,852 Virginia workers in their production, with a payroll of $1.4 billion.
These export products are made here, and the exporting businesses buy inputs and supplies from other Virginia businesses, thus creating a very large indirect impact. The employees of these businesses live in Virginia, spending most of their earnings here, yielding an additional induced impact. The cumulative total impact is $16.3 billion in sales by Virginia businesses, with a payroll of $4.3 billion to 93,520 employees. Table 4 gives the amounts by type of impact.
Table 4
VPA Virginia-made Export Impacts ($ in mil)
Direct
Indirect
Induced
Total
Revenues/Sales $ 8,086.9 $ 2,900.8 $ 5,297.0 $ 16,284.7
Employee Compensation
$ 1,376.5 $ 829.2 $ 2,080.8 $ 4,286.5
Employment 27,852 18,205 47,462 93,520
8
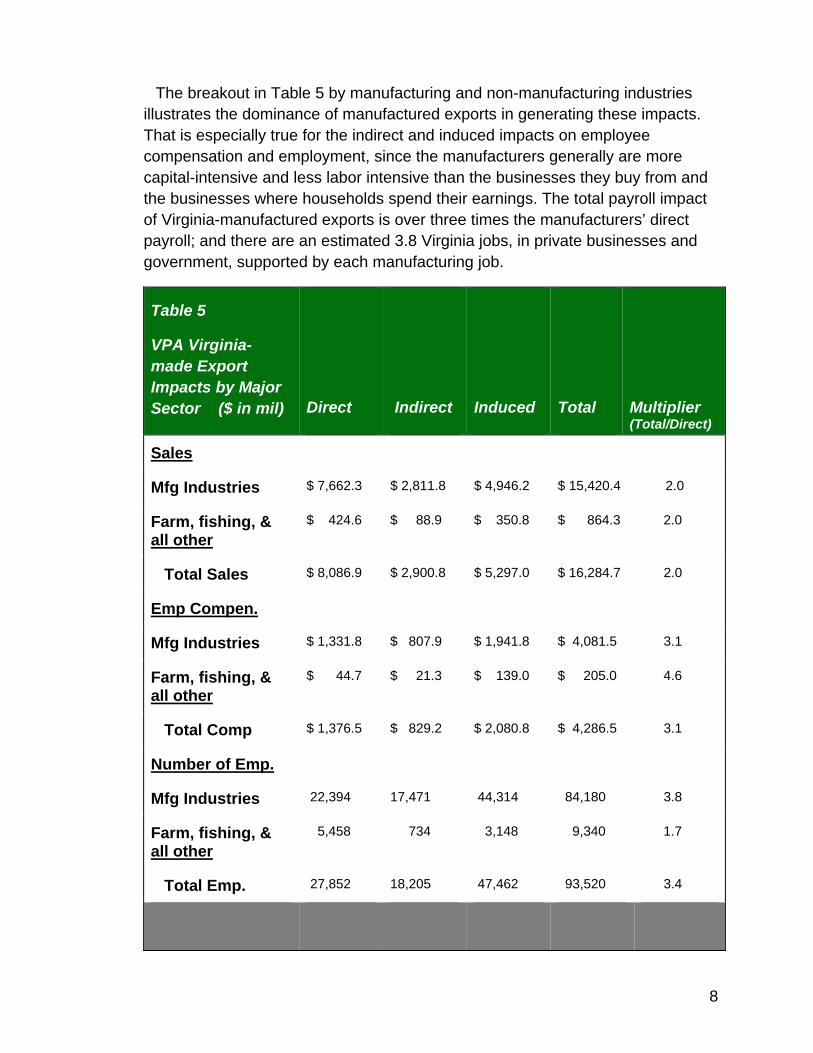
The breakout in Table 5 by manufacturing and non-manufacturing industries illustrates the dominance of manufactured exports in generating these impacts. That is especially true for the indirect and induced impacts on employee compensation and employment, since the manufacturers generally are more capital-intensive and less labor intensive than the businesses they buy from and the businesses where households spend their earnings. The total payroll impact of Virginia-manufactured exports is over three times the manufacturers’ direct payroll; and there are an estimated 3.8 Virginia jobs, in private businesses and government, supported by each manufacturing job.
Table 5
VPA Virginia-made Export Impacts by Major Sector ($ in mil)
Direct
Indirect
Induced
Total
Multiplier (Total/Direct)
Sales
Mfg Industries $ 7,662.3 $ 2,811.8 $ 4,946.2 $ 15,420.4 2.0
Farm, fishing, & all other
$ 424.6 $ 88.9 $ 350.8 $ 864.3 2.0
Total Sales $ 8,086.9 $ 2,900.8 $ 5,297.0 $ 16,284.7 2.0
Emp Compen.
Mfg Industries $ 1,331.8 $ 807.9 $ 1,941.8 $ 4,081.5 3.1
Farm, fishing, & all other
$ 44.7 $ 21.3 $ 139.0 $ 205.0 4.6
Total Comp $ 1,376.5 $ 829.2 $ 2,080.8 $ 4,286.5 3.1
Number of Emp.
Mfg Industries 22,394 17,471 44,314 84,180 3.8
Farm, fishing, & all other
5,458 734 3,148 9,340 1.7
Total Emp. 27,852 18,205 47,462 93,520 3.4

9
The value and tonnage of imports by product category flowing through the VPA terminals were identified from the same sources used for exports. These four terminals handled 9.7 million tons of imports, the equivalent of 95 Ronald Reagan aircraft carriers sailing into and throughout Virginia, with a customs value of $21.5 billion. Table 6 shows the value and tonnage by major industry sectors. The $13.3 billion worth of manufactured durable goods in NAICS sector 33 accounted for 62% of the total value. These durable goods include furniture and automobiles destined for households as well as machinery headed to businesses.
Table 6
VPA Imports, Value and Tons by Major Sectors
Dollar Value ($ mil)
Tons
NAICS Sectors Description
11 Agric., forestry & fishing products $ 684.9 772,964
21 Nonmetallic mining products $ 24.6 268,645
31 Food, bev., textiles, & apparel mfg. $ 3,175.0 1,448,139
32 Wood, paper, chem., plastics, mfg. $ 4,149.4 2,891,065
33 Metal, machinery, electrical & Electronics, transport eqpt. & furniture mfg.
$ 13,286.3 2,955,530
51, 91-99 Software, waste, scrap, used/spec classification goods
$ 130.6 1,412,330
Total $ 21,450.9 9,748,673
IMPORTS
10
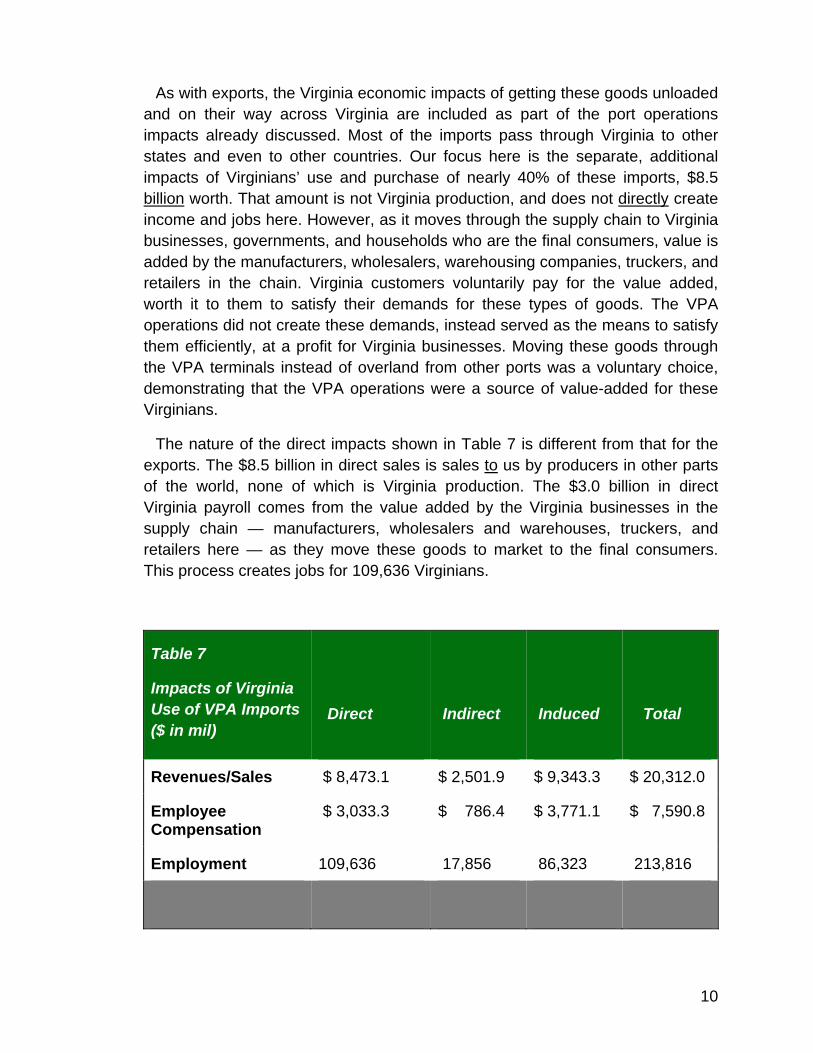
As with exports, the Virginia economic impacts of getting these goods unloaded and on their way across Virginia are included as part of the port operations impacts already discussed. Most of the imports pass through Virginia to other states and even to other countries. Our focus here is the separate, additional impacts of Virginians’ use and purchase of nearly 40% of these imports, $8.5 billion worth. That amount is not Virginia production, and does not directly create income and jobs here. However, as it moves through the supply chain to Virginia businesses, governments, and households who are the final consumers, value is added by the manufacturers, wholesalers, warehousing companies, truckers, and retailers in the chain. Virginia customers voluntarily pay for the value added, worth it to them to satisfy their demands for these types of goods. The VPA operations did not create these demands, instead served as the means to satisfy them efficiently, at a profit for Virginia businesses. Moving these goods through the VPA terminals instead of overland from other ports was a voluntary choice, demonstrating that the VPA operations were a source of value-added for these Virginians.
The nature of the direct impacts shown in Table 7 is different from that for the exports. The $8.5 billion in direct sales is sales to us by producers in other parts of the world, none of which is Virginia production. The $3.0 billion in direct Virginia payroll comes from the value added by the Virginia businesses in the supply chain — manufacturers, wholesalers and warehouses, truckers, and retailers here — as they move these goods to market to the final consumers. This process creates jobs for 109,636 Virginians.
Table 7
Impacts of Virginia Use of VPA Imports ($ in mil)
Direct
Indirect
Induced
Total
Revenues/Sales $ 8,473.1 $ 2,501.9 $ 9,343.3 $ 20,312.0
Employee Compensation
$ 3,033.3 $ 786.4 $ 3,771.1 $ 7,590.8
Employment 109,636 17,856 86,323 213,816

11
These businesses also need the goods and services of other Virginia businesses in their operations, creating $2.5 billion in indirect, or B2B, demand. Production of goods and services to meet that demand employs another 17,856 Virginia workers receiving $786.4 million in payroll. The incomes earned in Virginia by businesses and households along with taxes and fees paid to state and local government largely are spent in Virginia, creating the final rounds of ripple effects. This induced demand, with an estimated $9.3 billion in purchases, adds another $3.8 billion in payroll for 86,323 Virginia employees. The cumulative impact of Virginians using and purchasing the $8.5 billion of goods produced elsewhere is over $20 billion in Virginia purchases generating $7.6 billion in Virginia payroll and 213,816 Virginia jobs, as reported in Table 7.
The total estimated impacts on Virginia in FY 2006 of the three VPA port-related activities — the VPA port operations, Virginia production of goods exported through the VPA-terminals, and Virginia use and sales of goods imported through the VPA terminals — are reported in Table 8. The VPA terminal operations produce or contribute to Virginia revenues of $41.1 billion with employee compensation of $13.5 billion to 343 thousand Virginia employees. These employees were 9.0% of the 3,832 thousand Virginia resident employment, and their compensation was 7.4% of total FY 2006 employee compensation to private sector and state and local government employees.
Table 8
Total Virginia Economic Impacts of VPA Terminal Operations ($ in mil)
Direct
Indirect
Induced
Total
Multiplier (Total/Direct)
Revenue/Sales $ 18,557.2 $ 6,128.3 $ 16,381.9 $ 41,067.5 2.2
Employee Compensation
$ 4,975.8 $ 1,903.3 $ 6,637.3 $ 13,516.4 2.7
Employment 147,645 42,650 152,705 343,001 2.3
VIRGINIA ECONOMIC IMPACT SUMMARY

12
All of these economic impacts are flows of activity, in this case occurring within a fiscal year. The purpose is to show the full contribution to the Commonwealth’s economy flowing from the use of the VPA terminals, including the contribution flowing from the exports produced in Virginia and the imports used here. We do not speculate about how much of the Virginia production of exports would be lost if the VPA operations did not exist. It would be less than 100% of the impacts we report here, but surely it would be substantial. Similarly, we do not speculate about the amount of increase in prices, loss of availability of goods, and loss of income and jobs in the state’s wholesale and retail supply chains if the imported goods were not available through this port. Rather than speculate about hypothetical levels that cannot be confirmed, we show the full revenue, payroll, and jobs impacts of the actual use taking place, use that is growing and expected to continue to grow in the future.
The impact estimates reported here generate a wide range of payments to state and local governments, including corporate profits taxes, personal income taxes, general and motor vehicle sales taxes, property taxes, motor fuels taxes, business and motor vehicle licenses, and non-tax fees and fines. An accurate estimate of all of these payments requires a level of detailed information beyond the scope of this study. We limit our estimates of tax payments to the three major tax sources: the state personal and corporate income tax, the 5% general sales tax, and the real property tax paid to cities and counties.
We estimate that the impacts of the FY 2006 VPA port operations, Virginia-made exports through the VPA terminals, and Virginia use and sales of imports arriving at the VPA terminals generated $379.2 million in Virginia corporate and personal income tax payments, 3.7% of the total income tax payments; $426.5 million in general sales taxes, 9.5% of the total paid; and $404.1 million in real property taxes, 5.7% of such taxes paid to Virginia cities and counties (excluding towns), as reported in Table 9.
VIRGINIA TAX IMPACTS

13
Table 9
Selected FY 2006 Virginia Taxes Related to the VPA Operations ($ in mil)
VPA Optns. Related
Total VA Collections
VPA-related % of Total
Virginia income taxes $ 379.2 $10,180.1 3.7%
Virginia 5% general sales taxes $ 426.5 $ 4,505.1 9.5%
Virginia real property taxes $ 404.1 $ 7,035.8 5.7%
Totals $1,209.8 $21,721.0 5.6%
In sum, the VPA operations directly and indirectly were a major force in producing $1,209.8 million, or 5.6%, — 1 dollar out of every 18 — of the total amount raised by these three government revenue sources.
The Hampton Roads Metropolitan Statistical Area (MSA) accounted for 19% of Virginia’s Gross State Product in 2005 and 16.7% of Virginia’s employee compensation to private sector and state and local government employees, according to the U.S. Department of Commerce Bureau of Economic Analysis.
The VPA terminals are located in three Hampton Roads cities and most of the businesses participating in the port operations are based in this metropolitan area encompassing the Virginia cities of Chesapeake, Hampton, Newport News, Norfolk, Poquoson, Portsmouth, Suffolk, Virginia Beach, and Williamsburg; and the Virginia counties of Gloucester, Isle of Wight, James City, Mathews, Surry, and York. Many of Virginia’s exporting businesses have plants in the Hampton Roads metropolitan area. That concentration raises the Hampton Roads share of the VPA port operations impacts above the state average.
HAMPTON ROADS ECONOMIC IMPACTS

14
Table 10
VPA-related Hampton Roads Impacts ($ in mil)
Direct
Indirect
Induced
Total
Port operations
Revenues/Sales $ 1,617.8 $ 587.8 $ 1,410.7 $ 3,616.3
Employee Compensation
$ 458.4 $ 233.1 $ 636.2 $ 1,327.7
Employment 8,227 5,336 15,325 28,889
Va made exports
Revenues/Sales $ 2,102.6 $ 754.2 $ 1,377.2 $ 4,234.0
Employee Compensation
$ 357.9 $ 215.6 $ 541.0 $ 1,114.5
Employment 7,241 4,733 12,340 24,315
Va sold imports
Revenues/Sales $ 1,864.1 $ 550.4 $ 2,055.5 $ 4,470.0
Employee Compensation
$ 667.3 $ 173.0 $ 829.6 $ 1,670.0
Employment 24,120 3,928 18,991 47,040
Total
Revenue/sales
Compensation
Employment
$ 5,584.4
$ 1,483.7
39,589
$ 1,892.4
$ 621.6
13,998
$ 4,843.5
$ 2,006.8
46,657
$ 12,320.3
$ 4,112.1
100,244

15
Our data analysis indicates that 81% of the direct impacts of VPA port operations are in Hampton Roads, 29% of the Virginia production for export, and 22% of the impacts accruing from Virginia use and sale of imports. The result, reported in Table 10, is about 30% of the VPA-related impacts occur in Hampton Roads, with a total revenue impact of $12.3 billion and employee compensation of $4.1 billion to an estimated 100,244 Hampton Roads employees.
16
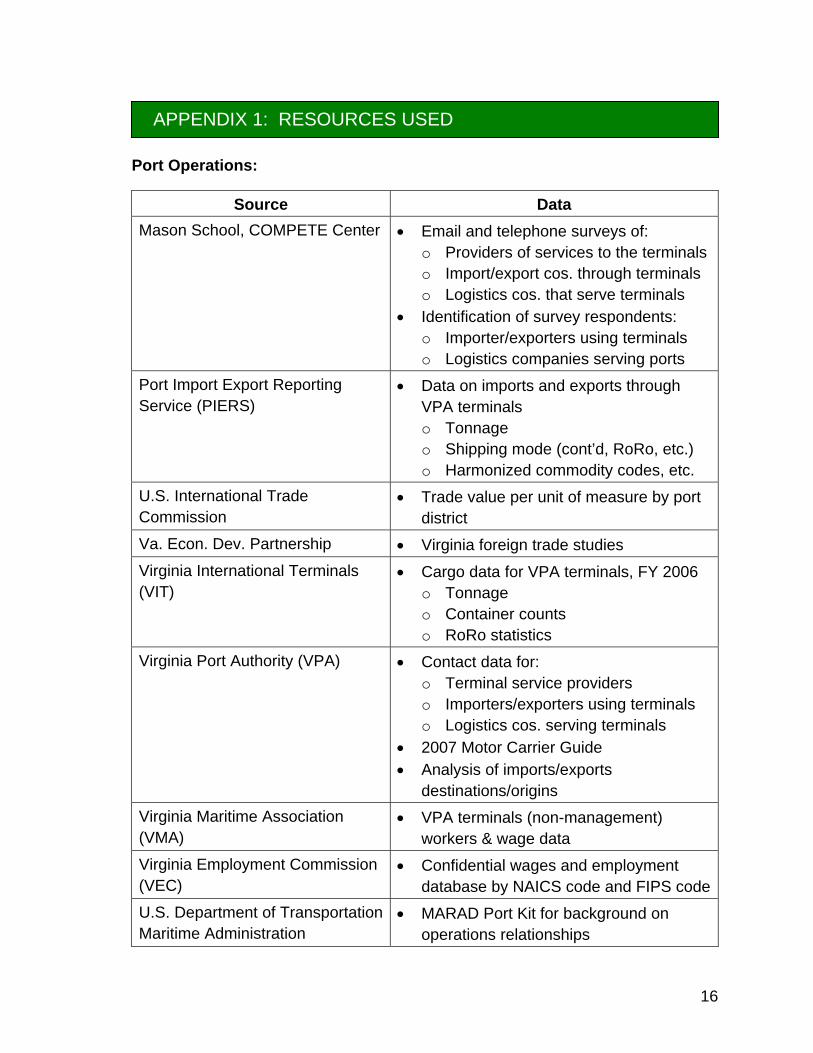
Port Operations:
Source Data Mason School, COMPETE Center • Email and telephone surveys of:
o Providers of services to the terminals o Import/export cos. through terminals o Logistics cos. that serve terminals
• Identification of survey respondents: o Importer/exporters using terminals o Logistics companies serving ports
Port Import Export Reporting Service (PIERS)
• Data on imports and exports through VPA terminals o Tonnage o Shipping mode (cont’d, RoRo, etc.) o Harmonized commodity codes, etc.
U.S. International Trade Commission
• Trade value per unit of measure by port district
Va. Econ. Dev. Partnership • Virginia foreign trade studies Virginia International Terminals (VIT)
• Cargo data for VPA terminals, FY 2006 o Tonnage o Container counts o RoRo statistics
Virginia Port Authority (VPA) • Contact data for: o Terminal service providers o Importers/exporters using terminals o Logistics cos. serving terminals
• 2007 Motor Carrier Guide • Analysis of imports/exports
destinations/origins Virginia Maritime Association (VMA)
• VPA terminals (non-management) workers & wage data
Virginia Employment Commission (VEC)
• Confidential wages and employment database by NAICS code and FIPS code
U.S. Department of Transportation Maritime Administration
• MARAD Port Kit for background on operations relationships
APPENDIX 1: RESOURCES USED
17
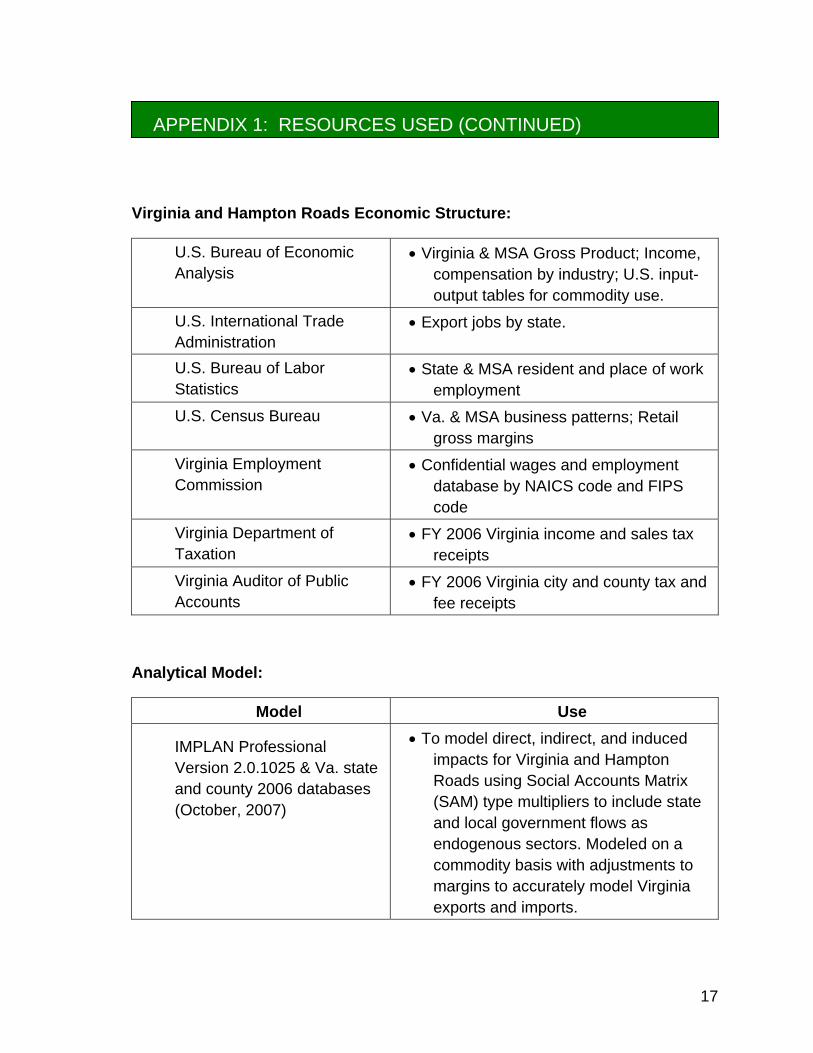
Virginia and Hampton Roads Economic Structure:
U.S. Bureau of Economic Analysis
• Virginia & MSA Gross Product; Income, compensation by industry; U.S. input-output tables for commodity use.
U.S. International Trade Administration
• Export jobs by state.
U.S. Bureau of Labor Statistics
• State & MSA resident and place of work employment
U.S. Census Bureau • Va. & MSA business patterns; Retail gross margins
Virginia Employment Commission
• Confidential wages and employment database by NAICS code and FIPS code
Virginia Department of Taxation
• FY 2006 Virginia income and sales tax receipts
Virginia Auditor of Public Accounts
• FY 2006 Virginia city and county tax and fee receipts
Analytical Model:
Model Use
IMPLAN Professional Version 2.0.1025 & Va. state and county 2006 databases (October, 2007)
• To model direct, indirect, and induced impacts for Virginia and Hampton Roads using Social Accounts Matrix (SAM) type multipliers to include state and local government flows as endogenous sectors. Modeled on a commodity basis with adjustments to margins to accurately model Virginia exports and imports.
APPENDIX 1: RESOURCES USED (CONTINUED)
18
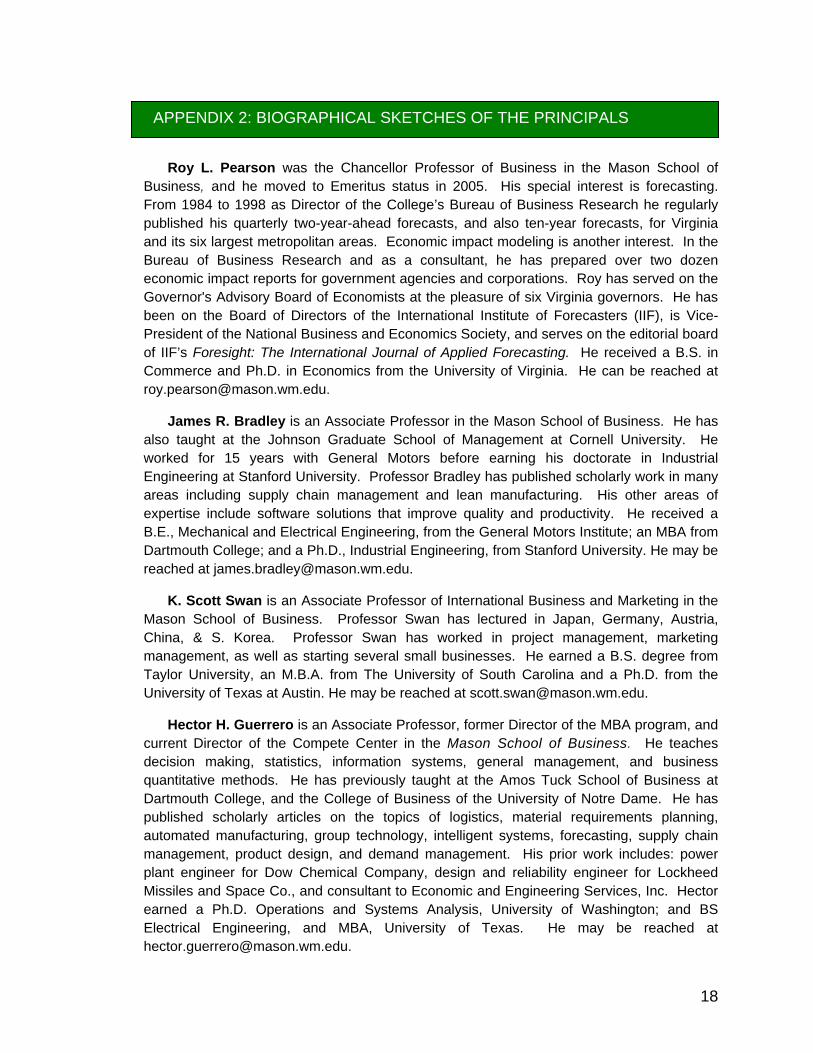
Roy L. Pearson was the Chancellor Professor of Business in the Mason School of Business, and he moved to Emeritus status in 2005. His special interest is forecasting. From 1984 to 1998 as Director of the College’s Bureau of Business Research he regularly published his quarterly two-year-ahead forecasts, and also ten-year forecasts, for Virginia and its six largest metropolitan areas. Economic impact modeling is another interest. In the Bureau of Business Research and as a consultant, he has prepared over two dozen economic impact reports for government agencies and corporations. Roy has served on the Governor's Advisory Board of Economists at the pleasure of six Virginia governors. He has been on the Board of Directors of the International Institute of Forecasters (IIF), is Vice-President of the National Business and Economics Society, and serves on the editorial board of IIF’s Foresight: The International Journal of Applied Forecasting. He received a B.S. in Commerce and Ph.D. in Economics from the University of Virginia. He can be reached at [email protected].
James R. Bradley is an Associate Professor in the Mason School of Business. He has also taught at the Johnson Graduate School of Management at Cornell University. He worked for 15 years with General Motors before earning his doctorate in Industrial Engineering at Stanford University. Professor Bradley has published scholarly work in many areas including supply chain management and lean manufacturing. His other areas of expertise include software solutions that improve quality and productivity. He received a B.E., Mechanical and Electrical Engineering, from the General Motors Institute; an MBA from Dartmouth College; and a Ph.D., Industrial Engineering, from Stanford University. He may be reached at [email protected].
K. Scott Swan is an Associate Professor of International Business and Marketing in the Mason School of Business. Professor Swan has lectured in Japan, Germany, Austria, China, & S. Korea. Professor Swan has worked in project management, marketing management, as well as starting several small businesses. He earned a B.S. degree from Taylor University, an M.B.A. from The University of South Carolina and a Ph.D. from the University of Texas at Austin. He may be reached at [email protected].
Hector H. Guerrero is an Associate Professor, former Director of the MBA program, and current Director of the Compete Center in the Mason School of Business. He teaches decision making, statistics, information systems, general management, and business quantitative methods. He has previously taught at the Amos Tuck School of Business at Dartmouth College, and the College of Business of the University of Notre Dame. He has published scholarly articles on the topics of logistics, material requirements planning, automated manufacturing, group technology, intelligent systems, forecasting, supply chain management, product design, and demand management. His prior work includes: power plant engineer for Dow Chemical Company, design and reliability engineer for Lockheed Missiles and Space Co., and consultant to Economic and Engineering Services, Inc. Hector earned a Ph.D. Operations and Systems Analysis, University of Washington; and BS Electrical Engineering, and MBA, University of Texas. He may be reached at [email protected].
APPENDIX 2: BIOGRAPHICAL SKETCHES OF THE PRINCIPALS