economic impact study for the rubicon trail
TRANSCRIPT

Office: (916) 538-9857 | www.new-econ.net | 508 Gibson Drive, Suite 260, Roseville, CA 95678
Economic Impact Study for the Rubicon Trail
FINAL REPORT
Prepared by New Economics & Advisory
June 7, 2019

Chapter 1: Executive Summary
Introduction This Economic Impact Analysis (EIA, or Study) has been commissioned by El Dorado
County (County) to evaluate the economic value of the Rubicon Trail (Trail) within the
regional economy of El Dorado and Placer Counties. The Rubicon Trail is an increasingly
popular destination for off‐highway motoring and other types of outdoor recreation, and
the County and other stakeholders are interested to know what the role of the Trail is in
the regional economy.
Key questions that this study analyzes are:
How much economic activity does the Rubicon Trail bring to El Dorado and Placer
Counties and the surrounding region?
What are the primary categories of spending from Rubicon Trail users, and where
does this spending typically occur?
How many local jobs does the spending from the Rubicon Trail support in El
Dorado and Placer Counties?
Summary of Findings Finding 1: The Rubicon Trail is an important regional asset to El Dorado and Placer
Counties, driving significant visitation and generating approximately $57.4 million per
year in direct spending. Economic activity generated by the trail comes a variety of
sources, including purchases of off‐highway vehicles, trailers, equipment, operations and
maintenance services, food, supplies, etc.
Finding 2: In addition to the $57.4 million per year in direct spending, additional
economic activity is provided by the Trail in the form of “spin‐off activity” which
includes spending from suppliers and employees related to the Trail. This spin‐off
activity is registered in various areas throughout California and beyond, as users of the
Trail purchase goods and services in various locations. Locally, the trail brings an
estimated $16.0 million in total economic activity to El Dorado County and $9.8 million
to Placer County each year. The total economic activity generated by the trail is
summarized in Figure 1 below, which shows that over the past ten years, the trail has
generated over $570 million in total direct expenditures. When accounting for the full
spectrum of economic impacts (including direct, indirect, and induced impacts), the
Rubicon Trail has stimulated an estimated $160 million in El Dorado County and $98
million in Placer County. Much of this spending will provide impact to El Dorado County
in the form of sales tax, although the specific amount is not calculated in this analysis.
FINAL Economic Impact Analysis for the Rubicon Trail June 7, 2019
Page 1 of 29

Finding 3: The economic output of the Rubicon Trail supports approximately 125 jobs
in El Dorado County and Placer Counties. Located in various industries, these jobs
include those that are directly related to the trail (such as vehicle sales) and other
supporting sectors that support the industry.
Finding 4: According to the most recent estimates available, the Trail sees an average
of approximately 10,400 vehicle trips per year, and has been growing steadily. New
Economics has worked closely with the County to come up with the trail counts used in
this analysis based on recent trail surveys and a set of reasonable assumptions. However,
no complete set of trail counts exist that capture activity at all times of the day, every day,
and at each major segment of the Trail. In future years the County may wish to consider
implementing complete trail user counts using electronic trail counters or other methods.
Finding 5: The large majority of users of the Rubicon Trail come from areas outside El
Dorado County, illustrating the Trail’s influence as a major tourism destination.
According to a survey administered to Trail Users, approximately 96 percent of Trail Users
come from outside El Dorado County, and a large portion (approximately 20 percent)
come from outside California.
Finding 6: New Economics administered a survey to Trail Users in 2018 to assist in the
calculation of economic impacts and to gain a better understanding of the behavior of
Trail Users. This survey received nearly 800 completed surveys returned. Notable
results from the survey responses include:
Trail Users spend an average of $64,400 to purchase their OHVs (which occurs
once every 11 years for each user, on average). Plus, users typically spend an
additional $36,600 on upgrades and modifications to their vehicles over a 9‐year
Summary of Total Economic Impacts ‐ 2018 $
Rubicon Trail Economic Impact Analysis
El Dorado
County
Placer
County
Economic Output $57,354,000 $15,965,000 $9,837,000
10-Year Extrapolation $573,540,000 $159,650,000 $98,370,000
[1] Total economic activity includes direct, indirect, and induced impacts.
Prepared by New Economics & Advisory, May 2019.
1
Item
Total Economic Impacts,
Including Spin‐Off [1]
Direct Impacts Only
(All Geographic Areas)
FINAL Economic Impact Analysis for the Rubicon Trail June 7, 2019
Page 2 of 29

period. In addition, nearly 70 percent of Survey Respondents reported having
more than one OHV.
Approximately 56 percent of Trail Users report towing their OHV(s) with a trailer.
These trailers cost on average $4,400 and are purchased once every eight years.
Trail Users spend, on average, $1,901 per year on general operations and
maintenance on their vehicles.
Trail Users spent, on average, $444 per trip on items associated with their trip to
the Rubicon, including gasoline, food/ drinks, supplies, entertainment, and other
goods and services.
Approximately 26 percent of Trail Users typically stay in a hotel before or after
their trip on the Rubicon. According to the User Survey, the average user who
stays in a hotel rents 1.9 rooms for 1.3 nights, at an average nightly rate of $144.
It should be noted that only a portion of the total spending related to the Trail
occurs in El Dorado and Placer Counties. For example, survey responses indicate
that approximately 13 percent of primary OHV purchases occur in El Dorado
County and 9 percent in Placer County.
Finding 6: El Dorado County has invested significant resources into the trail over the
past ten years, including capital improvements educational programs, operations/
maintenance, law enforcement, etc. The County has spent approximately $8.5 million
on these items over the past ten years, all of which has been secured from grant funding
or other sources outside the County’s operating funds. To our knowledge, Placer County
has not appropriated funding in recent years for Trail maintenance.
Finding 7: Organized tours and events on the Rubicon Trail provide a substantial
quantity of spending, conservatively accounting for approximately $1,000,000 per year
in direct spending. When including the spin‐off spending activity associated with these
events contribute approximately $1.2 million in El Dorado and Placer Counties, which
occurs in the form of food, supplies, entertainment, etc.
FINAL Economic Impact Analysis for the Rubicon Trail June 7, 2019
Page 3 of 29

Chapter 2: Introduction
The Rubicon Trail spans from the Georgetown area in El Dorado County to the Tahoma area of Placer County, constituting a total of 22 miles of challenging off‐highway terrain. Map 1 shows the location of the Trail. Users of the trail can enter either from Wentworth Springs or the Loon Lake trailhead on the western terminus of the trail, or from Tahoma on the eastern terminus. The trailheads on the western terminus are located approximately 20 miles from Placerville and 80 miles from Sacramento.
The Rubicon’s variety of advanced terrain, spectacular views, and numerous camping destinations along the way make it an extremely popular destination for off‐road enthusiasts. According to interviews with users of the trail and other published resources, the Rubicon is known as the “Crown Jewel” of all off‐highway trails. There are many organized activities on the Trail, including the annual Jeep Jamboree, and Jeep USA events, which host thousands of participants each year. While the majority of the activity on the trail comes from OHVs, other activities including motorcycling, bicycling, and hiking also occur on the trail.
Vicinity Map of the Rubicon Trail
Rubicon Trail Economic Impact AnalysisMap 1
FINAL Economic Impact Analysis for the Rubicon Trail June 7, 2019
Page 4 of 29
The Trail’s close proximity to several major urban markets provide a vast and ever‐growing contingent of users, with over 14 million residents that reside with a 4 hour‐drive.
FINAL Economic Impact Analysis for the Rubicon Trail June 7, 2019
Page 5 of 29
Chapter 3: Trail User Survey Results
Many of the results presented in this Economic Impact Analysis are based upon a survey that was administered to various Rubicon Trail users. This survey was designed to provide a more complete understanding of the various ways that the Rubicon Trail is used, the dollar amounts spent by users on various categories, and other ways that the trail brings value to the region. This Chapter summarizes the results of the Rubicon Trail User Survey.
Survey Background and Methodology The User Survey was developed by New Economics in consultation with County staff and various experts and users of the Trail. During the initial phase of this analysis, New Economics became familiar with the unique history, uses, and attributes of the Trail through a series of interviews with trail users and experts, as well as during a tour of the Trail conducted in September 2018. From this baseline understanding, we began to craft a series of questions that were designed to help provide insight into the economic value of the trail.
The survey questions were finalized in October of 2019 and sent electronically to various Trail users by the County and other organizations. The survey was “live” from November 9 to December 17, 2018, and enjoyed an excellent response rate, with nearly 800 responses collected. After the survey was closed, New Economics compiled and analyzed the results. The following sections outline certain key conclusions derived from the User Survey. Additional results from the survey are used directly in the quantification of economic value of the Trail and are presented in the subsequent chapter.
Key Survey Results Trail User Origin The first question asked in the survey was meant to identify the areas from which Rubicon Trail users travel in order to access the Trail by asking for the home zip code each survey respondent. New Economics sorted these results into the top responses, sorting by zip code, City, and County.
Figure 2 summarizes the results of the trail user origin data, as shown by top region of residence of trail users. As shown, approximately 22 percent of users come from the Bay Area, 17 percent come from the Sacramento Region, 41 percent come from elsewhere in California, and 19 percent come from other states.
FINAL Economic Impact Analysis for the Rubicon Trail June 7, 2019
Page 6 of 29
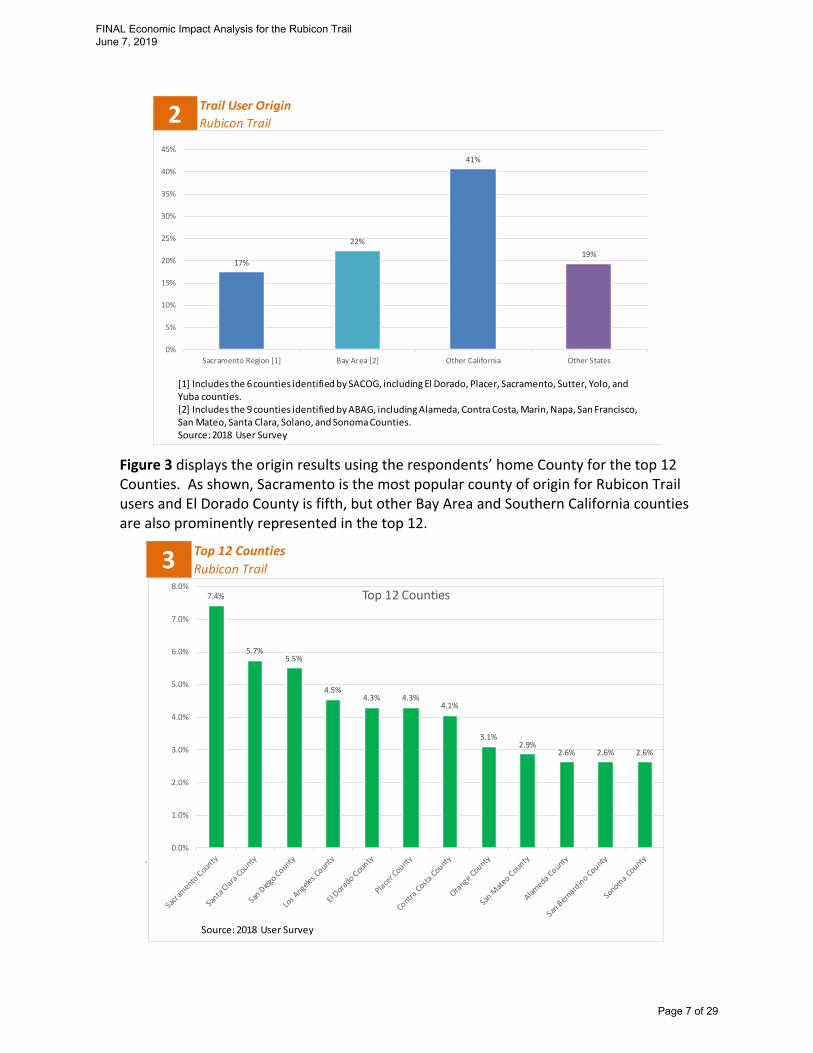
Figure 3 displays the origin results using the respondents’ home County for the top 12 Counties. As shown, Sacramento is the most popular county of origin for Rubicon Trail users and El Dorado County is fifth, but other Bay Area and Southern California counties are also prominently represented in the top 12.
Trail User Origin
Rubicon Trail2
17%
22%
41%
19%
0%
5%
10%
15%
20%
25%
30%
35%
40%
45%
Sacramento Region [1] Bay Area [2] Other California Other States
[1] Includes the 6 counties identified by SACOG, including El Dorado, Placer, Sacramento, Sutter, Yolo, and Yuba counties.[2] Includes the 9 counties identified by ABAG, including Alameda, Contra Costa, Marin, Napa, San Francisco, San Mateo, Santa Clara, Solano, and Sonoma Counties.Source: 2018 User Survey
Top 12 Counties
Rubicon Trail37.4%
5.7%5.5%
4.5%4.3% 4.3%
4.1%
3.1%2.9%
2.6% 2.6% 2.6%
0.0%
1.0%
2.0%
3.0%
4.0%
5.0%
6.0%
7.0%
8.0%Top 12 Counties
Source: 2018 User Survey
FINAL Economic Impact Analysis for the Rubicon Trail June 7, 2019
Page 7 of 29

Trail Entry and Exit Points The vast majority of survey respondents indicated that they enter the trail from its western end, either at Wentworth Springs or Loon Lake, as opposed to the eastern end near Tahoma. Approximately 90 percent of survey respondents reported that they access the trail from the west, with the largest proportion (79 percent) accessing it from the Loon Lake trailhead, as shown in Figure 4.
The exit points showed a more varied response, indicating that some users prefer to do an “out‐and‐back,” in which they exit from the same point at which they enter, while others travel the entire Rubicon Trail through to the other terminus. Figure 5 shows that approximately 54 percent of users exit the Trail in Tahoma, with the remaining 46 percent exit at Loon Lake or Wentworth Springs, (which are most likely to be “out‐and‐back” trips since 90 percent of users begin at this point).
Of those who exit the trail in Tahoma, the majority (65 percent) reported that they turn South on Highway 89 and head toward South Lake Tahoe, as shown in Figure 6 below.
Trailhead Use (Entrance)
Rubicon Trail EIA4
79.19%
9.10%11.70%
Loon Lake Wentworth Springs Tahoma Staging Area
0.00%
10.00%
20.00%
30.00%
40.00%
50.00%
60.00%
70.00%
80.00%
90.00%
Source: 2018 User Survey
FINAL Economic Impact Analysis for the Rubicon Trail June 7, 2019
Page 8 of 29

Trailhead Use (Exit)
Rubicon Trail EIA5
36.75%
9.61%
53.64%
Loon Lake Wentworth Springs Tahoma Staging Area
0.00%
10.00%
20.00%
30.00%
40.00%
50.00%
60.00%
Source: 2018 User Survey
Rubicon Trail Exit Patterns in Tahoma
Rubicon Trail EIA6
North on 89 South on 89
0%
10%
20%
30%
40%
50%
60%
70%
If you exit the Rubicon Trail in Tahoma which way do you turn:
Source: 2018 User Survey
FINAL Economic Impact Analysis for the Rubicon Trail June 7, 2019
Page 9 of 29
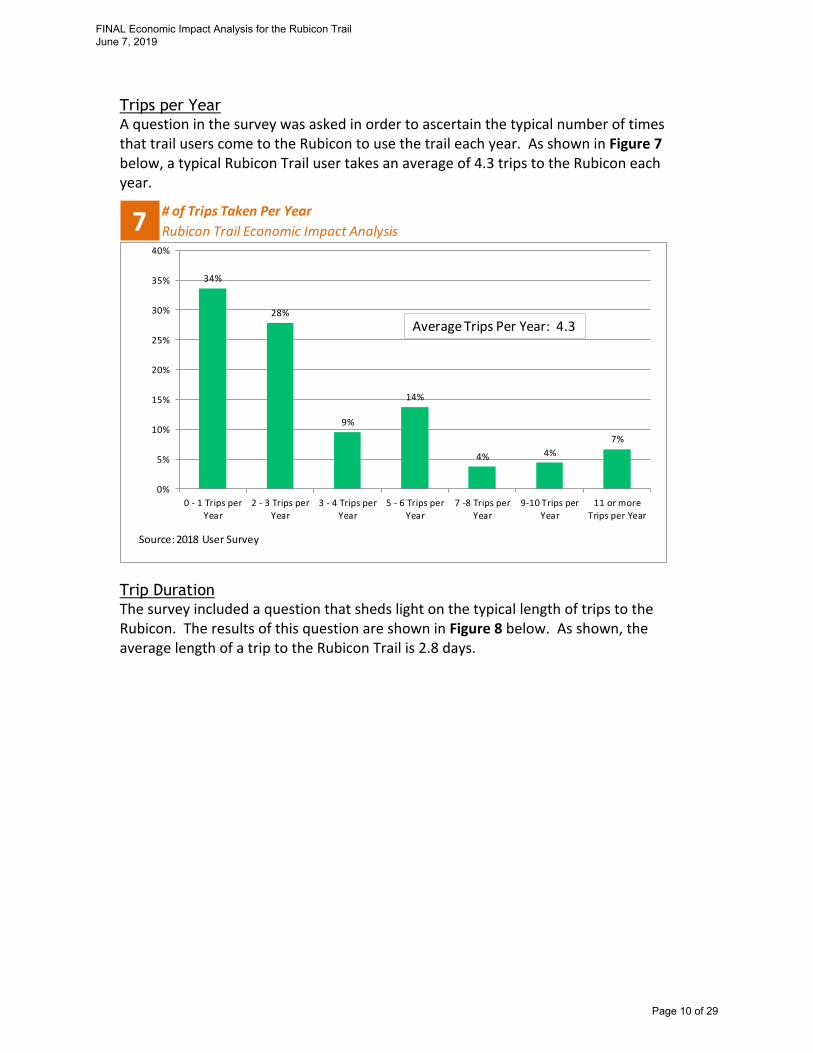
Trips per Year A question in the survey was asked in order to ascertain the typical number of times that trail users come to the Rubicon to use the trail each year. As shown in Figure 7 below, a typical Rubicon Trail user takes an average of 4.3 trips to the Rubicon each year.
Trip Duration The survey included a question that sheds light on the typical length of trips to the Rubicon. The results of this question are shown in Figure 8 below. As shown, the average length of a trip to the Rubicon Trail is 2.8 days.
# of Trips Taken Per Year
Rubicon Trail Economic Impact Analysis7
34%
28%
9%
14%
4% 4%
7%
0 ‐ 1 Trips perYear
2 ‐ 3 Trips perYear
3 ‐ 4 Trips perYear
5 ‐ 6 Trips perYear
7 ‐8 Trips perYear
9‐10 Trips perYear
11 or moreTrips per Year
0%
5%
10%
15%
20%
25%
30%
35%
40%
Source:2018 User Survey
Average Trips Per Year: 4.3
FINAL Economic Impact Analysis for the Rubicon Trail June 7, 2019
Page 10 of 29

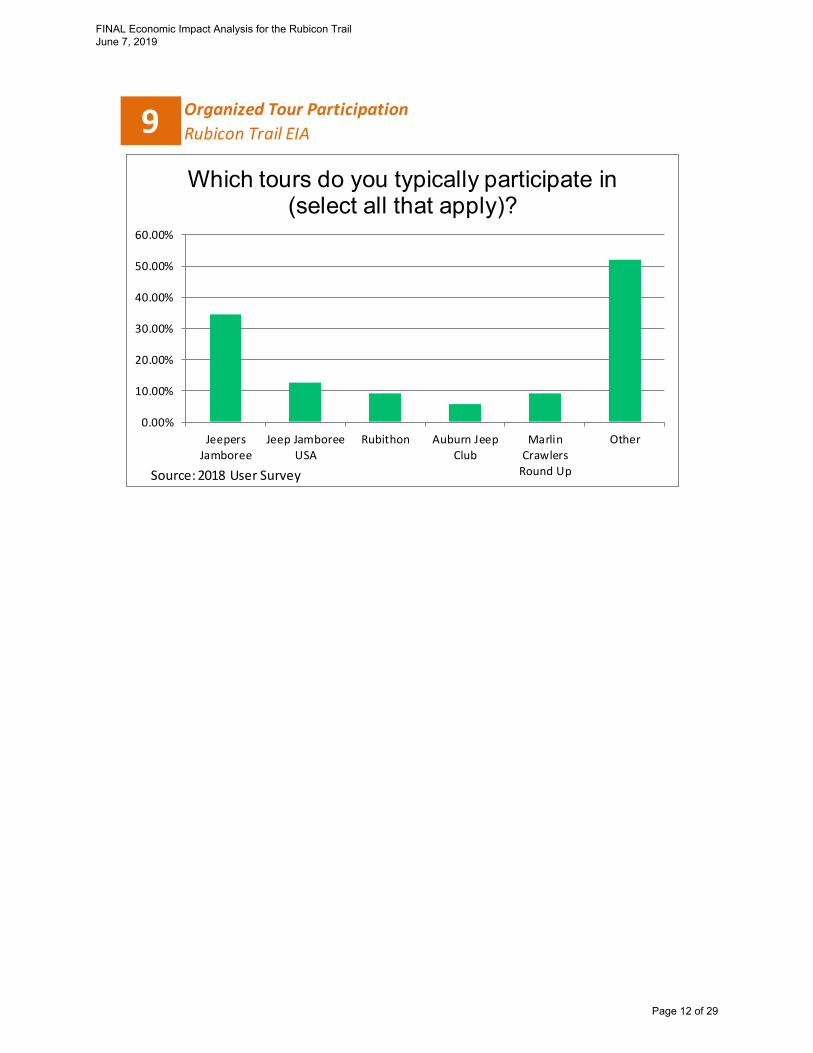
Organized Tours Organized tours are an important aspect of activity on the Trail, and the large majority of survey respondents (97 percent) indicated that they participate in at least one organized tour per year. The most popular tours are Jeep Jamboree and Jeepers Jamboree, but there are numerous other formal and informal tours, as shown in Figure 9.
Average Trip Length
Rubicon Trail EIA8
7.78%
25.68%
48.90%
13.75%
2.85%1.04%
1 day 2 days 3 days 4 days 5 days 6 days ormore
0.00%
10.00%
20.00%
30.00%
40.00%
50.00%
60.00%
Sorurce: 2018 User Survey
Average Trip Length: 2.8 Days
FINAL Economic Impact Analysis for the Rubicon Trail June 7, 2019
Page 11 of 29
Organized Tour Participation
Rubicon Trail EIA9
Jeepers
Jamboree
Jeep Jamboree
USA
Rubithon Auburn Jeep
Club
Marlin
Crawlers
Round Up
Other
0.00%
10.00%
20.00%
30.00%
40.00%
50.00%
60.00%
Which tours do you typically participate in (select all that apply)?
Source: 2018 User Survey
FINAL Economic Impact Analysis for the Rubicon Trail June 7, 2019
Page 12 of 29

Chapter 4: Direct Economic Impacts
The Trail provide an economic boost to El Dorado and Placer Counties in a variety of ways, stemming from the Trail’s ability to attract visitors to witness its unparalleled beauty, challenging terrain, and reputation as the “mecca” of off‐road vehicle activity in the world.
This section quantifies the economic value of the Trail, which include spending from vehicle purchases, spending on vehicle maintenance, purchases of supplies, County spending, organized events, and others. The calculations are based on a variety of sources, including the User Survey, interviews with trail users and business owners affiliated with the Trail, and IMPLAN. The methodologies, data sources, and calculations used to quantify these amounts are described in detail below.
Number of Trail Vehicle Trips The Rubicon Trail Foundation (RTF) is under contract with El Dorado County for mid‐trail staff services, and New Economics has analyzed records provided by RTF showing user counts. The County also keeps track of users on the trail, as on‐site Sheriff staff patrol the area during the active summer months. These two sources, taken from 2015, are used in this analysis to calculation certain spending impacts.
Based on discussions with County staff and other stakeholders, New Economics has estimated that there are approximately 10,400 vehicle trips on the Trail in a given year. This number was estimated by using trail counts conducted by RTF and County staff. Since the County and RTF counts only occurred on the western segment of the trail, we added approximately 12 percent to this number for trips that occur from the Tahoe side. Based on County input, we also applied a 30 percent “contingency” factor to account for vehicles that access the trail in off‐hours or in the off‐season. These calculations are shown in Figure 10 below.
FINAL Economic Impact Analysis for the Rubicon Trail June 7, 2019
Page 13 of 29
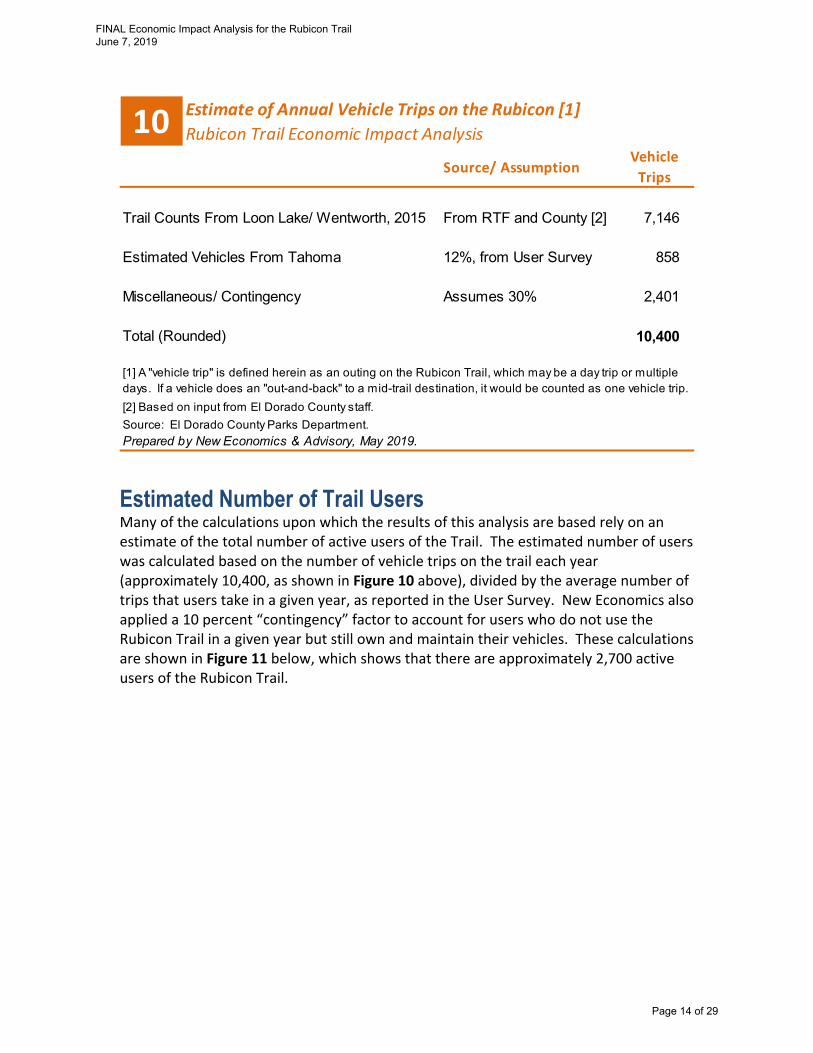
Estimated Number of Trail Users Many of the calculations upon which the results of this analysis are based rely on an estimate of the total number of active users of the Trail. The estimated number of users was calculated based on the number of vehicle trips on the trail each year (approximately 10,400, as shown in Figure 10 above), divided by the average number of trips that users take in a given year, as reported in the User Survey. New Economics also applied a 10 percent “contingency” factor to account for users who do not use the Rubicon Trail in a given year but still own and maintain their vehicles. These calculations are shown in Figure 11 below, which shows that there are approximately 2,700 active users of the Rubicon Trail.
Estimate of Annual Vehicle Trips on the Rubicon [1]
Rubicon Trail Economic Impact Analysis
Source/ AssumptionVehicle
Trips
Trail Counts From Loon Lake/ Wentworth, 2015 From RTF and County [2] 7,146
Estimated Vehicles From Tahoma 12%, from User Survey 858
Miscellaneous/ Contingency Assumes 30% 2,401
Total (Rounded) 10,400
Source: El Dorado County Parks Department.
Prepared by New Economics & Advisory, May 2019.
10
[1] A "vehicle trip" is defined herein as an outing on the Rubicon Trail, which may be a day trip or multiple days. If a vehicle does an "out-and-back" to a mid-trail destination, it would be counted as one vehicle trip.
[2] Based on input from El Dorado County staff.
FINAL Economic Impact Analysis for the Rubicon Trail June 7, 2019
Page 14 of 29

OHV Spending The largest economic contribution of the Trail is registered when considering the substantial expenditures that are required for most trail users, which is the purchase of their OHV used to access the trail. While these expenditures are great, they occur relatively infrequently. In addition, there are significant dollar amounts spent to upgrade and maintain OHVs on a regular basis.
Survey data from the 2018 User Survey and other resources allow us to calculate these amounts, which are described in greater detail below.
Primary OHV Purchases According to the 2018 User Survey, the average purchase price of Rubicon Trail Users’ OHV is approximately $64,400. Survey data also sheds light on the year in which each survey respondent has indicated that they purchased their OHV(s). New Economics has interpolated this data to conclude that Rubicon Trail users purchase an OHV approximately once every 11 years, on average. The OHV purchase occurred in various areas; typically near each user’s home. Approximately 13 percent of Trail Users reported that they purchased their vehicle in El Dorado County and 9 percent purchased in Placer County, according to the User Survey.
Figure 12 summarizes the economic value of OHV purchases in general, and more specifically in El Dorado and Placer Counties. As shown, OHV users spend approximately $15.8 million each year in purchasing a primary OHV. Approximately $2.0 million of this spending is estimated to occur in El Dorado County, and $1.5 million in Placer County.
Estimate of Active Rubicon Trail Users
Rubicon Trail Economic Impact AnalysisValue
Total / Average Annual Vehicle Trips (rounded) 10,400
Average Annual # of Trips per User [1] 4.3
Total # of Active Users (Rounded) [2] 2,700
Sources: 2018 User Survey, El Dorado County, and New Economics.
Prepared by New Economics & Advisory, May 2019.
11
[1] From the 2018 User Survey.
[2] Includes a 10% "contingency" for potential users that do not use the Rubicon Trail in a given year. Subject to refinement.
FINAL Economic Impact Analysis for the Rubicon Trail June 7, 2019
Page 15 of 29

Additional OHVs Purchases Many Trail Users own other vehicles which complement their experience on the trail. Approximately 69 percent of Survey Respondents indicated that they have more than one OHV, and the average Survey Respondent indicated they have 2.5 OHVs. The User Survey results indicated that additional OHV purchases were made at an average price of $20,400 each.
Figure 13 below shows the estimated annual spending on additional OHVs overall, as well as in El Dorado and Placer Counties, as informed by User Survey results. As shown, OHV users spend approximately $5.2 million each year in purchasing a additional OHVs beyond their primary OHV. Approximately $660,000 million of this spending is estimated to occur in El Dorado County, and $482,000 million in Placer County.
Estimated Direct Spending on Primary OHV Purchases, 2018 $
Rubicon Trail Economic Impact AnalysisPrimary OHV
Estimated # of Active Users 2,700
Primary OHV Purchases Per Year [1] 245
Average Value per Purchase [2] $64,400
Estimated Annual Spending on OHVs $15,807,273
Portion Spent in El Dorado County [3] [4] 13% $2,007,524Portion Spent in Placer County [3] 9% $1,470,076
[2] Average OHV purchase price, per the 2018 User Survey.
[3] Percentages as reported in the 2018 User Survey.
[4] El Dorado County spending includes the cities of Placerville and South Lake Tahoe.
Source: 2018 User Survey
Prepared by New Economics & Advisory, May 2019.
12
[1] Assumes Trail Users purchase an OHV once every 11 years, according to the 2018 User Survey.
FINAL Economic Impact Analysis for the Rubicon Trail June 7, 2019
Page 16 of 29

Trailer Purchases Most Survey Respondents (56 percent) indicated that they tow their OHV on a trailer, and the average purchase price of the trailer was $4,400. Figure 14 shows the estimated direct spending on trailer purchases overall, and in El Dorado and Placer Counties, as informed by the 2018 User Survey data.
Estimated Direct Spending on Additional OHV Purchases, 2018 $
Rubicon Trail Economic Impact AnalysisAdditional OHVs
Estimated Trails Users, 2018 2,700
Percentage Who Own More Than One OHV [1] 69%
Average Additional Vehicles Per Person 1.5
Estimated # of Additional OHVs 2,795
Additional Annual OHV Purchases [2] 254
Value Per Additional OHV [3] $20,400
Value of Total Annual Additional OHV Purchases $5,182,527
Portion Spent in El Dorado County [4] [5] 13% $658,181Portion Spent in Placer County [4] 9% $481,975
[1] Per the 2018 User Survey.
[2] Assumes Trail Users purchase an OHV once every 11 years, according to the 2018 User Survey.
[3] Average OHV purchase price of additional OHVs, per the 2018 User Survey.
[4] Percentages as reported in the 2018 User Survey.
[5] El Dorado County spending includes the cities of Placerville and South Lake Tahoe.
Source: 2018 User Survey
Prepared by New Economics & Advisory, May 2019.
13
FINAL Economic Impact Analysis for the Rubicon Trail June 7, 2019
Page 17 of 29
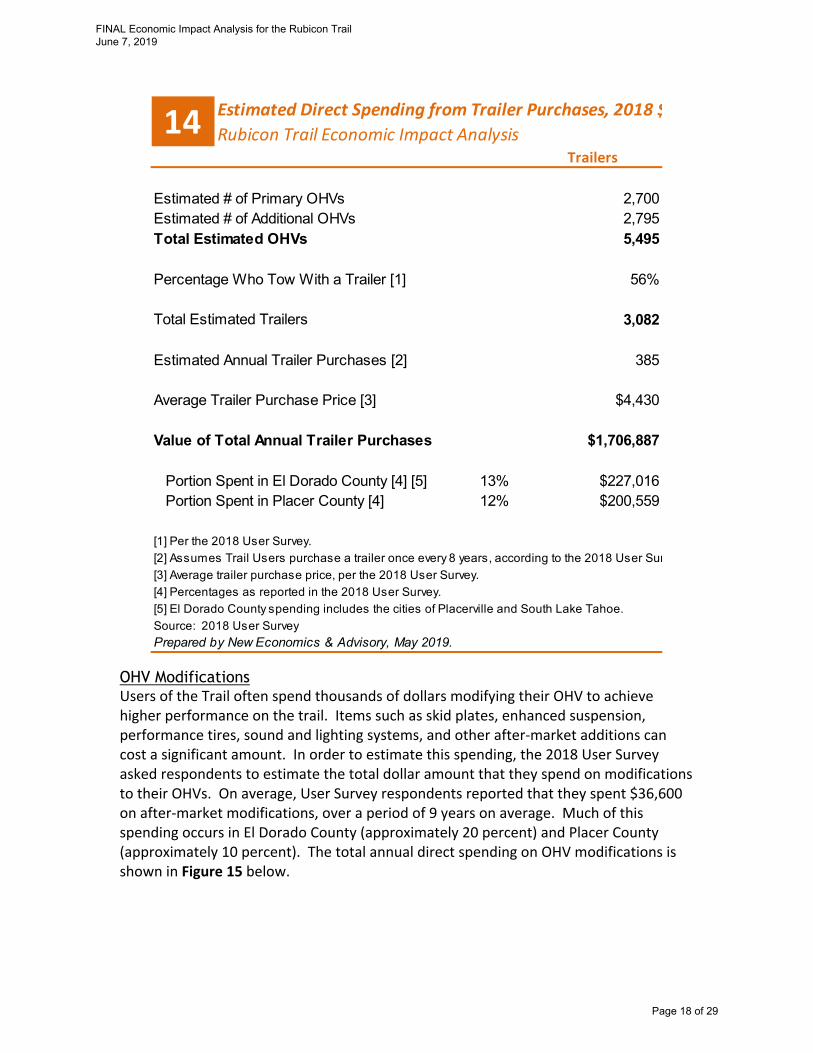
OHV Modifications Users of the Trail often spend thousands of dollars modifying their OHV to achieve higher performance on the trail. Items such as skid plates, enhanced suspension, performance tires, sound and lighting systems, and other after‐market additions can cost a significant amount. In order to estimate this spending, the 2018 User Survey asked respondents to estimate the total dollar amount that they spend on modifications to their OHVs. On average, User Survey respondents reported that they spent $36,600 on after‐market modifications, over a period of 9 years on average. Much of this spending occurs in El Dorado County (approximately 20 percent) and Placer County (approximately 10 percent). The total annual direct spending on OHV modifications is shown in Figure 15 below.
Estimated Direct Spending from Trailer Purchases, 2018 $
Rubicon Trail Economic Impact AnalysisTrailers
Estimated # of Primary OHVs 2,700Estimated # of Additional OHVs 2,795Total Estimated OHVs 5,495
Percentage Who Tow With a Trailer [1] 56%
Total Estimated Trailers 3,082
Estimated Annual Trailer Purchases [2] 385
Average Trailer Purchase Price [3] $4,430
Value of Total Annual Trailer Purchases $1,706,887
Portion Spent in El Dorado County [4] [5] 13% $227,016Portion Spent in Placer County [4] 12% $200,559
[1] Per the 2018 User Survey.
[2] Assumes Trail Users purchase a trailer once every 8 years, according to the 2018 User Sur
[3] Average trailer purchase price, per the 2018 User Survey.
[4] Percentages as reported in the 2018 User Survey.
[5] El Dorado County spending includes the cities of Placerville and South Lake Tahoe.
Source: 2018 User Survey
Prepared by New Economics & Advisory, May 2019.
14
FINAL Economic Impact Analysis for the Rubicon Trail June 7, 2019
Page 18 of 29

OHV Operations/ Maintenance Similarly, Trail Users spend a significant amount on annual operations and maintenance on their OHV(s), on items such as oil changes, cleaning, storage, tires, brakes, etc. According to the 2018 User Survey, Rubicon Trail Users spend an average of approximately $1,900 per year on general maintenance.
The 2018 User Survey indicated that 21 percent of these purchases occur in El Dorado County, and 10 percent occur in Placer County. The total annual direct spending on OHV operations and maintenance is shown in Figure 16 below.
Estimated Direct Spending from OHV Modifications, 2018 $
Rubicon Trail Economic Impact AnalysisModifications
Estimated # of Primary OHVs 2,700Estimated # of Additional OHVs 2,795Total Estimated OHVs 5,495
Estimated Annual Modification Spending Per User [1] $4,067
Total Estimated Spending on Modifications $22,344,300
Estimated El Dorado County Portion [2] [3] 21% $4,625,270Estimated Placer County Portion [2] 10% $2,301,463
[2] Percentages as reported in the 2018 User Survey.
[3] El Dorado County spending includes the cities of Placerville and South Lake Tahoe.
Source: 2018 User Survey
Prepared by New Economics & Advisory, May 2019.
15
[1] Estimated by taking the average amount the survey respondents reported spending on add-on modifications, divided by the number of years survey respondents reported that this was spread over (9 years).
FINAL Economic Impact Analysis for the Rubicon Trail June 7, 2019
Page 19 of 29
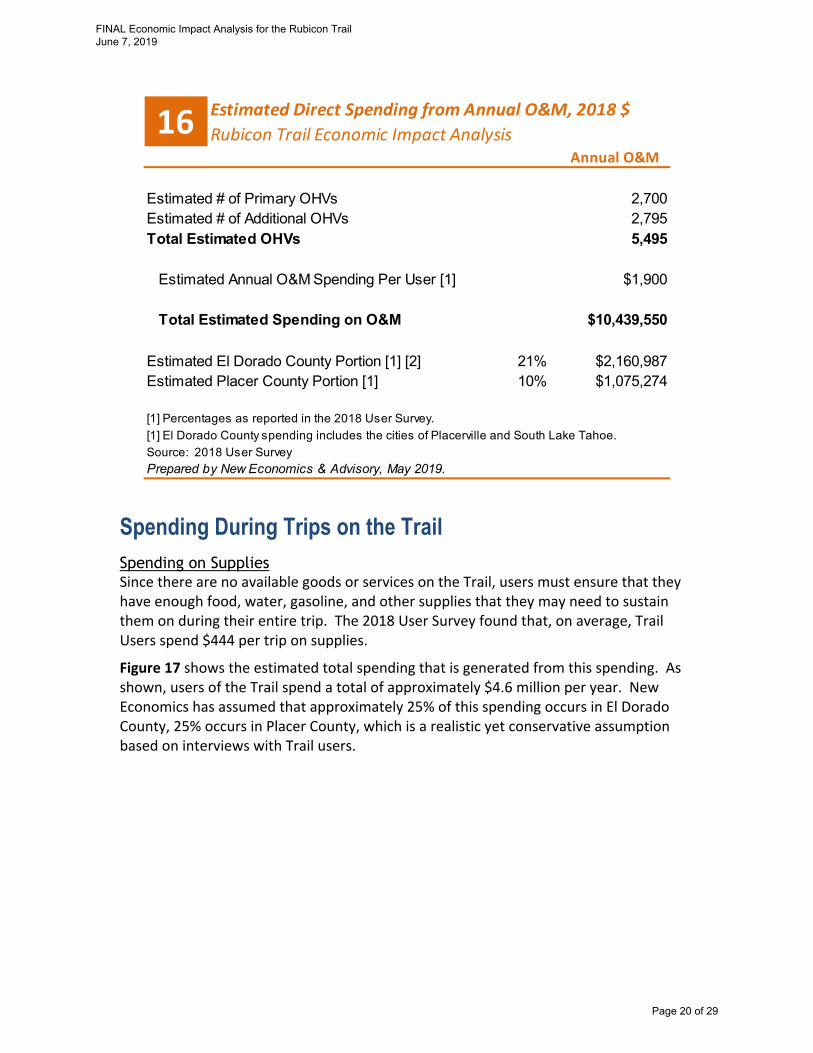
Spending During Trips on the Trail Spending on Supplies Since there are no available goods or services on the Trail, users must ensure that they have enough food, water, gasoline, and other supplies that they may need to sustain them on during their entire trip. The 2018 User Survey found that, on average, Trail Users spend $444 per trip on supplies.
Figure 17 shows the estimated total spending that is generated from this spending. As shown, users of the Trail spend a total of approximately $4.6 million per year. New Economics has assumed that approximately 25% of this spending occurs in El Dorado County, 25% occurs in Placer County, which is a realistic yet conservative assumption based on interviews with Trail users.
Estimated Direct Spending from Annual O&M, 2018 $
Rubicon Trail Economic Impact AnalysisAnnual O&M
Estimated # of Primary OHVs 2,700Estimated # of Additional OHVs 2,795Total Estimated OHVs 5,495
Estimated Annual O&M Spending Per User [1] $1,900
Total Estimated Spending on O&M $10,439,550
Estimated El Dorado County Portion [1] [2] 21% $2,160,987Estimated Placer County Portion [1] 10% $1,075,274
[1] Percentages as reported in the 2018 User Survey.
[1] El Dorado County spending includes the cities of Placerville and South Lake Tahoe.
Source: 2018 User Survey
Prepared by New Economics & Advisory, May 2019.
16
FINAL Economic Impact Analysis for the Rubicon Trail June 7, 2019
Page 20 of 29

Spending on Lodging Many User Survey respondents indicated that they typically stay in a hotel or other lodging type before or after their trip on the Rubicon Trail. Specifically, 25 percent indicated that they stay in an overnight accommodation.
On average, Survey Respondents reported that they rented 1.3 hotel rooms, for an average of 1.9 nights, at an average nightly rate of $144. Of these, 23 percent indicated they typically stay in South Lake Tahoe, 20 percent stay in Auburn or other Placer County locations, and 10 percent stay in Tahoe City or other North Lake Tahoe locations.
This data from the 2018 User Survey is used to calculate the total spending on hotels in the region, as shown in Figure 18 below. As shown, the trail generates approximately $960,000 in hotel revenues, of which approximately $270,000 is estimated to occur in El Dorado County and $290,000 in Placer County.
Estimated Direct Spending from Rubicon Trail Visitation, 2018 $
Rubicon Trail Economic Impact AnalysisValue
Estimated Rubicon Trail Vehicle Trips, 2018 10,400
Estimated Spending per Trip [1] $444
Total Estimated Annual Visitor Spending $4,617,600
Estimated El Dorado County Portion [2] 25% $1,154,400Estimated Placer County Portion [2] 25% $1,154,400
[2] Estimated by New Economics, based on interviews with trail users. Subject to refinement.
Source: El Dorado County, the 2018 User Survey, and New Economics.
Prepared by New Economics & Advisory, May 2019.
17
[1] Per the 2018 User Survey.
FINAL Economic Impact Analysis for the Rubicon Trail June 7, 2019
Page 21 of 29

County Trail Investments El Dorado County has made several investments in the Rubicon Trail throughout the past two decades. According to County staff, all of this spending has been secured through outside sources and not the County’s general fund.
Figure 17 shows total County investment in the Rubicon Trail since 2001. As shown, the County has invested a total of approximately $8.5 million, which includes $3.8 million in capital expenses, $1.5 million in operations and maintenance, and significant amounts on education, law enforcement, etc.
Estimated Annual Spending on Lodging, 2018 $
Rubicon Trail Economic Impact AnalysisFormula Value
Estimated Annual Trips a 10,400
Percentage Who Typically Stay in a Hotel [1] b 26%
Average Number of Rooms [1] c 1.9
Average Number of Nights per Trip [1] d 1.3
Estimated Annual Hotel Rooms Rented e = a * b * c *d 6,679
Average Nightly Rate [1] f $144
Estimated Total Annual Hotel Revenue [1] g = f * e $961,759
Hotel Revenue by AreaEl Dorado County (Including South Lake Tahoe) g * 28% $269,292Placer County (Including Auburn and Other Cities) g * 30% $288,528State of Nevada (Reno, Lake Tahoe, or Elsewhere) g * 6% $57,706Various/ Not Sure g * 36% $346,233
[1] Per the 2018 User Survey.
Source: El Dorado County, the 2018 User Survey, and New Economics.
Prepared by New Economics & Advisory, May 2019.
18
FINAL Economic Impact Analysis for the Rubicon Trail June 7, 2019
Page 22 of 29

County Expenses Incurred on Rubicon Trail
Rubicon Trail Economic Impact Analysis
Average
Total Annual FY 01/02 FY 02/03 FY 03/04 FY 04/05 FY 05/06 FY 06/07 FY 07/08 FY 08/09 FY 09/10 FY 10/11 FY 11/12 FY 12/13 FY 13/14 FY 14/15 FY 15/16 FY 16/17 FY 17/18
Phase I $483,171 $28,422 $227,569 - - - - - - - - $255,602 - - - - - - -
Phase II $1,113,833 $65,520 - $174,843 - - - - - - $938,990 - - - - - - - -
Phase III $603,363 $35,492 - - $311,725 - - - - - - - $291,638 - - - - - -
Education $474,804 $27,930 - - - - - - - $52,840 - $56,703 $56,013 $74,791 - - $85,691 $81,075 $67,691
Law Enforcement $334,596 $19,682 $64,107 - - - - - - $41,334 $47,011 $47,825 - - $134,319 - - - -
O&M $1,487,284 $87,487 - - - - - - - $157,000 - $128,598 $102,006 $111,517 $163,246 - - $606,873 $218,043
Capital Projects $3,797,889 $223,405 - - - - - $248,928 - $74,700 $135,260 $331,956 - $52,120 $2,002,606 $711,434 $240,887 - -
Other $259,942 $15,291 - - - $107,626 - - - - - - - $101,321 - - - - $50,995
Total $8,554,882 $503,228 $291,676 $174,843 $311,725 $107,626 $0 $248,928 $0 $325,874 $1,121,261 $820,684 $449,657 $339,749 $2,300,171 $711,434 $326,578 $687,948 $336,729
Source:
Prepared by New Economics & Advisory, May 2019.
19
Category
FINAL Economic Impact Analysis for the Rubicon Trail June 7, 2019
Page 23 of 29

Organized Tours and Events In addition to the spending from conventional users of the Trail, a large portion of the activity on the trail occurs through organized tours and events. Organized event spending is different from “typical” users spending because it occurs in large increments and represents a significant share of total spending on the Trail which is not captured in the results of 2018 User Survey. There are many different operators and organizers of tours and events on the trail, in fact the results of the 2018 User Survey indicated over approximately unique events. The largest events are the Jeepers Jamboree and Jeep Jamboree USA events. In order to capture the spending from these large events, the County and New Economics asked major tour operators to provide some baseline financial information.
These results are shown in Figure 20 below. As shown, tours represent up to $973,000 in total spending on the trail, approximately $675,000 of which is estimated to occur in El Dorado County and $150,000 in Placer County.
Estimated Direct Spending from Major Tours/ Events, 2018 $
Rubicon Trail Economic Impact Analysis
Total Annual
Revenue
Est. El Dorado
County Portion
Est. Placer
County Portion
Jeep Jamboree USA [1] $213,750 $213,750 $0Jeepers Jamboree [2] $500,000 $350,000 $0Marlin Crawlers [3] $24,500 $12,250 $12,250Auburn Jeep Club [4] $40,625 $0 $40,625Misc. Other [5] $194,719 $97,359 $97,359Subtotal $973,594 $673,359 $150,234
[1] Jeep Jamboree staff indicated that nearly all spending occurs in El Dorado County.
[2] Jeepers Jamboree staff indicated that approximately 70% of spending occurs in El Dorado County.
[4] Auburn Jeep Club event organizers indicated that nearly all spending occurs in El Dorado County.
Source: Individual event organizers, El Dorado County staff, and New Economics.
Prepared by New Economics & Advisory, May 2019.
20
[3] Since a breakdown of the location of spending was not available, New Economics assumed a 50-50 split between El Dorado and Placer Counties.
[5] New Economics has conservatively assumed that other organized events account for in additional 25% of spendingn, which is split 50-50 between El Dorado and Placer Counties. Subject to refinement.
FINAL Economic Impact Analysis for the Rubicon Trail June 7, 2019
Page 24 of 29

Chapter 5: Total Economic Impacts
New Economics has quantified the direct economic impacts from the various sources described above. Figure 21 shows the total direct impacts from these sources, which totals approximately of $57.4 million per year.
In addition to these direct impacts, New Economics has utilized a commonly‐used input‐output model called IMPLAN to capture the additional economic activity that the Rubicon Trail supports through other impacts. These “other” impacts are often referred to as “spin‐off” activity and consist of purchase made by suppliers, employee spending, and other. More specifically, the three categories of economic impacts are described below.
Direct, Indirect, and Induced Impacts Results are presented in terms of three categories: Direct Impacts, Indirect Impacts, and Induced Impacts. These three categories can be added together to equal the total impacts. Each of these categories are described in further detail below.
Direct Impacts are those that are directly associated with the activity being studied.
Indirect Impacts additional economic activity that results from the Direct Impacts, including suppliers and inputs of goods and services produced.
Summary of Annual Direct Impacts ‐ 2018 $
Rubicon Trail Economic Impact Analysis
El Dorado Placer
Total County County Table
Amount Amount Amount Reference
Vehicle Purchases $15,807,273 $2,007,524 $1,470,076 Figure 12
Vehicle Modifications $22,344,300 $4,625,270 $2,301,463 Figure 15
Trailer Purchases $1,706,887 $227,016 $200,559 Figure 14
Vehicle Operations/ Maintenance $10,439,550 $2,160,987 $1,075,274 Figure 16
Supplies $4,617,600 $1,154,400 $1,154,400 Figure 17
Lodging $961,759 $269,292 $288,528 Figure 18
County Spending $503,228 $503,228 $0 Figure 19
Major Events/ Tours $973,594 $673,359 $150,234 Figure 20
Total $57,354,191 $11,621,077 $6,640,534
Prepared by New Economics & Advisory, May 2019.
21
List
FINAL Economic Impact Analysis for the Rubicon Trail June 7, 2019
Page 25 of 29

Induced Impacts include the consumption expenditures of direct and indirect employees. Examples of induced benefits include employees’ expenditures on food, restaurants, housing, medical services, etc.
The Indirect and Induced impacts are calculated based on the Direct Impacts as the “input,” and produce the results. The total Direct, Indirect, and Induced economic impacts from the Trail are shown below. As shown, in Figure 22, the $11.6 million in direct economic activity in El Dorado County generates an additional $2.0 million in annual indirect activity and $2.3 million in induced activity for a total of $16.0 million in total economic impact in the County. This economic activity supports approximately 76 total jobs in the County.
In Placer County, approximately $6.4 million in direct economic activity generates an additional $1.5 million in annual indirect activity and $1.7 million in induced activity for a total of $9.8 million in total economic impact in the County, as shown in Figure 23. This economic activity supports approximately 48 total jobs in the County.
In total for both El Dorado and Placer Counties, the Rubicon Trail generates $18.3 million in direct impact, $3.5 million in indirect impact, and $4.1 million in induced impact for a total of $25.5 in total economic impact in both counties.
The total direct, indirect, and induced impacts for El Dorado and Placer Counties are shown in Figure 24 below.
FINAL Economic Impact Analysis for the Rubicon Trail June 7, 2019
Page 26 of 29

Summary of Total Annual Impacts ‐ El Dorado County ‐ 2018 $
Rubicon Trail Economic Impact Analysis
Direct Indirect Induced
Total
Output Jobs
Vehicle Purchases $2,007,524 $383,638 $360,889 $2,752,050 17.1
Vehicle Modifications $4,625,270 $883,889 $831,476 $6,340,635 19.3
Trailer Purchases $227,016 $43,383 $40,810 $311,209 1.9
Vehicle Operations/ Maintenance $2,160,987 $266,955 $536,076 $2,964,018 11.5
Supplies $1,154,400 $256,522 $185,301 $1,596,222 9.8
Lodging $269,292 $68,897 $45,910 $384,099 3.4
County Spending $503,228 $0 $184,244 $687,472 7.1
Events $673,359 $113,018 $142,800 $929,177 5.9
Total $11,621,077 $2,016,302 $2,327,505 $15,964,883 75.9
Source:
Prepared by New Economics & Advisory, May 2019.
22
Category
FINAL Economic Impact Analysis for the Rubicon Trail June 7, 2019
Page 27 of 29

Summary of Total Annual Impacts ‐ Placer County ‐ 2018 $
Rubicon Trail Economic Impact Analysis
Direct Indirect Induced Total Jobs [1]
Vehicle Purchases $1,470,076 $312,538 $365,020 $2,147,635 13.3
Vehicle Modifications $2,301,463 $489,291 $571,453 $3,362,207 10.2
Trailer Purchases $200,559 $42,639 $49,799 $292,997 1.8
Vehicle Operations/ Maintenance $1,075,274 $170,969 $359,141 $1,605,384 6.2
Supplies $1,154,400 $326,695 $288,598 $1,769,693 10.9
Lodging $288,528 $84,077 $62,986 $435,590 3.9
Events $150,234 $34,334 $38,740 $223,308 1.4
Total $6,640,534 $1,460,542 $1,735,737 $9,836,814 47.7
[1] Job estimates are based on the job multipliers in El Dorado County.
Prepared by New Economics & Advisory, May 2019.
23
Category
FINAL Economic Impact Analysis for the Rubicon Trail June 7, 2019
Page 28 of 29

Summary of Total Annual Impacts ‐ El Dorado and Placer Counties ‐ 2018 $
Rubicon Trail Economic Impact Analysis
Direct Indirect Induced Total Jobs [1]
Vehicle Purchases $3,477,600 $696,176 $725,908 $4,899,684 30.4
Vehicle Modifications $6,926,733 $1,373,180 $1,402,929 $9,702,842 29.6
Trailer Purchases $427,575 $86,022 $90,609 $604,206 3.7
Vehicle Operations/ Maintenance $3,236,261 $437,924 $895,217 $4,569,402 17.7
Supplies $2,308,800 $583,217 $473,899 $3,365,915 20.7
Lodging $557,820 $152,974 $108,895 $819,689 7.3
County Spending $503,228 $0 $184,244 $687,472 7.1
Events $823,594 $147,351 $181,540 $1,152,485 7.3
Total $18,261,611 $3,476,844 $4,063,242 $25,801,697 123.7
[1] Job estimates are calculated based on the employment multipliers in El Dorado County.
Prepared by New Economics & Advisory, May 2019.
24
Category
FINAL Economic Impact Analysis for the Rubicon Trail June 7, 2019
Page 29 of 29