economic impact of the covid-19 on africa...average 2016-18 yearly exports revenues from fuels for...
TRANSCRIPT
Addis Ababa, Ethiopia
March 13, 2020
Economic Commission for Africa
Economic Impact of the COVID-19 on Africa

Of 118,000 known cases, less than 50 in Africa
However disproportionate economic impact
Ghana, Kenya and Ethiopia reported first cases on 13 March
15 countries in Africa of 117 countries globally affected
Source: UN WHO, 2020

Africa: Corona Virus new blow to economy
Growth expected to drop from 3.2% to 1.8%
0
1
2
3
4
2017 2018 2019 2020
% c
han
ge
1.4 %age point decline expected from effects of COVID-19 as at March 2020 (USD 29 Billion)
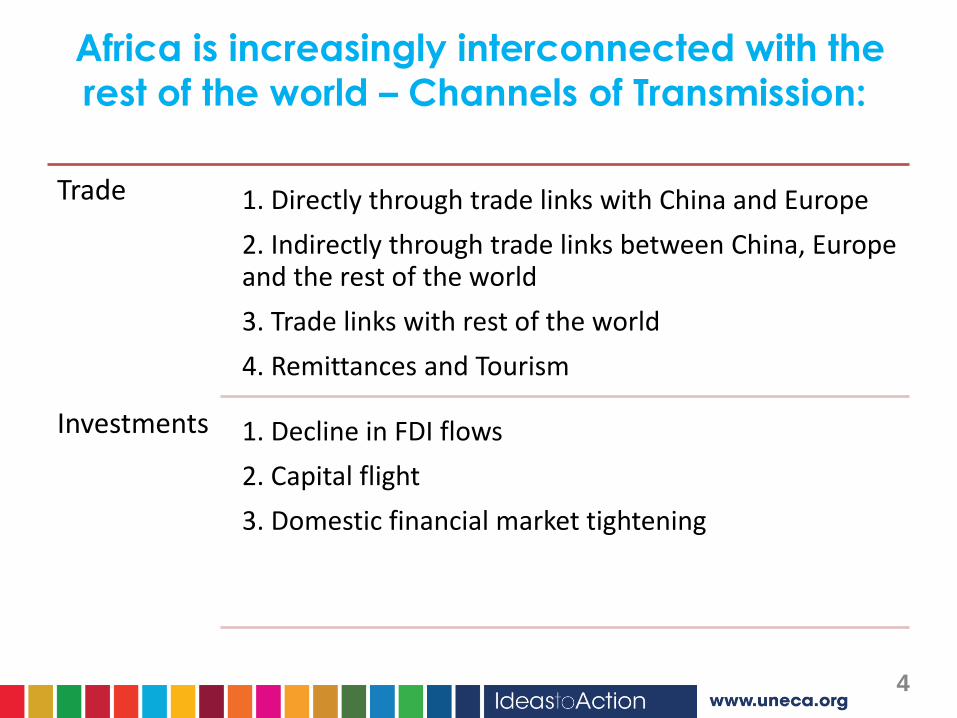
Africa is increasingly interconnected with the
rest of the world – Channels of Transmission:
4
Trade
Investments
1. Directly through trade links with China and Europe
2. Indirectly through trade links between China, Europe and the rest of the world
3. Trade links with rest of the world
4. Remittances and Tourism
1. Decline in FDI flows
2. Capital flight
3. Domestic financial market tightening
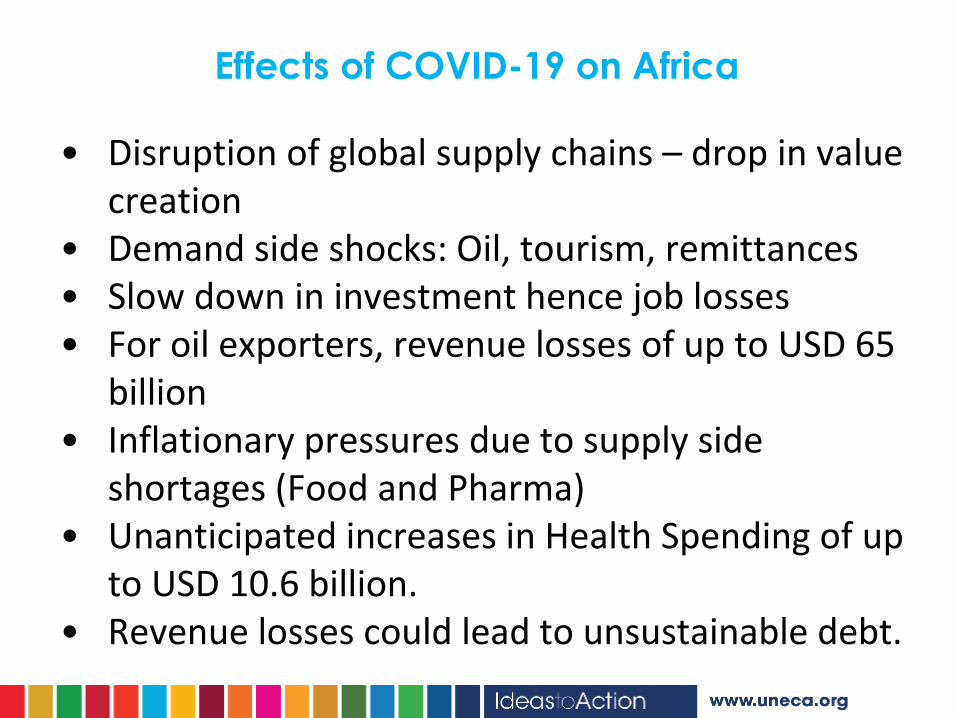
Effects of COVID-19 on Africa
• Disruption of global supply chains – drop in value creation
• Demand side shocks: Oil, tourism, remittances• Slow down in investment hence job losses• For oil exporters, revenue losses of up to USD 65
billion• Inflationary pressures due to supply side
shortages (Food and Pharma) • Unanticipated increases in Health Spending of up
to USD 10.6 billion.• Revenue losses could lead to unsustainable debt.

Decline in commodity prices could lead to fiscal
pressures for Africa’s largest economies
Making it impossible to respond to COVID-19 crisis
6
Fiscal Deficit (%
of GDP)
Debt (% of
GDP)
Nigeria -2.6 55.8
South Africa -5.9 55.9
Egypt, Arab Rep. -8.0 84.9
Algeria -7.6 46.1
Angola 0.7 95.0
Ethiopia -2.7 59.1
Kenya -7.2 61.6
Cote d'Ivoire -3.2 52.7
Ghana -5.0 63.8
Zambia -4.6 91.6
Mozambique -6.1 108.8
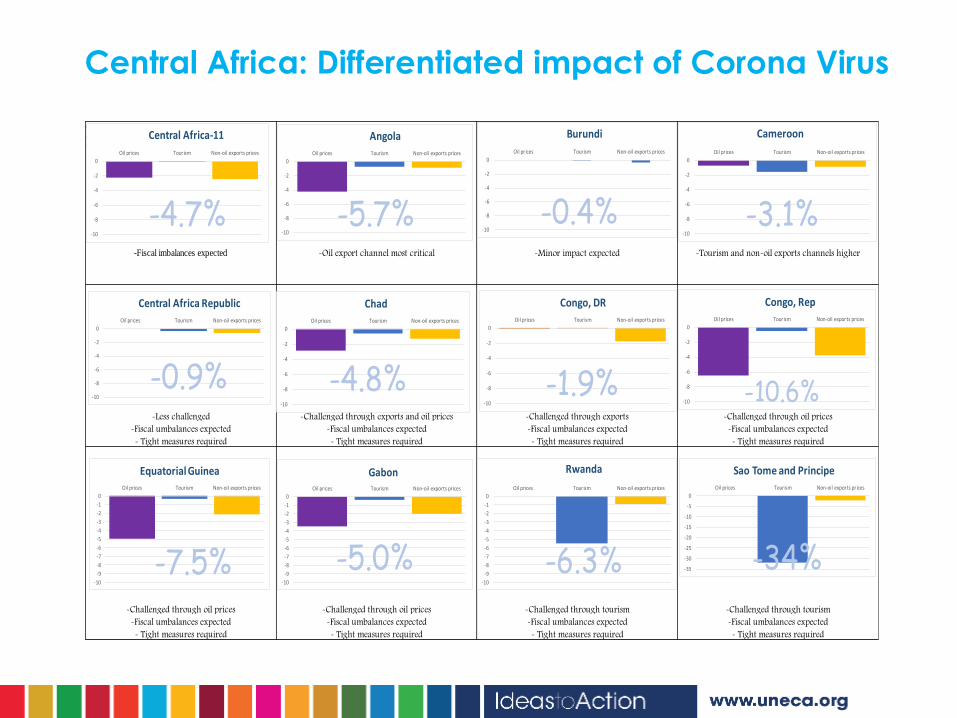
Central Africa: Differentiated impact of Corona Virus
Central Africa 11
Oil prices -0.5
Tourism -56
Non-oil exports -20
-Challenged through tourism
-Fiscal umbalances expected
- Tight measures required
- Tight measures required
-Challenged through oil prices
-Fiscal umbalances expected
- Tight measures required
-Challenged through oil prices
-Fiscal umbalances expected
- Tight measures required
-Challenged through tourism
-Fiscal umbalances expected
- Tight measures required
- Tight measures required
-Challenged through exports and oil prices
-Fiscal umbalances expected
- Tight measures required
-Challenged through exports
-Fiscal umbalances expected
- Tight measures required
-Tourism and non-oil exports channels higher
-Less challenged
-Fiscal umbalances expected
-Challenged through oil prices
-Fiscal umbalances expected
-Fiscal imbalances expected -Oil export channel most critical -Minor impact expected
-10
-8
-6
-4
-2
0
Oil prices Tourism Non-oil exports prices
Central Africa-11
-10
-8
-6
-4
-2
0
Oil prices Tourism Non-oil exports prices
Angola
-5.7%-10
-8
-6
-4
-2
0
Oil prices Tourism Non-oil exports prices
Burundi
-10
-8
-6
-4
-2
0
Oil prices Tourism Non-oil exports prices
Cameroon
-10
-8
-6
-4
-2
0
Oil prices Tourism Non-oil exports prices
Central Africa Republic
-10
-8
-6
-4
-2
0
Oil prices Tourism Non-oil exports prices
Chad
-10
-8
-6
-4
-2
0
Oil prices Tourism Non-oil exports prices
Congo, DR
-10
-8
-6
-4
-2
0
Oil prices Tourism Non-oil exports prices
Congo, Rep
-10
-9
-8
-7
-6
-5
-4
-3
-2
-1
0
Oil prices Tourism Non-oil exports prices
Equatorial Guinea
-10
-9
-8
-7
-6
-5
-4
-3
-2
-1
0
Oil prices Tourism Non-oil exports prices
Gabon
-10
-9
-8
-7
-6
-5
-4
-3
-2
-1
0
Oil prices Tourism Non-oil exports prices
Rwanda
-35
-30
-25
-20
-15
-10
-5
0
Oil prices Tourism Non-oil exports prices
Sao Tome and Principe
-4.7% -0.4% -3.1%
-0.9% -4.8% -1.9% -10.6%
-7.5% -5.0% -6.3% -34%

In past crisis, Africa’s tourism experienced losses of up
to $US7.2bn
0
1
2
3
4
5
6
7
8
Egypt Ethiopia Kenya Mauritius Morocco Tunisia Africa
USD
Bill
ion
s
2008 Financial Crisis 2014 Commodity price shocks

High Trade Vulnerability to COVID19
Africa’s Top 25 exports and imports of goods – Average (2016-18)
Source: ECA based on UNCTADStat
117.0
27.5
18.4
15.8
11.3
10.4
10.0
8.5
8.4
8.4
7.0
6.0
5.7
5.2
5.0
4.4
4.4
4.0
3.6
3.6
3.5
3.4
2.8
2.8
2.8
0 20 40 60 80 100 120
Petroleum oils, oils from bitumin. materials,…
Gold, non-monetary (excluding gold ores…
Natural gas, whether or not liquefied
Petroleum oils or bituminous minerals > 70…
Copper
Pearls, precious & semi-precious stones
Fruits and nuts (excluding oil nuts), fresh or…
Motor vehicles for the transport of persons
Cocoa
Ores and concentrates of base metals, n.e.s.
Silver, platinum, other metals of the…
Coal, whether or not pulverized, not…
Equipment for distributing electricity, n.e.s.
Fertilizers (other than those of group 272)
Iron ore and concentrates
Liquefied propane and butane
Pig iron & spiegeleisen, sponge iron, powder…
Vegetables
Motor vehic. for transport of goods, special…
Articles of apparel, of textile fabrics, n.e.s.
Aluminium
Inorganic chemical elements, oxides &…
Fish, fresh (live or dead), chilled or frozen
Women's clothing, of textile fabrics
Ships, boats & floating structures
Top 25 Exports (US$ bn)
42.9
16.3
13.6
12.9
12.0
9.9
8.0
7.3
6.7
6.5
6.5
6.1
5.9
5.2
5.1
5.0
4.9
4.8
4.8
4.7
4.6
4.6
4.5
4.5
4.5
0 20 40 60
Petroleum oils or bituminous minerals > 70 % oil
Motor vehicles for the transport of persons
Telecommunication equipment, n.e.s.; &…
Petroleum oils, oils from bitumin. materials,…
Medicaments (incl. veterinary medicaments)
Wheat (including spelt) and meslin, unmilled
Motor vehic. for transport of goods, special…
Civil engineering & contractors' plant &…
Ships, boats & floating structures
Parts & accessories of vehicles of 722, 781,…
Other machinery for particular industries, n.e.s.
Apparatus for electrical circuits; board, panels
Sugar, molasses and honey
Rice
Manufactures of base metal, n.e.s.
Paper and paperboard
Equipment for distributing electricity, n.e.s.
Electrical machinery & apparatus, n.e.s.
Tubes, pipes & hollow profiles, fittings, iron,…
Aircraft & associated equipment; spacecraft,…
Iron & steel bars, rods, angles, shapes &…
Articles, n.e.s., of plastics
Pumps (excluding liquid), gas compressors &…
Automatic data processing machines, n.e.s.
Heating & cooling equipment & parts thereof,…
Top 25 Imports (US$ bn)
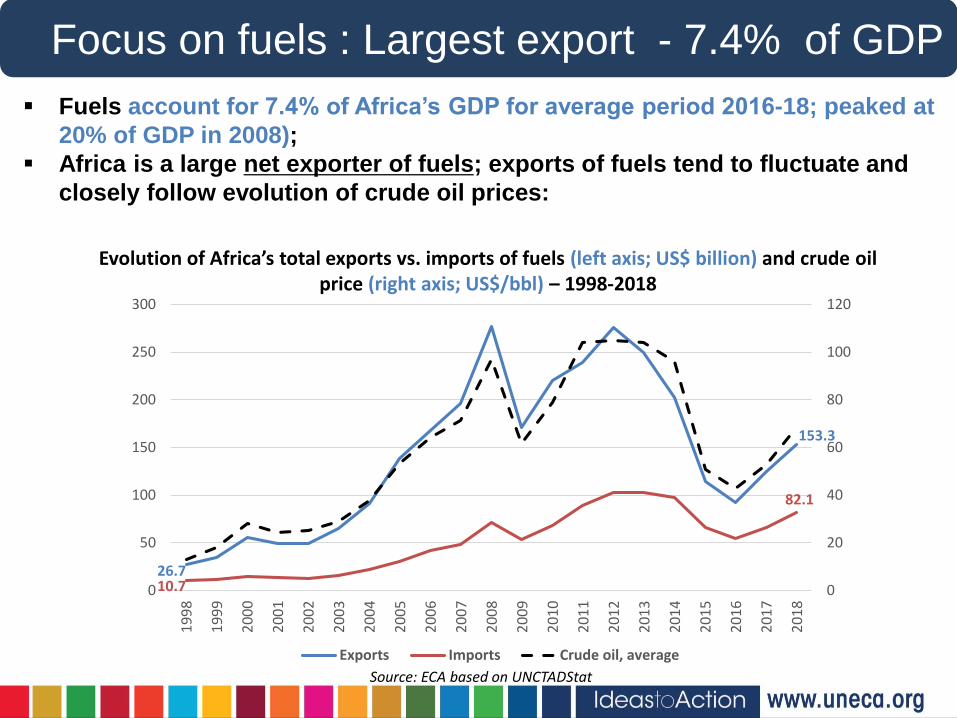
Focus on fuels : Largest export - 7.4% of GDP
Fuels account for 7.4% of Africa’s GDP for average period 2016-18; peaked at
20% of GDP in 2008);
Africa is a large net exporter of fuels; exports of fuels tend to fluctuate and
closely follow evolution of crude oil prices:
Evolution of Africa’s total exports vs. imports of fuels (left axis; US$ billion) and crude oil price (right axis; US$/bbl) – 1998-2018
Source: ECA based on UNCTADStat
26.7
153.3
10.7
82.1
0
20
40
60
80
100
120
0
50
100
150
200
250
300
19
98
19
99
20
00
20
01
20
02
20
03
20
04
20
05
20
06
20
07
20
08
20
09
20
10
20
11
20
12
20
13
20
14
20
15
20
16
20
17
20
18
Exports Imports Crude oil, average
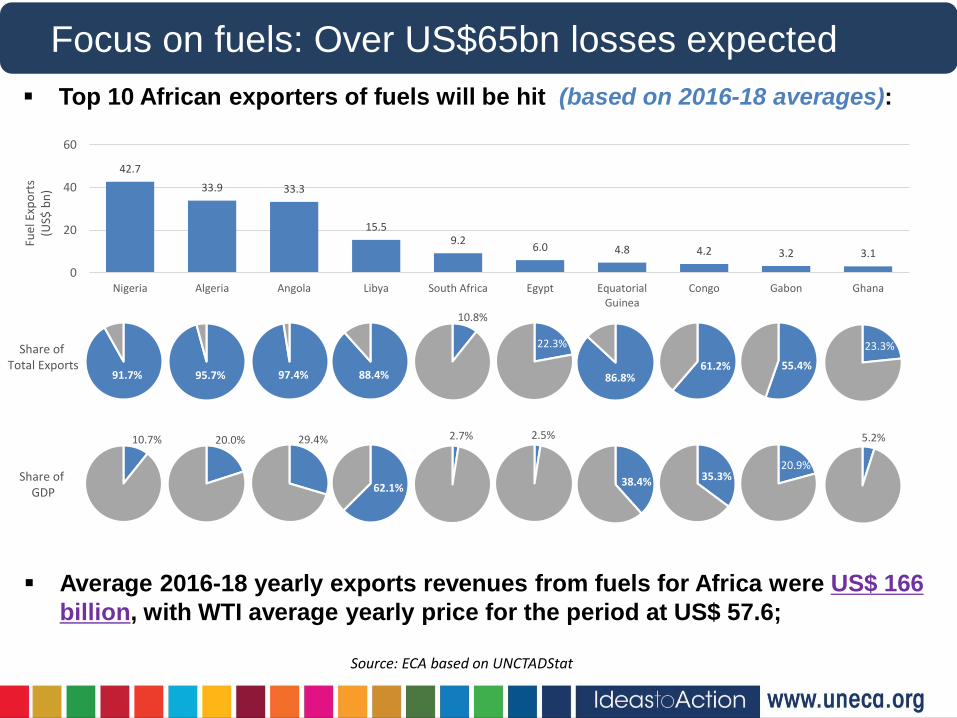
42.7
33.9 33.3
15.59.2
6.0 4.8 4.2 3.2 3.1
0
20
40
60
Nigeria Algeria Angola Libya South Africa Egypt EquatorialGuinea
Congo Gabon Ghana
Focus on fuels: Over US$65bn losses expected
Average 2016-18 yearly exports revenues from fuels for Africa were US$ 166
billion, with WTI average yearly price for the period at US$ 57.6;
Top 10 African exporters of fuels will be hit (based on 2016-18 averages):
Source: ECA based on UNCTADStat
Fuel
Exp
ort
s(U
S$ b
n)
Share of Total Exports
Share of GDP
91.7%
10.7%
95.7%
20.0%
97.4%
29.4%
88.4%
62.1%
10.8%
2.7%
22.3%
2.5%
86.8%
38.4%
61.2%
35.3%
55.4%
20.9%
23.3%
5.2%

…fuels: Price declines and demand contraction
Assuming identical volume of barrels of fuels to
be exported in 2020 as in average 2016-18
period, with average 2020 price at US$ 35*,
COVID-19 could lead to Africa’s export revenues
from fuels falling to around US$ 101 billion in
2020 (with countries in above table most
negatively affected);
Observed prices of $61.6 (Jan.), $53.4 (Feb.), $35
(Mar.) and predicted prices of $30 Apr. through
Dec. due in part to OPEC policy differences
Further drops in demand could compound price
drops: (e.g. cancellation of flights, lower use of
cars due to lock downs and quarantine
measures, etc.).

Fuels cont’d: zoom on Nigeria upto $19b loss
COVID-19 could reduce Nigeria’s total exports of crude oil in 2020 by between
US $14 billion and US$ 19 billion (compared to predicted exports without COVID-
19).
33.4
21.4
28.5
38.936.7
19.4
14.2
0
5
10
15
20
25
30
35
40
2016 2017 2018 2019 2020
Predicted before COVID-19
Predicted with COVID-19: average oil price falling to US$35/bbl in 2020
Predicted with COVID-19: average oil price falling to US$35/bbl in 2021 + halved export quantities in 2020
Evolution of crude oil exports from Nigeria – 2016-19 (observed)
and 2020 (predicted under various scenarios) – US$ billion:
Expected Pressure on Naira
Source: ECA based on Central Bank of Nigeria (observed; prices and quantities) and Trading Economics (predicted; quantities) as well as EIA and WTI (predicted prices)Remark: observed export values here are for strictly crude oil when there were based on fuels (i.e. mineral fuels and lubricant as per STIC 3 nomenclature)
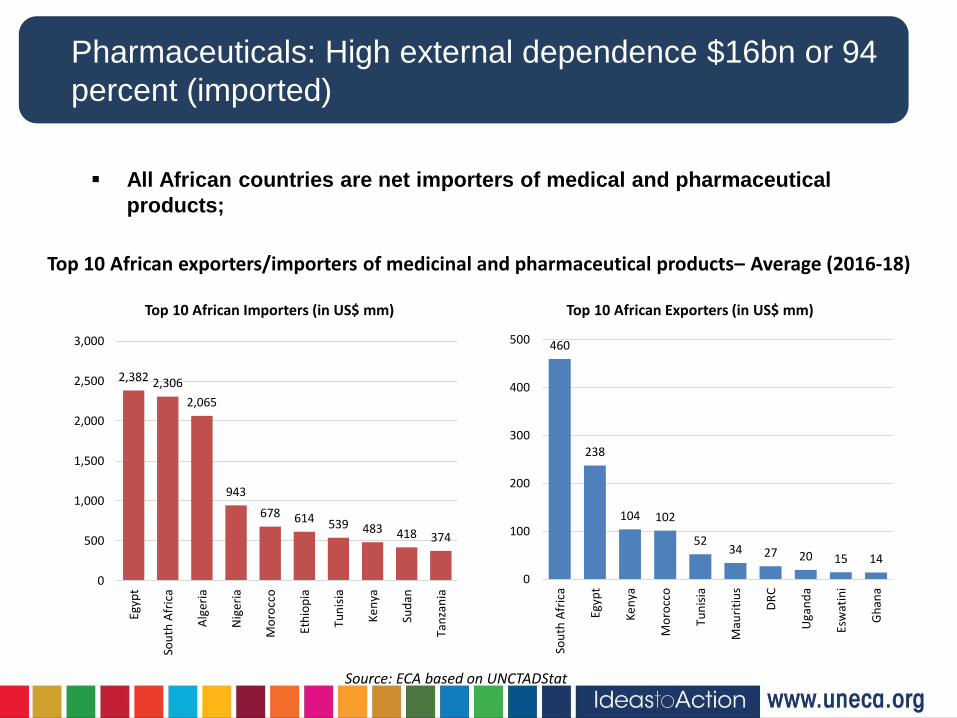
Pharmaceuticals: High external dependence $16bn or 94
percent (imported)
All African countries are net importers of medical and pharmaceutical
products;
Top 10 African exporters/importers of medicinal and pharmaceutical products– Average (2016-18)
Source: ECA based on UNCTADStat
2,382 2,306
2,065
943
678 614 539 483 418 374
0
500
1,000
1,500
2,000
2,500
3,000
Egyp
t
Sou
th A
fric
a
Alg
eria
Nig
eri
a
Mo
rocc
o
Eth
iop
ia
Tun
isia
Ke
nya
Sud
an
Tan
zan
ia
460
238
104 102
5234 27 20 15 14
0
100
200
300
400
500
Sou
th A
fric
a
Egyp
t
Ke
nya
Mo
rocc
o
Tun
isia
Mau
riti
us
DR
C
Uga
nd
a
Esw
atin
i
Gh
ana
Top 10 African Importers (in US$ mm) Top 10 African Exporters (in US$ mm)

Pharmaceuticals: Europe, India, China 80% of total imports
COVID19 affected countries are Africa’s main exporters
Medical and pharmaceutical products imported from the EU-
27 (51.5% of Africa’s total imports) but also India (19.3%) and
to a lesser extent Switzerland (7.7%), China (5.2%), the US
(4.3%) and the UK (3.3%);
from Africa, South Africa is the largest source of imports
(2.2% of Africa’s total imports);
African exports of medicinal and pharmaceutical products,
although quite limited, are essentially directed to Africa
(56.5% of Africa’s total exports), the EU-27 (16.5%) and to
some extent Saudi Arabia (3.3%), the US (3.0%) and Yemen
(2.6%). Source: ECA based on UNCTADStat
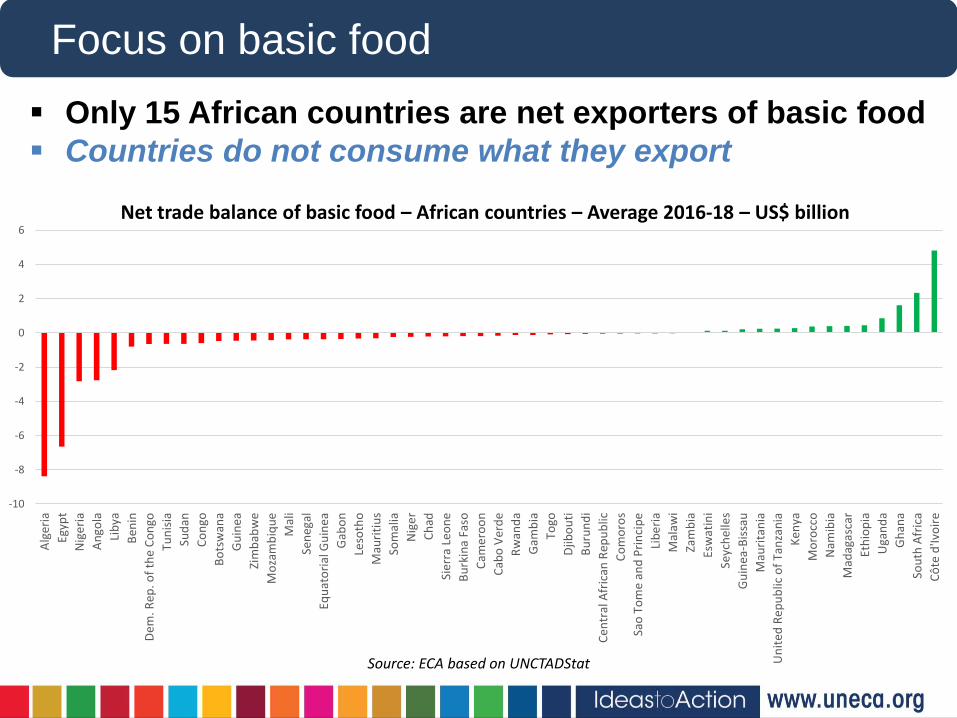
Focus on basic food
Only 15 African countries are net exporters of basic food
Countries do not consume what they export
Net trade balance of basic food – African countries – Average 2016-18 – US$ billion
Source: ECA based on UNCTADStat
-10
-8
-6
-4
-2
0
2
4
6
A
lger
ia
E
gyp
t
N
ige
ria
A
ngo
la
L
ibya
B
enin
D
em. R
ep. o
f th
e C
on
go
T
un
isia
S
ud
an
C
on
go
B
ots
wan
a
G
uin
ea
Z
imb
abw
e
M
oza
mb
iqu
e
M
ali
S
eneg
al
E
qu
ato
rial
Gu
inea
G
abo
n
L
eso
tho
M
auri
tiu
s
S
om
alia
N
ige
r
C
had
S
ierr
a Le
on
e
B
urk
ina
Faso
C
ame
roo
n
C
abo
Ver
de
R
wan
da
G
amb
ia
T
ogo
D
jibo
uti
B
uru
nd
i
C
entr
al A
fric
an R
epu
blic
C
om
oro
s
S
ao T
om
e an
d P
rin
cip
e
L
ibe
ria
M
alaw
i
Z
amb
ia
E
swat
ini
S
eych
elle
s
G
uin
ea-B
issa
u
M
auri
tan
ia
U
nit
ed R
epu
blic
of
Tan
zan
ia
K
enya
M
oro
cco
N
amib
ia
M
adag
asca
r
E
thio
pia
U
gan
da
G
han
a
S
ou
th A
fric
a
C
ôte
d'Iv
oir
e
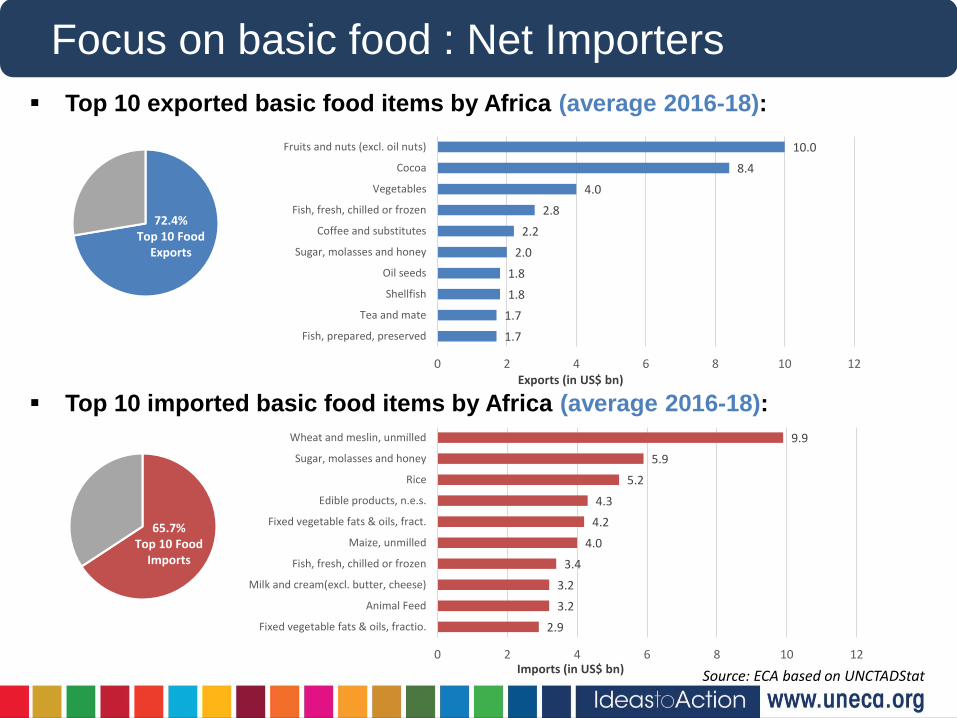
Focus on basic food : Net Importers
Top 10 exported basic food items by Africa (average 2016-18):
Top 10 imported basic food items by Africa (average 2016-18):
Source: ECA based on UNCTADStat
1.7
1.7
1.8
1.8
2.0
2.2
2.8
4.0
8.4
10.0
0 2 4 6 8 10 12
Fish, prepared, preserved
Tea and mate
Shellfish
Oil seeds
Sugar, molasses and honey
Coffee and substitutes
Fish, fresh, chilled or frozen
Vegetables
Cocoa
Fruits and nuts (excl. oil nuts)
2.9
3.2
3.2
3.4
4.0
4.2
4.3
5.2
5.9
9.9
0 2 4 6 8 10 12
Fixed vegetable fats & oils, fractio.
Animal Feed
Milk and cream(excl. butter, cheese)
Fish, fresh, chilled or frozen
Maize, unmilled
Fixed vegetable fats & oils, fract.
Edible products, n.e.s.
Rice
Sugar, molasses and honey
Wheat and meslin, unmilled
Exports (in US$ bn)
Imports (in US$ bn)
72.4%Top 10 Food
Exports
65.7%Top 10 Food
Imports
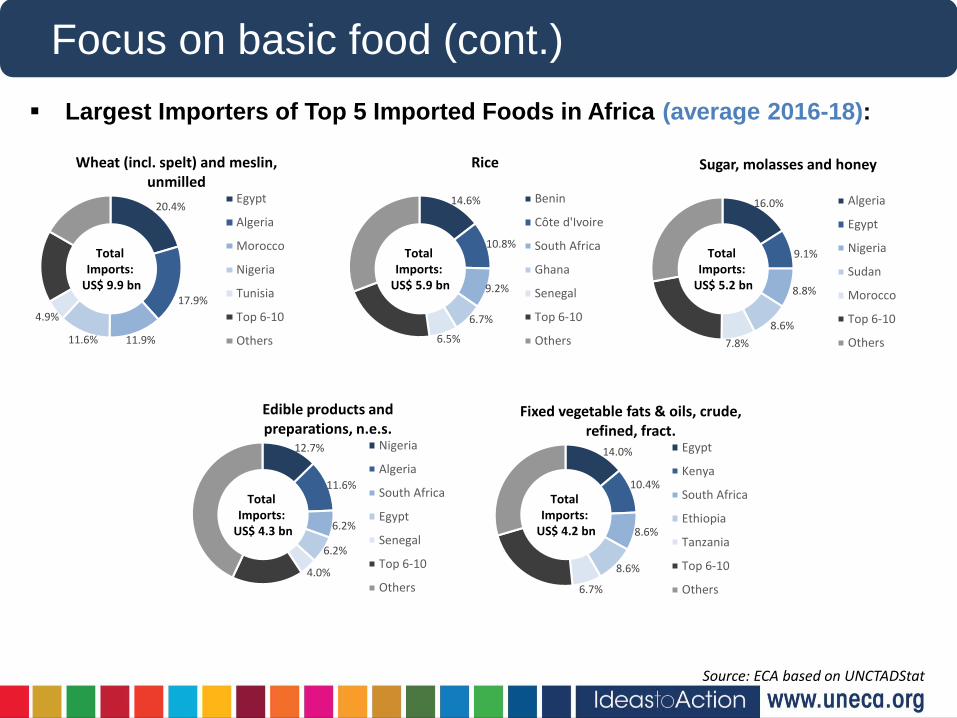
20.4%
17.9%
11.9%11.6%
4.9%
Wheat (incl. spelt) and meslin, unmilled
Egypt
Algeria
Morocco
Nigeria
Tunisia
Top 6-10
Others
14.6%
10.8%
9.2%
6.7%
6.5%
Rice
Benin
Côte d'Ivoire
South Africa
Ghana
Senegal
Top 6-10
Others
16.0%
9.1%
8.8%
8.6%
7.8%
Sugar, molasses and honey
Algeria
Egypt
Nigeria
Sudan
Morocco
Top 6-10
Others
12.7%
11.6%
6.2%
6.2%
4.0%
0.162
Edible products and preparations, n.e.s.
Nigeria
Algeria
South Africa
Egypt
Senegal
Top 6-10
Others
14.0%
10.4%
8.6%
8.6%
6.7%
0.222
Fixed vegetable fats & oils, crude, refined, fract.
Egypt
Kenya
South Africa
Ethiopia
Tanzania
Top 6-10
Others
Total Imports:
US$ 9.9 bn
Total Imports:
US$ 5.9 bn
Total Imports:
US$ 5.2 bn
Total Imports:
US$ 4.3 bn
Total Imports:
US$ 4.2 bn
Focus on basic food (cont.)
Largest Importers of Top 5 Imported Foods in Africa (average 2016-18):
Source: ECA based on UNCTADStat
Policy Options

Recommendations
African governments could review and revise their budgets to reprioritize spending
towards mitigating expected negative impacts from COVID-19 on their economies,
such as:
As a safety net, provide incentives for food importers to quickly forward purchase to
ensure sufficient food reserves in key basic foods items;
Fund virus preparedness, prevention and curative facilities including logistics.
Use crisis to improve health systems
Prepare fiscal stimulus packages (e.g. guaranteeing wages for those unable to work
due to the crisis, favoring consumption and investment);
Maintain infrastructure investments to protect jobs
Maintain momentum on CFTA as mechanism for building long term continental
resilience and volatility management. For example increase intra African trade on
pharmaceutical and basic food products

THANK YOU!