economic impact of hydrographic surveys · relatively inexpensive), hydrographic surveying can not....
TRANSCRIPT
TS 8I - Economic Benefits of Hydrography Brian Douglas Connon and Rod Nairn Economic Impact of Hydrigraphic Surveys FIG Congress 2010 Facing the Challenges – Building the Capacity Sydney, Australia, 11-16 April 2010
1/13
Economic Impact of Hydrographic Surveys
Brian Douglas CONNON, United States of America Rod NAIRN, Australia
Key words: Hydrography, economics, bathymetry, coastal zone management, hazard mitigation.
SUMMARY This paper discusses the inherent value of hydrographic services and bathymetric surveys beyond the obvious benefit of improved nautical charts. These direct and indirect benefits are not traditionally recognized for their economic value to coastal States as they are difficult to quantify. Also, their actual value is somewhat dependent on the specific economic, recreational, and defense activities of each coastal State. Convincing governments to invest in hydrography and bathymetry can be difficult. However even without quantitative analysis, there is strong logical and qualitative argument that recognizes the critical value of hydrographic services as an essential element of national infrastructure and a critical enabler of other maritime activities. Thus, providing government with information detailing the second and third order benefits of bathymetric surveys and hydrographic services may influence further investment in these essential enablers of economic growth.
TS 8I - Economic Benefits of Hydrography Brian Douglas Connon and Rod Nairn Economic Impact of Hydrigraphic Surveys FIG Congress 2010 Facing the Challenges – Building the Capacity Sydney, Australia, 11-16 April 2010
2/13
Economic Impact of Hydrographic Surveys
Brian Douglas CONNON, United States of America Rod NAIRN, Australia
1. INTRODUCTION The economic impacts of hydrography and bathymetry on safety of navigation have been studied and reported for a number of years. However it is important to recognize that many aspects of hydrographic services fall into the category of 'public goods'. A public good or service is that which is in the public interest but would not be supplied at optimal levels by market forces alone. There are three characteristics of a public good; non-rivalness in consumption, non-excludability and impossibility of rejection. The nautical chart is a noteworthy example of a public good. An individual using a chart does not impair another individual’s ability to use a chart to navigate safely, hence satisfying non-rivalness in consumption. It displays non-excludability as it is impossible to prevent any member of the public from using the information the hydrographic service provides. Also, an individual cannot abstain from the benefits of the hydrographic service even if he or she wished to (impossibility of rejection). (Coochey, 1992)
Several studies have estimated that the return on investment from having a national hydrographic program is on the order of 1:10. (IHO, 2004) This certainly should be an incentive for coastal nations to invest in hydrographic services and to have properly charted waters that can support an ever growing need for maritime commerce. Improved charts may allow for faster transits of ships with deeper draughts, resulting in a greater amount of goods moving through navigational choke points and ports. Perhaps just as important is the need for hydrography and bathymetry to support the development of national and local strategies to preserve and protect ocean resources. Coastal zone management, hazard response and mitigation, national defense and maritime boundary delimitation are but a few examples of activities that require knowledge of the seafloor. (IHO, 2004) Hydrography and bathymetry provide the foundation layer on which many other programs can be built to provide essential, nationally significant information to government authorities. Whilst the provision of hydrographic services can thus be seen as a fundamental enabler and an important boost to many aspects of economic development, it is also germane that large scale hydrographic surveys are extremely expensive. Whereas land mapping can be effectively conducted over large areas using satellite remote sensing techniques (which is relatively inexpensive), hydrographic surveying can not. 2. AREAS OF IMPACT The Canadian Hydrographic Service (CHS) conducted a study of the cost benefits of having a hydrographic service. (Brinkman and Caverley, 1992) While specific to Canada, the general lessons of this study apply to any maritime nation. This study looked at six areas of impact:
TS 8I - Economic Benefits of Hydrography Brian Douglas Connon and Rod Nairn Economic Impact of Hydrigraphic Surveys FIG Congress 2010 Facing the Challenges – Building the Capacity Sydney, Australia, 11-16 April 2010
3/13
commercial shipping, commercial fishing, recreational boating, national defense, Arctic development, and environment. For this discussion, similar themes will be built upon to capture the direct and indirect benefits of hydrography. 2.1 Marine Transportation and Safety of Navigation A recent study by the U.S. International Trade Commission cites, for numerous countries, one of the main barriers to economic growth is the lack of adequate port facilities and infrastructure. (U.S. International Trade Commission, 2005) Improved ports will require dredging, new piers, enhanced terminal functionality and, of course, up-to-date nautical charts. Maritime transport remains the backbone of international trade with over 80 per cent of world merchandise trade by volume being carried by sea. During the past three decades, the annual average growth rate of world seaborne trade is estimated at 3.1 per cent. At this rate, global seaborne trade would be expected to increase by 44 per cent in 2020 and double by 2031, potentially reaching 11.5 billion tons and 16.04 billion tons, respectively. (UNCTAD, 2008) In the United States, more than 78 percent of overseas trade by volume and 43.5 percent by value comes and goes by ship, including nine million of barrels of imported oil daily. (Department of Transportation, 2007). Nearly 80% of U.S. import and export freight is transported through seaports (RITA, 2009); more than 80% of the nation’s economy is supported in coastal states; and more than 50% of the population and U.S. economic activity are found in coastal management counties. (NOEP, 2009) In Australia these figures are even more empowering with a staggering 99.9% of trade by weight and 78% by value being carried by sea. (BTRE, 2007) Commercial shipping relies on current nautical charts for one important reason, time is money. Good charts provide the most direct routes between ports, reduce the number of pilots required, decrease the number of groundings (and reduce insurance rates), and allow deeper draft vessels (i.e. more cargo) to be used. The National Oceanographic and Atmospheric Administration (NOAA) reported that one additional foot of draft may account for between $36,000 and $288,000 of increased profit per transit into Tampa, FL. (NOAA, 2000) This is also demonstrated in a study completed by Thompson Clarke Shipping (AMSA, 2007) which examined Torres Strait shipping trends and investigated the economic impact of increasing the maximum draught of the Prince Of Wales Channel, currently 12.2 metres, by 30 cm and 60 cm. In the financial year of 2005-2006, 602 vessels with a draught in excess of 11.0m transited via the Torres Strait and of these, 161 were loaded to exactly the maximum draught. If the maximum draught can be increased to 12.5m, the increase in cargo carried would amount to AUD 10.3 million. If extended to 12.8m, it would increase again to AUD13.3 million. Given this potential for substantial economic benefit, re-surveying the Prince of Wales Channel to a very high degree of confidence has been allocated high priority for the Australian Hydrographic Service. In areas with inadequate charting, shipping companies deploy a fleet that is older, less efficient and capable, and more likely to be involved in a maritime accident due to the age of the equipment and caliber of the crew. (Brinkman and Caverley, 1992) The economic benefits and savings associated with preventing marine accidents through more adequate
TS 8I - Economic Benefits of Hydrography Brian Douglas Connon and Rod Nairn Economic Impact of Hydrigraphic Surveys FIG Congress 2010 Facing the Challenges – Building the Capacity Sydney, Australia, 11-16 April 2010
4/13
survey are significant. The cost of an oil spill can be measured by the revenue lost through the loss of cargo, the vessel and days at sail, as well as the cost of cleanup. For example, the Exxon Valdez oil spill of 1989 cost Exxon USD 2.1 billion for clean up, USD1.1 billion for settlements and in 1994, a US jury found Exxon negligent and fined them USD 5 billion for the incident. The destruction of wildlife, habitat and future resources are more difficult to assign dollar value to however the estimated price that the residents affected were willing to give their pristine environment for one degraded by the spill was approximately USD 7.9 billion. Additionally, most marine accidents, (groundings in particular) are the result of operator error. Approximately 25% of all serious ship accidents occur in coastal waters or during harbor approach. Of these, greater than 75% result from insufficient information, mistaken interpretation or assessment, and lack of timely preventative action. (Hecht, et al, 2002) The introduction and implementation of Electronic Chart Display and Information Systems (ECDIS and Electronic Navigation Charts (ENC into the maritime industry has the potential to significantly reduce the margin for human error during pilotage navigation scenarios such as that which afflicted the Exxon Valdez and therefore reduce the monetary costs to companies and environmental cost to the global community. In Africa’s Gulf of Guinea, commercial shipping is the primary method of trade for coastal nations, whereas interior landlocked countries rely on train and truck connections to seaports. Increased production of oil and gas requires substantial infrastructure to support the export of petroleum products, as well as the import of commercial goods into the region. U.S. imports from Africa increased 40.2% in 2005. Oil-producing countries showed the greatest increases; Nigeria up 48.9%, Angola 87.7%, Gabon 14.1%, and Congo 89.5%. U.S. exports to West Africa are dominated by heavy machinery & equipment, oilseeds & grains, and industrial chemicals; products that must be transported by maritime commerce. (US Dept. of Commerce, 2006) Three ports in the Gulf of Guinea rank in the top ten African container ports: Abidjan, Lagos, and Tema. As container traffic flow continues to rise, not only from the United States, but also from Europe and Asia, new shipping companies expand into the region. For example, the Gold Star Line from China has established a direct trade route into West Africa from Chennai, India. (UNCTAD, 2006) On average, the current charts for the region are based on surveys that are over 25 years old and were not conducted with the benefit of GPS and modern echosounders. The US Navy conducted a cooperative hydrographic survey in Tema, Ghana and observed discrepancies of 35-125 m in shoreline (horizontal) features and .5m - 5.8m in depths when compared to available charts. It can be expected that similar discrepancies exist in the many areas of the world utilizing charts based on dated surveys or with insufficient data. Unless there is further investment in improving the standard of surveys and charting it is likely that increasing shipping volumes will yield a similar increase in navigational incidents.
TS 8I - Economic Benefits of Hydrography Brian Douglas Connon and Rod Nairn Economic Impact of Hydrigraphic Surveys FIG Congress 2010 Facing the Challenges – Building the Capacity Sydney, Australia, 11-16 April 2010
5/13
2.2 Marine Resources Marine resources can be broken down into two categories, living and mineral, which cover the majority of renewable and non-renewable resources found in the ocean. Activities associated with marine resources include: commercial and recreational fishing, aquaculture, sand and gravel mining, ocean dumping, oil, gas, and mineral exploration and extraction, channel dredging, dredge material disposal, pipeline/cable installation, and pollution. Control/regulation of these activities is critical to the overall success of a coastal region, either as a protected area or as an economically viable fishing ground. 2.2.1 Living Resources As marine living resources, such as those associated with fishing and aquaculture, are so vital to the economies of coastal nations, the information that hydrography can provide to ensure efficient use of these resources is equally as vital. In 2006, commercial and recreational fisheries supported over 2 million jobs and contributed over $73 billion to the United States gross national product. (NMFS, 2009) Commercial fisherman benefit from accurate charting through safe navigation, knowledge of preferred fish habitats, locating wrecks and other hazards that can interfere with nets, and improving the speed and efficiency of onload/offload operations. Bathymetry is a critical component of the characterization and delineation of fish habitats, as well as, the proper location and extent of aquaculture areas. The United States has undertaken significant efforts to characterize and describe seafloor and open ocean habitats and associated fish assemblages on spatial scales relevant to fishery management and habitat protection. In order to manage these resources they must be mapped. Substantial hydrographic effort has been expended to delineate and map important habitats including coastal shorelines, estuaries, salt marsh wetlands, anadromous streams, riparian zones, submerged aquatic vegetation (e.g. eelgrass), deepwater corals, pinnacles, seamounts, and fishing grounds on the Continental Shelf and Slope. (NMFS, 2009) Coastal, estuarine, and marsh waters serve as the nursery for many species of fish that live in the deep ocean as adults. Fresh water streams and rivers also serve as vital pathways for ocean fish, such as salmon, which travel upstream to spawn. By carefully mapping the features mentioned above, it is possible to effectively manage, protect, and preserve marine living resources through mechanisms like marine sanctuaries, protected areas, and reserves. Proper planning of aquaculture projects based on modeling of the ocean environment can not only maximize production, but also help developers avoid areas that will undoubtedly fail to meet financial expectations. 2.2.2 Mineral Resources Mineral resources include sand, gravel, oil, and other economically important resources found on, or below, the ocean bottom. Hydrography, by definition, characterizes the nature of the seafloor and thereby is a direct contributor to the discovery of areas of mineral resources available for exploitation. Sidescan sonars, or acoustic backscatter from multi-beam echosounders, are capable of bottom provincing—a technique that allows hydrographers to

TS 8I - Economic Benefits of Hydrography Brian Douglas Connon and Rod Nairn Economic Impact of Hydrigraphic Surveys FIG Congress 2010 Facing the Challenges – Building the Capacity Sydney, Australia, 11-16 April 2010
6/13
determine the type and extent of different bottom characteristics. This incidental activity can significantly reduce the cost of exploration by private businesses whilst at the same time continuing to improve navigation safety. Bathymetric information is also critical to selection of routes for submarine pipelines and cables. Whilst exploration companies may focus their data collection on sensors such as sub-bottom profilers and magnetometers to gain detailed information of what is lying on and below the seabed, the concurrent collection of standard hydrographic information and these additional data is cost efficient means of satisfying the dual purposes of improved safety of navigation and marine resource development. Clearly, the national interest is best served when the base hydrographic information collected by oil and gas companies is added to the national archive. 2.3 Environmental Concerns Hydrographic surveys provide the base layer for environmental monitoring, impact modeling and consequence management. Physical environmental characteristics, such as bathymetry, are required to support numerical modeling efforts in order to provide accurate representations of the impact from a variety of man-made and naturally occurring events. If no controls on the use of the environment are in place, nations developing their coasts may be vulnerable to degradation as industrialization and economic expansion occurs. 2.3.1 Coastal Zone Management As more of the world’s population is concentrated around our coasts, the focus on coastal zone management must continue to grow if we are to maximize utilization without damaging the environment. In the United States, population density along coasts is five times greater than that of the rest of the nation.. (OCRM, 2007) Internationally, government authorities and resource managers struggle to find the balance in allocation of valuable water space to a diversity of interests including recreational and commercial fishing, diving, pleasure yachting, professional navigation, beach access, tourism activities, and marine farming. Archaeological studies of areas with historic or cultural value require precise mapping of the ocean bottom. Bathymetry also provides the necessary information for underwater construction and development. Pipelines, telecommunication cables, and offshore drilling platforms cannot be arbitrarily placed; bathymetry must be used to ensure their locations are safe from potential hazards. Without proper governance over coastal construction and development, significant negative impacts to property and people may occur. For example, groins, jetties or revetments built along a coast to create a clear channel or safe harbor for fishing boats may result in the erosion of sand downdrift of the structure area due to blocking of sediment transport by longshore currents and subsequent accretion of sand in other areas. Proper modeling of the environmental consequences of proposed man-made features along a coast must be conducted to avoid potentially significant economic impacts due to loss of shoreline and beaches. Hydrographic survey provides information that is essential to enable proper planning to ensure that coastal zones are effectively and sustainably managed.
TS 8I - Economic Benefits of Hydrography Brian Douglas Connon and Rod Nairn Economic Impact of Hydrigraphic Surveys FIG Congress 2010 Facing the Challenges – Building the Capacity Sydney, Australia, 11-16 April 2010
7/13
2.3.2 Offshore Aquaculture Offshore aquaculture, although in its infancy, is an exciting development into sustainable fish farming. Aquaculture, probably the fastest growing food-producing sector, now accounts for almost 50 percent of the world’s food fish and is perceived as having the greatest potential to meet the growing demand for aquatic food. Given the projected population growth over the next two decades, it is estimated that at least an additional 40 million tonnes of aquatic food will be required by 2030 to maintain the current per capita consumption. (FAO, 2006) One of the major barriers to development is finding suitable sites in coastal areas, where aquaculture must compete with many other coastal uses. (NOAA Aquaculture Program, 2006) The selection of an Aquaculture site is a process that not only involves market forces but also governmental designation of sites. The planning of offshore aquaculture zones takes into account not only hydrological and biographical factors, but also topographical and hydrographical factors. Accurate hydrographic information can provide assistance in the selection of appropriate aquaculture sites to enhance a nation’s ability to plan efficiently for sustainable harvest into the future. 2.3.3 Climate Change, Natural Disasters, Pollution, and Hazard Mitigation Many natural and man-made occurrences can have a significant impact on the ecology and biology of a coastal region. Rising atmospheric and ocean temperatures can have adverse affects on marine vegetation and organisms which, in turn, can impact the economy of a coastal nation. By surveying habitat boundaries, changes in expanse or volume can be easily monitored and immediate actions taken to mitigate negative trends, where possible. Increased erosion can be expected with rising seas and more energetic storms, which will decrease water clarity and quality, as well as increase sedimentation and silting. The results of a rise in sea level along a typical beach profile are twofold: first, a direct landward encroachment takes place (shoreline recession) followed by a beach face readjustment by waves to a flatter slope (erosion above the waterline and some accretion offshore). (CHL-ERDC, 2007) It is possible to predict the extent of a sea-level rise and take early action to mitigate negative impacts on economic activities in the coastal zone. Increased oil and gas production/export and increases in commercial shipping increases the possibility of a major environmental disaster in coastal regions. Coastal development can also heighten chances of introduction of contaminants into the marine environment. For example, placing a pipeline over rock outcrops or coral heads can place stress on the pipeline and possibly result in a break and release of the pipeline’s contents. Pollution from ports, agricultural run-off, and other sources is becoming a significant issue for maritime nations. Hydrographic survey is imperative to environmental monitoring through the establishment of baseline conditions and will thereby assist in the development of mitigation plans in the event of a maritime accident.
TS 8I - Economic Benefits of Hydrography Brian Douglas Connon and Rod Nairn Economic Impact of Hydrigraphic Surveys FIG Congress 2010 Facing the Challenges – Building the Capacity Sydney, Australia, 11-16 April 2010
8/13
2.4 Maritime Boundaries The United Nations Convention on the Law of the Sea (UNCLOS) has established the basic framework for boundary definitions of territorial seas, the exclusive economic zone (EEZ), and the continental shelf. The delineation of these zones are increasingly important in determining the rights and responsibilities of coastal states. One of the most important economic impacts of UNCLOS is the ability of a coastal nation to extend their claims beyond the 200 mile EEZ based on the bathymetry, change in slope of the continental shelf and geology of the seafloor. National hydrographic offices are the recognized, official provider of this information. (IHO, 2004) As noted above, marine resources can provide viable economic activity for coastal nations and any opportunity to increase area available for exploitation should be seriously considered. In 1998 Australia entered into a program of detailed offshore surveying to map the limits of the extended continental shelf. After submission in November 2004, Australia’s extended continental shelf claim was approved by the United Nations in 2008 and resulted in the recognition of an additional 2.5 million square kilometers of continental shelf. Clearly, the additional seabed resources in the region justify the cost of surveying and charting to support the claim. Hydrographic surveys are also the source of the fundamental data used to provide the baseline information for determining maritime boundaries between countries. For example, if two countries have agreed that their maritime boundary will follow the thalweg of a channel, bathymetry is the only method to accurately determine where the thalweg is located. In other cases where maritime boundaries are in dispute the determination by courts will invariably rely substantially on the positions, and delineation of offshore islands, reefs and outcrops determined by detailed hydrographic surveys. 2.5 Law Enforcement and Defense Coastal nations generally desire to organically monitor maritime activities and conduct law enforcement and defense operations within their territorial waters and EEZ. Small navies and coast guards with limited assets are often under-resourced to deal with the host of threats found on today’s oceans. People, drug and weapons smuggling, piracy, illegal fishing, and proliferation of terrorism provide significant threats to the economies of coastal nations, which must protect their commerce, marine resources and residents. The economic value of the knowledge that a hydrographic service provides cannot be underestimated in terms of its ability to enable ‘Maritime Power’. Maritime power is described by Bateman and Bergin as a countries ability to use the sea to promote it national interests – economic, political, strategic and environmental. (Bateman and Bergin, 2009) It in turn ensures that “good order at sea” is maintained, to permit the free flow of seaborne trade. The free flow of trade not only improves economic growth by opening the most efficient routes and thereby cutting transportation costs, but also minimises other economic losses. These monetary losses can be incurred through piracy, maritime terrorism, the illegal trade of people, arms or drugs and the unregulated pollution of the marine environment. The strategic benefit that hydrographic surveys provide is not only immense but immeasurable. Accurate
TS 8I - Economic Benefits of Hydrography Brian Douglas Connon and Rod Nairn Economic Impact of Hydrigraphic Surveys FIG Congress 2010 Facing the Challenges – Building the Capacity Sydney, Australia, 11-16 April 2010
9/13
charts provide increased freedom of manoeuvre for the law enforcement agencies of these countries - a tactical advantage when dealing with the threats discussed here. In addition, hydrographic surveys can provide critical information for mine warfare applications. Locating mines, determining mine burial rates, modeling mine drift, and choosing mine avoidance routes are all enabled through high resolution bathymetry and acoustic imagery that is gathered during hydrographic surveys. 3. OPPORTUNITIES FOR ASSISTANCE TO DEVELOPING NATIONS As can be seen for the above discussion, hydrographic surveys of national waters and in particular the provision of comprehensive hydrographic services provide substantial intrinsic value to a nation's economy and the opportunity to participate more actively in the global economy. The non-intrusive, environmentally supportive and non-controversial nature of hydrography also make it an ideal avenue for economic assistance to developing nations. Below, an example is presented for a specific region to demonstrate how developing states might benefit from the investment in hydrographic services. 3.1 Pacific Island Context Of geopolitical interest to the US and Australia are the Pacific Island countries which typically have small economies, are remote in geographic and political position and could be characterized as developing. Often these counties are unable to take hydrographic responsibility for themselves, and rely on the assistance of regional powers with larger hydrographic services. This section aims to describe how the provision of hydrographic services in developing island states can contribute to sustainable economic development of island nations by opening up these often poorly surveyed and therefore inaccessible areas to trade and tourism. This can be counted as a direct injection into the local economy of these counties, and should be considered as a key target area for overseas aid. 3.1.1 Investment in Infrastructure Shipping to Pacific island states is currently very expensive due to long distances between ports, low trade volumes, imbalanced trade (exports far outweigh imports) and poor facilities suffering from inadequate investment and maintenance. Many of these aspects can be addressed by improving hydrographic services in the region. For example, many inter-island routes contain archipelagic routes that are unattractive and dangerous to the bulk carrier. More accurate surveys of these areas could open shorter, safer and more efficient sea lanes which could increase trade to the region. Once accessibility is improved, industry will be more willing to improve port facilities in the region, which in turn, will require regular surveys in order to maintain its functionality. (Asian Development Bank, 2007) Hydrographic surveys therefore contribute to building much needed infrastructure in the region, eventually enabling Pacific island states to take advantage of economic opportunities and better participate in the global economy. 3.1.3 Contribution of Tourism
TS 8I - Economic Benefits of Hydrography Brian Douglas Connon and Rod Nairn Economic Impact of Hydrigraphic Surveys FIG Congress 2010 Facing the Challenges – Building the Capacity Sydney, Australia, 11-16 April 2010
10/13
In a study conducted by Carnival Australia, a multinational in charge of recreational cruise providers such as P&O and Princess cruises, it was recognised that currently, the cruise ship industry cannot meet the demand in the sector. (Access Economics, 2008) The larger the demand for cruise holidays, the larger the cruise ships required in order to satisfy demand and obtain economies of scale. However, the larger the cruise ship the larger the draught and the more restricted the access to certain ports. Pacific Island port visits make up a majority of destinations of Australian based cruise liners. The report indicates that new larger cruise ships are unable to access the ports they wish due to inadequate hydrographic information, for example Yasawa and the Lau Group, Fiji. The report concludes that development of cruise tourism in the region is being seriously restricted by the low levels of marine infrastructure and there is potential for substantial growth. Clearly, there are untapped opportunities awaiting those island states that could provide adequate hydrographic information and port facilities. There are also the second order benefits of increased local employment as cruise companies prefer to recruit from the island nations, as well as enhanced incentives and opportunities to showcase and preserve customs and culture. 4. CONCLUSION Despite the comprehensive justifications offered above, when allocating funds to requirements, governments often give a low priority to hydrography. The reasons range from a lack of interest or a lack of understanding to the pragmatisms of political survival. Investments in national infrastructure, in genuine public goods such as hydrography, just don't attract the populist gratitude of a tax reduction or a welfare handout, neither do they satisfy the feel-good sentiment of an industry sector assistance package. Hydrographic infrastructure provides benefits to the nation as a whole and not to any one lobby group in particular. Investing in hydrography saves lives by making navigation safer, it enables maritime activities that support national security and economic prosperity while contributing to protection of the environment. It is akin to investing in infrastructure and insurance, perhaps not very exciting but invariably a very sound investment! This paper does not seek to argue that every coastal State should establish its own organic hydrographic organization as the dollar and personal resource costs may exceed the capacity of many developing States. It does however; argue the high national value of hydrographic services and where such capability is beyond a nation’s own means, it recommends the provision of hydrographic support as a prime area for a cooperative bilateral arrangement or foreign aid support. It also emphasizes the criticality of national governments recognizing the value and importance of hydrographic information and putting in place arrangements that ensure any hydrographic information collected within that nation’s waters is contributed to the national hydrographic database. Finally, this paper provides supplemental information that can be used to overcome at least one of the impediments to hydrographic investment referred to above, the deficiency in knowledge. It provides a comprehensive overview of the ‘public good’ benefits and intrinsic economic values of hydrography. This information may assist in imparting the importance of
TS 8I - Economic Benefits of Hydrography Brian Douglas Connon and Rod Nairn Economic Impact of Hydrigraphic Surveys FIG Congress 2010 Facing the Challenges – Building the Capacity Sydney, Australia, 11-16 April 2010
11/13
the requirement for hydrographic surveys among government officials. In doing so it also provides arguments to support the provision of hydrographic infrastructure as a viable, effective and indeed attractive avenue of providing external aid to developing coastal States. REFERENCES Access Economics, Commercial In Confidence for Carnival Australia, The Economic Contribution of the Cruise Shipping Industry to Australia, 08 May 2008 Asian Development Bank, Oceanic Voyages: Aviation and Shipping in the Pacific, Pacific Studies Series, Philippines, 2007 Australian Maritime Safety Authority (AMSA), Implementation of an Under Keel Clearance System for the Torres Strait, March, 2007. Bateman, S., and Bergin, A. Seachange: Advancing Australia’s Ocean Interests, Australian Strategic Policy Institute, Barton, ACT, March 2009 Brinkman, G. L., and S. L. Caverley. Benefit-Cost Assessment of the Canadian Hydrographic Service. Report prepared by Intercambio Limited for Canadian Hydrographic Survey, Ottawa. 1992 Bureau of Transport and Regional Economics [BTRE] 2007, Australian maritime trade: 2000–01 to 2004–05, Working Paper 69, BTRE, Canberra, ACT. Coastal and Hydraulics Laboratory - Engineer Research and Development Center (CHL-ERDC) Beach Basics, Vicksburg, Mississippi. June 2007 Coochey. J, An Economic Analysis of the Benefit of the RAN Hydrographic Programme Australian Government Publishing Service, July 1992 Department of Transportation, Bureau of Transportation Statistics, 2007: National Transportation Statistics, Washington, DC, [502 pp.] ONLINE. Available: http://www.bts.gov/publications/national_transportation_statistics/pdf/entire.pdf Food and Agriculture Organization (FAO) of the United Nations, Inland Water Resources and Aquaculture Service, Fishery Resources Division, FAO Fisheries Technical Paper 500, State of World Aquaculture 2006. Rome. 2006. Hecht, H., Berking, B., Buttgenbacj, G.,Jonas, M., Alexander, L: The Electronic Chart, Functions, Potential and Limitations of a New Marine Navigation System, GITC, December 2002
TS 8I - Economic Benefits of Hydrography Brian Douglas Connon and Rod Nairn Economic Impact of Hydrigraphic Surveys FIG Congress 2010 Facing the Challenges – Building the Capacity Sydney, Australia, 11-16 April 2010
12/13
International Hydrographic Organization: Miscellaneous Publication 2: National Maritime Policies and Hydrographic Services. International Hydrographic Bureau. Monaco. 2004. Minister for Resources and Energy: UN Confirms Australia’s Rights Over Extra 2.5 Million Square Kilometres of Seabed. Press Release. ONLINE. Available: http://minister.ret.gov.au/ National Marine Fisheries Service (NMFS). Our living oceans: Habitat. Status of the habitat of U.S. living marine resources. Policymakers’ summary, 1st edition. U.S. Dep. Commer., NOAA Tech. Memo. NMFS-F/SPO-83, 32 p. May 2009. ONLINE. Available: http://spo.nwr.noaa.gov/TM83.pdf. National Oceanic and Atmospheric Administration (NOAA) Aquaculture Program, Aquaculture in the United States. February 2009. ONLINE. Available: http://aquaculture.noaa.gov/us/welcome.html National Oceanic and Atmospheric Administration (NOAA) Technical Report NOS CO-OPS 031, National Physical Oceanographic Real-Time Systems (PORTStm) Management Report. Silver Spring, Md. 2000 National Ocean Economics Program (NOEP). State of the U.S. Ocean and Coastal Economies 2009. ONLINE. Available: http://www.oceaneconomics.org/NationalReport/ [June 2009] Office of Ocean and Coastal Resource Management, Strategic Plan 2007-2012. ONLINE. Available: http://coastalmanagement.noaa.gov/resources/docs/ocrm_strategicplan.pdf Research and Innovative Technology Administration (RITA). 2009. Bureau of Transportation Statistics. Pocket Guide to Transportation. 2007. ONLINE. Available: http://www.bts.gov/publications/pocket_guide_to_transportation/2009/pdf/entire.pdf United Nations, United Nations Convention on the Law of the Sea, Publication No. E97.V10, United Nations, New York. 1997 United Nations Conference on Trade and Development (UNCTAD), Review of Maritime Transport 2006. Geneva. ONLINE. Available http://www.unctad.org/en/docs/rmt2006_en.pdf United Nations Conference on Trade and Development (UNCTAD), Review of Maritime Transport 2008. Geneva. ONLINE. Available: http://www.unctad.org/en/docs/rmt2008ch1_en.pdf U.S. International Trade Commission, Export Opportunities and Barriers in African Growth and Opportunity Act Eligible Countries, October 2005 U.S. Dept of Commerce International Trade Administration, U.S.-African Trade Profile, March 2006
TS 8I - Economic Benefits of Hydrography Brian Douglas Connon and Rod Nairn Economic Impact of Hydrigraphic Surveys FIG Congress 2010 Facing the Challenges – Building the Capacity Sydney, Australia, 11-16 April 2010
13/13
BIOGRAPHICAL NOTES CDR Connon currently serves as Expeditionary Warfare Program Manager for the Naval Meteorology and Oceanography Command and the Vice Chairman of the IHO’s Capacity Building Subcommittee. He holds a BS in Geography from the University of South Carolina, a MS in Meteorology and Physical Oceanography from the Naval Postgraduate School, and a MS in Hydrography from the University of Southern Mississippi. He is qualified as a Naval Hydrographer and a Surface Warfare Officer. His previous notable assignments include: Commanding Officer of the US Navy’s Fleet Survey Team and Staff Oceanographer for Carrier Strike Group Five. CDRE Nairn is the Hydrographer of Australia and Director General of Navy Hydrography, Meteorology and Oceanography. His naval career includes 4 sea commands and commissioning commander of the world’s first Laser Airborne Depth Sounder. He holds tertiary qualifications in Strategic Studies, Surveying and Management and is a graduate of the Australian Institute of Company Directors. He is a certified Level 1 Hydrographic Surveyor and currently chairs the Australasian Hydrographic Surveyors Certification Panel, the Ports Australia Port Surveyors Working Group, and the ICSM Permanent Committee on Tides and Mean Sea Level. CONTACTS CDR Brian CONNON Naval Meteorology and Oceanography Command 1100 Balch Blvd Stennis Space Center, MS USA Tel. +011 228 688 5222 Fax + 011 228 688 5232 Email:[email protected] CDRE Rod NAIRN Australian Hydrographic Office Locked Bag 8801 Wollongong NSW 2500 AUSTRALIA Email: [email protected]
FIG Congress 2010 Facing the Challenges – Building the Capacity Sydney, Australia, 11‐16 April 2010 1
ECONOMIC IMPACT OF HYDROGRAPHIC SURVEYS
Commodore Rod NAIRN, AUS Commander Brian CONNON, USA
FIG 2010
Hydrographic Surveys
• Hydrography is expensive and time-consuming – Return on investment is difficult to see – However, indirect benefits are estimated to be
on the order of $10 for every $1 • Often falls into category of “Public Good” • Hydrography enables all maritime activities
and supports protection of the environment
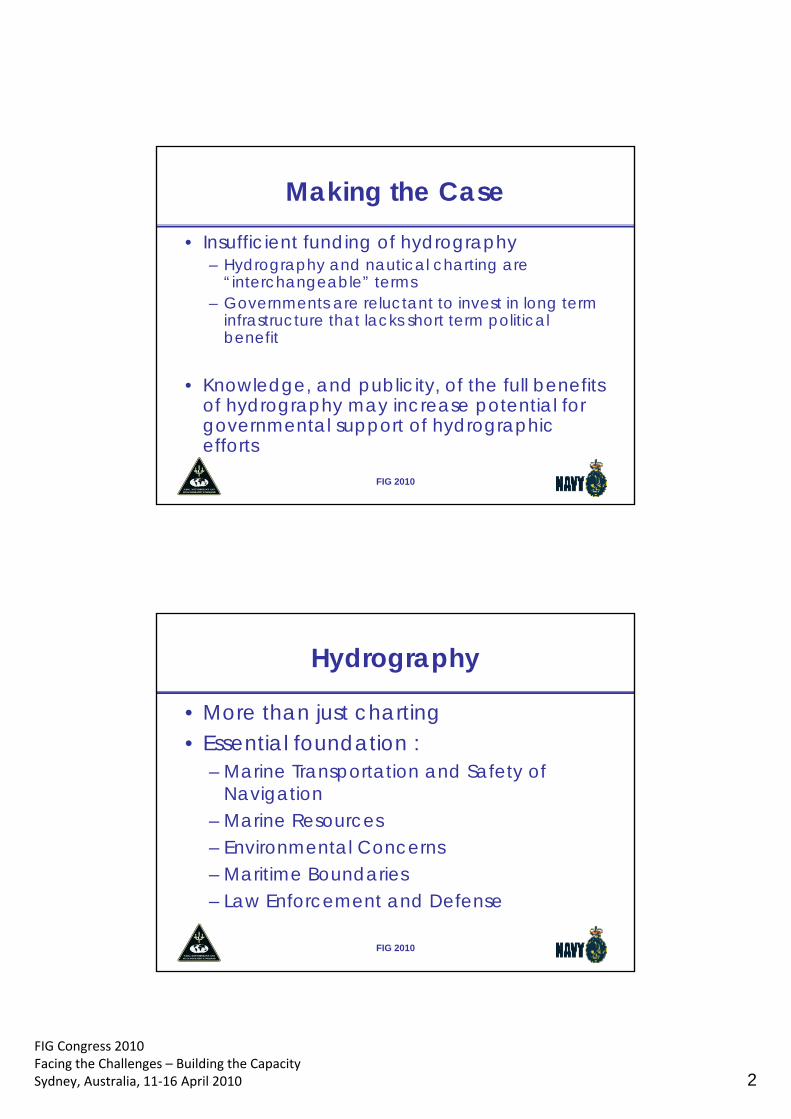
FIG Congress 2010 Facing the Challenges – Building the Capacity Sydney, Australia, 11‐16 April 2010 2
FIG 2010
Making the Case
• Insufficient funding of hydrography – Hydrography and nautical charting are
“interchangeable” terms – Governments are reluctant to invest in long term
infrastructure that lacks short term political benefit
• Knowledge, and publicity, of the full benefits
of hydrography may increase potential for governmental support of hydrographic efforts
FIG 2010
Hydrography
• More than just charting • Essential foundation :
– Marine Transportation and Safety of Navigation
– Marine Resources – Environmental Concerns – Maritime Boundaries – Law Enforcement and Defense
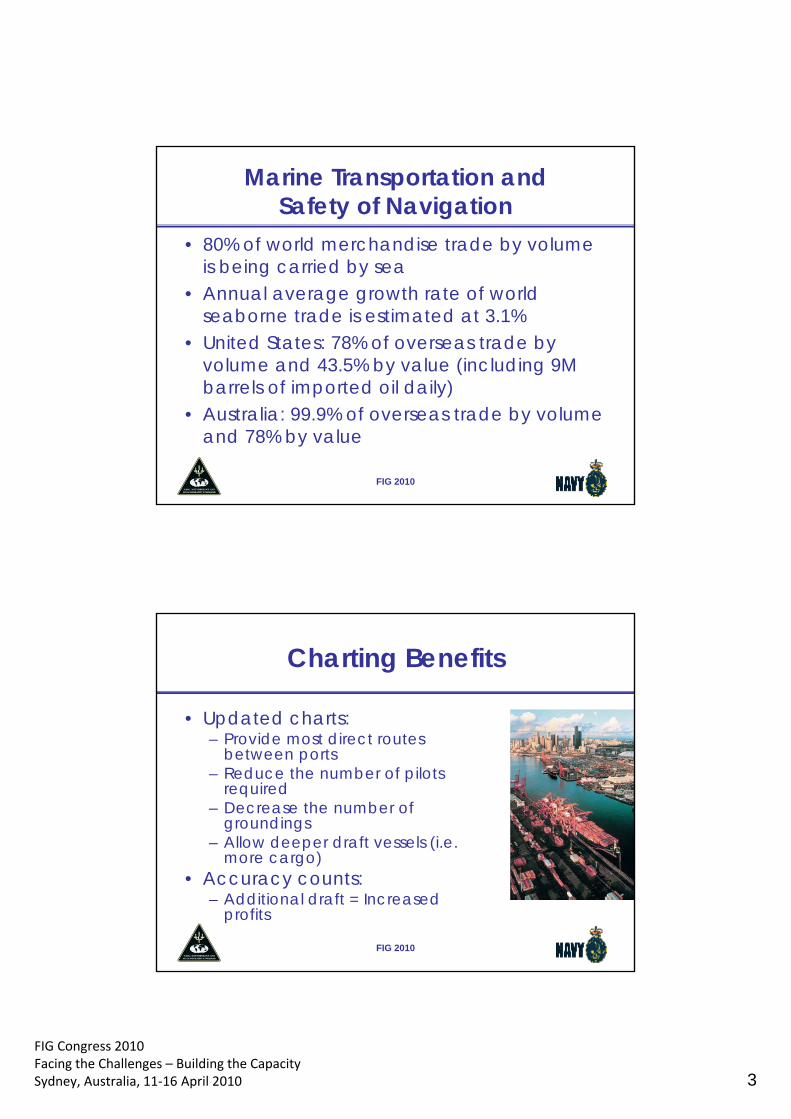
FIG Congress 2010 Facing the Challenges – Building the Capacity Sydney, Australia, 11‐16 April 2010 3
FIG 2010
Marine Transportation and Safety of Navigation
• 80% of world merchandise trade by volume is being carried by sea
• Annual average growth rate of world seaborne trade is estimated at 3.1%
• United States: 78% of overseas trade by volume and 43.5% by value (including 9M barrels of imported oil daily)
• Australia: 99.9% of overseas trade by volume and 78% by value
FIG 2010
Charting Benefits
• Updated charts: – Provide most direct routes
between ports – Reduce the number of pilots
required – Decrease the number of
groundings – Allow deeper draft vessels (i.e.
more cargo) • Accuracy counts:
– Additional draft = Increased profits
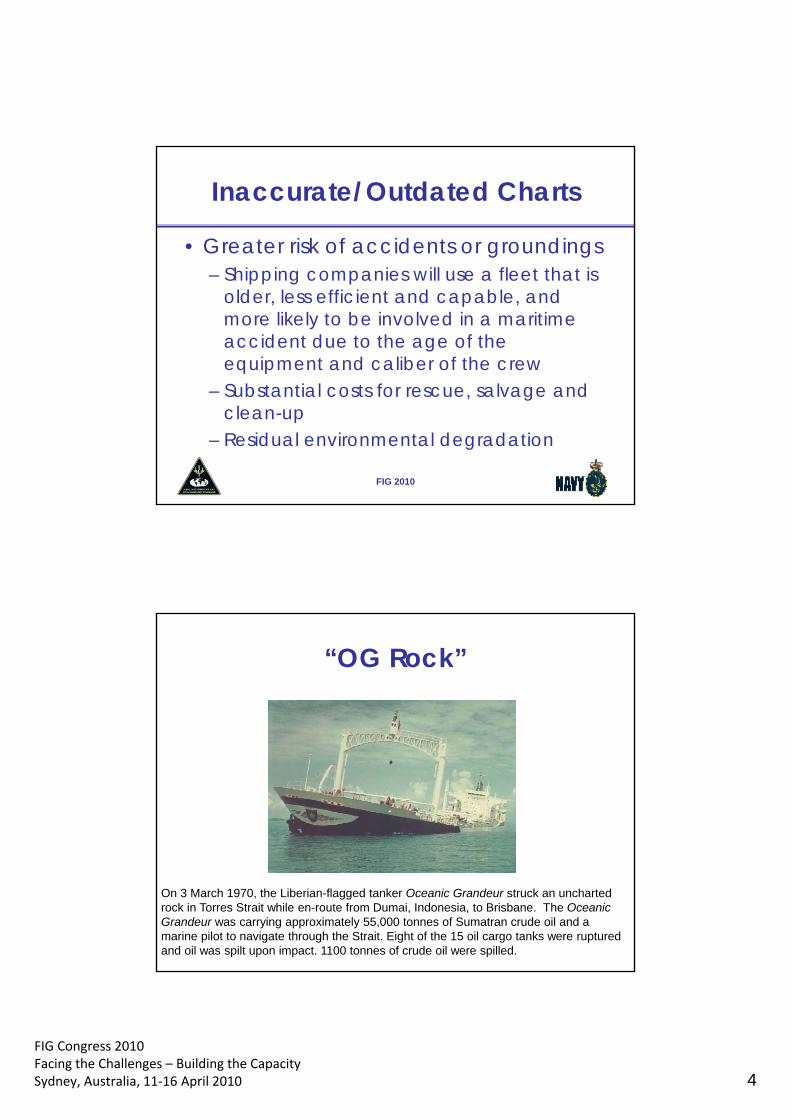
FIG Congress 2010 Facing the Challenges – Building the Capacity Sydney, Australia, 11‐16 April 2010 4
FIG 2010
Inaccurate/Outdated Charts
• Greater risk of accidents or groundings – Shipping companies will use a fleet that is
older, less efficient and capable, and more likely to be involved in a maritime accident due to the age of the equipment and caliber of the crew
– Substantial costs for rescue, salvage and clean-up
– Residual environmental degradation
“OG Rock”
On 3 March 1970, the Liberian-flagged tanker Oceanic Grandeur struck an uncharted rock in Torres Strait while en-route from Dumai, Indonesia, to Brisbane. The Oceanic Grandeur was carrying approximately 55,000 tonnes of Sumatran crude oil and a marine pilot to navigate through the Strait. Eight of the 15 oil cargo tanks were ruptured and oil was spilt upon impact. 1100 tonnes of crude oil were spilled.
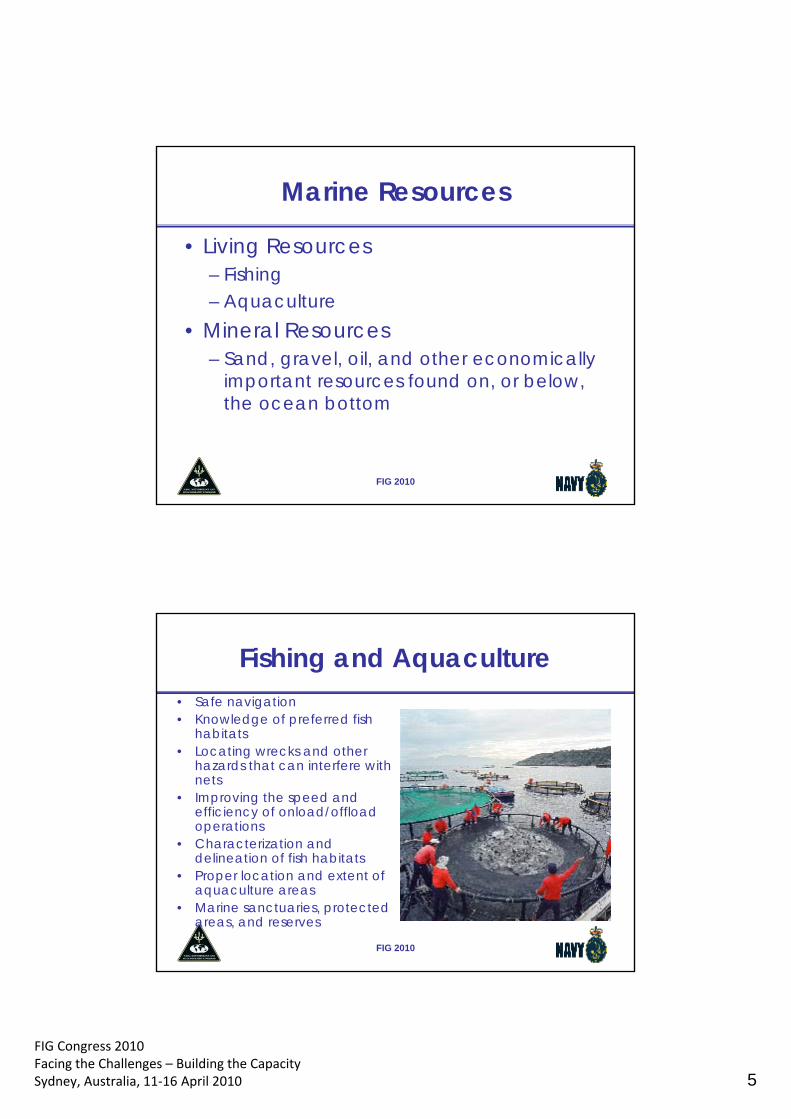
FIG Congress 2010 Facing the Challenges – Building the Capacity Sydney, Australia, 11‐16 April 2010 5
FIG 2010
Marine Resources
• Living Resources – Fishing – Aquaculture
• Mineral Resources – Sand, gravel, oil, and other economically
important resources found on, or below, the ocean bottom
FIG 2010
Fishing and Aquaculture • Safe navigation • Knowledge of preferred fish
habitats • Locating wrecks and other
hazards that can interfere with nets
• Improving the speed and efficiency of onload/offload operations
• Characterization and delineation of fish habitats
• Proper location and extent of aquaculture areas
• Marine sanctuaries, protected areas, and reserves
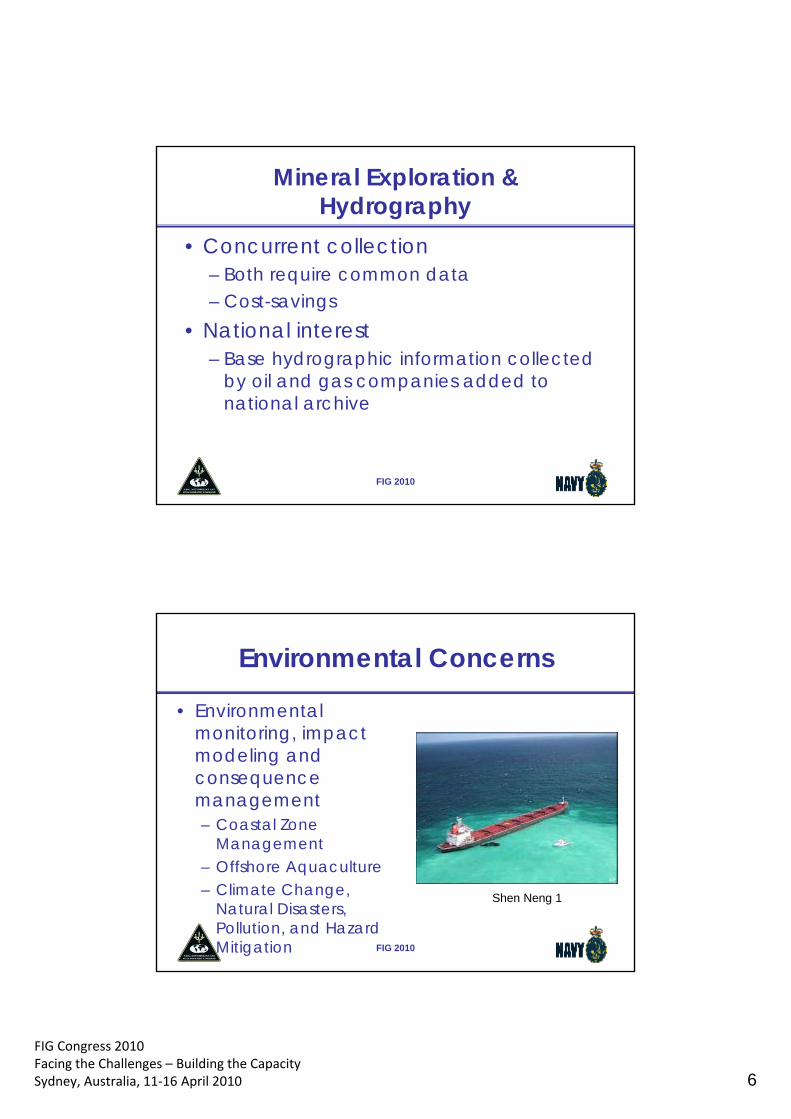
FIG Congress 2010 Facing the Challenges – Building the Capacity Sydney, Australia, 11‐16 April 2010 6
FIG 2010
Mineral Exploration & Hydrography
• Concurrent collection – Both require common data – Cost-savings
• National interest – Base hydrographic information collected
by oil and gas companies added to national archive
FIG 2010
Environmental Concerns
• Environmental monitoring, impact modeling and consequence management – Coastal Zone
Management – Offshore Aquaculture – Climate Change,
Natural Disasters, Pollution, and Hazard Mitigation
Shen Neng 1

FIG Congress 2010 Facing the Challenges – Building the Capacity Sydney, Australia, 11‐16 April 2010 7
FIG 2010
Coastal Zone Management
• Hydrography provides information essential to proper planning – Ensures coastal zones are effectively and
sustainably managed. • Competing Interests:
– Recreational and commercial fishing, diving, pleasure yachting, navigation, beach access, tourism activities, and marine farming.
– Archaeological studies, underwater construction and development, pipelines, telecommunication cables, and offshore drilling platforms
FIG 2010
Offshore Aquaculture
• Accurate hydrographic information can provide assistance in the selection of appropriate aquaculture sites – Planning of offshore aquaculture zones
takes into account not only hydrological and biographical factors, but also topographical and hydrographical factors
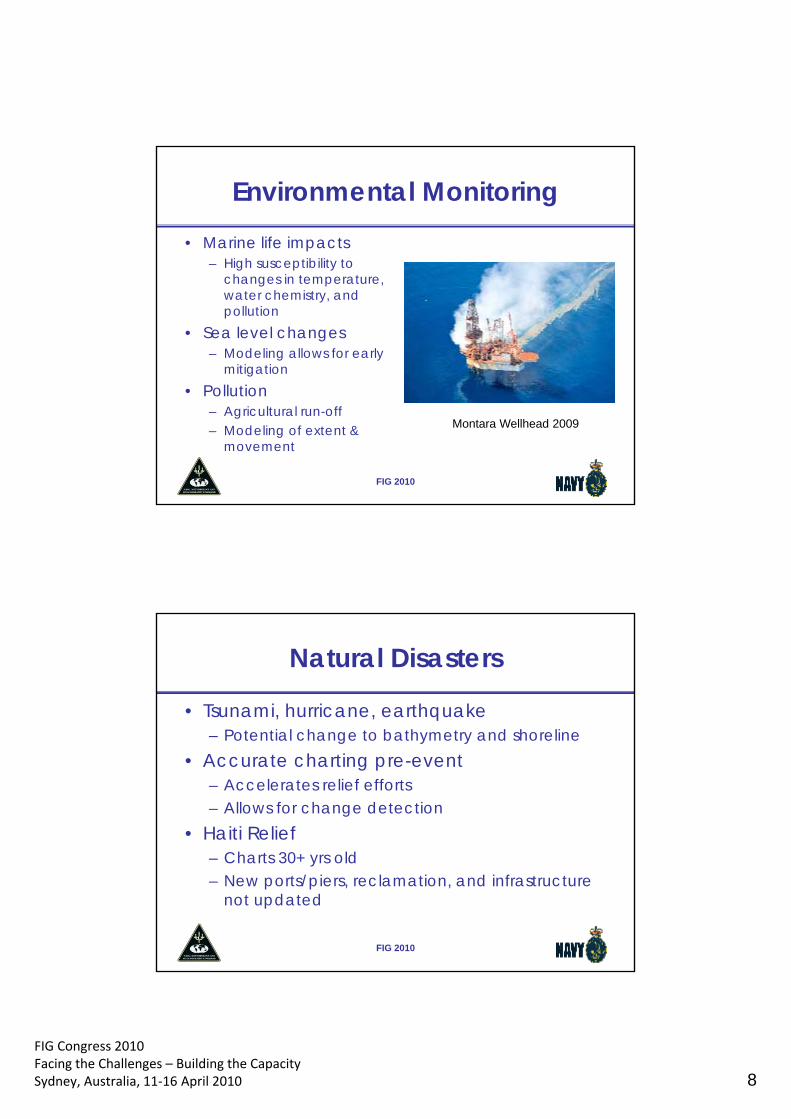
FIG Congress 2010 Facing the Challenges – Building the Capacity Sydney, Australia, 11‐16 April 2010 8
FIG 2010
Environmental Monitoring • Marine life impacts
– High susceptibility to changes in temperature, water chemistry, and pollution
• Sea level changes – Modeling allows for early
mitigation • Pollution
– Agricultural run-off – Modeling of extent &
movement
Montara Wellhead 2009
FIG 2010
Natural Disasters
• Tsunami, hurricane, earthquake – Potential change to bathymetry and shoreline
• Accurate charting pre-event – Accelerates relief efforts – Allows for change detection
• Haiti Relief – Charts 30+ yrs old – New ports/piers, reclamation, and infrastructure
not updated
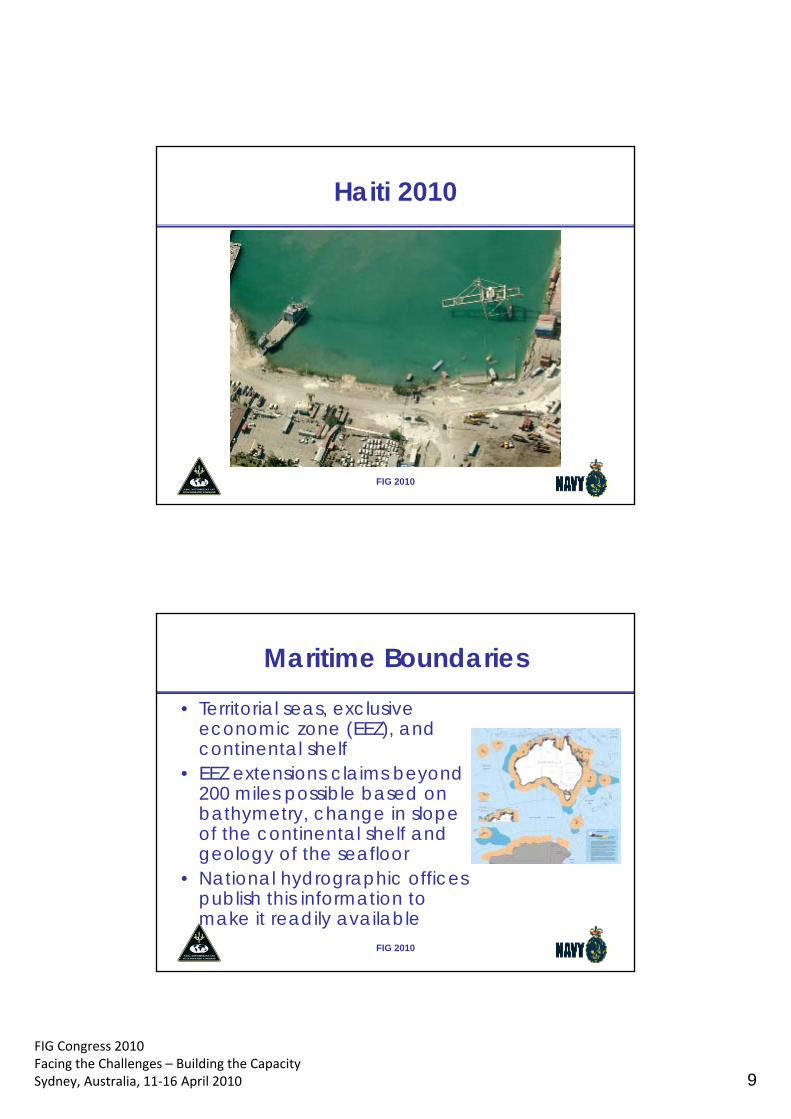
FIG Congress 2010 Facing the Challenges – Building the Capacity Sydney, Australia, 11‐16 April 2010 9
FIG 2010
Haiti 2010
FIG 2010
Maritime Boundaries
• Territorial seas, exclusive economic zone (EEZ), and continental shelf
• EEZ extensions claims beyond 200 miles possible based on bathymetry, change in slope of the continental shelf and geology of the seafloor
• National hydrographic offices publish this information to make it readily available
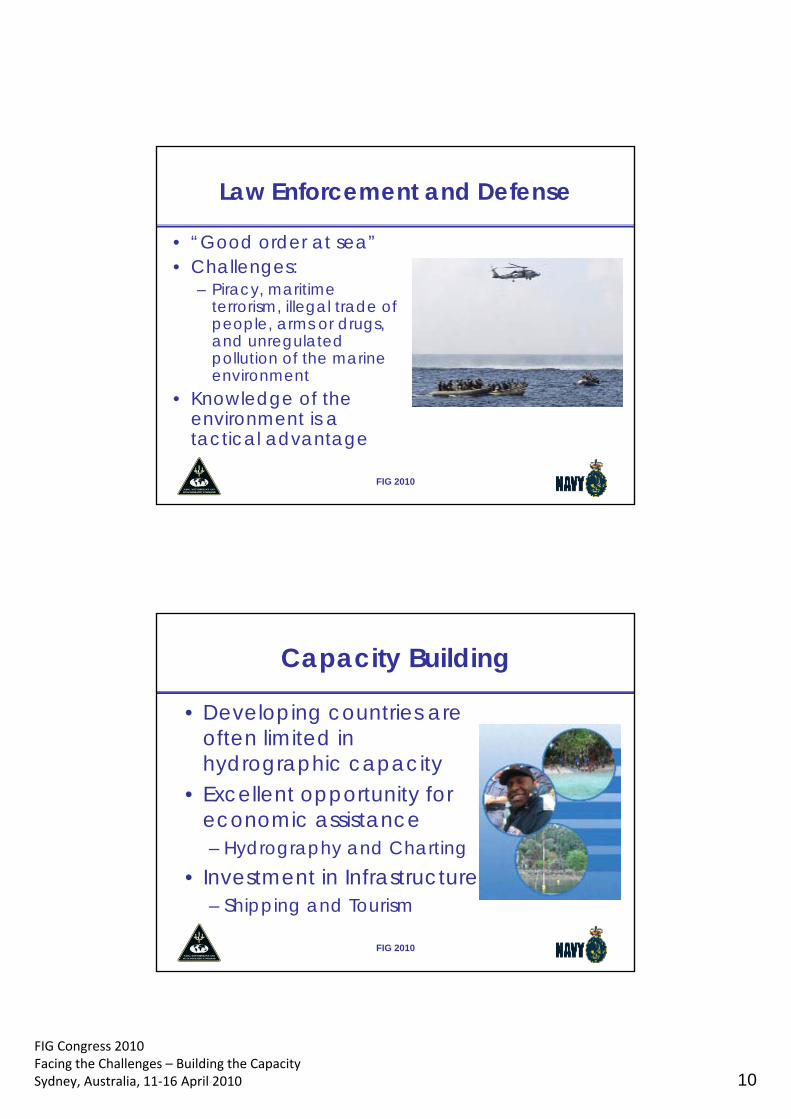
FIG Congress 2010 Facing the Challenges – Building the Capacity Sydney, Australia, 11‐16 April 2010 10
FIG 2010
Law Enforcement and Defense
• “Good order at sea” • Challenges:
– Piracy, maritime terrorism, illegal trade of people, arms or drugs, and unregulated pollution of the marine environment
• Knowledge of the environment is a tactical advantage
FIG 2010
Capacity Building
• Developing countries are often limited in hydrographic capacity
• Excellent opportunity for economic assistance – Hydrography and Charting
• Investment in Infrastructure – Shipping and Tourism

FIG Congress 2010 Facing the Challenges – Building the Capacity Sydney, Australia, 11‐16 April 2010 11
FIG 2010
Conclusion
• Hydrography is often a low priority for funding – Improved knowledge of the additional uses of
hydrography may influence further investment • Potential for regional support and
cooperation • Ultimate Goal
– National governments recognize the value and importance of hydrographic information
Questions
FIG 2010
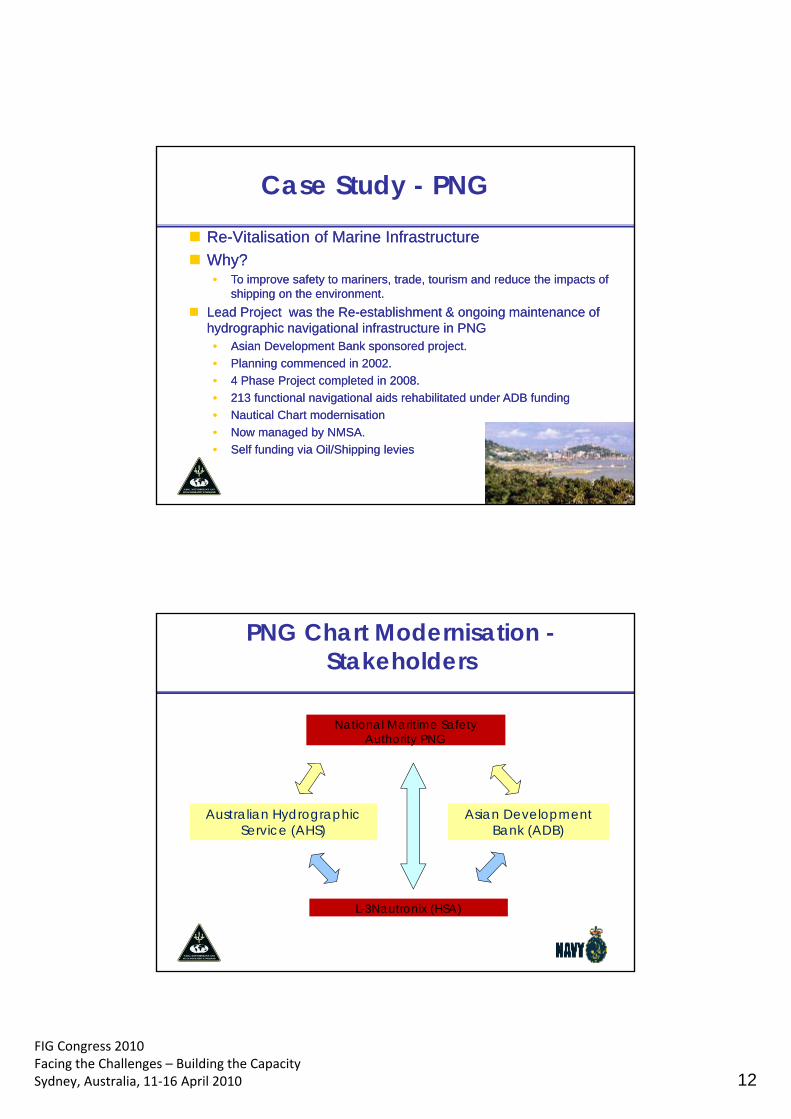
FIG Congress 2010 Facing the Challenges – Building the Capacity Sydney, Australia, 11‐16 April 2010 12
Case Study - PNG
Re-Vitalisation of Marine Infrastructure
Why? • To improve safety to mariners, trade, tourism and reduce the impacts of
shipping on the environment.
Lead Project was the Re-establishment & ongoing maintenance of hydrographic navigational infrastructure in PNG • Asian Development Bank sponsored project.
• Planning commenced in 2002.
• 4 Phase Project completed in 2008.
• 213 functional navigational aids rehabilitated under ADB funding
• Nautical Chart modernisation
• Now managed by NMSA.
• Self funding via Oil/Shipping levies
PNG Chart Modernisation - Stakeholders
National Maritime Safety Authority PNG
Australian Hydrographic Service (AHS)
L-3Nautronix (HSA)
Asian Development Bank (ADB)
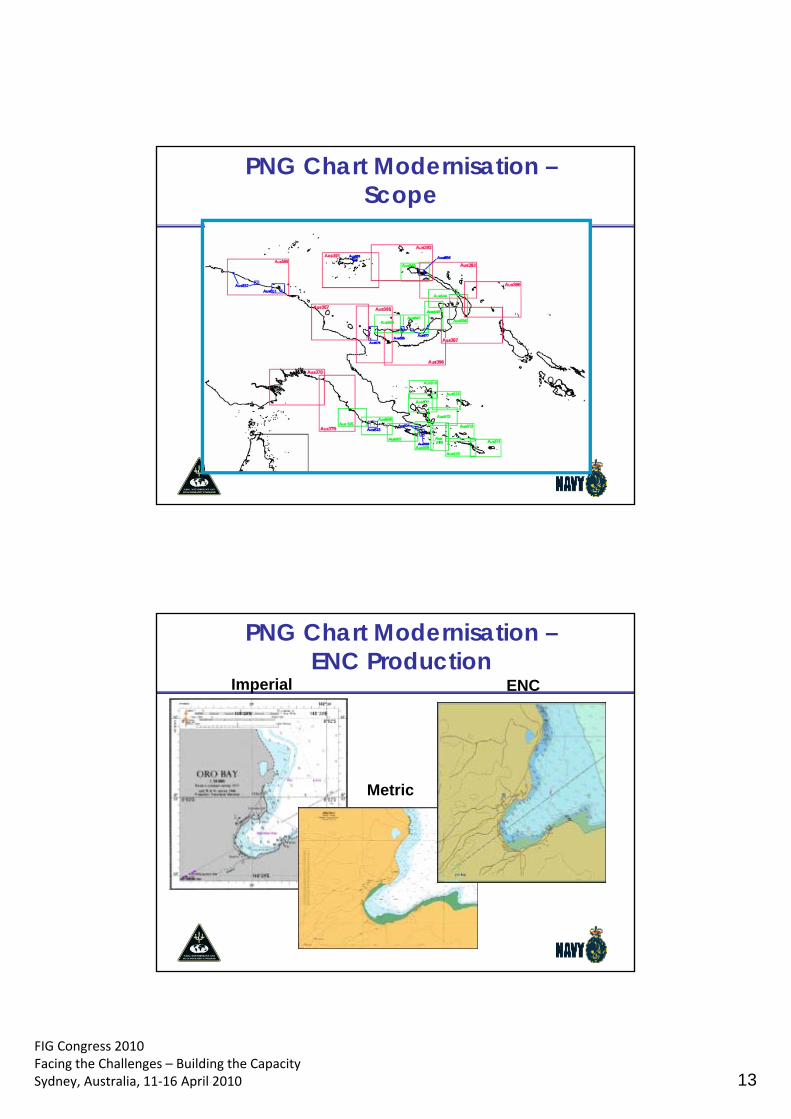
FIG Congress 2010 Facing the Challenges – Building the Capacity Sydney, Australia, 11‐16 April 2010 13
PNG Chart Modernisation – Scope
Imperial
Metric
ENC
ENC
PNG Chart Modernisation – ENC Production
FIG Congress 2010 Facing the Challenges – Building the Capacity Sydney, Australia, 11‐16 April 2010 14
Provision of a modern hydrographic paper chart & ENC
portfolio.
• IHO S57 data sets for 17 existing S57 datasets (remediated and updated)
• Digital repromat for 39 new metric paper charts
• IHO S57 data sets for 39 new ENC’s
• Full ENC, Raster Chart and metric paper chart coverage
Provision of a modern hydrographic paper chart & ENC
portfolio.
• IHO S57 data sets for 17 existing S57 datasets (remediated and updated)
• Digital repromat for 39 new metric paper charts
• IHO S57 data sets for 39 new ENC’s
• Full ENC, Raster Chart and metric paper chart coverage
PNG Chart Modernisation – Outcomes
– Governance
• NMSA was established by parliament. • NMSA took over the marine regulatory & operational functions of the Dept of
Transport & Civil Aviation.
– Maritime Safety Information • Fully functioning & effective network of maritime navigational aids • Availability of high-quality, up-to-date navigational charts • All vessels to meet safety standards required by PNG & IMO • Seafarer competency • Coordinate responses to distress calls.
– Hydrographic Survey Capability • Training of personnel • Basic survey capability established
– Additional Training • MSI i.e. radio operators, nav. aids maintenance • AIS/LRIT (web enabled)
– Vessel Monitoring Capability • Establishment of a national AIS/LRIT infrastructure
– Establishment of SAR & Oil Spill Response capability
PNG Chart Modernisation – Other Components
FIG Congress 2010 Facing the Challenges – Building the Capacity Sydney, Australia, 11‐16 April 2010 15
Improved quality of hydrography and
charting which supports the safety of navigation, maritime trade and contributes to the protection of the marine environment.
Shorter Safer Routes • Vessels save time and fuel. • Reduced marine accident rate. • Improved access/trading routes.
Increased Economic Activity • Nav aids & charts enable more people to fish and travel • Increased economic activity is supported by a lively interisland shipping sector.
Sustainability • The NMSA is self funding. • Communities are being paid to maintain light houses & safeguard them from
vandalism. • Charts and ENCs are being maintained by the AHS with information supplied by
NMSA.
PNG Chart Modernisation - Benefits