economic impact analysis: the bayer biopharmaceutical
TRANSCRIPT

April 2021
Economic Impact Analysis: The Bayer Biopharmaceutical Campus in Berkeley

About the InstituteSince 1990, the Bay Area Council Economic Institute has been a leading think tank focused on the economic and policy issues facing the San Francisco/Silicon Valley Bay Area, one of the most dynamic regions in the United States and the world’s leading center for technology and innovation. A valued forum for stakeholder engagement and a respected source of information and fact-based analysis, the Institute is a trusted partner and adviser to both business leaders and government officials. Through its economic and policy research and its many partnerships, the Institute addresses major factors impacting the competitiveness, economic development, and quality of life of the region and the state, including infrastructure, globalization, science and technology, and health policy. It is guided by a Board of Trustees drawn from influential leaders in the corporate, academic, non-profit, and government sectors.
The Institute is housed at and supported by the Bay Area Council, a public policy organization that includes hundreds of the region’s largest employers and is committed to keeping the Bay Area the world’s most competitive economy and best place to live. The Institute also supports and manages the Bay Area Science and Innovation Consortium (BASIC), a partnership of Northern California’s leading scientific research laboratories and thinkers.
About this ReportThis report explores how the Bayer biopharmaceutical campus in Berkeley plays an important role in generating economic activity for the City of Berkeley, the East Bay region (Alameda and Contra Costa counties), and the nine-county San Francisco Bay Area. Primarily using data for calendar years 2019 and 2020 provided by Bayer, this report analyzes the annual average economic impact produced by Bayer’s employment and wages, contingent labor, suppliers and vendors, and capital expenditures. In order to evaluate its future economic impacts on these three geographies related to the proposed 30-year Development Agreement with the City of Berkeley to transform its campus by 2052, this report will also estimate Bayer’s forward-looking economic impacts over the next 30 years and compare them to the current state.
Acknowledgments
This report was prepared by the Bay Area Council Economic Institute with support from Bayer.
This report was authored by:
Jeff Bellisario, Executive Director
Isabel Monteleone, Research Analyst
Bay Area Council Economic InstituteSan Francisco, CA
www.bayareaeconomy.org
@bayareaeconomy

ContentsExecutive Summary .............................................................................. 4
Introduction: The Life Sciences Sector and Economic Impact
Bayer in Berkeley ..................................................................................... 6
Methodology: Defining and Measuring Economic Impact ................ 7
The Importance of Manufacturing ........................................................ 9
Chapter 1: Looking Back at the Bayer Economic Impact on the City of Berkeley
Summary Findings ................................................................................. 11
Chapter 2: Looking Back at the Bayer Economic Impact on the East Bay
Summary Findings ................................................................................. 14
Chapter 3: Looking Back at the Bayer Economic Impact on the San Francisco Bay Area
Summary Findings ................................................................................. 17
Chapter 4: Projecting Forward - Bayer’s Future Economic Impact
Summary Findings ................................................................................. 21
Employee and Construction Future Impacts at Full Buildout ............ 22

4
Bay Area Council Economic Institute
Executive SummaryThriving local and regional economies can generally point to their anchor institutions—including universities, hospitals, or large private sector employers—as reasons for their success. In Berkeley, a large public university anchors the economy, while another globally significant entity is creating its own economic impacts on the west side of town.
Bayer, a global life sciences company with a large pharmaceuticals division, is one of Berkeley’s and the Bay Area’s major economic contributors. With a long-standing presence in Berkeley through its biopharmaceutical center where it develops and manufactures medicines for hemophilia, Bayer creates employment opportunities at all income levels.
Bayer’s presence in Berkeley has benefited from a long-standing development agreement with the city, and a renewed agreement would facilitate Bayer’s future development plans over the next 30 years. These expansion plans would result in an increase in employment and new construction at the Berkeley site.
The analysis that follows looks at Bayer’s current contributions to the surrounding region. It also projects forward to provide insight on the economic implications of extending the Bayer Development Agreement with the City of Berkeley over the next 30 years.
Bayer’s Current and Future Economic ImpactsBayer’s economic impact on the City of Berkeley, the East Bay (Alameda and Contra Costa counties combined), and the nine-county San Francisco Bay Area is analyzed using Bayer data on employment and wages, contingent labor force, supplier and vendor spending, and capital expenditures. All data presented herein represents an annual impact. Data points were collected from 2019 and 2020, when available. Numbers are averaged when both years of data were used.
Looking out to 2052 (when Bayer assumes full buildout of its new campus), Bayer’s economic impacts would
benefit from an increased employee headcount and the construction required to expand its campus. By 2052, Bayer projects 2,000 employees total at the Berkeley campus (a 2x increase from current levels), while 900,000 square feet of new facility construction and potentially 779,500 square feet in parking structure construction would take place over 30 years under an extended development agreement.
City of Berkeley ImpactsHome to Bayer’s biopharmaceutical center, Berkeley benefits directly from the presence of Bayer, which is the city’s largest private sector business employer. Economic impacts for Berkeley include:
■ The campus employed an annual average of 1,024people over 2019 and 2020, with an average of 56employees residing in Berkeley.
■ Multiplier effects (e.g., employee spending, supplierand vendor expenditures) support an additional51 full-time equivalent jobs in Berkeley. For every10 Bayer employees that reside in Berkeley, anadditional nine jobs are supported within the city.
■ Bayer’s direct spending in Berkeley totals $8.0million annually. These dollars include employeeand contingent labor wages paid to Berkeleyresidents, and expenses for suppliers and vendorsand capital expenditures at a Berkeley-basedcompany.
■ When including the value of every transactionstemming from an original Bayer expenditure, Bayercreates an annual economic impact of $14.8 millionin Berkeley.
■ Projecting to 2052: Bayer’s proposed expansionwould support 204 jobs annually in the City ofBerkeley, compared to 107 jobs currently.
■ Projecting to 2052: Bayer would have a $29.1million annual economic impact on Berkeley by2052 (in 2020 dollars), an increase of 96.8% over thecurrent annual impact.

55
Economic Impact Analysis: The Bayer Biopharmaceutical Campus in Berkeley
East Bay ImpactsWhile Bayer’s biopharmaceutical campus is based in Alameda County, Contra Costa County also serves as an important part of the labor shed, and both counties capture significant benefits from Bayer’s presence. Economic impacts to the East Bay include:
■ On average over the two-year period from 2019 to 2020, 715 of Bayer’s 1,024 employees lived within the East Bay (69.8% of the total).
■ When including multiplier effects and Bayer’s other spending categories, Bayer currently supports a total of 1,547 jobs in the East Bay. For every 10 Bayer employees that are East Bay residents, another 12 jobs are supported across Alameda and Contra Costa counties.
■ Bayer spends $110.0 million annually on direct expenditures into the East Bay, including wages, suppliers and vendors, and capital expenditures.
■ When including multiplier effects and the direct expenditures, Bayer creates $222.5 million in annual economic impacts for the East Bay.
■ Projecting to 2052: Bayer’s expansion would support 2,811 jobs annually in the East Bay, compared to 1,547 jobs currently.
■ Projecting to 2052: In 2020 dollars, Bayer would have a $422.0 million annual economic impact on the East Bay by 2052, an increase of 87.7% over the current annual impact.
San Francisco Bay Area ImpactsBayer is a key contributor to the region’s cluster of growing life sciences companies, and its impacts reach broadly across the Bay Area. Regional impacts include:
■ Bayer’s presence supports 2,221 full-time equivalent jobs across the nine counties when including Bayer’s own employment, the impacts of spent wages, and the company’s regional expenditures. For every 10 Bayer workers employed by the Berkeley campus, another 12 jobs are supported across the Bay Area.
■ Bayer spends $180.7 million annually within the nine-county region. Two-thirds of this spending is tied directly to wages.
■ Overall Bay Area economic impacts related to Bayer’s presence in Berkeley total $353.2 million annually when accounting for all transactions linked back to the original Bayer expenditures.
■ Projecting to 2052: Construction over 30 years would support 1,698 full-time equivalent job-years.
■ Projecting to 2052: Bayer’s expansion would support 3,816 jobs annually in the Bay Area, compared to 2,221 jobs supported currently.
■ Projecting to 2052: In 2020 dollars, Bayer would have a $613.1 million annual economic impact on the Bay Area by 2052, an increase of 73.6% over the current annual impact.

6
Bay Area Council Economic Institute United Airlines
Introduction The Life Sciences Sector and Economic Impact
The Bay Area’s innovation ecosystem is the envy of economies around the globe, and it has been the driver of strong employment and wage growth in the region over the last decade. Included in this ecosystem are sector clusters that have produced new ideas, new products, new companies, and a tremendous amount of economic value for the region. One of the region’s most prominent clusters is in life sciences. It is comprised of pharmaceutical, biotechnology, medical device, diagnostic companies, and health-related research and development. Together, these companies provide jobs across a range of occupations, including scientists, quality control technicians, and distribution workers.
According to the 2019 California Life Sciences Industry Report,1 there were 3,418 life sciences companies in California in 2018—up from 3,249 in 2017. Of the 311,226 individuals employed in life sciences companies in California in 2017, 27% were employed in the Bay Area—making the Bay Area the largest employment hub for life sciences in the state.
With its extensive Berkeley campus, Bayer represents a core part of the life sciences cluster in the region. Bayer has more than 150 years of history as a company and is known for its innovation in health care and agriculture. Globally, it has more than 100,000 employees, of which approximately 20,000 are based in North America.
Bayer in BerkeleyBayer (operating as Miles Labs at the time) purchased its first Berkeley property in 1974. Today the campus covers 46 acres and employs 1,000+ people with varying ethnic and educational backgrounds: 40% of Bayer’s workforce identifies as Asian, 12% as Latinx, and 9% as Black; the campus has more than 80 employees with PhDs and 600 employees with educational attainment ranging from high school diplomas to associate’s degrees.
Employees of the Berkeley campus are focused primarily on developing and manufacturing hematology drugs in addition to developing medicines for patients with cancer and cardiovascular diseases. As of January 2021, three treatments for hemophilia A that have been manufactured in Berkeley are distributed worldwide from the site, and the team also supports the development of a new gene therapy for the treatment of hemophilia A.
In addition to making essential medicines, the company has an economic impact on Berkeley, the East Bay (Alameda County and Contra Costa County), and the nine-county region that will be studied within this report. These impacts come in the form of company spending on employment, vendors, contingent labor, and capital investment projects.

7
Economic Impact Analysis: The Bayer Biopharmaceutical Campus in Berkeley
Bayer’s success in Berkeley has been facilitated by its 30-year Development Agreement with the city, which was signed in 1992. Bayer has applied to extend this agreement as it looks to transform its operations in the city—ultimately bringing new jobs, biomanufacturing insights, and new medicines for patients across a variety of disease states. The analysis that follows seeks to better understand how Bayer creates economic value for Berkeley and the surrounding region, looking at current impacts and forward at the economic impacts of the plans outlined in an extended development agreement.
This analysis models the economic impact of Bayer’s biopharmaceutical campus on the City of Berkeley, the East Bay (Alameda and Contra Costa counties), and the nine-county San Francisco Bay Area region, with the focus being on the dollars flowing from Bayer into each geography. This report addresses only the Bayer site in Berkeley and does not include in scope any other Bayer sites in California.
This report also illustrates other ways in which Bayer contributes to its surrounding geography, such as taxes paid at the local, state, and federal levels, and the community involvement of the company and its employees. While not factored into the modeling analysis, these two pieces contribute to the company’s overall economic impact on the city and region.
Lastly, this report presents a forward-looking projection of Bayer’s economic impact on the three geographies based on the proposed 30-year extension of the development agreement between Bayer and Berkeley.
Methodology: Defining and Measuring Economic Impact
We draw high-level conclusions from 2019 full-year data provided by several Bayer departments; data from 2020 is also used where available and annual averages are created across the two years. The forward-looking analysis was produced using projected employment and construction data also provided by Bayer. To create a conservative estimate, the forward-looking analysis holds the contingent labor and supplier and vendor impacts constant (with the assumption being that these numbers will remain stable during Bayer’s expansion, but they will be difficult to project forward).
Economic impact is typically measured through an input-output model that uses national transaction and labor force data and measures relationships among industries, suppliers, and customers. To arrive at an economic impact, this report uses an industry-standard economic modeling tool called IMPLAN.
Specifically, IMPLAN utilizes data from the U.S. Bureau of Economic Analysis’ Input-Output Benchmarks, which allows for analysis of how industries and investments affect the economy. IMPLAN does this by tracking each dollar spent in a given industry and its ripple of economic effects until it leaves a given geography. Economic indicators in IMPLAN are discussed and defined as such:
■ Employment: This measure is presented in full-time equivalent jobs supported. As an example, two 20-hour per week jobs for an entire year equal one job supported;
■ Income: This measure is the total sum of wages paid during the defined period of time;
■ Value Added: This measure captures the value-added of final goods and services delivered as a result of the initial activity. Value added refers to the difference in value between the products and services at each stage of production, subtracting the initial labor and capital costs. Additionally, value added is an equivalent measure to gross domestic product (GDP) in a given period. Value added impacts do occur from Bayer in Berkeley based on the company’s overall sales of its products. However, because these transactions primarily have an economic impact on a global scale and these dollars do not flow into the three geographies focused on in this report, they have been omitted from the impact discussions; and
■ Economic Output: The measure of total economic activity related to the initial activity, reflecting the total spending by firms, organizations, and households that is made possible by the initial input. Different from value-added, economic output captures all transactions no matter how the dollar is being spent.

88
Bay Area Council Economic Institute
IMPLAN categorizes economic impact in three ways:
■ Direct: Captures the original expenditure—examples include Bayer’s wages paid to employees and contingent workers;
■ Indirect: Encompasses spending that is related to the provision of the original expenditure, such expenditures on suppliers or vendors; and
■ Induced: Originates from the wages supported by the direct expenditure, such as spending that occurs via Bayer’s employees and contingent labor force.
Economic impacts created by Bayer can be divided into four categories. Data for each category are analyzed for full year 2019 unless otherwise noted:
1. Employment and Earnings: Employment and earnings are key inputs into understanding a company’s contribution to economic activity. Employment is measured by the total number of employees (full-time and part-time) that work for Bayer in Berkeley. Earnings include the total salaries for all employees that work for Bayer in Berkeley, excluding benefits and other forms of compensation. Data on employment and earnings are for full year 2019 with data for Bayer’s employee headcount including numbers up to September 2020.
2. Contingent Labor: Contingent labor refers to contractors, consultants, and other individuals that Bayer may hire on a part-time or contract basis. Contingent labor impacts are measured by the total number of individuals in the contingent labor force and their respective wages. These numbers include individuals that may work equivalently to full-time employee hours, while also including workers that may have worked for Bayer on a singular basis or short period of time.
3. Supplier and Vendor Impacts: Expenses related to Bayer’s suppliers and vendors at the Berkeley campus allow it to operate efficiently and are additive to the economy. Given Bayer is a global operation and the City of Berkeley and surrounding region is one of many geographies within which Bayer operates, a significant portion of Bayer’s overall supplier and vendor spending occurs outside of these
geographies. Additionally, as a life sciences company, Bayer’s business needs require the global sourcing of materials that are not entirely found at the local level (Berkeley’s major industries include Trade, Transportation, and Utilities and Professional and Business Services, but only 10% of Alameda County’s workforce was employed in Manufacturing in 2019). Still, supplier and vendor spending in the city and surrounding region creates an economic benefit. Examples of supplier and vendor industries that Bayer uses include Manufacturing, Wholesale and Retail Trade, and Transportation and Warehousing. Data points in this category include both 2019 and 2020 figures, and thus are averaged over the two years.
4. Capital Expenditure Impacts: Capital expenditure impacts can be defined as expenses related to the maintenance, repair, and construction of Bayer’s facilities and equipment. Examples of this include the construction of HVAC systems and grounds improvements, as well as the purchase of manufacturing, lab, and R&D equipment.
The tables in this report reflect the economic impacts that the Bayer biopharmaceutical campus in Berkeley has on the City of Berkeley, East Bay, and Bay Area. All numbers are rounded and refer to annual impacts unless otherwise stated.
Other contributions and impacts to economic activity studied within this report include:
■ Taxes: While not included in the modeling itself, payroll, property, sales, and use taxes reflect Bayer’s local and federal contributions to the economy as these taxes help to fund projects and programs at the national, state, and local levels; and
■ Community Engagement: Additionally, Bayer’s contributions through community engagement can also help drive economic activity. This includes philanthropic donations and charitable contributions to local organizations, employee volunteer hours, and community benefits.

99
Economic Impact Analysis: The Bayer Biopharmaceutical Campus in Berkeley
The Importance of Manufacturing
At its core, the Bayer biopharmaceutical campus is a manufacturing facility. Manufacturing is a crucial component of a diversified economy, as it supports jobs across the wage spectrum. Bayer’s Berkeley campus employs people ranging from scientists to quality control technicians to warehouse staff.
The manufacturing sector has not been immune to job loss during the COVID-19 pandemic, but it has been relatively resilient. Between December 2019 and December 2020, the East Bay (Oakland-Hayward-Berkeley metropolitan area) saw a 2.3% loss in manufacturing employment. Bayer’s hiring trend, however, has moved in the opposite direction, as it increased employment between 2019 and 2020.
As a fundamental component of the region’s economy, manufacturing will be key for the region’s recovery. The jobs that Bayer provides now and into the future are critical in creating economic opportunities at multiple wage levels.
Sector Dec. 19 Dec. 20 COVID Effect % Gain/Loss
Leisure and Hospitality 121,900 74,100 -47,800 -39.2%
Other Services 40,700 30,800 -9,900 -24.3%
Information 27,700 25,200 -2,500 -9.0%
Government 176,000 163,500 -12,500 -7.1%
Financial Activities 55,700 52,000 -3,700 -6.6%
Professional and Business Services 197,800 184,900 -12,900 -6.5%
Trade, Transportation and Utilities 208,000 196,900 -11,100 -5.3%
Educational and Health Services 200,700 192,300 -8,400 -4.2%
Construction 75,200 72,500 -2,700 -3.6%
Manufacturing 101,900 99,600 -2,300 -2.3%
Total Non-Farm Employment 1,205,900 1,092,000 -113,900 -9.4%Source: U.S. Bureau of Labor Statistics (Not seasonally adjusted)
Oakland-Hayward-Berkeley Metropolitan Area Job Trends by Sector
Analysis: Bay Area Council Economic Institute
Source: BayerAnalysis: Bay Area Council Economic Institute

1010
Bay Area Council Economic Institute
Industry Group Indirect Jobs* Induced Jobs** Multiplier Effect
Utilities 5.15 4.42 9.58
Real estate and rental leasing 3.97 4.83 8.80
Durable manufacturing 2.89 4.55 7.44
Information 2.52 3.21 5.73
Nondurable manufacturing 1.85 3.30 5.14
Professional, scientific, and technical services 1.42 2.76 4.18
Management of companies 1.44 2.55 4.00
Mining 2.24 1.66 3.90
Arts, entertainment, and recreation 1.23 2.55 3.79
Finance and insurance 1.50 2.15 3.64
Transportation and warehousing 1.13 1.63 2.76
Wholesale trade 1.07 1.28 2.35
Agriculture, forest, fishing, and hunting 0.94 1.35 2.29
Construction 0.88 1.38 2.26
Other services (except public administration) 0.71 1.40 2.10
Health care and social assistance 0.69 1.36 2.06
Educational services 0.64 1.30 1.94
Accommodation and food services 0.54 1.07 1.61
Administrative and support services and waste management 0.46 0.89 1.35
Retail trade 0.47 0.75 1.22Source: EPI analysis of data from the Bureau of Labor Statistics (BLS) Employment Requirements Matrices, the BLS Current Employment Statistics program, and the Bureau of Economic Analysis GDP-by-industry accountsAnalysis: Bay Area Council Economic Institute
Industry-Specific National Employment Multipliers per Job
* Includes materials and services supplier jobs** Includes jobs supported by re-spending of income from direct jobs and supplier jobs
Manufacturing also plays an important economic role due to the multiplying effects of each job in the sector. Because manufacturing uses a high degree of capital input, spending circulates into a number of different supplier industries. According to a 2019 article by the Economic Policy Institute,2 manufacturing has one of the highest jobs multipliers compared to other major private sector industries. For every one job in manufacturing, 5.14 additional jobs are supported nationally. A table of economic multipliers by industry can be found below.
Comparable reports exist that calculate the impact of the pharmaceutical industry. TEConomy Partners, LLC develops annual reports on the biopharmaceutical industry in the U.S. In their 2019 report,3 they found that the industry employed over 811,000 individuals in 2017. These jobs supported an additional 3.2 million jobs across the U.S. (a 3.95x multiplier) and created total economic output of over $1.1 trillion. These multipliers refer to national impacts, while the largest geography studied in this report is the region; therefore, multipliers found for the Bayer Berkeley campus will be lower.

11
Bay Area Council Economic Institute
1Looking Back at the Bayer Economic Impact on the City of Berkeley
Situated in the heart of the Bay Area, Berkeley is known for its world-class university and high quality of life. Although boasting a relatively small population compared to other major Bay Area cities—at just over 122,000 as of January 2020—Berkeley’s population has grown by 19% since 2000 (California Department of Finance). Bayer is the City of Berkeley’s largest private sector business employer.
This chapter will focus on the dollars that flow from the Bayer biopharmaceutical campus in Berkeley directly into the City of Berkeley as they pertain to Bayer’s Berkeley-based employment, contingent labor force, suppliers and vendors, and capital expenditures.
Summary Findings, Annual Impacts
107 jobs (full-time equivalents) supported in Berkeley, including an average of 56 Berkeley residents employed by Bayer and 51 jobs supported through multiplier effects.
$8.0 million in direct Bayer spending in Berkeley on employment, contingent labor, suppliers and vendors, and capital expenditures.
$14.8 million in total economic impact. This figure comprises all transactions in Berkeley related to Bayer’s presence. Included in this total are the direct expenditures that Bayer makes as well as their indirect and induced multiplier effects.
Impact by Geography Direct Expenditures Indirect and Induced Output Aggregate Total Impact
Employment/Wages $6,800,000 $5,910,000 $12,710,000Contingent Labor $320,000 $278,000 $598,000Supplier/Vendor $803,000 $512,000 $1,315,000Capital Expenditures $120,000 $55,000 $175,000Total $8,043,000 $6,755,000 $14,798,000
Total Economic Impact of Bayer in Berkeley (Annual Average for 2019-2020)

12
Bay Area Council Economic Institute
12
Employment
■ Bayer had a total of 988 employees at the biopharmaceutical campus in 2019. As of September 2020, that number had increased to 1,060 employees. For the purposes of this analysis, an average number of 1,024 employees is used, and the numbers presented in this section are averaged over the two years;
■ Of Bayer’s total employment of approximately 1,000 in Berkeley, on average 56 are Berkeley residents;
■ Berkeley residents working at Bayer in Berkeley represent 5.7% of Bayer’s total wages, and 5.5% of Bayer’s overall employment headcount;
■ Total salaries for all employees at the biopharmaceutical campus were $120.3 million in 2019. Berkeley residents had total salaries of $6.8 million;
■ The average annual salary for a Berkeley resident working at Bayer during 2019 was $121,000;
■ Bayer employee salaries spent in Berkeley created an additional $5.9 million in induced impact; and
■ For every 10 Berkeley residents employed at Bayer, 9 additional jobs are supported in the Berkeley economy through indirect and induced effects.
Contingent Labor
■ In addition to its full-time workforce, Bayer paid 114 contingent employees during 2019. These workers are employed on a contract basis and not all work full-time or for the entire year;
■ In 2019, seven of these contingent workers lived in Berkeley;
■ Bayer’s contingent labor force living in Berkeley was paid $320,000 in total wages in 2019; and
■ Bayer’s contingent labor force residing in Berkeley creates $278,000 in additional economic impact through the induced impact of their spending. In total, Bayer’s contingent workforce supports an additional two jobs within the City of Berkeley.
Suppliers and Vendors
■ Given the nature of Bayer’s highly technical requirements as a pharmaceutical manufacturer, supplier and vendor spending at Bayer is largely captured at the national and international level. While relatively modest, its supplier and vendor spending in the city still provides a benefit to the Berkeley economy;
■ Supplier and vendor expenses spent with Berkeley-based businesses average $803,000 annually, comprising 1.3% of Bayer’s total supplier and vendor spending in California; and
■ Bayer’s spending on suppliers and vendors supports six jobs directly in Berkeley, and an additional two jobs through indirect and induced effects. In total, these jobs and spending generate $610,000 in total wages and more than $1.3 million in overall economic activity in Berkeley.
Capital Expenditures
■ Bayer’s overall capital expenditures related to the Berkeley campus were $84.0 million in 2019;
■ For the purposes of this analysis, capital expenditures at Bayer were divided between spending on construction and spending on equipment/materials;
■ This analysis uses the geographic allocations found in supplier and vendor spending to estimate Berkeley-based spending on equipment. For construction, past Bayer projects were used to identify spending patterns at a regional level; then occupational data by city, county, and region is used to construct an allocation to Berkeley (i.e., percentage of the region’s construction workforce residing in Berkeley). This calculation yields 0.14% of all capital expenditure allocated to Berkeley;
■ Total capital expenditures spent within Berkeley approximated $120,000 in 2019; and
■ This spending on capital expenditures creates an additional $55,000 in multiplier effects within the City of Berkeley, creating a total economic impact of $175,000 in 2019.

13
Economic Impact Analysis: The Bayer Biopharmaceutical Campus in Berkeley
Impact Employment Total Income Value Added Output
Direct 56 $6,800,000 $36,171,000 $70,738,000Indirect 0 $0 $0 $0Induced 33 $2,105,000 $3,866,000 $5,910,000Total 89 $8,905,000 $45,956,124 $76,648,000
Note: Highlighted numbers denote inclusion in aggregate economic output calculation.
Economic Impact of Employment in Berkeley, 2019-2020 Annual Average
Impact Employment Total Income Value Added Output
Direct 7 $320,000 $1,702,000 $3,329,000Indirect 0 $0 $0 $0Induced 2 $99,000 $182,000 $278,000Total 9 $419,000 $1,884,000 $3,607,000
Note: Highlighted numbers denote inclusion in aggregate economic output calculation.
Economic Impact of Contingent Labor Expenses in Berkeley, 2019
Impact Employment Total Income Value Added Output
Direct 6 $406,000 $490,000 $803,000Indirect 1 $121,000 $173,000 $278,000Induced 1 $83,000 $153,000 $234,000Total 8 $610,000 $816,000 $1,315,000
Note: Highlighted numbers denote inclusion in aggregate economic output calculation.
Economic Impact of Supplier and Vendor Expenses in Berkeley, 2019-2020 Annual Average
Impact Employment Total Income Value Added Output
Direct 1 $57,000 $74,000 $120,000Indirect 0 $10,000 $16,000 $26,000Induced 0 $10,000 $19,000 $29,000Total 1 $77,000 $109,000 $175,000
Note: Highlighted numbers denote inclusion in aggregate economic output calculation.
Economic Impact of Capital Expenditures in Berkeley, 2019

Bay Area Council Economic Institute
14
2Looking Back at the Bayer Economic Impact on the East Bay While Bayer is positioned in the City of Berkeley, its operations have economic impacts predominantly across two counties: Alameda and Contra Costa. Over time, transit corridors, travel patterns, and job positioning have blurred county lines, making it common (and in some cases necessary) that residents live in one county and work in another. Given such, this chapter will analyze how Bayer’s campus in Berkeley generates an economic impact for the combined counties, referring to this geography as the East Bay.
Summary Findings, Annual Impacts
1,547 jobs (full-time equivalents) supported in the East Bay.
$110.0 million spent directly by Bayer in the East Bay through employment, contingent labor, suppliers and vendors, and capital expenditures.
$222.5 million in total economic impact. This figure comprises all transactions related to Bayer’s presence in Berkeley that impact an Alameda- or Contra Costa-based household or business, which includes the direct total income of Bayer’s employees and contingent labor force, Bayer’s supplier and vendor expenses and capital expenditures, as well as the indirect and induced multiplier impacts.
Impact by Geography Direct Expenditures Indirect and Induced Output Aggregate Total Impact
Employment/Wages $84,374,000 $91,101,000 $175,475,000Contingent Labor $3,734,000 $6,808,000 $10,542,000Supplier/Vendor $15,818,000 $11,222,000 $27,040,000Capital Expenditures $6,050,000 $3,350,000 $9,400,000Total $109,976,000 $112,481,000 $222,457,000
Total Economic Impact of Bayer in the East Bay (Annual Average for 2019-2020)

15
Economic Impact Analysis: The Bayer Biopharmaceutical Campus in Berkeley
2Employment
■ In the two years of employment data analyzed, Bayer’s workforce residing in the East Bay averaged 715 employees over the period (inclusive of those living in Berkeley);
■ 70% of Bayer’s workforce live between the two East Bay counties, which is in line with averages for manufacturers based in Alameda and Contra Costa counties;
■ Salaries for employees residing in the East Bay totaled $84.4 million in 2019;
■ The annual salary for an East Bay resident working at Bayer averaged $122,000; and
■ For every 10 East Bay residents employed at Bayer, 13 additional jobs are supported in the East Bay.
Contingent Labor ■ Bayer’s contingent labor force in the East Bay
totaled 77 contract employees in 2019;
■ Contingent labor force impacts represented a total of $3.7 million in total wages; and
■ In 2019, Bayer’s contingent labor force supported an additional 37 jobs in the East Bay and over $10.5 million in total economic impact when adding induced impacts to wages paid.
Suppliers and Vendors ■ Bayer spent an annual average of $15.8 million with East Bay suppliers and vendors across 2019 and 2020. These expenditures comprise 25.3% of Bayer’s supplier and vendor spending across California;
■ Alameda County was Bayer’s top location in the state for supplier and vendor spending during 2020 ($9.5 million), followed closely by San Mateo and Sacramento counties; and
■ East Bay suppliers and vendors for Bayer supported approximately 170 total jobs in the East Bay when including multiplier effects, and created $27.0 million in total economic output.
Impact Employment Total Income Value Added Output
Direct 715 $84,374,000 $448,866,000 $878,612,000Indirect 0 $0 $0 $0Induced 501 $31,301,000 $58,808,000 $91,101,000Total 1,216 $115,675,000 $507,674,000 $969,713,000
Note: Highlighted numbers denote inclusion in aggregate economic output calculation.
Economic Impact of Employment in the East Bay, 2019-2020 Annual Average
Impact Employment Total Income Value Added Output
Direct 77 $3,734,000 $33,544,000 $65,658,000
Indirect 0 $0 $0 $0
Induced 37 $2,339,000 $4,395,000 $6,808,000
Total 114 $6,073,000 $37,939,000 $72,466,000
Note: Highlighted numbers denote inclusion in aggregate economic output calculation.
Economic Impact of Contingent Labor Expenses in the East Bay, 2019

1616
Bay Area Council Economic Institute
Capital Expenditures ■ Out of the $84.0 million in annual capital expenditures for Bayer in 2019, approximately
7%, or $6.1 million, was spent with businesses in the East Bay. This analysis assumes capital expenditures are spent on both equipment/materials and on construction itself. Within the construction category, geographic allocations are made based on past Bayer spending patterns on capital projects and on the local, regional, and statewide construction workforce (i.e., percentage of the region’s construction workforce residing in the East Bay). Within the equipment category, allocations are made based on Bayer’s supplier and vendor spending patterns.
■ This spending directly supported 31 jobs in the East Bay in 2019 and 16 additional jobs when multiplier effects are taken into account. In total, Bayer’s capital expenditure spending created a total economic impact of $9.4 million in 2019.
Impact Employment Total Income Value Added Output
Direct 110 $7,993,000 $9,650,000 $15,818,000Indirect 28 $2,306,000 $3,393,000 $5,545,000Induced 31 $1,952,000 $3,664,000 $5,677,000Total 170 $12,251,000 $16,707,000 $27,040,000
Note: Highlighted numbers denote inclusion in aggregate economic output calculation.
Economic Impact of Supplier and Vendor Expenses in the East Bay, 2019-2020 Annual Average
Impact Employment Total Income Value Added Output
Direct 31 $2,926,000 $3,706,000 $6,050,000
Indirect 6 $527,000 $841,000 $1,467,000
Induced 10 $647,000 $1,215,000 $1,883,000
Total 47 $4,100,000 $5,762,000 $9,400,000
Note: Highlighted numbers denote inclusion in aggregate economic output calculation.
Economic Impact of Capital Expenditures in the East Bay, 2019

Bay Area Council Economic Institute
17
3Looking Back at the Bayer Economic Impact on the San Francisco Bay Area Bayer’s role in generating economic activity for the region is vital to ensuring the continual growth and positioning of life sciences in the Bay Area. This chapter builds off previous chapters, showcasing how Bayer’s biopharmaceutical campus produces an economic impact for the nine-county Bay Area.
Summary Findings, Annual Impacts
2,221 jobs (full-time equivalents) supported in the nine-county Bay Area.
$180.7 million spent by Bayer annually on Bay Area expenses through employment, contingent labor, suppliers and vendors, and capital expenditures.
$353.2 million in total economic impact. This figure comprises all transactions related to Bayer’s presence in Berkeley that impact a Bay Area-based household or business, including the direct total income of Bayer’s employees and contingent labor force, the direct output of Bayer’s supplier and vendor expenses and capital expenditures, as well as the indirect and induced impacts.
Impact by Geography Direct Expenditures Indirect and Induced Output Aggregate Total Impact
Employment/Wages $114,707,000 $123,211,000 $237,918,000Contingent Labor $5,014,000 $5,386,000 $10,400,000Supplier/Vendor $41,411,000 $31,272,000 $72,683,000Capital Expenditures $19,547,000 $12,639,000 $32,186,000Total $180,679,000 $172,508,000 $353,187,000
Total Economic Impact of Bayer in the Bay Area (Annual Average for 2019-2020)

18
Bay Area Council Economic Institute
18
Other Contributions to Economic ActivityTaxesA breakdown of local and state taxes paid in 2019 related to Bayer’s operations in Berkeley can be seen below. Bayer paid nearly $46 million in total to government entities within the state, and a portion of these payments do flow back to the City of Berkeley via state and county support. Although most corporate taxes are paid at the state or county level, Bayer did pay more than $78,000 in 2019 in business license fees directly to the City of Berkeley.
Community EngagementBayer has had a long-standing and deep relationship with community partners and organizations in the City of Berkeley and the surrounding Bay Area. Using community engagement activity in 2019 and 2020, Bayer contributed an average of $1.2 million annually in various community engagement efforts. Bayer makes these financial contributions through community benefit payments and various charitable donations. Additionally, the Bayer Fund—the philanthropic arm of Bayer in the U.S., which superseded the Bayer USA Foundation in 2020—provides grants in the Bay Area.
In 2019 and 2020, Bayer contributed an annual average of $287,000 in community benefits. Bayer in Berkeley also supports several organizations that are providing instrumental support in various programmatic areas including science education, patient and health challenges, and community development and support.
Examples of organizations Bayer has funded include the Berkeley Food & Housing Project, Bridge Housing, and the Lawrence Hall of Science. In 2019 and 2020, an annual average of $325,000 was donated to organizations with an additional $589,000 donated to other organizations through Bayer’s philanthropic arm.
Tax DescriptionPaid to
Alameda County Paid to CaliforniaPersonal Property Taxes paid on property that can be moved from
one location to another $2,874,477
Real Property Taxes paid on land and fixed improvements $5,821,724 -
Use A sales tax on purchases made outside California, but will be used, stored, or consumed in - $1,196,272
Sales Taxes paid on goods and services - $3,278,521
Payroll Taxes paid by employer on wages - $32,493,746
Business License Permits allowing companies to conduct business within a specific jurisdiction $78,707* -
Total $8,696,201 $36,968,539
*Note: Business license figure only refers to the City of Berkeley.
Taxes Paid Annually Related to Bayer's Berkeley Operations
1919
Economic Impact Analysis: The Bayer Biopharmaceutical Campus in Berkeley
Employment
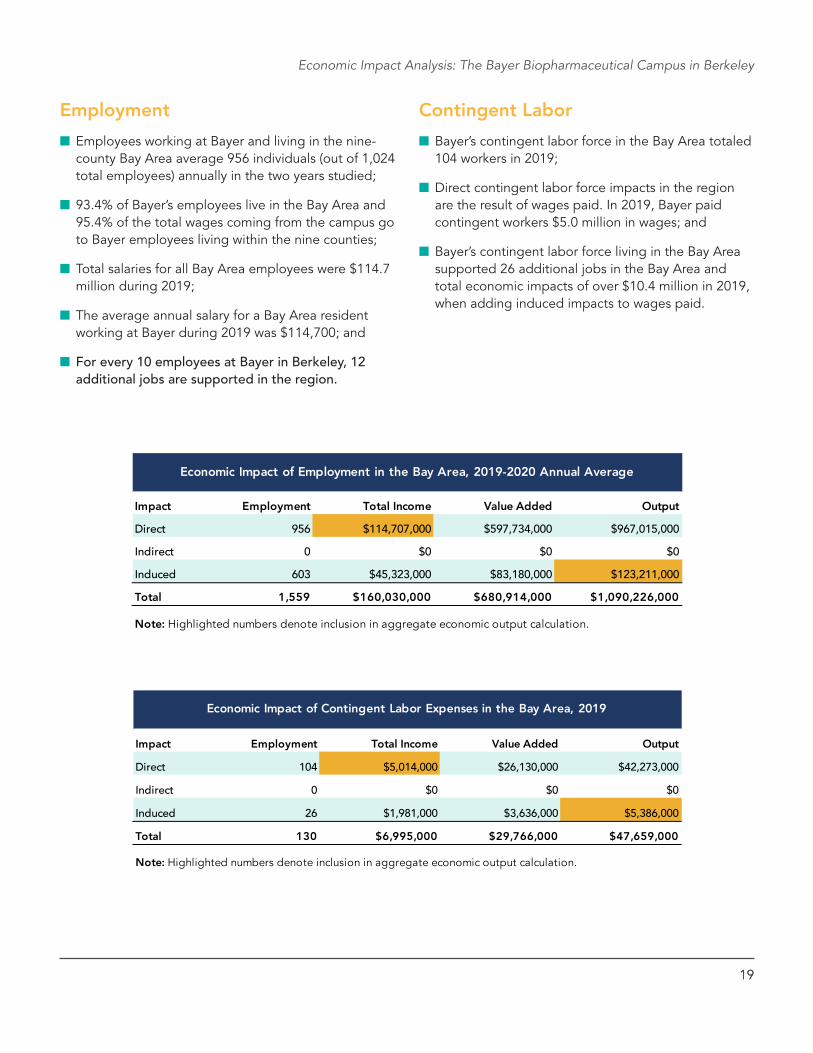
■ Employees working at Bayer and living in the nine-county Bay Area average 956 individuals (out of 1,024 total employees) annually in the two years studied;
■ 93.4% of Bayer’s employees live in the Bay Area and 95.4% of the total wages coming from the campus go to Bayer employees living within the nine counties;
■ Total salaries for all Bay Area employees were $114.7 million during 2019;
■ The average annual salary for a Bay Area resident working at Bayer during 2019 was $114,700; and
■ For every 10 employees at Bayer in Berkeley, 12 additional jobs are supported in the region.
Contingent Labor
■ Bayer’s contingent labor force in the Bay Area totaled 104 workers in 2019;
■ Direct contingent labor force impacts in the region are the result of wages paid. In 2019, Bayer paid contingent workers $5.0 million in wages; and
■ Bayer’s contingent labor force living in the Bay Area supported 26 additional jobs in the Bay Area and total economic impacts of over $10.4 million in 2019, when adding induced impacts to wages paid.
Impact Employment Total Income Value Added Output
Direct 956 $114,707,000 $597,734,000 $967,015,000Indirect 0 $0 $0 $0Induced 603 $45,323,000 $83,180,000 $123,211,000Total 1,559 $160,030,000 $680,914,000 $1,090,226,000
Note: Highlighted numbers denote inclusion in aggregate economic output calculation.
Economic Impact of Employment in the Bay Area, 2019-2020 Annual Average
Impact Employment Total Income Value Added Output
Direct 104 $5,014,000 $26,130,000 $42,273,000
Indirect 0 $0 $0 $0
Induced 26 $1,981,000 $3,636,000 $5,386,000
Total 130 $6,995,000 $29,766,000 $47,659,000
Note: Highlighted numbers denote inclusion in aggregate economic output calculation.
Economic Impact of Contingent Labor Expenses in the Bay Area, 2019

20
Bay Area Council Economic Institute
Suppliers and Vendors
■ Expenses on Bay Area suppliers and vendors for Bayer averaged $41.4 million during 2019 and 2020;
■ This spending comprises 66.2% of Bayer’s overall supplier and vendor spending across California;
■ Expenditures on suppliers and vendors averaged over $1 million annually in eight of the nine Bay Area counties, with the largest amounts spent in the two East Bay counties, San Mateo County, Marin County, and Santa Clara County; and
■ Bayer spending on Bay Area suppliers and vendors directly supported 238 total jobs in the region, resulting in an additional 142 jobs supported through indirect and induced impacts.
Capital Expenditures
■ Out of the $84.0 million in 2019 capital expenditures for Bayer in Berkeley, approximately 23.3% or $19.5 million was spent in the Bay Area;
■ Of that, $17.8 was estimated to be spent toward construction and $1.7 million was estimated to be spent toward equipment. The construction figure was estimated from recent Bayer construction projects, in which 35% of all spending was allocated to the region. For equipment spending, approximations mirror percentages allocated to the Bay Area for suppliers and vendors; and
■ Capital expenditures by Bayer in Berkeley supported 152 jobs in the Bay Area when including multiplier effects and $32.2 million in overall economic activity.
Employment Total Income Value Added Output
Direct 238 $23,660,000 $28,292,000 $41,411,000Indirect 53 $5,685,000 $8,764,000 $13,226,000Induced 89 $6,651,000 $12,182,000 $18,046,000Total 380 $35,996,000 $49,238,000 $72,683,000
Note: Highlighted numbers denote inclusion in aggregate economic output calculation.
Economic Impact of Supplier and Vendor Expenses in the Bay Area, 2019-2020 Annual Average
Impact Employment Total Income Value Added Output
Direct 97 $9,375,000 $11,877,000 $19,547,000
Indirect 20 $2,138,000 $3,330,000 $5,587,000
Induced 35 $2,600,000 $4,761,000 $7,052,000
Total 152 $14,113,000 $19,968,000 $32,186,000
Note: Highlighted numbers denote inclusion in aggregate economic output calculation.
Economic Impact of Capital Expenditures in the Bay Area, 2019

Bay Area Council Economic Institute
21
4Projecting Forward - Bayer’s Future Economic Impact This report has highlighted ways in which Bayer’s current workforce, spending, and investments at its Berkeley campus have yielded positive economic benefits for Berkeley and the surrounding region. As Bayer prepares for the expansion of its Berkeley campus and the proposed extension of its development agreement with the City of Berkeley, this final chapter will use the same methodology as previous chapters to project Bayer’s future economic impact.
While the COVID-19 pandemic and the future prevalence of remote work challenges the ability to make predictions, life sciences companies like Bayer will increasingly need more office, development, laboratory, and manufacturing spaces to operate efficiently. Given this dynamic, their economic impacts on the surrounding geographies are likely to increase as the economy grows.
This chapter focuses on the future economic impacts that increased employment would bring to the three geographies analyzed. Secondly, this chapter uses data on the projected buildout by square footage and usage type to determine the future economic impacts that increased construction will bring. Employee impacts will be expressed as the total benefit in the year of full buildout (2052), whereas construction impacts will be expressed as the average annual impact over 30 years. To allow for comparisons between the backward-looking impacts and the future-looking impact totals,
this chapter holds constant the contingent labor and supplier and vendor impacts, but inflates them out to 2052. This conservative assumption is used because these figures are difficult to project, but they would likely be even larger at full buildout.
Summary of Annual Economic Impact by 2052 (in 2020 dollars)
$29.1 million annual economic impact for the City of Berkeley, an increase of 96.8% over the current annual impact
204 jobs supported annually in the City of Berkeley, compared to 107 jobs currently
$422.0 million annual economic impact for the East Bay, an increase of 89.7% over the current annual impact
2,811 jobs supported annually in the East Bay, compared to 1,547 currently
$613.1 million annual economic impact for the Bay Area, an increase of 73.6% over the current annual impact
3,816 jobs supported annually in the Bay Area, compared to 2,221 currently

22
Bay Area Council Economic Institute
Employee and Construction Future Impacts at Full Buildout
By 2052, Bayer’s biopharmaceutical campus will grow to have approximately 2,000 employees in four major job types: Production (35%), Maintenance (15%), Laboratory (38%), and Administration (12%), as estimated by Bayer. To quantify the impacts of these new employees, this chapter takes the average annual salary within each job type and conservatively inflates it by 2% out to 2052, which matches assumptions used to discount this spending back to 2020 dollars. It is assumed that the geographic employee mix (i.e., Berkeley, East Bay, and Bay Area) by each job type remains equivalent to findings in the backward-looking analysis. Given that the timing of employment increases cannot be predicted, this analysis focuses on 2052, when it is assumed the expanded Berkeley campus will employ 2,000 people.
To facilitate this growth, the new 30-year Development Agreement would allow for a significant expansion of the physical space. By 2052, facility additions at the biopharmaceutical campus will total 918,000 million square feet (with 267,000 square feet of existing space demolished), in addition to potentially 779,500 new square feet within parking structures at the campus. The construction and demolition of the work spaces is divided into five building types: Production, Warehouse, Administration, Utilities, Manufacturing Labs, and Maintenance. The majority of the new construction (69%) falls into the Production category.
To estimate the cost of construction, this analysis uses 2020 building cost estimates for the San Francisco metropolitan area and estimates from Bayer.4,5 Cost estimates for the work spaces range from $800 per square foot for production to $915 per square foot for laboratory. For parking structures, each square foot carries a cost of $86. This analysis assumes 2% constant annual inflation. Bayer also estimates the construction will occur in two phases: the first completed between 2022 and 2032, and the second extending to 2052.
Overall costs for construction and demolition are projected to total $940 million in 2020 dollars, or $1.2 billion when adjusted for inflation in the year of assumed construction. All modeling outputs are displayed in constant 2020 dollars for comparability purposes.
Spotlight on Construction Jobs
Bayer would invest $1.2 billion in inflation-adjusted dollars under an extended 30-year Development Agreement with the City of Berkeley. That investment will support direct job creation in the construction sector and multiplying effects in sectors that provide building materials, equipment, and other inputs.
Because construction will occur over multiple years, economic impact models produce an output in “job-years.” For example, two job-years could equate to two unique full-time jobs that each last a single year or four unique full-time jobs that each last for six months.
This analysis finds that construction investments that would take place under an extended 30-year Development Agreement would yield:
■ A total of 1,698 full-time equivalent construction job-years supported at the Berkeley campus.
■ Given the construction workforce makeup of the Bay Area, 572 of these job-years would be filled by East Bay residents.
These numbers are derived from the assumption that 35% of Bayer spending is allocated to construction labor (based on past projects), and the fact that one-third of the current Bay Area construction workforce resides in the East Bay.
Much like the overall employee profile of the Bayer campus in Berkeley shown earlier in this report, these construction jobs would provide opportunities to a diverse workforce. Of East Bay residents that work in the construction sector, 45% identify as Latinx, 9% as Asian/Pacific Islander, and 5% as Black. In 2019, the average annual wage for a construction worker across the two East Bay counties was $85,000.

2323
Economic Impact Analysis: The Bayer Biopharmaceutical Campus in Berkeley
The following sections present forward-looking economic impact findings that would stem from an extended 30-year Development Agreement between Bayer and the City of Berkeley. Summary charts are shown on the following page.
City of Berkeley Impacts
■ By 2052, Bayer is projected to have 116 employees that also live in the City of Berkeley. Salaries in 2052 dollars for Berkeley residents would total $27.6 million, or $14.5 million in 2020 dollars.
■ Employees who live in Berkeley would create an additional $12.6 million impact annually in 2020 dollars when including the effects of their spending.
■ Construction impacts based on geographic spending estimates would result in a total allocation of $2 million in Berkeley-based spending over 30 years, supporting 11 direct full-time equivalent construction job-years (a job-year is one year of work for one person).
■ When including multiplier effects related to the construction spending, one full-time equivalent job for Berkeley residents is supported annually in the construction sector. These construction impacts and their multiplier effects in the City of Berkeley would generate $102,000 in annual economic impact over 30 years.
■ In 2020 dollars, the 30-year Development Agreement would allow Bayer’s economic impacts within the City of Berkeley to grow to $29.1 million annually, and it would support a total of 204 jobs by 2052 (including direct employment at Bayer, construction workers, and employment related to multiplier effects).
East Bay Impacts
■ By 2052, Bayer is expected to have a total of 1,418 employees who live between the two East Bay counties. Total salaries in 2052 dollars for East Bay residents would total $346.0 million, or approximately $182.4 million in 2020 dollars.
■ Employees living in East Bay counties would create an added impact of $196.4 million annually in 2020 dollars when including the effects of their spending.
■ Construction impacts based on geographic spending estimates would result in $109.4 million in East Bay-based spending over 30 years, supporting 572 direct full-time equivalent construction job-years.
■ When including multiplier effects related to construction spending, 29 full-time equivalent jobs for East Bay residents are supported annually in the construction sector. New construction would generate $5.7 million annually in aggregate impacts over 30 years within the East Bay.
■ With the new 30-year Development Agreement, Bayer is estimated to generate $422.0 million in annual economic impacts for the East Bay and support a total of 2,811 jobs annually at full buildout.
San Francisco Bay Area Impacts
■ By 2052, Bayer is expected have 1,921 employees who live within the nine-county Bay Area. Salaries in 2052 dollars for Bay Area residents would total $469.3 million, or $246.9 million in 2020 dollars.
■ Employees who live in the Bay Area would create an additional $265.0 million in annual impacts in 2020 dollars, when including the effects of their spending.
■ Construction impacts for the region, based on capital expenditures allocated to the Bay Area, total $331.8 million over 30 years, directly supporting 1,698 full-time equivalent job-years over the period.
■ When including multiplier effects related to the construction spending, 87 full-time equivalent jobs for Bay Area residents are supported annually in the construction sector. Altogether, new construction spending would generate $18.1 million in annual impacts over 30 years.
■ The 30-year Development Agreement would allow Bayer to grow its annual economic impact in the Bay Area to $613.1 million.

24
Bay Area Council Economic Institute
Impact Type Jobs Supported Direct Expenditures Indirect and Induced Output Aggregate Total Impact
Employment/Wages 2,498 $182,388,000 $196,402,000 $378,790,000Construction 29 $3,646,000 $2,009,000 $5,655,000Contingent Labor 114 $3,734,000 $6,808,000 $10,542,000Supplier/Vendor 170 $15,818,000 $11,222,000 $27,040,000Total 2,811 $205,586,000 $216,441,000 $422,027,000
Note: Contingent labor and supplier/vendor impacts are held constant at current (2019/2020) levels
Estimated Annual Impacts Created from the 30-Year Development Agreement on the East Bay (in 2020 dollars)
Impact Type Jobs Supported Direct Expenditures Indirect and Induced Output Aggregate Total Impact
Employment/Wages 3,219 $246,889,000 $264,997,000 $511,886,000Construction 87 $11,059,000 $7,039,000 $18,098,000Contingent Labor 130 $5,014,000 $5,386,000 $10,400,000Supplier/Vendor 380 $41,411,000 $31,272,000 $72,683,000Total 3,816 $304,373,000 $308,694,000 $613,067,000
Note: Contingent labor and supplier/vendor impacts are held constant at current (2019/2020) levels
Estimated Annual Impacts Created from the 30-Year Development Agreement on the Bay Area (in 2020 dollars)
Impact Type Jobs Supported Direct Expenditures Indirect and Induced Output Aggregate Total Impact
Employment/Wages 186 $14,521,000 $12,591,000 $27,112,000Construction 1 $70,000 $32,000 $102,000Contingent Labor 9 $320,000 $278,000 $598,000Supplier/Vendor 8 $803,000 $512,000 $1,315,000Total 204 $15,714,000 $13,413,000 $29,127,000
Note: Contingent labor and supplier/vendor impacts are held constant at current (2019/2020) levels
Estimated Annual Impacts Created from the 30-Year Development Agreement onthe City of Berkeley (in 2020 dollars)

25
Economic Impact Analysis: The Bayer Biopharmaceutical Campus in Berkeley
Endnotes1. California Life Sciences Industry Report (2019). California Life Sciences Association and PwC. Accessed at: https://
califesciences.org/wp-content/uploads/2018/11/clsa-2019-california-life-sciences-industry-report.pdf
2. Bivens, Josh (2019). “Updated employment multipliers for the U.S. economy.” Economic Policy Institute. Accessed at: https://www.epi.org/publication/updated-employment-multipliers-for-the-u-s-economy/
3. The Economic Impact of the U.S. Biopharmaceutical Industry: 2017 National and State Estimates (December 2019). TEConomy Partners LLC.
4. Cumming Insights (2021) “U.S. Costs per Square Foot of Gross Floor Area 2021.” Accessed at: https://ccorpinsights.com/costs-per-square-foot/
5. Smith, Raymond (2020). “Parking Structure Cost Outlook for 2020.” WGI. Accessed at: https://h8f4v6c7.stackpathcdn.com/wp-content/uploads/2020/07/Parking-Construction-Cost-Outlook.pdf
Image CreditsFront Cover: Photo provided by Bayer
Page 6: Photo provided by Unsplash
Page 11: Photo provided by Bayer
Page 14: Photo provided by Wikipedia
Page 17: Photo provided by Flickr
Page 21: Photo provided by BBI Construction
Infographic associated with this report: Icons provided by ultimatearm

Bay Area Council Economic Institute
San Francisco, CA
www.bayareaeconomy.org • [email protected] • @bayareaeconomy