economic growth in the horn of africa: identifying
TRANSCRIPT

Economic Growth in the Horn of Africa:
Identifying Principal Drivers and
Determinants
The Horn Economic and Social Policy Institute (HESPI)
Policy paper no. 12/3 Ali I. Abdi (PhD) and Emerta A. Aragie (MSc)
December 2012

Contents
I. Introduction and Background .................................................................................................................................. 2
II. Identifying Determinants of Economic Growth ................................................................................................ 4
1. Development of Growth Models ......................................................................................................................... 4
2. The Growth Diagnostics Approach .................................................................................................................... 6
III. Growth and Investment in the Horn of Africa ................................................................................................... 9
IV. Determinants of Investment and Growth .......................................................................................................... 12
V. Findings and Policy Implications .......................................................................................................................... 26
a. Findings ....................................................................................................................................................................... 26
b. Policy Implications ................................................................................................................................................. 27
References ................................................................................................................................................................................ 29
Annex I ....................................................................................................................................................................................... 31

1
Economic Growth in the Horn of Africa: Identifying Principal Drivers and
Determinants1
December 2012
Abstract
The Horn of Africa countries had poor economic growth for many decades before the 2000’s. Various
studies were conducted to uncover the factors responsible for the poor economic performance and
divergence from the developing regions. Opinions varied, however, on why the countries in the Horn
sub-region have been some of the poorest in the world. In identifying growth determinants in the sub-
region, a diagnostics approach is applied, which reveals that limited access to finance (from both
domestic and external sources), low domestic savings, weak infrastructure, and inadequate human
capital are the most significant constraints on economic growth in the sub-region. Removing these
constraints can lead to higher economic growth, as the adopted approach assumes stronger multiplier
impact of removing the binding constraints. Specifically, the sub-region should work to reform the
financial sector so as to mobilize the required finance for both private and public investment projects.
Infrastructure development should be another priority for governments. Moreover, the level of human
capital in the sub-region is very low, suggesting a need for strong commitment to improve access to
quality education at all levels. International development partners would be well advised to channel
their technical and financial assistance to address the most binding constraints of growth.
1 Ali I. Abdi (PhD) and Emerta A. Aragie (MSc), the Horn Economic and Social Policy Institute (HESPI)

2
I. Introduction and Background
The Horn of Africa sub-region constitutes seven countries in the North-Eastern tip of the continent.
Of its more than 213 million people nearly three in four reside in rural areas, and rely on
subsistence production. Economic growth in the region averaged about 3 percent between 1965
and 1995, with a 3 percent population growth that led to a stagnation of per capita income at US$
223 at the end of the period compared to US$ 491 in the rest of sub-Saharan Africa. Since the
second half of 1990’s, most countries in the region experienced strong growth. The sub-region grew
by 4.4 percent between 1996 and 2000, and at 5.3 percent and 7.9 percent in the first and second
half of the 2000’s, respectively. However, only three of the countries in the sub-region (Ethiopia,
Sudan and Uganda) registered a sustained growth of 7 percent since 2000 to achieve substantial
reduction in poverty and progress towards the Millennium Development Goals (MDGs).2 Due to this
renewed growth performance, poverty in the sub-region declined by 18 percentage points to 35
percent from 2000 to 2009, showing a growth elasticity of poverty of about -0.45. The average per-
capita income in the region was at US$ 341 in 2008, compared to per-capita income of US$ 648 for
the whole of sub-Saharan Africa.
Despite the improving regional trend in growth performance, there is a marked difference in
growth experience within the sub-region: some countries experienced growth, while others
experienced a slowdown in growth in 1996-2000. Among the member countries of the Horn of
Africa growth decelerated in Kenya and Eritrea between 2006-09. Oil extraction contributed to the
high growth performance in the Sudan, which markedly exceeded the average of the sub-region.
The overall disappointing growth performance in the Horn of Africa has led to poor socio-economic
indicators in the member countries. Per capita income in the sub-region in 2010 was only 14
percent of that of Eastern and South-Eastern Asia (excluding China); and it was around 56 percent
of sub-Saharan African average (Table 1.1). On the other hand, the poverty head count ratio is on
average 32 percent in the Horn of Africa as compared to an average of 17 percent in developing
East Asia and the Pacific; and 51 percent in sub-Saharan Africa. The high level of poverty in sub-
Saharan Africa despite better per capita income than in the Horn of Africa indicates huge inequality
in the sub-Saharan Africa. Of the Horn of African countries for which we have data Uganda had the
highest proportion of poor people at 51.5 percent in 2005 while Ethiopia had 39 percent.
The member countries of the Horn sub-region underwent gradual change in their economic
makeup. The share of the agricultural sector in total regional value added declined from 40.2
percent in 1995 to 31.8 percent in 2009, and service sector becomes a dominant economic activity
in the sub-region. Industry also increased its contribution to GDP in most countries of the sub-
region, its share growing by 6 percentage points. However, the sector still contributes to less than
19 percent of total GDP of the sub-region. During the same period, the share of industry in total
production increased from 20.9, 21.0, and 19.7 percent to 26.7, 28.0, and 24.7 percent in a group of
heavily indebted poor countries, least developed countries and low income countries, respectively.
2 See ECA, 2003; and Emerta, 2009.

3
Table 1.1: Comparison of income and poverty indicators
Country /Region
2010 Per capita income
in $US
(at current prices and
exchange rates)
2005
Poverty Head Count
Ratio at $1.25 a day
Djibouti 1,283 ...
Eritrea 429 ...
Ethiopia 325 39.0
Kenya 802 19.7
Somalia ... ...
Sudan 1,825 ...
Uganda 509 51.5
The Horn of Africa (IGAD) 743 31.8
Sub-Saharan Africa 1,319 50.9
Eastern and South-Eastern Asia (excluding
China) 5,116 16.8
Source: UNCTAD Stat (2012)
The overall poor growth performance has made the Horn of Africa the least developed sub-region
in the world. Stimulating and sustaining high economic growth is therefore the most pressing
challenge of political leaders, development agents, and policy makers in the sub-region. Various
studies were conducted to identify the sources and determinants of growth on individual countries
of the Horn of Africa, and many other developing countries elsewhere in the world. The classical
methods adopted to discover covariates of growth have not provided a permanent solution to the
problem of low economic growth and underdevelopment in the Horn of Africa sub-region3. In this
context, following the recent growth literature, and in an effort to enhance growth and poverty
reduction in the sub-region, this study aims at identifying the binding constraints to economic
growth and recommends how growth can be accelerated at sustained levels.
The rest of the paper is organized as follows: section II summarizes development in growth models
and the growth diagnostics approach adopted by this study; while section III revisits how growth
and investment have behaved overtime in the Horn of Africa. In section IV, the growth diagnostics
approach is applied to the Horn of Africa countries and in section V principal conclusions and
recommendations are provided.
3 Rodrik, 2004

4
II. Identifying Determinants of Economic Growth
1. Development of Growth Models
Economic growth has been the concern of all societies at all times particularly since the days of the
classical economists.4 After a period of relative neglect in mainstream economics, in the past four
decades economists have paid increasing attention to developing models to identify the
determinants of economic growth. The notion of long-term economic growth and the analysis of its
determinants date back to the contributions of Solow (1956) and Swan (1956) as documented by
Villa,5 Aghion and Howitt6. Solow and Swan, in their independent prominent works, examined
economic growth in the U.S. and developed the “neoclassical growth theory”. Growth economics has
registered a rapid development since then and experienced different phases of evolution to reach
its current state.
One of the strongest propositions in the evolution of growth economics is that technological
innovation is crucial to sustain a positive growth rate of output per capita. This proposition has
been repeatedly tested using the Solow-Swan growth model. The main assumptions of this model
are constant returns to scale production function, and labor and capital as the basic factors of
production. From these assumptions it follows that an increase in capital, provided the amount of
labor employed stays the same, will result in a less than proportionate increase in output.
In the Slow-Swan model, growth of output is related to the amount and quality of the basic factors
of production. The amount of output growth that cannot be attributed to the change in the basic
factors of production is often referred to as Solow residual, total factor productivity or measure of
ignorance. The model also assumes that the labor force is growing at the rate of change of the
population, and is augmented by exogenously growing technology. Accordingly, the policy
recommendations based on the model revolve around the quality and quantity of the factors of
production. Most of the assumptions of this model have been criticized as limitations of the model
and led to the development of what is called the endogenous growth model.
The endogenous growth model theories emphasize the determination of long-run (or steady state)
growth rate, which is determined within the model, and therefore can be affected also by economic
policies, instead of being driven exogenously. This model assumes that permanent changes in
economic parameters can alter the long-run rate of growth.7 The improvement of the endogenous
growth models over the standard neoclassical growth models is that the rate of technical progress
(which is exogenous in the neoclassical growth model) has permanent growth effects. Although
endogenous growth theory is still young in comparison to the neoclassical theory, it is more
4 Vaish, 2002. Adam Smith. David Ricardo, John Stuart Mills, Thomas Robert Malthus, Karl Marx, Alfred Marshal, Joseph A. Schumpeter, John Maynard Keynes and others either made economic growth the central theme of their work or related their works to it. 5 Villa, 2005 6 Aghion and Howitt, 1998 7 Rao et al extended the neoclassical growth model to capture the level and growth effects of the shift variables in “An Extension to the Neoclassical Growth Model to Estimate Growth and Level Effects, 2006”.

5
suitable for addressing the problems of sustainable development than is the neoclassical growth
theory.8
Since the inception of economic growth models, many time-series and cross-section specifications
have been estimated. Some of these studies tried to uncover the correlates of growth in the Horn of
Africa countries, and found a long shopping list of factors that have contributed to the poor
economic performance in these countries. For example, Geda et al9 found that growth in Ethiopia, to
a large extent, depends on structural factors such as initial conditions, vagaries of nature, external
shocks and peace and stability in the country and in the sub-region. Easterly10 found the quality of
institutions, the literacy rate, openness to trade, and the structural transformation to be important
variables for long-run growth. Studies in the case of Kenya identified various factors: Odhiambo et
al11 established that Kenya’s trade policy, climate, and government expenditure on agriculture are
important determinants of agricultural total factor productivity growth. On the other hand, Kumar
and Pacheco12 found that overseas development aid, foreign direct investment, the progress of
financial sector, and trade openness are the key determinants of Kenya’s growth. In the case of
Uganda, Kasekende, Ego and Sebudde13 suggested that the growth is heavily influenced by three
major factors: governance and political economy (including political instability and conflict), the
policy environment, and external factors. According to Nassanga14, the determinants of growth in
Uganda during the 1990s have been identified as improved security, the restoration of
macroeconomic stability, the removal of economic distortions and an improvement in the terms of
trade as a result of the mid-nineties coffee price boom.
Despite such extensive empirical works the growth studies have not provided ‘reliable and
unambiguous’15 evidence on the principal reasons for the poor growth performance in the Horn of
Africa. Different economists provided various reasons on the failure of previous attempts to identify
growth determinants in developing countries. Cerra and Saxena attributed the limited exposition of
past attempts on considerable variation in data across time, which can mask the determinants of
turning points and conceal valuable information.16
Also the traditional approach to targeting the biggest distortion or a number of large distortions
may not be feasible and may not lead to welfare improvement due to large second best effects, and
financial and capacity constraints, especially in low income countries.17 Unlike the previous
attempts, the growth diagnostics approach targets the most binding constraint to growth which can
increase the overall positive impact, as the most binding constraint is possibly associated with the
biggest multiplier. Institutional policy recommendations failed to produce the desired outcome as
8 Aghion and Howitt, 1998
9 A. Geda et al, 2008
10Easterly, 2002
11 Odhiambo, Nyangito, & Nzuma, 2004
12 Kumar and Pacheco, nd
13 Kasekende, Ego and Sebudde, 2004
14 Nassanga, 2006
15 As quoted from Rodrik, 2004: Growth Strategies
16 Cerra and Saxena, 2007
17 Ianchovichina, 2009

6
they were never targeted on what may have been the most important constraints blocking
economic growth in developing countries.18
2. The Growth Diagnostics Approach
The growth diagnostics approach requires us to identify one or two most binding country specific
constraints in order to uncover constraints of growth instead of laboring on a whole list of growth
covariates. Efforts should focus on lifting these constraints. The growth diagnostics approach
assumes that the constraints are country specific; however, building on the country case analysis
and regional averages, this study will draw conclusions on the Horn of Africa sub-region.
The growth diagnostics approach has its conceptual origins in Albert Hirschman’s (1958) theory of
unbalanced growth.19 Hirschman argued that, in the absence of sufficient resources -- especially
capital, entrepreneurs, decision makers and, above all, the means and ability to bring them all into
play -- policy makers should choose the projects that make the greatest contribution to
development, relative to their costs. Building on the work of Hirschman and extending it,
Hausmann et al20 developed the growth diagnostics approach, which provides a framework for
formulating hypotheses on what may be constraining a country’s growth. It views economic growth
as the result of an optimization process under constraints, and seeks to identify factors that are the
most binding in the sense that their removal would allow a growth spurt. It also identifies the most
binding constraints for the purpose of policy reforms.
The underlying idea behind the growth diagnostics approach is that the removal of a small number
of key constraints (i.e., focused interventions) will have a larger impact on growth than the
traditional approach based on a long list of reforms often associated with the “Washington
Consensus,”21 which emphasizes the need to remove all distortions at once. Hence, the growth
diagnostics methodology can be a useful tool for policymakers to formulate a focused growth
strategy for developing countries in the presence of limited resources.
Within the framework of growth diagnostics approach, investment and growth can be constrained
by:
a) Poor access to finance in the form of high cost of capital, poor financial intermediation,
weak access to finance, and low domestic saving;
b) Low social returns related to geography, infrastructure, and education; and
c) Poor appropriability through macroeconomic risk, market failure, high transaction cost
and poor business environment.
18
Rodrik, 2004 19
Felipe and Usui, 2008 20
Hausmann eta al, 2005 21
Williamson, 2004

7
Taking the above factors into account and to put things into context, Hausmann et al22 start with a
simple endogenous growth model comprising the factors that affect growth. According to the
standard model, consumption and capital grow, along a balanced growth path, in the following
manner:
]1[
**
rk
k
c
c
t
t
t
t ……………………………. [2.1]
Where c=consumption,
k=capital r =the rate of return on capital
=the tax rate on capital, actual or expected =the world rate of interest =inter temporal elasticity of consumption
The dot over a variable implies the rate of change of the variable over time.
On the other hand, the private rate of return on capital )(r depends on total factor productivity
( ), availability of complementary factors of production ( ) such as infrastructure and human
capital, and index of externality or distortions ( ). It can be represented by
),,( rr ……………………….…………… [2.2]
The two equations [2.1] and [2.2] incorporate the most important factors affecting economic
growth in the short-run. Two qualifications have to be mentioned. First the identification of the
binding constraint is meant to help the government in prioritization of reforms rather than to deny
existence of other distortions in the economy23. Second, the binding constraint does not necessarily
coincide with what is perceived as the biggest distortion in the economy by economic agents; rather,
it is the magnitude of the distortion’s direct impact on growth that is decisive.
The growth diagnostics approach is not without limitations, although it indeed provides a well-
structured methodology to think about why some countries do not appear to develop or attain
sustainable high growth. The limitations of the diagnostic approach are that it: (i) focuses
exclusively on economic growth vis-a-vis development; (ii) assumes that investment is the main
source of growth; and (iii) is static and focuses on constraints that are binding today, but not
necessarily in the future24.
Although the growth diagnostics approach is just emerging, it has been widely used by various
researchers on Brazil, Bolivia, Dominican Republic, Egypt, El Salvador, Malawi, and Pakistan. The
growth diagnostics approach has been adopted to trade expansion in developing countries, and that
22
Hausman et al, 2005 23
Dobronogov & Iqbal, 2005 24
Felipe and Usui, 2008

8
indicates that it is becoming a useful method not only for identifying the most binding constraints
to growth but also for sequencing reform priorities which should focus on the most binding ones25.
The descriptive presentation of the growth diagnostics approach can be represented by the
decision tree in Figure 1.1.
Figure 1.1: Schematic representation of growth diagnostics approach
Source: Hausmann et al (2005)
25
Hallaert and Munro, 2009
Growth diagnostics
Low Approprability
High Cost of Finance
Low Social Returns
Low return to economic activity
Limited International Finance Limited Local Finance
Poor Geography
Low Human Capital
Inadequate Infrastructure
Government failure
Market failure
Low domestic saving
Poor Intermediation
Micro-risks: corruption, taxes…
Macro-risks: financial, fiscal instability
Information externalities
Coordination externalities

9
III. Growth and Investment in the Horn of Africa
Growth in the Horn of Africa was very low in the three decades to mid-1990s. Only recently is the
sub-region showing improvement in economic growth, most of which is coming from the service
sector. The industrial sector in the sub-region has not been transformed and its contribution to sub-
regional GDP is small. Following the growth diagnostics methodology, this study assesses which of
the three “general” constraints-- financial constraint, low social returns, or low appropriability-- is
likely to bind growth in the Horn of Africa. The study then proceeds to identify the specific
constraints, which in the case of investment include lack of finance, cost of finance, microeconomic
environment, macroeconomic environment and/or lack of complementary inputs such as
infrastructure. The most binding constraints should, thus, be the immediate focus of economic
policy in the region.
The growth performance in the Horn of Africa countries was not only low but also volatile
(Figure 2.1). Non-fragile states of the sub-region experienced high economic growth in the last few
years. Real GDP growth reached as high as 10.7 percent in Ethiopia, 8.3 percent in Uganda and 7.8
percent in Sudan in 2005-09. These three countries constitute 74 percent of the sub-region’s
population, and 72 percent of its GDP. Hence, the average real growth rate of GDP in the Horn of
Africa reached 7.7 percent during the five years to 2009. Furthermore, growth is forecasted to
average between 3.3 percent in Eritrea and 8.1 percent in Ethiopia for the years 2011-1526, and the
average growth rate for the sub-region is about 6 percent in the same period.
Figure 2.1: GDP growth rate in the Horn of Africa
Source: World Bank Development Indicators
An important step in analyzing the constraints of growth is identifying the drivers of long-term
growth. Building largely on the national accounts of countries, one can identify which sector
(agriculture, industry or service) is behind the growth performance of the economies. The
industrial sector used to grow by 5 to 19 percent between 1996-2010, while the growth of the
services sector rose from 0.8 percent in 1996-2000 to 14.1 percent in 2006-10 (Table 3.1).
26 IMF, 2010
-15
-10
-5
0
5
10
15
20
25
19
81
19
83
19
85
19
87
19
89
19
91
19
93
19
95
19
97
19
99
20
01
20
03
20
05
20
07
20
09
Eritrea Djibouti Ethiopia

10
Also, sectoral contribution to sub-regional GDP changed gradually. Services became the dominant
economic activity, contributing around 42 percent of the sub-regions GDP in 2006-10. There is a
general pattern of falling share of the agricultural sector, as the industrial and services sectors
expanded more. Data on trade show that exports grew by 17 percent over the past 10 years and
increased to a range of 16-17 percent of GDP in 2001-10, while the growth rate of imports varied
between 13-19 percent and amounted to 25-27 percent of GDP in the 10 years to 2010.
Table 3.1: Sources of GDP growth in the Horn of Africa (Average)
National account* 1996-2000 2001-05 2006-10
Real GDP growth 4.9 5.8 7.3
Import growth (goods and services) -0.7 18.6 13.2
Imports as share of GDP 23.0 25.2 26.5
Export growth 2.0 17.0 17.0
Exports as share of GDP 13.8 15.8 17.4
Growth (in percent)
O/w: Agriculture 0.1 11.3 14.3
Industry 5.7 17.1 19.1
Services 0.8 13.6 14.1
Share to GDP (in percent)
Agriculture 36.3 32.1 31.1
Industry 14.9 17.5 20.3
Services 41.7 43.8 41.9
Sources: UNCTAD Stat (2012)
The mechanism through which all sources of economic activity can transform into growth is
through investment. The global observation is that countries growing fast are those with higher
rates of investment (see Figure A.1 for the global relationship). In this context, it is desirable to
explore investment dynamics in the Horn of Africa. Although investment data are scanty in most of
the countries of the sub-region, analysis is based on the most accurate and comparable data that is
obtained from World Bank database. The data shows that the sub-region lags behind the rest of the
developing world in terms of investment as a percent of GDP (Table 3.2). The thirty years average
in the Horn of Africa is as low as 18 percent compared to 35 percent and 19 percent in developing
East Asia and the Pacific, and sub-Saharan African countries, respectively. A key feature of the
investment component in the national accounts is that it is the most volatile. The coefficient of
variation in Table 3.2 shows that investment in the Horn of Africa is not only low, but among the
most volatile, next to developing East Asia and the Pacific sub-region.
Table 3.2: Investments in the developing world (in percent of GDP)
Region 1981-
1985
1986-
1990
1991-
1995
1996-
2000
2001-
2009 Average
Coef. of
Variation
The Horn of Africa 16.7 17.0 17.2 17.5 21.7 18.0 196.3
East Asia & Pacific (developing only) 32.8 34.1 38.0 33.9 36.5 35.1 221.2
Sub-Saharan Africa (all income levels) 22.0 17.9 17.2 17.7 19.4 18.9 153.1
Sub-Saharan Africa (developing only) 22.0 17.9 17.1 17.7 19.3 18.8 154.2
Sources: Computed from World Bank Development Indicators

11
0
5
10
15
20
25
30
Ethiopia
0
10
20
30
40
Djibouti
0
5
10
15
20
25
30
Kenya
0
10
20
30
40
50
Eritrea
0
5
10
15
20
25
30
35
Sudan
0
5
10
15
20
25
30
Uganda
Despite the general features of investment at the sub-region level, it is quite variable and different
across the countries (Figure 3.2). There is a general long-run upward trend in all countries except
in Eritrea and Kenya, although a declining trend has been recorded in Sudan and Ethiopia since
2007. Djibouti is experiencing exceptionally high growth rate of investment, as can be seen in
Figure 3.2. Investment as percent of GDP is highly variable in Djibouti, Eritrea and the Sudan, and
relatively stable in Kenya.
Figure 2.2: Trends in investment in the individual countries of the Horn of Africa as % of GDP (1990-2010)
Source: Based on African Development Indicators

12
IV. Determinants of Investment and Growth
The preceding sections show that the Horn of Africa has been experiencing low investment and
poor economic growth performance. The causes of the region’s low investment and growth rates
are examined below to identify the true constraints. The growth diagnostics approach assumes that
if a constraint is binding then changes in that binding constraint should have some growth
consequences. Conversely, a factor is defined not binding if it has changed markedly with no growth
effect.
The study postulates that in the Horn of Africa, economic activities must be constrained by at least
one of the following three factors: (i) financing related problems, (ii) the social return to economic
activity, and/or (iii) the private appropriability of returns. The hypothesis is that these countries
have not developed because of undesirable effects of either or all of the above three factors.
The most important step in providing a workable policy recommendation is to identify which of the
above factors characterize the sub-region by comparing economies in the sub-region with the rest
of the developing world. Finance related problems are related to high cost of finance, low saving
and poor intermediation. If the sub-region is constrained by high cost of finance, that can be
identified by high real interest rates, low savings, and high current account deficit, which can lead
to difficulties to borrow from foreign sources. In economies which are constrained by finance, an
exogenous increase in investible funds, such as foreign aid and remittances, can spur investment
and other productive economic activities. Policies that are directed to encouraging savings and
promoting productive investments can also help.
Low returns on investment could be attributed to low social returns or low private appropriability.
The sub-region is labeled as social return constrained if there are some diagnostic signals of poor
human capital, or inadequate infrastructure. If human capital is a serious constraint in the Horn of
Africa, one would expect the returns to education or the skill premium to be high vis-à-vis
comparable regions. Moreover, various indicators of human capital will be inferior as compared to
counterpart sub-regions. If infrastructure is the problem, one would observe various bottlenecks on
access to markets.
Low private returns could be as a result of low private approprability, associated with government,
or market failure. The Horn of Africa sub-region is constrained by low private approprability if
there are macroeconomic instabilities in the form of huge inflation, deficits, and unemployment,
and the business environment is poor owing to high tax rates and corruption, among others.
Finance related issues
The development of the financial sector is crucial for investment and growth by lubricating the real
sectors of the economy. Countries with advanced financial sector tend to be richer, showing the role
of finance for accelerating a sustained growth. The global association between various indicators of
financial sector development and economic growth is presented in Figures A.2-A.4 in Annex I.

13
Recognizing the role of finance for growth, policy makers in the Horn of Africa have introduced
substantial reforms in the financial sector of their respective economies over the past few decades.
The financial sector has been liberalized and controls eased, with foreign investors allowed to
operate in the sub-region, with the exception of Ethiopia. Despite some progress over the past few
decades, the financial sector has lots of unresolved problems, and in this context, the financial
sector contributed to the divergence of the Horn of Africa from the rest of the world. This can be
established by examining how well the financial sector is doing in the region relative to others in
terms of access to finance, cost of finance, and size of savings.
Access to finance as a constraint
Various growth analysis have underlined that countries that achieved strong growth are those with
better access to financial services. Following such theoretical and empirical studies, access to
finance as a constraint for growth in the Horn of Africa is examined by assessing the adequacy of
domestic and external finance.
Access to domestic finance: Countries in the Horn of Africa have one of the least developed local
financial systems, and access to domestic finance is constrained. Access to domestic finance can be
examined in terms of the size of domestic credit provided to the private sector. In this regard, the
Horn of African countries are marginally inferior as compared to developing East Asia and the
Pacific, and sub-Saharan Africa countries, with private sector credit to GDP ratio of only 17 percent
(Table 4.1). Despite the low regional average, Djibouti, Eritrea and Kenya are in a better position.
Another indicator for the domestic access to finance is domestic credit provided by the banking
sector. With respect to this, the sub-region has an unsatisfactory level of credit from the banking
sector. Domestic credit from banks in the Horn of Africa is just 29 percent over the last ten years for
which data are available, as compared to 124 percent and 86 percent in the developing East Asia
and the Pacific, and sub-Saharan African countries, respectively. At country level bank credit to the
private sector performed at relatively better levels in Eritrea, Ethiopia and Kenya.
Table 4.1: Domestic credit to the private sector (as percent of GDP)
Domestic Credit to the Private
Sector (percent of GDP)
Total Domestic Credit Provided by
the Banking Sector (percent of GDP)
Country/Region 1981-90 1991-00 2001-09 1981-90 1991-00 2001-09
Djibouti ... 42.7 22.8 ... 47.8 27.4
Eritrea ... 33.2 27.2 ... 104.6 130.5
Ethiopia 11.0 14.6 20.7 35.8 40.4 46.1
Kenya 30.5 30.2 27.7 50.0 47.9 40.2
Somalia ... ... ... ... ... ...
Sudan 10.0 2.6 8.4 30.2 104.9 13.8
Uganda 1.9 4.6 9.3 14.5 8.3 8.8
The Horn of Africa 17.2 16.0 17.1 38.1 57.9 29.2
East Asia & Pacific (developing only) 57.4 90.2 103.7 62.6 95.8 123.6
Sub-Saharan Africa (all income levels) 37.9 55.8 58.9 58.0 77.1 85.2
Sub-Saharan Africa (developing only) 37.9 55.9 59.6 58.0 77.1 86.3
Sources: World Bank Development Indicators

14
Access to external finance: Another possibility for the countries of the Horn of Africa to finance
investment is by international finance. Access to external sources of finance by the sub-region is
limited owing to the low incomes in these countries, fragmented financial sectors, and rudimentary
domestic financial markets. The sources of external finance can be broken down to Foreign Direct
Investment (FDI), Overseas Development Assistance (ODA) and workers’ remittances. As shown in
Table 4.2, ODA and remittances are by far the larger sources of external finance in the Horn of
Africa amounting to 6.5 percent and 4.1 percent of GDP. Remittances (as percent of GDP) are in a
better condition compared to other developing regions in the world. At the country level, Ethiopia
and Eritrea are the lowest recipients of workers’ remittances. ODA inflows as a percent of Gross
National Income are much better in the Horn of Africa, owing to the low level of development and
the high demand for aid in the sub-region. Unlike remittances, Ethiopia and Eritrea are the main
destinations of ODA within the Horn of Africa countries.
In comparison to other sub-regions, FDI as percent of GDP is very low in the Horn of Africa,
although it improved in 2001-09 (Table 4.2). The current rise of FDI is as a result of the return of
peace and stability in member countries of the sub-region. Djibouti and the Sudan are emerging as
growing destinations of FDI in the sub-region.
Table 4.2: FDI, ODA and workers’ remittances in the Horn of Africa
Net FDI Inflows
(percent of GDP)
Net ODA Received
(percent of GNI)
Worker’s Remittances
(percent of GDP)
Country /Region
1981-
1990
1991-
2000
2001-
2009
1981-
1990
1991-
2000
2001-
2009
1981-
1990
1991-
2000
2001-
2009
Djibouti ... 0.5 9.1 ... 19.5 11.5 ... 2.6 3.2
Eritrea ... 9.5 0.7 ... 18.1 23.7 ... ... 0.0
Ethiopia ... 1.0 2.9 5.8 9.7 15.2 0.1 0.3 1.0
Kenya 0.4 0.6 0.5 8.7 7.6 4.2 1.0 2.5 4.6
Somalia -0.4 ... ... 51.3 ... ... 0.7 ... ...
Sudan 0.03 1.2 6.3 7.1 3.8 4.4 2.0 3.0 5.2
Uganda -0.02 1.9 4.4 7.2 15.8 13.8 0.0 0.8 4.7
The Horn of Africa 0.1 1.1 3.8 5.2 7.9 6.5 1.0 1.8 4.1
East Asia & Pacific (developing only) 0.9 3.5 3.3 1.0 0.8 0.3 0.5 0.7 1.4
Sub-Saharan Africa (all income
levels) 0.5 1.5 3.2 4.4 5.4 5.1 0.6 1.0 1.7
Sub-Saharan Africa (developing only) 0.5 1.5 3.1 4.4 5.4 5.1 0.6 1.0 1.7
Sources: World Bank Development Indicators
The cost of capital as a constraint
Banks constitute the main financial institutions in the Horn of Africa and financial markets are not
well developed. Banks dominate the financial sector in the sub-region, and short-term credit
characterizes financial products in these countries. The short-term nature of the bank credit is a

15
function of the short-term nature of the deposits in financial institutions27. Capital markets are not
developed, or are non-existent in most countries of the Horn of Africa. In this weak financial sector
a binding constraint for growth could be the high cost of financing a project. The cost of capital is
examined by looking at the level of real lending rates. As shown in Table 4.3 real lending interest
rates in the sub-region are among the lowest in Africa showing that the sub-region is clearly a low
cost finance area. The real lending rate ranges from -4.6 percent in Ethiopia to 13.3 percent in
Uganda on average for the period 2001-09.
Table 4.3: Real interest rates
Country 1981-85 1986-90 1991-95 1996-2000 2001-09 Average
The Horn of Africa
Djibouti ... ... ... ... 6.0 6.0
Eritrea ... ... ... ... ... ...
Ethiopia -10.6 4.7 -2.0 9.6 -4.6 -0.6
Kenya 0.8 4.8 2.3 19.1 4.1 6.2
Somalia ... ... ... ... ... ...
Sudan ... ... ... ... ... ...
Uganda -58.7 -94.0 -4.2 16.5 13.3 -25.4
Other African
countries
Malawi 4.9 1.5 -5.5 13.4 24.8 7.8
Nigeria -5.8 -8.6 -25.5 7.2 6.5 -5.2
Rwanda 7.0 10.6 21.8 11.7 8.1 11.8
Senegal 2.9 14.1 17.3 ... ... ...
South Africa 4.8 1.3 6.5 12.1 6.9 6.3
Tanzania -17.8 -9.7 -4.9 12.6 8.9 -2.2
Sources: World Bank Development Indicators
We can also test for the cost of financing in the Horn of Africa sub-region by examining the size of
interest rate spread.28 Figure 4.1 shows that the nominal spread is comparable to other countries.
The interest rate spread is as high as 22 percent in Malawi and 15 percent in Kenya, the country
with the highest spread among Horn sub-region. The low cost of finance in the face of constrained
access to financial services as reflected by other variables discussed above may indicate that
interest rates are highly controlled. Hence, interest rates in the Horn of Africa are of limited help to
conclude that credit scarcity is a binding constraint.
27 A detailed presentation of the nature of loans by banks in the Horn of Africa countries is presented in HESPI (2009). 28 Interest rate spread is the difference between average lending and deposit rates.

16
Figure 3.1: Interest rate spread in the Horn of Africa (in percent)
Sourced: Based on World Bank Development Indicators on 18 developing countries data
The x-axis with 1-6 corresponds to the five-year period average from 1981-2009
Low savings as a constraint
Various growth theories underline the importance of savings in the growth process. Cross-country
growth studies using saving rates as one of the determinant factors for growth established that
countries with low saving tend to have low investment and low growth rates (such a relationship is
also observed in Figure A.3). Thus, it is imperative to build on the fact that adequate domestic
saving is required to sustainably finance private and public investment projects. The gross saving as
percentage of GDP for the Horn of Africa ranges from 18.8 percent in Kenya to 6 percent in Sudan
(Table 4.4). The region’s average of 13.5 percent is significantly less than that of developing East
Asia & Pacific and sub-Saharan Africa, which are 36.5 percent and 16.3 percent, respectively.
Although low in comparison with other regions, the saving rate in the Horn of Africa has improved.

17
Table 4.4: Gross domestic saving
Country/Region 1981-85 1986-90 1991-95 1996-2000 2001-09 Average
Djibouti ... ... 11.8 9.8 24.7 15.4
Eritrea ... ... 46.1 16.5 ... ...
Ethiopia 12.0 14.6 14.7 16.9 18.0 15.3
Kenya 17.5 18.7 25.5 17.0 15.3 18.8
Somalia 13.4 26.1 ... ... ... ...
Sudan 3.3 3.5 3.0 6.5 13.4 6.0
Uganda 6.5 5.2 12.5 18.1 18.0 12.1
The Horn of Africa 10.9 12.1 15.4 14.0 15.7 13.6
East Asia & Pacific (developing only) 32.1 34.1 37.7 36.5 42.2 36.5
Sub-Saharan Africa (all income
levels) 18.3 17.4 14.9 15.4 15.8 16.3
Sub-Saharan Africa (developing
only) 18.3 17.4 14.9 15.4 15.8 16.3
Sources: Prepared from World Bank Development Indicators database
As the low domestic saving is a potential constraint on the Horn of Africa’s growth, it is important
to understand the causes of low saving. Low domestic saving in developing countries could be
attributed to multiple economic factors that include the low level of per capita income, limited
productive employment, undeveloped financial saving instruments and high foreign debt and
current account deficit. External distress factors and economic instability in general could lead to
leakages of domestic financial resources and capital flight that limit domestic saving. Data from
World Bank’s Development Indicators database show that the Horn of Africa sub-region has a very
high foreign debt ratio and current account deficit. The current account deficit as a percent of GDP
reached 9.1 percent as compared to a surplus of 4.3 percent for developing East Asia and the Pacific
countries in 2001-09 (Table 4.9).
Another test of whether the Horn of Africa is savings constrained is to examine the link between
investment and saving. The strong correlation coefficient of 0.64 observed between investment as a
percentage of GDP and national saving as percentage of GDP (Table 4.5) and the low absolute level
of saving support the hypothesis that saving constitutes a binding constraint to investment and
growth in the Horn of Africa.

18
Table 4.5: Investment and domestic saving (in percent of GDP)
Country/Region 1981-85 1986-90 1991-95 1996-2000 2001-09
Djibouti Investment ... 14.1 11.4 9.6 20.0
Saving ... ... 11.8 9.8 24.7
Eritrea Investment ... ... 18.1 32.1 22.7
Saving ... ... 46.1 16.5 ...
Ethiopia Investment 14.3 16.6 14.5 19.9 22.8
Saving 12.0 14.6 14.7 16.9 18.0
Kenya Investment 22.2 24.1 19.3 16.0 18.1
Saving 17.5 18.7 25.5 17.0 15.3
Somalia Investment 26.7 25.6 ... ... ...
Saving 13.4 26.1 ... ... ...
Sudan Investment 14.2 10.0 17.7 16.3 24.4
Saving 3.3 3.5 3.0 6.5 13.4
Uganda Investment 7.8 10.6 14.7 18.8 21.5
Saving 6.5 5.2 12.5 18.1 18.0
The Horn Investment 16.7 17.0 17.2 17.5 21.7
Saving 10.9 12.1 15.4 14.0 15.7 Sources: World Bank Development Indicators
Constraints on social returns to capital
It is also assumed that the low level of investment is due to low returns to capital. It is argued in
empirical literatures that low private returns could be either due to low appropriability of returns
or low social returns. It may be the case that poor infrastructure and human capital cause the social
returns to be low in the Horn of Africa. Below, we examined the state of infrastructural
development and human capital in the sub-region, and concluded that low social return is a
defining characteristic of the Horn of Africa.
Infrastructure as a constraint
The relationship between infrastructure and economic growth has been studied extensively, and
poor infrastructure is identified by many as a binding constraint for doing business and for
economic growth. To support this statement a global relationship between access to infrastructure
and GDP per capita is shown in Figure A.4. It shows that income is correlated with access to
infrastructure. Moreover, Escribano et al observed that infrastructural limitations depress
productivity of African firms by around 40 percent.29 Infrastructure provision is inherently difficult
in the tropics with its disbursed population and varied topography making the Horn of Africa a
structurally high-cost region for infrastructure development.
29
Escribano et al, 2008

19
The World Bank Development Indicators data reveals that, in 2004, the road density per 100
square kilometer of land area was as low as 3 kilometers in Ethiopia, 11 in Uganda and 17 in Kenya,
as compared to 21.8 in developing East Asia and the Pacific. The low road density in the sub-region
is due partly to inadequate finances, the settlement patterns and to its geographic makeup. The
same source shows that the percentage of paved roads in total roads is low in the sub-region: 45
percent for Djibouti in 2001, 21 percent for Eritrea in 2001, 12.8 percent for Ethiopia in 2007, 14
percent for Kenya in 2004, 12 percent for Somalia in 2001, 36 percent for Sudan in 2001, and 23
percent for Uganda in 2003.
Table 4.6 presents the comparison of overall access to soft infrastructures in the Horn of Africa and
selected regions. According to comparative data in the World Development Indicators database,
internet and telephone coverage in the Horn of Africa is lower than any other country groupings.
More specifically, internet users are 2 percent of the Horn of Africa population, compared to a
penetration of 9 percent and 2.7 percent for East Asia and the Pacific and sub-Saharan Africa,
respectively. Telephone lines are available only to less than 1 percent of the population in the Horn
sub-region compared to 18 percent for developing East Asia and the Pacific.
Table 4.6: Access to infrastructure in the Horn and selected regions (as percent of total
population)
Country/Region
Broad band
Internet
Internet
Users
Mobile
Users
Telephone
lines
Averages (2001-09)
Djibouti 0.06 1.05 5.28 1.44
Eritrea … 1.60 0.83 0.85
Ethiopia 0.00 0.21 0.75 0.77
Kenya 0.02 4.38 15.30 0.84
Somalia … 0.76 4.67 1.00
Sudan 0.03 3.76 8.86 1.60
Uganda 0.00 2.21 7.72 0.33
The Horn Average (weighted) 0.01 2.07 6.35 0.90
East Asia & Pacific (developing only) 1.93 9.05 27.99 18.33
Sub-Saharan Africa (developing only) 0.04 2.65 13.49 1.58
Sources: World Bank Development Indicators
Access to power is also an important economic infrastructure that can adversely impact or
stimulate growth. With regard to access to power, the Horn of African countries are lagging behind
as compared to the rest of sub-Saharan Africa, and are much behind the rest of the developing
world (Figure 3.2). Per capita electric power consumption in 2008 was 43, 96 and 156 kwh in
Ethiopia, Sudan and Kenya respectively; while in developing East Asia and the Pacific and sub-
Saharan Africa, it was 1964 and 536 kwh respectively.

20
Figure 3.2: Electric power consumption in Kilowatt hours (kwh) per capita in 2008
Sources: African Development Indicators
Human capital/education as a constraint
Conventional growth theories incorporate human capital as an important predictor of economic
growth. According to the growth models, countries that attain high literacy rates achieved
improved economic growth. A similar observation based on cross-country data is observed in
Figure A.6 in Annex I. To assess if human capital in the form of low level of education is responsible
for the poor growth performance in the Horn of Africa, the study reviews the level of education in
the sub-region in comparison with other sub-regions. The comparison is in terms of school
enrollment and business enterprises access to skilled workers. Education is a binding constraint in
this part of the world, as school enrollment and access to skilled workers are lower than other
developing regions.
Over the period 2001-09 the Horn of Africa had low levels of secondary and tertiary education,
leading to one of the lowest levels of human capital in the world. Primary level education was not
significantly lower than in Sub-Saharan Africa, but the gap in attainment of secondary and territory
education between the Horn of Africa and the rest of the developing world is high. Secondary
education coverage is 18 percent in the Horn of Africa sub-region, and tertiary level education
reached only 2 percent of the appropriate age group compared to 18 percent in developing East
Asia and the Pacific countries, and 5 percent in developing sub-Saharan Africa (Table 4.7).
0.0
300.0
600.0
900.0
1200.0
1500.0
1800.0
2100.0
Ethiopia Sudan Kenya Sub-SaharanAfrica
East Asia &Pacific

21
Table 4.7: Enrollment rates for primary, secondary and territory education
Country / Region Average of 2001-09
Primary Secondary Territory
Djibouti 27.2 18.2 1.7
Eritrea 43.8 23.1 1.3
Ethiopia 40.4 18.5 2.7
Kenya 88.8 40.1 3.1
Somalia … … …
Sudan 45.45 … …
Uganda 56.8 16.6 3.2
The Horn of Africa 53.5 17.8 2.1
East Asia & Pacific (developing only) 99.2 … 17.5
Sub-Saharan Africa (developing only) 57.90 … 5.4
Sources: World Development Indicators
The role of education in the growth process is to provide adequately trained labor force for
business establishments. The relative position of the Horn of Africa countries in this regard can be
compared using World Bank Enterprise Survey database. The data shown in Table 4.8 indicates
that the proportion of unskilled workers is marginally higher in the sub-region. Nevertheless, a very
small proportion of firms consulted for the World Bank Enterprise survey considered labor skill
level as a major constraint on doing business, contradicting the higher proportion of unskilled
workers. The latter could be due to the low skill intensive nature of economic activities in the Horn
of Africa or the low relative weight attached by respondents to skill shortages as compared to other
challenges of doing business in the sub-region.
Table 4.8: Access to skilled workers for business establishments
Region Percent of unskilled workers
Percent of firms identifying
labor skill level as a major
constraint
Developing Asia and Africa 39.2 22.3
The Horn of Africa 41.8 9.4
Sources: World Bank Enterprises Survey
Constraints on appropriability of returns
Approprability is related to whether it is easy for people to benefit from the returns of their
activities. The return from investment determines the rate of investment. Investment in the Horn of
Africa could be restricted because investors do not expect to appropriate the high social returns
that their investments generate. This could happen through a number of channels including
government failures such as macroeconomic risks (external and internal deficits, and inflation),
poor business environment (high tax rates, corruption and other governance indicators) and
market failures such as inputs and factor market failures.

22
Macroeconomic risks and instability as a constraint
The macroeconomic state provides both opportunities and constraints to economic growth, as
instability can deter the growth process. Instability attributable to large domestic and external
imbalances caused by inappropriate fiscal and monetary policies lead to inflation, loss of
international reserves, and large depreciation of the exchange rate. Such imbalances stand as
constraints on investment, savings and overall economic growth in the Horn of Africa and
elsewhere. Accordingly, the indicators of external imbalances (current account deficit) and
domestic instability such as fiscal deficits, inflation and unemployment rate are examined. The data
on these indicators show that the macroeconomic environment in the sub-region has changed
significantly over the past couple of decades and has affected entrepreneurial efforts and the
investment climate differently. While there is a general improvement in macroeconomic stability,
the sub-region faces mixed results as compared to other countries and sub-regions.
On the basis of the above macroeconomic indicators, the sub-region experienced mixed states of
macroeconomic stability and instability in 1991-2009. It recorded high levels of current account
deficits as compared to developing Asia and sub-Saharan Africa countries (Table 4.9). In the Horn of
Africa the external current account deficit reached 9 percent of GDP in 2000-09, and was higher by
6 and 13 percentage points than in developing Asia and sub-Saharan Africa, respectively. During the
same period, inflation in the Horn of Africa was higher than in developing Asia and only marginally
lower in relation to that of all sub-Saharan countries. The inflation rate gradually moderated and
trended down to single digit levels in 2001-09.
Table 4.9: Indicators of macroeconomic stability and instability
Years
Current Account Balance
(percent of GDP)
Inflation Rate (percent)
Horn of
Africa
Low Income
(Developing
Asia)
SSA
Horn of
Africa
Low Income
(Developing Asia)
SSA
1991-95 -5.8 -1.5 -2.8 39.7 11.1 40.7
1996-2000 -5.1 0.9 -2.6 14.8 5.3 18.9
2001-09 -9.1 4.3 -2.6 8.4 3.9 9.8
Sources: World Bank Development Indicators
The unemployment rate and fiscal deficits in the Horn of Africa countries are compared in Figure
4.3 with those of many countries in the world. The Horn of Africa sub-region’s weighted average
fiscal deficit was at 4.2 percent per year in 1991-2009, while global average fiscal deficit was 4.4
percent. The unemployment rate in the Horn sub-region was among the highest in the world.

23
Figure 3.3: Unemployment and fiscal deficits in the Horn of Africa (>210 countries included)
Sources: World Bank Development Indicators
Business environment and microeconomic risks as constraints30
The global observation is that countries that have a better environment for doing business tend to
grow faster than countries which do not. The simple cross section relationship presented in Figure
A.7 shows a positive relationship between doing business score and economic performance.
Microeconomic risks include high tax rates, poor governance, high corruption levels and other
problems that constrain doing business. High tax rates on business impact on companies’
profitability and discourage business expansion and growth. The data on corporate tax rates show
that profit taxes in 2006-09 were stable and not too high in the Horn of Africa as compared to a set
of low income African and Asian countries (Table 4.10). The rate is lower by about 20 percentage
points indicating that tax rates are not binding constraints for doing business and investment in the
Horn sub-region. A low tax rate regime may not always be good, as there is a need to develop public
infrastructure in order to promote long-term growth. Table 4.10 also shows the average percentile
rank of governance indicators for the Horn of Africa and for developing Africa and Asian countries
in 2006-09. The table shows that, in terms of governance, the sub-region is comparable to the rest
of the developing world.
30 Indicators of doing business that imply economic growth or retardation are in Annex I, Figure 8.

24
Table 4.10: Total tax rates and governance indicators
Year
The Horn of Africa31 Developing Africa and Asia32
Total tax rate
(percent of
profit)
Governance indicator
(percentile rank)
Total tax rate
(percent of profit)
Governance
indicator (percentile
rank)
2006 49.9 23.7 73.2 24.8
2007 49.9 27.4 75.8 25.6
2008 50.7 27.4 75.0 26.0
2009 50.0 26.3 74.8 25.6
2010 50.3 ... 74.0 ...
2011 50.3 ... 71.5 ...
Source: World Bank Enterprises Survey, and World Bank Development Indicators
Although general perceptions and global statistics, such as Transparency International rankings
indicate accountability and transparency of financial management are low in the Horn of Africa,
corruption does not seem to be a critical constraint of doing business in the sub-region. The average
of the proportion of firms identifying corruption as a constraint for doing business, according to the
World Bank Enterprise survey, is 4.8 percent in the Horn of Africa as compared to 7.3 percent in the
reset of the world. The percent of firms identifying corruption as a constraint were 2.5 percent in
Uganda, 2.9 percent in Ethiopia, and 9.6 percent in Kenya, while the average for the whole of Africa
was 6.2 percent. Overall, the average rank for doing business for the Horn of Africa countries is 126
which is lower than the average rank of 132 for 40 developing Asian and African countries.
Market failure as a constraint
There are clear indications that the Horn of Africa is lagging behind the rest of the developing world
in market development, owing to imperfect product and factor markets. Generally, markets tend to
be fragmented in low income countries due to infrastructural problems. Other market development
constraints include limitations on access to finance, and to land, as well as labor regulations
problems. In this context the study assesses how market failure stands as a constraint for doing
business and growth in the Horn sub-region.
Of the assessed market imperfection indicators, access to finance is the main obstacle for doing
business in the sub-region, as indicated by the World Bank World Enterprise Survey (Table 4.11).
The average size of firms in the Horn sub-region declaring access to finance as a constraint is 11.6
percent compared to 33 percent in Ghana and 28.3 percent in Senegal. Also, in comparison to other
selected African countries, more firms in the Horn of Africa declared access to land as an important
bottleneck in investing in the sub-region; 6.7 percent in the Horn of Africa vis-a-vis average of 5.6
31
We include data on four Horn of Africa countries (Eritrea, Ethiopia, Kenya and Uganda) for which we get data. 32
The data is average of 40 developing Africa and Asia counties based on the World Bank doing Business
Classification.

25
percent in other African countries. The survey result shows that labor market regulations are not
exceptionally acute in the sub-region, even though labor regulation scores in Ethiopia and Kenya
are higher than the regional average.
Table 4.11: Factor market failures
Country/Region
Percentage of firms identifying the following as major
obstacle
Access to Finance Access to Land Labor Regulations
The Horn of Africa 11.6 6.7 2.9
Eritrea 0.0 17.0 0.2
Ethiopia 18.8 16.6 4.0
Kenya 13.5 1.7 4.3
Uganda 6.7 0.8 1.2
Other Africa
Ghana 33.1 3.8 1.7
Malawi 28.3 2.6 12.6
Senegal 12.2 11.0 4.8
Tanzania 9.8 2.6 4.8
Sources: World Enterprises Survey, the World Bank

26
V. Findings and Policy Implications
a. Findings
Growth has been disappointing in the Horn of Africa for many decades, leading to low levels of
economic and social development. The seven countries that comprise the Horn of Africa region are
at different stages of development. However, the region includes some of the least developing
countries in the world and is the poorest region as a whole. Changing the growth history and
improving human development levels require relaxing the binding constraints on economic growth.
The growth diagnostics approach utilized in this study provides a methodology to assess the
economic performance of specific countries or regions. The approach is based on identifying the
binding constraints on economic growth, and in particular, places highest priority on the most
binding constraints. It focuses national reforms and the policy response as closely as possible on
the source of the distortion. The growth diagnostics approach followed in this study indicates that
the main binding constraints of growth in the Horn of Africa include limited access to finance, low
social returns, broad instability and market failure, as follows:
Finance related issues
Access to finance, both domestic and external, is limited in the Horn of Africa as compared
to other developing regions. (binding)
Domestic saving rates are very low in the Horn of Africa, owing to low levels of income and
limited access to financial saving products. (binding)
Cost of capital is moderate in the Horn of Africa sub-region. Real interest rates and interest
rate spread are not very high in the sub-region. The low level of cost of capital in the face of
limited access to finance and poor saving mobilization imply that financial markets are
repressed in the sub-region. (not binding)
Social returns
Infrastructure limitations are prevalent in the Horn of Africa sub-region. The very
low access to infrastructure services generates low social returns. (binding)
Human capital and access to education and skill development are very limited in the
sub-region. The literacy rate in the Horn of Africa is very low and access to skilled
workers is limited for business enterprises. (binding)
Approprability
Government policy failures have been a significant constraint for high and sustainable
economic growth in the Horn of Africa sub-region. Analysis of macroeconomic stability

27
shows that there are weak external accounts as demonstrated by large current account
deficits and high unemployment rates in the sub-region. (binding)
Governance issues are a factor in retarding economic progress but not a principal
constraint. The business environment (the microeconomic context) is comparable with
other developing countries, showing that it does not exert a peculiar challenge to growth in
the sub-region. (not binding)
Market limitations are of significant concern and credit access is a principal constraint. Also
access to land is seen as an acute challenge for doing business in the Horn of Africa.
(binding)
b. Policy Implications
Finance related problems and low social returns are the main binding constraints on economic
growth in the Horn of Africa, implying a direct important role for government policy reforms.
Countries should be committed to reform their financial sector and public services. The financial
sector is extremely underdeveloped in the sub-region, making financial intermediation weak.
Domestic savings mobilization is also limited due to low income levels and underdeveloped
financial intermediation. This implies that there is a need to introduce vibrant domestic financial
institutions: commercial banks, development banks and non-bank financial institutions.
Governments should take the lead in reforming the sector and specifically in removing regulatory
bottlenecks. In economies which are constrained by finance, an exogenous increase in investible
funds, such as foreign aid and remittances, can significantly spur investment in productive
economic activities.
On the challenges on social returns, the education sector should be built to produce a skilled labor
force. Although governments have an indispensible role in this regard in terms of direct provision
of education services, the private sector also has a role to play in producing a skilled labor force.
Building human skills is therefore the most vital policy recommendation in order to achieve high
sustainable growth.
The public sector has to invest in the provision of both hard (roads, railway and other transport
services) and soft (information communications technology facilities) infrastructure. Adequate
efforts should be made to mobilize the required finance for infrastructure development from both
domestic and external sources. The growth elasticity/multiplier of improved access to finance and
essential public services, including education and infrastructure, is paramount.
The results of this study have also implications for the involvement of external development
partners of the member countries of the region. In order to break the prolonged poor growth, low
income and poverty in the Horn of Africa, development partners of the sub-region need to channel
their financial and technical assistance to the most binding constraints. Aid for education and
infrastructure should be of higher priority for supporting the Horn of Africa sub-region. A more

28
targeted financial sector capacity building should also be another intervention by the international
financial institutions.
This study suggests some possible areas of future work, specifically the investigation of the right
sequencing of reforms and policy interventions within the most binding constraints. Given the
scarcity of resources, countries in the sub-region may not find it possible to simultaneously and
effectively address their financial sector, education sector and infrastructure. It is not feasible a
priori to conclude that the financial sector should develop first before the infrastructural sectors
grows in all countries of the sub-region. However, all indications are that the critical nature of
augmented financial resources would also enable the sub-region to address economic and social
infrastructure development.
Any further attempt to uncover the binding constraints of growth in the Horn of Africa should be
extended to incorporate the role of governments in the growth diagnostics approach and how to
make growth pro-poor. Such studies should learn from the experiences on aid for trade approach of
trying to loosen constraints of trade expansion and economic growth.33
33
See WTO, 2006
29
References
Aghion, P. and Howitt, P. (1998) “Endogenous Growth Theory”, The MIT Press, Cambridge, England.
Alemayehu Geda, Abebe Shimeles and John Weeks (2008) Growth, Poverty and Inequality in
Ethiopia: Which Way for Pro-poor Growth? Journal of International Development, J. Int. Dev.
(2008), (www.interscience.wiley.com) DOI: 10.1002/jid.1517.
Arbache, S. and Page, J. (2007) “Patterns of Long Term Growth in Sub-Saharan Africa”, The World
Bank.
Calvo, S. (2006) Applying the Growth Diagnostics Approach: the Case of Bolivia, the World Bank.
Cerra, V. and Saxena, S. (2007) “Growth dynamics: The Myth of Economic Recovery”, BIS Working
Papers, No 226.
Collier, P. (2007) “Africa’s Economic Growth: Opportunities and Constraints”, Africa Development
Indicators, Center for the Study of African Economies, Department of Economies, Oxford University,
UK.
Dobronogov, A., & Iqbal, F. (2005), Economic Growth in Egypt: Constraints and Determinants,
October 2005.
Easterly, W. (2002) Growth in Ethiopia: Retrospect and Prospect, Center for Global Development,
Institute for International Economics, 2002.
ECA (2003) Economic Commission for Africa (2003): Economic Report on Africa 2003: Accelerating
the Pace of Development, at: http://www.uneca.org/era2003/.
Emerta, A. (2009) The Empirics of Growth, Poverty and Inequality in Sub-Saharan Africa, Ethiopian
Economic Policy Research Institute, Working Paper, No.1/2009.
Escribano, A., Guasch, J. L. and Pena, J. (2008) Impact of Infrastructure Constraints on Firm
Productivity in Africa. AICD, Working Paper, World Bank, Washington, D.C.
Felipe, J., & Usui, N. (2008) Rethinking the Growth Diagnostics Approach: Questions from the
Practitioners, retrieved on May 2, 2011.
Hallaert, J., & Munro, L. (2009) Binding Constraints to Trade Expansion: Aid for Trade Objectives
and Diagnostics Tools, OECD Trade Policy Working Paper No. 94.
Hausmann, R., Rodrik, D., & A. Velasco (2005) Growth Diagnostics, The John F. Kennedy School of
Government, Harvard University.
HESPI (2009) The Financial Sector in the IGAD Region, The Horn Social and Economic Policy
Research Institute, Occasional Paper, 2009.

30
IMF (2010) African Economic Outlook, International Monetary Fund (IMF).
Ianchovichina, E., (2009) Growth diagnostics, PRMED, World Bank, Joint Vienna Institute.
Kasekende, L., Ego, M., & Sebudde, R. (2004) The African Growth Experience: Uganda Country Case
Study, Prepared as a component of the AERC Collaborative Research Project, African Economic
Research Consortium, Working Paper 8, Nairobi, Kenya.
Kumar, S., & Pacheco, G. (nd) What Determines the Long run Growth in Kenya? Department of
Economics, Auckland University of Technology, New Zealand.
Lea, N. & Hanmer, L. (2009) Constraints to Growth in Malawi, The World Bank, Africa Region,
Southern Africa Poverty Reduction and Economic Management Unit, Policy Research Working
Paper 5097.
Nassanga (2006) Country/Organizational Report (Uganda-NOTU), International Training Center of
the ILO, Course A1-00601 (Trade Union Trading on Capacity Building for Organizing (06/03-
31/03/2006).
Odhiambo, W., Nyangito, H., & Nzuma, J. (2004) Sources and Determinants of Agricultural Growth
and Productivity in Kenya, Productive Sector Division, Kenya Institute for Public Policy, Research
and Analysis, KIPPRA Discussion Paper No. 34.
Qayyum, A., Khawaja, I., & Hyder, A. (2008) Growth Diagnostics in Pakistan, Pakistan Institute of
Development Economics, PIDE Working Papers.
Rao, B., Singh, R. and Nisha, F.(2006) “An Extension to the Neoclassical Growth Model to Estimate
Growth and Level Effects”, Munich Personal RePEc Archive.
Rodrik, D. (2004) “Growth Strategies”, John F. Kennedy School of Government.
Vaish, M.(2002) “Macroeconomic Theory”, Twelfth Revised Edition, Vikas Publishing House Pvt
Ltd.
Villa, S.(2005) “Determinants of growth in Italy: A Time-Series Analysis”, Dipartimento di Scienze
Economiche, Matematiche e Statistiche, University of Foggia.
Williamson, J. (2004) The Washington Consensus as Policy Prescription for Development
Senior Fellow, Institute for International Economics.
World Trade Organization (2006), Recommendations of the Task Force on Aid for Trade, Geneva:
WTO, WT/AFT/1.
World Bank World Development Indicators Database, World Bank.
World Bank Enterprise Surveys, World Bank.

31
Annex I
Figure A.1: Investment and GDP growth
Source: Based on World Bank Development Indicators Database
Note: A global observation in Figure A.1 shows that there is economically strong and
positive relationship between investment and growth.
Figure A.2: A global relationship between saving and investment (as percent of GDP)
Source: Based on World Bank Development Indicators Database
Note: The global relationship showed in Figure A.2 shows a positive and strong association
between saving and investment (as percent of GDP).
-3.0
-2.0
-1.0
0.0
1.0
2.0
3.0
4.0
5.0
6.0
0.0 5.0 10.0 15.0 20.0 25.0 30.0
GD
P g
row
th
Investment (% of GDP)
a cross section relatiohship between growth & invetsment
GDP growth = 0.74*Invest - 13.77 R² = 0.29
10.0
12.0
14.0
16.0
18.0
20.0
22.0
24.0
26.0
10.0 12.0 14.0 16.0 18.0 20.0 22.0 24.0
Inves
tmen
t (%
of
GD
P)
Saving rate (% of GDP)

32
Figure A.3: Gross domestic saving and GDP growth
Source: Based on World Bank Development Indicators Database
Note: The trend lines presented in Figure A.3 witnessed that the global time series level
of domestic savings (as percent of GDP) moves closer with the global average economic
growth.
Figure A.4: Access to infrastructure and GDP per capita
Source: Based on World Bank Development Indicators Database
Note: The cross-section relationship between access to infrastructure and GDP per
capita shown in Figure A.5 is statistically positive
-5.0
0.0
5.0
10.0
15.0
20.0
25.0
1981 1983 1985 1987 1989 1991 1993 1995 1997 1999 2001 2003 2005 2007 2009
Saving (% of GDP)
GDP growth
a long-run linear relationship of GDP growth = 1.14*Saving -21.68
R² = 0.51
0
20
40
60
80
100
120
0 20000 40000 60000 80000 100000
% o
f pav
ed r
oad
s
GDP percapita
a cross-section relationship GDP percapita= 0.001*Road
+ 45.59 R² = 0.0333
33
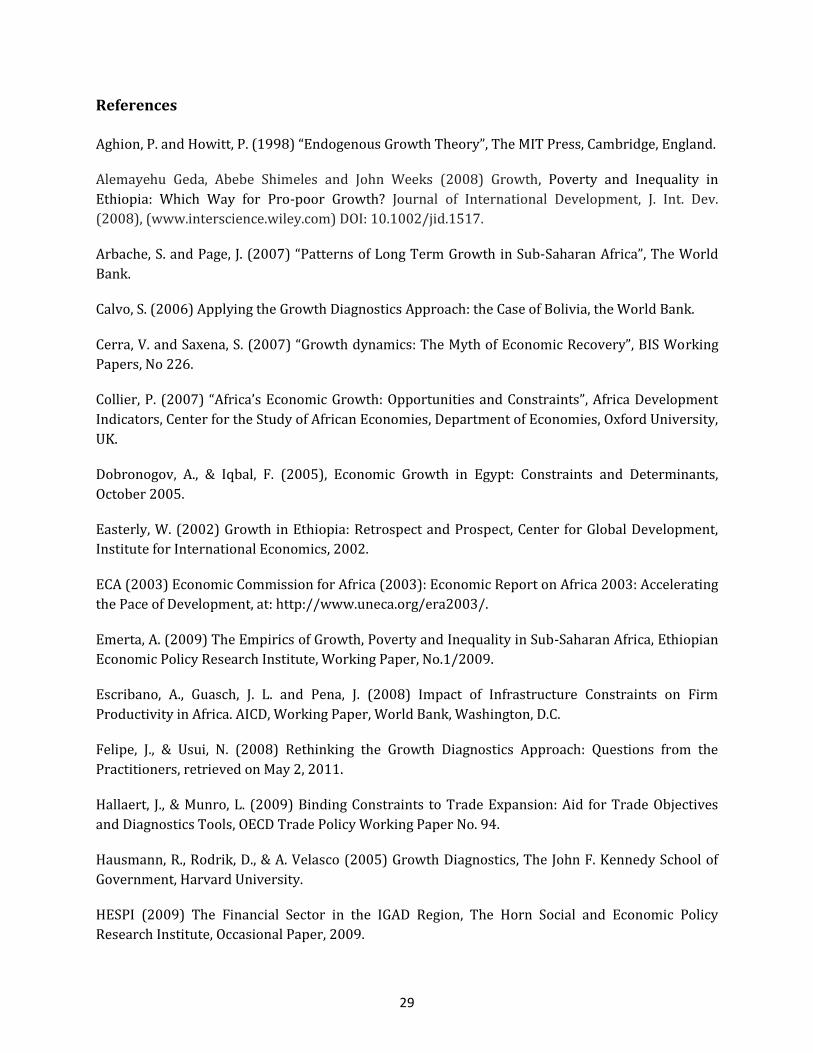
Figure A.5: Level of human resource development and per capita GDP
Source: Based on World Bank Development Indicators Database
Note: Figure A.6 supports the long-standing knowledge that countries with better level
of human resource development tend to have higher per-capita income.
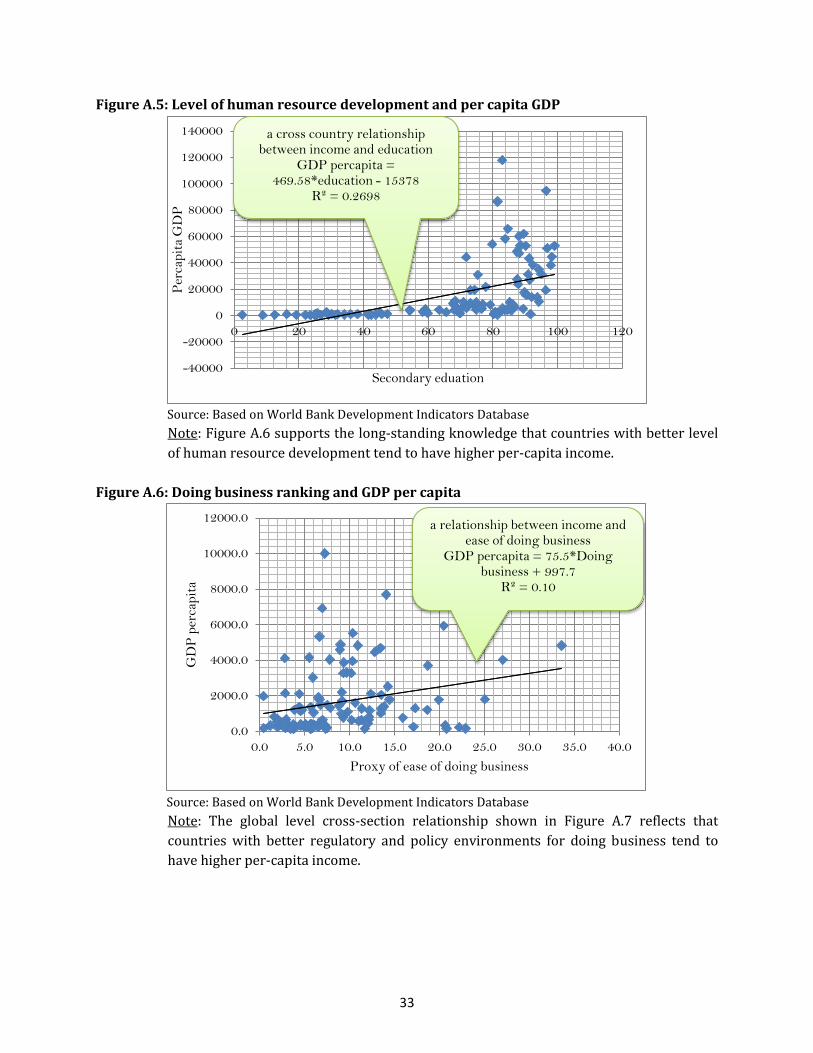
Figure A.6: Doing business ranking and GDP per capita
Source: Based on World Bank Development Indicators Database
Note: The global level cross-section relationship shown in Figure A.7 reflects that
countries with better regulatory and policy environments for doing business tend to
have higher per-capita income.
-40000
-20000
0
20000
40000
60000
80000
100000
120000
140000
0 20 40 60 80 100 120
Per
cap
ita
GD
P
Secondary eduation
a cross country relationship between income and education
GDP percapita = 469.58*education - 15378
R² = 0.2698
0.0
2000.0
4000.0
6000.0
8000.0
10000.0
12000.0
0.0 5.0 10.0 15.0 20.0 25.0 30.0 35.0 40.0
GD
P p
erca
pit
a
Proxy of ease of doing business
a relationship between income and ease of doing business
GDP percapita = 75.5*Doing business + 997.7
R² = 0.10