economic growth and the dynamics of wage determination · pdf filewage determination a micro...
TRANSCRIPT

A list of Working Papers on
the last pages
No. 170, 1986
ECONOMIC GROWTH AND THE DYNAMICS OF
WAGE DETERMINATION
a Micro Simulation Study of the
Stability Consequences of Deficient
Variation in Factor Prices and Micro
Structures
by
Gunnar Eliasson and Thomas Lindberg
This is a preliminary paper. Comments are welcome.
Revised version, August 1988

Revised: 1986, Aug.
Revised: 1986, Dec.
Revised: 1988, Aug
ECONOMIC GROWTH AND THE DYNAMICS OF W AGE
DETERMINATION
Contents
Abstract
a micro simulation study of the stability consequences of
deficient variation in factor prices and micro structures
by
Gunnar Eliasson and Thomas Lindberg
IUI, Stockholm
1. Diversity of Prices and Micro Structures - A Description
2. Partiai Dynamic Relationships - Hypotheses
3. Wage Setting as a Potentially Destabilizing Process Policy Analysis
on the Swedish Micro-Macro Simulation Model
4. Supplement on Micro Simulation Method
An earlier version of this paper was presented to the Eastern Economic
Association, 12th Annual Convention, Philadelphia, April 10-12, 1986.

-2-
Abstract
Swedish Manufacturing Industry is said to be technologically and commercially in good shape. While Swedish wage levels were higher than in all industrial countries in the mid 70s, wages - expressed in international currencies - have now dropped to a mid position, and real rates of return are back to the average for the postwar period.
Given what empirical research on Swedish labor market behavior tells us, the large devaluation in late 1982 should have been followed by strong wage drift.
However, to underst and recruitment and wage setting decisions, one really needs a model in which firm pricing, production and investment decisions are controlled by overriding profitability objectives and where the rate of interest plays a role. The Swedish micro-to-macro model is such a model.
Three partiaI explanations are formulated and tested on panel micro data of firms. We find that:
(l) The relationships between profitability, investment, output growth and increases in employment have been gradually weakened. Firms increasing their employment tend to offer relatively high wages, but they are not necessarily the most profitable firms.
(~) Wage costs per unit of labor appears to be evenly distributed across the population of production establishments in manufacturing, not being above average in profitable firms and above average in distressed basic industries. A distorted wage and reservation wage distribution, hence, may force such strong wage demands on high rate of return industries if they want to expand employment, that they rather abstain.
G.n The high real interest rates appear to increase profit margin requirements in firms such that they have held back recruitment and wage expansion.
The combined impact of these partiaI mechanisms are simultaneously explored in a dynamic, multimarket setting through the Swedish micro-to-macro model. Simulations suggest;
a) that if expectations and adjustment speeds are changed to mlmlC the situation in the 60s sudden wage overshooting may easily produce a cost crisis collapse in output from which the economy has not recovered 20 years later, compared to a less inflationary reference scenario
b) that if the initial wage distortion is not corrected long-term growth in the profitable end of the firm distribution will permanently be held back through wage drift.
The latter conclusion can be given two alternative interpretations, not discriminated between in the model.
Either an inert wage reservation structure forces an inefficient allocation of labor over firms. Alternatively new recruitment requires knowledge and skill qualities that are not available in the market in sufficient "quantities".

3-
1. DIVERSITY OF PRICES AND MICRO STRUCTURESl
- A Description
This paper addresses two indirectly related issues. First, we study several
partiai problems, one at a time. We look at the micro--€conomic effects of
various mismatches in the ways relative prices clear various markets in the
economy. We particularly ask whether a distorted wage structure is pricing
certain labor group s out of the market. We also inquire into the consequences
of changing wage setting practices when increased real interest rates from a
deregulated credit market force higher margin requirements on producers. All
policy questions asked, however, relate to the simultaneous, multirnarket
price and quantity setting processes of a dynamic economy. Hence, second, we
ask what pricing behavior, notably the stability of the price systern means for
the stability of long-term macro--€conornic growth. In this analysis we use
the Swedish micro-to-macro model.
Factor prices and factor use - is labor compensation perverse?
Standard economic theory presumes factors to be paid at rates corresponding
to their marginal productivities. We have the problem whether homogeneous
labor - all individuals being equally productive in any occupation - should be
differently paid because of an incomplete adjustment (search) process. We
also ask the related question whether alabor market equilibrium, all labor
being adjusted to the same wage is at all compatible with an equilibrium
credit market, all firms earning equal returns to capital.
Figure 1 gives data on marginal value product of labor, and wages in Swedish
manufacturing by year, 1976 through 1983. Value productivities are
"marginal" in the sense of relating to the average of each of 250 manu
facturing divisions or firms, together accounting for about 75 percent of total
Swedish manufacturing employment. In the figure data (on firms and divi
sions) have been ranked by productivity from the top down.
1 We want to thank Bo Axell, Anders Björklund, Harald Lang, Erik Mellander and Nils Henrik Schager , all at IUI, for many comments on earlier versions of this paper.

4-
For an industry in the midst of a structural adjustment process one would
expect profitable firms to plan expansion of investment, output and
employment and hence generate a tilting of the wage eos t structure towards
high (profit) performance firms.
We find a distribution of actual marginal value products (in nominal terms)
that moves very little through the "crisis years" of 1976-79, and then starts
shifting upwards, notably in the upper left performance spectrum, and even
more notably in 1983, the year af ter a 16 percent devaluation (in October),
and in 1985.
However, more spectacular is the result that the wage cost distributions2 in
Figure 1 for firms ranked by value productivity (1) are horizontal throughout
the years, and (2) do move very little, even in nominal terms. The average,
nominal wage eos t level in 1983 was about 50 percent higher than in 1976,
and barely above the same level in 1985, two years af ter the 1984 devaluation.
Some "breaking up" of the distribution towards the end of the period can be
observed. It does not change the "horizontal trend", but some erratic
dispersion of wage costs does occur.
Do profitable firms invest, grow and pay higher wages?
We have no matching data set on the distribution of labor qualities. A
standard guess would be that labor quality is correlated with labor value
productivity and that labor productivity is strongly, positively correlated
with capital intensity of production or the capital coefficient. If a positive
relationship between labor quality and measured labor productivity can be
assumed, Figure 1 exhibits the perverse relationship that labor remuneration
per unit of labor input decreases with "marginal" labor product. The explana
tion that first comes to mind is that the dispersion of surplus value over labor
2 This is not what one normally means by a "distribution". For lack of a more adequate term we will still call it a "distribution", except in contexts where the term can be misunderstood.

-5-
costs is related to capital coefficients, or capital productivity. When the
difference between labor productivity and wage costs has been corrected for
capital intensity the two graphs will picture the relative distributions of
profitability and wage costs.
For one year (1979) we have a matching data set on capital coefficients,
capital being measured by cumulated machinery and construction invest
ments net of depreciation at reproduction value. When we plot profit margins3
against capital (value) coefficients in Figure 2, we do not even find a positive
correlation. It is negative, even though weakly so. Obviously, the remaining,
low performing, basic industries with large installations of hardware capital
per employee, when measured on areplacement value basis, produce this
perverse result. Obviously, again, wages are not at all positively correlated
with profitability, an inference also suggested by Figures 3, on a different set
of data. There is only a weak positive correlation between profits per
employee and the relative wage level.
Somehow available data on wage cost distributions in Swedish manufacturing
exhibit a perverse factor price structure in the labor market. 4 Low pro
ductivity labor appears to be systematically overpaid, while high productivity
labor appears to be underpaid, and there appears as weIl to be no relationship
among firms between returns to capital and their wage cost level.
There are several ways to interpret these figures. 5 First of all the explicit
ambition of Swedish egalitarian policies and union ambitions have been to
3 Profit Margins (M) in Figure 2 are defined as gross operating profits in percent of value added. The differences between the two curves in Figure 1 show gross operatin& profits per employee, or X = PQ/L-W = (PQ-WL)/L = (Profits/PQ)(PQ/L) = M(PQ/L). Q is value added in constant prices and P the value added deflator. W is the wage cost level per unit of labor (=L) input. The difference X should be correlated with M.
4 An independent data set for Swedish industrial statistics put together for the years 1977 and 1983 by the National Industrial Board yields the same result as does a similar data set for Norwegian manufacturing. See Lönsamhet och kostnader - en strukturstudie av svensk och nordisk industri, SIND Data, Statens Industriverk, Stockholm, November 1985.
5 Note that even though the wage cost distributions across establishments are consistently flat, a considerable spread of wage costs over individuals within each establishment is still possible.

-6-
push for the same pay for the same kind and quality of job ("solidaric wage
policies "), and even the same pay irrespective of job. In an abstract setting
this could be interpreted as aiming for a perfect labor market arbitrage. The
hitch is that one would not expect this to be a sustainable state in a dynamic
labor market and an industry subjected to rapid structural reorganization.
On the other hand, the observed labor compensation structure appears to be
the reverse as compared with U.S. manufacturing experience since the early
70s (Lawrence-Lawrence 1985). The interesting question is whether this
difference reflects a corresponding difference in labor market flexibility , that
also explains the relatively lower rate of manufacturing growth in Sweden
through the observation period and the relatively much faster growth in
manufacturing employment in the U.S. during the same period.6
6 Cf. OECD Employment Outlook, Paris, September 1984, pp. 13-20, Holmlund (1984) and Björklund (1986b).

-7-
2. PARTIAL DYNAMIC RELATIONSHIPS - HYPOTHESES
For a company in the higher performance, upper left end of Figure 1, the
wage structure shown means a favored position. As long as it can stay there
the horizontal and rigid wage structure provides it with a "subsidy" , or an
above average return to assets. The opposite holds for the low end of the
performance spectrum. Economic theory would predict the profitable firms to
invest and expand. Offering higher wages and/or lowering prices, hence
driving down rates of return until they are all equal on the margin. Expansion
would then push up the wage level thus forcing the low end of the manu
facturing firm population into a distressed profit situation. Firms would lose
labor or exit. Labor would quit or be laid off, and move to growing industries.
One would hence expect a dynamic growth process to create a downward
tilted wage cost schedule. The question is to what extent the downward
sloping productivity schedules can be interpreted as demand curves for labor
in a nearly perfect labor market, where all "low wage producers" have been
driven out of business. For at least the years 1976-81 the (profit) margin
between survival and exit has been extremely slim for the bulk of manu
facturing activity (see Figure 1). Through 1981 a rapid expansion of the
average wage cost level would suddenly have reduced the profit margins for
the bulk of Swedish manufacturing to af ter capital charges - loss opera
tions. The suppressed average wage cost level hence, has saved a large
number of firms. Has this been the effect of policies, or of endogenous
economic forces?
Swedish manufacturing industry being dominated by export firms, the
suppressed wage cost level also has had to hold in international currencies.
The slim margin between value productivity and the wage cost level thus was
established for more than 6 years af ter a couple of years of extreme wage
overshooting, following an extreme, nominal profit boom in manufacturing in
1974, notably in basic industries. A suppressed wage cost level was
maintained through the devaluation in October 1982 (see Figure 6) until at
least 1985. Until then wages apparent ly had not caught up.
From the micro-macro analysis reported in Section 3, we observe that wage
overshooting in model simulations for these years depends entirely upon how
the labor market process is specified. The most realistic simulations taken

-8-
from a recent IUI long-term survey of the Swedish economy, suggest that the
propensity to wage overshoot during the 70s has been lower than during the
60s (cf. Schager 1985). The explanation could be explicit policies, or central
union agreements, a general and realistic fear among the employees for a
rapidly rising unemployment, or increased employer resistance to wage
escalation. All three factors might have checked wage and salary demands
during these years.
Two questions, hence, remain for this paper.
First, why had rapid growth in output not started by 1985 despite the
improvement in profitability, and/or why had wages not begun to increase
faster?
Second, what would the macroeconomic consequences be of a different wage
policy, allowing for much wider wage dispersion on identical jobs?
Why no growth and no wage drift?
Why do not firms in the thin, but very profitable left part of the performance
distribution in Figure 1 pull off a general wage expansion, and even more so,
why did this not happen in 1983, the year af ter the extreme devaluation in
1982, when the profitability level of all firms was raised? This would have
been the normal out come in the 50s and the 60s of a situation as that
pictured on the diagrams for 1982 and 1983. However, Schager (1985)
observes that the pricing process in the labor market has changed for a slower
mode since the late 60s. At least he finds little evidence of a pull effect on
wages from profits.
Should not high rates of return, nevertheless, stimulate expansion and new
recruitment?
There are at least five possible answers to the apparent absence of a strong
surge in manufacturing growth, new recruitment and, hence, wage drift. First,
firms may simply sense that the current situation is a disequilibrium
situation. Current price and profit signals, hence, are not reliable indicators of
-9-
the future. Hence, the mode of the labor market has at least temporarily
changed for a slower pace. Uncertainty about the future is high. Firms,
furthermore, have not yet recovered and reconsolidated af ter the loss years
af ter the oi! price shock, at least in an ex ante sense. They dare not set out on
a rapid investment expansion path, bidding up wages to recruit labor to man
the new plants. (This statement is for all manufacturing. Many firms are still
lingering on as semi crisis industries, af ter having been saved by industrial
subsidies in the 70s. During the "old policy regime" they would have been
gone by now (Eliasson 1986b). Even though some high performance firms are
expanding output quite rapidly this is not sufficient to pull the whole average
along at a rapid rate.)
Second, firms do not expand "structurally" as they did in earlier days.
Hardware processing is no longer the profitable activity. Firms expand their
marketing network, mostly internationally and they concentrate resources on
improving product quality, which is not measured properly in statistics on
output. Hence, expansion may in fact be occurring but not in such a fashion
as to generate more blue collar jobs.
Since expanding firms do not employ the same kind of people as those
released from stagnating, contracting or shut-down firms, expansion may be
held back due to lack of skilled people. There is a human capital barrier to
expansion.
Third, initial conditions, like unused capacity and labor hoarding may make
even profitable firms temporarily hold back investment and recruitment.
Furthermore, a not completed restructuring of manufacturing and downward
rigidity of wages may mean that relative labor compensation is out of tune
with labor productivity, creating reservation wages that drive up the supply
price of labor, especially on the margin. For instance, while technical change
is moving profitable firms and employment structures away from simple
factory production towards more human capital demanding service
production (Eliasson 1985b) relative labor compensation of those groups have
been declining (see Figure 5 and Deiaco 1986). This seems to have been the
case for wage compensation to skills in general (see Björklund 1986b). This is

10 -
the elassical example of how to create a situation of scarcity through keeping
the price "too low".
While compensation to human capital in demand has declined relatively ,
compensation to labor carrying on elose to "worthless production" has been
maintained relatively very high through government subsidies (Table 1) such
that crisis industries have been capable of paying the highest wages in
manufacturing.7
High interest rates may hold back wage escalation
Fourth, high real interest rates make it difficult for firms to maintain
targeted returns on net worth, earlier subsidized by a positive contribution
from cheap borrowing (see Figure 6). Hence, firms have been forced to
increase profit margin requirements to meet rate of return targets, imposed in
the capital market. This hypothesis is reinforced by the observation that
labor, because of Swedish labor market laws, compared to the U.S. situation
is very much to be regarded as a fixed cost. Higher interest rates cool down
wage increases partly through holding back investments partly through
forcing stiffer profit margin requirements on companies.
If the average wage cost leveI was constantly, somehow, suppressed such that
an average rate of return significantly higher than the market Ioan rate couId
be maintained, we would have created an inflation prone macro disequi
librium situation in the capital market, resembling the cumulative process of
Wicksell (1898). By this interpretation temporarily suppressed wages have
created an average return in excess of the market interest. However, this is
not currently the situation. The average return to capital is currently equal
to, or lower than the market loan rate. (See Figure 6.) To maintain the same
7 Policy experiments in the micro-to-macro model (see next section) support the hypothesis that subsidies was the major reason behind stagnation in Swedish manufacturing, and that the distorted wage cost structure was an important part of the explanation (see Carlsson-Bergholm-Lindberg 1981, Carlsson 1983, Eliasson-Lindberg 1981).

-11-
real rate of return on equity as before, rate of return requirements on total
capital- and hence also profit margins8 - have to be raised. Rather than being
inflation prone and unstable the high interest rates set in global markets - in
a Wicksellian sense - appear to have exercised a derived check on domestic
wage escalation. However, if rate of return distributions are very skewed - as
in the diagrams - and if relative reservation wages are not flexible enough to
accommodate a transfer of manpower (new entrants, unemployed, or
employed in low performing firms) to the growth industries at a low level of
average wage drift, a micro disequilibrium situation might still exist, that will
manifest itself as soon as the economy starts to grow, and a reallocation of
labor is needed. The tricky question is why firms in the high performance end
of industry have not expanded faster, driving up wages in the process, and the
low performance firms out of business.
Answering the original question requires that all these partiai mechanisms,
the slower labor market model, the new supply demand structure in the labor
market, special initial conditions and the Wicksellian disequilibrium be
simultaneously evaluated. This is beyond standard econometric modeling and
testing techniques. However, micro simulation analysis on an estimated
micro-based macro model with dynamic, multimarket price and quantity
interactions makes up a good substitute. A write up of the mo del , specially
organized to highlight the relationships we have just discussed, is found in the
supplement. In the next section we proceed with the simultaneous testing
problem.
8 See the margin targeting process so common among firms, as represented in the Swedish micro-to-macro model (Eliasson 1985a, p. 57 ff. AIso see Model supplement).

-12 -
3. WAGE SETTING AS A POTENTIALL y DESTABILIZING PROCESS
- Policy Analysis on the Swedish Micro-Macro Simulation Model
Various policy solutions to the Swedish growth problem are discussed and the
micro and macro concequences of some of them are studied on the Swedish
micro-to-macro (M-M) model. We look particularly on wage determination
as the combined outcome (in a multimarket setting) of many partiai price
and quantity interactions at the micro level. The dynamics of micro-macro
interaction may occasionaIly destabilize the macro economy. A short
presentation of the model and the experimental setting follows in the
supplement. For more complete presentations the reader is referred to
Eli as son (1976, 1977, 1978, 1985a, 1986a). In all experiments firms are
assumed to be price and interest takers in foreign markets; prices abroad
being the same in all experiments, as are the assumptions about technical
change associated with new investments in individual firms.
Do distorted relative factar prices block expansion in profitable firms?
- Formulation of a simultaneous hypothesis
Figures 1 to 5 suggest that rates of ch ange in wages are not correlated with
rates of change in profits, as they should not be according to Schager (1985).
Since wage change is strongly and positively correlated with ch ange in
employment, this implies a weak relationship at the firm level between
growth in output, on the one hand, and both profitability and change in
employment on the other. This is support ed by the diagrams, even though the
rate of return measures are not the ones we would prefer to use. Hence,
something has hel d back growth in the profitable firms during the period 1976
to 1985.
As a consequence, reservation wages for blue coIlar workers on the average -
and even mare so on the margin, and in particular af ter Swedish income taxes
- have been kept high, and probably above the offered wages of many firms
planning to expand factory production. This conclusion is compatible with
Schager's (1985) UV-curve analysis, which shows that it takes an open
unemployment rate of some 4-5 percent to keep vacancy times for blue collar

-13 -
workers in manufacturing at around 2 weeks, compared to 2 percent in the
60s. These results are also compatible with Holmlund's (1984) results that
those few who have moved have gained an increase in the yearly wage growth
rate by more than 2 percentage points, while those who have decided to stay
have foregone wage gains of some 2 percentage points per annum.
The hypothesis proposed is that expected profitability has been too low for
manufacturing firms to plan expansion of volume production and to hire
people, notably blue collar workers. It has been too low because capital costs
and taxes together have made reservation wages so steep on the margin, that
the expansion of profitable firms has been effectively blocked.
One might even carry the interpretation one step further and ask whether the
relative work compensation structures maintained in Sweden might mean
that policies and unions are forcing simple blue collar jobs out of the market
faster than technology alone - pushing the employment structure in the same
direction - would suggest.
This in addition should add to the worries of a possible wage cost explosion,
despite the fact that the average wage compensation level has so far been kept
very low. If relative wage conserving policies of unions, so typical of Sweden
(Björklund 1986a, b) cannot be broken, a rapid expansion of demand and
relative wages for engineers, management personal and skilled workers might
generate a compensating wage movement at the lower end of the labor force
and exactly what is feared might occur; inflation, stagnation of output and
low skilled jobs being priced out of the market at an increased rate. This is
perfectly compatible with a continued downgrading of the relative wage level
of the Swedish economy in international currencies through further
devaluations.
The test of the hypothesis will soon be provided by reality. However,
preliminary tests of some of the hypotheses can be run prior to that on the
Swedish micro-to-macro model.

-14-
Are elassical alternatives viable policy options?
The exact question asked to the M-M model is whether the elassical policy of
more flexible factor prices is efficient in engineering the labor reallocation
needed to set the economy on a growth path.
If high wage firms are the most profitable and the most expansive firms, a
more flexible labor market pricing should mean a wage distribution, tilted in
favor of the high profit, fast growing firms during the growth process. The
wage consequences for the low performance firms would be more complex.
There is the pull effect from the expanding sector, pulling up wages
everywhere. But since wages are flexible, those who prefer to stay can stay at
lower relative wages. However, if the labor market pricing process were
efficient, the wage level would nevertheless increase also in the low
performance end, since there would always be many people in a firm that
would otherwise leave, and it is elose to impossible to have different wages for
the same job in the same workshop. These firms which cannot take the higher
wage level would exit. This leveling of the wage level across firms - if needed
through forced exit - was the aim of the so-called solidaric wage policy of the
old Swedish labor market policy model (see Björklund 1986b, Lundberg 1985).
However, if reservation wages and/or actual wages are high, or higher in the
low performing or ailing firms, compared to the high performing potential
growth firms, the price mechanism would not stimulate the transfer of people
away from low performance to high performance industries. These questions
are much too complex to be tested simultaneously by standard econometric
methods. Micro simulation on a dynamic multimarket model is the only
practical approach. The Swedish M-M model can be set up to mimic a more
or less fast and efficient simultaneous arbitrage process in the product, labor
and capital markets, with particular attention being paid to the dynamic
mechanisms of the labor market. Endogenous, forced exit of firms is a
standard feature of the model. The initial state upon which the model
experiment starts running ineludes a fairly complete distribution of profit
rates, actual wages, reservation wages, production capacity, utilization of
production capacity, labor hoarding, etc. in 1982. The model firm computes
its own offering wage every quarter during a simulation. High profitability

-15 -
firms, furthermore, should begin to expand, since investment in the model is
directly related to the ability of the individual firm to earn a return over the
loan rate, provided capacity utilization is not too low. However, there is a
complete demand feedback in the model, and export and import trade
depends - in a classical fashion - on relative returns over costs on deliveries
in different markets.
As a consequence a set of carefully designed experiments should be capable of
capturing the balancing forces involved and also indicates the intermediate
balance that is optimal for long-run growth in output (Eliasson 1983). The
model has been set up for the year 1982 on (inter aHa) the data exhibited in
Figure 1. We will then compare the macro out come for different labor market
pricing processes.
(To begin with we will carry on the argument as if labor were homogeneous -
as in the model. This argument will produce one explanation. We will then
round off the discussion, and hypothetically reas on in terms of heterogeneous
labor, to see if the interpretations are affected.)
Manipulating the Wage Determination Process - 20 year model experiments
beginning 1982
To investigate the influence of the wage determination process on long-term
growth in manufacturing output we have run three experiments on the M-M
model. The first experiment (Reference Case) has a parameter specification
that relatively weIl tracks macro performance during the 70s and the early
80s.9
The performance of the Reference case is illustrated in Figure 8 that
compares the simulated wage cost and value productivity distributions 1985
with the real, nominal distributions 1985 according to the most recent data
9 This parameter specification was used as a base case in the recent long-term survey of the IUI published in November 1985. See Att rätt värdera 90-talet (Evaluating the 90s), IUI, Stockholm, 1985. Also see Eliasson, 1985a, Chapter VIII.

-16 -
from the IUI - Federation of Swedish Industries long-term survey. The
simulation started on the initial distributions of 1982, also shown in the
diagram. The large devaluation in the late autumn of 1982 has shifted and
tilted the value productivity distributions almost identically in reality and in
the model (see Figure 8). The same holds for the wage cost distribution which
has not overshot in the model, because of the slow labor market mo del
specified. This is comforting for the simulation analysis to follow.
We believe that the parameter setting for the labor market relatively weIl
pictures the slow mobility established since the early 70s, as compared with
the 50s and 60s (cf. Schager 1985). In experiment No. 2, everything is the
same, except that firms only look for, and accept labor from the same
industry. We call this the case of a Restricted Labor Market. Only new
entrants into the labor market are free to go anywhere for a job. The "second
hand" market is tied down completely by either human capital constraints to
mobility and/or restrictive union practices.
Experiment No. 3 (Fast Labor Market), finally, is parameterized as the base
case No. 1, except that the labor market process is very fast and price
transmission from abroad into Sweden, through export trade is also very fast. lO
One could say that the respecifications put the 60s back into the labor
market.
One could also say that experiment No. 3 takes the economy eloser to the
situation of static efficiency each period (quarter) than the other two, through
rapidly reallocating labor across the entire firm population. The out come is
also a mu ch more rapid exit of firms through bankruptcy, than in the other
runs, be cause of a wage "cost crisis" generated during the first few years, that
in tum generates an "output collapse" in 1987 (see Figure 7).
Policy experiment No. 3 also illustrates the initial factor price shock
sensitivity of the Swedish economy, positioned initially, as partially shown for
10 A principal presentation of the experiments is found in the supplement and aore detailed presentation in Chapter VIII in Eliasson 1985a. The parameter setting is that of "elassical policies" in Figure VIII:6 (p. 400) or the FAST market regime in Table VIII:1D (p. 390).

17 -
1982 in Figure 1. The endogenously generated wage overshooting drove a
significant number of firms out of business. The remaining firms were on the
average much more productive than the firms in the other experiments, but a
higher wage level had been established in the economy, and even though
unemployment went sky high, the remaining 10 year period was not enough
to drive real wages back to the levels of the other two experiments. As a
consequence, output growth in the "statistically more efficient" policy
experiment No. 3, never catches up. It is still lagging behind af ter year 2000
because of a slow investment process and because of a relatively lower
profitability level. It should be recalled that when a similar situation occurred
in the mid 70s the government saved the firms and kept unemployment low
through subsidizing existing high wage, crisis firms, thus preserving their
relative wages (see Table 1) and forcing manufacturing output to a standstill
for about a decade. ll
Manufacturing output growth in the other two experiments is parallei and
smooth (see Figure 7). P rofit abilit y gradually improves, investment increases
in the most profitable firms, no wage cost overshooting disturbs development
and productivity increases at increasing real wages and declining inflation.
We observe that a segmented labor market (experiment No. 2) hurts real
wages and benefits industry through allowing a somewhat higher profit
margin than would have been possible with a more complete wage arbitrage.
Productivity is, hence (!!!!), slightly lowered in the segmented labor market
experiments, but this is partly made up for in the form of alarger number of
labor hours on the job. This technically explains the slightly lower rate of
output growth in the segment ed labor market case.
Perhaps the Swedish labor force was so badly entrenched through an
inoperative pricing system to begin with, that more or less segmentation did
not make any difference for the allocation of labor. What was needed to move
people was extreme wage overshooting and rapid shut down of inefficient
firms, with no protection for people thrown into the market. But even that
did not help growth in output because of the overkill associated with the wage
cost overshooting. Let us therefore take a look at the micro structures
generated in the simulations.
11 See Carlsson 1983, Eliasson-Lindberg 1981.

18 -
Does more wage spread give more or less growth in output?
The two hypotheses associated with the growth experiments were, (1) that
expansion would tilt the wage cost distribution leftwards in the same
direction as the productivity distribution, and (2) that the wage distribution
would widen during the reallocation process, but then narrow down again in
the rapid, steady growth scenario with a steady profit margin, widen in the
disorderly, fast market regime and stay fairly widened, with a large profit
margin but a lower growth rate in the restricted labor market allocation case.
Hypothesis (1) was not confirmed in the experiments. Wage cost distributions
stayed horizontal throughout the experiments in all three experiments. The
reas on was simple enough that despite homogeneous labor, diverging
reservation wages preserved a measure of heterogeneity in the labor market
when it came to supply price elasticities of labor. In terms of the
micro-macro model both the sticky wages and the preserved wage
distributions can be said to be due to imperfect information on the part of
labor and/or firms - as discussed by Stiglitz (1985)12 - a state of imperfection
that persists or can be reinforced through multimarket interaction over time.
High wage (crisis) industries were instrumental in checking labor reallocation
during the first few years through holding back output and employment
expansion in profitable industries, very much as illustrated with historic data
in Figure 1. The devaluation, and later the export upswing supported the old
wage structure for many years. This effect was, of course, even more
reinforced in the restricted labor market experiment. Reservation wages kept
labor from moving between firms as long as firms were not shut down, since
relatively high wage firms were in trouble and relatively more medium wage
firms were expanding. Hence, fast expansion of employment was not
profitable and growth slowed down. New recruitment in growing firms was
predominantly coming out of new entrants in the labor force, and the
horizontal distribution was preserved.
12 Note, however, that the Swedish micro-macro model represents an ongoing micro market process. It is not an equilibrium model.

-19 -
Why a slower labor market mode?
Also Schager (1985) reports a low sensitivity of wages to profits, a result that
is support ed by Figure 3 but which runs somewhat against results from
estimating profit functions on data from the 50s and 60s (Eliasson 1974). One
can think of three explanations to this. The labor market may have changed
between the 60s and 70s. This is supported by Schager's analysis. If so, the
results are compatible. Then, however, one has to explain why the mode has
changed. There is no expansion mechanism through investment at the firm
level directly linked to profit rates. If so, Eliasson (1974) was wrong. There
may, however, be a direct link between profit rates, expected profits, capacity
utilization, investment, growth in output and employment growth at the firm
level as in Eliasson (1974) and in the M-M model. If relative ex ante supply
and demand prices in the labor market are all distorted such that expansion
of the most profitable firms is stopped, then this profitability, recruitment
and wage drift relationship will not be observable from empirical data for
those years. This is so because the common factor, growth in output and
employment, is not present. This explanation is compatible with bot h Schager
(1985), Eliasson (1974) and with all simulation experiments, although
Schager's results depend on particular data characteristics for his sample
period. A dynamie micro-macro analysis is needed to sort out what has
happened.
This appears to be the reason why a rapid output growth and wage drift
phase did not begin af ter the drastic devaluation in the autumn of 1982.
Reservation wages on the margin before tax, were too high for the relatively
low paying growth industries to be willing to pull high wage labor out of
stagnant or crisis industries. Since new entrants and unemployed were not
available in sufficient numbers "growth firms" chose not to expand, and hence
did not generat e wage drift, as they did in the 50s and 60s. High wage
industries, on the other hand, were not profitable. They did not recruit
people. (They were more inclined to lay off people, or to exit. Laid off, high
wage people from crisis industries had to accept lower unemployment
benefits, or be employed by expanding industries at lower wages. Both
mechanisms kept the wage distributions from tilting.)
-20-
However, why did firms abstain from raiding each other for labor as in the
60s to be able to expand faster? The explanation nearest at hand is that
expectations have changed from over-optimism to pessimism, or simply that
firm management recognized the favorable, post devaluation profit situation
as temporay, and no predictor of the future. Furthermore, the stiffer profit
margin requirements that the high real interest rate imposed forced firms to
raise their profit margin requirements to maintain an acceptable return on
equity (see Figure 6 and formulae (4) and (5) in the supplement). With
product prices and wages more or less fully arbitraged, there is little else for
firms to do than to compete with productivity ({J in formula (5)) through
diminishing slack, shutting down low profit operations, or upgrading
performance through investment. This is the way wage setting is affected by
interest rates in the M-M model. All of this is making for less volume
expansion and less recruitment, and, hence, no excess demand in the labor
market.
What happens in the longer term?
A significant part of the profit potential created by the 1982 devaluation
remained in 1985 both in reality, and in the reference simulation, because of
the slow labor market (see Figure 8). It was more than gone in 1985 in the
fast labor market experiment (No. 3), mimicking the pre-oil crisis organiza
tion of a wage drift prone wage setting process. With the fast labor market
mode of the 60s turned on the model continues to create strong wage over
shooting and an output collapse in 1987, despite the fact that considerable
wage dispersion occurs.
Few distributionai differences are recorded between the reference scenario and
the restricted wage market setting by 1992 (hence not shown). However, the
collapse in output and increased unemployment has stopped wage expansion
in the fast market scenario. P rofitabili t y and growth have been restored and a
significantly increased spread in real wages has been achieved (see Figure 9).
-21
Summing up
While there are several dynamic micro-to-macro explanations of the current
Swedish labor market paradox, at least the following two conclusions are
consistent with both data and policy simulations on the Swedish micro-to
macro model.
(1) Inflexible relative wages, still reflecting previous relative profitability
and price structures figure as important explanations behind output
stagnation in the 70s and the absence of resumed rapid growth in the 80s.
(2) The high real interest has checked wage escalation through imposing
tougher rate of return and profit margin standards in firms, thus posting a
warning for a return of inflationary conditions if the real interest rate is
allowed to come down.
However, a perhaps more principal and important observation is that some of
the paradoxical disequilibrium situations that we have frequently observed
since the mid-70s require dynamic micro-macro models to be understood.

-22
4. SUPPLEMENT ON MICRO SIMULATION METHOD
Micro simulation substitutes for standard econometric testing when it comes to complex empirical analysis. For the analysis of this paper we have used a dynamic, multimarket micro-macro model econometrically estimated or calibrated on panel data on firms for the 70s and 80s. We refer to other publications for further information on the model. l3
Micro simulation analysis, to which we now turn, is a statistical method of evaluating certain complex hypotheses using the model specification and initial and exogenous data as prior assumptions. One could say that the method allows enormous amounts of evidence bearing on a particular problem to be condensed on an interpretable format. This interpretation includes the facts and the ways facts are organized (the estimated model) as priors.
Contrary to standard econometric testing procedure, micro-simulation analysis, because of the richness of the mo del , is very demanding on prior experimental design. Hypotheses are easily rejected if someone comes up with an alternative, possible suggestion. In principle, a new experimental design is the same thing as to ask somebody to reestimate all his regressions on a new model, using different priors. In this particular analysis, dealing with a politically very sensitive subject matter, we have gone very far in responding with new simulation experiments and checks on all kinds of alternative interpretations, many of which originate in unfamiliarity with this kind of modeling technique.
The supplement begins with a brief, verbal presentation of the model, then goes on to detail some of the relationships that are particularly important for the empirical subject matter at hand.
The M-M model economy of Sweden
When seen "from above" the macro mapping of the micro-to-macro model is a Keynesian-Leontief, eleven sector mo del with a non-linear, Stone type consumption system, wealth creation being treated as one separate consumption category, with complete dynamic feedback through demand, through prices and through profits, investment and capacity growth.
Underneath the macro level exogenous Schumpeterian innovative activity upgrades the characteristics of new investment of individual firms. Pricing behavior is interdependent through the product, labor and capital markets. Rate of return criteria imposed through the capital market dominate longterm dynamics in the model and check wage setting in the labor market. Investment in individual firms is determined by a Wicksellian disequilibrium in the capital market, related to the innovative activity in individual firms
13 AIso called the MOSES model. Both the micro-macro model used and the experimental designs are too complex to be fully described in this paper. For more detail, we refer to Eliasson (1976, 1977, 1978, 1985a, 1986a). For a short presentation of the labor market process, see Eliasson (1983). AlbrechtLindberg (1982) and Bergholm (1983) include technical presentations of the model.

-23-
(see Eliasson 1986c), productivity and wages. A Smithian invisible hand coordinates the whole economy dynamically through monopolistic competition in the product, labor and capital markets. The competitive situation of a firm is based on "technological" process superiority. Foreign prices, the foreign interest rate and technical change in new investment are exogenous. Profit margins on foreign trade affect domestic supply and demand conditions and, hence, domestic prices. With the exception of parameters regulating speed and scanning range of search in the labor market all exogenous assumptions are identical in all experiments reported in this paper.
Model Overview14 - verbal presentation
The M-M model has been designed to analyze industrial growth processes. Therefore, the manufacturing sector is the most detailed in the model. Manufacturing is divided into four markets (raw materials, semi-manufactures, durable goods, and consumer non-durables). Each market is populated by a number of firms, some of which are real (with data supplied mainly through an annual survey) and some of which are synthetic. Together, the synthetic firms in each industry make up the differences between the real firms and the industry totals in the national accounts. The 250 real firms, or divisions, in the model cover 70-75 percent of industrial employment and production in the base year, 1982. The model is based on a quarterly time specification.
The Labor Market
Firms in the model constitute short-run and long-run planning systems for production and investment. Each quarter they decide on their desired production, employment and investment. Armed with these plans they go into the labor market where their employment plans confront those of other firms as weIl as labor supply.15 The labor force is treated as homogeneous in the model in the sense that individuals generat e the same productivity on the same job. Productivity is job (firm) specific. Labor is recruited from a common "pool" or from other firms. A search process initiated by the firms through the signaling of vacancies determines the wage level, which is thus endogenous in the model. Even though labor is homogeneous, wages vary among firms, because the market is imperfectly informed about the earnings capacity of firms. This holds both for labor and for firms about competing firms. Information is gathered during the labor market growth process, but the outcome of the search process in terms of firm specific employment and wages in turn determines the earnings capacity of firms and so on. Tendencies of wages to converge to "one price" depend on the speed of markets and the degree of interdependency between markets. The eloser wages get to the "one price"
14 This "Model overview" paragraph is a slightly modified version of Bo Carlsson's presentation in "Industriai Subsidies in Sweden: Simulations on a Micro-to-Macro Model" , in Microeconometrics, IUI Yearbook 1982-1983, Stockholm, 1983.
15 Eliasson (1985a, Chapter II, and 1986a) ineludes a rather detailed account of the labor market pricing process.

-24-
situation the more unstable the macro economy becomes.16 Since the labor market is subdivided into industries, not regions, mobility in the labor market is probably overestimated. This is important in interpreting simulation results.
The micro-to-macro model features an endogenous firm entry and exit device. Exits occur when net worth of a firm goes below a certain minimum level in percent of total assets (bankruptcy) and/or when the firm runs out of cash (liquidity crisis). The firm, of course, gradually fades away through lack of investment if its cash flow diminishes and if it cannot borrow in the capital market at the going interest rate.
Domestic product prices and the production volume in the four product markets are determined through a similar process. The output volume of the individual firm is determined endogenously in the following way.
The Production Decision
Each quarter the firm determines its production volume in two steps; desired production volume is first determined taking into account desired changes in inventories of finished goods, based on expected total sales (including exports) which are in tum based on the firms' historical experience. This first production plan is revised by the firm with regard to its profit target, capacity utilization, and the expected labor market situation. The production plan is then executed. Production volume is distributed to export and domestic markets according to relative profit margins. (If the export price (exogenous ) is higher than the domestic price, the firm tries to increase its export share and vice versa. However, the adjustment takes place over several quarters, not instantly. If the export price is lower than the domestic price, the firms do not try to lower their export share but rat her maintain it at a constant level. In spite of this asymmetry conceming the effect of positive or negative price differences between exports and the domestic market, it tums out that the export shares in the various markets can both increase and decrease. This depends on whether firms with high export shares fare better or worse than other firms in the market. The import share in the four markets is also determined by the difference between the export and domestic prices with a certain time delay. High domestic prices relative to foreign prices lead to increasing import shares.)
(There is also a capital market in the model where firms compete for investment resources and where the rate of interest is determined. However, in the present runs the rate of interest has been determined exogenously. At this given interest rate firms invest as much as they find it profitable to invest, given their profit targets.)
Public sector employment is a policy variable, and the rate of wage increase in the public sector has been set equal to the average wage change in manufacturing, preserving the relative, average salaryand wage differential between the two sectors.
16 This dynamic propert y of the mode1 has been elaborated at length in Eliasson (1983, 1985a, Chapter VII).

25 -
The exogenous variables (besides government policies) which drive the model are the rate of technical change (which is specific to each sector and raises the labor productivity associated with new, best practice investment in each firm) , the rate of change of prices in export markets, and the rate of new entrants in the labor market.
Endogenous Pricing Decisions in a Multimarket Setting
In contrast to most econometric macro modeis, domestic prices and wages are determined endogenously in MOSES through price feedback via income formation and market demand. Firms operate simultaneously in product, labor and capital markets, making price determination in the three markets interdependent. Firms read off the market prices and reinterpret them into expectations that in turn influence the firms' expected profits and therefore their production plans, the allocation of sales to domestic and export markets, their investments, and therefore their productivity. This is the main mechanism through which resource allocation is determined in the model. These features make the model especially suited for analyzing the effects of policy measures, which can be expected to influence the expectations and plans of firms and which influence the development of prices and wages. The advantage of a micro-based simulation model is, that one can introduce various policy measures affecting individual firms rather than industries and analyze the effects. In a more traditional macro modelone is usually forced to make assumptions regarding the resource allocation effects, i.e. one has to assume a large portion of the results.
The Contral Function of a MOSES Firm - Mathematical Presentation
Capital market dynamics of the M-M economy derives from the profit targeting formula that monitors both production and investment decisions. It guides the firm in its gradient search for a rate of return in excess of the market loan rate. To derive these formulae we decompose total costs of a business firm over a one year planning horizon, into:
I ~ k k TC = wL + p . I + (r + p - ~) p . K
p
w = wage cost per unit of L L = uni t of labor input
pI = input price (other than w and pk) per unit of I I = units of input r interest rate
P = depreciation factor on K = pkK
pk = capital goods price, market or cost
K = units of capital installed
(1)
In principle the various factors (L, I, K) within a firm can be organized differently, yet achieving the same total output. Depending upon the nature of this allocation the firm experiences higher or lower capital and labor productivity, as defined and measured below. We investigate the
-26-
capital-Iabor mix achieved through the market allocation of resources between firms.
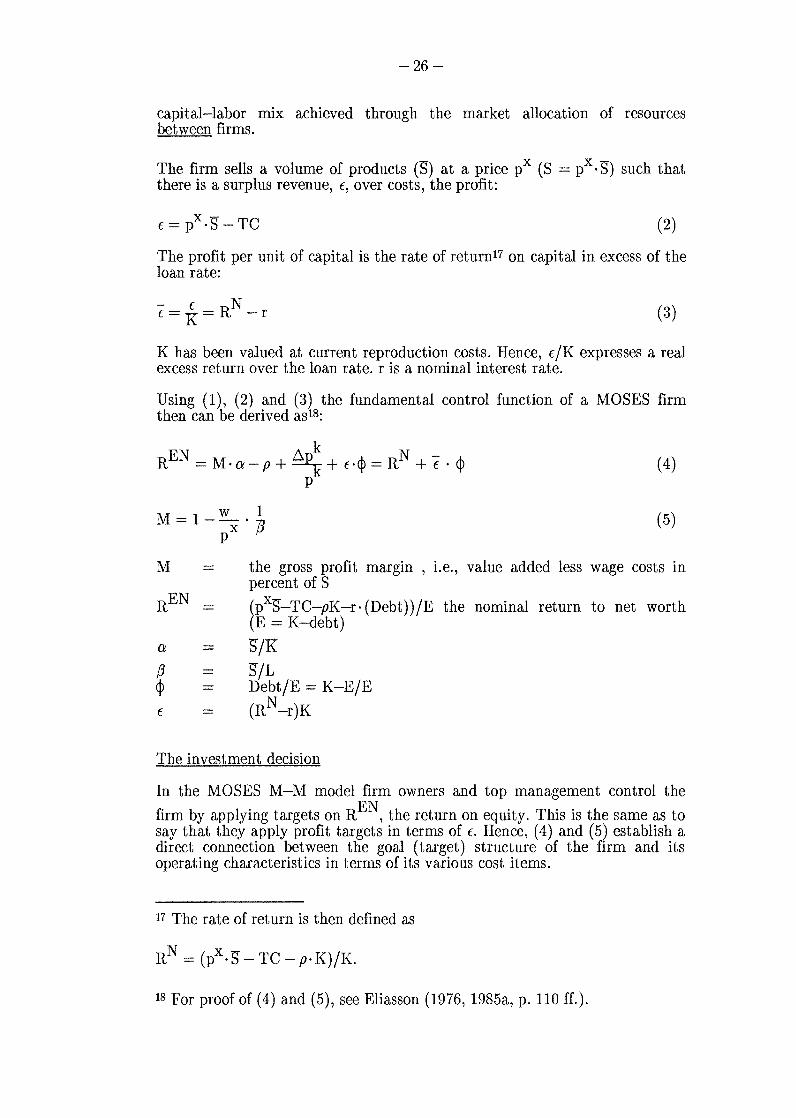
The firm sells a volume of products (S) at a price pX (S = pX. S) such that there is asurplus revenue, t, over costs, the profit:
(2)
The profit per unit of capital is the rate of return17 on capital in excess of the loan rate:
- t N t=K=R -r (3)
K has been valued at current reproduction costs. Hence, t/K expresses a real excess return over the loan rate. r is a nominal interest rate.
Using (1), (2) and (3) the fundamental controI function of a MOSES firm then can be derived asl8:
EN ~p~ N -R =M·a-p+ +t·</>=R +t·</> p
(4)
(5)
M the gross profit margin , Le., value added less wage costs in per cent of S
REN
a {3 -</> -t
(pxS_ Te-pK -r· (Debt)) /E the nominal return to net worth (E = K-debt)
S/K
S/L Debt/E K-E/E
(RN-r)K
The investment decision
In the MOSES M-M model firm owners and top management control the
firm by applying targets on REN, the return on equity. This is the same as to say that they apply profit targets in terms of t. Hence, (4) and (5) establish a direct connection between the goal (target ) structure of the firm and its operating characteristics in terms of its various cost items.
17 The rate of return is then defined as
18 For proof of (4) and (5), see Eliasson (1976, 1985a, p. 110 ff.).

-27 -
The f and the rate of capacity utilization determine the volume of investment of the individual firm.
A high interest rate raises profit margin targets in the production decision and imposes a squeeze on wages
Management of the firm delegates responsibility over the operating departments through (4) and appropriate short-term targets on M (production contro!) and long-term targets on f, that controi the investment decision.
f'~ defines the contribution to overall firm profit performance from the financing department.
At any given set of (w, pX) in (4) determined through conventionai expectations or adaptive ("smoothing") error learning functions of individual
firms, a target on M means alabor productivity target on S/L. Hence, the profit margin can be viewed as a price weighted and "inverted" labor productivity measure.
Product market conditions determine to what extent a firm can compete through lowering its price. Labor market conditions, including reservation wages in the market and the activities of all other firms, determine what the firm has to pay its labor. Hence, profitability performance depends on the ability of the firm to upgrade its productivity, or (3 in (5). This is particularly important for the theme of this paper. Figure 6 shows that the average (industry) f disappeared completely af ter 1975. By 1975, however, real rates of interest were above those before 1975. The contribution to the rate of return on equity from a too low, distorted market rate of interest was all but gone. Rate of return requirements on equity, nevertheless, were as high, or higher than before 1975. To perform up to capital market requirements firms had to increase profit margin requirements in their recruitment decisions. With prices more or less given in world markets, and productivity ((3 in (5)) restricted by technical facts and investment, the firm has only one way (see (5)) to raise margins (M) to meet rate of return requirements on equity, namely to be very tight in offering higher wages. If labor is not forthcoming at a slow wage change, there is no new recruitment.
Technological competition through innovative behavior - closing the model
The f of an individual firm is generat ed through innovative technical improvements at the firm level (Schumpeterian innovative rents) that constitute Wicksellian typ e capital market disequilibria defined at the micro level. The expected f drives the rate of investment spending of the individual firm. The standard notion of a capital market equilibrium is that of all f i =0.
A new investment vintage can be regarded as a "new firm" with exogenous
capital productivity (a=S/K) and labor productivity ((3=S/L) characteristics. A new investment can be seen as a new vintage of capital with its particular (a,(3,p) characteristics in the profit controi function (4) that mixes with existing capital installations in existing firms.

-28-
Finns set prices and quantities and compete freely in all markets, thereby competing Schumpeterian innovative rents f. away from each other, if they cannot be maintained through some innovative process, that generates new t:s all the time. Part of competition takes place in the capital market, where high f. performers attract relatively more funds for investment than low performers. This process can be said to be a long-term micro version of Wicksell's (1898) "cumulative process", at the time regarded as an inflation theory (see Eliasson 1984).

29 -
Bibliography
Albrecht, J. - Axell, B. Lang, H., 1986, "General Equilibrium Wage and
Price Distributions", Quarterly Journal of Economics, Nov. 1986, pp.
687-707.
Albrecht, J. - Lindberg, Th., 1982, Micro Initialization of MOSES, IUI
Working Paper No. 72, Stockholm.
Bean, L.R. - Layard, P.R.C. - Nickell, S.J., 1986, The Rise in
Unemployment - A Multicountry Study, Centre for Labour
Economics, LSE Discussion paper No. 239 (Jan.).
Bergholm, F., 1983, The MOSES Manual - The Initialization Process, IUI
Working Paper No. 118, Stockholm.
Bergmann, B. - Eliasson, G. - Orcutt, G., 1980, (eds.), Micro Simulation
Models, Methods and Applications, IUI Conference Reports 1980:1,
Stockholm.
Björklund, A., 1986a, Policies for labor market adjustment in Sweden, to be
published in Hufbauer, G. and Rosen, H. (eds.) Domestic Adjustment
and International Trade, Institute for International Economics,
Washington, 1986.
Björklund, A., 1986b, Assessing the Decline of Wage Dispersion in Sweden,
IUI Working Paper No. 157, Stockholm.
Bosworth, B.P. - Rivlin, A.M. (eds), 1987, The Swedish Economy, The
Brookings Institution, Washington D.C.
Carlsson, B., 1983, Industrial Subsidies in Sweden: Macroeconomic Effects
and an International Comparison, The Journal of Industrial
Economics, Vol. XXXII, Sept. 1983, No. 1, also IUI Booklet No. 148,
Stockholm.
Carlsson, B. - Bergholm, F. - Lindberg, Th., 1981, Industristödspolitiken och
dess inverkan på samhällsekonomin (Industry Subsidy Policy and Its
Macroeconomic Impact), IUI, Stockholm.
Deiaco, E., 1986, Utbildning, arbetsmarknad och kompetens, in Eliasson
Carlsson-Deiaco-Lindberg-Pousette, K unskap, information och
tjänster. En studie av svenska industriföretag, IUI, Stockholm.
Eliasson, G., 1974, Profits and Wage Determination - an empirical study of
Swedish manufacturing, Research Report No. 11, Federation of
Swedish Industries.

-30-
Eliasson, G., 1976, A Micro Macro Interactive Simulation Model of the
Swedish Economy, Preliminary Documentation, Economic Research
Report B15, Federation of Swedish Industries, Stockholm (with the
assistance of Gösta Olavi and Mats Heiman).
Eliasson, G., 1977, Competition and Market Processes in a Simulation Model
of the Swedish Economy, AER, No. l.
Eliasson, G., 1978, A Micro-to-Macro Model of the Swedish Economy, IUI
Conference Reports 1978:1, Stockholm. (Note. E 1978 without the
MOSES Code has been printed in Bergmann-Eliasson-Orcutt 1980.)
Eliasson, G., 1980, Experiments with Fiscal Policy Parameter on a Micro to
Macro Model of the Swedish Economy, in Haveman, R.H. - Hollen
beck, K. (1980).
Eliasson, G., 1983, On the Optimal Rate of Structural Adjustment, in
Eliasson-Sharefkin-Ysander (eds.) 1983, Policy Making in a Disorderly
World Economy, IUI Conference Reports 1985:1, Stockholm.
Eliasson, G., 1984, Micro Heterogeneity of Firms and the Stability of
Industrial Growth, JEBO, Vol. 5 (Sept.-Dec.).
Eliasson, G., 1985a, The Firm and Financial Markets in the Swedish
Micro-to-Macro Model - Theory, Model and Verification, IUI, Stock
holm.
Eliasson, G., 1985b, Information Technology, Capital Structure and the
Nature of Technical Change, IUI Working Paper No. 138. Published
1987 in Information Technology and Economic Prospects (ICCP) No.
12, OECD Paris.
Eliasson, G., 1986a, The Swedish Micro-to-Macro Model: Idea, Design and
Application, in Orcutt-Merz-Quinke (eds.) Microanalytic Simulation
Models to Support Social and Financial Policy, North-Holland,
Amsterdam.
Eliasson, G., 1986b, Is the Swedish Welfare State in Trouble? - a new policy
model, in Scandinavian-Canadian Studies II, May.
Eliasson, G., 1986c, Innovative Change, Dynamic Market Allocation and
Long-Term St ab ili t y of Economic Growth, IUI Working Paper No.
156, Stockholm.
Eliasson, G. Bergholm, F. - Horwitz, E.C. - Jagren, L., 1985, De svenska
storföretagen - en studie av internationaliseringens konsekvenser för d
n svenska ekonomin, IUI, Stockholm.

-31-
Eliasson, G. - Holmiund, B. - Stafford, F. (eds.), 1981, Studies in Labor
Market Behavior: Sweden and the United States, IUI Conference
Reports 1981:2, Stockholm.
Eliasson, G. Lindberg, Th., 1981, Allocation and Growth Effects of
Corporate Income Taxes, in Eliasson-Södersten (eds.), Business
Taxation, Finance and Firm Behavior, IUI Conference Reports 1981:1,
Stockholm.
Flanagan, R.J., 1986, Efficiency and Equality in Swedish Labor Markets, in
Prospects for the Swedish Economy - An American Perspective,
Studieförbundet Näringsliv och Samhälle (SNS), Stockholm.
Hashimoto, M. - Raisian, J., 1985, Employment Tenure and Earnings
Profiles in Japan and the United States, AER, Vol. 75, No. 4.
Haveman, R.H. - Hollenbeck, K., 1980, (eds.), Microeconomic Simulation
Models for Public Policy Analysis, Vol. 2, Academic Press, New York.
Holmlund, B., 1984, Labor Mobility, IUI, Stockholm.
Lawrence, C. - Lawrence, B., 1985, Manufacturing Wage Dispersion: An End
of Game Interpretation, Brookings Papers in Economic Activity, L
Lundberg, E., 1985, The Rise and Fall of the Swedish Model, JEL, Vol. XXIII
(March).
Schager, N.H., 1985, The Replacement of the UV-curve with a New Measure
of Hiring Efficiency, IUI Working Paper No. 149, Stockholm.
Stafford, F.P. - Duncan, G.J., 1980, Do Union Members Receive
Compensating Wage Differentials, AER (June).
Stiglitz, J.E., 1985, Equilibrium Wage Distributions, The Economic Journal,
Sept.
Wicksell, K., 1898, Geldzins und Giiterpreise, Jena.
Örtengren, J., 1988, Industristödet och staten som företagsägare, in
Expansion, avveckling och företagsvärdering i svensk industri, IUI,
Stockholm.

-32 -
Table 1 Relative wages in crisis industries
Index 100 = other industries
1970/72 1974/76 1980/82
Iron ore 119 127 125
Steel 114 122 114
Shipyards 109 109 106
Other industry 100 100 100
Source: Örtengren (1988).
Table 2 Wage and price increases, profit margins and open
unemployment in policy experiments
Experiment First 10 year Second 10 year period period 1982-1992 1992-2002
Wages, average nominal in- No. l tre! 7.1 9.3 crease percent No. 2 61 Restricted 5.7 7.8 per year No. 3 62 Fast 18.6 7.2
Producer :Qrices ditto No. 1 6.9 5.9
No. 2 6.9 5.6 No. 3 8.5 4.6
Profit margins percent of No. 1 56.1 65.5 value added No. 2 59.1 70.8
No. 3 34.5 40.6
Unem:Qloyment per cent No. 1 3.2 1.8
No. 2 2.4 1.2 No. 3 15.2 18.3
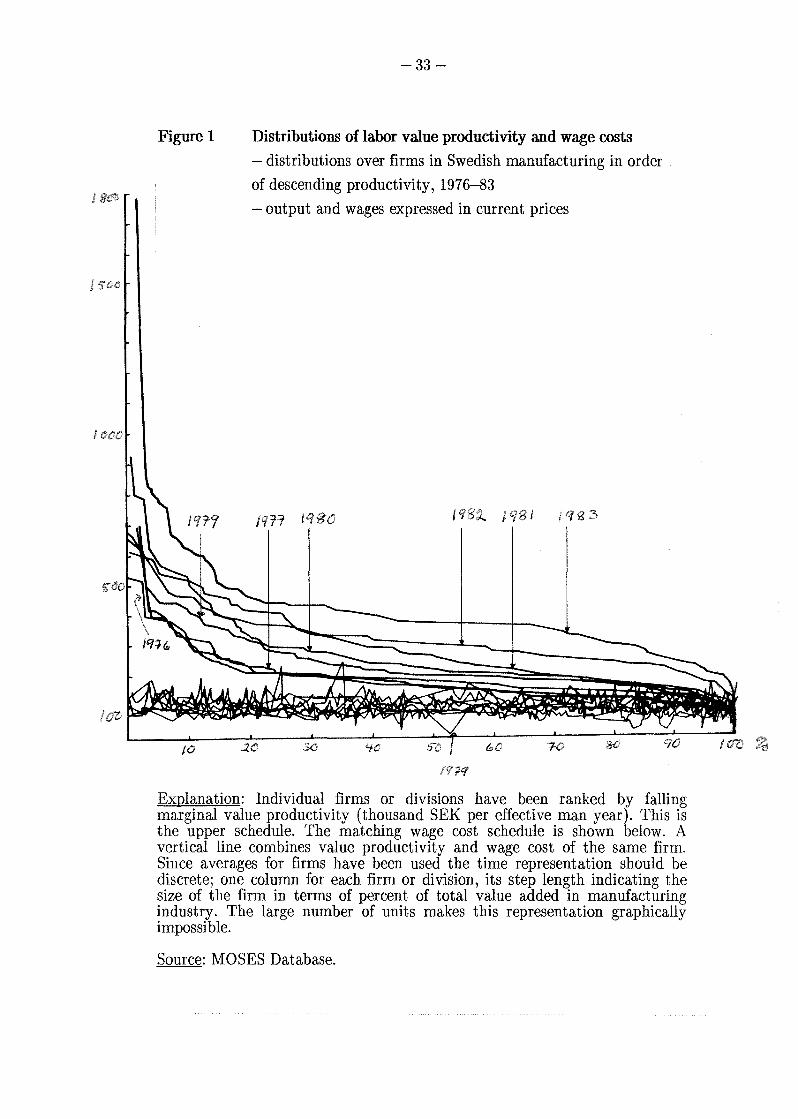
Figurel
-33-
Distributions of labor value productivity and wage costs - distributions over firms in Swedish manufaeturing in order
of descending produetivity, 1976-83
- output and wages expressed in eurrent priees
Explanation: Individual firms or divisions have been ranked by falling marginal value produetivity (thousand SEK per effeetive man year). This is the upper sehedule. The matehing wage eost sehedule is shown below. A vertieal line eombines value produetivity and wage eost of the same firm. Since averages for firms have been used the time representation should be diserete; one eolumn for eaeh firm or division, its step length indieating the size of the firm in terms of percent of total value added in manufaeturing industry. The large number of units makes this representation graphically impossible.
Souree: MOSES Database.

M
Figure 2
•
•
•• • •
• • •
• • • • • . ' • • •
• • • • ••
• •• • • • • • • • • • • • • t. • ".
-34-
Profit margins (M) and capita! (va!ue) coefficients (K/PQ) in
Swedish ma.nufacturing fiI'IDS 1979
• • •
t
• • • • • •
• • • • • • • • • • • • • • • •• • • t. • • • • • • • • • • • • •
• • • • • • • • • • • • ••• • • • • • " •
' .. • • .. • • • • • • • • • • •
• .. • , • • • • • •
•
Source: MOSES Database.
• •
• • • •
• •
• •
• • •
•
•
•
Capital coefficients

Figure 3
3 A. 1976
-35
Profits per employee and relative wage (RW) in Swedish
manufacturing firms 1976 and 1983
y = DLOCN = (W-W)
I
= PQ-WL x = QWL L
Relative wage
:-1 ";-"11"r . --+_ ..
-,. -'-r--- --_.-; I !
0.05
0.Q6
0.04
I I I 'r- ; -T' -. I i . j" : ; ,
O .02-1-. ~:-.~-'I-- -1" "'1 ! t l I. I' i
O O 1 I. . • •
O.Ol
I
I . 1"":';r~. -~ .. ' -- '-t I " I' I I ' .",,,": .. 'o • ! I
O.oO~~~~~-+-r~~~--+---~~--~---+~~--~--~~--~---
'''. J .el~~.~ ~~: o ~. al'! o. 5 t) 6 tf. 1- : o S CI" I J
1'0 i {,f'- 1.
1.3
I Profits/
IlS '-'
I r employeE :o.'nlt l!;, l, -0.01 ;~Ir' _ .. - -_..,
, ~~, ~, '
-o .-G-2 ~~ _J.. .....LI : I ., I ~ . I
I
~ r ~ ..
,
I I
I ·t·
I I I !
I I -,
I I
I I ,
I I
I
I -0.03
I !
.. L -' ; I ' I. : l -0.04
-0.05
-0.06 •
Note: Relative wages (RW) are defined as percentage wage difference from industry average.
Source: MOSES Database.

, I 0,
Relative wa<Je
I I
• I
: 0.11' r ~ . . . I o,,~ • • • • •
• • el • , ~ I (;II~ 1 fil i • 1·
i I II.lÄ .,. ...: . •
~ I I I .' " • • • ,,_
; I I - \., • • " I I j "IJ' ,'I • : • ~. ' .. • I .
i ~,:;t' ... : t. •
I • i, .,
I P,p, .' I I • I ! t),cy
I I " I
, I .' I •
• I •
•
I . , ,
.1
•
•• I
, .'
Note: Relative wages (RW) are defined as percentage wage difference from industry average.
Source: MOSES Database.
I~
w mvL profits O')
per I I. 'f e;:nployee

-37-
Figure4 Relative wages, relative change in profit margins, and relative
wage, employment and output change in manufacturing
establishments
4 A. Relative output (DQ) and employment (DL) ch ange 1980-83.
31
f
21-t
11-t • t
D • • ... • • t • O • t
• • t,.. tf
I- t t ~~I.. • .? i .tr." •
t • • \ • • t -i8 - • • • • • • -21
-8.2 -e.1 8:' I
0.1 DL
DQ = 1.7 + 37.7 DL, R2 = 0.13
(3.8)
DL = Relative change in employment
DQ = Relative change in deflated value added
DW = Relative change in wage costs per unit oflabor input
DM = Change in profit margins (percentage point s )
•
8.2
RW= Rate of deviation from average wage in manufacturing (percent)
Source: MOSES Database.

-38 -
Figure 4 (continued)
4 B. Relative employment (DL) and wage (DW) change 1980-83.
I.l ..... ------~--------. t
8.1- t t
t
• • fl D 8.8 - f ~. tf.
L • • ~:1, t
• t t ~ • · tr t ..\ . -8.1- t • • • •
• • • t
• -1.2 t
-8.l -9. i 8.8 9.1/ DM
Source: M OSES Da ta Base.
DW= 0.1 + 1.4 DL,
(11.4)
R2 = 0.58
Source: MOSES Database.
• •
S.l

-39-
Figure 4 (continued)
4 C. Relative change in output (DQ) and in profit margins (DM) 1980-83.
1.5
• • • • t • .* · t(t t
8.8- ti4'!I' .. t t tf> t...... f •
• f
O -2.5· M
t
-5.8· •
• I -7. 5 ~_~~_,......_-,..-_...,._.....,
-28 -le 8 18 il 38 DO
Note that DM measures change in profit margin expressed in percentage points.
Source: MOSES Database.

40 -
Figure 4 (continued)
4 D. Relative change in profit margins (DM) and relative wages (RW),
1980-83
1.121 .... ----------..... •
8.815· , t
R t .. W " ,.t' 8.811· • • •• • • •
'fil • • • t
•.•• 5 -1.5 -5'.9 -2.5 9.9 2.5
DM
Source: MOSES Database.

Figure 5
{nde.
120
110
I
-41-
Relative labor cost per unit produced, domestic and foreign
currency. Swedish manufacturing 1970-84
Index 1970 = 100
100~t ____ ~~ __________ ~ __ __
90
80
1970 75 80
domestic currency
foreign currency
Source: Schager (1985).
85

Figure 6
30
20
10
-42-
Real rate of return in Swedish manufacturing (RR ) and the
Swedish real interest rate (IR), 1951-86
Index 1975 = 100
RR
I t t I I , ! , I • I , I I J a f I l , • • • I I I J I , I h I t I I
1951 55 60 65 70 75 80 85 86
RR ---- IR
Note: Real rate of return (RRT) on total assets (machinery, buildings and inventories) in the manufacturing industry 1951-85 and real rate of interest (IR) on long-term industrial bonds.
Source: Expansion, avveckling och företagsvärdering i svensk industri, IUI, Stockholm, 1988.

Figure7
210
200
190
180
170
160
150
140
130
120
110
1\:JO 198:5
43 -
Manufacturing output in the three policy experiments
1982-2002
Index 1983 = 100
._--. I !.
.. -_ .. I
Fast "' --
I
... . ... I
i I ... -"1 ---... - -
: -.. :.- r i
85 90 95 2000 2002
(2)
(3)
Year

Figure8
-44-
Productivity and wage distributions 1982 and 1985
and simulated distributions 1985
Hnu. SEl '{'hV urrr?JU-1.48
, .. l: ': , ;00,\
, o,
8.68 \".' ~, ~--~~~~~--'" --. '-----------... .... ....... -. --.. --____ ... _______ - :. __ oo_o_oo ___ ~~==:___~
• 20 ----------:::::::.:-....... -.. ~ . ---- -~-. .... _ ... ~ ........
10 6eJ "'Tt}
Note: The upper curves show distributions of value productivities, ranked in decreasing order over firms and weighted by value added. The lower curves show the matching nominal wage cost distributions.
The simulation began on the 1982 initial dat ab ase (- -). The outcome of the simulation ( ... ) can be compared with the real 1985 state from the database (-).
Source: MOSES Database.

JOO
I o
I D
I'(){)
Figure 9
'-\ ..... , \
I"" ,
-45 -
Wage cost and value productivity distributions 1992 In
reference case and in fast market experiment
Value productivity in Fast /
'-----, productivity i>tl ----- -
Fast labor markets (No. 3)
Reference case (No. 1)