economic growth and life satisfaction in japan: does happiness
TRANSCRIPT
PART II
Economic Growth and Life Satisfaction in Japan:
Does Happiness Prevail with Economic Prosperity?
This part explores the issue of quality of economic growth by paying closer attention to the relationship between economic growth performance and changes in people’s subjective wellbeing in Japan.1 For the analysis of this linkage, the study has utilized range of data gathered by the government of Japan to apply different types of development and progress index. Japanese economic development will be discussed from non-monolithic perspectives. Also, an initiative taken seriously by a local government cantering on life satisfaction or happiness as a core mandate for their public policy making and public services provision will be highlighted
1 This part has included an updated version of the paper by Kusago (2007) with latest economic and social data available after 2002.

Economic Growth and Life Satisfaction in Japan

Economic Growth and Life Satisfaction in Japan
1 Japan: A miraculous economic growth after WWII
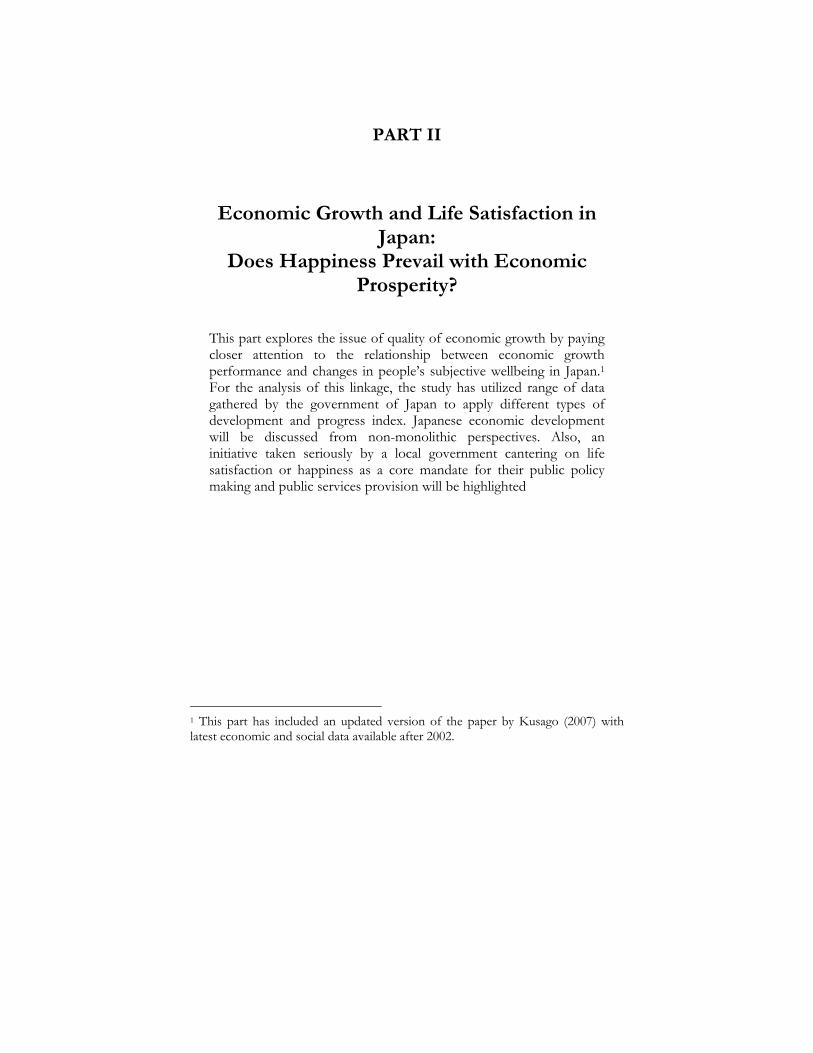
With Japan’s extraordinary national economic growth since 1945, which was orchestrated by the Japanese government and achieved through the hard work of Japanese companies and their employees, the Japanese seemed to enjoy one of the world’s highest levels of economic attainment. In 1945, reconstruction of Japan started with the Allied Powers’ economic policy, which included disbandment of financial cliques (zaibatsu) such as Mitsubishi and Mitsui, agricultural land reform and implementation of the Dodge line. After Japan regained its independence in 1952, the Japanese government struggled with its economic reconstruction. In the late 1950s, Japan finally experienced economic boom with higher industrial production and in 1956, the government declared that the post-war reconstruction period was almost over (Nakamura 1985). To accelerate reconstruction of the economy, Japan became a member of the World Bank and the IMF in 1952 and subsequently received loans from the World Bank to finance infrastructure development such as dams, roads, and railways. In this manner, Japan got on track to grow its economy rapidly in the 1950s and 1960s. With this economic recovery and growth, Japanese people were viewed as improving its economic and social standard of living. In the 1970s, Europeans described Japanese workers as “economic animals” in the context of warning the world about Japanese economic power. In fact, that description is not far from the mark. The majority of Japanese migrated from rural to urban areas to obtain a job in the high-growth manufacturing sector. They worked long hours, and perhaps, as a result of this hard work, their economic wellbeing improved with the sharp economic growth of the 1960s and 1970s. During Japan’s rapid economic growth from the 1960s to the early 1980s, the wage level of Japanese workers, on average, increased every year and they enjoyed growing purchasing power. One could claim that the Japanese came to perceive economic growth as a good measurement to indicate the level of economic security and prosperity for themselves. If we look at Japan based on its economic performance (GDP), as shown in Figure 2.1, we see that it achieved extraordinary high economic growth after World War II. Some academics and policymakers in the West described Japan’s high economic growth in the 1960s and 70s as a “miracle”. With this, many Japanese families were able to build their own houses, although their sizes were smaller than those mostly found in other developed
Economic Growth and Life Satisfaction in Japan
countries. They also sent their children to secondary schools, and enjoyed longer life partly because of the Japanese public universal health care system with the increase in government tax revenues.
Figure 2.1: Japan’s economic growth: GDP per capita, and GDP growth rate
GDP Growth and GDP per capita
0.00.51.01.52.02.53.03.54.04.5
1955
196019
6519
70197
5198
0198
5199
0199
520
00200
5
Year
Mill
ion
Yen
-5.0
0.0
5.0
10.0
15.0
GDP per capitaGDP growth
Data Source: National Accounts, Economic and Social Research Institute, Cabinet Office As Figure 2.2 shows, school enrollment rates in Japan improved dramatically in a very short period, gaining more than 30% for high school enrollment rates from 1955 to 1970, and the rate reached closer to 100% in 2005. Similarly, the enrollment rate for university2 has also been upwards, and the rate, less than 10% in 1955, reached more than 50 % in 2005. As shown in Figure 2.3, the health of the Japanese also improved. Soon after the war ended, life expectancy was merely fifty years old for men, an age far exceeded now and one of the longest in the world. With these descriptions, it can be seen that the Japanese have made great progress and gained both economic and social wellbeing during the post-World War II era. Japan’s success can be viewed as a good practice by human resources development approach (Shultz 1963). Alternatively, it could be viewed as a good model for use of local budget increased by strong local economic growth to support social development through allocating it more for education and health sectors.
2 University consists of four-year college and two-year junior college.

Economic Growth and Life Satisfaction in Japan
Figure 2.2: School enrollment rates in Japan
School Enrolment for Secondary and Higher Education
0
10
20
30
40
50
60
70
80
90
100
1955 1960 1965 1970 1975 1980 1985 1990 1995 2000 2005
Year
%
High school
University
Data Source: Basic Surveys on Schools, Ministry of Education, Culture, Sports, Science and Technology
Figure 2.3: Life expectancy at birth in Japan by gender
Life Expe c ta nc y a t Birth in Ja pa n
0
10
20
30
40
50
60
70
80
90
1947 1955 1965 1975 1985 1995 2005
Ye a r
Ma leFe ma le
Data Source: Life Table, Ministry of Health, Labour and Welfare
Economic Growth and Life Satisfaction in Japan
1.1 Has GDP expansion brought about safe and secured lives for the Japanese?
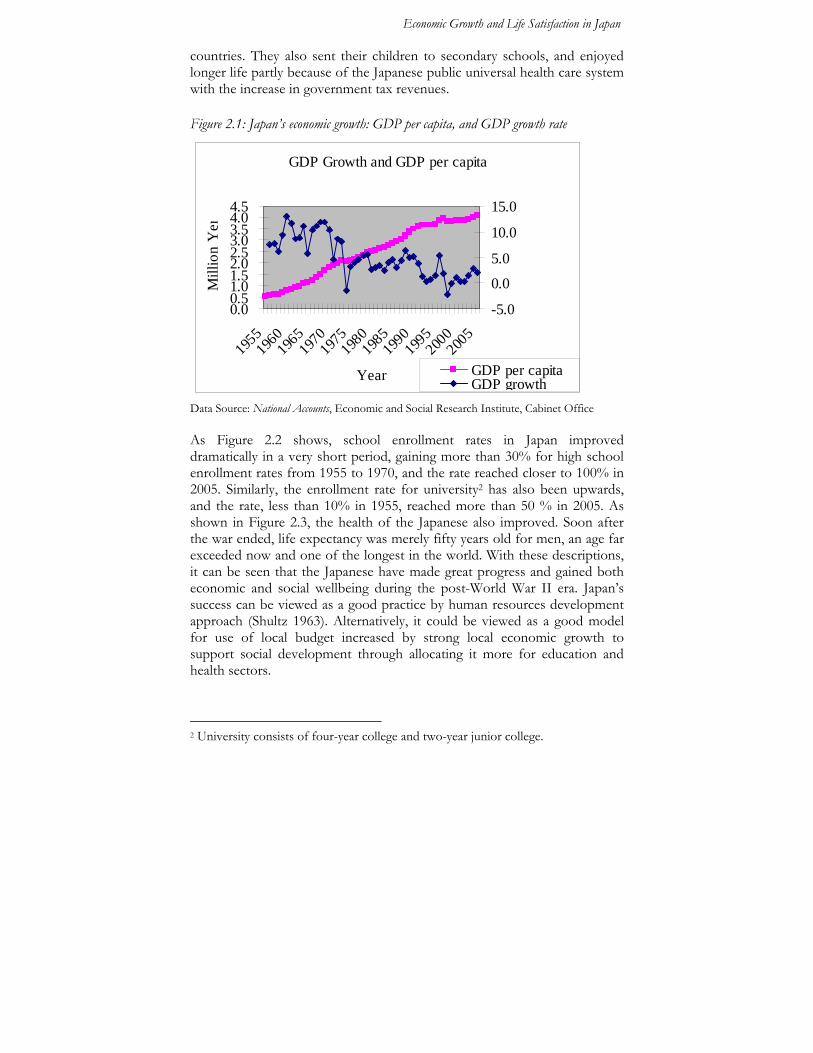
As we have seen, in the post-World War II period, the Japanese managed to gain economic wellbeing with higher economic growth performance. However, it is important to pose the question: Are the Japanese satisfied with their life as long as their economic growth continues? If we look at some social statistics, things do not look particularly good for Japan and the Japanese people. For example, as Figure 2.4 shows, the number of suicide cases was very high in the mid-1950s when many Japanese men, who returned from the war front, struggled to find a job. However, the number of suicide cases was gradually increasing from the 1960s to the 1980s even though the Japanese economy experienced higher economic growth. As for security in Japan’s daily life, the number of crimes can be a good proxy, and it has increased over time, particularly after the 1980s (Figure 2.5). These social statistics imply that economic prosperity is not the sole factor to ensure the Japanese have a higher social wellbeing. The Japanese has faced with different kinds of serious social problems. This leads us to scrutinize more if and to what extent the Japanese are satisfied with their lives.
Figure 2.4: Suicide cases in Japan
Suicide cases per 100,000
05
10152025303540
1947 1950 1955 1960 1965 1970 1975 1980 1985 1990 1995 2000 2005
Year
AllMaleFemale
Source: Vital Statistics of Population, Ministry of Health, Labour and Welfare

Economic Growth and Life Satisfaction in Japan
Figure 2.5: Crime cases in Japan
The Number of Cases of General Offenses Under Penal Code
0
500,000
1,000,000
1,500,000
2,000,000
2,500,000
3,000,000
1947 1950 1955 1960 1965 1970 1975 1980 1985 1990 1995 2000 2005Ye
Data Source: Criminal Statistics, Criminal Investigation Bureau, National Police Agency
1.2 Examining Japanese growth by GPI and HDI
Japan’s per capita GDP has grown post World War II (see Figure 2.1). The GDP indicator tells us the size of the economy, which consists of private production and consumption, and government spending. However, GDP does not tell us what goods and services are produced and consumed, nor does it tell us how each individual values his or her increase in purchasing power. GDP growth could be attained by the performance of large multinational companies, which seek to maximize their profits and minimize their costs to compete in the global market. Companies tend to emphasize short-term profits at the cost of long-term impacts, including those on the environment. These behaviors could enhance GDP expansion, which might have little connection with the improvement of people’s overall wellbeing. New efforts have been made to gather data on social and economic development and to devise alternatives to GDP that monitor social and economic progress. Two alternatives are highlighted here: (1) Genuine Progress Index (GPI), and (2) Human Development Index (HDI).

Economic Growth and Life Satisfaction in Japan
1.3 Measuring quality of growth by GPI
Figure 2.6: GDP per capita and GPI per capita in Japan
0500
1,0001,5002,0002,5003,0003,5004,0004,500
1955
1959
1963
1967
1971
1975
1979
1983
1987
1991
1995
1999
Year
thousand yen
GDP per capitaGPI per capita
Data source: Ohashi, Nakano, Makino, and Wada, 2003 GPI was created by a US non-profit research group called Redefining Progress to incorporate social costs (pollution, crime, and the like) into growth measurement (GDP). GPI starts from the same personal consumption data on which GDP is based. Then, it is adjusted by subtracting important destructive costs, and adding social and economic benefits. For example, it adds the value of time spent on household work and volunteer work, and subtracts expenditures for security systems, hospital bills, etc (see Cobb Halstead, and Rowe 1995). There are 10 major adjustment groups: household and volunteer work, income distribution, crime and family breakdown, resource depletion, pollution, long-term environmental damage, changes in leisure time, defensive expenditures, life span of consumer durables and public infrastructure, and dependence on foreign assets. For example, the number of hours for voluntary activities is considered as social benefits and the worth of such activities is calculated by the hours and the minimum wage level. These adjustments are made to calculate GPI for Japan. Based on this GPI calculation method, Japan’s GPI was calculated by a group of Japanese researchers (Ohashi, T., Nakano, K., Makino. M., and Y. Wada, 2003) and they found a huge discrepancy between GDP and GPI for the last four decades.

Economic Growth and Life Satisfaction in Japan
HDI consists of the three dimensions of human development: (1) long and healthy life, (2) knowledge, and (3) decent standard of living. The three dimensions identify the following indicators: Long and healthy life: life expectancy at birth (indicator) and life expectancy index Knowledge: adult literacy rate and gross enrollment ratio (indicators), and education index Decent standard of living: GDP per capita (indicator) and GDP index The HDI is calculated by putting an equal weighting on the three indices. According to the Human Development Report 2006, Japan’s life expectancy at birth is 82.2, gross enrollment ratio is 85, GDP is US$29,251, and HDI value is 0.949, ranking Japan 7th in the world. Although the growth in GDP is traced as an upward-moving curve, the growth in GPI is traced as a relatively flat line (Figure 2.6). This implies that a substantial proportion of GDP growth has been made at the expense of environmental degradation, social instability and increased crime, which raises critical questions about the importance and effectiveness of economic growth in ensuring true social and economic welfare. Interestingly, unlike GDP, GPI has not changed much for the last three decades in Japan. This suggests that GDP growth has not incorporated social costs incurred by economic activities aiming at high economic growth performance.
1.4 HDI (Human Development Index) for Japan
HDI was developed by the UNDP in 1990 (UNDP 1990), based on Amartya Sen’s capability concept and approach (Sen 1985). Since then it has become popular among development practitioners and researchers. HDI has three major components of human development indicators: income as a proxy for decent economic life, education for a proxy for good knowledge base, and health as a proxy for healthy life.3
3 HDI consists of the three dimensions of human development: (1) long and healthy life, (2) knowledge, and (3) decent standard of living. The three dimensions identify the following indicators: Long and healthy life: life expectancy at birth (indicator) and life expectancy index Knowledge: adult literacy rate and gross enrollment ratio (indicators), and education index Decent standard of living: GDP per capita (indicator) and GDP index
Economic Growth and Life Satisfaction in Japan
Using the composite index of human development, HDI revealed that the Japanese, on average, have access to good public services and a high income base. The latest HDI ranking put Japan at 7th in the world (UNDP 2006), which is consistent with our general views about Japan’s development: it has a solid economic base, high educational attainment, and strong health services. However, the place of Japan in the world ranking of HDI has been gradually declining from 1st in 1993 to 7th (UNDP 2006) which might be influenced by the sluggish economic performance after the bubble economy collapsed in the 1990s.
1.5 Regional variations and discrepancies between GDP and HDI
Arguments on Japanese economic and social progress post World War II have so far based solely on national data. There might be some variations in the country by region and by time. In this section, Japanese development will be looked at by examining the possibility of regional variations in economic growth and people’s satisfaction.
1.5.1 People’s wellbeing rankings by prefecture-based HDI
Table 2.1 shows Japan’s prefecture-based HDI4 for 1990, 1995 and 2000, which were calculated by the author using official data on per capita GDP, education and health. In 2000, prefecture-based HDI scores in Japan ranged from 0.9065 for Aomori Prefecture to 0.9667 for the Tokyo Metropolitan Area. The UNDP Global HDR 2006 shows the world’s highest HDI to be 0.965 for Norway, which Tokyo surpasses, and 0. 910 for Slovenia, ranked 27th, 0.904 for Portugal, ranked 28th close to Aomori’s value, 0.907. This means that all of the prefectures in Japan are categorized in the high-HDI group. However, people living in Tokyo enjoy higher human development than elsewhere in Japan.
The HDI is calculated by putting an equal weighting on the three indices. According to the Human Development Report 2006, Japan’s life expectancy at birth is 82.2, gross enrollment ratio is 85, GDP is US$29,251, and HDI value is 0.949, ranking Japan 7th in the world. 4 Calculated by the author from (1) school enrollment rate from Basic Surveys on Schools, Ministry of Education, Culture, Sports, Science and Technology, (2) life expectancy rate from Life Table, Ministry of Health, Labour and Welfare, (3) per capita GDP from Annual Report on National Economy, Cabinet Office using the UNDP’s HDI method (see UNDP, 1990).

Economic Growth and Life Satisfaction in Japan
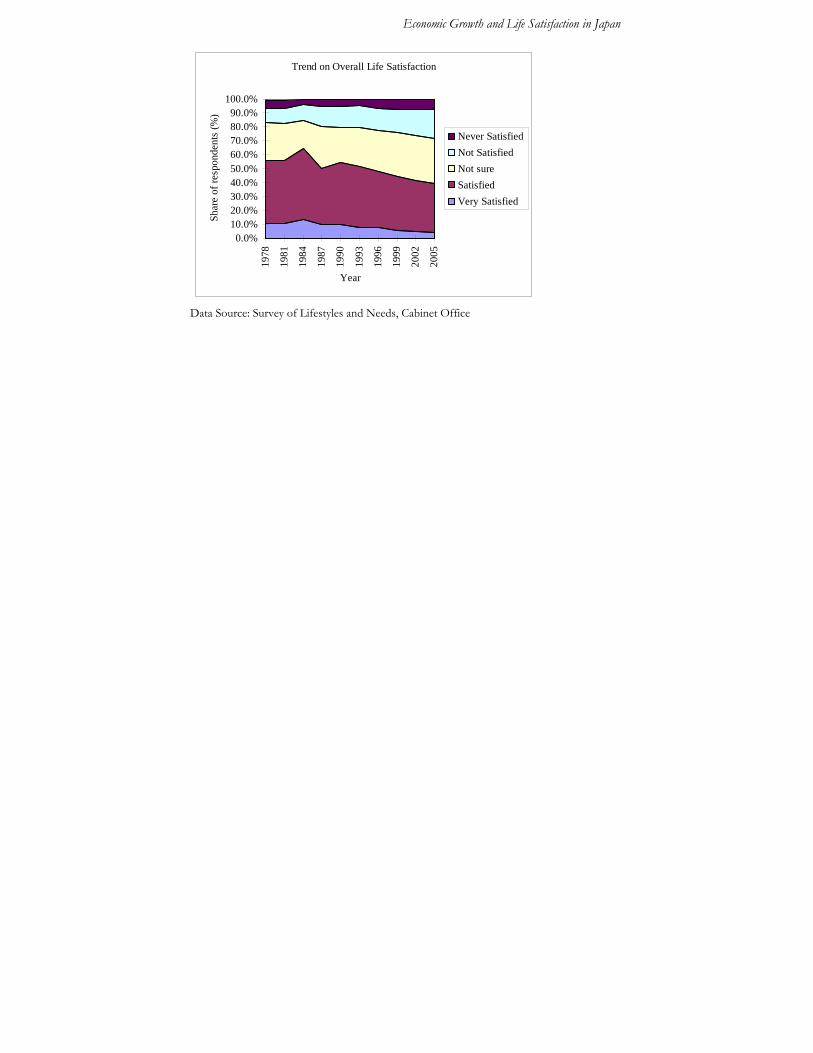
1.5.2 Trends in overall life satisfaction in Japan (1978 - 2005)
Table 2.1: HDI in Japan by prefecture: 1990, 1995 and 2000
HDI 1990 1995 2000 Hokkaido 0.8863 0.9068 0.9260 Aomori 0.8698 0.8877 0.9065 Iwate 0.8792 0.8998 0.9186 Miyagi 0.8926 0.9071 0.9247 Akita 0.8777 0.8951 0.9142 Yamagata 0.8855 0.9014 0.9216 Fukushima 0.8880 0.9044 0.9241 Ibaraki 0.8928 0.9080 0.9259 Tochigi 0.8955 0.9107 0.9294 Gunma 0.8957 0.9117 0.9303 Saitama 0.8811 0.8956 0.9166 Chiba 0.8868 0.9019 0.9219 Tokyo 0.9296 0.9448 0.9667 Kanagawa 0.8996 0.9119 0.9324 Niigata 0.8921 0.9095 0.9290 Toyama 0.9031 0.9205 0.9392 Ishikawa 0.8991 0.9163 0.9364 Fukui 0.9027 0.9204 0.9401 Yamanashi 0.8944 0.9094 0.9319 Nagano 0.8980 0.9148 0.9365 Gifu 0.8921 0.9070 0.9263 Shizuoka 0.9056 0.9204 0.9402 Aichi 0.9115 0.9265 0.9460
HDI 1990 1995 2000 Mie 0.8934 0.9123 0.9329 Shiga 0.9080 0.9229 0.9426 Kyoto 0.8952 0.9123 0.9333 Osaka 0.9003 0.9177 0.9390 Hyogo 0.8950 0.9086 0.9290

Economic Growth and Life Satisfaction in Japan
To what extent do Japanese subjectively feel satisfied with their lives? Figure 2.7 shows trends in subjective life satisfaction as surveyed by the Cabinet Office’s Survey of Lifestyles and Needs, which has been conducted every three years since 1978. It clearly shows that the number of people who report feeling “satisfied with life” or “very satisfied with life” has declined over time. The number of Japanese who report feeling “satisfied with life” or “very satisfied with life” decreased from 64.2% in 1984 to 39.5% in 2005, while those who report feeling “unsatisfied with life” or “never unsatisfied with life” increased from 11.1% in 1978 to more than 28.3% in 2005. It is important to note that fewer than one in twenty-five Japanese reports feeling very satisfied with life in 2005.
Figure 2.7: Overall Life Satisfaction in Japan
Nara 0.8794 0.8944 0.9169 Wakayama 0.8770 0.8957 0.9155 Tottori 0.8887 0.9045 0.9239 Shimane 0.8858 0.9021 0.9231 Okayama 0.8992 0.9152 0.9316 Hiroshima 0.9032 0.9170 0.9361 Yamaguchi 0.8924 0.9084 0.9258 Tokushima 0.8831 0.9005 0.9182 Kagawa 0.8945 0.9122 0.9304 Ehime 0.8862 0.9047 0.9221 Kochi 0.8781 0.8964 0.9156 Fukuoka 0.8896 0.9061 0.9228 Saga 0.8810 0.9021 0.9189 Nagasaki 0.8749 0.8949 0.9127 Kumamoto 0.8872 0.9045 0.9225 Oita 0.8891 0.9076 0.9285 Miyazaki 0.8780 0.8959 0.9148 Kagoshima 0.8762 0.8938 0.9127 Okinawa 0.8810 0.8940 0.9111
Economic Growth and Life Satisfaction in Japan
Trend on Overall Life Satisfaction
0.0%10.0%20.0%30.0%40.0%50.0%60.0%70.0%80.0%90.0%
100.0%
1978
1981
1984
1987
1990
1993
1996
1999
2002
2005
Year
Shar
e of
resp
onde
nts
(%)
Never SatisfiedNot SatisfiedNot sureSatisfiedVery Satisfied
Data Source: Survey of Lifestyles and Needs, Cabinet Office

Economic Growth and Life Satisfaction in Japan
1.5.3 In what prefectures did Japanese people report the greatest life satisfaction?
If we assume that people assess fairly well over their own subjective life satisfaction, the degree of happiness can be explained by the number of people who felt satisfied or unsatisfied. The author checked the level of life satisfaction by the number of people who have felt very satisfied or satisfied with their life by prefecture. Table 2.2 shows Japanese prefectures ranked at the top five or at the bottom five by HDI, GDP and Life Satisfaction in Japan5. The top five by HDI are Tokyo, Aichi, Shiga, Shizuoka, and Fukui. On the other hand, the top five by GDP are Tokyo, Aichi, Osaka, Shiga, and Shizuoka. The top five by HDI and the top five by GDP show significant overlap, mainly because GDP is the most influential component in HDI, due partly to the fact that educational data and health data do not differ so much across the nation. A similar tendency is also found among the bottom five by GDP and HDI. However, if we look at the figures from sub-regional groupings we find some differences between prefecture ranking by GDP and one by HDI. For prefectures in the Hokkaido, Tohoku and Kyushu regions, their rankings by GDP are higher than those by HDI. In contrast, for prefectures in the Kansai and Kanto regions, their rankings by HDI are higher than those by GDP. This suggests that educational development and public health development differ from economic growth in the Hokkaido, Tohoku and Kyushu regions. Interestingly, these regions have been the origins of rural-urban migration in Japan in its industrial development and also have been the beneficiaries of public works programs from central government to support local construction sector for decades, while the Kansai and Kanto where major cities like Tokyo, Yokohama, Osaka, Kyoto, and Kobe are all located, do far better in education and health services than income component. This might imply that more non-economic progress has been made in major cities and urban areas than rural regions, implying that public policy might have influenced this regional variation in HDI and GDP for Japan. Table 2.2 shows there is very little connection between prefecture-based GDP and Life Satisfaction rankings. More surprisingly, there is far less
5 Sample survey was conducted by the Cabinet Office and here the ‘Happiness indicator’ is created based on the following question (Q) and answers (A): Q. Are you happy with your life overall? A. 1. Very Satisfied, 2. Satisfied, 3. Not satisfied or unsatisfied , 4. Unsatisfied, 5. Never Satisfied.
Economic Growth and Life Satisfaction in Japan
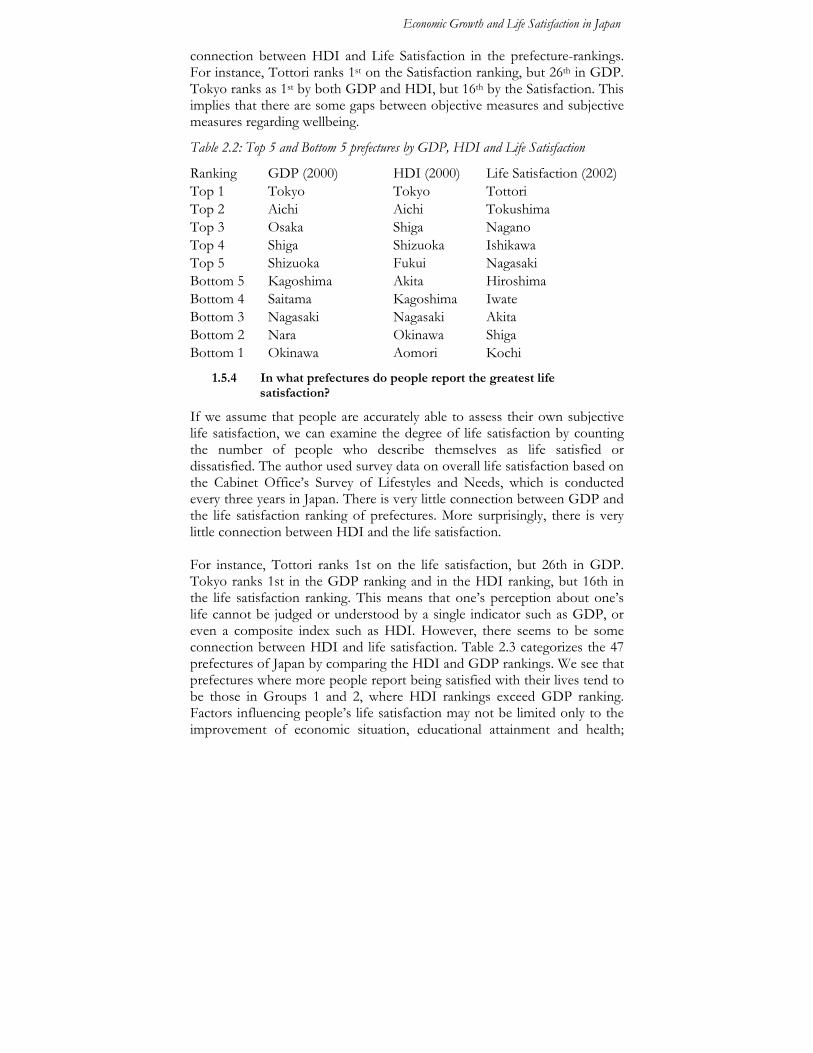
connection between HDI and Life Satisfaction in the prefecture-rankings. For instance, Tottori ranks 1st on the Satisfaction ranking, but 26th in GDP. Tokyo ranks as 1st by both GDP and HDI, but 16th by the Satisfaction. This implies that there are some gaps between objective measures and subjective measures regarding wellbeing.
Table 2.2: Top 5 and Bottom 5 prefectures by GDP, HDI and Life Satisfaction
Ranking GDP (2000) HDI (2000) Life Satisfaction (2002) Top 1 Tokyo Tokyo Tottori Top 2 Aichi Aichi Tokushima Top 3 Osaka Shiga Nagano Top 4 Shiga Shizuoka Ishikawa Top 5 Shizuoka Fukui Nagasaki Bottom 5 Kagoshima Akita Hiroshima Bottom 4 Saitama Kagoshima Iwate Bottom 3 Nagasaki Nagasaki Akita Bottom 2 Nara Okinawa Shiga Bottom 1 Okinawa Aomori Kochi
1.5.4 In what prefectures do people report the greatest life satisfaction?
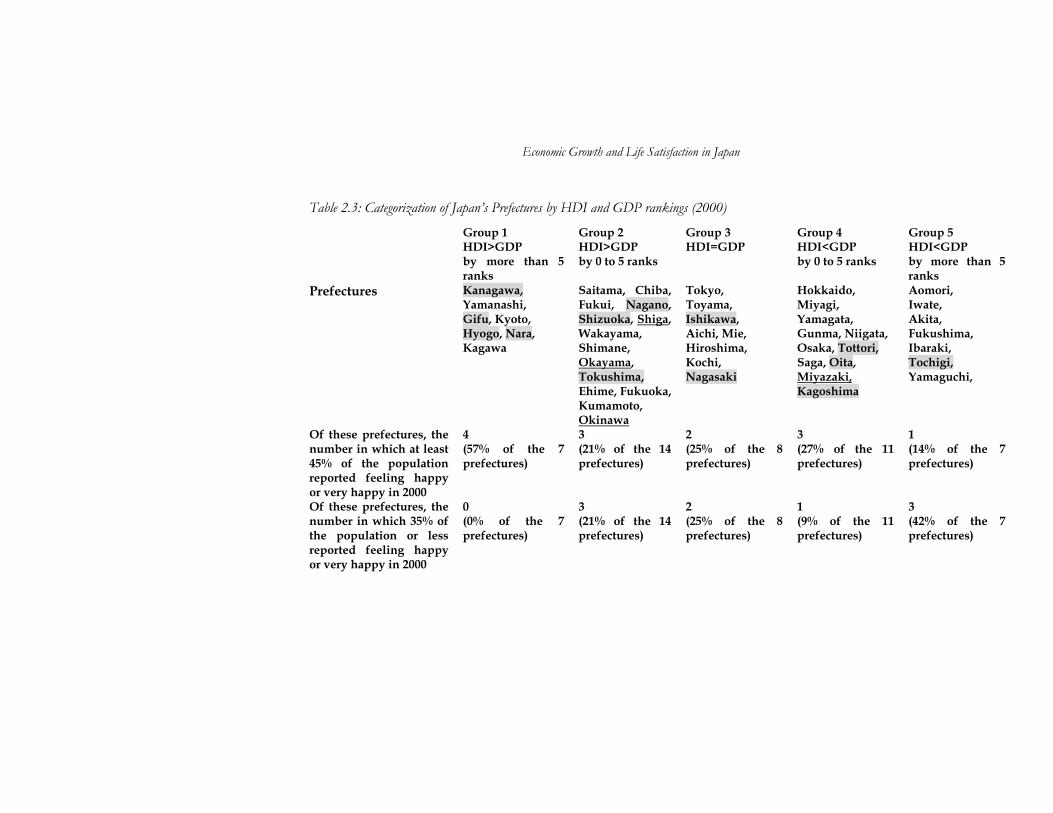
If we assume that people are accurately able to assess their own subjective life satisfaction, we can examine the degree of life satisfaction by counting the number of people who describe themselves as life satisfied or dissatisfied. The author used survey data on overall life satisfaction based on the Cabinet Office’s Survey of Lifestyles and Needs, which is conducted every three years in Japan. There is very little connection between GDP and the life satisfaction ranking of prefectures. More surprisingly, there is very little connection between HDI and the life satisfaction. For instance, Tottori ranks 1st on the life satisfaction, but 26th in GDP. Tokyo ranks 1st in the GDP ranking and in the HDI ranking, but 16th in the life satisfaction ranking. This means that one’s perception about one’s life cannot be judged or understood by a single indicator such as GDP, or even a composite index such as HDI. However, there seems to be some connection between HDI and life satisfaction. Table 2.3 categorizes the 47 prefectures of Japan by comparing the HDI and GDP rankings. We see that prefectures where more people report being satisfied with their lives tend to be those in Groups 1 and 2, where HDI rankings exceed GDP ranking. Factors influencing people’s life satisfaction may not be limited only to the improvement of economic situation, educational attainment and health;
Economic Growth and Life Satisfaction in Japan
rather, there might be other factors that affect one’s subjective evaluation over life. It will require more data and careful analysis to identify such factors, which go beyond the scope of this paper.
1.6 Analysis of people’s life satisfaction in Japan: who feel more satisfied with their life?
This section looks at Japanese development trends based on people’s subjective assessment and examine which groups of people in Japan feel satisfied or dissatisfied with their life. It also looks at which factors influence the level of subjective wellbeing by statistical tests.
1.6.1 Who feels more satisfied with their life than others?
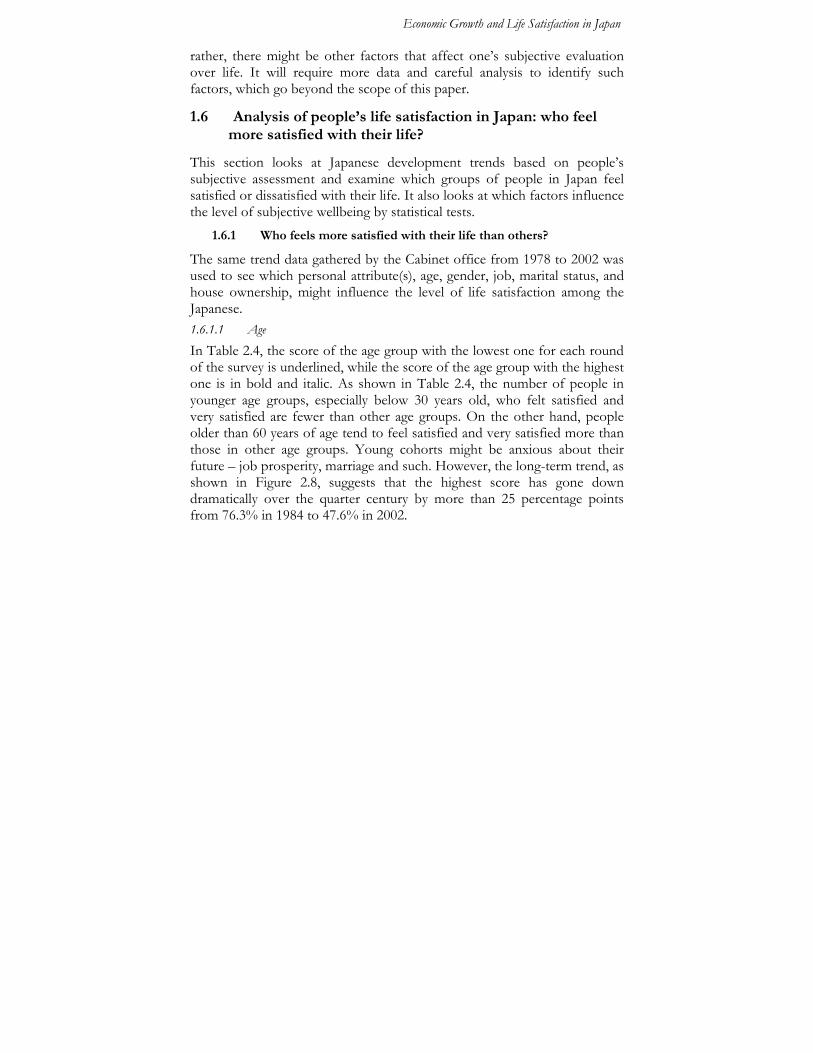
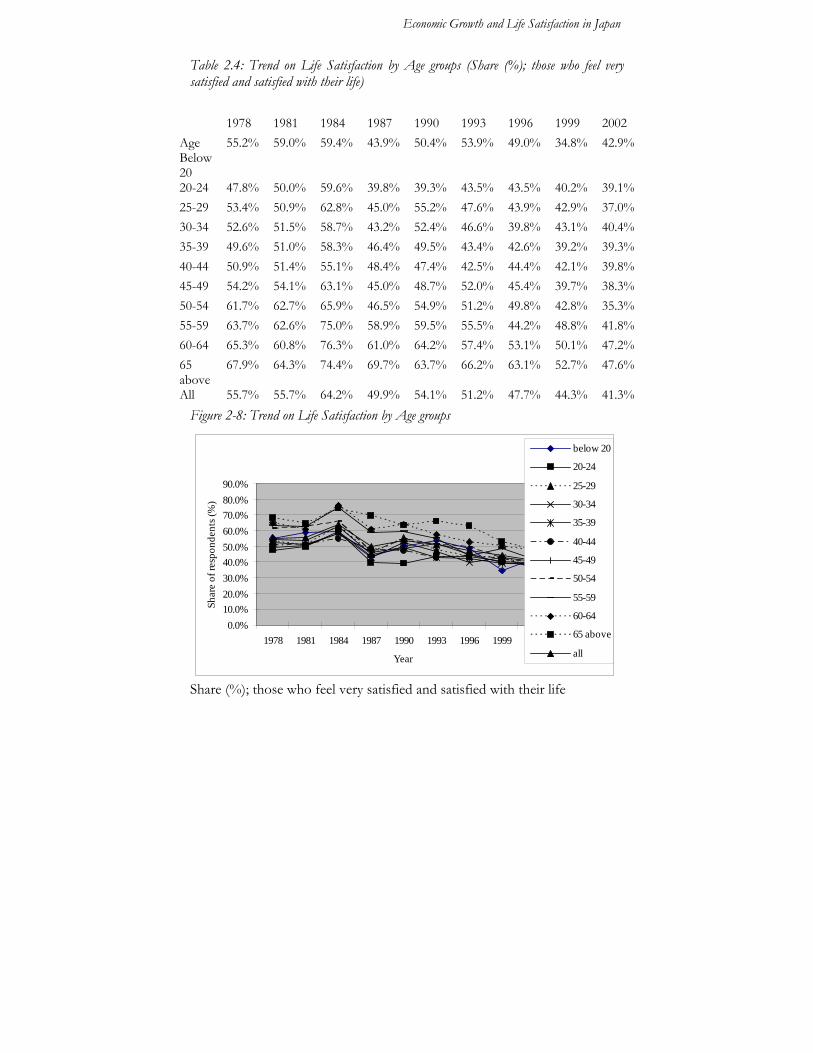
The same trend data gathered by the Cabinet office from 1978 to 2002 was used to see which personal attribute(s), age, gender, job, marital status, and house ownership, might influence the level of life satisfaction among the Japanese. 1.6.1.1 Age In Table 2.4, the score of the age group with the lowest one for each round of the survey is underlined, while the score of the age group with the highest one is in bold and italic. As shown in Table 2.4, the number of people in younger age groups, especially below 30 years old, who felt satisfied and very satisfied are fewer than other age groups. On the other hand, people older than 60 years of age tend to feel satisfied and very satisfied more than those in other age groups. Young cohorts might be anxious about their future – job prosperity, marriage and such. However, the long-term trend, as shown in Figure 2.8, suggests that the highest score has gone down dramatically over the quarter century by more than 25 percentage points from 76.3% in 1984 to 47.6% in 2002.
Economic Growth and Life Satisfaction in Japan
Table 2.3: Categorization of Japan’s Prefectures by HDI and GDP rankings (2000)
Group 1 HDI>GDP by more than 5 ranks
Group 2 HDI>GDP by 0 to 5 ranks
Group 3 HDI=GDP
Group 4 HDI<GDP by 0 to 5 ranks
Group 5 HDI<GDP by more than 5 ranks
Prefectures Kanagawa, Yamanashi, Gifu, Kyoto, Hyogo, Nara, Kagawa
Saitama, Chiba, Fukui, Nagano, Shizuoka, Shiga, Wakayama, Shimane, Okayama, Tokushima, Ehime, Fukuoka, Kumamoto, Okinawa
Tokyo, Toyama, Ishikawa, Aichi, Mie, Hiroshima, Kochi, Nagasaki
Hokkaido, Miyagi, Yamagata, Gunma, Niigata, Osaka, Tottori, Saga, Oita, Miyazaki, Kagoshima
Aomori, Iwate, Akita, Fukushima, Ibaraki, Tochigi, Yamaguchi,
Of these prefectures, the number in which at least 45% of the population reported feeling happy or very happy in 2000
4 (57% of the 7 prefectures)
3 (21% of the 14 prefectures)
2 (25% of the 8 prefectures)
3 (27% of the 11 prefectures)
1 (14% of the 7 prefectures)
Of these prefectures, the number in which 35% of the population or less reported feeling happy or very happy in 2000
0 (0% of the 7 prefectures)
3 (21% of the 14 prefectures)
2 (25% of the 8 prefectures)
1 (9% of the 11 prefectures)
3 (42% of the 7 prefectures)
Economic Growth and Life Satisfaction in Japan
Table 2.4: Trend on Life Satisfaction by Age groups (Share (%); those who feel very satisfied and satisfied with their life)
Figure 2-8: Trend on Life Satisfaction by Age groups
0.0%10.0%20.0%30.0%40.0%50.0%60.0%70.0%80.0%90.0%
1978 1981 1984 1987 1990 1993 1996 1999 2002
Year
Shar
e of
resp
onde
nts (
%)
below 20
20-24
25-29
30-34
35-39
40-44
45-49
50-54
55-59
60-64
65 above
all
Share (%); those who feel very satisfied and satisfied with their life
1978 1981 1984 1987 1990 1993 1996 1999 2002 Age Below 20
55.2% 59.0% 59.4% 43.9% 50.4% 53.9% 49.0% 34.8% 42.9%
20-24 47.8% 50.0% 59.6% 39.8% 39.3% 43.5% 43.5% 40.2% 39.1% 25-29 53.4% 50.9% 62.8% 45.0% 55.2% 47.6% 43.9% 42.9% 37.0% 30-34 52.6% 51.5% 58.7% 43.2% 52.4% 46.6% 39.8% 43.1% 40.4% 35-39 49.6% 51.0% 58.3% 46.4% 49.5% 43.4% 42.6% 39.2% 39.3% 40-44 50.9% 51.4% 55.1% 48.4% 47.4% 42.5% 44.4% 42.1% 39.8% 45-49 54.2% 54.1% 63.1% 45.0% 48.7% 52.0% 45.4% 39.7% 38.3% 50-54 61.7% 62.7% 65.9% 46.5% 54.9% 51.2% 49.8% 42.8% 35.3% 55-59 63.7% 62.6% 75.0% 58.9% 59.5% 55.5% 44.2% 48.8% 41.8% 60-64 65.3% 60.8% 76.3% 61.0% 64.2% 57.4% 53.1% 50.1% 47.2% 65 above
67.9% 64.3% 74.4% 69.7% 63.7% 66.2% 63.1% 52.7% 47.6%
All 55.7% 55.7% 64.2% 49.9% 54.1% 51.2% 47.7% 44.3% 41.3%

Economic Growth and Life Satisfaction in Japan
1.6.1.2 Gender We have examined the same data from the gender perspective and have found that more women have felt very satisfied and satisfied with their life than men over the years, as shown in Figure 2.9. Interestingly, although Japan is known as a strong patriarchal male-biased society, men tend to feel less satisfied with their life. This might reflect some social pressure on the shoulders of men, as being a successful breadwinner for his family, while women are more concerned with finding a successful man to get married. Also, it might imply that women and men have different points of views over their life satisfaction.
Figure 2.9: Trend on Life Satisfaction by Gender
0.0%
10.0%
20.0%
30.0%
40.0%
50.0%
60.0%
70.0%
1978 1981 1984 1987 1990 1993 1996 1999 2002
Year
Shar
e of
resp
onde
nts (
%)
MenWomenAll
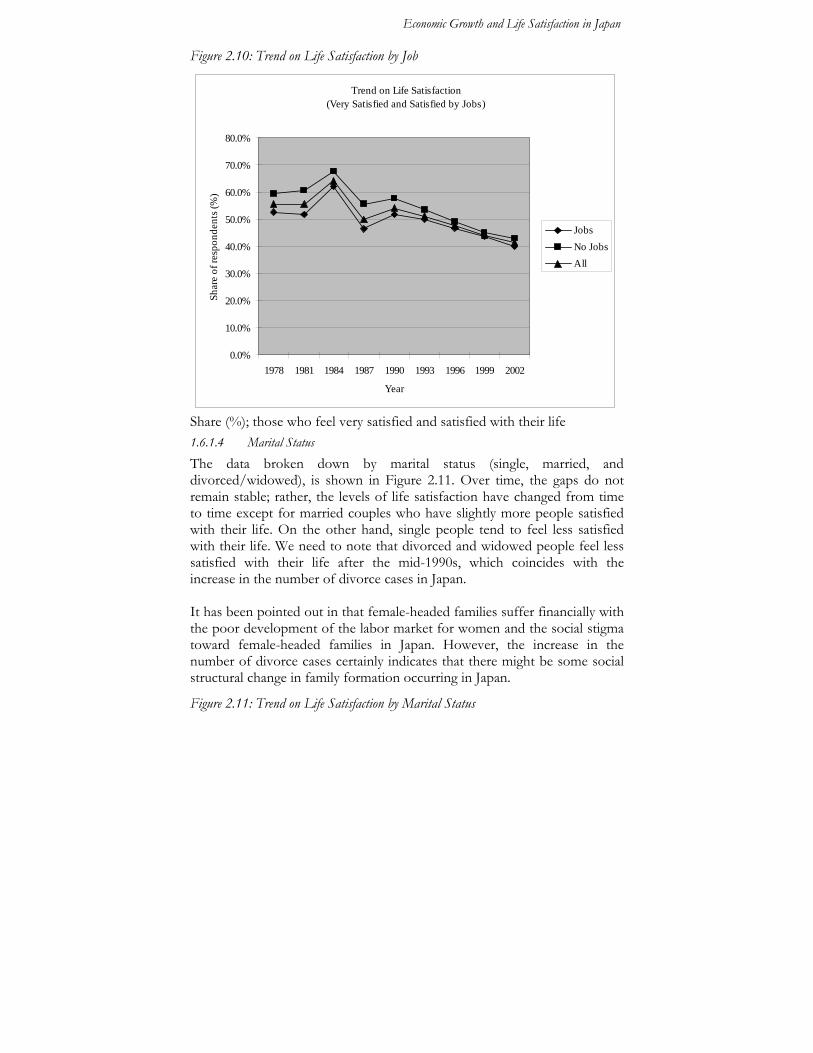
Share (%); those who feel very satisfied and satisfied with their life 1.6.1.3 Job I have looked at the trend data on life satisfaction by job status. As Figure 2.10 shows, more people without jobs feel satisfied with their life than those with jobs. Both housewives and retirees are the majority of those who felt satisfied with their life. Thus, in Japan, non-employed people felt satisfied; but, this does not tell us much about if, and to what extent, those who are unemployed, recently increasing in Japan, have influenced that statistic one way or another6.
6 This is very important and should be explored further; however, the Cabinet data does not have detailed information over job status by unemployment.
Economic Growth and Life Satisfaction in Japan
Figure 2.10: Trend on Life Satisfaction by Job
Trend on Life Satisfaction(Very Satisfied and Satisfied by Jobs)
0.0%
10.0%
20.0%
30.0%
40.0%
50.0%
60.0%
70.0%
80.0%
1978 1981 1984 1987 1990 1993 1996 1999 2002
Year
Shar
e of
resp
onde
nts (
%)
JobsNo JobsAll
Share (%); those who feel very satisfied and satisfied with their life 1.6.1.4 Marital Status The data broken down by marital status (single, married, and divorced/widowed), is shown in Figure 2.11. Over time, the gaps do not remain stable; rather, the levels of life satisfaction have changed from time to time except for married couples who have slightly more people satisfied with their life. On the other hand, single people tend to feel less satisfied with their life. We need to note that divorced and widowed people feel less satisfied with their life after the mid-1990s, which coincides with the increase in the number of divorce cases in Japan. It has been pointed out in that female-headed families suffer financially with the poor development of the labor market for women and the social stigma toward female-headed families in Japan. However, the increase in the number of divorce cases certainly indicates that there might be some social structural change in family formation occurring in Japan.
Figure 2.11: Trend on Life Satisfaction by Marital Status

Economic Growth and Life Satisfaction in Japan
Trend on Life Satisfaction (Very Satisfied and Satisfied by Marital Status)
0.0%
10.0%
20.0%
30.0%
40.0%
50.0%
60.0%
70.0%
1978
1981
1984
1987
1990
1993
1996
1999
2002
Year
Shar
e of
resp
onde
nts
(%)
SingleMarriedDivorced/WidowedAll
Share (%); those who feel very satisfied and satisfied with their life
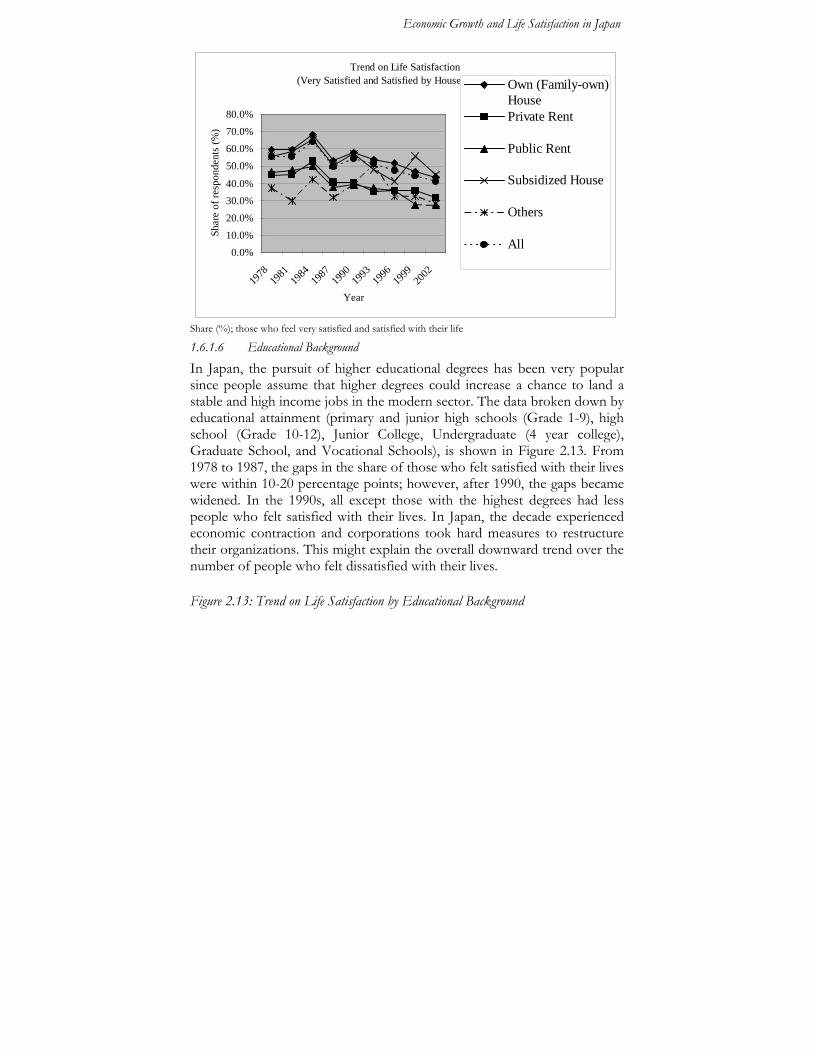
1.6.1.5 House Ownership In Japan, the type of house ownership might be a good proxy indicator for showing one’s economic and social status and wellbeing situation. We use five categories for house ownership: (1) those who own houses, (2) those who rent houses from private companies, (3) those who rent houses from the public housing services, (4) those who live in houses subsidized either by the government or companies, and (5) those who live in other forms of housing arrangements. Figure 2.12 shows that the number of people who feel satisfied with their life has declined over time regardless of their house ownership. However, those who live in subsidized housing feel less unsatisfied compared to people in other categorical groups. It is important to look at those who have access to subsidized housing in Japan: many of those are government officials or employees of big companies. This might suggest indirectly that economic burden might be less for people living in subsidized housing than those who rent houses or own houses, who in fact experienced heavy debt due to the burst of the bubble economy in the 1990s.
Figure 2.12: Trend on Life Satisfaction by House Ownership
Economic Growth and Life Satisfaction in Japan
Trend on Life Satisfaction (Very Satisfied and Satisfied by House Ownership)
0.0%10.0%20.0%30.0%40.0%
50.0%60.0%70.0%80.0%
1978
1981
1984
1987
1990
1993
1996
1999
2002
Year
Shar
e of
resp
onde
nts
(%)
Own (Family-own)HousePrivate Rent
Public Rent
Subsidized House
Others
All
Share (%); those who feel very satisfied and satisfied with their life
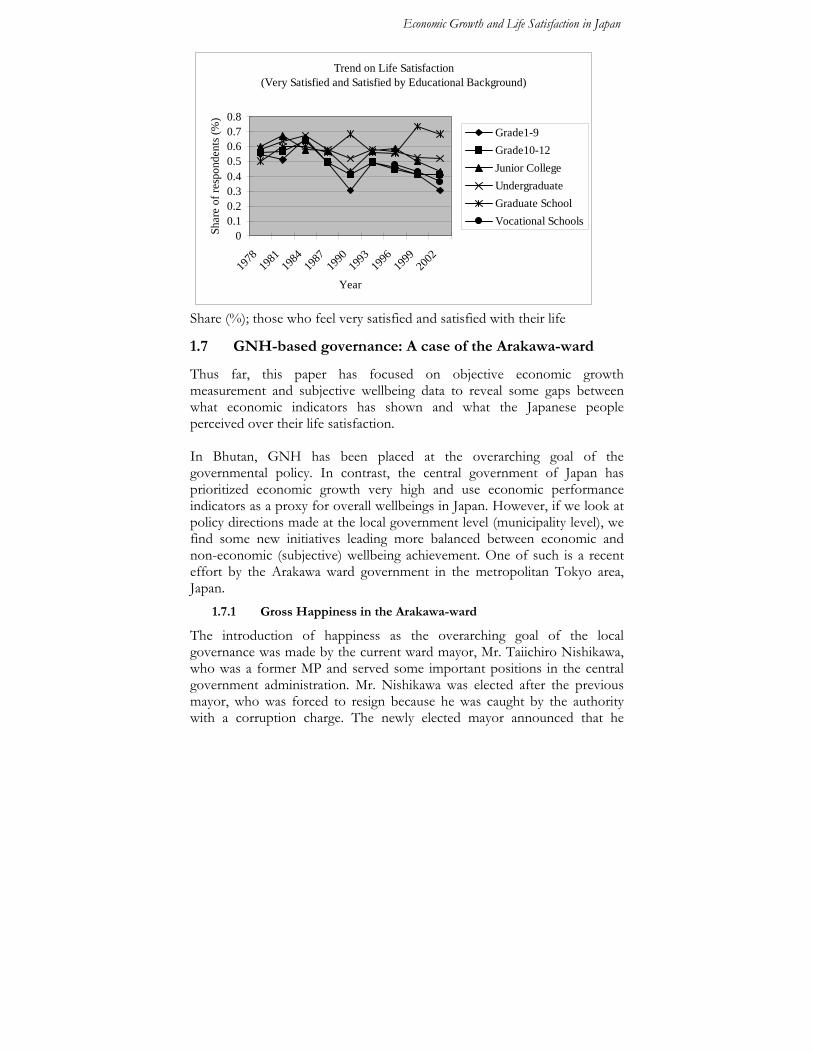
1.6.1.6 Educational Background In Japan, the pursuit of higher educational degrees has been very popular since people assume that higher degrees could increase a chance to land a stable and high income jobs in the modern sector. The data broken down by educational attainment (primary and junior high schools (Grade 1-9), high school (Grade 10-12), Junior College, Undergraduate (4 year college), Graduate School, and Vocational Schools), is shown in Figure 2.13. From 1978 to 1987, the gaps in the share of those who felt satisfied with their lives were within 10-20 percentage points; however, after 1990, the gaps became widened. In the 1990s, all except those with the highest degrees had less people who felt satisfied with their lives. In Japan, the decade experienced economic contraction and corporations took hard measures to restructure their organizations. This might explain the overall downward trend over the number of people who felt dissatisfied with their lives.
Figure 2.13: Trend on Life Satisfaction by Educational Background
Economic Growth and Life Satisfaction in Japan
Trend on Life Satisfaction (Very Satisfied and Satisfied by Educational Background)
00.10.20.30.40.50.60.70.8
1978
1981
1984
1987
1990
1993
1996
1999
2002
Year
Shar
e of
resp
onde
nts (
%)
Grade1-9Grade10-12Junior CollegeUndergraduateGraduate SchoolVocational Schools
Share (%); those who feel very satisfied and satisfied with their life
1.7 GNH-based governance: A case of the Arakawa-ward
Thus far, this paper has focused on objective economic growth measurement and subjective wellbeing data to reveal some gaps between what economic indicators has shown and what the Japanese people perceived over their life satisfaction. In Bhutan, GNH has been placed at the overarching goal of the governmental policy. In contrast, the central government of Japan has prioritized economic growth very high and use economic performance indicators as a proxy for overall wellbeings in Japan. However, if we look at policy directions made at the local government level (municipality level), we find some new initiatives leading more balanced between economic and non-economic (subjective) wellbeing achievement. One of such is a recent effort by the Arakawa ward government in the metropolitan Tokyo area, Japan.
1.7.1 Gross Happiness in the Arakawa-ward
The introduction of happiness as the overarching goal of the local governance was made by the current ward mayor, Mr. Taiichiro Nishikawa, who was a former MP and served some important positions in the central government administration. Mr. Nishikawa was elected after the previous mayor, who was forced to resign because he was caught by the authority with a corruption charge. The newly elected mayor announced that he

Economic Growth and Life Satisfaction in Japan
would like to guide the ward government to improve people’s happiness after he became the mayor in Arakawa in 2004. In his essay, Mr. Nishikawa explained that he has set local people’s happiness as the main objective of the Arakawa ward development. Under his leadership, the ward government office has laid out “Actual Realization of Happiness in the Arakawa ward,” as its fundamental development vision within twenty years. In its development plan recently formulated by the ward government, it has stated that “administration of a ward is the system to improve happiness of ward residents.”
1.7.2 Participatory formulation of the local development plan
The newly elected Mayor initiated to open up a window for local people to participate in the process of formulation of the ward development plan. First, the ward government called for a local resident committee to discuss about local government needs – Advisory Board for Political Reform of the Arakawa ward. In 2005, the committee was formed by sixty-seven local residents with diversified background (different jobs like shop-owners, academia, lawyer, student, housewife; men and women, young, middle-aged and senior). At the end of the fiscal year of 2005, the administrative staff of the ward government assisted the group to submit its report based on their discussions to the Mayor. Upon receipt of the report from the board, the Arakawa-ward office formed Council of the Master Plan for the Arakawa-ward to internalize those suggestions from the board. One representative from the board joined the Council. In the fiscal year of 2006, the advisory board members were divided into four thematic issues and submitted its final recommendation report to the government. In 2007-2008, the ward government has incorporated some recommendations made by the local resident committee into its annual budget plan (Please see Box 2.1).
Box 2.1: Development of Happiness-centered policy-making in the Arakawa-ward November 2004 Mr. Taichiro Nishikawa was elected as the Arakawa-ward mayor July 2005 Mr. Nishikawa directed to create “Advisory Board for Political Reform of the Arakawa-ward.” The members consisted of sixty seven citizens selected from among applicants. The period of the membership was two years. One of the reasons for the establishment of this panel was to change ward-politics after the arrest of the predecessor of the Arakawa-ward mayor due to corruption charge. February 2006 Advisory Board for Political Reform of the Arakawa-ward submitted its report to the ward

Economic Growth and Life Satisfaction in Japan
Economic Growth and Life Satisfaction in Japan
1.7.3 Challenge: GAH indicator development
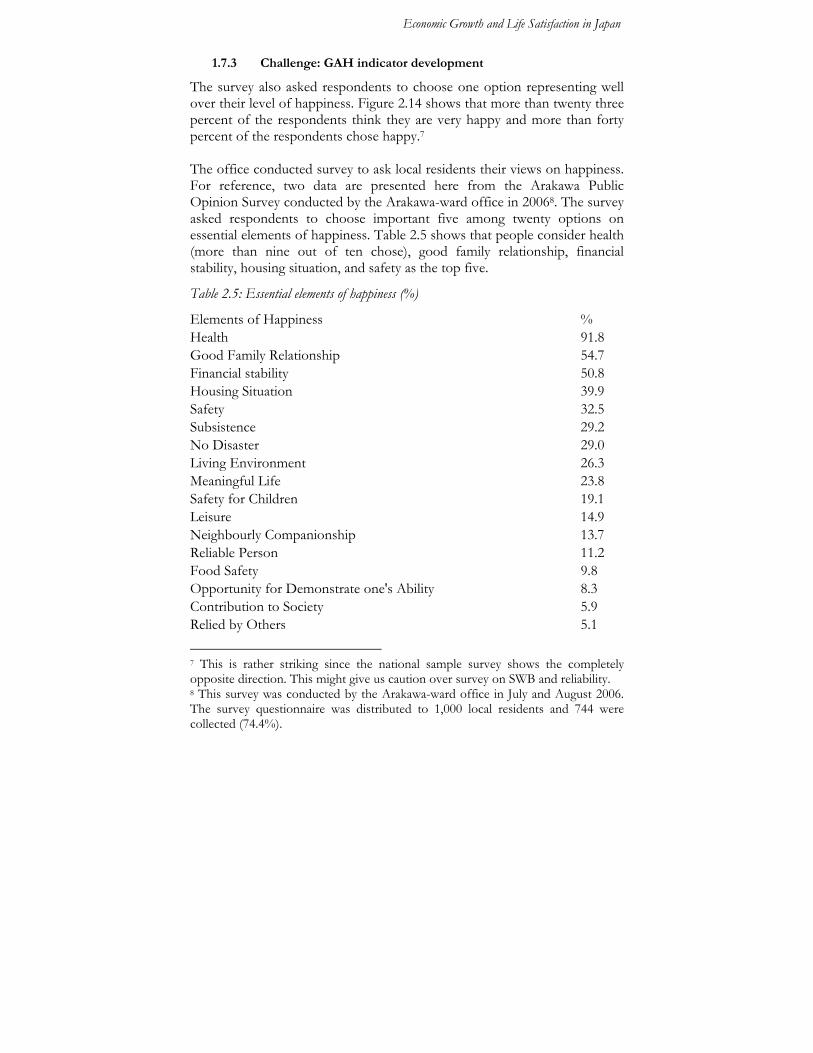
The survey also asked respondents to choose one option representing well over their level of happiness. Figure 2.14 shows that more than twenty three percent of the respondents think they are very happy and more than forty percent of the respondents chose happy.7 The office conducted survey to ask local residents their views on happiness. For reference, two data are presented here from the Arakawa Public Opinion Survey conducted by the Arakawa-ward office in 20068. The survey asked respondents to choose important five among twenty options on essential elements of happiness. Table 2.5 shows that people consider health (more than nine out of ten chose), good family relationship, financial stability, housing situation, and safety as the top five.
Table 2.5: Essential elements of happiness (%)
Elements of Happiness % Health 91.8 Good Family Relationship 54.7 Financial stability 50.8 Housing Situation 39.9 Safety 32.5 Subsistence 29.2 No Disaster 29.0 Living Environment 26.3 Meaningful Life 23.8 Safety for Children 19.1 Leisure 14.9 Neighbourly Companionship 13.7 Reliable Person 11.2 Food Safety 9.8 Opportunity for Demonstrate one's Ability 8.3 Contribution to Society 5.9 Relied by Others 5.1
7 This is rather striking since the national sample survey shows the completely opposite direction. This might give us caution over survey on SWB and reliability. 8 This survey was conducted by the Arakawa-ward office in July and August 2006. The survey questionnaire was distributed to 1,000 local residents and 744 were collected (74.4%).

Economic Growth and Life Satisfaction in Japan
Attachment to Community 4.4 Community Program/Event 3.1 Heaven of Rest in Community 2.0 Others 1.3 No answer 0.1 Note: Percentage points show how many respondents chose each option. (Source: Arakawa Public Opinion Survey 2006)
Figure 2-14: Level of Happiness in Arakawa (sample survey by the Arakawa-ward office)
23.1
44.9
19.8
8.22.6 1.5
05
101520253035404550
Veryhappy
Happy Not Sure Not happy Unhappy NoAnswer
%
Share (%); those who feel very satisfied and satisfied with their life Source: Arakawa Public Opinion Survey 2006 The Arakawa initiative is rather unique in Japan since the majority of local government follows policies designed by the central government, which has placed the economic production expansion high among others. The Arakawa ward office has identified the need for quantitative measures to assess and evaluate its operational performance from the points of residential wellbeing enhancement views and it has named it as “Gross Arakawa Happiness.” Currently, the planning section of the ward office has been working on the development of the GAH; yet, the office has not come up a concrete set of indicators. This is going to be a big challenge for the ward, since no other

Economic Growth and Life Satisfaction in Japan
local governments in Japan have done to develop new development measures based on local residents’ perceptions over their lives.

Economic Growth and Life Satisfaction in Japan
1.8 Concluding discussions
This project has attempted to learn from Bhutan and Japan based on the visions and directions of their development. It is worthwhile reflecting on the findings of each country study, to synthesize and provide discussion points for further research.
1.8.1 Key elements of happiness and wellbeing
In Bhutan, based on the pilot survey on PWB/SWB, important elements of happiness and wellbeing include health, finance and family. In Japan, although there is no systematic data on elements of happiness that is comparable to the Bhutanese data, one survey conducted by the ward office of Arakawa shows health, finance and family as key for happiness as shown in Table (a). This suggests that a systematic survey on elements of happiness from diversified groups by geographical dimensions (countries, regions, communities) and social dimensions (gender, generation, ethnic background, educational background, economic levels, etc) could help identify a core set of elements of happiness and wellbeing, if any.
Table (a): Perceived elements of happiness
GNH pilot survey in Bhutan Arakawa-ward public opinion survey in Japan
Financial security 66.0% Good Health 91.8% Good Family 44.3% Good Family Relationship 54.7% Good Health 43.1% Financial stability 50.8% Resources for farm production
33.4% Housing Situation 39.9%
Access to basic facilities 25.1% Safety 32.5% Personal development/education
19.7% Subsistence 29.2%
Faith and spiritual pursuits
17.1% No Disaster 29.0%
Employment & job satisfaction
16.3% Good Living Environment 26.3%
Good governance & welfare system
11.4% Meaningful Life 23.8%
Good inter-personal relations
10.0% Safety for Children 19.1%

Economic Growth and Life Satisfaction in Japan
1.8.2 Characteristics of higher happiness or life satisfaction groups in Bhutan and Japan.
In Bhutan, young people, female, those never married, and those with higher educational background (between 11-12 grades) are likely to have high life satisfaction than others. In Japan, those who are old, female, married, and with higher educational background (university and graduate school) are likely to have high life satisfaction than others. Life satisfaction is a subjective wellbeing indicator, which can be influenced by many factors. Thus, studies dealing with life satisfaction or happiness require comprehensive data gathered through both quantitative and qualitative methods. The Bhutanese pilot survey on PWB/SWB has incorporated mainly quantitative questions; in future it may be useful to develop and include qualitative and open-ended questions to complement the findings from the current quantitative data.
Table (b): Characteristics of high level of life satisfaction groups
PWB/SWB pilot survey in Bhutan
Life Satisfaction Survey in Japan
Age Young Old Gender Female Female Marital Status Never married Married Education 11-12 grades University
1.8.3 Relational analysis of psychological and subjective wellbeing in Bhutan
Key factors influencing individual levels of subjective wellbeing have been explored and tested based on the PWB/SWB pilot survey in Bhutan. Four measures of subjective wellbeing were utilized and the analysis has shown that the level of mental health (GHQ score) is closely associated with the subjective wellbeing levels on happiness, quality of life, life enjoyment and life satisfaction. Path-analysis has revealed a mechanism of emotional change and life satisfaction, which suggests that cultural specific explanations need to be qualitatively examined.
1.8.4 Prefecture-based objective and subjective measures on development outcome comparison in Japan
Analysis presented widening gaps between per-capita GDP and the share of people who felt at least satisfied with their lives over the last three decades.
Economic Growth and Life Satisfaction in Japan
Prefecture-based development performance by three different measures (GDP, HDI and Life Satisfaction) showed distinctive differences in development situation assessed by objective measures such as GDP and HDI, and that by subjective measure such as life satisfaction. Yet, those prefectures ranked higher by HDI than by GDP by more than five ranks, tend to have many residents with higher life satisfaction, while those prefectures ranked lower by HDI than by GDP by more than five ranks, tend to have many residents with less life satisfaction.
1.8.5 Potential of mixed use of objective and subjective measures: Japan
The data used in this report for Japan is not a panel data-set, which places limits ability to make a thorough investigation of changes in life satisfaction over time. However, the data has enabled the sketching of the Japanese development path with the use of different indicators: GDP and SWB. Large gaps were found between the GDP line and the SWB line for the last three decades. The case study clearly shows that people’s life satisfaction has declined for the last two decades. This should not obscure the fact that Japan has improved its human development components in education and health care services with high economic growth incurred with social and environmental costs.
1.8.6 Caveat over data and analytical method on subjective wellbeing in Bhutan
Finally, there are some limitations in this study that need to be highlighted. One should be cautioned that data used in this analysis is not comprehensive, particularly with regard to income and living standards for which reliable data was insufficient. Also, as mentioned towards the beginning of this report, the scope of this project does not go beyond tackling the basic question of what is important for the happiness and wellbeing of the Bhutanese people at the psychological/inner level. Therefore, the survey data collected for this project comprise only those on demographics, PWB/SWB, and income data. The interpretations on PWB/SWB assessment results should therefore be regarded as exploratory and tentative. It should be noted that while measures on subjective wellbeing used in this study have mostly been gathered quantitatively, one’s perceptions and

Economic Growth and Life Satisfaction in Japan
feelings cannot be simplified into numeric, since meaning of happiness and life satisfaction tend to be viewed differently across culture. This study has no intention to judge which country, Bhutan or Japan, is the better nation in terms of having more happy people or better government policies. Within its scope, it provides preliminary findings that may facilitate future research in reaching deeper understanding of factors influencing people’s wellbeing and happiness.
Economic Growth and Life Satisfaction in Japan
References
Advisory Board for Political Reform of the Arakawa-ward. (2006). Arakawa-ku kusei kaikaku kondankai teigensho (Policy Report of the Advisory Board for Political Reform of the Arakawa-ward
Arakawa-ward. (2007). Arakawa-ku yosan-an-no gaiyou (Outline of Budget Plan of the Arakawa-ward for 2007)
Arakawa-ward. (2007). Arakawa ku hou (a regular newsletter by the Arakawa-ward government)
Cobb, C., T. Halstead, and J. Rowe. (1995). The Genuine Progress Indicator: Summary of Data and Methodology. San Francisco: Redefining Progress
Colman, Ronald & Sagebien, Julia. (2005). Measuring Genuine Progress: The Nova Scotia Experience and Its Potential Relevance to Bhutan’s Efforts to Operationalise the View of Gross National Happiness. Centre for Bhutan Studies
Council of the Master Plan for the Arakawa-ward. (2006). Kohfuku Jikkan Toshi Arakawa (Actual Realization of Happiness in Arakawa-ward)
Diener, E. (1994). Assessing Subjective Well-Being: Progress and Opportunities. Social Indicators Research, 31, pp.103-57
Diener, E., & E. Suh (Eds.). (2000). Culture and Subjective Well-Being. Cambridge, MA: MIT-Press
Frederickson,B,L. (2001). The role of positive emotions in positive psychology: The broaden-and-build theory of positive emotions. American Psychologist, Vol.56, pp.218-226
Frey, B. and A. Stutzer (2002) Happiness and economics: how the economy and institutions affect well-being. Oxford: Princeton University Press.

Economic Growth and Life Satisfaction in Japan
Huppert, Felicia A., Baylis, Nick, & Keverne, Barry (2005). The Science of Well-being. The Royal Society 2005, Oxford University Press
Karma Ura & Karma Galay (Eds). (2004). Gross National Happiness and Development: Proceedings of the First International Seminar on Operationalising Gross National Happiness. Thimphu: Centre for Bhutan Studies
Kahneman, D, E. Diener, N. Schwarz (Eds.) (1999). Well-Being: The Foundations of Hedonic Psychology
Keyes, Corey Lee M. (1998). Social Well-being. Social Psychology Quarterly. Vol. 61, No.2, pp. 121-140
Kusago, T. (2007) Rethinking of Economic Growth and Life Satisfaction in Post-WWII Japan A Fresh Approach. Social Indicators Research, 81(1), pp.79-102
Meadows, D.H. et al. (1972) The Limits to growth: a report for the Club of Rome's project on the predicament of mankind. Universe Books.
Ministry of Health, Labour and Welfare. (2005). White Paper on the Labour Economy 2005. Tokyo: MHLW.
Mc Gregor, Ian, R. Little, Brian. (Eds.). (1992). Personal Projects, Happiness, and Meaning: On doing well and being yourself. Journal of Personality and Social Psychology, Vol.74 No. 2, pp.494-512
Marks, Nic, et al. (2004). The Power and Potential of Well-being Indicators: Measuring Young People’s Well-being in Nottingham. New Economics Foundation (NEF)
Marks, Nic & Shah, Hetan. (2004). A Well-being Manifesto for a Flourishing Society. New Economics Foundation (NEF)
Markus and Kitayama (Eds.). (1994). Emotion and Culture: empirical studies of mutual influence. American Psychological Association

Economic Growth and Life Satisfaction in Japan
Nakamura, T. (1985). Economic development of modern Japan, Tokyo: International Society for Educational Information.
Ohashi, T., Nakano, K., Makino. M., and Y. Wada. (2003). A study on Japan’s GPI (Nihon no GPI no keisoku kekka). Tokyo: Future 500.
Prescott-Allen, Robert (2001). The Wellbeing of Nations: A Country-by-Country Index of Quality of Life and Environment. Island Press
Richard M. Ryan and Edward L. Deci. (2001). On Happiness and Human Potentials: A review of research on Hedonic and Eudiamonic Well-being. Annu. Rev. Psychol. 2001. 52:141 – 66
Sonam Kinga, Karma Galay, Phuntsho Rapten, & Adam Pain (Eds.). (1999). Gross National Happiness: A Set of Discussion Papers. Thimphu: Centre for Bhutan Studies
Sen, A. K. (1985). Commodities and Capabilities. North-Holland
Sen, A. K. (1999). Development as Freedom. Oxford University Press.
Shultz, T.W. (1963) The Economic Value of Education. Columbia University Press.
UNDP. (1990). Human Development Report 1990. Oxford University Press.
UNDP. (2006). Human Development Report 2006. Oxford University Press.
Veenhoven, R. (1996). Developments in Satisfaction-Research. Social Indicators Research, 37, pp.1-46.
Veenhoven, R. (1993). Happiness in Nations: Subjective Appreciation of Life in 56 Nations 1946-1992. Erasmus University Press.